cae apps for physics of failure reliability & durability ...key characteristics of the sherlock...
TRANSCRIPT
CAE Apps for Physics of Failure
Reliability & Durability Simulations
James McLeish &
Nathan Blattau PhD
2014 RAMS – Paper – McLeish
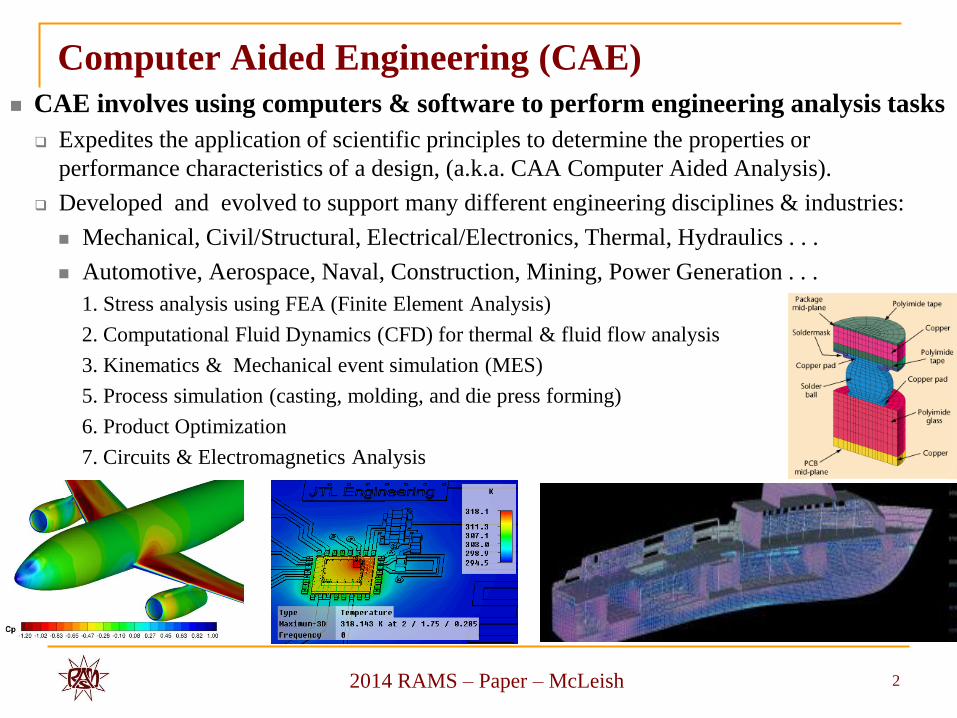
Computer Aided Engineering (CAE)
CAE involves using computers & software to perform engineering analysis tasks
Expedites the application of scientific principles to determine the properties or
performance characteristics of a design, (a.k.a. CAA Computer Aided Analysis).
Developed and evolved to support many different engineering disciplines & industries:
Mechanical, Civil/Structural, Electrical/Electronics, Thermal, Hydraulics . . .
Automotive, Aerospace, Naval, Construction, Mining, Power Generation . . .
1. Stress analysis using FEA (Finite Element Analysis)
2. Computational Fluid Dynamics (CFD) for thermal & fluid flow analysis
3. Kinematics & Mechanical event simulation (MES)
5. Process simulation (casting, molding, and die press forming)
6. Product Optimization
7. Circuits & Electromagnetics Analysis
2

2014 RAMS – Paper – McLeish
CAE Tools & Methods
Most CAE programs are model “creation” tools
Like a blank spread sheet or word document they enable the user to
first create every element and then run an analysis.
But this requires a long model creation effort
and requires the user to be:
Very experienced with the
CAE modeling program.
Highly knowledgeable in the specific
physics and engineering discipline
of the item being analyzed.
PhD level expertise is often required.
Availability and cost of this level of
expertise has sometimes limited the
expansion of CAE methods from
reaching many areas where they
could be beneficial.
3
A Blank Canvas

2014 RAMS – Paper – McLeish
An Emerging Trend - Application Specific CAE Apps
4
Application Specific, Customized
CAE Solutions.
Auto guided, specific function, CAE
Apps or analysis templates are created
to provide a common, reusable semi-
automated interface
Pre-programed, off the shelf ready,
similar to smart phone or tablet Apps. Regularly needed product optimization
Frequently encountered problems.
Allows product teams to perform expert
level CAE analysis without a rare,
costly, CAE expert
See Article at:”
http://www.sae.org/mags/SVE/10767
2014 RAMS – Paper – McLeish
Physics of Failure Reliability Assessment
Combines dynamic stress analysis of usage & environmental conditions
with failure mechanism models to perform a durability simulation
Identifies failure susceptibilities & calculates reliability behavior over time.
Based on Physics of Failure Root Cause Research that identifies:
“CAUSE & EFFECT” Relationships in Failure Mechanisms &
The variable factors that makes them “APPEAR” to be Random Events.
A Combination of Material Science, Physics & Chemistry with
Statistics, Variation Theory & Probabilistic Mechanics.
Failure of devices or structures (i.e. hardware) are due to: The gradual degradation (wearout) or
Rapid disruption (overstress) due to encounters with “Excessive Stresses” that
exceeds the capabilities/strength of a device or material.
Both are related to the stress(s) an item is exposed to Thermal, Electrical, Chemical, Moisture, Vibration, Shock, Mechanical Loads . . .
Failures can also occur prematurely due to fabrication or assemble defects,
excessive variable factors or even design errors that weakens the items to
reduced capability to endurance capabilities
5
Also Reference the
RAMS Introduction
to PoF/RP Tutorial

2014 RAMS – Paper – McLeish
3. Designing Reliability & Durability into Products with
PoF Knowledge & CAE Failure Mechanism Modeling
Starts With Understanding The Failure Mechanisms
Your Product’s Technology Is Susceptible To and
How It Will Be Exposed To The Stresses That
Initiate and Propagate These Failure Mechanisms
6
Temperature
Extremes & Cycling
Moisture & Humidity
Electromagnetic
Noise
Vibration & Shock

2014 RAMS – Paper – McLeish
PoF Durability Simulations & Reliability Assessments
Finite Element Analysis (FEA) and Computational Fluid Dynamic (CFD)
CAE program are regularly used to identify the stress conditions that products
and systems will experience under various usage conditions.
A standard practice in mechanical and structural products.
Combining CAE Stress Analysis with Failure Mechanism Models enables:
“Virtual Durability Simulations” that can Calculate Stress Driven
Reliability Performance Over Time .
PoF Research has enable the migration of this technology to the materials and micro
structures of E/E components and circuit board assemblies.
7

2014 RAMS – Paper – McLeish
4. A Tool Suite of CAE Apps for PoF Durability Simulations &
Reliability Assessments of Electronic Equipment
Fast, Semi-Automated
Enables CAE durability simulations to be interactively with design creation
Durability/Reliability impact of design choices rapidly determined
8
It is not at the
Iphone or Droid
App store.
But yes there
is now a
Physics of
Failure
Durability
Simulation App

2014 RAMS – Paper – McLeish
Key Characteristics of the Sherlock ADA PoF CAE App
A Semi-Automated CAE knowledge based tool suite for:
PoF durability simulation & reliability assessments on electronics
Semi-Automated features simplifies model creation and analysis
Designed to be used by non-CAE experts to quickly create and
perform PoF durability & reliability analysis.
Eliminates the long, complicated, model creation process & the need for a
PhD level expert in PoF, FEA and CFD numerical modeling.
The “Knowledge Based” features customized for E/E component and
materials includes customizable, preloaded libraries of:
Component geometry models
Material properties
Design templates
Analysis wizards
Environmental profiles for various applications.
9
2014 RAMS – Paper – McLeish
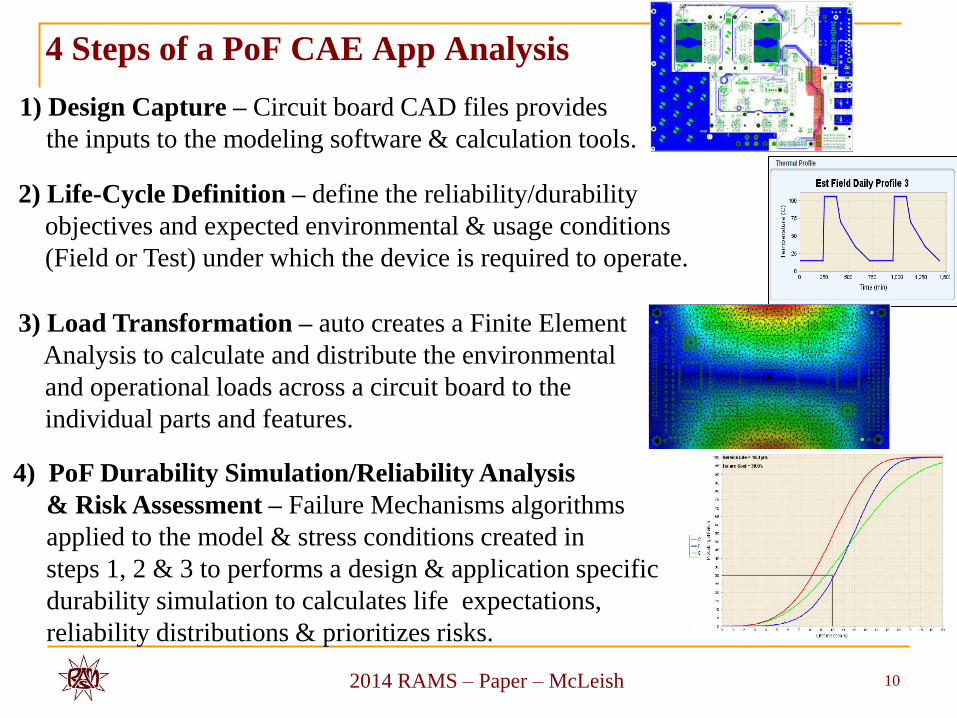
4 Steps of a PoF CAE App Analysis
1) Design Capture – Circuit board CAD files provides
the inputs to the modeling software & calculation tools.
10
2) Life-Cycle Definition – define the reliability/durability
objectives and expected environmental & usage conditions
(Field or Test) under which the device is required to operate.
3) Load Transformation – auto creates a Finite Element
Analysis to calculate and distribute the environmental
and operational loads across a circuit board to the
individual parts and features. 4) PoF Durability Simulation/Reliability Analysis
& Risk Assessment – Failure Mechanisms algorithms
applied to the model & stress conditions created in
steps 1, 2 & 3 to performs a design & application specific
durability simulation to calculates life expectations,
reliability distributions & prioritizes risks.

2014 RAMS – Paper – McLeish
Step 1: Design Capture - Import PCBA Layout
(Gerber, ODB++, Eagle & Valor CAD & BOM Part Lists)
11
2014 RAMS – Paper – McLeish
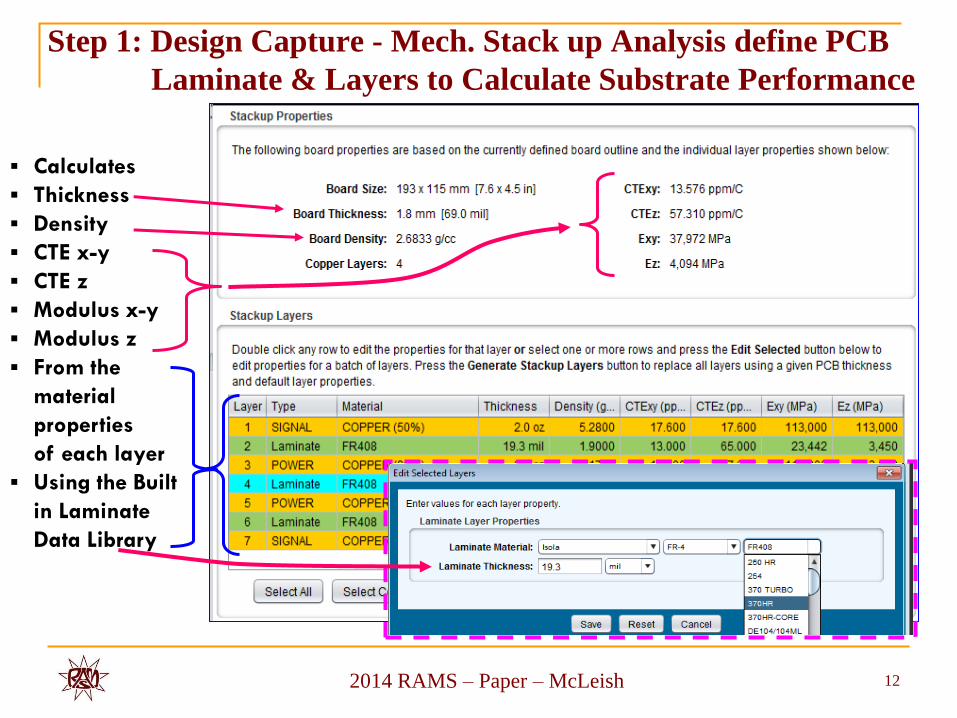
Step 1: Design Capture - Mech. Stack up Analysis define PCB
Laminate & Layers to Calculate Substrate Performance
12
Calculates
Thickness
Density
CTE x-y
CTE z
Modulus x-y
Modulus z
From the
material
properties
of each layer
Using the Built
in Laminate
Data Library
2014 RAMS – Paper – McLeish
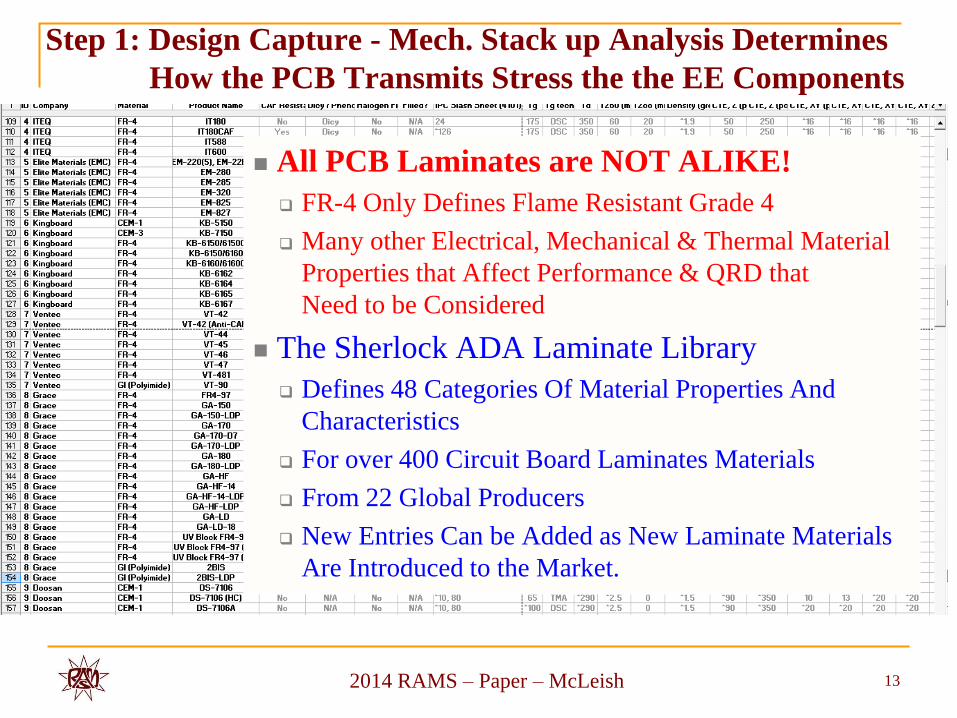
Step 1: Design Capture - Mech. Stack up Analysis Determines
How the PCB Transmits Stress the the EE Components
All PCB Laminates are NOT ALIKE!
FR-4 Only Defines Flame Resistant Grade 4
Many other Electrical, Mechanical & Thermal Material
Properties that Affect Performance & QRD that
Need to be Considered
The Sherlock ADA Laminate Library
Defines 48 Categories Of Material Properties And
Characteristics
For over 400 Circuit Board Laminates Materials
From 22 Global Producers
New Entries Can be Added as New Laminate Materials
Are Introduced to the Market.
13

2014 RAMS – Paper – McLeish
Step 1: Parts ID, Management & Linkage to
Built In PoF Component Model Library
Minimizes data entry through intelligent parsing and embedded
electronic components package and material databases
14
2014 RAMS – Paper – McLeish
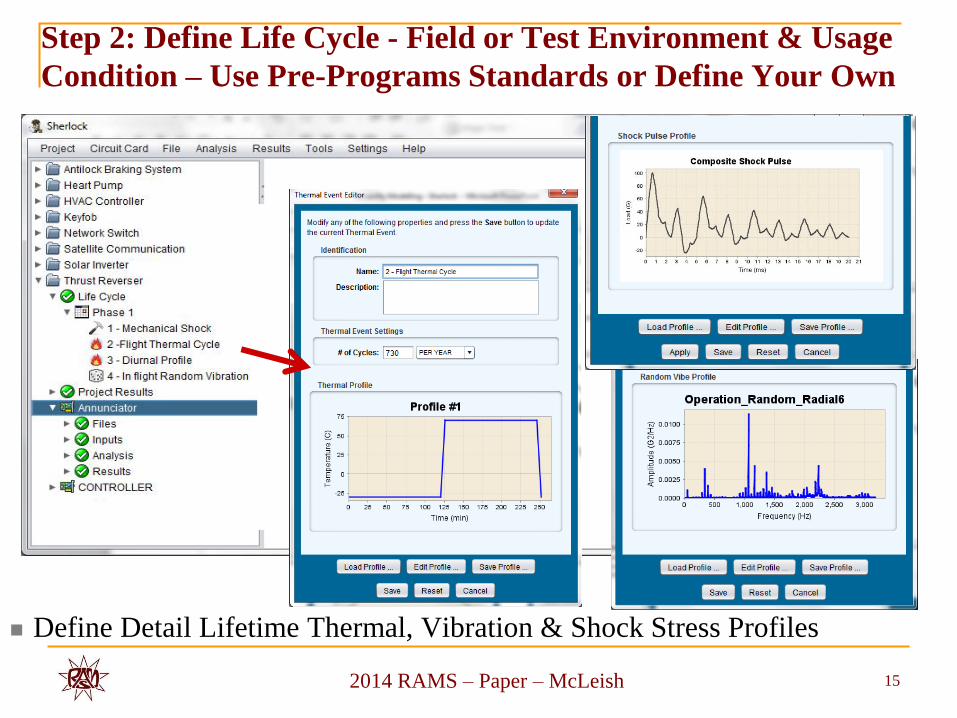
Step 2: Define Life Cycle - Field or Test Environment & Usage
Condition – Use Pre-Programs Standards or Define Your Own
Define Detail Lifetime Thermal, Vibration & Shock Stress Profiles
15

2014 RAMS – Paper – McLeish
Step 2: Life Cycle Characterization - Need to Develop
Life Time Environmental Loading Profiles
16
20-4040-60
60-8080-
100100-
120120-
140140-
160160-
180
60-8080-100
100-
120
120-
140
140-
160
160-
180
180-
200
200-
220
Valley Temp. Band
(Deg F)
Peak Temp. Band
(Deg F)
20-30 30-40 40-50 50-40 60-70 70-80 80-90 90-
100
100-
110
110-
120
120-
130
130-
140
140-
150
150-
160
160-
170
170-
180
180-
190
190-
200
210-
220
220-
230Temperature bands (Deg. F)
Tim
e (
Hrs
)
Time At Temperature Hours Over 10 Years at Phoenix Az.
Number of Thermal Cycles Over 10 Years At Phoenix Az.

2014 RAMS – Paper – McLeish
Step 3: Load Transformation - Automated FEA Mesh Generation
to Calculate Stress Distribution Across the PCBA
17
2014 RAMS – Paper – McLeish
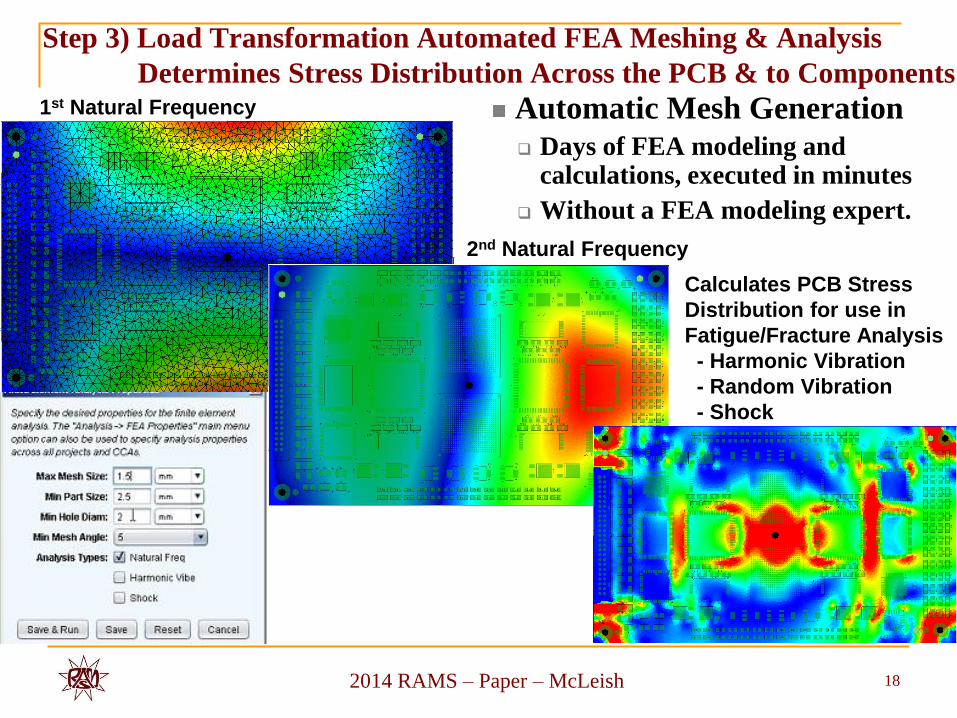
Step 3) Load Transformation Automated FEA Meshing & Analysis
Determines Stress Distribution Across the PCB & to Components
Automatic Mesh Generation
Days of FEA modeling and calculations, executed in minutes
Without a FEA modeling expert.
18
1st Natural Frequency
Calculates PCB Stress
Distribution for use in
Fatigue/Fracture Analysis
- Harmonic Vibration
- Random Vibration
- Shock
2nd Natural Frequency

2014 RAMS – Paper – McLeish
Step 4: PoF Durability Simulation & Reliability Risk Assessments
- Thermal Cycling Solder Fatigue Example
N50 fatigue life calculated for each of 705 components (68 unique part types), with risk
color coding, prioritized risk listing and life distribution plots based on known part type
failure distributions (analysis performed in <30 seconds) after model created.
Red - Significant portion of failure distribution within service life or test duration.
Yellow - Lesser portion of failure distribution within service life or test duration.
Green - Failure distribution well beyond service life or test duration. (Note: N50 life - # of thermal cycles where fatigue of 50% of the parts are expected to fail)
19
Parts With Low Fatigue Endurance
Found In Initial Design
~84% Failure Projection
Within Service Life,
Starting at ~3.8 years.

2014 RAMS – Paper – McLeish
Step 4: PoF Durability/Reliability Risk Assessment
Enables Virtual Reliability Growth Identification of specific reliability/durability limiting or deficiencies,
of specific parts in, specific applications
Enables the design to be revised to meet reliability/durability objectives
WHILE STILL ON THE CAE SCREEN
Failure Risk Plot of the
same project after
fatigue susceptible
parts replaced with
electrically equivalent
parts in component
package suitable for
the application.
Life time failure risks reduced from ~84% to ~1.5%
20

2014 RAMS – Paper – McLeish
Step 4: PoF Durability/Reliability Capabilities
Plus Optional MIL-STD-217 Random Failure Rate Calculator
Thermal Cycling Solder Attachment Fatigue
Thermal Cycling PCB PTH Via Barrel Cracking Fatigue
Vibration Solder Fatigue
Shock Solder Fracture
MIL-HDBK-217 Actuarial (Constant Failure Rate/MTBF-Probabilistic)
Conductive Anodic Filament Risk Assessment
Stress load in Fracture Risk Assessments
ICT Test Stress Analysis
Compliant Pin Connector Insertion
ISO-26262 Functional Safety FMECA
21

2014 RAMS – Paper – McLeish
Step 4: PoF Durability Simulations/Failure Risk Life Curves for each
Failure Mechanism Tallied to Produce a Combined Life Curve
Detailed Design & Application Specific PoF Life Curves are Far More Useful that a simple
single point MTBF (Mean Time Between Failure) estimate.
22
PTH Thermal
Cycling Fatigue
Wear Out
Thermal
Cycling
Solder
Fatigue
Wear Out
Vibration
Fatigue
Wear Out
Over All
Module
Combined
Risk
Cumulative Failures from
Generic, Actuarial, Failure Rate
Tables in MIL-HDBK-217
2014 RAMS – Paper – McLeish
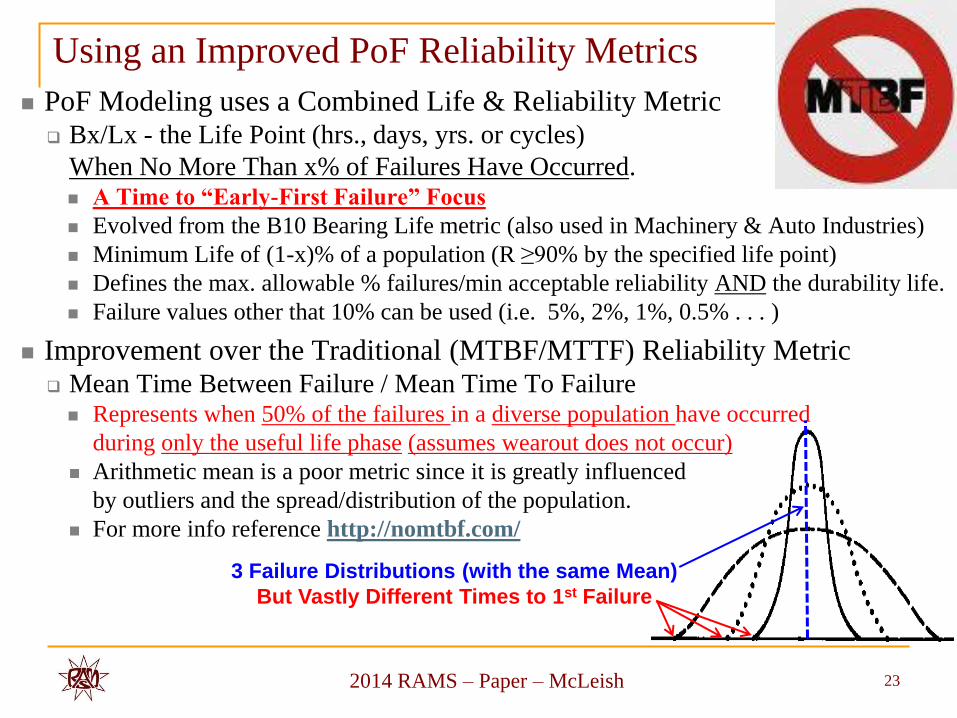
Using an Improved PoF Reliability Metrics
PoF Modeling uses a Combined Life & Reliability Metric Bx/Lx - the Life Point (hrs., days, yrs. or cycles)
When No More Than x% of Failures Have Occurred. A Time to “Early-First Failure” Focus
Evolved from the B10 Bearing Life metric (also used in Machinery & Auto Industries)
Minimum Life of (1-x)% of a population (R ≥90% by the specified life point)
Defines the max. allowable % failures/min acceptable reliability AND the durability life.
Failure values other that 10% can be used (i.e. 5%, 2%, 1%, 0.5% . . . )
Improvement over the Traditional (MTBF/MTTF) Reliability Metric Mean Time Between Failure / Mean Time To Failure
Represents when 50% of the failures in a diverse population have occurred
during only the useful life phase (assumes wearout does not occur)
Arithmetic mean is a poor metric since it is greatly influenced
by outliers and the spread/distribution of the population.
For more info reference http://nomtbf.com/
23
3 Failure Distributions (with the same Mean)
But Vastly Different Times to 1st Failure

2014 RAMS – Paper – McLeish
Step 4: PoF Durability/Reliability Risk Assessment Results
Available in 6 Different Output Options
24

2014 RAMS – Paper – McLeish
Step 4: PoF Durability/Reliability Risk Assessment
- Automated Report Generation
Comprehensive reports
generated in PDF format
Key summary points
Detailed inputs and findings
Result plots and tables
User control over contents
50-100 page professionally
formatted document
produced in seconds
25

2014 RAMS – Paper – McLeish
5: In Conclusion: the Sherlock ADA CAE App is a
New, Revolutionary, Awarding Winning Tool Suite for Virtual
Durability/Reliability Risk Assessments of Electronic Equipment
26
2014 RAMS – Paper – McLeish
Questions
Thank you for your attention.
Any questions?
For More Information or Copies of the Presentation Slides Contact:
301-474-0607
27