caffeine and airway resistance
TRANSCRIPT

University of South FloridaScholar Commons
Graduate Theses and Dissertations Graduate School
11-16-2004
Caffeine and Airway ResistanceGwyn N. Crump M.D.University of South Florida
Follow this and additional works at: https://scholarcommons.usf.edu/etd
Part of the American Studies Commons
This Thesis is brought to you for free and open access by the Graduate School at Scholar Commons. It has been accepted for inclusion in GraduateTheses and Dissertations by an authorized administrator of Scholar Commons. For more information, please contact [email protected].
Scholar Commons CitationCrump, Gwyn N. M.D., "Caffeine and Airway Resistance" (2004). Graduate Theses and Dissertations.https://scholarcommons.usf.edu/etd/1002

Caffeine and Airway Resistance
by
Gwyn N. Crump, M.D.
A thesis submitted in partial fulfillment of the requirements for the degree of Master of Science in Public Health
Department of Environmental and Occupational Health College of Public Health
University of South Florida
Major Professor: Stuart Brooks, M.D. Robert Haight, M.D., M.S.P.H.
Philip Roets, Sc.D.
Date of Approval: November 16, 2004
Keywords: impulse, oscillometry, spirometry, IOS, pulmonary, methylxanthine
© Copyright 2004, Gwyn Crump, M.D.

Dedication
I would like to dedicate this work to my wife, Alice, who has encouraged me,
stood beside me and inspired me in these efforts.

Acknowledgements
I would like to thank Dr. Robert Haight for his assistance in this project. I would
also like to thank Dr. Stuart Brooks for providing me encouragement and the opportunity
to work on this project.
i
Table of Contents
List of Tables iii
List of Figures iv
Abstract v Introduction 1 Caffeine 1 Spirometry 2 Impulse Oscillometry 2 Asthma 4 Methods 6 Study Subjects 6 Data Collected 7 Pulmonary Measurement and Analysis 7 Results 11 Study Sample Characteristics 11 Impulse Oscillometry Measurements 14 Spirometric Measurements 14 Discussion 16 Conclusions 18 References 19

ii
Appendices 22 Appendix A: Questionnaires 23 Appendix B: Study Sample Characteristics 28 Appendix C: Age, Gender and Ethnicity Distributions 29 Appendix D: Health Characteristics and Exposures Distributions 32 Appendix E: Pre and Post Coffee Symptom Questionnaire Results 40 Appendix F: Pre and Post Coffee Symptom Questionnaire Distributions 41 Appendix G: Impulse Oscillometry Measurements 53 Appendix H: Spirometric Measurements 54 Appendix I: Respiratory Measurements Distributions 55 Appendix J: Analysis of Post-test vs Pre-test Differences in R5, R20 and FEV1 71

iii
List of Tables
Table 1. Study Sample Characteristics 12
Table 2. Pre and Post Coffee Symptom Questionnaire Results 13
Table 3. Impulse Oscillometry Measurements 14
Table 4. Spirometric Measurements 15

iv
List of Figures
Figure 1. Impulse Oscillometer 3
Figure 2. Use of Spirometry Equipment 8
Figure 3. IOS Restrictor Screen Door 9
Figure 4. IOS Subject Hand Position 9

v
Caffeine and Airway Resistance
Gwyn N. Crump, MD
ABSTRACT
This study investigated the effect of caffeine on airway resistance. The subjects
were drawn from volunteers (18-90 years old) in good health, with no major
cardiopulmonary conditions.
We found no association between the consumption of a single cup of the
caffeinated beverage coffee and a decrease in airway resistance within one hour in a
normal population of subjects as measured neither by impulse oscillometry nor with
conventional spirometry. It appears that any possible bronchodilatory effect of the
caffeine from a single cup of coffee in a normal population is below the limit of detection
of spirometry and impulse oscillometry or is not sufficiently expressed in the one-hour
time frame of the study.
The study did validate currently accepted methods of using the Jaeger impulse
oscillometry (IOS) measurement for use at the University of South Florida (USF). The
impulse oscillometry technique was found to be a useful adjunct to conventional
pulmonary function testing. Conventional pulmonary function testing provides a useful
measure of a person’s ability to breathe yet is difficult to perform and only indirectly
guides the physician to the diagnosis of the pathology behind the person’s breathing

vi
difficulties. The impulse oscillometry technique may help the physician to noninvasively
determine the location of a pulmonary obstruction by measurement of the dynamics of
sound wave travel through the airways of the lungs.

1
Introduction
Caffeine
Mankind has been drinking caffeinated beverages for almost 5000 years with the
discovery of brewed tea attributed to the Second Emperor of China, Shen Nung, also
known as the divine healer. Tea and coffee contain about 20-60 mg and 125-185 mg of
caffeine respectively per cup and have been prized throughout their history as both
stimulants and palliatives for respiratory disorders1, 2. The efficacy of caffeine in asthma
has been evaluated in a recent evidence based medicine review of clinical trials which
concludes “Caffeine appears to improve airways modestly in people with asthma for up
to four hours”3.
Yet, still much is not known both about the mechanisms of action of caffeine and
the extent to which the general population, consciously or unconsciously uses caffeine to
self-medicate respiratory ailments. Caffeine and its more active metabolic products,
theophylline and theobromine have long demonstrated bronchodilator effects through
relaxation of bronchial smooth muscle4. They are phosphodiesterase (PDE) inhibitors
and decrease the rate at which the intracellular second messengers cAMP and cGMP are
degraded. Phosphodiesterase inhibitors also increase diaphragmatic contractility and
respiratory drive probably through adenosine receptor antagonism5. Recently,
theophylline has been shown to exercise immunomodulatory and anti-inflammatory

2
properties even at sub-bronchodilator doses and plasma levels6. This has been confirmed
by measurement of exhaled nitric oxide levels after caffeine consumption7.
The discovery of tissue specific PDE isoenzymes in the 1970’s has led to interest
in the development of selective PDE inhibitors such as roflumilast and cilomilast8, 9.
Selective PDE4 inhibitors are hoped to offer improved anti-inflammatory effects and
improved safety over nonspecific PDE inhibitors such as theophylline. The PDE4
specific inhibitors cilomilast and roflumilast are now in clinical trials and appear
promising10-12.
Spirometry
Spirometry has great utility for the diagnosis of respiratory disorders, monitoring
of pulmonary disease progression, and assessment of treatment efficacy. It is a
composite measure of lung function that reveals much about overall air exchange
capability yet is less illuminating of the various factors contributing to obstructive and
restrictive lung deficits. These factors may include body habitus, chest wall elasticity,
lung compliance, airway resistance, cystic air trapping, respiratory muscle weakness and
CNS impairment13, 14. Thus for obstructive lung disorders it has been desirable to
directly measure airway resistance and many techniques have been developed to
accomplish this15. Unfortunately these methods of airway resistance measurement such
as plethysmography and the forced oscillation technique have previously been unsuitable
for clinical application due to complexity and cost.
Impulse Oscillometry
Recently an application of the forced oscillation technique known as impulse

3
oscillometry (IOS) has become available in a compact package. This Jaeger
Masterscreen IOS package is non-invasive and FDA approved for IOS and conventional
spirometry measurements. A diagram of the typical equipment is shown in Figure 116.
Figure 1. Impulse Oscillometer
Mouthpiece
Impulse oscillometry uses the pressure-flow relationship of artificial impulse-
shaped test signals produced by an external generator. These artificial signals are
superimposed on the normal tidal breathing waveform of the subject while he is breathing
ambient air. Fast Fourier Transform (FFT) and quotient calculation is performed to
derive frequency versus impedance, resistance and reactance curves. This data can then
be used to describe airflow characteristics of the subjects’ lungs both in degree of and
location of impairment16. Useful respiratory impedance parameters include R5, total

4
respiratory resistance; R20, proximal respiratory resistance; and X5, distal capacitive
reactance (inversely related to the compliance of the lung).
Asthma
Asthma is the intermittent obstruction of lung airways in response to intrinsic or
environmental provocation such as allergens, physiologic stress or infection. Asthma is
thought to be under diagnosed both in the general population and the elderly. Many
times there is a history of wheezing, especially after viral infections. Often childhood
asthma enters remission in the second decade of life only to return in adulthood. Asthma
may occur after decades of pulmonary insult from tobacco smoking, occasionally
secondary to workplace exposures, and sometimes explosively with no prior history of
asthma17, 18.
Reports on the use of over-the-counter bronchodilator medications in asthmatics
indicate not only are asthmatics under diagnosed, but medically diagnosed asthmatics
who self-treat are less likely to receive and use anti-inflammatory therapy19. Modern
anti-inflammatory therapy can both relieve the symptoms of and delay the progression of
asthma. Further reports of other self and alternative medicine treatments for asthma
include herbal products, coffee, black tea, reflexology, acupuncture, massage therapy,
homeopathy, aromatherapy, and spinal manipulation20-23. Treatments, such as Chinese
herbs, may have concerning safety profiles and unpredictable interactions with
conventional medications24. Even if these alternative therapies are partially efficacious,
it may only delay the diagnosis of asthma until an episode of respiratory failure places
the patient in a hospital emergency department.

5
Asthma is not the only cause of obstructive pulmonary pathology. Other
obstructive lung pathologies include chronic obstructive lung disease (chronic bronchitis
or emphysema), bronchiectasis, cystic fibrosis, and bronchiolitis25. Recently it has been
recognized that vocal cord dysfunction may present with asthma-like symptoms26.
Each of these illnesses tends to obstruct different areas of the respiratory tree. Asthma
tends to exercise a predominant effect on the bronchi (larger airways) while chronic
obstructive lung disease tends to affect both large and small airways. In bronchiectasis,
there is dilatation of the bronchi with obstruction of the smaller distal airways. Cystic
fibrosis tends to initially affect the smaller airways with later evolution to bronchiectasis.
In contrast, bronchiolitis tends to affect the bronchioles (smaller airways). Vocal cord
dysfunction affects the flow of air through the larynx (voicebox).
6
Methods
The study was designed to investigate the question: “Is there a significant
bronchodilator effect observed in a normal population with the consumption of a single
cup of caffeinated coffee?” The hypotheses to be tested was: “A bronchodilator effect as
measured as total respiratory resistance at 5 Hz by impulse oscillometry will be observed
in a normal population with the consumption of a single cup of caffeinated coffee after
one hour.”
Study Subjects
Subjects by interview had no history of diagnosis of major cardiopulmonary
conditions. The sample consisted of 20 subjects with an approximately equal distribution
of gender in the group.
Subjects had to be of a certain age group to be eligible for the study: ages 18 to 90
years old (dates of birth 1914-1986). If the subjects were of this age group and decided to
participate in this study, each reviewed the informed consent and discussed the study and
possible participation with the study physician. If a subject was interested in
participating, the informed consent was be signed before any study-related test or
procedure was done. After signing the informed consent, screening tests were completed
to determine if a subject met the requirements to be in the study.

7
Potential candidates were screened to determine whether they could be considered
“normal”. Screening tests include completing standard questionnaires, undergoing a
physician’s interview, submitting to a physical examination and completing spirometry
measurements. The questionnaires are shown in Appendix A. The study physician
investigator reviewed the questionnaire responses; interviewed the subjects and
completed spirometry. All spirometry was performed according to American Thoracic
Society specifications and predicted values were taken from Hankinson, Crapo and co-
workers values27. In order to qualify, participants must have recorded a negative
questionnaire response suggestive of heart problems such as chest pain, irregular
heartbeats or uncontrolled high blood pressure. They also must not have been receiving
any medical treatment for any pulmonary condition.
Data Collected
Data was collected about the airway resistance of subjects using the Jaeger impulse
oscillometer and conventional pulmonary function tests. These tests were performed
before and 60 minutes after coffee consumption and subjects were interviewed as to
current and previous state of health, smoking history and current respiratory symptoms.
Patients were interviewed before and after the test, filled out the questionnaires in
Appendix A and asked to report any respiratory or sensory changes.
Pulmonary Measurement and Analysis
This study was performed in the respiratory investigations lab of the Occupational
and Environmental Medicine Department at the College of Public Health at the
University of South Florida, Tampa, FL. Over a two-week period, twenty subjects were

8
interviewed and tested during a single one to two hour visit. With the exception of the
informed consent form, all documentation was only identified by subject number. They
filled out a questionnaire screening for major medical conditions, underwent an interview
and received a screening exam. They then filled out a pre-test symptom questionnaire,
performed conventional spirometry and underwent impulse oscillometry. Spirometry
and impulse oscillometry were perfomed in a seated position for safety. The subject was
fitted with a nose clip and instructed in the performance of the forced expiratory
maneuver. The use of the spirometry equipment is illustrated in Figure 2. Three
acceptable maneuvers were obtained and the best was retained for comparison.
Figure 2. Use of Spirometry Equipment
The restrictor screen door (Figure 3a) on the impulse oscillometer was closed
(Figure 3b) and the subject instructed on the IOS procedures. The device was zeroed and
the subject was then instructed to begin breathing through the mouthpiece while
supporting his cheeks with his hands (Figure 4). After thirty seconds of breathing

9
normally through the mouthpiece and acclimating to the device, thirty seconds of
measurements were taken.
Figure 3. IOS Restrictor Screen Door
Figure 4. IOS Subject Hand Position

10
The subjects then received one eight ounce cup of premium caffeinated coffee
and filled out a medical history questionnaire. The coffee was the brand name Starbucks
Breakfast Blend and was prepared according to the instructions received with the
package of coffee. One tablespoon (15 milliliters of dried ground coffee) per six ounces
(180 milliliters) of water was prepared using a drip type coffee maker. One hour later the
subjects again filled out a symptom questionnaire, performed conventional spirometry
and underwent impulse oscillometry. These questionnaires are shown in Appendix A.
The investigator then interviewed the subject and performed a post-test
auscultation of the subject’s chest to conclude the subject’s visit. Jaeger impulse
oscillometry and conventional spirometry data were collected using the Jaeger
LabManager software. It was then was integrated with medical history data in a
Microsoft Excel spreadsheet and analyzed using the JMP 5.1 statistical program.

11
Results
Study Sample Characteristics
The study sample of twenty subjects was split approximately equally between
male(11) and female(9) subjects. The age of the sample ranged from 26 to 68 years with
a median age of 40 years. Seventeen of the subjects were Caucasian, two were US-
Asian, and one was US-African. Sixteen of the twenty subjects reported no health
problems. Health problems that were reported included mitral valve prolapse, migraine
headaches, lower back pain, glaucoma, urinary stones, history of fractures, hypertension,
and frequent urinary tract infections.
Pre and post coffee consumption symptoms were monitored by use of the
questionnaires in Appendix A. Subjects were asked to describe symptoms of heavy or
difficulty in breathing, phlegm production, runny or irritated nasal passages, throat
irritation or burning, sensation of weight or tightness of the chest and feeling of chest
burning. Each symptom was rated a numeric scale of none(1), very little(2), moderate
amount(3) and very much(4). Descriptive statistics for the study sample are shown in
Table 2 and Appendices E and F. Additional sample characterstics are detailed in Table
1 and Appendices B, C and D.

12
Table 1. Study Sample Characteristics
Gender
Female (9) 45% Male (11) 55%
Race / Ethnicity Caucasian (17) 85% US African (1) 5% US Asian (2) 10%
Age Range 26-68 years Median 40 years Mean 41.15 years Standard Deviation 9.76 years
Health Problems None (16) 80%, Mitral valve prolapse (1) 5%, Migraine headaches (1) 5%, Lower back pain (1) 5%, Glaucoma (1) 5%, Urinary stones (1) 5%, History of fractures (1) 5%, Hypertension (1) 5%, Frequent urinary tract infections (1) 5%
Medications None (10) 50%, Multivitamin (3) 15%, Calcium (1) 5%, Vitamin C (1) 5%, Saw palmetto (1) 5%, Lo Ovral (1) 5%, Tryoptic (1) 5%, Naprosyn (1) 5%, Premarin (1) 5%, OTC sinus medication (1) 5%, Yasmin (1) 5%, Spector (1) 5%, Paxil (1) 5%
Tobacco Smoker
No (15) 75% Yes (3) 15% Past (2) 10%

13
Table 2. Pre and Post Coffee Symptom Questionnaire Results
Median Mean Standard Deviation Pre Coffee 1.000 1.150 0.489 Breathing
Difficulties Post Coffee 1.000 1.100 0.447 Pre Coffee 1.000 1.350 0.671 Phlegm
Production Post Coffee 1.000 1.450 0.605 Pre Coffee 1.000 1.200 0.523 Nasal
Problems Post Coffee 1.000 1.100 0.308 Pre Coffee 1.000 1.200 0.523 Throat
Irritation Post Coffee 1.000 1.200 0.523 Pre Coffee 1.000 1.150 0.366 Chest
Tightness Post Coffee 1.000 1.050 0.224 Pre Coffee 1.000 1.000 0.000 Chest
Burning Post Coffee 1.000 1.000 0.000
14
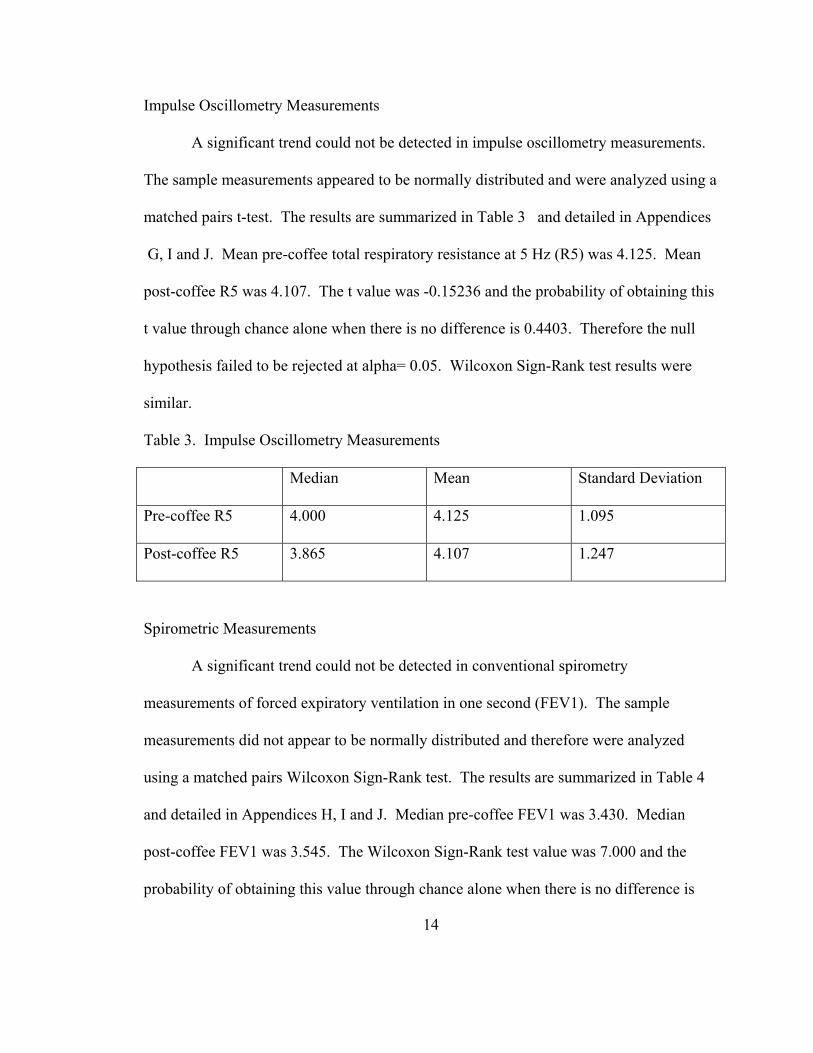
Impulse Oscillometry Measurements
A significant trend could not be detected in impulse oscillometry measurements.
The sample measurements appeared to be normally distributed and were analyzed using a
matched pairs t-test. The results are summarized in Table 3 and detailed in Appendices
G, I and J. Mean pre-coffee total respiratory resistance at 5 Hz (R5) was 4.125. Mean
post-coffee R5 was 4.107. The t value was -0.15236 and the probability of obtaining this
t value through chance alone when there is no difference is 0.4403. Therefore the null
hypothesis failed to be rejected at alpha= 0.05. Wilcoxon Sign-Rank test results were
similar.
Table 3. Impulse Oscillometry Measurements
Median Mean Standard Deviation
Pre-coffee R5 4.000 4.125 1.095
Post-coffee R5 3.865 4.107 1.247
Spirometric Measurements
A significant trend could not be detected in conventional spirometry
measurements of forced expiratory ventilation in one second (FEV1). The sample
measurements did not appear to be normally distributed and therefore were analyzed
using a matched pairs Wilcoxon Sign-Rank test. The results are summarized in Table 4
and detailed in Appendices H, I and J. Median pre-coffee FEV1 was 3.430. Median
post-coffee FEV1 was 3.545. The Wilcoxon Sign-Rank test value was 7.000 and the
probability of obtaining this value through chance alone when there is no difference is

15
0.387. Therefore this secondary measure also failed reach significance at alpha= 0.05.
Matched pairs t-test results were similar.
Table 4. Spirometric Measurements
Median Mean Standard Deviation
Pre-coffee FEV1 3.430 3.425 0.842
Post-coffee FEV1 3.545 3.454 0.832

16
Discussion
This study compared respiratory parameters in a sample of normal subjects before
and one hour after consumption of one cup of the caffeinated beverage coffee. Although
the study failed to show a significant difference in R5 before and after consumption of
this beverage it did provide useful experience in the use of the Jaeger Impulse
Oscillometer. Further, this study failed to confirm a bronchodilator effect in normal
individuals from consumption of caffeine as measured by changes in FEV1. This stands
in contrast to previous studies on asthmatics in which an increase in FEV1 was measured.
One possibility for the minimal changes observed in the study was that the study
sample was too healthy. Previous studies that demonstrated a bronchodilator effect were
performed on asthmatics. This study excluded known asthmatics.
Another explanation was that the interval of one hour between consumption of the
coffee and measurement of lung parameters was too short to allow time for a significant
bronchodilator effect to develop. Some studies in asthmatics demonstrated a larger effect
in intervals of two to four hours. It is possible that there is a measurable effect in a
normal population but it takes longer than one hour to develop.
It is also possible that the dose of caffeine delivered by this coffee was less than
that delivered by other brands or types of coffee. No attempt was made to quantify the
caffeine content of this coffee. Although Starbucks Breakfast Blend Coffee was

17
presumed to have between 125 and 185 mg of caffeine per cup the actual caffeine content
of this blend is unknown to this researcher. Caffeine has complex pharmacodynamics
and remains in the body for more than one day. Thus in a habitual coffee drinker the
effect may be masked by the previous days consumption of coffee.
There may simply be too much intra-subject and inter-subject variability in the in
the amount of bronchodilation and bronchoconstriction existing even in normal subjects
in response to environmental stimuli and personal characteristics from day to day and
hour to hour. This “noise” would tend to mask small effects.
This study could be repeated on asthmatic subjects to characterize their response
to caffeine using the IOS. The caffeine dose given could be exactly determined and
subjects could be asked to abstain from caffeine for more than just overnight. Finally the
study could be performed over a longer period of time on normal subjects to determine
when a bronchodilatory effect occurs in normal subjects.
The study could be repeated with a greater attempt to control subjects activity and
confounding exposures in the interval between the pre and post caffeine pulmonary
measurements. The subjects were allowed to leave the lab area in the interval between
being given the coffee and the post coffee respiratory measurements. By requiring the
test subjects to remain in the lab area during the entire duration of the study the activities
of the subjects can be monitored and external exposures could be controlled.

18
Conclusions
There was no evidence of bronchodilation induced one hour after consumption of
a single cup of caffeinated coffee in normal individuals neither as measured by impulse
oscillometry nor by conventional spirometry.

19
References 1. Scott A, Beckwith S. In pursuit of tea. In Pursuit of Tea [webpage]. Available at:
www.inpursuitoftea.com, 2004. 2. Anonymous. The history of coffee. The Roast and Post Coffee Company
[webpage]. Available at: www.realcoffee.co.uk, 2004. 3. Bara AI, Barley EA. Caffeine for asthma.[update in Cochrane Database Syst Rev.
2001;(4):CD001112; PMID: 11687099]. Cochrane Database of Systematic Reviews. 2000(2):CD001112.
4. Macht DI, Ting G-C. A study of anti-spasmodic drugs on the bronchus. Journal
of Pharmacology & Experimental Therapeutics. December, 1921 1921;18(5):373-398.
5. Jenne JW. Bronchodilators. In: O'Byrne PM, Thomson NC, eds. Manual of
Asthma Management. London, England: W. B. Saunders Company Ltd.; 1995:291-320.
6. Banner KH, Spina D, Page CP. Drugs that reduce airways inflammation. In: Page
CP, Banner KH, Spina D, eds. Cellular Mechanisms in Airways Inflammation. Basel, Switzerland: Birkhauser Verlag; 2000:303-325.
7. Bruce C, Yates DH, Thomas PS. Caffeine decreases exhaled nitric oxide.[see
comment]. Thorax. 2002;57(4):361-363. 8. Essayan DM. Cyclic nucleotide phosphodiesterases. Journal of Allergy &
Clinical Immunology. 2001;108(5):671-680. 9. Spina D. Theophylline and PDE4 inhibitors in asthma. Current Opinion in
Pulmonary Medicine. 2003;9(1):57-64. 10. Grootendorst DC, Gauw SA, Baan R, et al. Does a single dose of the
phosphodiesterase 4 inhibitor, cilomilast (15 mg), induce bronchodilation in patients with chronic obstructive pulmonary disease? Pulmonary Pharmacology & Therapeutics. 2003;16(2):115-120.
11. Profita M, Chiappara G, Mirabella F, et al. Effect of cilomilast (Ariflo) on TNF-

20
alpha, IL-8, and GM-CSF release by airway cells of patients with COPD. Thorax. 2003;58(7):573-579.
12. Sturton G, Fitzgerald M. Phosphodiesterase 4 inhibitors for the treatment of
COPD. Chest. 2002;121(5 Suppl):192S-196S. 13. Nava S, Rubini F. Lung and chest wall mechanics in ventilated patients with end
stage idiopathic pulmonary fibrosis. Thorax. 1999;54(5):390-395. 14. Eissa NT, Ranieri VM, Corbeil C, et al. Analysis of behavior of the respiratory
system in ARDS patients: effects of flow, volume, and time. Journal of Applied Physiology. 1991;70(6):2719-2729.
15. Klug B, Bisgaard H. Specific airway resistance, interrupter resistance, and
respiratory impedance in healthy children aged 2-7 years. Pediatric Pulmonology. 1998;25(5):322-331.
16. Anonymous. IOS User Manual, Version 4.5. Hoechberg, Germany: Erich Jaeger
GmbH. 17. Zacharisen MC. Occupational asthma. Medical Clinics of North America.
2002;86(5):951-971. 18. Braman SS. Asthma in the elderly. Clinics in Geriatric Medicine. 2003;19(1):57-
75. 19. Kuschner WG, Hankinson TC, Wong HH, Blanc PD. Nonprescription
bronchodilator medication use in asthma.[see comment]. Chest. 1997;112(4):987-993.
20. Blanc PD, Kuschner WG, Katz PP, Smith S, Yelin EH. Use of herbal products,
coffee or black tea, and over-the-counter medications as self-treatments among adults with asthma.[see comment]. Journal of Allergy & Clinical Immunology. 1997;100(6 Pt 1):789-791.
21. Blanc PD, Kuschner WG, Katz PP, Yelin EH. Reanalysis of Blanc PD et al, "Use
of herbal products, coffee or black tea, and over-the-counter medications as self treatments among adults with asthma".[comment]. Journal of Allergy & Clinical Immunology. 2000;106(1 Pt 1):196.
22. Blanc PD, Trupin L, Earnest G, Katz PP, Yelin EH, Eisner MD. Alternative

21
therapies among adults with a reported diagnosis of asthma or rhinosinusitis : data from a population-based survey.[see comment]. Chest. 2001;120(5):1461-1467.
23. Ernst E. Complementary/alternative medicine for asthma: we do not know what
we need to know.[see comment]. Chest. 1999;115(1):1-3. 24. Ernst E. "Alternative" therapies for asthma : reason for concern?[comment].
Chest. 2001;120(5):1433-1434. 25. Weinberger SE, Drazen JM. Disturbances of Respiratory Function. In: Braunwald
E, Fauci AS, Kasper DL, Hauser SL, Longo DL, Jameson JL, eds. Harrison's Principles of Internal Medicine. 15th ed. New York: McGraw-Hill; 2001:1446-1453.
26. McFadden ER, Jr., Zawadski DK. Vocal cord dysfunction masquerading as
exercise-induced asthma. a physiologic cause for "choking" during athletic activities. American Journal of Respiratory & Critical Care Medicine. 1996;153(3):942-947.
27. Hankinson JL, Odencrantz JR, Fedan KB. Spirometric reference values from a
sample of the general U.S. population.[see comment]. American Journal of Respiratory & Critical Care Medicine. 1999;159(1):179-187.

22
Appendices

23
Appendix A: Questionnaires
Subject number:_______
Caffeine and Airway Resistance Study Pre-Coffee Questionnaire
Today’s Date _______________________________________
People who are pregnant or have heart problems such as chest pain, irregular heartbeats or uncontrolled high blood pressure should not drink caffeinated beverages such as coffee. Do you have any health problems that would prevent you from drinking coffee or have you been told by a doctor, nurse or other healthcare provider that you should avoid caffeinated beverages such as coffee? Please circle “yes” or “no”. YES or NO Do you take any medications from a doctor or other healthcare provider for your lungs? Please circle “yes” or “no”. YES or NO

24
Appendix A: (Continued)
SUBJECT NUMBER:
___________________________________________
Pre-Coffee Consumption Symptom Questionnaire
“At this point in time, to what degree do you note the following symptoms?”
(1) Heavy or difficulty in your breathing 1. NONE 2. VERY LITTLE 3. MODERATE AMOUNT 4. VERY MUCH
(2) Phlegm production 1. NONE 2. VERY LITTLE 3. MODERATE AMOUNT 4. VERY MUCH
(3) Runny or irritated nose or nasal passages 1. NONE 2. VERY LITTLE 3. MODERATE AMOUNT 4. VERY MUCH
(4) Throat irritation or burning sensation 1. NONE 2. VERY LITTLE 3. MODERATE AMOUNT 4. VERY MUCH
(5) Sensation of a “weight” or tightness of the chest 1. NONE 2. VERY LITTLE 3. MODERATE AMOUNT 4. VERY MUCH
(6) Feeling of chest burning 1. NONE 2. VERY LITTLE 3. MODERATE AMOUNT 4. VERY MUCH

25
Appendix A: (Continued)
SUBJECT NUMBER:
___________________________________________
Post-Coffee Consumption Symptom Questionnaire
“At this point in time, to what degree do you note the following symptoms?”
(1) Heavy or difficulty in your breathing 1. NONE 2. VERY LITTLE 3. MODERATE AMOUNT 4. VERY MUCH
(2) Phlegm production 1. NONE 2. VERY LITTLE 3. MODERATE AMOUNT 4. VERY MUCH
(3) Runny or irritated nose or nasal passages 1. NONE 2. VERY LITTLE 3. MODERATE AMOUNT 4. VERY MUCH
(4) Throat irritation or burning sensation 1. NONE 2. VERY LITTLE 3. MODERATE AMOUNT 4. VERY MUCH
(5) Sensation of a “weight” or tightness of the chest 1. NONE 2. VERY LITTLE 3. MODERATE AMOUNT 4. VERY MUCH
(6) Feeling of chest burning 1. NONE 2. VERY LITTLE 3. MODERATE AMOUNT 4. VERY MUCH

26
Appendix A: (Continued)
Subject number:_______
Caffeine and Airway Resistance Study Questionnaire Today’s Date _______________________________________ Gender: Male Female (circle one)
1) How old are you? ______________years 2) Do you have any health problems that you see a physician for? Please list them below. 1._________________________________________________________ 2. ________________________________________________________ 3. ________________________________________________________ 4. ________________________________________________________ 5.________________________________________________________ 3) Are you taking any medications? If so please list them below. (Including over the counter medications) 1._________________________________________________________ 2. ________________________________________________________ 3. ________________________________________________________ 4. ________________________________________________________ 5.________________________________________________________
27
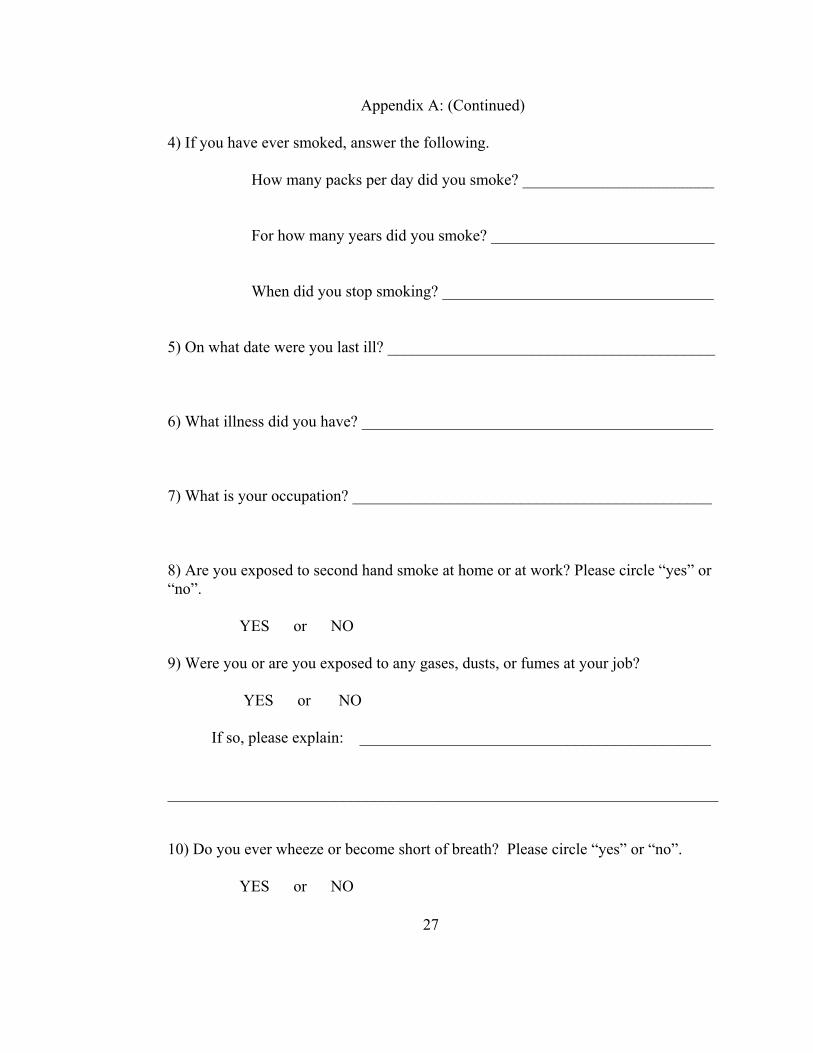
Appendix A: (Continued) 4) If you have ever smoked, answer the following. How many packs per day did you smoke? ________________________ For how many years did you smoke? ____________________________ When did you stop smoking? __________________________________ 5) On what date were you last ill? _________________________________________
6) What illness did you have? ____________________________________________ 7) What is your occupation? _____________________________________________ 8) Are you exposed to second hand smoke at home or at work? Please circle “yes” or “no”. YES or NO 9) Were you or are you exposed to any gases, dusts, or fumes at your job? YES or NO If so, please explain: ____________________________________________
_____________________________________________________________________ 10) Do you ever wheeze or become short of breath? Please circle “yes” or “no”. YES or NO

28
Appendix B: Study Sample Characteristics
Gender Ethnicity Age Health Problems Medications Smoker Pack-yearsMale Caucasian 36 None None Past 1Female US-Asian 37 None MVI, calcium No 0Female Caucasian 26 None MVI No 0Female US-Asian 35 None None No 0Male Caucasian 39 None None No 0Female Caucasian 48 None MVI, vitamin C No 0Male Caucasian 35 None None No 0Male Caucasian 36 None Saw palmetto No 0Female Caucasian 40 MVP, migraine, LBP Lo Ovral Yes 15Male Caucasian 42 None None Yes 0.1Female Caucasian 42 None None No 0Male Caucasian 42 Glaucoma, stones, fx Tryoptic, naprosyn No 0Female Caucasian 54 None Premarin, OTC sinus No 0Male Caucasian 45 None None No 0Female Caucasian 26 None Yasmin Past 0.5Male Caucasian 68 None Spector No 0Male Caucasian 32 None None No 0Male Caucasian 52 Hypertension None No 0Female Caucasian 48 Frequent UTIs Paxil Yes 8Male US-African 40 None None No 0

29
Appendix C: Age, Gender and Ethnicity Distributions
Distributions Gender
Female
Male
Frequencies Level Count ProbFemale 9 0.45000Male 11 0.55000Total 20 1.00000 N Missing 0 2 Levels

30
Appendix C: (Continued)
Ethnicity
Caucasian
US-African
US-Asian
Frequencies Level Count ProbCaucasian 17 0.85000US-African 1 0.05000US-Asian 2 0.10000Total 20 1.00000 N Missing 0 3 Levels

31
Appendix C: (Continued)
Age
20
30
40
50
60
70
Quantiles 100.0% maximum 68.00099.5% 68.00097.5% 68.00090.0% 53.80075.0% quartile 47.25050.0% median 40.00025.0% quartile 35.25010.0% 26.6002.5% 26.0000.5% 26.0000.0% minimum 26.000 Moments Mean 41.15Std Dev 9.7617675Std Err Mean 2.1827976upper 95% Mean 45.718648lower 95% Mean 36.581352N 20

32
Appendix D: Health Characteristics and Exposures Distributions
Health Problems
Frequent UTIs
Glacoma, stones, fx
Hypertension
MVP, migraine, LBP
None
Frequencies Level Count ProbFrequent UTIs 1 0.05000Glacoma, stones, fx 1 0.05000Hypertension 1 0.05000MVP, migraine, LBP 1 0.05000None 16 0.80000Total 20 1.00000 N Missing 0 5 Levels

33
Appendix D: (Continued)
Medications
Lo OvralMVIMVI, calciumMVI, vitamin CNonePaxilPremarin, OTC sinusSaw palmettoSpectorTryoptic, naprosynYasmin
Frequencies Level Count ProbLo Ovral 1 0.05000MVI 1 0.05000MVI, calcium 1 0.05000MVI, vitamin C 1 0.05000None 10 0.50000Paxil 1 0.05000Premarin, OTC sinus 1 0.05000Saw palmetto 1 0.05000Spector 1 0.05000Tryoptic, naprosyn 1 0.05000Yasmin 1 0.05000Total 20 1.00000 N Missing 0 11 Levels

34
Appendix D: (Continued)
Smoker
No
Past
Yes
Frequencies Level Count ProbNo 15 0.75000Past 2 0.10000Yes 3 0.15000Total 20 1.00000 N Missing 0 3 Levels

35
Appendix D: (Continued)
Pack-years
0
5
10
15
Quantiles 100.0% maximum 15.00099.5% 15.00097.5% 15.00090.0% 7.30075.0% quartile 0.07550.0% median 0.00025.0% quartile 0.00010.0% 0.0002.5% 0.0000.5% 0.0000.0% minimum 0.000 Moments Mean 1.23Std Dev 3.6992318Std Err Mean 0.8271734upper 95% Mean 2.9612938lower 95% Mean -0.501294N 20

36
Appendix D: (Continued)
Months Since Sick
0
5
10
15
20
25
Quantiles 100.0% maximum 24.00099.5% 24.00097.5% 24.00090.0% 22.00075.0% quartile 12.00050.0% median 2.00025.0% quartile 1.00010.0% 0.7502.5% 0.5000.5% 0.5000.0% minimum 0.500 Moments Mean 6.25Std Dev 7.7577505Std Err Mean 2.073346upper 95% Mean 10.729192lower 95% Mean 1.7708082N 14

37
Appendix D: (Continued)
Occupation
Case Mgr.
City Planner
Coast Guard
Engineer
Military
Physician
Rad. Clerk
Reg. Nurse
Secretary
Student
Frequencies Level Count ProbCase Mgr. 1 0.05000City Planner 1 0.05000Coast Guard 1 0.05000Engineer 1 0.05000Military 1 0.05000Physician 9 0.45000Rad. Clerk 1 0.05000Reg. Nurse 2 0.10000Secretary 2 0.10000Student 1 0.05000Total 20 1.00000 N Missing 0 10 Levels

38
Appendix D: (Continued) Exposures
None
indirect tobacco
workplace
Frequencies Level Count ProbNone 16 0.80000indirect tobacco 2 0.10000workplace 2 0.10000Total 20 1.00000 N Missing 0 3 Levels

39
Appendix D: (Continued)
Wheeze/SOB
No
Yes
Frequencies Level Count ProbNo 19 0.95000Yes 1 0.05000Total 20 1.00000 N Missing 0 2 Levels

40
Appendix E: Pre and Post Coffee Symptom Questionnaire Results
Pre Breathing Post Breathing Pre Phlegm Post Phlegm Pre Nose Post Nose 1 1 1 2 1 11 1 1 2 1 11 1 1 2 1 11 1 3 2 1 11 1 1 2 1 13 3 3 3 2 21 1 2 1 3 21 1 1 1 1 12 1 1 2 1 11 1 1 1 1 11 1 1 1 1 11 1 1 1 1 11 1 2 2 2 11 1 1 1 1 11 1 1 1 1 11 1 1 1 1 11 1 1 1 1 11 1 1 1 1 11 1 2 1 1 11 1 1 1 1 1
Pre Throat Post Throat Pre Tightness Post Tightness Pre Burning Post Burning
1 1 1 1 1 11 1 1 1 1 11 1 1 1 1 11 1 1 1 1 11 1 1 1 1 13 3 2 2 1 12 2 2 1 1 11 1 1 1 1 11 1 2 1 1 11 1 1 1 1 11 1 1 1 1 12 2 1 1 1 11 1 1 1 1 11 1 1 1 1 11 1 1 1 1 11 1 1 1 1 11 1 1 1 1 11 1 1 1 1 11 1 1 1 1 11 1 1 1 1 1

41
Appendix F: Pre and Post Coffee Symptom Questionnaire Distributions
Distributions Pre Breathing
0.5
1
1.5
2
2.5
3
3.5
Quantiles 100.0% maximum 3.000099.5% 3.000097.5% 3.000090.0% 1.900075.0% quartile 1.000050.0% median 1.000025.0% quartile 1.000010.0% 1.00002.5% 1.00000.5% 1.00000.0% minimum 1.0000 Moments Mean 1.15Std Dev 0.4893605Std Err Mean 0.1094243upper 95% Mean 1.3790278lower 95% Mean 0.9209722N 20

42
Appendix F: (Continued)
Post Breathing
0.5
1
1.5
2
2.5
3
3.5
Quantiles 100.0% maximum 3.000099.5% 3.000097.5% 3.000090.0% 1.000075.0% quartile 1.000050.0% median 1.000025.0% quartile 1.000010.0% 1.00002.5% 1.00000.5% 1.00000.0% minimum 1.0000 Moments Mean 1.1Std Dev 0.4472136Std Err Mean 0.1upper 95% Mean 1.3093024lower 95% Mean 0.8906976N 20

43
Appendix F: (Continued)
Pre Phlegm
0.5
1
1.5
2
2.5
3
3.5
Quantiles 100.0% maximum 3.000099.5% 3.000097.5% 3.000090.0% 2.900075.0% quartile 1.750050.0% median 1.000025.0% quartile 1.000010.0% 1.00002.5% 1.00000.5% 1.00000.0% minimum 1.0000 Moments Mean 1.35Std Dev 0.6708204Std Err Mean 0.15upper 95% Mean 1.6639536lower 95% Mean 1.0360464N 20

44
Appendix F: (Continued)
Post Phlegm
0.5
1
1.5
2
2.5
3
3.5
Quantiles 100.0% maximum 3.000099.5% 3.000097.5% 3.000090.0% 2.000075.0% quartile 2.000050.0% median 1.000025.0% quartile 1.000010.0% 1.00002.5% 1.00000.5% 1.00000.0% minimum 1.0000 Moments Mean 1.45Std Dev 0.6048053Std Err Mean 0.1352386upper 95% Mean 1.7330576lower 95% Mean 1.1669424N 20

45
Appendix F: (Continued)
Pre Nose
0.5
1
1.5
2
2.5
3
3.5
Quantiles 100.0% maximum 3.000099.5% 3.000097.5% 3.000090.0% 2.000075.0% quartile 1.000050.0% median 1.000025.0% quartile 1.000010.0% 1.00002.5% 1.00000.5% 1.00000.0% minimum 1.0000 Moments Mean 1.2Std Dev 0.5231484Std Err Mean 0.1169795upper 95% Mean 1.444841lower 95% Mean 0.955159N 20

46
Appendix F: (Continued)
Post Nose
0.75
1
1.25
1.5
1.75
2
2.25
Quantiles 100.0% maximum 2.000099.5% 2.000097.5% 2.000090.0% 1.900075.0% quartile 1.000050.0% median 1.000025.0% quartile 1.000010.0% 1.00002.5% 1.00000.5% 1.00000.0% minimum 1.0000 Moments Mean 1.1Std Dev 0.3077935Std Err Mean 0.0688247upper 95% Mean 1.2440518lower 95% Mean 0.9559482N 20

47
Appendix F: (Continued)
Pre Throat
0.5
1
1.5
2
2.5
3
3.5
Quantiles 100.0% maximum 3.000099.5% 3.000097.5% 3.000090.0% 2.000075.0% quartile 1.000050.0% median 1.000025.0% quartile 1.000010.0% 1.00002.5% 1.00000.5% 1.00000.0% minimum 1.0000 Moments Mean 1.2Std Dev 0.5231484Std Err Mean 0.1169795upper 95% Mean 1.444841lower 95% Mean 0.955159N 20

48
Appendix F: (Continued)
Post Throat
0.5
1
1.5
2
2.5
3
3.5
Quantiles 100.0% maximum 3.000099.5% 3.000097.5% 3.000090.0% 2.000075.0% quartile 1.000050.0% median 1.000025.0% quartile 1.000010.0% 1.00002.5% 1.00000.5% 1.00000.0% minimum 1.0000 Moments Mean 1.2Std Dev 0.5231484Std Err Mean 0.1169795upper 95% Mean 1.444841lower 95% Mean 0.955159N 20
49
Appendix F: (Continued)
Pre Tightness
0.75
1
1.25
1.5
1.75
2
2.25
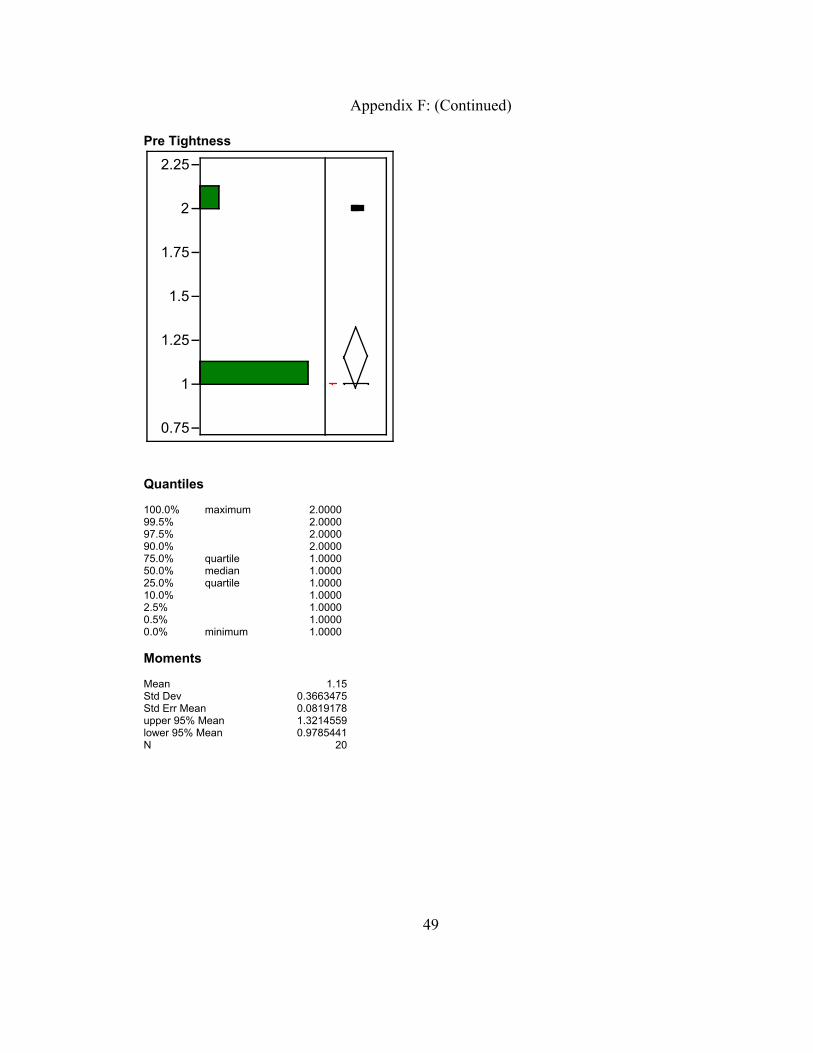
Quantiles 100.0% maximum 2.000099.5% 2.000097.5% 2.000090.0% 2.000075.0% quartile 1.000050.0% median 1.000025.0% quartile 1.000010.0% 1.00002.5% 1.00000.5% 1.00000.0% minimum 1.0000 Moments Mean 1.15Std Dev 0.3663475Std Err Mean 0.0819178upper 95% Mean 1.3214559lower 95% Mean 0.9785441N 20

50
Appendix F: (Continued)
Post Tightness
0.75
1
1.25
1.5
1.75
2
2.25
Quantiles 100.0% maximum 2.000099.5% 2.000097.5% 2.000090.0% 1.000075.0% quartile 1.000050.0% median 1.000025.0% quartile 1.000010.0% 1.00002.5% 1.00000.5% 1.00000.0% minimum 1.0000 Moments Mean 1.05Std Dev 0.2236068Std Err Mean 0.05upper 95% Mean 1.1546512lower 95% Mean 0.9453488N 20

51
Appendix F: (Continued)
Pre Burning
0.75
1
1.25
1.5
1.75
2
2.25
Quantiles 100.0% maximum 1.000099.5% 1.000097.5% 1.000090.0% 1.000075.0% quartile 1.000050.0% median 1.000025.0% quartile 1.000010.0% 1.00002.5% 1.00000.5% 1.00000.0% minimum 1.0000 Moments Mean 1Std Dev 0Std Err Mean 0upper 95% Mean 1lower 95% Mean 1N 20

52
Appendix F: (Continued)
Post Burning
0.75
1
1.25
1.5
1.75
2
2.25
Quantiles 100.0% maximum 1.000099.5% 1.000097.5% 1.000090.0% 1.000075.0% quartile 1.000050.0% median 1.000025.0% quartile 1.000010.0% 1.00002.5% 1.00000.5% 1.00000.0% minimum 1.0000 Moments Mean 1Std Dev 0Std Err Mean 0upper 95% Mean 1lower 95% Mean 1N 20

53
Appendix G: Impulse Oscillometry Measurements
Pre R5 Pre R5 %ile Post R5 Post R5 %ile R5 Change R5 %ile Chg 3.85 138.3 3.57 128.2 -0.28 -10.1 3.43 94.3 2.72 74.9 -0.71 -19.4 5.04 146.2 4.78 138.7 -0.26 -7.5 5.99 166.4 7.29 202.5 1.3 36.1 4.44 157.5 4.01 142.1 -0.43 -15.4 3.18 83.3 3.26 85.2 0.08 1.9 4.25 153.4 4.49 161.9 0.24 8.5 6.94 249.1 6.21 223 -0.73 -26.1 3.29 89.2 3.07 83.4 -0.22 -5.8 2.64 92.6 2.9 101.6 0.26 9 4.05 109 3.55 95.4 -0.5 -13.6 3.2 112.3 3.3 115.9 0.1 3.6
4.17 106.3 4.37 111.3 0.2 5 3.45 119.6 4.51 156.2 1.06 36.6 5.25 152.4 5.28 153.3 0.03 0.9 4.44 141.3 4.54 144.7 0.1 3.4 2.64 96.4 2.44 89.1 -0.2 -7.3 4.91 165.6 5.34 180.2 0.43 14.6 3.95 103.5 3.72 97.4 -0.23 -6.1 3.39 119.6 2.79 98.5 -0.6 -21.1

54
Appendix H: Spirometric Measurements
Pre FEV1 Pre FEV1 %ile Post FEV1 Post FEV1 %ile FEV1 Change FEV1 %ile Chg4.17 102 4.26 104.3 0.09 2.32.54 88.2 2.36 82 -0.18 -6.23.53 103.4 3.48 102.2 -0.05 -1.22.12 74.6 2.02 71.1 -0.1 -3.53.03 82.8 3.67 100.3 0.64 17.52.64 99.7 2.95 111.2 0.31 11.53.65 73.5 3.65 73.6 0 0.14.42 117.8 4.2 111.9 -0.22 -5.92.78 98.9 2.9 103.1 0.12 4.24.27 93.1 4.28 93.2 0.01 0.12.89 107.3 2.59 95.9 -0.3 -11.43.75 81.7 3.8 82.7 0.05 12.34 79.9 2.33 79.7 -0.01 -0.24.42 110.6 4.37 109.3 -0.05 -1.32.83 91.4 3.05 98.5 0.22 7.12.84 81.2 2.98 85.3 0.14 4.15.41 103.7 5.41 103.6 0 -0.13.67 92.6 3.61 91.2 -0.06 -1.43.33 115.3 3.35 116 0.02 0.73.87 80.3 3.83 79.5 -0.04 -0.8

55
Appendix I: Respiratory Measurements Distributions
Pre FEV1
2
2.5
3
3.5
4
4.5
5
5.5
Quantiles 100.0% maximum 5.410099.5% 5.410097.5% 5.410090.0% 4.420075.0% quartile 4.095050.0% median 3.430025.0% quartile 2.792510.0% 2.36002.5% 2.12000.5% 2.12000.0% minimum 2.1200 Moments Mean 3.425Std Dev 0.8416119Std Err Mean 0.1881901upper 95% Mean 3.8188865lower 95% Mean 3.0311135N 20

56
Appendix I: (Continued)
Pre FEV1 %ile
70
80
90
100
110
120
Quantiles 100.0% maximum 117.8099.5% 117.8097.5% 117.8090.0% 114.8375.0% quartile 103.6350.0% median 92.8525.0% quartile 81.3310.0% 75.132.5% 73.500.5% 73.500.0% minimum 73.50 Moments Mean 93.9Std Dev 13.459843Std Err Mean 3.0097123upper 95% Mean 100.1994lower 95% Mean 87.6006N 20

57
Appendix I: (Continued)
Post FEV1
2
2.5
3
3.5
4
4.5
5
5.5
Quantiles 100.0% maximum 5.410099.5% 5.410097.5% 5.410090.0% 4.361075.0% quartile 4.107550.0% median 3.545025.0% quartile 2.912510.0% 2.33302.5% 2.02000.5% 2.02000.0% minimum 2.0200 Moments Mean 3.4545Std Dev 0.8318431Std Err Mean 0.1860058upper 95% Mean 3.8438145lower 95% Mean 3.0651855N 20

58
Appendix I: (Continued)
Post FEV1 %ile
70
80
90
100
110
120
Quantiles 100.0% maximum 116.0099.5% 116.0097.5% 116.0090.0% 111.8375.0% quartile 104.1350.0% median 97.2025.0% quartile 82.1710.0% 74.192.5% 71.100.5% 71.100.0% minimum 71.10 Moments Mean 94.73Std Dev 13.468681Std Err Mean 3.0116886upper 95% Mean 101.03354lower 95% Mean 88.426463N 20

59
Appendix I: (Continued)
Pre R5
2
3
4
5
6
7
Quantiles 100.0% maximum 6.940099.5% 6.940097.5% 6.940090.0% 5.916075.0% quartile 4.792550.0% median 4.000025.0% quartile 3.315010.0% 2.69402.5% 2.64000.5% 2.64000.0% minimum 2.6400 Moments Mean 4.125Std Dev 1.0950775Std Err Mean 0.2448668upper 95% Mean 4.637512lower 95% Mean 3.612488N 20

60
Appendix I: (Continued)
Pre R5 %ile
100
150
200
250
Quantiles 100.0% maximum 249.1099.5% 249.1097.5% 249.1090.0% 166.3275.0% quartile 153.1550.0% median 119.6025.0% quartile 98.1810.0% 89.542.5% 83.300.5% 83.300.0% minimum 83.30 Moments Mean 129.815Std Dev 39.016411Std Err Mean 8.7243346upper 95% Mean 148.07524lower 95% Mean 111.55476N 20

61
Appendix I: (Continued)
Post R5
2
3
4
5
6
7
8
Quantiles 100.0% maximum 7.290099.5% 7.290097.5% 7.290090.0% 6.123075.0% quartile 4.720050.0% median 3.865025.0% quartile 3.117510.0% 2.72702.5% 2.44000.5% 2.44000.0% minimum 2.4400 Moments Mean 4.107Std Dev 1.2474146Std Err Mean 0.2789304upper 95% Mean 4.690808lower 95% Mean 3.523192N 20

62
Appendix I: (Continued)
Post R5 %ile
50
100
150
200
Quantiles 100.0% maximum 223.0099.5% 223.0097.5% 223.0090.0% 200.2775.0% quartile 155.4750.0% median 122.0525.0% quartile 95.9010.0% 83.582.5% 74.900.5% 74.900.0% minimum 74.90 Moments Mean 129.175Std Dev 41.41872Std Err Mean 9.2615074upper 95% Mean 148.55956lower 95% Mean 109.79044N 20

63
Appendix I: (Continued)
Pre R20
2.5
3
3.5
4
4.5
5
5.5
Quantiles 100.0% maximum 5.320099.5% 5.320097.5% 5.320090.0% 4.801075.0% quartile 3.950050.0% median 3.465025.0% quartile 3.182510.0% 2.64702.5% 2.55000.5% 2.55000.0% minimum 2.5500 Moments Mean 3.595Std Dev 0.7431901Std Err Mean 0.1661824upper 95% Mean 3.9428237lower 95% Mean 3.2471763N 20

64
Appendix I: (Continued)
Post R20
2
2.5
3
3.5
4
4.5
5
5.5
6
Quantiles 100.0% maximum 5.920099.5% 5.920097.5% 5.920090.0% 5.176075.0% quartile 4.272550.0% median 3.290025.0% quartile 2.817510.0% 2.49502.5% 2.32000.5% 2.32000.0% minimum 2.3200 Moments Mean 3.5795Std Dev 0.9626579Std Err Mean 0.2152569upper 95% Mean 4.0300378lower 95% Mean 3.1289622N 20

65
Appendix I: (Continued)
Pre X5
-3.5
-3
-2.5
-2
-1.5
-1
-0.5
Quantiles 100.0% maximum -0.53099.5% -0.53097.5% -0.53090.0% -0.63575.0% quartile -0.81850.0% median -1.05025.0% quartile -1.43210.0% -2.1152.5% -3.0200.5% -3.0200.0% minimum -3.020 Moments Mean -1.223Std Dev 0.5911283Std Err Mean 0.1321803upper 95% Mean -0.946343lower 95% Mean -1.499657N 20

66
Appendix I: (Continued)
Post X5
-3
-2.5
-2
-1.5
-1
-0.5
0
Quantiles 100.0% maximum -0.38099.5% -0.38097.5% -0.38090.0% -0.59875.0% quartile -0.78550.0% median -1.01025.0% quartile -1.40810.0% -1.5942.5% -2.5800.5% -2.5800.0% minimum -2.580 Moments Mean -1.116Std Dev 0.4880078Std Err Mean 0.1091219upper 95% Mean -0.887605lower 95% Mean -1.344395N 20

67
Appendix I: (Continued)
Pre AX
0
5
10
15
20
Quantiles 100.0% maximum 20.04099.5% 20.04097.5% 20.04090.0% 10.97575.0% quartile 5.97750.0% median 2.68025.0% quartile 1.64810.0% 1.0992.5% 0.9600.5% 0.9600.0% minimum 0.960 Moments Mean 4.578Std Dev 4.7440984Std Err Mean 1.0608126upper 95% Mean 6.7983064lower 95% Mean 2.3576936N 20

68
Appendix I: (Continued)
Post AX
0
2.5
5
7.5
10
12.5
15
Quantiles 100.0% maximum 13.26099.5% 13.26097.5% 13.26090.0% 10.84075.0% quartile 5.91850.0% median 2.65025.0% quartile 1.68010.0% 0.9792.5% 0.9200.5% 0.9200.0% minimum 0.920 Moments Mean 4.1095Std Dev 3.7563048Std Err Mean 0.8399353upper 95% Mean 5.8675048lower 95% Mean 2.3514952N 20
69
Appendix I: (Continued)
Pre Fres
7.5
10
12.5
15
17.5
20
22.5
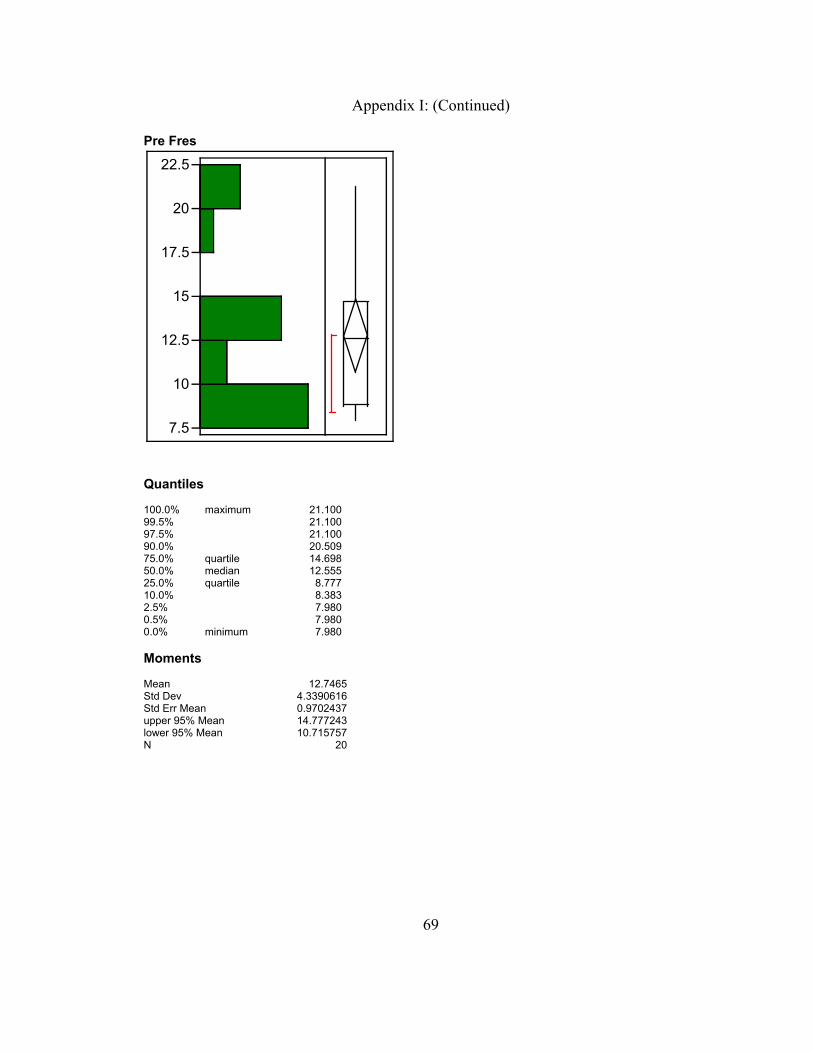
Quantiles 100.0% maximum 21.10099.5% 21.10097.5% 21.10090.0% 20.50975.0% quartile 14.69850.0% median 12.55525.0% quartile 8.77710.0% 8.3832.5% 7.9800.5% 7.9800.0% minimum 7.980 Moments Mean 12.7465Std Dev 4.3390616Std Err Mean 0.9702437upper 95% Mean 14.777243lower 95% Mean 10.715757N 20

70
Appendix I: (Continued)
Post Fres
7.5
10
12.5
15
17.5
20
22.5
Quantiles 100.0% maximum 21.20099.5% 21.20097.5% 21.20090.0% 20.61175.0% quartile 15.01550.0% median 11.94025.0% quartile 8.95710.0% 8.2812.5% 7.9200.5% 7.9200.0% minimum 7.920 Moments Mean 12.589Std Dev 4.2574367Std Err Mean 0.9519918upper 95% Mean 14.581542lower 95% Mean 10.596458N 20

71
Appendix J: Analysis of Post-test vs Pre-test Differences in R5, R20 and FEV1
Matched Pairs Difference: Post R5-Pre R5
-1.5
-1.0
-0.5
0.0
0.5
1.0
1.5D
iffer
ence
: Pos
t R5-
Pre
R5
2 3 4 5 6 7Mean: (Post R5+Pre R5)/2
Post R5 4.107 t-Ratio -0.15236Pre R5 4.125 DF 19Mean Difference -0.018 Prob > |t| 0.8805Std Error 0.11814 Prob > t 0.5597Upper95% 0.22927 Prob < t 0.4403Lower95% -0.2653 N 20 Correlation 0.90632 Wilcoxon Sign-Rank Post R5-Pre R5Test Statistic -18.000Prob > |z| 0.516Prob > z 0.742Prob < z 0.258

72
Appendix J: (Continued)
Matched Pairs Difference: Post R20-Pre R20
-1.5
-1.0
-0.5
0.0
0.5
1.0
1.5D
iffer
ence
: Pos
t R20
-Pre
R20
2.0 2.5 3.0 3.5 4.0 4.5 5.0 5.5 6.0Mean: (Post R20+Pre R20)/2
Post R20 3.5795 t-Ratio -0.13075Pre R20 3.595 DF 19Mean Difference -0.0155 Prob > |t| 0.8973Std Error 0.11855 Prob > t 0.5513Upper95% 0.23262 Prob < t 0.4487Lower95% -0.2636 N 20 Correlation 0.83723 Wilcoxon Sign-Rank Post R20-Pre R20Test Statistic -27.000Prob > |z| 0.330Prob > z 0.835Prob < z 0.165

73
Appendix J: (Continued)
Matched Pairs Difference: Post FEV1-Pre FEV1
-1.0
-0.5
0.0
0.5
1.0D
iffer
ence
: Pos
t FE
V1-
Pre
FE
V1
2.0 2.5 3.0 3.5 4.0 4.5 5.0 5.5Mean: (Post FEV1+Pre FEV1)/2
Post FEV1 3.4545 t-Ratio 0.654114Pre FEV1 3.425 DF 19Mean Difference 0.0295 Prob > |t| 0.5209Std Error 0.0451 Prob > t 0.2604Upper95% 0.12389 Prob < t 0.7396Lower95% -0.0649 N 20 Correlation 0.97102 Wilcoxon Sign-Rank Post FEV1-Pre FEV1Test Statistic 7.000Prob > |z| 0.775Prob > z 0.387Prob < z 0.613