cafr fiscal year 2011 - basic financial statements liabilities 658,472 234,262 892,734 3,895...
TRANSCRIPT

S t a t e o f W a s h i n g t o n
Basic Financial Statements
35
Basic Financial Statements
Government-wide Financial Statements

S t a t e o f W a s h i n g t o n
Basic Financial Statements
36
This page intentionally left blank.

S t a t e o f W a s h i n g t o n
Basic Financial Statements
37
Governmental Business-Type Component
Activities Activities Total Units
ASSETS
Cash and pooled investments $ 4,192,162 $ 6,062,493 $ 10,254,655 $ 78,720
Taxes receivable (net of allowance) 3,043,494 10,514 3,054,008 -
Other receivables (net of allowance) 1,222,946 1,492,462 2,715,408 2,062
Internal balances (net) 159,895 (159,895) - -
Due from other governments 3,841,826 183,094 4,024,920 -
Inventories 89,938 98,122 188,060 -
Investments, noncurrent 4,277,739 14,910,710 19,188,449 16,138
Other assets 97,741 366,838 464,579 87,560
Restricted assets:
Cash and pooled investments 243,934 284,630 528,564 -
Receivables 40,446 40,446 -
Capital assets (Note 6):
Non-depreciable assets 23,392,880 358,129 23,751,009 34,677
Depreciable assets, net of depreciation 9,567,210 1,589,116 11,156,326 322,866
Total capital assets, net of depreciation 32,960,090 1,947,245 34,907,335 357,543
Total Assets $ 50,170,211 $ 25,196,213 $ 75,366,424 $ 542,023
LIABILITIES
Accounts payable $ 1,559,577 $ 113,036 $ 1,672,613 $ 54,936
Contracts and retainage payable 198,422 17,177 215,599 3,141
Accrued liabilities 658,472 234,262 892,734 3,895
Obligations under security lending agreements 223,779 2,579,797 2,803,576 -
Due to other governments 960,692 122,868 1,083,560 -
Unearned revenue 299,337 41,733 341,070 5,189
Long-term liabilities (Note 7):
Due within one year 1,311,879 2,163,282 3,475,161 -
Due in more than one year 20,228,250 25,669,118 45,897,368 20,750
Total Liabilities 25,440,408 30,941,273 56,381,681 87,911
NET ASSETS
Invested in capital assets, net of related debt 18,723,038 717,778 19,440,816 331,840
Restricted for:
Unemployment compensation - 3,199,137 3,199,137 -
Higher education 1,020,304 - 1,020,304 -
Expendable endowment funds 1,553,252 - 1,553,252 -
Nonexpendable permanent endowments 1,700,603 - 1,700,603 -
Transportation 315,447 - 315,447 -
Loan programs 242,751 242,751 -
Other purposes 14,067 - 14,067 20,108
Unrestricted (deficit) 1,160,341 (9,661,975) (8,501,634) 102,164 Total Net Assets (Deficit) $ 24,729,803 $ (5,745,060) $ 18,984,743 $ 454,112
The notes to the financial statements are an integral part of this statement.
Primary Government
Statement of Net Assets June 30, 2011
(expressed in thousands)

S t a t e o f W a s h i n g t o n
Basic Financial Statements
38
Charges for Operating Grants Capital Grants Functions/Programs Expenses Services and Contributions and Contributions
PRIMARY GOVERNMENT
Governmental Activities:
General government $ 1,674,061 $ 645,269 $ 403,541 $ 344
Education - elementary and secondary (K-12) 8,054,781 16,493 1,386,388 -
Education - higher education 6,257,439 2,379,335 2,349,362 48,596
Human services 13,363,482 461,623 8,216,895 1,710
Adult corrections 935,264 7,270 2,264 -
Natural resources and recreation 996,349 478,059 171,079 51,270
Transportation 1,980,584 914,343 79,372 730,939
Interest on long-term debt 881,961 - - -
Total Governmental Activities 34,143,921 4,902,392 12,608,901 832,859
Business-Type Activities:
Workers' compensation 1,219,310 2,018,981 9,165 -
Unemployment compensation 3,690,343 1,573,368 2,288,291 -
Higher education student services 1,819,520 1,614,592 7,367 13,227
Liquor control 556,212 595,690 41 -
Washington's lottery 393,227 510,619 - -
Other 784,306 152,061 - -
Total Business-Type Activities 8,462,918 6,465,311 2,304,864 13,227 Total Primary Government $ 42,606,839 $ 11,367,703 $ 14,913,765 $ 846,086
COMPONENT UNITS $ 130,380 $ 16,739 $ 105,081 $ 1,023Total Component Units $ 130,380 $ 16,739 $ 105,081 $ 1,023
General Revenues:
Taxes, net of related credits:
Sales and use
Business and occupation
Property
Motor vehicle and fuel
Excise
Cigarette and tobacco
Public utilities
Insurance premium
Other
Interest and investment earnings
Total general revenues
Excess (deficiency) of revenues over expenses before
contributions to endowments, transfers and special item
Contributions to endowments
Transfers
Special item - Transfer of Convention and Trade
Center to another government
Change in Net Assets
Net Assets (Deficit) - Beginning, as restatedNet Assets (Deficit) - Ending
The notes to the financial statements are an integral part of this statement.
Program Revenues
Statement of ActivitiesFor the Fiscal Year Ended June 30, 2011
(expressed in thousands)

S t a t e o f W a s h i n g t o n
Basic Financial Statements
39
Changes in Net AssetsPrimary Government
Governmental Business-Type ComponentActivities Activities Total Units
$ (624,907) $ - $ (624,907)
(6,651,900) - (6,651,900)
(1,480,146) - (1,480,146)
(4,683,254) - (4,683,254)
(925,730) - (925,730)
(295,941) - (295,941)
(255,930) - (255,930)
(881,961) - (881,961)
(15,799,769) - (15,799,769)
- 808,836 808,836
- 171,316 171,316
- (184,334) (184,334)
- 39,519 39,519
- 117,392 117,392
- (632,245) (632,245)
- 320,484 320,484 (15,799,769) 320,484 (15,479,285)
$ (7,537)(7,537)
7,349,216 - 7,349,216 -
3,076,917 - 3,076,917 -
1,857,837 - 1,857,837 -
1,205,859 - 1,205,859 -
442,015 35,310 477,325 -
493,755 - 493,755 -
445,985 - 445,985 -
413,097 - 413,097 -
880,236 139,029 1,019,265 -
474,223 1,611,271 2,085,494 1,552
16,639,140 1,785,610 18,424,750 1,552
839,371 2,106,094 2,945,465 (5,985)
69,436 - 69,436 -
230,732 (230,732) - -
- (222,794) (222,794) -
1,139,539 1,652,568 2,792,107 (5,985)
23,590,264 (7,397,628) 16,192,636 460,097 $ 24,729,803 $ (5,745,060) $ 18,984,743 $ 454,112
Net (Expense) Revenue and

S t a t e o f W a s h i n g t o n
Basic Financial Statements
40
This page intentionally left blank.

S t a t e o f W a s h i n g t o n
Basic Financial Statements
41
Basic Financial Statements
Fund Financial Statements

S t a t e o f W a s h i n g t o n
Basic Financial Statements
42
NonmajorHigher Education Higher Education Governmental
General Special Revenue Endowment Funds Total
ASSETSCash and pooled investments $ 30,417 $ 370,496 $ 316,809 $ 2,572,010 $ 3,289,732Investments - 1,150,922 3,043,187 240,061 4,434,170 Taxes receivable (net of allowance) 2,909,152 21,795 - 112,547 3,043,494 Other receivables (net of allowance) 159,463 384,430 27,075 713,649 1,284,617 Due from other funds 175,013 319,730 122 581,747 1,076,612 Due from other governments 1,160,118 155,035 42 2,282,541 3,597,736 Inventories and prepaids 13,981 14,066 - 47,323 75,370 Restricted assets:
Cash and pooled investments 28,302 - - 215,632 243,934 Receivables 3,212 27,796 - - 31,008
Total Assets $ 4,479,658 $ 2,444,270 $ 3,387,235 $ 6,765,510 $ 17,076,673
LIABILITIES AND FUND BALANCESLiabilities:Accounts payable $ 939,027 $ 70,206 $ 28,528 $ 414,956 $ 1,452,717Contracts and retainages payable 34,039 3,313 2,078 117,276 156,706 Accrued liabilities 160,621 249,340 9,926 59,561 479,448 Obligations under security lending agreements - - 176,616 47,163 223,779 Due to other funds 183,362 92,291 3,506 611,802 890,961 Due to other governments 565,615 18,367 - 166,579 750,561 Deferred revenue 1,369,593 190,551 8,304 985,757 2,554,205 Claims and judgments payable 9,200 - - 8,028 17,228 Total Liabilities 3,261,457 624,068 228,958 2,411,122 6,525,605
Fund Balances:Nonspendable fund balance 89,916 157,849 1,577,691 1,928,654 3,754,110 Restricted fund balance 23,273 744,826 1,580,586 1,465,165 3,813,850 Committed fund balance 98,077 917,527 - 1,134,996 2,150,600 Assigned fund balance 1,114,699 - - 45 1,114,744 Unassigned fund balance (107,764) - - (174,472) (282,236) Total Fund Balances 1,218,201 1,820,202 3,158,277 4,354,388 10,551,068 Total Liabilities and Fund Balances $ 4,479,658 $ 2,444,270 $ 3,387,235 $ 6,765,510 $ 17,076,673
The notes to the financial statements are an integral part of this statement.
(expressed in thousands)June 30, 2011
GOVERNMENTAL FUNDSBalance Sheet

S t a t e o f W a s h i n g t o n
Basic Financial Statements
43
Total Fund Balances for Governmental Funds $ 10,551,068
Amounts reported for governmental activities in the Statement of Net Assets aredifferent because:
Capital assets used in governmental activities are not financial resources andtherefore are not reported in the funds. These assets consist of:
Non-depreciable assets $ 23,355,789Depreciable assets 15,928,569 Less: Accumulated depreciation (6,781,461)
Total capital assets 32,502,897
Some of the state's revenues will be collected after year-end, but are not available soon enough to pay for the current period's expenditures, 2,256,097 and therefore are deferred in the funds.
Certain pension trust funds have been funded in excess of the annual requiredcontributions, creating a year-end asset. This asset is not a financial 10,700 resource and therefore is not reported in the funds.
Unmatured interest on general obligation bonds is not recognized in the funds (363,498) until due.
Internal service funds are used by management to charge the costs of certainactivities to individual funds. The assets and liabilities of the internal service (39,519) funds are included in governmental activities in the Statement of Net Assets.
Some liabilities are not due and payable in the current period andtherefore are not reported in the funds. Those liabilities consist of:
Bonds and other financing contracts payable $ (17,748,170)Accreted interest on bonds (393,181) Compensated absences (502,199) Other postemployment benefits obligations (921,841) Unfunded pension obligations (234,320) Claims and judgments (36,303) Pollution remediation obligations (168,219) Other obligations (183,709)
Total long-term liabilities (20,187,942)
Net Assets of Governmental Activities $ 24,729,803
The notes to the financial statements are an integral part of this statement.
(expressed in thousands)
Reconciliation of the Balance Sheetto the Statement of Net Assets
June 30, 2011GOVERNMENTAL FUNDS

S t a t e o f W a s h i n g t o n
Basic Financial Statements
44
NonmajorHigher Education Higher Education Governmental
General Special Revenue Endowment Funds Total
REVENUESRetail sales and use taxes $ 7,274,926 $ - $ - $ 74,290 $ 7,349,216Business and occupation taxes 3,072,245 - - 4,672 3,076,917 Property taxes 1,857,837 - - - 1,857,837 Excise taxes 414,362 - - 32,707 447,069 Motor vehicle and fuel taxes - - - 1,205,859 1,205,859 Other taxes 1,804,138 117,373 - 225,088 2,146,599 Licenses, permits, and fees 88,464 629 - 982,663 1,071,756 Timber sales 4,037 - 22,224 179,863 206,124 Other contracts and grants 199,408 797,112 - 40,428 1,036,948 Federal grants-in-aid 9,597,099 1,757,935 271 1,243,400 12,598,705 Charges for services 59,882 2,010,187 145 620,259 2,690,473 Investment income (loss) (15,055) 45,857 368,404 75,017 474,223 Miscellaneous revenue 229,905 83,389 1,841 341,321 656,456 Unclaimed property 62,987 - - - 62,987 Contributions and donations - - 69,436 - 69,436
Total Revenues 24,650,235 4,812,482 462,321 5,025,567 34,950,605
EXPENDITURESCurrent:
General government 923,216 - 131 451,864 1,375,211 Human services 13,472,743 363 - 660,529 14,133,635 Natural resources and recreation 387,553 - - 578,370 965,923 Transportation 41,234 - - 1,767,266 1,808,500 Education 9,211,186 4,461,526 3,710 409,136 14,085,558
Intergovernmental 102,335 - - 290,221 392,556 Capital outlays 48,504 218,129 2,441 2,134,383 2,403,457 Debt service:
Principal 16,104 29,018 - 651,991 697,113 Interest 502 13,171 - 816,032 829,705
Total Expenditures 24,203,377 4,722,207 6,282 7,759,792 36,691,658
Excess of RevenuesOver (Under) Expenditures 446,858 90,275 456,039 (2,734,225) (1,741,053)
OTHER FINANCING SOURCES (USES)Bonds issued 336,009 26,359 - 581,826 944,194 Refunding bonds issued - - - 1,160,990 1,160,990 Payments to escrow agents for refunded bond debt - - - (1,339,372) (1,339,372) Bond issue premiums 3,678 657 - 219,195 223,530 Other debt issued 14,700 21,523 - 118,601 154,824 Refunding COPs issued - - - 9,310 9,310 Payments to escrow agents for refunded COP debt - - - (11,054) (11,054) Transfers in 938,822 140,148 2,876 2,778,501 3,860,347 Transfers out (1,154,483) (171,790) (94,954) (2,214,952) (3,636,179) Total Other Financing Sources (Uses) 138,726 16,897 (92,078) 1,303,045 1,366,590 Net Change in Fund Balances 585,584 107,172 363,961 (1,431,180) (374,463)
Fund Balances - Beginning, as restated 632,617 1,713,030 2,794,316 5,785,568 10,925,531
Fund Balances - Ending $ 1,218,201 $ 1,820,202 $ 3,158,277 $ 4,354,388 $ 10,551,068
The notes to the financial statements are an integral part of this statement.
(expressed in thousands)For the Fiscal Year Ended June 30, 2011
GOVERNMENTAL FUNDSStatement of Revenues, Expenditures, and Changes in Fund Balances

S t a t e o f W a s h i n g t o n
Basic Financial Statements
45
Net Change in Fund Balances - Total Governmental Funds $ (374,463)
Amounts reported for governmental activities in the Statement of Activitiesare different because:
Capital outlays are reported as expenditures in governmental funds.However, in the Statement of Activities, the cost of capital assets isallocated over their estimated useful lives as depreciation expense.In the current period, these amounts are:
Capital outlays $ 2,240,190Less: Depreciation expense (539,915) 1,700,275
Some revenues in the Statement of Activities do not provide currentfinancial resources, and therefore, are deferred in governmental funds.Also, revenues related to prior periods that became available during thecurrent period are reported in governmental funds but are eliminated inthe Statement of Activities. This amount is the net adjustment. 113,945
Pension trust funding in excess of annual required contributionsuses current financial resources, but does not qualify as an expense. (1,800)
Internal service funds are used by management to charge the costsof certain activities to individual funds. The change in net assets of the internal service funds is reported with governmental activities. 210,805
Bond proceeds and other financing contracts provide current financial resourcesto governmental funds, while the repayment of the related debt principalconsumes those financial resources. These transactions, however, have no effecton net assets. In the current period, these amounts consist of:
Bonds and other financing contracts issued $ (2,824,069)Principal payments on bonds and other financing contracts 2,629,497 Accreted interest on bonds (26,666) (221,238)
Some expenses/revenue reductions reported in the Statement of Activities do notrequire the use of current financial resources and, therefore, are not recognizedin governmental funds. Also payments of certain obligations related to prior periodsare recognized in governmental funds but are eliminated in the Statement of Activities.In the current period, the net adjustments consist of:
Compensated absences $ 10,356Other postemployment benefits obligations (224,628) Unfunded pension obligations (42,931) Pollution remediation obligations 6,134 Claims and judgments (2,640) Accrued interest (25,711) Unclaimed property (6,973) Other obligations (1,592) (287,985)
Change in Net Assets of Governmental Activities $ 1,139,539
The notes to the financial statements are an integral part of this statement.
(expressed in thousands)For the Fiscal Year Ended June 30, 2011
Reconciliation of the Statement of Revenues, Expenditures and Changes in Fund Balances to the Statement of Activities
GOVERNMENTAL FUNDS

S t a t e o f W a s h i n g t o n
Basic Financial Statements
46
Workers' Unemployment Higher Education Other Compensation Compensation Student Services Activities
ASSETSCurrent Assets:Cash and pooled investments $ 43,372 $ 2,554,055 $ 684,156 $ 96,345Investments 2,217,078 - 3,594 362,719 Taxes receivable (net of allowance) - - - - Other receivables (net of allowance) 673,619 605,698 182,819 4,405 Due from other funds 55 6,771 320,306 791 Due from other governments 1,127 91,850 41,957 3,428 Inventories 94 - 41,976 84 Prepaid expenses - - 19,087 12 Restricted assets:
Cash and pooled investments - - 284,630 - Receivables - - - -
Total Current Assets 2,935,345 3,258,374 1,578,525 467,784
Noncurrent Assets:Investments, noncurrent 12,512,691 - 278,183 1,897,675 Other noncurrent assets - - 84,577 262,346 Capital assets:
Land and other non-depreciable assets 3,240 - 60,344 - Buildings 65,134 - 1,933,708 - Other improvements 1,662 - 79,107 110 Furnishings and equipment 68,809 - 410,284 9,351 Infrastructure - - 41,273 - Intangible assets 4,338 - 19,358 - Accumulated depreciation (87,042) - (997,418) (7,417) Construction in progress 13,041 - 279,789 -
Total Noncurrent Assets 12,581,873 - 2,189,205 2,162,065 Total Assets 15,517,218 3,258,374 3,767,730 2,629,849
LIABILITIESCurrent Liabilities:Accounts payable 8,820 - 68,686 1,940 Contracts and retainages payable 6,959 - 10,223 129,500 Accrued liabilities 135,119 8,591 205,459 8,866 Obligations under security lending agreements 2,217,078 - - 362,719 Bonds and notes payable 3,206 - 59,212 - Due to other funds 6,114 1,182 480,735 565 Due to other governments 14 49,464 160 4,392 Unearned revenue 7,676 - 34,045 - Claims and judgments payable 1,741,968 - - 2,038 Total Current Liabilities 4,126,954 59,237 858,520 510,020
Noncurrent Liabilities:Claims and judgments payable 21,201,343 - - 9,977 Bonds and notes payable 14,876 - 1,421,341 - Other long-term liabilities 34,556 - 154,165 2,606,489 Total Noncurrent Liabilities 21,250,775 - 1,575,506 2,616,466 Total Liabilities 25,377,729 59,237 2,434,026 3,126,486
NET ASSETSInvested in capital assets, net of related debt 51,100 - 630,521 2,043 Restricted for:
Unemployment compensation - 3,199,137 - - Unrestricted (9,911,611) - 703,183 (498,680) Total Net Assets (Deficit) $ (9,860,511) $ 3,199,137 $ 1,333,704 $ (496,637)
The notes to the financial statements are an integral part of this statement.
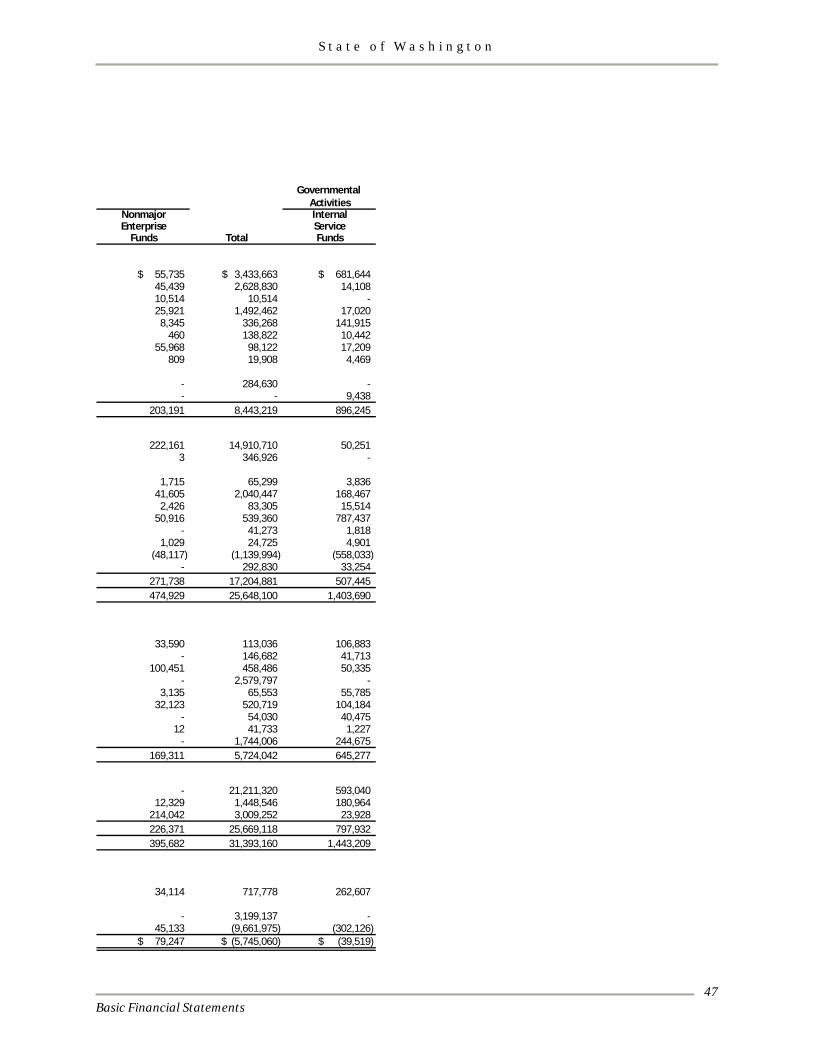
Business-Type ActivitiesEnterprise Funds
Statement of Fund Net AssetsPROPRIETARY FUNDS
June 30, 2011(expressed in thousands)
S t a t e o f W a s h i n g t o n
Basic Financial Statements
47
Governmental Activities
Nonmajor InternalEnterprise Service
Funds Total Funds
$ 55,735 $ 3,433,663 $ 681,64445,439 2,628,830 14,108 10,514 10,514 - 25,921 1,492,462 17,020
8,345 336,268 141,915 460 138,822 10,442
55,968 98,122 17,209 809 19,908 4,469
- 284,630 - - - 9,438
203,191 8,443,219 896,245
222,161 14,910,710 50,251 3 346,926 -
1,715 65,299 3,836 41,605 2,040,447 168,467
2,426 83,305 15,514 50,916 539,360 787,437
- 41,273 1,818 1,029 24,725 4,901
(48,117) (1,139,994) (558,033) - 292,830 33,254
271,738 17,204,881 507,445 474,929 25,648,100 1,403,690
33,590 113,036 106,883 - 146,682 41,713
100,451 458,486 50,335 - 2,579,797 -
3,135 65,553 55,785 32,123 520,719 104,184
- 54,030 40,475 12 41,733 1,227
- 1,744,006 244,675 169,311 5,724,042 645,277
- 21,211,320 593,040 12,329 1,448,546 180,964
214,042 3,009,252 23,928 226,371 25,669,118 797,932 395,682 31,393,160 1,443,209
34,114 717,778 262,607
- 3,199,137 - 45,133 (9,661,975) (302,126)
$ 79,247 $ (5,745,060) $ (39,519)

S t a t e o f W a s h i n g t o n
Basic Financial Statements
48
Workers' Unemployment Higher Education OtherCompensation Compensation Student Services Activities
OPERATING REVENUESSales $ - $ - $ 123,257 $ 153
Less: Cost of goods sold - - 87,957 83 Gross profit - - 35,300 70
Charges for services - - 1,275,485 74,997 Premiums and assessments 1,983,348 1,545,016 - - Federal aid for unemployment
insurance benefits - 2,288,291 - - Lottery ticket proceeds - - - - Miscellaneous revenue 35,634 28,352 211,123 3,217 Total Operating Revenues 2,018,982 3,861,659 1,521,908 78,284
OPERATING EXPENSESSalaries and wages 135,979 - 635,834 23,628 Employee benefits 51,397 - 174,338 8,099 Personal services 6,366 - 16,119 3,278 Goods and services 72,443 - 713,179 20,232 Travel 3,401 - 20,225 622 Premiums and claims 888,160 3,690,343 - - Lottery prize payments - - - - Depreciation and amortization 8,037 - 94,293 1,552 Guaranteed education tuition expense - - - 639,365 Miscellaneous expenses 52,463 - 15,541 1,100 Total Operating Expenses 1,218,246 3,690,343 1,669,529 697,876 Operating Income (Loss) 800,736 171,316 (147,621) (619,592)
NONOPERATING REVENUES (EXPENSES)Earnings (loss) on investments 997,577 97,979 225,438 283,923 Interest expense (1,064) - (62,034) (13) Distributions to other governments - - - - Tax and license revenue 130 - - 21,557 Other revenues (expenses) 9,164 - 12,094 29 Total Nonoperating Revenues (Expenses) 1,005,807 97,979 175,498 305,496 Income (Loss) Before Contributions, Transfers and Special Item 1,806,543 269,295 27,877 (314,096)
Capital contributions - - 13,227 - Transfers in - - 128,476 - Transfers out - - (58,525) (3,250) Net Contributions and Transfers - - 83,178 (3,250)
SPECIAL ITEM Transfer of Convention and Trade Center to another government (Note 2) - - - - Change in Net Assets 1,806,543 269,295 111,055 (317,346)
Net Assets (Deficit) - Beginning, as restated (11,667,054) 2,929,842 1,222,649 (179,291) Net Assets (Deficit) - Ending $ (9,860,511) $ 3,199,137 $ 1,333,704 $ (496,637)
The notes to the financial statements are an integral part of this statement.
Business-Type ActivitiesEnterprise Funds
Statement of Revenues, Expenses, and Changes in Fund Net AssetsPROPRIETARY FUNDS
For the Fiscal Year Ended June 30, 2011(expressed in thousands)

S t a t e o f W a s h i n g t o n
Basic Financial Statements
49
GovernmentalActivities
Nonmajor InternalEnterprise Service
Funds Total Funds
$ 660,197 $ 783,607 $ 99,781429,167 517,207 91,918 231,030 266,400 7,863
8,385 1,358,867 590,630 - 3,528,364 1,449,731
- 2,288,291 - 510,457 510,457 -
1,700 280,026 121,292 751,572 8,232,405 2,169,516
71,105 866,546 271,021 34,365 268,199 83,035 15,516 41,279 15,647
114,447 920,301 246,399 1,592 25,840 3,307
- 4,578,503 1,267,281 295,155 295,155 -
8,529 112,411 70,751 - 639,365 -
226 69,330 2,157 540,935 7,816,929 1,959,598 210,637 415,476 209,918
6,354 1,611,271 4,826 (18,545) (81,656) (8,961) (47,128) (47,128) - 152,652 174,339 23
(724) 20,563 (3,293) 92,609 1,677,389 (7,405)
303,246 2,092,865 202,513
- 13,227 1,771 29,890 158,366 23,920
(327,321) (389,096) (17,397) (297,431) (217,503) 8,294
(222,794) (222,794) - (216,979) 1,652,568 210,807
296,226 (7,397,628) (250,326) $ 79,247 $ (5,745,060) $ (39,519)

S t a t e o f W a s h i n g t o n
Basic Financial Statements
50
Workers' Unemployment Higher EducationCompensation Compensation Student Services
CASH FLOWS FROM OPERATING ACTIVITIESReceipts from customers $ 1,824,052 $ 1,464,198 $ 1,115,737Payments to suppliers (2,038,603) (3,654,975) (539,004) Payments to employees (181,791) - (778,198) Other receipts (payments) 35,634 2,325,435 211,121
Net Cash Provided (Used) by Operating Activities (360,708) 134,658 9,656
CASH FLOWS FROM NONCAPITAL FINANCING ACTIVITIESTransfers in - - 128,476 Transfers out - - (58,525) Operating grants and donations received 9,250 - 9,701 Taxes and license fees collected 130 - - Distributions to other governments - - -
Net Cash Provided (Used) by Noncapital Financing Activities 9,380 - 79,652
CASH FLOWS FROM CAPITAL AND RELATED FINANCING ACTIVITIESInterest paid (1,143) - (58,557) Principal payments on long-term capital financing (4,030) - (32,800) Proceeds from long-term capital financing - - 400,371 Proceeds from sale of capital assets 95 - 25,997 Acquisitions of capital assets (13,954) - (206,773)
Net Cash Provided (Used) by Capital and Related Financing Activities (19,032) - 128,238
CASH FLOWS FROM INVESTING ACTIVITIESReceipt of interest 569,678 97,979 212,976 Proceeds from sale of investment securities 4,419,372 - 14,212 Purchases of investment securities (4,622,325) - (55,980)
Net Cash Provided (Used) by Investing Activities 366,725 97,979 171,208 Net Increase (Decrease) in Cash and Pooled Investments (3,635) 232,637 388,754
Cash and Pooled Investments, July 1, as restated 47,007 2,321,418 580,031 Cash and Pooled Investments, June 30 $ 43,372 $ 2,554,055 $ 968,785
CASH FLOWS FROM OPERATING ACTIVITIESOperating Income (Loss) $ 800,736 $ 171,316 $ (147,621)
Adjustments to Reconcile Operating Income(Loss) to Net Cash Provided by Operations:
Depreciation 8,037 - 94,293 Change in Assets: Decrease (Increase)
Receivables (net of allowance) (108,684) (72,027) (282,503) Inventories 25 - 126 Prepaid expenses - - 311
Change in Liabilities: Increase (Decrease)Payables (1,060,822) 35,369 345,050
Net Cash or Cash Equivalents Provided by (Used in) Operating Activities $ (360,708) $ 134,658 $ 9,656
The notes to the financial statements are an integral part of this statement.
(expressed in thousands)
Business-Type ActivitiesEnterprise Funds
Statement of Cash FlowsPROPRIETARY FUNDS
For the Fiscal Year Ended June 30, 2011

S t a t e o f W a s h i n g t o n
Basic Financial Statements
51
Continued
GovernmentalActivities
Nonmajor InternalOther Enterprise Service
Activities Funds Total Funds
$ 914,488 $ 1,171,064 $ 6,489,539 $ 2,171,437(665,784) (894,428) (7,792,794) (1,663,935)
(30,789) (102,034) (1,092,812) (351,477) 3,191 1,674 2,577,055 92,487
221,106 176,276 180,988 248,512
- 29,890 158,366 23,920 (3,250) (327,321) (389,096) (17,397)
- 25 18,976 532 21,557 151,926 173,613 23
- (100,550) (100,550) - 18,307 (246,030) (138,691) 7,078
(13) (3,563) (63,276) (8,961) (297) (273,991) (311,118) (25,590)
- - 400,371 32,032 - 271,841 297,933 6,965
(283) (4,848) (225,858) (92,011) (593) (10,561) 98,052 (87,565)
31,323 88 912,044 5,212 405,929 101,070 4,940,583 69,550
(679,888) (50,535) (5,408,728) (59,867) (242,636) 50,623 443,899 14,895
(3,816) (29,692) 584,248 182,920 100,161 85,427 3,134,044 498,724
$ 96,345 $ 55,735 $ 3,718,292 $ 681,644
$ (619,592) $ 210,637 $ 415,476 $ 209,918
1,552 8,529 112,411 70,751
(37,958) (7,796) (508,968) 18,541 (11) (131) 9 755
3 65 379 631
877,112 (35,028) 161,681 (52,084) $ 221,106 $ 176,276 $ 180,988 $ 248,512

S t a t e o f W a s h i n g t o n
Basic Financial Statements
52
Workers' Unemployment Higher Education
Compensation Compensation Student Services
NONCASH INVESTING, CAPITAL AND FINANCING ACTIVITIES
Contributions of capital assets $ - $ - $ 13,227
Acquisition of capital assets through capital leases - - 2,714
Amortization of annuity prize liability - - -
Increase (decrease) in fair value of investments 421,195 - 281
Refunding bonds issued - - 10,400
Refunding bonds redeemed - - 10,890
Amortization of debt premium (issue costs/discount) - - 448
Increase in ownership of joint venture - - 12,169
The notes to the financial statements are an integral part of this statement.
(expressed in thousands)
Business-Type Activities
Enterprise Funds
Statement of Cash FlowsPROPRIETARY FUNDS
For the Fiscal Year Ended June 30, 2011

S t a t e o f W a s h i n g t o n
Basic Financial Statements
53
Concluded
Governmental
Activities
Nonmajor Internal
Other Enterprise Service
Avtivities Funds Total Funds
$ - $ - $ 13,227 $ 1,771
- - 2,714 586
- 14,982 14,982 -
253,048 6,266 427,742 (338)
- - 10,400 -
- - 10,890 -
- - 448 -
- - 12,169 -

S t a t e o f W a s h i n g t o n
Basic Financial Statements
54
Local Private- Government Pension and Purpose Investment Other Employee
Trust Pool Benefit Plans Agency Funds
ASSETSCurrent Assets:Cash and pooled investments $ 9,234 $ 2,509,133 $ 385,135 $ 294,185Investments - 5,646,806 - - Receivables, pension and other employee benefit plans:
Employers - - 117,834 - Members (net of allowance) - - 2,684 - Interest and dividends - - 184,280 - Investment trades pending - - 3,133,472 - Due from other pension and other employee benefit funds - - 968 -
Other receivables, all other funds - 1,988 - 7,570 Due from other funds - - 1,454 479 Due from other governments - - - 19,184 Total Current Assets 9,234 8,157,927 3,825,827 321,418
Noncurrent Assets:Investments, noncurrent, pension and other employee benefit plans:
Public equity - - 29,858,894 - Fixed income - - 11,765,036 - Private equity - - 15,613,270 - Real estate - - 8,598,192 - Security lending - - 2,718,939 - Liquidity - - 1,949,411 - Tangible assets - - 718,740 -
Investments, noncurrent, all other funds 24,174 708,861 - 28,343 Other noncurrent assets - - - 40,842 Capital assets:
Furnishings and equipment 32 - - - Accumulated depreciation (19) - - -
Total Noncurrent Assets 24,187 708,861 71,222,482 69,185 Total Assets 33,421 8,866,788 75,048,309 $ 390,603
LIABILITIESAccounts payable 328 - - $ 5,444Contracts and retainages payable - - - 60,345 Accrued liabilities 148 108 3,857,768 6,910 Obligations under security lending agreements - - 2,718,938 - Due to other funds - - 2,527 38,337 Due to other pension and other employee benefit funds - - 968 - Due to other governments - 3,552 - 238,724 Unearned revenue - - 893 - Other long-term liabilities - - - 40,843 Total Liabilities 476 3,660 6,581,094 $ 390,603
NET ASSETSNet assets held in trust for: Pension benefits - - 65,528,135 Deferred compensation participants - - 2,939,080 Local government pool participants - 8,863,128 - Individuals, organizations & other governments 32,945 - - Total Net Assets $ 32,945 $ 8,863,128 $ 68,467,215
The notes to the financial statements are an integral part of this statement.
(expressed in thousands)
Statement of Fiduciary Net Assets
June 30, 2011FIDUCIARY FUNDS

S t a t e o f W a s h i n g t o n
Basic Financial Statements
55
LocalPrivate- Government Pension and Purpose Investment Other Employee
Trust Pool Benefit PlansADDITIONSContributions:
Employers $ - $ - $ 902,855Members - - 959,141 State - - 68,699 Participants - 16,566,893 186,734
Total Contributions - 16,566,893 2,117,429
Investment Income:Net appreciation (depreciation) in fair value - - 10,557,243 Interest and dividends - 22,019 1,614,756
Less: Investment expenses - - (216,935) Net Investment Income (Loss) - 22,019 11,955,064
Other Additions:Unclaimed property 42,191 - - Transfers from other pension plans - - 11,441 Other contracts, grants and miscellaneous 31 - 1,462
Total Other Additions 42,222 - 12,903 Total Additions 42,222 16,588,912 14,085,396
DEDUCTIONSPension benefits - - 2,937,334 Pension refunds - - 282,064 Transfers to other pension plans - - 11,441 Administrative expenses 3,353 724 2,649 Distributions to participants - 16,054,499 149,010 Payments to or on behalf of individuals,
organizations and other governments inaccordance with state unclaimed property laws 31,827 - -
Total Deductions 35,180 16,055,223 3,382,498
Net Increase (Decrease) 7,042 533,689 10,702,898
Net Assets - Beginning 25,903 8,329,439 57,764,317 Net Assets - Ending $ 32,945 $ 8,863,128 $ 68,467,215
The notes to the financial statements are an integral part of this statement.
Statement of Changes in Fiduciary Net Assets
(expressed in thousands)For the Fiscal Year Ended June 30, 2011
FIDUCIARY FUNDS

S t a t e o f W a s h i n g t o n
Basic Financial Statements
56
Public NonmajorStadium Component Units Total
ASSETSCurrent Assets:Cash and pooled investments $ 7,235 $ 25,746 $ 32,981Investments - 42,038 42,038 Investments - restricted 3,701 - 3,701 Other receivables (net of allowance) 834 1,228 2,062 Prepaid expenses 21 109 130 Total Current Assets 11,791 69,121 80,912
Noncurrent Assets:Investments, noncurrent - restricted 16,138 - 16,138 Other noncurrent assets - 87,430 87,430 Capital assets: Land 34,677 - 34,677 Buildings 460,610 - 460,610 Furnishings, equipment and intangible assets 20,979 1,596 22,575 Accumulated depreciation (158,943) (1,376) (160,319) Total Noncurrent Assets 373,461 87,650 461,111 Total Assets 385,252 156,771 542,023
LIABILITIESCurrent Liabilities:Accounts payable 98 54,838 54,936 Contracts and retainages payable 3,141 - 3,141 Accrued liabilities 3,855 40 3,895 Unearned revenue - 5,189 5,189 Total Current Liabilities 7,094 60,067 67,161
Noncurrent Liabilities:Other long-term liabilities 20,750 - 20,750 Total Noncurrent Liabilities 20,750 - 20,750 Total Liabilities 27,844 60,067 87,911
NET ASSETSInvested in capital assets, net of related debt 331,620 220 331,840 Restricted for deferred sales tax 19,029 - 19,029 Restricted for other purposes - 1,079 1,079 Unrestricted 6,759 95,405 102,164 Total Net Assets (Deficit) $ 357,408 $ 96,704 $ 454,112
The notes to the financial statements are an integral part of this statement.
(expressed in thousands)
Statement of Fund Net AssetsCOMPONENT UNITS
June 30, 2011

S t a t e o f W a s h i n g t o n
Basic Financial Statements
57
Public NonmajorStadium Component Units Total
OPERATING REVENUESCharges for services $ 1,051 $ 15,688 $ 16,739Total Operating Revenues 1,051 15,688 16,739
OPERATING EXPENSESSalaries and wages 398 4,567 4,965 Employee benefits 103 1,268 1,371 Personal services 304 1,612 1,916 Goods and services 783 2,198 2,981 Travel 3 21 24 Depreciation and amortization 15,469 150 15,619 Miscellaneous expenses - 979 979 Total Operating Expenses 17,060 10,795 27,855 Operating Income (Loss) (16,009) 4,893 (11,116)
NONOPERATING REVENUES (EXPENSES)Earnings (loss) on investments 704 848 1,552 Operating grants and contributions - 103,065 103,065 Distributions of operating grants - (102,140) (102,140) Naming rights 2,016 - 2,016 Other (385) - (385) Total Nonoperating Revenues (Expenses) 2,335 1,773 4,108
Income (Loss) (13,674) 6,666 (7,008)
Capital grants and contributions 1,023 - 1,023 Total Contributions and Transfers 1,023 - 1,023
Change in Net Assets (12,651) 6,666 (5,985)
Net Assets - Beginning 370,059 90,038 460,097 Net Assets - Ending $ 357,408 $ 96,704 $ 454,112
The notes to the financial statements are an integral part of this statement.
(expressed in thousands)
Statement of Revenues, Expenses, and Changes in Fund Net Assets
For the Fiscal Year Ended June 30, 2011COMPONENT UNITS

S t a t e o f W a s h i n g t o n
Basic Financial Statements
58
This page intentionally left blank.