cafr word file - fy19
TRANSCRIPT

CIT
Y OF B
ILLINGS, MONTANA
CIT
Y OF B
ILLINGS, MONTANA
2019FISCALYEAR
ComprehensiveANNUAL FINANCIAL REPORT

ABOUT THE COVER The Billings City/County 9-1-1 Center (9-1-1) provides the critical link between the community and public safety resources. Thirty one and a half full-time employees and four 9-1-1 supervisors receive, coordinate, and process emergency and non-emergency radio and telephone traffic 24 hours a day. Additionally, the 9-1-1 Center Manager oversees the citywide 800 MHz radio system.
In 1998, the Billings City/County 9-1-1 committed $25,000 to a reserve fund dedicated to constructing a new 9-1-1 facility for the community. Within three years, 9-1-1 elected to contribute 25% of all in-coming annual revenues to the reserve fund as well. The significance of this project and its on-going impact to public safety cannot to be overstated, especially considering it was accomplished without imposing additional fees or levies.
Coming in slightly under its $5.5 million budget, the new 9,100 square foot facility nearly triples the space previously dedicated to 9-1-1 operations. It embraces modern enhancements that include environmentally controlled data and UPS rooms, redundant emergency generators, a dedicated training area, dormitory rooms, a conference area, secured parking, and separate restroom facilities for male and female employees. Twelve state-of-the-art workstations allow for expanded operational capability and agency support in the event of a critical event or disaster, ensuring that the 9-1-1 center is well equipped to meet increased demand for services associated with future community and population growth.
The new 9-1-1 facility has garnered national attention. Other communities, faced with the same daunting challenge of constructing a highly specialized type of facility, have sent delegations of police chiefs, fire chiefs, sheriffs, and 9-1-1 personnel to visit the Billings’ center and witness its exceptional functionality, as well as to seek advice on managing the complexity of such a project. Additionally, the Billings City/County 9-1-1 Center was named the 2018 Montana Contractor’s Association Commercial Project of the Year in Building Excellence.
On every level, the new 9-1-1 center project was a success, and it reflects the power of effective collaboration between City Departments and private partnerships. Many thanks are due to the City of Billings Information Technology staff, Will Robbins of the City Engineering Division, CTA Architects, Fisher Construction and their many subcontractors, and the technical engineers and staff from Motorola and Industrial Communications & Electronics.

Further, the 9-1-1 Center is exceedingly proud of its EMD program. 9-1-1 staff members have delivered babies, resuscitated drowning and cardiac victims, stemmed uncontrolled bleeding, and have positively impacted the outcome for countless individuals and their families in the community. The 9-1-1 staff are professionals who have great interest in delivering top-notch service. They appreciate how supervisory staff is making a consistent effort to not only identify areas requiring improvement, but also seeing and recognizing the outstanding work they are performing on a daily basis.
Through 20 years of sacrifice and savings, 9-1-1 telephone and radio operations moved into the beautiful, new facilty on September 18, 2018.
Special thanks go out to Anne Kindness, Community Center Manager. In addition to her normal duties, Anne spent countless hours working on this project to see the new 9-1-1 Center project come to fruition. Anne will retire this year after 34 years of service to the City of Billings. Job well done!

CITY OF BILLINGS, MONTANA
COMPREHENSIVE ANNUAL FINANCIAL REPORT
FINANCE DEPARTMENT
ANDREW ZOELLER, CPA FINANCE DIRECTOR
FISCAL YEAR 2019
July 1, 2018 – June 30, 2019

INTRODUCTORY SECTION

Page
INTRODUCTORY SECTION (UNAUDITED) Transmittal Letter .......................................................................................................................................................... i-vi Certificate of Achievement for Excellence in Financial Reporting ................................................................................. vii Organization Chart ........................................................................................................................................................ viii Official Roster .................................................................................................................................................................. ix FINANCIAL SECTION Independent Auditors’ Report ....................................................................................................................................... 1-2 Management’s Discussion and Analysis .................................................................................................................... 3-12 Basic Financial Statements: Government-wide Financial Statements: Statement of Net Position .............................................................................................................................. 13-14 Statement of Activities ........................................................................................................................................ 15 Fund Financial Statements: Governmental Funds – Balance Sheet ............................................................................................................... 16 Reconciliation of the Governmental Funds Balance Sheet to the Statement Net Position ................................................................................................................................................... 17 Governmental Funds – Statement of Revenues, Expenditures, and Changes in Fund Balances .............................................................................................................................................. 18 Reconciliation of the Statement of Revenues, Expenditures, and Changes in Fund Balances of Governmental Funds to the Statement of Activities ..................................................... 19-20 Proprietary Funds – Statement of Net Position.............................................................................................. 21-22 Proprietary Funds – Statement of Revenues, Expenses, and Changes in Net Position ......................................................................................................................................................... 23 Proprietary Funds – Statement of Cash Flows .............................................................................................. 24-25 Fiduciary Funds – Statement of Fiduciary Net Position ...................................................................................... 26 Notes to Basic Financial Statements ...................................................................................................................... 27-109 Required Supplemental Information ..................................................................................................................... 110-127 Supplemental Information: Major Funds Budget and Actual Schedules: General Fund – Schedule of Revenues, Expenditures, and Changes in Fund Balance – Budget and Actual ...................................................................................................................... 128

Major Special Revenue Fund – Public Safety Fund – Schedule of Revenues, Expenditures and Changes in Fund Balance – Budget to Actual ................................................................ 129 Nonmajor Governmental Funds: Combining and individual Fund Statements and Schedules: Nonmajor Governmental Funds – Combining Balance Sheet ..................................................................... 130 Nonmajor Governmental Funds – Combining Statement of Revenues, Expenditures, and Changes in Fund Balances ...................................................................................... 131 Nonmajor Special Revenue Funds: Combining Balance Sheet ......................................................................................................................... 132-135 Combining Statement of Revenues, Expenditures, and Changes in Fund Balances ................................ 136-139 Combining Schedule of Revenues, Expenditures, and Changes in Balances – Budget and Actual ................................................................................................................................ 140-154 Nonmajor Debt Service Funds: Combining Balance Sheet ................................................................................................................................ 155 Combining Statement of Revenues, Expenditures, and Changes in Fund Balances ....................................... 156 Combining Schedule of Revenues, Expenditures, and Changes in Balances – Budget and Actual ................................................................................................................................ 157-160 Nonmajor Capital Projects Funds: Combining Balance Sheet ................................................................................................................................ 161 Combining Statement of Revenues, Expenditures, and Changes in Fund Balances ....................................... 162 Combining Schedule of Revenues, Expenditures, and Changes in Balances – Budget and Actual ................................................................................................................................ 163-166 Nonmajor Permanent Fund: Balance Sheet .................................................................................................................................................. 167 Schedule of Revenues, Expenditures, and Changes in Fund Balance – Budget and Actual ........................... 168 Nonmajor Enterprise Funds: Combining Statement of Net Position .................................................................................................. 169-170 Combining Statement of Revenues, Expenses, and Changes in Net Position ........................................................................................................................................... 171 Combining Statement of Cash Flows ................................................................................................... 172-173 Internal Service Funds: Combining Statement of Net Position .................................................................................................. 174-177 Combining Statement of Revenues, Expenses, and Changes in Net Position .................................................................................................................................... 178-179 Combining Statement of Cash Flows ................................................................................................... 180-183

Agency Funds: Combining Statement of Changes in Assets and Liabilities ................................................................. 184-185 STATISTICAL SECTION (UNAUDITED) Net Position by Component ................................................................................................................................... 186 Changes in Net Position ................................................................................................................................. 187-189 Governmental Activities Tax Revenues by Source ................................................................................................ 190 Fund Balances of Governmental Funds ................................................................................................................. 191 Changes in Fund Balances of Governmental Funds ....................................................................................... 192-193 General Governmental Tax Revenues by Source ................................................................................................. 194 Assessed and Estimated Market Value of Taxable Property ................................................................................. 195 Property Tax Rates – Direct and Overlapping Governments ................................................................................. 196 Principal Property Taxpayers ................................................................................................................................. 197
Property Tax Levies and Collections ...................................................................................................................... 198 Ratios of Outstanding Debt by Type ...................................................................................................................... 199 Ratios of General Obligation Bonded Debt Outstanding ........................................................................................ 200 Direct and Overlapping General Obligation Bonded Debt ...................................................................................... 201 Legal Debt Margin Information ............................................................................................................................... 202 Pledged – Revenue Coverage – Water and Wastewater ....................................................................................... 203 Pledged – Revenue Coverage – Airport Revenue Bonds ...................................................................................... 204 Pledged – Revenue Coverage – Special Assessment Bonds ................................................................................ 205 Pledged – Revenue Coverage – Storm Sewer Bonds ........................................................................................... 206 Pledged – Revenue Coverage – Parking Note Payable ........................................................................................ 207 Pledged – Revenue Coverage – Parking Note Payable ........................................................................................ 208 Demographics Statistics ........................................................................................................................................ 209 Principal Employers ............................................................................................................................................... 210 Full-time Equivalent City Government Employees by Function ............................................................................. 211 Operating Indicators ............................................................................................................................................... 212 Capital Asset Statistics ................................................................................................................................... 213-214 Property Value, Construction, and Bank Deposits ................................................................................................. 215

SINGLE AUDIT SECTION Independent Auditors’ Report on Internal Control over Financial Reporting and on Compliance and Other Matters Based on an Audit of Financial Statements Performed in Accordance with Government Auditing Standards .................................................................... 216-217 Independent Auditors’ Report on Compliance for Each Major Program and on Internal Control over Compliance Required by the Uniform Guidance ............................................................ 218-219 Schedule of Expenditures of Federal Awards ...................................................................................................... 220-222 Notes to Schedule of Expenditures of Federal Awards ............................................................................................... 223 Schedule of Findings and Questioned Costs ....................................................................................................... 224-225 Summary Schedule of Prior Audit Findings ................................................................................................................. 226

i
CITY OF BILLINGS FINANCE DEPARTMENT
P.O BOX 1178 BILLINGS, MONTANA 59103
(406) 657-8207 FACSIMILE (406) 247-8608
January 22, 2020 Honorable Mayor, Members of the City Council, City Administrator and the Citizens of the City of Billings, Montana: The Comprehensive Annual Financial Report (CAFR) of the City of Billings, Montana (the City) for Fiscal Year ended June 30, 2019, is hereby submitted. This report was prepared by the Finance Department. Management assumes full responsibility for the completeness and reliability of the information contained in this report, based upon a comprehensive framework of internal control that it has established for this purpose. Because the cost of internal control should not exceed anticipated benefits, the objective is to provide reasonable, rather than absolute, assurance that the financial statements are free of any material misstatements. Management’s Discussion and Analysis (MD&A) immediately follows the independent auditors’ report and provides a narrative introduction, overview, and analysis of the basic financial statements. MD&A complements this letter of transmittal and should be read in conjunction with it. The City is required to undergo an annual Single Audit in conformity with the provisions of the Single Audit Act Amendments of 1996 and the Office of Management and Budget Uniform Guidance, Audits of States, Local Governments and Non-Profit Organizations. Information related to the Single Audit, including the Schedule of Expenditures of Federal Awards and the auditor’s reports on internal controls and compliance is included in the Single Audit section of this report. CITY OF BILLINGS PROFILE The City of Billings was incorporated in 1882 and is located in South Central Montana along Interstate 90. The City of Billings is located in Yellowstone County, the most populous county in Montana. Billings is the largest city in the state with a 2010 Census population of 104,170 and a current estimate of 109,642.

ii
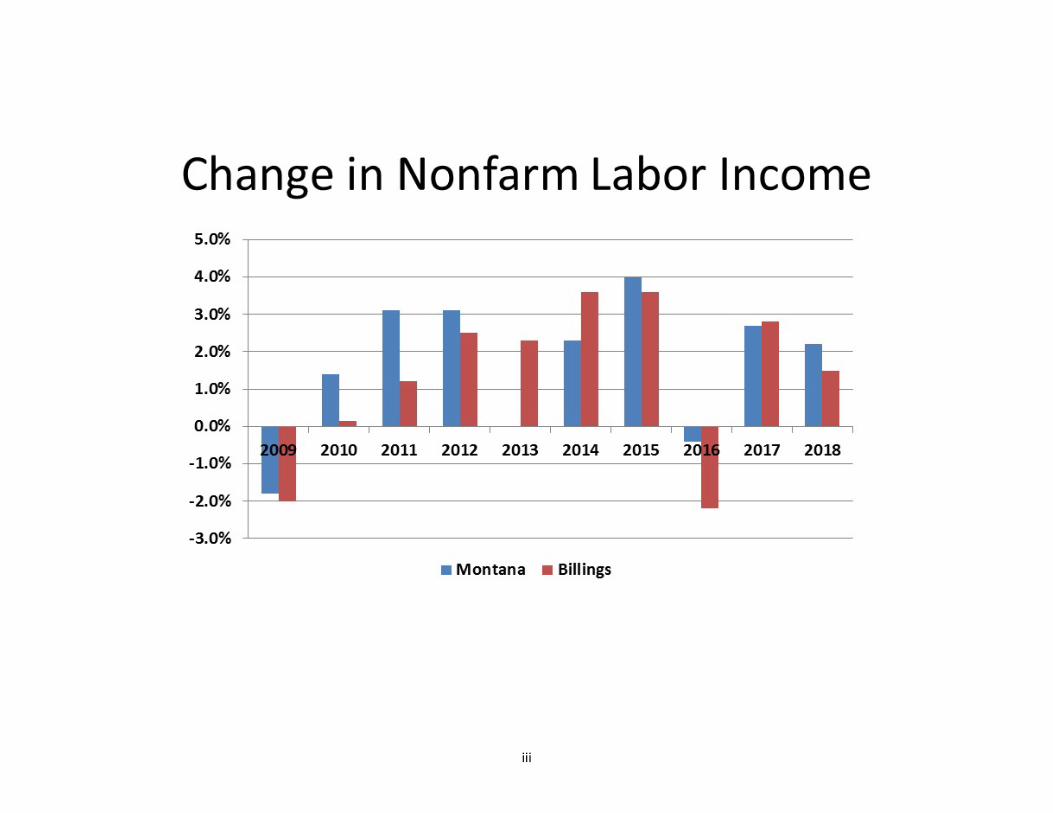
The City of Billings operates under a Home Rule Charter, established in 1976, with a Council-Manager form of government. Policymaking and legislative authority are vested in a 10-member council and mayor (Legislative Branch). The Legislative Branch is responsible for the performance of all duties and obligations imposed on the City by law. Two council members are elected from each of 5 wards for four year terms with a maximum of two consecutive terms. The mayor is elected at large for a four-year term with a maximum of two consecutive terms. The Legislative Branch hires a City Administrator (Manager) to oversee the day-to-day operations of the City. The City of Billings provides governmental services for public safety, utilities (including water, wastewater, and solid waste), public transportation, construction and maintenance of infrastructure, and general support services to serve the citizens of Billings. The City maintains budgetary controls, the objective of which is to ensure compliance with legal provisions embodied in the annual appropriated budget approved by the City Council. Budgets are legally required and are prepared for all the City’s funds. The level of budgetary control (that is the level at which expenditures cannot legally exceed the appropriated amount) is established at the fund level. The City also maintains an encumbrance system as one technique of accomplishing budgetary control. Open encumbrances are reported as reservations of fund balance as of June 30, 2019. Per state law, encumbrances are automatically re-appropriated and added to the following year’s adopted budget. This re-appropriation takes place without council action. ECONOMIC CONDITION AND OUTLOOK The University of Montana – Missoula, Bureau of Business and Economic Research publishes its Economic Outlook for selected counties in Montana. Following is some information contained in the publication. Billings continues as the largest trade and service center in the Upper Plains. It comes as no surprise that the export components of retail trade, wholesale trade and professional services were the greatest contributors to economic growth since the Great Recession. Manufacturing (primarily the oil refineries) has also been growing. In the last few years, increases in the health care industry have been significant. Since 2014, the Billings area economy has faced the added challenge of the slump in the Bakken due to low oil prices. Overall, the Billings area economy has performed at about the statewide average during the last five years and roughly in the middle of the pack among Montana cities.
iii
iv
One of the City's largest industries is health care. Presently, the Billings Clinic Health System (approximately 4,000 employees) and Saint Vincent Healthcare (approximately 2,000 employees) employ approximately 6,000 employees. Both healthcare systems have embarked on major expansion programs that will increase the size of their facilities and their employment levels over the next several years. LONG-TERM FINANCIAL PLANNING The City of Billings annually completes five-year plans for the General Fund, Public Safety Fund, Library Fund, Airport Fund, Transit Fund and other operating funds. Currently, the Public Safety Fund gets around 52% of its revenue from the General Fund. Historically, the General Fund balance increased slightly through modest increases in expenditures and tax revenue. However, tax revenue increases have not been able to keep pace with the increase in expenses. As a result of this in balance, reserves will need to be used to balance future budgets. As a result of continued population growth, the City will need to make many decisions related to expansion of City facilities over the next five years. This will continue to use the unassigned General Fund balance. The City is also going to begin updating its strategic plan. This information will be used when completing the FY21 budget. RELEVANT FINANCIAL POLICIES The Billings City Council adopts three capital plans each budget year. The three plans are for technology equipment, vehicles, and capital improvements (infrastructure, buildings, building improvements, etc.). These three plans guide the City throughout the fiscal year with capital purchases. The City Council followed the adopted growth policy by only annexing parcels contained within the boundaries of the policy. Following the policy does not over extend City services, which in turn cost more money. The City Council adopted a reserve level policy authorizing the City Administrator to establish fiscally responsible reserve minimums. The City Administrator adopted an Administrative Order with recommended reserve levels for all operating funds. MAJOR INITIATIVES City Council adopts annual goals before beginning budget preparations. The Council, with the help of a consultant, adjusted and adopted updated strategic goals in 2019.

v
Honest, Responsive Government: Striving to be a principle-centered organization that promotes responsibility, accountability, trust, and open, accessible government.
Comprehensive Orderly Growth: Careful consideration and management of the process of community growth. Transportation: Development of a comprehensive, multi-modal transportation system that supports the Growth
Policy. Sustainable Economic Development: Economic vitality that fosters community partnerships and ensures a strong
and efficient infrastructure. Involved, United Community: Community-wide investment in visioning and planning for the future.
Public Safety: Provide for a safe and secure community.
Quality of Life: Provide Library patrons with tools to become happy, informed, participating community members. City Infrastructure: Provide an understandable program with sustainable funding.
All City departments establish departmental goals and action plans that help to support the Council goals. Some of the major initiatives that were started, or completed, in the budget year are:
Updated the Capital Improvements Plan.
Completed multiple road construction projects.
INDEPENDENT AUDIT The State of Montana requires a biennial audit of the basic financial statements of the City by independent certified public accountants selected by the City Council. However, the City Council has recommended that an annual audit be performed. An annual audit provides a higher level of financial management and fiscal responsibility. JCCS P.C., Certified Public Accountants, have issued an unmodified (“clean”) opinion on the City of Billings, Montana’s financial statements for the year ended June 30, 2019. The independent auditors’ report is located at the front of the financial section of this report.

vi
AWARDS The Government Finance Officers Association of the United States and Canada (GFOA) awarded a Certificate of Achievement for Excellence in Financial Reporting to the City of Billings, Montana, for its comprehensive annual financial report for the fiscal year ended June 30, 2018. This was the 35th consecutive year the City has achieved this prestigious award. In order to be awarded a Certificate of Achievement, a governmental unit must publish an easily readable and efficiently organized comprehensive annual financial report. This report must satisfy both generally accepted accounting principles and applicable legal requirements. A Certificate of Achievement is valid for a period of one year only. We believe our current comprehensive annual financial report continues to meet the Certificate of Achievement Program’s requirements and we are submitting it to the GFOA to determine its eligibility for another certificate. For the 28th consecutive year, the City received the GFOA's Award for Distinguished Budget Presentation for its 2019-2020 annual budget. In order to qualify for the Distinguished Budget Presentation Award, the City's budget document was judged to be proficient in several categories including policy documentation, financial planning, and organization. ACKNOWLEDGEMENTS The preparation of the Comprehensive Annual Financial Report on a timely basis was made possible by the dedicated service of the entire staff of the Finance Department, with special appreciation extended to our Accountants Jim Hauck, Donna Hjelm, and Sarah Lane. Each member of the department has my sincere appreciation for the contributions made in the preparation of this report.

vii

viii

ix

FINANCIAL SECTION

To the Honorable Mayor, Members of the City Council and City AdministratorCity of Billings, Montana
INDEPENDENT AUDITORS' REPORT
Report on the Financial StatementsWe have audited the accompanying financial statements of the governmental activities, the business-type activities, each major fund, and the aggregate remaining fundinformation of the City of Billings, Montana, as of and for the year ended June 30, 2019, and the related notes to the financial statements, which collectively comprise theCity of Billings, Montana's basic financial statements as listed in the table of contents.
Management's Responsibility for the Financial StatementsManagement is responsible for the preparation and fair presentation of these financial statements in accordance with accounting principles generally accepted in theUnited States of America; this includes the design, implementation, and maintenance of internal control relevant to the preparation and fair presentation of financialstatements that are free from material misstatement, whether due to fraud or error.
Auditors' ResponsibilityOur responsibility is to express opinions on these financial statements based on our audit. We conducted our audit in accordance with auditing standards generallyaccepted in the United States of America and the standards applicable to financial audits contained in Government Auditing Standards, issued by the Comptroller Generalof the United States. Those standards require that we plan and perform the audit to obtain reasonable assurance about whether the financial statements are free frommaterial misstatement.
An audit involves performing procedures to obtain audit evidence about the amounts and disclosures in the financial statements. The procedures selected depend on theauditors' judgment, including the assessment of the risks of material misstatement of the financial statements, whether due to fraud or error. In making those riskassessments, the auditor considers internal control relevant to the entity’s preparation and fair presentation of the financial statements in order to design audit proceduresthat are appropriate in the circumstances, but not for the purpose of expressing an opinion on the effectiveness of the entity’s internal control. Accordingly, we express nosuch opinion. An audit also includes evaluating the appropriateness of accounting policies used and the reasonableness of significant accounting estimates made bymanagement, as well as evaluating the overall presentation of the financial statements.
We believe that the audit evidence we have obtained is sufficient and appropriate to provide a basis for our audit opinions.
OpinionsIn our opinion the financial statements referred to above present fairly, in all material respects, the respective financial position of the governmental activities, thebusiness-type activities, each major fund, and the aggregate remaining fund information of the City of Billings, Montana, as of June 30, 2019, and the respective changesin financial position and, where applicable, cash flows thereof for the year then ended in accordance with accounting principles generally accepted in the United States ofAmerica.
1
501 Park Dr S / Great Falls, MT 59405
Office: (406) 761-2820 / Fax: (406) 761-2825 / jccscpa.com

Other MattersRequired Supplementary InformationAccounting principles generally accepted in the United States of America require that the management's discussion and analysis, budgetary comparison schedules, otherpost-employment benefits information, and employee retirement pension benefits information (collectively, the required supplementary information) on pages 3 through12 and 110 through 127 be presented to supplement the basic financial statements. Such information, although not a part of the basic financial statements, is required bythe Government Accounting Standards Board, who considers it to be an essential part of financial reporting for placing the basic financial statements in an appropriateoperational, economic, or historical context. We have applied certain limited procedures to the required supplementary information in accordance with auditing standardsgenerally accepted in the United States of America, which consisted of inquiries of management about the methods of preparing the information and comparing theinformation for consistency with management's responses to our inquiries, the basic financial statements, and other knowledge we obtained during our audit of the basicfinancial statements. We do not express an opinion or provide any assurance on the information because the limited procedures do not provide us with sufficient evidenceto express an opinion or provide any assurance.
Other InformationOur audit was conducted for the purpose of forming opinions on the financial statements that collectively comprise the City of Billings, Montana's, basic financialstatements. The introductory section, combining and individual nonmajor fund financial statements, and statistical section, are presented for purposes of additionalanalysis and are not a required part of the basic financial statements. The schedule of expenditures of federal awards is presented for purposes of additional analysis asrequired by Title 2 U.S. Code of Federal Regulations Part 200, Uniform Administrative Requirements, Cost Principles, and Audit Requirements for Federal Awards, andis also not a required part of the basic financial statements.
The combining and individual nonmajor fund financial statements and the schedule of expenditures of federal awards are the responsibility of management and werederived from and relate directly to the underlying accounting and other records used to prepare the basic financial statements. Such information has been subjected to theauditing procedures applied in the audit of the basic financial statements and certain additional procedures, including comparing and reconciling such informationdirectly to the underlying accounting and other records used to prepare the financial statements or to the financial statements themselves, and other additional proceduresin accordance with auditing standards generally accepted in the United States of America. In our opinion the combining and individual nonmajor fund financialstatements and the schedule of expenditures of federal awards are fairly stated in all material respects in relation to the financial statements as a whole.
The introductory and statistical sections have not been subjected to the auditing procedures applied in the audit of the basic financial statements and, accordingly, we donot express an opinion or provide any assurance on them.
Other Reporting Required by Government Auditing StandardsIn accordance with Government Auditing Standards, we have also issued our report dated January 22, 2020, on our consideration of the City of Billings, Montana'sinternal control over financial reporting and on our tests of its compliance with certain provisions of laws, regulations, contracts, and grant agreements and other matters.The purpose of that report is to describe the scope of our testing of internal control over financial reporting and compliance and the results of that testing, and not toprovide an opinion on the internal control over financial reporting or on compliance. That report is an integral part of an audit performed in accordance with GovernmentAuditing Standards in considering the City of Billings, Montana's internal control over financial reporting and compliance.
Junkermier, Clark, Campanella, Stevens, P.C.
Great Falls, MontanaJanuary 22, 2020
2

3
MANAGEMENT’S DISCUSSION AND ANALYSIS
The City of Billings (the City) offers the readers of the City’s financial statements this narrative overview and analysis of the financial activities for the fiscal year ended June 30, 2019. In addition to this overview and analysis based on currently known facts, decisions, and conditions, the City encourages readers to consider the information presented in the City’s letter of transmittal and the City’s financial statements, which begin on pages i and 13 of this report, respectively. Financial Highlights
The assets and deferred outflows of the City exceeded its liabilities and deferred inflows at the fiscal year end by $770 Million (Net Position).
The total fiscal year end governmental fund balance was $95 Million as reported in the balance sheet. The total general fund and public safety fund balances at the fiscal year end were $22,399,798 and $1,471,734, respectively.
More information regarding the general fund and public safety fund balances is contained in the Economic Factors and Future Outlook toward the end of the Management Discussion and Analysis (MD&A).
Overview of the Financial Statements This discussion and analysis is intended to serve as an introduction to the City’s basic financial statements. The City’s basic financial statements consist of the following three components:
1) Government-wide Financial Statements 2) Fund Financial Statements 3) Notes to the Financial Statements
Other supplementary information is also included at the end of the Financial Section. Government-wide Financial Statements. The government-wide statements are designed to provide readers with a broad overview of the City’s finances using the accrual basis of accounting, the basis of accounting used by most private-sector businesses.

4
The statement of net position presents information on all of the City’s assets and liabilities. The difference between total assets and deferred outflows minus liabilities and deferred inflows is reported as net position. Over time, increases and decreases in net position may provide an indication of whether the City’s financial position is improving or deteriorating. The statement of activities presents information reflecting how the City’s net position has changed during the fiscal year just ended. All changes in net position are reported as soon as the underlying event giving rise to the change occurs, regardless of the timing of the related cash flows. Thus, revenues and expenses are reported in this statement for some items that will only result in cash flows in future periods (e.g., uncollected taxes and earned but unused vacation leave). The government-wide financial statements distinguish functions of the City that are principally supported by taxes and intergovernmental revenues (governmental activities) from other functions that are intended to recover all, or a significant portion, of their costs through user fees and charges (business-type activities). The governmental activities of the City include general government, public safety – police and fire, public health, culture and recreational services, housing and economic development, and public works. The business-type activities of the City include solid waste, airport, water, wastewater, transit, parking operations, and golf course. Fund Financial Statements. Traditional users of the City’s financial statements will find the fund financial statement presentation more familiar. With the implementation of GASB 34, the focus is now on major funds rather than fund types. A fund is a grouping of related accounts that are used to maintain control over resources that have been segregated for specific activities or objectives. A major fund should generally meet both of the following criteria: 1) total assets, liabilities, revenues, or expenditures/expenses are at least 10% of the corresponding total (assets, liabilities, etc.) for that fund type (i.e., governmental or enterprise funds), and 2) total assets, liabilities, revenues, or expenditures/expenses of the individual governmental or enterprise fund are at least 5% of the corresponding total for all governmental and enterprise funds combined. The City, like other state and local governments, uses fund accounting to ensure and demonstrate compliance with finance-related legal requirements. All of the funds of the City can be divided into two categories: governmental funds and proprietary funds. Governmental Funds. Governmental funds are used to report those same functions reported as governmental activities in the government-wide financial statements. However, unlike the government-wide statements, the fund financial statements are prepared on the modified accrual basis. Under the modified accrual basis of accounting, revenues are recognized when they become measurable and available, and expenditures are recognized when the related fund liability is incurred, with the exception of long-term debt and similar long-term items which are recorded when due. Therefore, the focus of the governmental fund financial statements is

5
on near-term inflows and outflows of spendable resources, as well as on the balance of spendable resources available at the end of the fiscal year. Since the focus of the governmental funds is on near-term resources, it is useful to compare the information presented for governmental funds with similar information presented for governmental activities in the government-wide financial statements. To facilitate this comparison, reconciliations are provided for both the governmental fund balance sheet and the governmental statement of revenues, expenditures, and changes in fund balances. Information is presented separately in the governmental fund balance sheet and in the governmental fund statement of revenues, expenditures, and changes in fund balance for the General Fund and Public Safety Fund. These two funds are considered to be major funds. Data from the other governmental funds is combined into a single, aggregated presentation. Individual fund data for each of these nonmajor funds is provided in the form of combining statements located within the supplementary information following the notes to the financial statements. The City adopts an annual appropriated budget for all of its governmental funds. Budgetary comparison statements have been provided to demonstrate compliance with this budget. The basic governmental fund financial statements can be found on pages 16-20 of this report. Proprietary Funds. The City maintains two different types of proprietary funds: enterprise and internal service funds. The proprietary fund financial statements are prepared on the accrual basis of accounting. Enterprise funds are used to report the same functions presented as business-type activities in the government-wide financial statements. The City uses enterprise funds to account for its solid waste, airport, water, wastewater, transit, parking operations, and golf course. Internal service funds are used to account for activities and services performed for other organizational units within the City. These costs are allocated internally among the City’s various functions. The City uses internal service funds to account for motor pool, postage and copying, information technology, health care benefits, facilities management, telephone services, radio communication services, public works administration, public works engineering, and property and liability insurance. The governmental-type functions use over 50% of these services. As such, they have been included within the governmental activities in the government-wide financial statements. Proprietary funds provide the same type of information as the government-wide financial statements, only in more detail. The transit and golf course enterprise funds are considered to be non-major funds and, therefore, are combined into a single, aggregated presentation in the proprietary fund statements. Major fund reporting requirements do not apply to internal service funds; therefore, they are combined into a single, aggregated presentation in the proprietary fund statements.
6
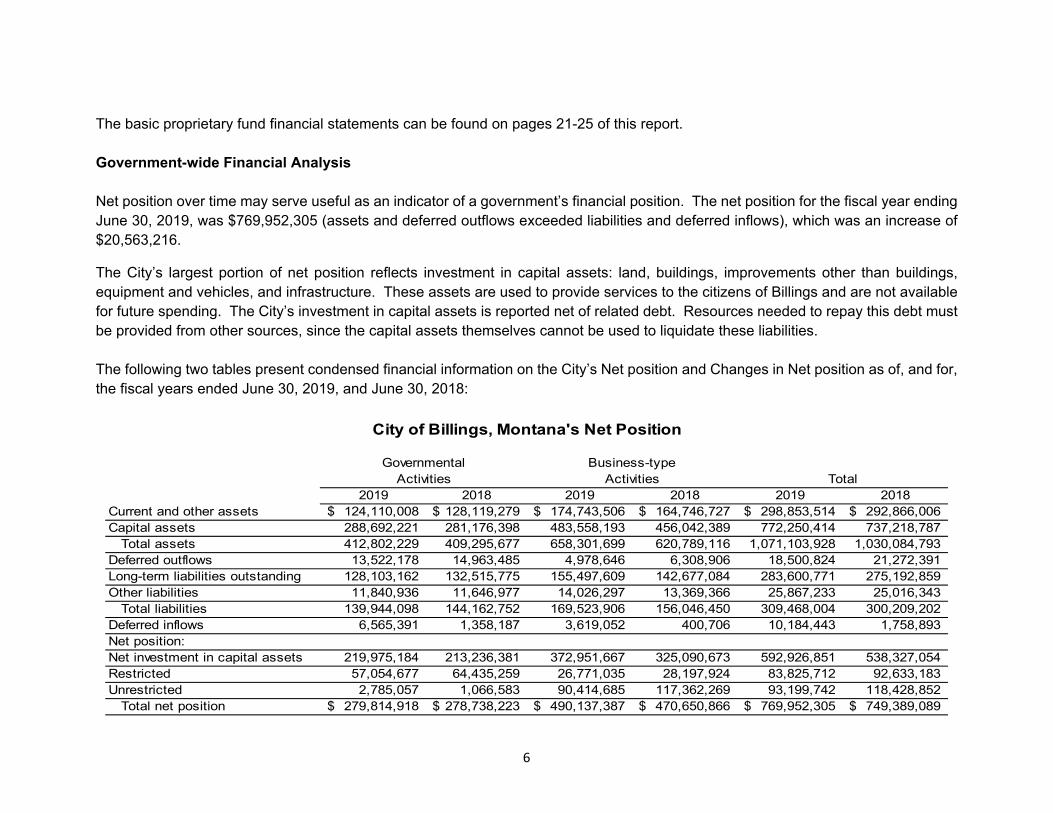
The basic proprietary fund financial statements can be found on pages 21-25 of this report. Government-wide Financial Analysis Net position over time may serve useful as an indicator of a government’s financial position. The net position for the fiscal year ending June 30, 2019, was $769,952,305 (assets and deferred outflows exceeded liabilities and deferred inflows), which was an increase of $20,563,216.
The City’s largest portion of net position reflects investment in capital assets: land, buildings, improvements other than buildings, equipment and vehicles, and infrastructure. These assets are used to provide services to the citizens of Billings and are not available for future spending. The City’s investment in capital assets is reported net of related debt. Resources needed to repay this debt must be provided from other sources, since the capital assets themselves cannot be used to liquidate these liabilities. The following two tables present condensed financial information on the City’s Net position and Changes in Net position as of, and for, the fiscal years ended June 30, 2019, and June 30, 2018:
2019 2018 2019 2018 2019 2018Current and other assets 124,110,008$ 128,119,279$ 174,743,506$ 164,746,727$ 298,853,514$ 292,866,006$ Capital assets 288,692,221 281,176,398 483,558,193 456,042,389 772,250,414 737,218,787
Total assets 412,802,229 409,295,677 658,301,699 620,789,116 1,071,103,928 1,030,084,793 Deferred outflows 13,522,178 14,963,485 4,978,646 6,308,906 18,500,824 21,272,391 Long-term liabilities outstanding 128,103,162 132,515,775 155,497,609 142,677,084 283,600,771 275,192,859 Other liabilities 11,840,936 11,646,977 14,026,297 13,369,366 25,867,233 25,016,343
Total liabilities 139,944,098 144,162,752 169,523,906 156,046,450 309,468,004 300,209,202 Deferred inflows 6,565,391 1,358,187 3,619,052 400,706 10,184,443 1,758,893 Net position:Net investment in capital assets 219,975,184 213,236,381 372,951,667 325,090,673 592,926,851 538,327,054 Restricted 57,054,677 64,435,259 26,771,035 28,197,924 83,825,712 92,633,183 Unrestricted 2,785,057 1,066,583 90,414,685 117,362,269 93,199,742 118,428,852
Total net position 279,814,918$ 278,738,223$ 490,137,387$ 470,650,866$ 769,952,305$ 749,389,089$
City of Billings, Montana's Net Position
GovernmentalActivities
Business-typeActivities Total

7
The restricted portion of fiscal year 2019 Net Position (10.9%) represents resources that are subject to external restrictions as to how they may be used.
Revenues: 2019 2018 2019 2018 2019 2018Program revenues:
Charges for services 40,348,085$ 38,974,596$ 80,661,403$ 78,132,295$ 121,009,488$ 117,106,891$ Operating grants and contributions 7,914,329 18,855,535 1,462,370 3,721,107 9,376,699 22,576,642 Capital grants and contributions 6,059,595 7,117,548 3,171,245 3,745,650 9,230,840 10,863,198
General revenues:Property taxes 39,670,483 38,683,508 2,264,225 2,230,151 41,934,708 40,913,659 Franchise fees 1,457,677 3,851,814 - - 1,457,677 3,851,814 Business licenses 766,478 762,297 - - 766,478 762,297 Unrestricted federal/state shared revenue 18,107,823 17,137,975 - - 18,107,823 17,137,975 Unrestricted investment earnings 2,314,255 428,152 3,595,705 1,498,320 5,909,960 1,926,472 Gain/(Loss) on sale of property and equipment 57,834 139,532 169,886 24,273 227,720 163,805 Miscellaneous 440,568 (782,855) 219,212 710,569 659,780 (72,286)
Total revenues 117,137,127 125,168,102 91,544,046 90,062,365 208,681,173 215,230,467
(Continued)
City of Billings, Montana's Changes in Net Position
Governmental Business-typeActivities Activities Total

8
Expenses: 2019 2018 2019 2018 2019 2018General government 8,679,189 9,166,943 - - 8,679,189 9,166,943 Public safety 39,965,050 52,598,618 - - 39,965,050 52,598,618 Public works 40,941,520 37,155,926 - - 40,941,520 37,155,926 Public health 1,449,194 1,037,576 - - 1,449,194 1,037,576 Culture and recreation 17,396,764 11,457,583 - - 17,396,764 11,457,583 Housing and economic development 4,983,940 5,338,458 - - 4,983,940 5,338,458 Interest on long-term debt 2,560,025 2,829,762 - - 2,560,025 2,829,762 Solid Waste - - 14,162,720 13,753,027 14,162,720 13,753,027 Airport - - 13,088,494 14,067,374 13,088,494 14,067,374 Water - - 20,096,427 20,672,758 20,096,427 20,672,758 Wastewater - - 15,751,457 14,974,704 15,751,457 14,974,704 Parking - - 2,431,081 2,502,939 2,431,081 2,502,939 Transit - - 6,146,028 5,992,999 6,146,028 5,992,999 Golf Course - - 466,068 435,048 466,068 435,048
Total expenses 115,975,682 119,584,866 72,142,275 72,398,849 188,117,957 191,983,715 Increase in net position before transfers 1,161,445 5,583,236 19,401,771 17,663,516 20,563,216 23,246,752
Transfers (84,750) (309,329) 84,750 309,329 - - Change in net position 1,076,695 5,273,907 19,486,521 17,972,845 20,563,216 23,246,752
Net position, beginning of year 278,738,223 273,464,316 470,650,866 452,678,021 749,389,089 726,142,337 Net position, end of year 279,814,918$ 278,738,223$ 490,137,387$ 470,650,866$ 769,952,305$ 749,389,089$
City of Billings, Montana's Changes in Net Position (Continued)
Activities Activities TotalGovernmental Business-type
Governmental activities. Net Position in governmental activities increased by $1,076,695 during fiscal year 2019. Net Position increased due to the combination of increased property tax collections and operating grants. Business-type activities. Net Position in business-type activities increased by $19,486,521 during fiscal year 2019. Net Position increased due to Airport, Water, and Wastewater contributed capital of $3.1 million and charges exceeding operating expenses in Solid Waste, Water, and Wastewater by $18.1 million. Financial Analysis of the City’s Funds As noted previously, the City uses fund accounting to ensure and demonstrate compliance with finance-related legal requirements.

9
Governmental funds. The focus of the City’s governmental funds is to provide information on near-term inflows, outflows, and balances of spendable resources. Such information is useful in assessing the City’s financing requirements. In particular, an unassigned fund balance may serve as a useful measure of a government’s net resources available for spending at the end of the fiscal year. The City of Billings Public Safety Fund received approximately 51% of its funding from the General Fund. Therefore, both funds are directly related. The combined fund balances for the General and Public Safety funds experienced a decrease in the current fiscal year. The decrease is a result of operating cost increases exceeding the increase in revenue and a $2 million capital investment in park development. Proprietary funds. The City’s proprietary funds provide the same type of information found in the government-wide financial statements, but in more detail. Unrestricted net position in the proprietary funds is $90,414,685 for fiscal year ended June 30, 2019, a decrease of $27 million. The most significant decreases in unrestricted net position were related to unspent debt attributable to capital projects. The net position of the Solid Waste Fund increased by $1.8 million due to a net operating income of $1.5 million. The Airport Fund’s net position increased by $3.1 million due to capital contributions of $2.7 million. The Water Fund’s net position increased by $6.7 million due to a net operating income of $6.0 million. The Wastewater Fund’s net position increased by $10.0 million due to a net operating income of $10.6 million. The Parking Fund’s net position decreased by $574,000 due to a net operating loss. Future increases and revenue enhancements are being planned for the Parking Fund. General Fund Budgetary Highlights General Fund revenues were nearly the same as amounts budgeted. Variances between the final revenue budget and actual revenues received is a result of charges for services being greater than anticipated due to an increase in participation of recreation activities. Variances between the final expenditure budget and actual expenditures resulted from vacancy savings, unused council contingency funds, and vacancy savings and deferred capital expenditures in the Public Safety Fund resulting in a transfer that was less than budgeted.

10
Capital Asset and Debt Administration Capital Assets. The City of Billings investment in capital assets for its governmental and business-type activities as of June 30, 2019, was $772 million (net of accumulated depreciation). The investment in capital assets includes land; construction in progress; buildings; improvements other than buildings, equipment and vehicles; and infrastructure. The City had construction commitments of $64 million for the end of the current fiscal year.
2019 2018 2019 2018 2019 2018Land 45,535,455$ 44,294,991$ 13,755,814$ 13,755,814$ 59,291,269$ 58,050,805$ Buildings 30,778,675 24,206,352 54,920,104 53,799,256 85,698,779 78,005,608 Improvements other than buildings 29,502,120 29,581,444 42,858,141 46,249,771 72,360,261 75,831,215 Machinery and equipment 13,815,528 15,156,167 21,611,546 21,616,303 35,427,074 36,772,470 Infrastructure 163,494,704 153,803,031 276,016,982 274,807,188 439,511,686 428,610,219 Construction In progress 5,565,739 14,134,409 74,395,606 45,814,057 79,961,345 59,948,466 Total 288,692,221$ 281,176,394$ 483,558,193$ 456,042,389$ 772,250,414$ 737,218,783$
City of Billings, Montana's Capital Assets(net of depreciation)
TotalGovernmental Business-type
Activities Activities
Additional information on the City of Billings’ capital assets can be found on pages 53-56 of this report.

11
2019 2018 2019 2018 2019 2018General obligation bonds 19,797,206$ 21,668,610$ -$ -$ 19,797,206$ 21,668,610$ Refunding bonds - - 1,566,423 2,429,542 1,566,423 2,429,542 Special assessment debt with governmental commitment 18,954,420 18,766,594 - - 18,954,420 18,766,594 Revenue bonds 27,639,805 24,810,319 86,471,719 65,238,028 114,111,524 90,048,347 Notes payable - - 36,607,000 39,727,000 36,607,000 39,727,000 Intercap notes payable 32,206 37,572 - - 32,206 37,572 Capital lease payable 2,083,906 2,514,688 3,208,851 3,437,007 5,292,757 5,951,695
Total 68,507,543$ 67,797,783$ 127,853,993$ 110,831,577$ 196,361,536$ 178,629,360$
Total
City of Billings, Montana's Outstanding DebtLong-term Debt
Governmental Business-typeActivities Activities
Long-term debt. The City of Billings had total bonded debt and notes outstanding of $196,361,536 at the end of the current fiscal year. The majority of the debt consists of revenue bonds payable in the amount of $152,284,947. These bonds are secured by specific revenue sources consisting mostly of loans for a major Wastewater plant project and Solid Waste Landfill drop-off facility. General Obligation Bonds in the amount of $19,797,206 of debt is backed by the full faith and credit of the government. The remaining amounts are special assessment debt in the amount of $18,954,420, which is assessed to benefit property owners, and $5,292,757 for capital leases. Under the current State statutes, City general obligation bonded debt issuances are subject to a legal limitation based on 2.50% of assessed market value of the property subject to taxation. As of June 30, 2019, the City’s general obligation bonded debt of $19,797,206 was well below the legal debt limit of $313,871,631. General obligation net bonded debt per capita equated to $158.19. Additional information on the City of Billings long-term debt can be found on pages 60-71 of this report.

12
Economic Factors and Future Outlook The City of Billings is the largest city in Montana and serves as Montana’s major trade and service center with major employment in health care, business services, and manufacturing. Most of the City’s funds are in good financial condition. The funds relying on property tax struggle because of local and state tax limitations, but continue to operate with use of reserves. Tax growth in the City has averaged slightly less than 3% over the past 10 years. While this growth allows us to keep up with the current level of service provided, it does not allow for much expansion in services. Development and construction continue to occur in Billings, during the fiscal year there was development valued at over $258 million within the city. Fund balance for the General Fund are above the minimum recommended reserve level as of June 30, 2019. The recommended reserve of 29% of the annual budget was derived from analyzing 10 years of cash flow needs. These reserves are necessary because property taxes, which are the greatest source of revenue for the General Fund, are paid in two installments, November 30 and May 31. As a result, cash balance in the fund decreases significantly in between tax payments. The Billings City Council approved an increase in the number of mills levied for tax year 2019 by 4.12 mills. Of the total mills levied within the City of Billings (City, County, School, and State), the City’s portion is approximately 21%. The city has seen modest growth in both new construction and existing property values. We expect this trend to continue, and anticipate modest growth in property tax revenue for FY20. Financial Contact The City’s financial statements are designed to provide users (citizens, taxpayers, customers, investors, and creditors) with a general overview of the City’s finances and to demonstrate the City’s accountability. Questions concerning any of the information presented in this report or requests for additional information should be sent to the attention of the Finance Director at the following address: P.O. Box 1178, Billings, MT 59103.

BASIC FINANCIAL STATEMENTS

13
Governmental Business-typeActivities Activities Total
AssetsCash and cash equivalents 45,636,432$ 59,196,869$ 104,833,301$ Restricted cash and cash equivalents with fiscal agent 4,501,909 6,427,850 10,929,759 Investments 66,011,423 85,561,080 151,572,503 Receivables 12,568,250 12,561,223 25,129,473 Internal balances (6,135,798) 6,135,798 - Inventories 392,204 1,487,031 1,879,235 Prepaid items 14,430 6,531 20,961 Property held for resale 378,825 - 378,825 Restricted assets:
Temporarily restricted:Investments with trustee - 3,367,124 3,367,124
Permanently restricted:Cash and cash equivalents 303,297 - 303,297 Investments 439,036 - 439,036
Capital assets:Land and construction in progress 51,101,195 88,151,420 139,252,615 Other capital assets, net of depreciation 237,591,026 395,406,773 632,997,799
Total capital assets 288,692,221 483,558,193 772,250,414 Total assets 412,802,229 658,301,699 1,071,103,928
Deferred OutflowsDeferred charge on refunding of debt 976,877 11,076 987,953 Other post employment benefits 927,265 855,402 1,782,667 Pensions 11,618,036 4,112,168 15,730,204 Total deferred outflows 13,522,178 4,978,646 18,500,824
LiabilitiesAccounts payable 5,152,451 10,774,893 15,927,344 Accrued wages and benefits 2,555,135 1,010,313 3,565,448 Incurred but not reported health benefits 767,796 - 767,796 Accrued interest 1,238,380 2,241,091 3,479,471 Unearned Revenue 753,824 - 753,824 Other liabilities 73,350 - 73,350 Claims and judgments - due within one year 1,300,000 - 1,300,000 Long-term liabilities:
Due within one year 11,056,494 8,816,597 19,873,091 Due in more than one year 66,184,220 122,462,555 188,646,775 Other post-employment benefits 5,655,916 2,861,190 8,517,106 Net pension liability 45,206,532 17,852,491 63,059,023
Landfill closure and postclosure - due in more than one year - 3,504,776 3,504,776 Total liabilities 139,944,098 169,523,906 309,468,004
(continued)
CITY OF BILLINGS, MONTANAStatement of Net Position
June 30, 2019(Page 1 of 2)

14
Deferred InflowsOther post employment benefits 2,185,237 1,003,841 3,189,078 Pensions 4,380,154 2,615,211 6,995,365
Total deferred inflows 6,565,391 3,619,052 10,184,443
Governmental Business-typeActivities Activities Total
Net PositionNet investment in capital assets 219,975,184 372,951,667 592,926,851 Restricted for:
Public works 22,482,686 - 22,482,686 Culture and recreation 2,433,249 - 2,433,249 Housing and economic development 14,207,551 - 14,207,551 Capital projects 9,368,244 19,704,004 29,072,248 Debt service 7,818,853 7,067,031 14,885,884 Endowments - nonexpendable 744,094 - 744,094
Unrestricted 2,785,057 90,414,685 93,199,742 Total net position 279,814,918$ 490,137,387$ 769,952,305$
The notes to the financial statements are an integral part of this statement.
June 30, 2019(Page 2 of 2)
CITY OF BILLINGS, MONTANAStatement of Net Position

15
Operating Capital GrantsCharges for Grants and and Governmental Business-Type
Expenses Services Contributions Contributions Activities Activities TotalFunctions/Programs:
Primary governmentGovernmental activities:
General government 8,679,189$ 3,439,094$ 1,380,077$ 300,000$ (3,560,018)$ -$ (3,560,018)$ Public safety 39,965,050 5,362,481 2,574,200 167,517 (31,860,852) - (31,860,852) Public w orks 40,941,520 29,006,071 52,962 3,587,421 (8,295,066) - (8,295,066) Public health 1,449,194 48,106 10,853 - (1,390,235) - (1,390,235) Culture and recreation 17,396,764 2,468,866 1,599,332 2,004,657 (11,323,909) - (11,323,909) Housing and economic development 4,983,940 23,467 2,296,905 - (2,663,568) - (2,663,568) Interest on long-term debt 2,560,025 - - - (2,560,025) - (2,560,025)
Total governmental activities 115,975,682 40,348,085 7,914,329 6,059,595 (61,653,673) - (61,653,673)
Business-type activities:Solid Waste 14,162,720 15,474,415 86,458 - - 1,398,153 1,398,153 Airport 13,088,494 12,887,199 207,259 2,734,270 - 2,740,234 2,740,234 Water 20,096,427 25,327,493 86,907 124,218 - 5,442,191 5,442,191 Wastew ater 15,751,457 23,969,963 67,951 312,757 - 8,599,214 8,599,214 Parking 2,431,081 1,743,170 12,779 - - (675,132) (675,132) Transit 6,146,028 809,231 1,001,016 - - (4,335,781) (4,335,781) Golf Course 466,068 449,932 - - - (16,136) (16,136)
Total business-type activities 72,142,275 80,661,403 1,462,370 3,171,245 - 13,152,743 13,152,743 Total primary government 188,117,957$ 121,009,488$ 9,376,699$ 9,230,840$ (61,653,673) 13,152,743 (48,500,930)
General revenues:
Property taxes 39,670,483 2,264,225 41,934,708 Franchise fees 1,457,677 - 1,457,677 Business license tax 766,478 - 766,478 Unrestricted federal/state shared revenue 18,107,823 - 18,107,823 Unrestricted investment earnings 2,314,255 3,595,705 5,909,960 Gain on sale of capital assets 57,834 169,886 227,720 Miscellaneous 440,568 219,212 659,780
Transfers (84,750) 84,750 -
Total general revenues and transfers 62,730,368 6,333,778 69,064,146
Change in net position 1,076,695 19,486,521 20,563,216 Net position, beginning of year 278,738,223 470,650,866 749,389,089
Net position, end of year 279,814,918$ 490,137,387$ 769,952,305$
The notes to the f inancial statements are an integral part of this statement.
Net (Expense) Revenue andChanges in Net Position
Primary Government
CITY OF BILLINGS, MONTANAStatement of Activities
For The Fiscal Year Ended June 30, 2019
Program Revenues

16
General FundPublic Safety
Fund
Other Governmental
Funds
Total Governmental
FundsAssets
Cash and cash equivalents 9,136,688$ 1,103,211$ 28,611,537$ 38,851,436$ Cash with fiscal agent - - 4,501,909 4,501,909 Investments 13,229,127 1,588,549 41,338,239 56,155,915 Receivables: Property taxes 629,083 526,368 684,426 1,839,877 Accounts and unbilled usage 8,201 77,962 81,584 167,747 Delinquent special assessments 46,426 - 1,225,479 1,271,905 Special assessments receivable - - 5,728,311 5,728,311 Accrued interest 47,708 2,780 173,636 224,124 Notes - - 2,184,011 2,184,011 Due from other funds 228,593 - 200,349 428,942 Due from other governments - - 673,865 673,865 Inventories - - 161,238 161,238 Property held for resale - - 378,825 378,825
Total assets 23,325,826$ 3,298,870$ 85,943,409$ 112,568,105$
Liabilities, Deferred Inflows and Fund BalancesLiabilities: Accounts payable 332,231$ 243,577$ 4,017,911$ 4,593,719$ Accrued wages & benefits 400,788 1,462,768 420,466 2,284,022 Due to other funds - - 428,943 428,943 Unearned Revenue - - 748,237 748,237 Other liabilities - - 73,350 73,350Total Liabilities 733,019$ 1,706,345$ 5,688,907$ 8,128,271$ Deferred inflows:Unavailable Revenue 193,009 120,791 8,642,891 8,956,691Fund balances: Unspendable - - 905,567 905,567 Restricted - 1,471,734 61,710,714 63,182,448 Committed 12,723,390 - 9,241,420 21,964,810 Unassigned 9,676,408 - (246,090) 9,430,318 Total fund balances 22,399,798 1,471,734 71,611,611 95,483,143
23,325,826$ 3,298,870$ 85,943,409$ 112,568,105$
The notes to the financial statements are an intergral part of this statement.
CITY OF BILLINGS, MONTANAGovernmental Funds
Balance Sheet June 30, 2019
Total liabilities, deferred inflows and fund balances

17
Total fund balances for governmental funds 95,483,143$
Total net position reported for governmental activities in the statement of net positionis different because:
Capital assets used in governmental activities are not financial resources and therefore are not reported in the funds. Those assets consist of:
Land 43,545,571$ Buildings and improvements 35,661,517 Improvements other than buildings 46,306,005 Machinery and equipment 36,429,310 Infrastructure 327,964,073 Construction in progress 5,392,561
Less accumulated depreciation (217,179,879) 278,119,158
Deferred outflow of resources are not financial resources, and therefore are not reportedin the funds and include: Gov't deferred outflows of resources - unavailable tax revenue 8,956,691 Gov't deferred outflows of resources - pensions 10,830,363 19,787,054
Long-term liabilities, including bonds payable, are not due and payable in the current periodand therefore are not reported in the funds
General obligation bonds payable (18,575,000) add: bond premium (1,222,206)
Tax increment bonds payable (27,560,000) less: bond discount 50,368 add: bond premium (130,173)
Special assessment bonds payable (18,435,867) less: bond discount 30,173 add: bond premium (548,726)
Notes payable (32,206) Compensated absences payable (7,297,463) Other post-employment benefits (4,971,210) Net pension liability (38,731,390) Claims and judgments (1,300,000) Accrued interest (1,218,580) (119,942,280)
Deferred inflow of resources related to pensions are not available to pay for current period expenditures, and therefore are not recorded in the funds
Deferred charge on refunding 976,877 Pensions and OPEB (5,336,874) (4,359,997)
Internal service funds are used by the City to charge the cost of certain activities to individualfunds. The assets and liabilities of the internal service funds are included in the governmentalactivities in the statement of net position 10,727,840
Total net position of governmental activities 279,814,918$
The notes to the financial statements are an integral part of this statement.
CITY OF BILLINGS, MONTANAReconciliation of the Governmental Funds Balance Sheet to the Statement of Net Position
June 30, 2019
18
General FundPublic Safety
Fund
Other Governmental
Funds
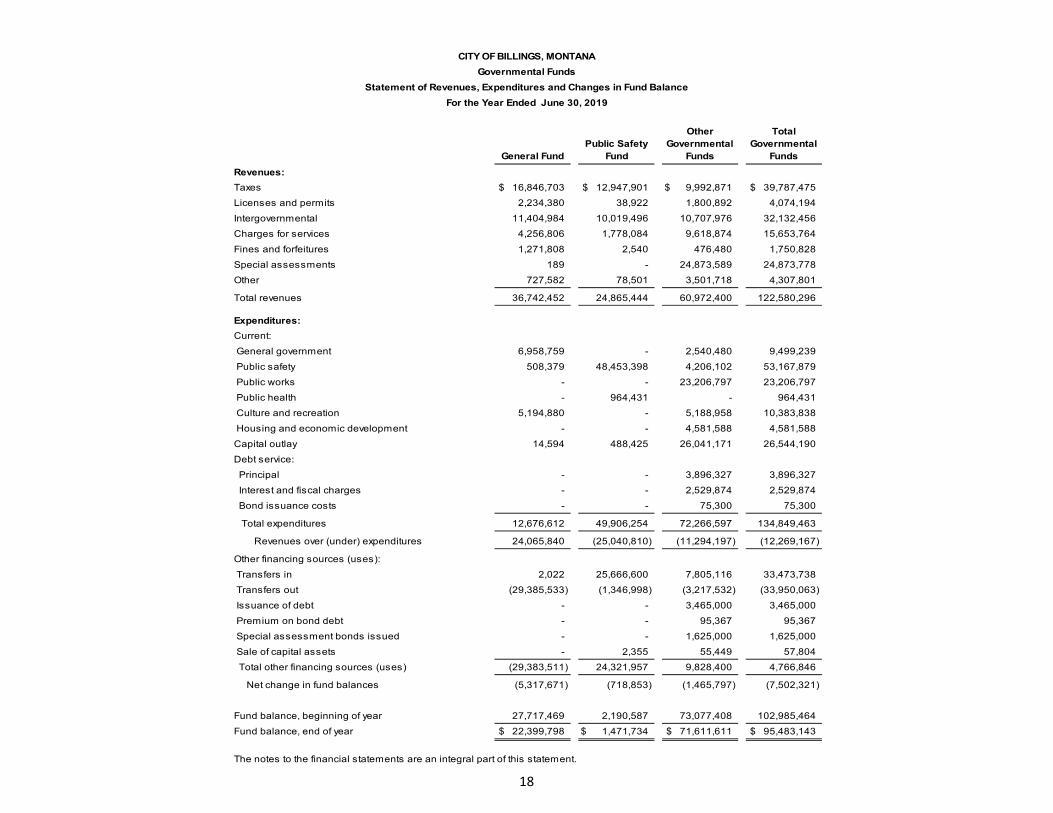
Total Governmental
FundsRevenues:Taxes 16,846,703$ 12,947,901$ 9,992,871$ 39,787,475$ Licenses and permits 2,234,380 38,922 1,800,892 4,074,194Intergovernmental 11,404,984 10,019,496 10,707,976 32,132,456Charges for services 4,256,806 1,778,084 9,618,874 15,653,764Fines and forfeitures 1,271,808 2,540 476,480 1,750,828Special assessments 189 - 24,873,589 24,873,778Other 727,582 78,501 3,501,718 4,307,801
Total revenues 36,742,452 24,865,444 60,972,400 122,580,296
Expenditures:Current: General government 6,958,759 - 2,540,480 9,499,239 Public safety 508,379 48,453,398 4,206,102 53,167,879 Public works - - 23,206,797 23,206,797 Public health - 964,431 - 964,431 Culture and recreation 5,194,880 - 5,188,958 10,383,838 Housing and economic development - - 4,581,588 4,581,588Capital outlay 14,594 488,425 26,041,171 26,544,190Debt service: Principal - - 3,896,327 3,896,327 Interest and fiscal charges - - 2,529,874 2,529,874 Bond issuance costs - - 75,300 75,300
Total expenditures 12,676,612 49,906,254 72,266,597 134,849,463
Revenues over (under) expenditures 24,065,840 (25,040,810) (11,294,197) (12,269,167)
Other financing sources (uses): Transfers in 2,022 25,666,600 7,805,116 33,473,738 Transfers out (29,385,533) (1,346,998) (3,217,532) (33,950,063) Issuance of debt - - 3,465,000 3,465,000 Premium on bond debt - - 95,367 95,367 Special assessment bonds issued - - 1,625,000 1,625,000 Sale of capital assets - 2,355 55,449 57,804 Total other financing sources (uses) (29,383,511) 24,321,957 9,828,400 4,766,846
Net change in fund balances (5,317,671) (718,853) (1,465,797) (7,502,321)
Fund balance, beginning of year 27,717,469 2,190,587 73,077,408 102,985,464Fund balance, end of year 22,399,798$ 1,471,734$ 71,611,611$ 95,483,143$
The notes to the financial statements are an integral part of this statement.
CITY OF BILLINGS, MONTANAGovernmental Funds
Statement of Revenues, Expenditures and Changes in Fund BalanceFor the Year Ended June 30, 2019
19
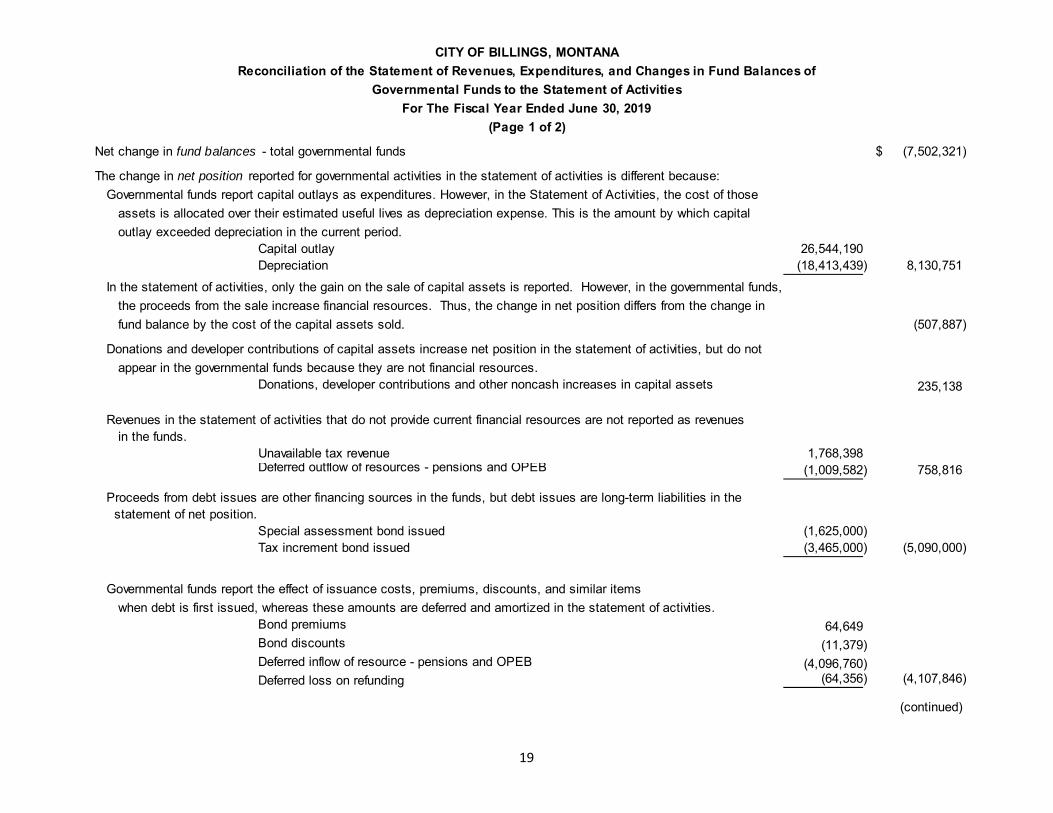
Net change in fund balances - total governmental funds (7,502,321)$
The change in net position reported for governmental activities in the statement of activities is different because:Governmental funds report capital outlays as expenditures. However, in the Statement of Activities, the cost of those
assets is allocated over their estimated useful lives as depreciation expense. This is the amount by which capital outlay exceeded depreciation in the current period.
Capital outlay 26,544,190 Depreciation (18,413,439) 8,130,751
In the statement of activities, only the gain on the sale of capital assets is reported. However, in the governmental funds,the proceeds from the sale increase financial resources. Thus, the change in net position differs from the change infund balance by the cost of the capital assets sold. (507,887)
Donations and developer contributions of capital assets increase net position in the statement of activities, but do not appear in the governmental funds because they are not financial resources.
Donations, developer contributions and other noncash increases in capital assets 235,138
Revenues in the statement of activities that do not provide current financial resources are not reported as revenuesin the funds. Unavailable tax revenue 1,768,398 Deferred outflow of resources - pensions and OPEB (1,009,582) 758,816
Proceeds from debt issues are other financing sources in the funds, but debt issues are long-term liabilities in the statement of net position.
Special assessment bond issued (1,625,000) Tax increment bond issued (3,465,000) (5,090,000)
Governmental funds report the effect of issuance costs, premiums, discounts, and similar itemswhen debt is first issued, whereas these amounts are deferred and amortized in the statement of activities.
Bond premiums 64,649 Bond discounts (11,379) Deferred inflow of resource - pensions and OPEB (4,096,760) Deferred loss on refunding (64,356) (4,107,846)
(continued)
(Page 1 of 2)
CITY OF BILLINGS, MONTANAReconciliation of the Statement of Revenues, Expenditures, and Changes in Fund Balances of
For The Fiscal Year Ended June 30, 2019Governmental Funds to the Statement of Activities

20
Repayment of bond principal is an expenditure in the governmental funds, but the repayment reduces long-term liabilities in the statement of net position.
General obligation debt 1,750,000 Tax increment debt 730,000 Special assessment debt 1,410,961 Notes payable 5,366 3,896,327
Internal service funds are used by management to charge the costs of certain activities, such as fleet management, insurance and telecommunication, to individual funds. The net revenue (expense)
of certain internal service funds is reported with governmental activities. 1,161,904
Some expenses reported in the statement of activities, do not require the use of current financialresources and, therefore, are not reported as expenditures in the governmental funds.
Compensated absences (498,970) Other post-employment benefits 1,416,425 Net Pension Liability 3,181,971 Interest and amortization expenses 2,387 4,101,813
Change in net position of governmental activities 1,076,695$
The notes to the financial statements are an integral part of this statement.
For The Fiscal Year Ended June 30, 2019(Page 2 of 2)
CITY OF BILLINGS, MONTANAReconciliation of the Statement of Revenues, Expenditures, and Changes in Fund Balances of
Governmental Funds to the Statement of Activities

21
Solid Waste Fund Airport Fund Water Fund
Wastewater Fund Parking Fund
Nonmajor Enterprise
Funds TotalInternal
Service FundsAssets
Current assets: Cash and cash equivalents 14,859,388$ 6,177,724$ 16,938,284$ 19,907,599$ 217,667$ 1,096,207$ 59,196,869$ 7,088,293$ Restricted cash and cash equivalents with fiscal agent 313,590 1,336,166 1,379,076 3,399,018 - - 6,427,850 - Investments 21,491,729 8,950,229 24,567,838 28,944,044 308,683 1,298,557 85,561,080 10,294,544 Receivables: Property taxes - - - - - 85,631 85,631 - Accounts and unbilled usage 1,667,928 822,778 6,197,314 2,565,768 7,327 25,736 11,286,851 32,025 Accrued interest 45,139 40,073 114,572 134,487 1,328 5,560 341,159 46,385 Notes - - - - - - - 120,000 Receivables from other governments - 788,022 - - - 59,560 847,582 - Inventories - 38,142 1,300,940 - - 147,949 1,487,031 230,966 Prepaid items - - - 645 - 5,886 6,531 14,430 Total current assets 38,377,774 18,153,134 50,498,024 54,951,561 535,005 2,725,086 165,240,584 17,826,643Noncurrent assets: Notes receivable - - - - - - - 280,000 Restricted investments with trustee 3,367,124 - - - - - 3,367,124 - Property and equipment: Land 493,448 3,402,517 1,799,888 959,585 5,665,085 1,435,291 13,755,814 1,989,883 Buildings 188,095 33,444,394 23,239,120 17,020,664 36,539,190 9,735,833 120,167,296 9,381,235 Improvements other than buildings 10,008,380 111,601,541 1,149,944 2,810,810 400,568 1,005,756 126,976,999 2,384,792 Equipment and vehicles 17,738,755 17,280,226 16,390,909 13,920,893 517,642 9,279,962 75,128,387 8,415,553 Infrastructure - - 255,426,772 189,583,935 - - 445,010,707 - Construction in progress 4,695,445 3,685,625 2,486,720 63,317,208 - 210,608 74,395,606 173,179 Less: accumulated depreciation (14,465,833) (111,896,799) (120,861,280) (94,740,545) (15,787,121) (14,125,038) (371,876,616) (11,771,584) Total noncurrent assets 22,025,414 57,517,504 179,632,073 192,872,550 27,335,364 7,542,412 486,925,317 10,853,058 Total assets 60,403,188 75,670,638 230,130,097 247,824,111 27,870,369 10,267,498 652,165,901 28,679,701
Deferred Outflows Bond refunding - 11,076 - - - - 11,076 - Other post employment benefits 187,592 160,549 172,750 130,408 37,719 166,384 855,402 223,444 Pensions 890,989 796,422 895,621 700,265 131,690 697,181 4,112,168 1,491,494Total assets and deferred outflows 61,481,769$ 76,638,685$ 231,198,468$ 248,654,784$ 28,039,778$ 11,131,063$ 657,144,547$ 30,394,639$
(continued)
CITY OF BILLINGS, MONTANAProprietary Funds
Statement of Net Position (Page 1 of 2) June 30, 2019
Business-type Activities

22
Solid Waste Fund Airport Fund Water Fund
Wastewater Fund Parking Fund
Nonmajor Enterprise
Funds TotalInternal
Service FundsLiabilities
Current liabilities: Accounts payable 2,280,660$ 292,487$ 2,271,694$ 5,780,409$ 30,989$ 118,654$ 10,774,893$ 558,732$ Accrued wages and benefits 230,286 172,042 205,157 164,848 30,204 207,776 1,010,313 271,113 Compensated absences 619,833 544,534 549,764 524,426 47,714 410,448 2,696,719 1,130,366 Accrued interest payable - - 329,076 178,218 76,812 - 584,106 19,800 Incurred but not reported health benefits - - - - - - - 767,796 Notes payable - 90,403 2,114,000 1,087,000 148,475 - 3,439,878 425,000 Unearned Revenue - - - - - - - 5,587 Accrued interest payable from restricted assets 313,590 137,595 - 1,205,800 - - 1,656,985 - Revenue bonds payable from restricted assets - 1,205,000 - 1,475,000 - - 2,680,000 - Total current liabilities 3,444,369 2,442,061 5,469,691 10,415,701 334,194 736,878 22,842,894 3,178,394Noncurrent liabilities: Compensated absences 167,429 147,090 148,503 141,658 12,888 110,871 728,439 305,337 Other post employment benefits 617,981 538,041 607,450 405,838 135,520 556,360 2,861,190 684,706 Net pension liability 3,868,123 3,457,570 3,888,234 3,040,118 571,716 3,026,730 17,852,491 6,475,142 Revenue bonds payable 23,338,127 4,979,227 - 57,040,789 - - 85,358,143 - Notes payable - 709,059 22,085,000 11,321,000 2,260,914 - 36,375,973 1,658,908 Landfill closure and postclosure-payable from restricted assets 3,504,776 - - - - - 3,504,776 - Total noncurrent liabilities 31,496,436 9,830,987 26,729,187 71,949,403 2,981,038 3,693,961 146,681,012 9,124,093 Total liabilities 34,940,805 12,273,048 32,198,878 82,365,104 3,315,232 4,430,839 169,523,906 12,302,487
Deferred Inflows Other post employment benefits 222,729 183,437 203,103 152,941 45,639 195,992 1,003,841 279,973 Pensions 566,641 506,499 569,587 445,347 83,751 443,386 2,615,211 948,544 Total deferred inflows of resources 789,370 689,936 772,690 598,288 129,390 639,378 3,619,052 1,228,517
Net PositionNet investment in capital assets 12,244,343 50,533,815 155,433,073 122,272,049 24,925,975 7,542,412 372,951,667 8,489,150Restricted for: Bond and notes payable ordinance reserve 1,547,825 2,688,344 1,386,571 1,444,291 - - 7,067,031 - Capital Projects 16,924,180 2,456,536 - 323,288 - - 19,704,004 -Unrestricted (4,964,754) 7,997,006 41,407,256 41,651,764 (330,819) (1,481,566) 84,278,887 8,374,485Total net position 25,751,594 63,675,701 198,226,900 165,691,392 24,595,156 6,060,846 484,001,589 16,863,635Total liabilities, deferred inflows, and net position 61,481,769$ 76,638,685$ 231,198,468$ 248,654,784$ 28,039,778$ 11,131,063$ 30,394,639$
Adjustment to reflect the consolidation of internal service fund activites related to enterprise funds 6,135,797Net position of business-type activities 490,137,386$
The notes to the financial statement are an intregral part of this statement
Proprietary FundsStatement of Net Position (Page 2 of 2)
June 30, 2019Business-type Activities
CITY OF BILLINGS, MONTANA

23
Solid Waste Fund Airport Fund Water Fund
Wastewater Fund Parking Fund
Nonmajor Enterprise
Funds TotalsInternal
Service FundsOperating revenues: Charges for services 15,392,848$ 10,740,431$ 25,327,493$ 23,968,173$ 1,729,710$ 1,184,674$ 78,343,329$ 25,179,736$ Operating expenses: Salaries and benefits 5,575,909 4,555,634 4,782,295 3,887,278 782,944 4,400,409 23,984,469 8,046,886 Supplies 2,469,202 1,167,991 2,418,221 1,488,074 95,235 862,580 8,501,303 332,646 Contracted services 2,108,189 811,357 2,904,573 1,443,186 457,984 355,793 8,081,082 12,354,157 Utilities 83,537 720,847 1,682,898 1,494,625 82,209 122,880 4,186,996 570,396 Other 844,979 270,345 467,901 463,317 80,786 191,378 2,318,706 2,441,763 Depreciation 2,617,110 5,236,605 7,089,996 4,573,433 821,178 679,056 21,017,378 854,830 Landfill closure and post-closure 150,204 - - - - - 150,204 - Total operating expenses 13,849,130 12,762,779 19,345,884 13,349,913 2,320,336 6,612,096 68,240,138 24,600,678 Operating income (loss) 1,543,718 (2,022,348) 5,981,609 10,618,260 (590,626) (5,427,422) 10,103,191 579,058Nonoperating revenue (expenses): Taxes - - - - - 2,264,225 2,264,225 25,127 Intergovernmental 86,458 207,259 86,907 67,951 12,779 1,001,016 1,462,370 - Interest expense (313,590) (325,715) (671,650) (2,401,544) (109,806) - (3,822,305) (42,319) Interest and investment income 500,981 368,376 1,089,665 1,439,324 12,230 60,420 3,470,996 390,442 Customer Facility Charge - 881,223 - - - - 881,223 - Passenger Facility Charge - 1,161,426 - - - - 1,161,426 - Gain (loss) on sale of capital assets 7,500 1,683 143,564 2,078 - 15,061 169,886 3,041 Other 4,066 92,908 11,303 3,497 965 42,728 155,467 199,028 Total nonoperating revenue (expense) 285,415 2,387,160 659,789 (888,694) (83,832) 3,383,450 5,743,288 575,319
Income (loss) before capital contributions and transfers 1,829,133 364,812 6,641,398 9,729,566 (674,458) (2,043,972) 15,846,479 1,154,377
Capital contributions - 2,734,270 124,218 312,757 - - 3,171,245 -Transfers in 3,300 - 8,450 - 100,000 - 111,750 491,320Transfers out - - - - - (20,000) (20,000) (106,745) Change in net position 1,832,433 3,099,082 6,774,066 10,042,323 (574,458) (2,063,972) 19,109,474 1,538,952Net position, beginning of year 23,919,161 60,576,619 191,452,834 155,649,069 25,169,614 8,124,818 15,324,683Net position, end of year 25,751,594$ 63,675,701$ 198,226,900$ 165,691,392$ 24,595,156$ 6,060,846$ 16,863,635$
Adjustment to reflect the consolidation of internal service fund activities related to enterprise funds 377,051Change in net position of business-type activities 19,486,525$
The notes to the financial statement are an intregral part of this statement
CITY OF BILLINGS, MONTANAProprietary Funds
Statement of Revenues, Expenses, and Changes in Fund Net PositionFor the Year Ended June 30, 2019
Business-type Activities

24
CITY OF BILLINGS, MONTANAProprietary Funds
Statement of Cash FlowsFor The Fiscal Year Ended June 30, 2019
Nonmajor InternalSolid Waste Airport Water Wastewater Parking Enterprise Service
Fund Fund Fund Fund Fund Funds Total FundsCash flows from operating activities:
Cash received from customers and users 15,501,090$ 10,697,684$ 24,845,217$ 23,761,238$ 1,737,218$ 1,196,872$ 77,739,319$ 717,898$ Cash received from interfund services provided - - - - - - - 24,528,223 Cash received from other sources - 92,908 148,399 3,497 - 1,500 246,304 176,973 Cash paid to employees for services (6,359,080) (4,420,152) (5,022,836) (4,604,628) (927,683) (5,039,628) (26,374,007) (7,916,579) Cash paid to suppliers and contracted services (5,056,135) (3,181,677) (6,266,650) (5,639,745) (618,785) (879,735) (21,642,727) (15,649,132) p
Net cash provided (used) by operating activities 4,085,875 3,188,763 13,704,130 13,520,362 190,750 (4,720,991) 29,968,889 1,857,383 Cash flows from noncapital financing activities:
Cash received from tax revenues - - - - - 2,311,052 2,311,052 - Cash received from intergovernmental revenues - 354,592 - - - 2,795,919 3,150,511 - Cash received from local community sponsors - 135,890 - - - - 135,890 - Transfers from other funds - - - - 100,000 - 100,000 - Transfers to other funds - - - - - (20,000) (20,000) (95,770)
Net cash provided (used) by noncapital f inancing activities - 490,482 - - 100,000 5,086,971 5,677,453 (95,770) Cash flows from capital and related financing activities:
Capital grants and contributions - 2,088,061 - - - - 2,088,061 - Acquisition and construction of capital assets (4,840,511) (5,971,028) (9,234,697) (28,879,515) (285,416) (333,123) (49,544,290) (512,648) Proceeds from sales of capital assets - 1,683 7,564 2,078 - 15,061 26,386 73,041 Cash paid for interest - (329,938) (698,460) (2,811,860) (113,705) - (3,953,963) (67,201) Principal paid on bonds, notes and capital leases payable - (1,246,080) (2,058,000) (2,492,000) (142,075) - (5,938,155) (409,999) Proceeds from bonds, including premium 22,799,247 - - - - - 22,799,247 (10,975) Transfers from other funds 3,300 - 8,450 - - - 11,750 491,320 Facilities charges - 2,033,604 - - - - 2,033,604 - Net cash provided (used) by capital and related f inancing activities 17,962,036 (3,423,698) (11,975,143) (34,181,297) (541,196) (318,062) (32,477,360) (436,462)
Cash flows from investing activities:Cash received from interest 402,868 276,512 811,322 1,140,696 9,492 46,444 2,687,334 284,986 Sale of investments 8,520,342 9,627,962 25,584,121 43,655,953 479,178 1,247,472 89,115,028 10,526,519 Purchase of investments (20,226,237) (9,024,060) (24,634,189) (27,222,387) (276,192) (1,065,465) (82,448,530) (10,352,778)
Net cash provided (used) by investing activities (11,303,027) 880,414 1,761,254 17,574,262 212,478 228,451 9,353,832 458,727 Net increase (decrease) in cash and cash equivalents 10,744,884 1,135,961 3,490,241 (3,086,673) (37,968) 276,369 12,522,814 1,783,878
Cash and cash equivalents, beginning of year 4,428,094 6,377,929 14,827,119 26,393,290 255,635 819,838 53,101,905 5,304,415 Cash and cash equivalents, end of year 15,172,978$ 7,513,890$ 18,317,360$ 23,306,617$ 217,667$ 1,096,207$ 65,624,719$ 7,088,293$
Cash and cash equivalents consists of:Cash and cash equivalents 14,859,388$ 6,177,724$ 16,938,284$ 19,907,599$ 217,667$ 1,096,207$ 59,196,869$ 7,088,293$ Restricted cash and cash equivalents w ith f iscal agent 313,590 1,336,166 1,379,076 3,399,018 - - 6,427,850 -
Cash and cash equivalents, end of year 15,172,978$ 7,513,890$ 18,317,360$ 23,306,617$ 217,667$ 1,096,207$ 65,624,719$ 7,088,293$
(continued)
(Page 1 of 2)

25
CITY OF BILLINGS, MONTANAProprietary Funds
Statement of Cash FlowsFor The Fiscal Year Ended June 30, 2019
Nonmajor InternalSolid Waste Airport Water Wastewater Parking Enterprise Service
Fund Fund Fund Fund Fund Funds Total FundsReconciliation of operating income to net cash
provided (used) by operating activities:Operating income (loss) 1,543,718$ (2,022,348)$ 5,981,609$ 10,618,260$ (590,626)$ (5,427,422)$ 10,103,191$ 579,058$ Other nonoperating income (expense) 4,064 92,908 148,399 5,575 965 57,789 309,700 227,196 Adjustments to reconcile operating income (loss) to net
cash provided (used) by operating activities: Depreciation expense 2,617,110 5,236,605 7,089,996 4,573,433 821,178 679,056 21,017,378 854,830 Landfill closure and postclosure 150,204 - - - - - 150,204 - (Increase) decrease in receivables 108,242 (42,746) (578,150) (209,013) 7,508 (5,140) (719,299) 7,148 (Increase) decrease in inventories - 11,214 (47,690) - - 17,494 (18,982) 3,637 (Increase) decrease in prepaid items - - - - - (156) (156) (15) Increase (decrease) in accounts payable 449,772 (222,349) 1,350,507 (750,543) (30,251) 46,390 843,526 199,389 Increase (decrease) in accrued liabilities (787,235) 135,479 (240,541) (717,350) (18,024) (89,002) (1,716,673) (13,860)
Net cash provided (used) by operating activities 4,085,875$ 3,188,763$ 13,704,130$ 13,520,362$ 190,750$ (4,720,991)$ 29,968,889$ 1,857,383$ Noncash investing, capital and financing activities:
Increase (decrease) in investment market value 82,075 87,968 254,438 298,628 2,710 13,976 739,795 93,611 Contribution of capital assets - - 124,218 312,757 - - 436,975 -
The notes to the f inancial statements are an integral part of this statement.
(Page 2 of 2)

26
CITY OF BILLINGS, MONTANAFiduciary Funds
Statement of Fiduciary Net PositionJune 30, 2019
AgencyFunds
AssetsCash and cash equivalents 602$
Total assets 602$
LiabilitiesAccounts payable 602$
Total liabilities 602$
The notes to the financial statements are an integral part of this statement.

NOTES TO FINANCIAL STATEMENTS
CITY OF BILLINGS, MONTANA
Notes to Financial Statements
27
I. Summary of Significant Accounting Policies
The financial statements of the City of Billings (the City) have been prepared in conformity with generally accepted accounting principles (GAAP) as applied to government units. The Governmental Accounting Standards Board (GASB) is the accepted standard-setting body for establishing governmental accounting and financial reporting principles. The City’s significant accounting policies are described below. A. Reporting Entity
The City of Billings financial statements include those separate governmental entities that are controlled by or are dependent on the City. The determination to include separate governmental entities is based on the criteria of Governmental Accounting Standards Board (GASB) Statement No. 61. GASB Statement No. 61 defines the reporting entity as the primary government and those component units for which the primary government is financially accountable. To be financially accountable, a voting majority of the organization’s governing body must be appointed by the City, and either a) the City must be able to impose its will, or b) the City may potentially benefit financially or be financially responsible for the organization. Blended component units, although legally separate entities, are, in substance, part of the City’s operations. Data from these units are combined with data of the primary government. Blended Component Unit – The Par 3 Golf Course (Golf Course) is governed by the City Council. Debt issuance authorizations are approved by the City Council. The Golf Course is reported as an enterprise fund. Complete financial statements for the Golf Course may be obtained at the entity’s administrative offices:
Par 3 Golf Course: 19 South 19th Street West, Billings, MT 59102 The City has no discretely presented component units.
The City provides a full range of municipal services. Included are parks and recreation, streets and traffic control, sanitation, public transit, airport, water, wastewater, library, community development, public safety (police and fire protection), and general administrative services.
CITY OF BILLINGS, MONTANA
Notes to Financial Statements
28
Related Organization – The City Council is responsible for appointing the members of the governing boards of the Billings Housing Authority. The City Council approves through resolution the Tourism Business Improvement District (TBID) and the Downtown Business Improvement District (DBID) annual budgets. However, the City is not able to impose its will on the three entities. Nor is there a potential for the three entities to provide specific financial benefits to, or impose specific financial burdens on, the City. As a result, the Billings Housing Authority, the TBID, and the DBID are considered related organizations and not component units of the City.
B. Government-wide and Fund Financial Statements
The goal of government-wide financial statements is to present a broad overview of a government’s finances. The basic statements that form the government-wide financial statements are the statement of net position and the statement of activities. These two statements report information on all of the activities of the City. For the most part, the effect of interfund activity has been removed from these statements. Governmental activities, which are normally financed through taxes and intergovernmental revenues, are reported separately from business-type activities, which are normally financed through user fees and charges for goods and services. The statement of activities reports gross direct expenses by function reduced by program revenues. This results in a measurement of net revenue or expense for each of the government’s activities. Direct expenses are those that are clearly identifiable with a specific function. Program revenues are directly associated with the function or business-type activity and include a) charges for services and b) operating or capital grants and contributions that are restricted to a particular function. Taxes and other items not classified as program revenues are reported instead as general revenues. Separate financial statements are provided for governmental funds, proprietary funds, and fiduciary funds, although the latter are excluded from the government-wide financial statements. Major individual governmental funds and major individual enterprise funds are reported as separate columns in the fund financial statements.
C. Measurement Focus, Basis of Accounting, and Financial Statement Presentation
The government-wide and proprietary fund financial statements are reported using economic resources measurement focus and accrual basis of accounting. Revenues are recorded when earned, and expenses are recorded when a liability is incurred, regardless of the timing of related cash flows. Property taxes are recognized as revenues in the year for which they are levied. Grants and similar items are recognized as revenue as soon as all eligibility requirements imposed by the provider have been met.

CITY OF BILLINGS, MONTANA
Notes to Financial Statements
29
Governmental fund financial statements are reported using the current financial resources measurement focus and the modified accrual basis of accounting. Under this method, revenues are recognized as soon as they are both measurable and available. Revenues are considered to be available when they are collectible within the current period or soon enough thereafter to pay liabilities of the current period. For this purpose, the City considers revenues to be available if they are collected within 60 days of the end of the current fiscal period. Expenditures generally are recorded when a liability is incurred, as under accrual accounting. However, debt service expenditures, as well as expenditures related to compensated absences and claims and judgments, are recorded only when payment is due. Taxes, intergovernmental revenue, charges for service, special assessments, and investment income associated with the current fiscal period are the major revenues that are considered to be susceptible to accrual and so have been recognized as revenue of the current fiscal period. Only the portion of special assessments receivable due within the current fiscal period is considered susceptible to accrual as revenue of the current period. All other revenue items are considered measurable and available only when cash is received by the City. The City reports the following major governmental funds: General Fund
The General Fund is used to account for resources traditionally associated with the government that are not required legally or by sound financial management to be accounted for in another fund. Public Safety The Public Safety Fund accounts for the Police Department operations, including the Animal Control, and the Fire Department operations. Major revenue sources include property taxes, intergovernmental and transfers from the General Fund.
The City reports the following major proprietary funds:
Solid Waste Fund The Solid Waste Fund accounts for the operations of the City’s garbage collection and landfill activities.

CITY OF BILLINGS, MONTANA
Notes to Financial Statements
30
Airport Fund
The Airport Fund accounts for the Billings Logan International Airport operations and for all the resources received and used for acquisition and development of airport capital improvements and equipment. Water Fund The Water Fund accounts for the operations of the City’s water system. Wastewater Fund The Wastewater Fund accounts for the operations of the City’s wastewater system. Parking Fund The Parking Fund accounts for the operations of the City’s public parking, which includes four parking garages and on-street parking in the downtown district.
In addition, the City reports for the following fund types: Internal Service Funds
The internal service funds account for fleet services, postage and copying, information technology, health care benefits, telephone services, liability and property insurance, radio communication services, facilities management, public works administration, and public works engineering on a cost reimbursement basis. Fiduciary Funds The fiduciary funds are used to account for assets held by the City as an agent for private organizations or other governments. Agency funds are custodial in nature (assets equal liabilities) and do not involve measurement of results of operations. The City currently has four such funds including the Downtown Business Improvement District, Tourism Business Improvement

CITY OF BILLINGS, MONTANA
Notes to Financial Statements
31
District, and License Plate Fund. These funds receive money from either Yellowstone County or a trust fund, and the City remits the monies to the appropriate BID or grantee as prescribed by either state law or a grant agreement.
The City has prepared its government-wide and proprietary fund financial statements in accordance with all applicable GASB pronouncements. As a general rule, the City has eliminated the effect of interfund activity from the government-wide financial statements. Exceptions to this general rule are charges between the government’s water, wastewater, and solid waste functions and various other functions of the government. Elimination of these charges would distort the direct costs and program revenues reported for the various functions concerned. Other interfund activities not eliminated are indirect general and administrative costs that are allocated to other funds. Therefore, certain indirect costs are included in the program expenses reported for individual functions and activities. Amounts reported as program revenues include: 1) charges for services, 2) operating grants and contributions, and 3) capital grants and contributions, including special assessments. Internally dedicated resources are reported as general revenues rather than as program revenues. Likewise, general revenues include all taxes. Proprietary funds report operating revenues and expenses separately from non-operating items. Operating revenues and expenses generally result from providing services or producing and delivering goods in connection with a proprietary fund’s principal on-going operations. The principal operating revenues of the City’s enterprise funds and internal service funds are charges to customers for sales and services. The Transit fund also receives property tax revenue and operating grants to support its operations. Operating expenses for enterprise funds and internal service funds include the costs of sales and services, administrative expenses, and depreciation on capital assets. All revenues and expenses not meeting this definition are reported as non-operating revenues and expenses.
D. Assets, Deferred Inflows, Liabilities, Deferred Outflows, and Net Position or Equity 1. Cash and Cash Equivalents and Investments
The government’s cash and cash equivalents are considered to be cash on hand, demand deposits, and short-term investments with original maturities of three months or less from the date of acquisition.
CITY OF BILLINGS, MONTANA
Notes to Financial Statements
32
Generally, cash resources of the individual funds are combined to form a pool of cash and investments, which are managed by the City’s finance director. Investments and cash equivalents consist primarily of U.S. Treasury and U.S. agency obligations, certificate of deposits, and State of Montana Short-Term Investment Pool (STIP).
Certificates of deposit are reported at cost. Investments are carried at fair value in all funds. The fair value of investments is determined monthly and is based on current market prices. Changes in the fair value of investments are recognized in revenue at the end of each month.
Interest income earned as a result of pooling and changes in the fair value of investments are distributed to the appropriate funds utilizing a formula based on the average book value of cash and investments of each fund. According to GASB Statement No. 31, “Accounting and Financial Reporting for Certain Investments and External Investments Pools,” STIP is considered an external investment pool. The STIP investments are purchased in accordance with the statutorily mandated “Prudent Expert Principle.” This pool is managed to preserve principal, while obtaining money market-type returns and 24-hour liquidity. Funds may be invested for one or more days. Although not registered with the Securities and Exchange Commission (SEC) as an investment company, STIP is managed similar to money market funds that are governed by SEC rule 2a7 of the Investment Company Act of 1940. As a 2a7-like pool, the STIP utilizes an amortized cost unit value to report net assets. The portfolio may include asset-backed securities, commercial paper, corporate, U.S. Government direct obligations, U.S. Government agency securities, repurchase agreements, institutional money market funds, certificates of deposit, and variable-rate (floating-rate) instruments. Investments must have a maximum maturity of 397 days or less, unless they are variable rate security. The portfolio is carried at amortized cost or book value with a constant unit value of $1.00. Asset-backed securities represent debt securities collateralized by a pool of mortgage and non-mortgage assets, such as trade and loan receivables, equipment leases, credit cards, etc. Commercial paper is unsecured short-term debt with maturities ranging from 1 to 270 days. U.S. Government direct obligations include U.S. Treasury securities and debt explicitly guaranteed by the U.S. Government. U.S. Government agency securities include U.S. Government and mortgage-backed securities. Repurchase agreements (REPOs) represent an agreement between a seller and a buyer, usually of U.S. Government securities, whereby the seller agrees to repurchase the securities at an agreed upon price and stated time. Variable rate securities pay a variable rate of interest until maturity. The STIP portfolio’s variable rate securities reset to LIBOR (London Interbank Offered Rate).

CITY OF BILLINGS, MONTANA
Notes to Financial Statements
33
The City issues warrants in payment of its obligations. When the warrants are presented to the Finance department, the City transfers funds to redeem the warrants. Cash balances are reported net of outstanding warrants.
2. Receivables and Payables
All outstanding balances between funds are reported as “due to/from other funds” (current portion). Any residual balances outstanding between the governmental activities and business-type activities are reported as “internal balances.” Under its Home Rule Charter, the City is permitted to levy taxes at a maximum rate for payment for general governmental services and payment of principal and interest on long-term general obligation debt. The City is currently levying at the rate of 163.12 mills. All property within the City limits is assessed on taxable market value. Property taxes are in two installments, due on November 30 and May 31 of each fiscal year. Payments not received on or before these dates are considered delinquent and accrue interest at a monthly compounding rate of 5/6 of 1% per month from and after such delinquency until paid, plus 2% as a penalty. Property taxes are attached as an enforceable lien on the property. Notice of foreclosure is filed with the County Clerk and Recorder five years from the date of delinquency. Property tax revenue is budgeted for the ensuing fiscal year. Notes receivable are reported net of allowances for amounts deemed uncollectible. Allowances are computed from receivables net of amounts collected in the 60 days subsequent to June 30, 2019. Estimates for uncollectible amounts at June 30, 2019, based on net receivables are as follows: $40,000 for Downtown Revolving Loans based upon historical experience and 100% of notes receivable that are in default. Personal property tax is exempt from this process because an amount cannot be estimated, as this tax is not levied. There is no allowance calculated for real property taxes, as any uncollected amount results in a lien on the property. At yearend the City’s Water utility had an outstanding receivable from a major customer, Heights Water District, in the amount of $2,970,599. The City is currently working with the customer to obtain payment.

CITY OF BILLINGS, MONTANA
Notes to Financial Statements
34
3. Inventories and Prepaid Items
Inventories of supplies are recorded at cost. Inventories that are held for sale in proprietary funds are stated at the lower of cost (average cost method) or market. The cost of inventory is recorded as an expenditure at the time the inventory items are purchased in governmental funds. Certain payments to vendors reflect costs applicable to future accounting periods and are recorded as prepaid items in both government-wide and fund financial statements.
4. Restricted Assets
Governmental Activities: A portion of the proceeds from cemetery plot sales are classified as permanently restricted assets. State statutes require that the investment earnings from such permanently restricted assets are used for the care, maintenance, and improvement of such cemetery lots and the grounds, roads, walks, and avenues leading thereto. Business-type Activities:
Certain proceeds of the City’s enterprise funds, notes payable, and closure/post-closure costs for the landfill, as well as certain resources set aside for their repayment, are classified as restricted assets on the statement of net position. They are maintained in either separate bank accounts or a separate fund within the City’s pooled cash, and their use is limited by applicable covenants. In the Airport fund the “revenue bond operations and maintenance” account is used to report resources set aside to subsidize potential deficiencies from the City’s operation that could adversely affect debt service payments. The “revenue bond current debt service” account is used to segregate resources accumulated for debt service payments. The “revenue bond replacement and depreciation” account is used to report resources set aside to meet unexpected contingencies or to fund asset replacements.

CITY OF BILLINGS, MONTANA
Notes to Financial Statements
35
The Airport fund’s restricted assets consist of amounts restricted by bond covenants and Federal Aviation Administration (FAA) requirements. In Water and Wastewater, the notes payable ordinance reserve account is used to set aside resources from operations for debt service. The following table reports restricted assets:
Series 2010A Revenue Refunding Bonds Debt service reserve $ 764,000 Maintenance and operating reserve 1,199,300 Capital replacement reserve 225,000 Series 2010B Revenue Bonds Debt service reserve 500,044 Solid Waste Closure/Post-Closure 3,367,124 Series 2019 Solid Waste Revenue Bonds
Debt service reserve 1,547,825 Passenger Facility Charges 527,896 Customer Facility Charges 1,929,346 Transit Grantor Restriction 5,460 Total Restricted Assets $10,065,995
5. Capital Assets
Capital assets, which include property, plant, equipment, and infrastructure assets (e.g., roads, bridges, sidewalks, and similar items), are reported in the applicable governmental or business-type activities columns in the government-wide financial statements. Capital assets are defined by the City as assets with an initial, individual cost equal to or greater than $5,000 for equipment and vehicles and $25,000 for construction projects including non-building, building, and infrastructure. In the case of the initial capitalization of general infrastructure assets (i.e. those reported by governmental activities), the City chose to include assets from 1980 forward to comply with GASB 34. The City estimated historical cost for the initial reporting of these assets through back trending (i.e. estimating the current replacement cost of the infrastructure to be capitalized and using an appropriate price-level index to deflate the cost to the acquisition year or estimated acquisition year). As the City constructs or acquires additional capital assets each period, including infrastructure assets, they are capitalized and reported at historical cost. Donated capital assets are recorded at estimated acquisition value at the date of donation. The costs of normal maintenance and repairs that do not add to the value of the asset or materially extend lives are not capitalized.

CITY OF BILLINGS, MONTANA
Notes to Financial Statements
36
Property and equipment of the government are depreciated using the straight-line method over the following estimated useful lives:
Asset Years
Buildings 5-50Improvements other than buildings 5-50Equipment and vehicles 3-30Infrastructure 10-50
6. Property Held for Resale
Property purchased for Urban Renewal Development is reported at the lower of cost or estimated net realizable value in the Special Improvement Districts Debt Service Fund and nonmajor governmental funds.
7. Compensated Absences
Employees earn vacation leave at the rate of 120 hours per year for the first 10 years. During years 11 to 21, employees earn vacation leave at an increasing rate, reaching 192 hours in year 21. There is no requirement that annual leave be taken, but the maximum permissible accumulation is two times the annual accrual as of the first pay period in January. Full time employees earn 96 hours of sick leave per year, which may be accumulated without limit. Upon separation, employees are paid 25% of the remaining balance at their current rate of pay. All accumulated vacation and 25% of accumulated sick leave are accrued when incurred in the government-wide and proprietary financial statements. This liability, which totals $12,158,327 at June 30, 2019, includes the related FICA, Medicare, and retirement costs. The unrecorded accumulated sick leave benefits total $10,542,694 at June 30, 2019.
8. Long-term Obligations
In the government-wide financial statements and in the proprietary fund type financial statements, long-term debt and other long-term obligations, such as notes payable, are reported as liabilities in the applicable governmental activities, business-type activities, or proprietary fund type statement of net position. Bond premiums and discounts are deferred and amortized over

CITY OF BILLINGS, MONTANA
Notes to Financial Statements
37
the life of the bonds, on a straight-line basis, over the term of the related issue. Bonds payable are reported net of the applicable bond premium or discount. In the fund financial statements, governmental fund types recognize bond premiums and discounts, as well as bond issuance costs, during the current period. The face amount of the debt is reported as other financing sources. Discounts on debt issuances are reported as other financing uses, while bond premiums are reported as other financing sources. Issuance costs, whether or not withheld from the actual debt proceeds, are reported as debt service expenditures.
9. Pensions
The Montana Public Employee Retirement Administration (MPERA) prepares its financial statements using the accrual basis of accounting. For the purposes of measuring the Net Pension Liability, deferred inflows of resources and deferred outflows of resources related to pensions, and Pension Expense, information about the fiduciary net position and additions to/deductions from fiduciary net position have been determined on the same accrual basis as they are reported by MPERA. Investments are reported at fair value. MPERA adheres to all applicable Governmental Accounting Standards Board (GASB) statements.
10. Fund Balance
Governmental funds fund balances can be classified into five categories. The categories are unspendable, restricted, committed, assigned and unassigned. The following table displays the City’s fund balances by major purpose as displayed on page 16 of the governmental funds balance sheet. GASB Statement 54 requires the disclosure of the purpose of each major fund.

CITY OF BILLINGS, MONTANA
Notes to Financial Statements
38
MajorSpecial Revenue
AllOther Total
General Public Governmental GovernmentalFund Safety Funds Funds
UnspendableCemetery Perpetual Care -$ -$ 744,329$ 744,329$ Nonspendable form - - 161,238 161,238
RestrictedBuilding Inspection - - 2,463,242 2,463,242 Tax Increment Districts - - 11,557,892 11,557,892 Roads and Streets - - 12,453,899 12,453,899 Grants - - 1,960,401 1,960,401 Cemetery Improvements - - 167,396 167,396 Emergency 911 - - 2,979,005 2,979,005 Public Safety - 1,471,734 - 1,471,734 Planning - - 678,190 678,190 Library - - 1,557,799 1,557,799 Street & Traffic - - 4,281,812 4,281,812 Light Maintenance Districts - - 1,740,942 1,740,942 Park Maintenance Districts - - 4,612,404 4,612,404 Sidewalk Hazard Repair - - 91,346 91,346 Debt Service - - 7,798,142 7,798,142 Capital Projects - - 9,368,244 9,368,244
CommittedGeneral Government 12,723,390 - - 12,723,390 Arterial - - 4,584,191 4,584,191 Park Programs - - 2,353,229 2,353,229 Animal Shelter Donations - - 39,170 39,170 Library - - 1,381,445 1,381,445 Downtown Revolving Loan - - 553,528 553,528 Ball Field Maintenance - - 329,857 329,857
UnassignedGeneral Government 9,676,408 - - 9,676,408 Grants - - (54,483) (54,483) Capital Projects - - (191,607) (191,607)
Total Fund Balances 22,399,798$ 1,471,734$ 71,611,611$ 95,483,143$
CITY OF BILLINGS, MONTANA
Notes to Financial Statements
39
The unspendable category includes balances that cannot be spent, because the balance is not in a spendable form or there are legal or contractual restrictions on the balance. The restricted category contains balances that are restricted for specific purposes by enabling legislation, external resource providers such as creditors or grantors, or laws or regulations of other governments. The committed category contains balances pursuant to constraints imposed by formal action of the government’s highest level of decision-making authority. The Billings City Council is that authority that makes these commitments by passing an ordinance or resolution. Resolution number 10-18914 was passed by City Council designating committed fund balances:
“Exhibit A
“Recommended Fund and Working Capital Balances Policy
“Recommended Fund and Working Capital Balances policy statement:
“The City shall use recommended Fund and Working Balances for certain funds as a best practice. Fund Balance (“Assigned”) and Working Capital Balance (“Assigned”) will be the designations for accounting purposes.
“Recommended balances purpose:
“The policy is necessary to provide sufficient cash flow for daily financial needs, secure and maintain investment grade bond ratings, offset revenue shortfalls, and provide funds for unforeseen expenditures related to emergencies.
“Recommended balances implementation authority: “Upon adoption of this Statement of Policy, the City of Billings Council authorizes the City Administrator to establish recommended balance procedures which may be necessary to support the policy statement and adopt such documents by Administrative Order. The City Administrator
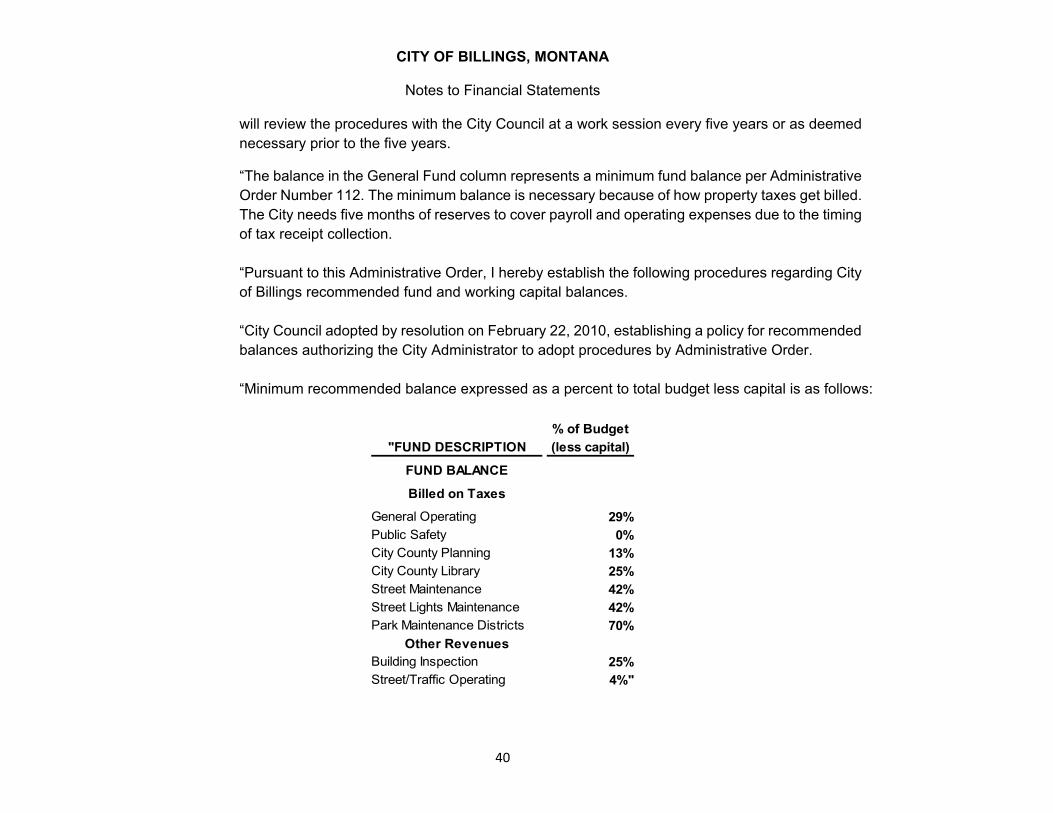
CITY OF BILLINGS, MONTANA
Notes to Financial Statements
40
will review the procedures with the City Council at a work session every five years or as deemed necessary prior to the five years.
“The balance in the General Fund column represents a minimum fund balance per Administrative Order Number 112. The minimum balance is necessary because of how property taxes get billed. The City needs five months of reserves to cover payroll and operating expenses due to the timing of tax receipt collection. “Pursuant to this Administrative Order, I hereby establish the following procedures regarding City of Billings recommended fund and working capital balances. “City Council adopted by resolution on February 22, 2010, establishing a policy for recommended balances authorizing the City Administrator to adopt procedures by Administrative Order. “Minimum recommended balance expressed as a percent to total budget less capital is as follows:
% of Budget"FUND DESCRIPTION (less capital)
FUND BALANCE
Billed on TaxesGeneral Operating 29%Public Safety 0%City County Planning 13%City County Library 25%Street Maintenance 42%Street Lights Maintenance 42%Park Maintenance Districts 70%
Other RevenuesBuilding Inspection 25%Street/Traffic Operating 4%"

CITY OF BILLINGS, MONTANA
Notes to Financial Statements
41
The assigned category is for balances constrained by an official who the governing body has delegated the authority to assign amounts to be used for specific purposes. The City Administrator is the official that would assign amounts for specific purposes per the City Charter. The unassigned category is the residual classification for the General Fund. A negative unassigned fund balance occurs when expenditures exceed amounts that are unspendable, restricted, and committed fund balances. The Library Fund has amounts in the restricted and committed categories. The restricted portion is the part of fund balance that voters approved through specific mills. The committed portion of fund balance is part of the City’s general mills that City Council has authorized to go to the Library. There is no distinction between the two regarding expenditures as they both are available for operations. The General Fund has amounts in the committed and unassigned categories. The flow assumption for the General Fund is that the unassigned balance is used for expenditures first. The Public Safety Fund has amounts restricted for Police, Fire, and Animal control purposes. In accordance with GASB 54, fund balances are classified as unspendable, restricted, committed, and unassigned. When expenditures are incurred, the City will determine, on a case-by-case basis, which classification of funds are to be used, taking into account any requirements of grant agreements, contracts, business circumstances, and other constraints. If no restrictions exist, the order of spending of resources will be unassigned, committed, and lastly, restricted.
11. Deferred Outflows/Inflows of Resources
In addition to assets, the statement of net position will sometimes report a separate section for deferred outflows of resources. This separate financial statement element, deferred outflows of resources, represents a consumption of net position that applies to a future period(s) and so will not be recognized as an outflow of resources (expense/expenditure) until then. The government has three items that qualify for reporting in this category. They are the deferred charge on refunding, the deferred amount related to pensions, and the deferred amount related to other post-employment benefits,

CITY OF BILLINGS, MONTANA
Notes to Financial Statements
42
as a result of the adoption of GASB 75. These are reported in the government-wide statement of net position. A deferred charge on refunding results from the difference in the carrying value of refunded debt and its reacquisition price. This amount is deferred and amortized over the shorter of the life of the refunded, or refunding, debt.
In addition to liabilities, the statement of net position will sometimes report a separate section for deferred inflows of resources. This separate financial statement element, deferred inflows of resources, represents an acquisition of net position that applies to a future period(s) and so will not be recognized as an inflow of resources (revenue) until that time. The government has two items that qualify for reporting in this category. The item, unavailable revenue, is reported only in the governmental funds balance sheet. The governmental funds report deferred revenues from two sources: property taxes and special assessments. These amounts are deferred and recognized as an inflow of resources in the period the amounts become available. The items, pensions and OPEB, are reported only on the accrual statements, and are a result of the City’s adoption of GASB 68 and GASB 75.
The changes in net pension liability are recorded as deferred inflows of resources or deferred outflows of resources (that arise from changes in actuarial assumptions or other inputs and difference between expected or actual experience), are amortized over the weighted-average, remaining service life of all participants in the respective pension plan, and are recorded as a component of pension expense beginning with the period in which they are incurred.
Projected earnings on pension investments are recognized as a component of pension expense. Differences between projected and actual investment earnings are reported as deferred inflows of resources or deferred outflows of resources and are amortized as a component of pension expense on a closed basis over a five-year period beginning with the period in which the difference occurred. Each subsequent year will incorporate an additional closed five-year period of recognition.
E. New Accounting Pronouncements
The following Governmental Accounting Standards Board (GASB) Statements have been implemented in the current financial statements:
Statement No. 83 “Certain Asset Retirement Obligations.” The requirements for this statement are effective for the current reporting period.

CITY OF BILLINGS, MONTANA
Notes to Financial Statements
43
Statement No. 88 “Certain Disclosures Related to Debt, Including Direct Borrowings and Direct Placements.” The provisions of the statement are effective for the current reporting period.
Statement No. 89 “Accounting for Interest Cost Incurred Before the End of a Construction Period.” The provisions of the statement are effective with the next reporting period, but were early implemented in the current fiscal year.
II. Stewardship, Compliance, and Accountability
A. Deficit Fund Equity
Funds with deficit fund balances at June 30, 2019, are listed below. The deficit fund balances do not represent any type of legal violation.
Fund Deficit Nonmajor Special Revenue Funds:
Municipal Court Grants $ 54,483
Nonmajor Capital Projects Funds Sidewalk and Curb Districts 191,607
Internal Service Funds
Information Technology 701,697 Public Works Administration 984,044 Public Works Engineering 1,936,370
A transfer will eliminate the Municipal Court Grants and Sidewalk and Curb District deficit fund balances during Fiscal Year 2020. The proprietary funds deficit net position will be removed through increased revenues and anticipated federal grants. The internal service funds deficit net position will likely not be removed, as it is largely a result of the net pension and other post-employment benefits liabilities.

CITY OF BILLINGS, MONTANA
Notes to Financial Statements
44
III. Detailed Notes on All Funds
A. Cash and Cash Equivalents and Investments
Cash and investments as of June 30, 2019, consist of the following:
Deposits in local banks 35,218,838$ Outstanding checks and reconciling items (815,414) Montana State Short Term Investment Pool (STIP) 70,733,174
105,136,598$ Investments:
US Government and US Agency Obligations 144,769,202$ Certificates of deposits 10,609,461
155,378,663$ Cash and investments as of June 30, 2019, are classified in the statement of net position as follows: Cash and cash equivalents 104,833,301$ Cash and cash equivalents, permanently restricted 303,297
105,136,598$
Investments 151,572,503$ Investments, temporarily restricted 3,367,124 Investments, permanently restricted 439,036
155,378,663$
CITY OF BILLINGS, MONTANA
Notes to Financial Statements
45
Investments Authorized by the Montana Code and the City’s Investment Policy Under the City’s investment policy and in accordance with Montana law, the City is restricted to investing funds in specific types of investment instruments. The following are the types of permitted instruments:
U.S. government and U.S. agency obligations. Interest-bearing savings accounts, certificates of deposit, and time deposits insured by the Federal Deposit Insurance
Corporation of which are at least 50% collateralized. State of Montana Short Term Investment Pool (STIP). U.S. Government security money market mutual funds. Short-term discount obligations of the Federal National Mortgage Association. Repurchase agreements where there is a master repurchase agreement and collateral held by a third party.
Fair Value The City categorizes its fair value measurements within the fair value hierarchy established by generally accepted accounting principles. The hierarchy is based on the valuation inputs used to measure the fair value of the asset. Level 1 inputs are quoted prices in active markets for identical assets; Level 2 inputs are significant other observable inputs; Level 3 are significant unobservable inputs. The City has the following recurring fair value measurements as of June 30, 2019: U.S. Treasury securities of $142,177,634 using quoted market prices (Level 1 inputs) The remainder of the City’s investments are not required to be measured at fair value. Interest Rate Risk Interest rate risk is the risk that changes in market interest rates will adversely affect the fair value of an investment. Generally, the longer the maturity of an investment is, the greater the sensitivity its fair value will be to changes in market interest rates.

CITY OF BILLINGS, MONTANA
Notes to Financial Statements
46
The City’s investments are not highly sensitive to interest rate fluctuations. The City employs a “buy and hold” investment strategy whereby investments are held to maturity at which time the investment is redeemed at par. One way the City manages its exposure to interest rate risk is by purchasing a combination of shorter-term and longer-term investments and by timing cash flows from maturities, so a portion of the portfolio is maturing or coming close to maturity evenly, over time, as necessary to provide the cash flow and liquidity needed for operations.
12 Months or 13 to 24 25 to 60 Over 60Investment Type Totals Less Months Months Months
US Treasury Notes 2,591,568$ 133,410$ 1,880,485$ 577,673$ -$ US Government Agency Securities 142,177,634 58,107,688 55,744,325 28,325,621 - Certificates of Deposit 10,609,461 2,609,461 8,000,000 - -
155,378,663$ 60,850,559$ 65,624,810$ 28,903,294$ -$ Credit Risk Under the City’s investment policy, safety of principal is the foremost objective of the City of Billings. Each investment transaction shall seek first to ensure that capital losses are avoided, whether they are from securities defaults or erosion of market value. The investment portfolio for the City shall be designed to attain a market average rate of return throughout budgetary and economic cycles, taking into account the government’s investment risk constraints and the cash flow characteristics of the portfolio. Generally, credit risk is the risk that an issuer of an investment will not fulfill its obligation to the holder of the investment. This is measured by the assignment of a rating by a nationally recognized statistical rating organization. As of June 30, 2019, the City’s investments in U.S. Government Agency Securities were rated AAA by Moody’s Investors Service or by Standard and Poor. Of those not rated, there was an implied AAA rating. Although the Montana Short Term Investment Pool (STIP) investments have been rated by investments security type, STIP, as an external investment pool, has not been rated by the Nationally Recognized Statistical Rating Organizations. More information on STIP is available at the Montana Department of Commerce Board of Investments website at http://www.investmentmt.com/Programs/STIP.

CITY OF BILLINGS, MONTANA
Notes to Financial Statements
47
Concentration of Credit Risk The investment policy of the City contains no limitations on the amount that can be invested in any one issuer. Investments in any one issuer that represent 5% or more of the total City’s investments are as follows (other than STIP):
Issuer Investment Type Total Federal Farm Credit Federal agency securities 62,684,223 40.34%Federal Home Loan Bank Federal agency securities 29,660,345 19.09%Federal Home Loan Mortgage Corp. Federal agency securities 36,994,349 23.81%Federal National Mortgage Assn. Federal agency securities 12,839,075 8.26%US Bank Certificate of Deposit 8,000,000 5.15%
Custodial Credit Risk
Custodial credit risk for deposits is the risk that, in the event of the failure of a depository financial institution, the City will not be able to recover its deposits or will not be able to recover collateral securities that are in the possession of an outside party. As of June 30, 2019, the City had limited exposure to custodial credit risk, but within compliance with Montana Code Annotated 7-6-207.
City policy requires that the City obtain securities for the uninsured portion of the deposits as follows: 1) Securities equal 50% of such deposits if the institution in which the deposits are made has a net worth to total assets
ratio of 6% or more, or 2) Securities equal to 100% of the uninsured deposits if the institution in which the deposits are made has a net worth to
total assets ratio of less than 6%.
The custodial credit risk for investments is the risk that, in the event of the failure of the counterparty (e.g., broker-dealer) to a transaction, the City will not be able to recover the value of its investment or collateral securities that are in the possession of another party. City policy requires investments to be collateralized by the actual security held in safekeeping by the primary agent. As of June 30, 2019, none of the City’s investments are exposed to custodial credit risk because all counterparties provide insurance in excess of the investments held.

CITY OF BILLINGS, MONTANA
Notes to Financial Statements
48
Restricted Cash and Cash Equivalents with Fiscal Agent Cash of $14,296,883 is restricted by bond covenants or for specific purposes as follows: Current debt service: Nonmajor government funds 4,501,909Airport fund 1,336,166Water fund 1,379,076Wastewater fund 3,399,018Solid Waste 3,680,714 Total $14,296,883

CITY OF BILLINGS, MONTANA
Notes to Financial Statements
49
B. Receivables
Receivables as of year-end for the City’s individual major funds, nonmajor funds, and internal service funds in the aggregate are presented below. See footnote I, D, 2 regarding the collectability of accounts receivable.
Public Non-Major Internal Governmental General Safety Governmental Service Activities
Fund Fund Funds Funds TotalTaxes 629,083$ 526,368$ 684,426$ -$ 1,839,877$ Accounts 8,201 77,962 81,584 32,025 199,772 Special assessments 46,426 - 6,953,790 - 7,000,216 Accrued interest 47,708 2,780 173,636 46,385 270,509 Notes - - 2,184,011 400,000 2,584,011 From other governments - - 673,865 - 673,865 TOTAL 731,418$ 607,110$ 10,751,312$ 478,410$ 12,568,250$
Non-Major Business-typeSolid Waste Airport Water Wastewater Parking Enterprise Activities
Fund Fund Fund Fund Fund Funds TotalTaxes -$ -$ -$ -$ -$ 85,631$ 85,631$ Accounts 1,667,928 822,778 6,197,314 2,565,768 7,327 25,736 11,286,851 Accrued interest 45,139 40,073 114,572 134,487 1,328 5,560 341,159 From other governments - 788,022 - - - 59,560 847,582 TOTAL 1,713,067$ 1,650,873$ 6,311,886$ 2,700,255$ 8,655$ 176,487$ 12,561,223$

CITY OF BILLINGS, MONTANA
Notes to Financial Statements
50
Governmental funds report unavailable revenue in connection with receivables for revenues that are not considered to be available to liquidate liabilities of the current period. At the end of the current fiscal year, the various components of unavailable revenue reported in the governmental funds were as follows:
UnavailableDelinquent property taxes receivable:
General fund 158,341$ Public safety fund 120,790 Nonmajor governmental funds 314,006
Special assessments not yet due:General fund 34,668 Nonmajor governmental funds 6,168,669
Notes receivable not yet due:Nonmajor governmental funds 2,184,010
Total 8,980,484$
C. Operating Lease Receivable
The City’s Airport leases a portion of its property to commercial airlines, commercial air freight haulers, car rental companies, concessionaires, fixed-base operators who service the aviation industry, private hangar owners, Federal and State governmental agencies whose main function is wildland fire suppression, and the Transportation Security Agency. Lease agreements with the Airlines and certain U.S. Government agencies are cancelable; all other leases are non-cancelable. The Airport’s leases consist of the following: Cancelable:
Operating lease agreements with the airlines for landing fees and terminal building rentals are adjusted annually based on compensatory and residual formulas, which are defined in the lease agreement. The terminal building rents are

CITY OF BILLINGS, MONTANA
Notes to Financial Statements
51
calculated using a compensatory formula to recover certain operating, capital, and debt service costs. The landing fee rates are calculated based on a residual methodology by which landing fees plus terminal rents plus non-airline revenues cover all of the Airport’s costs. Thus, keeping the Airport fiscally whole each year. The lease terms are for the period of July 1, 2013, through June 30, 2019, and allow the lessee to terminate with 180 days’ written notice. Fiscal Year 2019 revenues for landing fees and terminal building rents totaled $1,179,305 and $2,236,451 respectively. Operating lease agreements with two U.S. Government agencies consist of leases for ground and building space. Each agreement allows the lessee to terminate with 60 days’ written notice. Each lease’s term is for a ten-year period – one ending August 31, 2022, and the other ending November 30, 2026. Fiscal Year 2019 payments totaled $207,558.
Non-cancelable: Fixed minimum rentals with annual increases based on CPI-U.
Agreements under which the Airport received revenue from the operation of concessions located on Airport property which provide for the payment of a fee based on the greater of an aggregated percentage of gross receipts or a guaranteed minimum. Payments contingent on gross receipts that are associated with these non-cancelable leases totaled $4,804,972 for the fiscal year ended June 30, 2019.
The acquisition costs and accumulated depreciation for the above described leased property follows:
Acquisition Accumulated
Cost DepreciationLand 90,768$ -$ Building 23,489,970 16,478,690 Improvements other than Buildings 5,650,200 2,561,204 Equipment 2,815,114 1,517,996 Total 32,046,052$ 20,557,890$
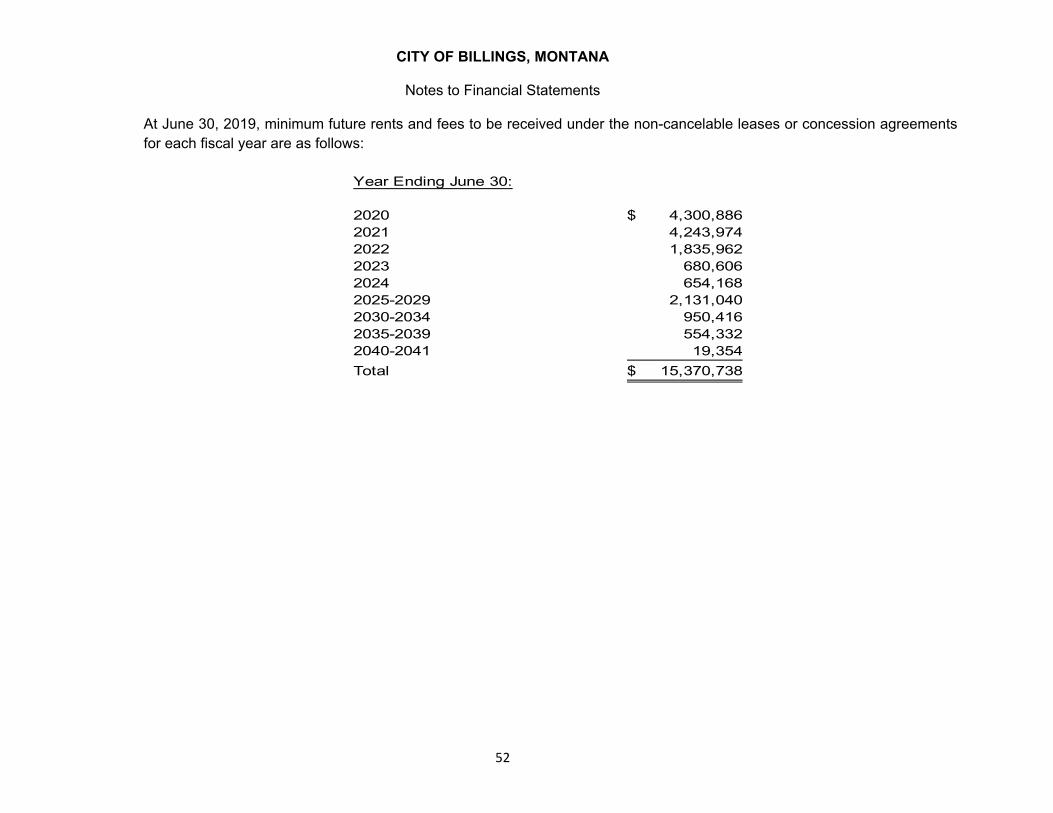
CITY OF BILLINGS, MONTANA
Notes to Financial Statements
52
At June 30, 2019, minimum future rents and fees to be received under the non-cancelable leases or concession agreements for each fiscal year are as follows:
Year Ending June 30:
2020 4,300,886$ 2021 4,243,974 2022 1,835,962 2023 680,606 2024 654,168 2025-2029 2,131,040 2030-2034 950,416 2035-2039 554,332 2040-2041 19,354 Total 15,370,738$

CITY OF BILLINGS, MONTANA
Notes to Financial Statements
53
D. Capital Assets
Capital asset activity for the year ended June 30, 2019, was as follows:
Governmental activities: Balance BalanceJune 30, 2018 Additions Deletions Transfer In/Out June 30, 2019
Capital assets not being depreciated:Land 44,294,991$ 934,814$ 25,226$ 330,876$ 45,535,455$ Construction in Progress 14,134,409 23,152,671 467,467 (31,253,874) 5,565,739
Total capital assets, not being depreciated 58,429,400 24,087,485 492,693 (30,922,998) 51,101,194 Capital assets being depreciated:
Buildings 37,435,684 866,555 - 6,740,514 45,042,753 Improvements other than Buildings 47,123,004 386,837 - 1,180,958 48,690,799 Equipment 43,719,974 1,730,582 659,685 53,995 44,844,866 Infrastructure 304,739,035 223,513 - 23,001,526 327,964,074
Total capital assets, being depreciated 433,017,697 3,207,487 659,685 30,976,993 466,542,492 Less accumulated depreciation for:
Buildings 13,229,332 1,034,746 - - 14,264,078 Improvements other than Buildings 17,541,560 1,647,119 - - 19,188,679 Equipment 28,563,807 3,053,033 641,497 53,995 31,029,338 Infrastructure 150,936,004 13,533,366 - - 164,469,370
Total accumulated depreciation 210,270,703 19,268,264 641,497 53,995 228,951,465 Total capital assets, being depreciated, net 222,746,994 (16,060,777) 18,188 30,922,998 237,591,027 Governmental activities capital assets, net 281,176,394$ 8,026,708$ 510,881$ -$ 288,692,221$
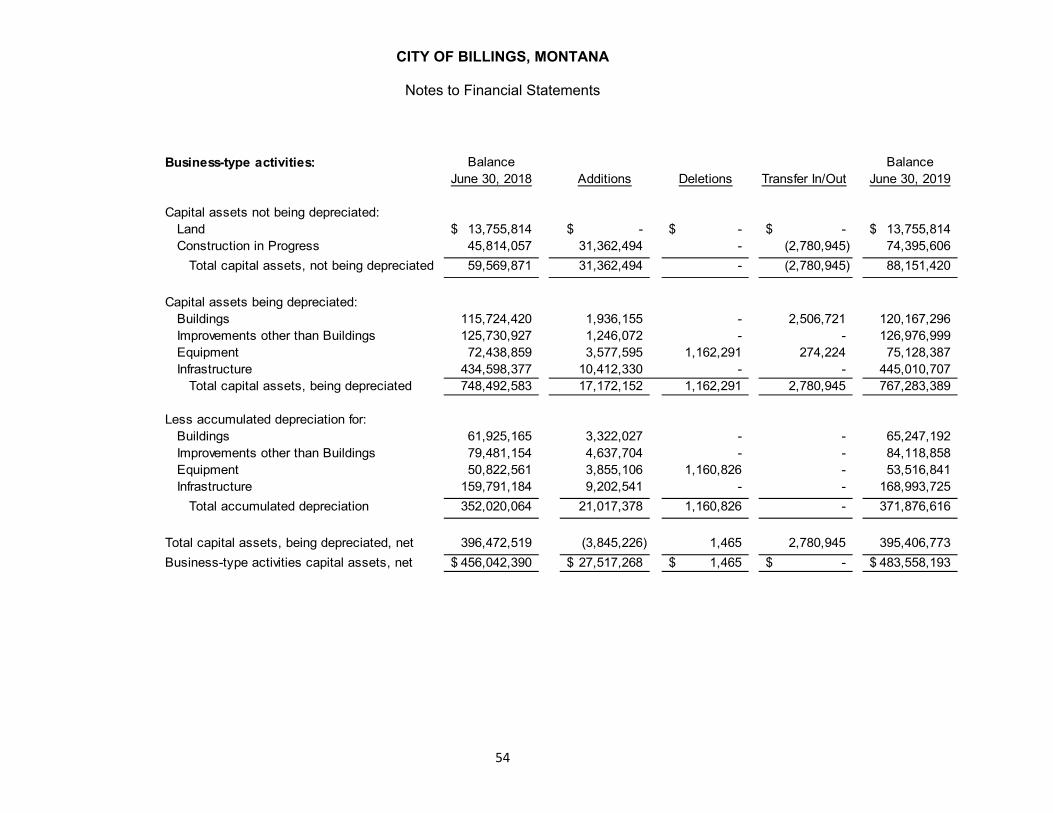
CITY OF BILLINGS, MONTANA
Notes to Financial Statements
54
Business-type activities: Balance BalanceJune 30, 2018 Additions Deletions Transfer In/Out June 30, 2019
Capital assets not being depreciated:Land 13,755,814$ -$ -$ -$ 13,755,814$ Construction in Progress 45,814,057 31,362,494 - (2,780,945) 74,395,606
Total capital assets, not being depreciated 59,569,871 31,362,494 - (2,780,945) 88,151,420
Capital assets being depreciated:Buildings 115,724,420 1,936,155 - 2,506,721 120,167,296 Improvements other than Buildings 125,730,927 1,246,072 - - 126,976,999 Equipment 72,438,859 3,577,595 1,162,291 274,224 75,128,387 Infrastructure 434,598,377 10,412,330 - - 445,010,707
Total capital assets, being depreciated 748,492,583 17,172,152 1,162,291 2,780,945 767,283,389
Less accumulated depreciation for:Buildings 61,925,165 3,322,027 - - 65,247,192 Improvements other than Buildings 79,481,154 4,637,704 - - 84,118,858 Equipment 50,822,561 3,855,106 1,160,826 - 53,516,841 Infrastructure 159,791,184 9,202,541 - - 168,993,725
Total accumulated depreciation 352,020,064 21,017,378 1,160,826 - 371,876,616
Total capital assets, being depreciated, net 396,472,519 (3,845,226) 1,465 2,780,945 395,406,773 Business-type activities capital assets, net 456,042,390$ 27,517,268$ 1,465$ -$ 483,558,193$

CITY OF BILLINGS, MONTANA
Notes to Financial Statements
55
Depreciation expense was charged to functions/programs of the government as follows:
Governmental activities:General Government 44,033$ Public Safety 1,432,833 Public Works 14,384,483 Public Health 148,071 Culture & recreation 2,327,779 Housing and community development 76,240 Capital assets held by the government's internal service funds are charged to the various functions based on their usage of the assets 854,830
Total depreciation expense - governmental activities 19,268,270$
Business-type activities:Solid Waste 2,617,110$ Airport 5,236,605 Water 7,089,996 Wastewater 4,573,433 Parking 821,178 Transit 610,203 Golf Course 68,853
Total depreciation expense - business-type activities 21,017,378$

CITY OF BILLINGS, MONTANA
Notes to Financial Statements
56
Construction Commitments The City has active construction projects as of June 30, 2019. At year-end, the City’s commitments with the contractors, rounded to the nearest thousand, are as follows:
General Fund 109$ Public Safety Fund 290 Solid Waste Fund 22,091 Airport Fund 3,107 Water Fund 9,137 Wastewater Fund 17,423 Nonmajor Enterprise Funds 444 Nonmajor Governmental Funds 11,268 Nonmajor Internal Services Funds 207
64,076$ Gas Tax, Storm Sewer assessments, and Arterial Fee assessments fund infrastructure. User fees and bonds finance Water, Wastewater, and Solid Waste projects. Grants, passenger facility charges, and charges for service fund Airport projects. Other Commitments At June 30, 2019, the Water fund had commitments of $3.0 million for Southside Triangle water line replacement. At June 30, 2019, the Wastewater fund had commitments of $12.4 million for the Water Reclamation Facility.
At June 30, 2019, the Streets fund had commitments of $1.2 million for Shiloh roundabouts landscaping.
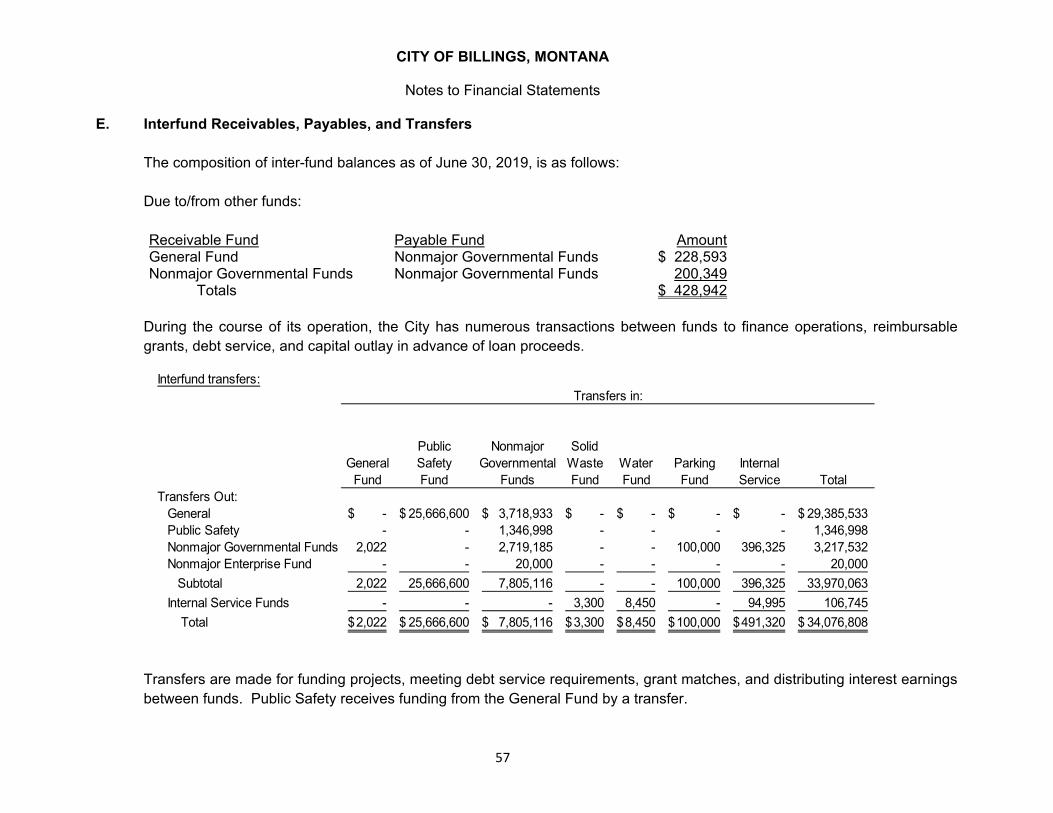
CITY OF BILLINGS, MONTANA
Notes to Financial Statements
57
E. Interfund Receivables, Payables, and Transfers
The composition of inter-fund balances as of June 30, 2019, is as follows: Due to/from other funds: Receivable Fund Payable Fund AmountGeneral Fund Nonmajor Governmental Funds $ 228,593Nonmajor Governmental Funds Nonmajor Governmental Funds 200,349
Totals $ 428,942 During the course of its operation, the City has numerous transactions between funds to finance operations, reimbursable grants, debt service, and capital outlay in advance of loan proceeds.
Interfund transfers:Transfers in:
Public Nonmajor SolidGeneral Safety Governmental Waste Water Parking Internal
Fund Fund Funds Fund Fund Fund Service TotalTransfers Out:
General -$ 25,666,600$ 3,718,933$ -$ -$ -$ -$ 29,385,533$ Public Safety - - 1,346,998 - - - - 1,346,998 Nonmajor Governmental Funds 2,022 - 2,719,185 - - 100,000 396,325 3,217,532 Nonmajor Enterprise Fund - - 20,000 - - - - 20,000
Subtotal 2,022 25,666,600 7,805,116 - - 100,000 396,325 33,970,063 Internal Service Funds - - - 3,300 8,450 - 94,995 106,745
Total 2,022$ 25,666,600$ 7,805,116$ 3,300$ 8,450$ 100,000$ 491,320$ 34,076,808$
Transfers are made for funding projects, meeting debt service requirements, grant matches, and distributing interest earnings between funds. Public Safety receives funding from the General Fund by a transfer.
CITY OF BILLINGS, MONTANA
Notes to Financial Statements
58
F. Capital Lease Obligations
Governmental Activities: Capital Lease Payable – Billings Operation Center – On March 1, 2003, the City entered into a capital lease to partially finance the construction of the Billings Operation Center. In 2013, the City paid in full this obligation and issued Certificates of Participation to refinance the Billings Operation Center. The term of the lease ends September 2023. Business-Type Activities: Capital Lease Payable – Park II (Business-Type Activities) – On September 1, 2006, the City signed a capital lease obligation to finance the construction of an expansion of the Park II Parking Garage which is a six level parking structure located in the heart of downtown Billings. In September 2012, Park 4 Garage was sold and the proceeds of the sale were applied to reduce the debt of the Park II loan. This reduced the remaining capital lease obligation from $4,756,651 to $2,640,384 and reduced interest expense by $780,057 over the life of the lease. Capital Lease Payable – Airport (Business-Type Activities) – On September 12, 2011, the City Council approved the Investment Grade energy audit findings. Because of this audit, the City undertook energy efficiency improvements to various buildings and facilities at the Airport and within certain City-owned parking garages. The City entered into an energy performance contract with McKinstry Essention Inc. to complete the improvements and signed a Purchase Lease Agreement with U.S. Bancorp to finance the improvements over the next 10 years.

CITY OF BILLINGS, MONTANA
Notes to Financial Statements
59
The assets acquired through capital leases are as follows:
Governmental Activities Business-type ActivitiesAssets:
Buildings 6,600,000$ 5,930,000$ Accumulated Depreciation (1,980,000) (2,339,056)
Total 4,620,000$ 3,590,944$
The following is a schedule, by year, of the future minimum lease payments at June 30, 2019: Year ending June 30 Governmental Activities Business-type Activities
2020 478,025 201,961 2021 475,125 201,961 2022 476,850 201,961 2023 473,200 201,961 2024 213,150 201,961 2025-2029 - 1,009,803 2030-2033 - 807,842
Total minimum lease payments 2,116,350 2,827,450 Less: Amount representing interest (136,350) (756,116)
Present value of minimum lease payments 1,980,000$ 2,071,334$
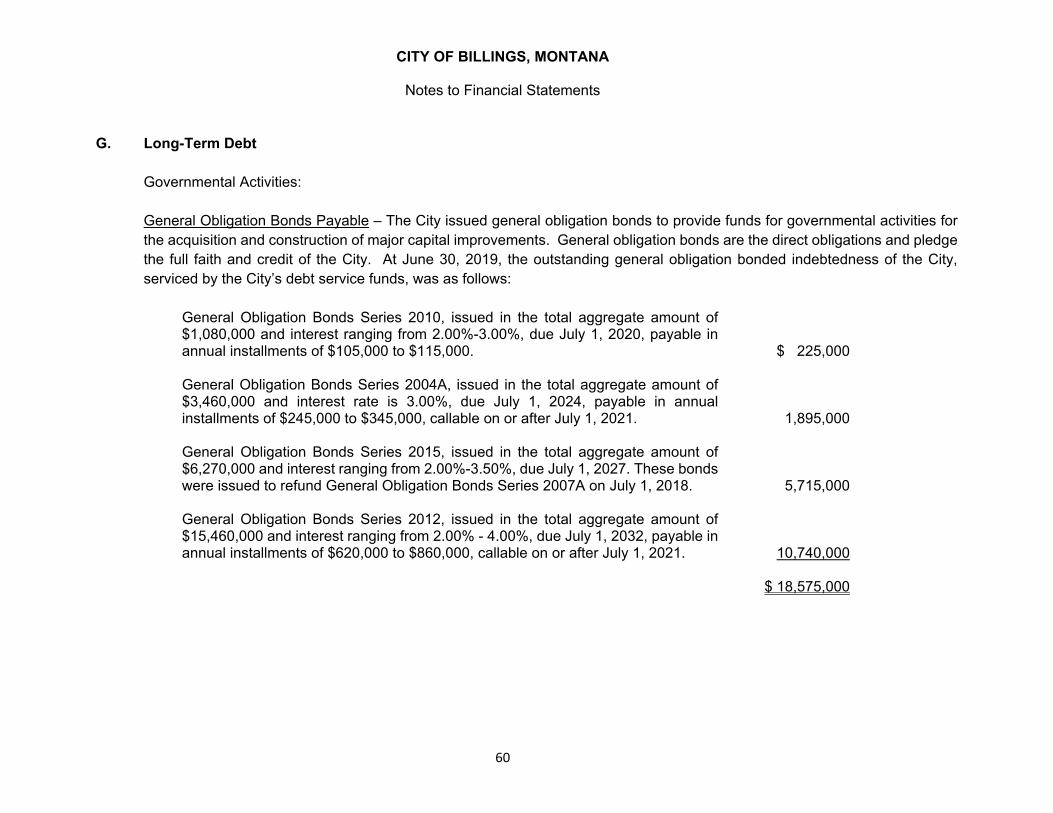
CITY OF BILLINGS, MONTANA
Notes to Financial Statements
60
G. Long-Term Debt
Governmental Activities: General Obligation Bonds Payable – The City issued general obligation bonds to provide funds for governmental activities for the acquisition and construction of major capital improvements. General obligation bonds are the direct obligations and pledge the full faith and credit of the City. At June 30, 2019, the outstanding general obligation bonded indebtedness of the City, serviced by the City’s debt service funds, was as follows:
General Obligation Bonds Series 2010, issued in the total aggregate amount of $1,080,000 and interest ranging from 2.00%-3.00%, due July 1, 2020, payable in annual installments of $105,000 to $115,000. $ 225,000 General Obligation Bonds Series 2004A, issued in the total aggregate amount of $3,460,000 and interest rate is 3.00%, due July 1, 2024, payable in annual installments of $245,000 to $345,000, callable on or after July 1, 2021. 1,895,000 General Obligation Bonds Series 2015, issued in the total aggregate amount of $6,270,000 and interest ranging from 2.00%-3.50%, due July 1, 2027. These bonds were issued to refund General Obligation Bonds Series 2007A on July 1, 2018. 5,715,000 General Obligation Bonds Series 2012, issued in the total aggregate amount of $15,460,000 and interest ranging from 2.00% - 4.00%, due July 1, 2032, payable in annual installments of $620,000 to $860,000, callable on or after July 1, 2021. 10,740,000 $ 18,575,000

CITY OF BILLINGS, MONTANA
Notes to Financial Statements
61
Tax Increment Bonds Payable – At June 30, 2019, the outstanding tax increment bonds indebtedness of the City was as follows:
Tax Increment Revenue Bonds Series 2013, issued in the total aggregate amount of $13,210,000 and interest ranging from 2.50%-6.50%, due July 1, 2038, payable in annual installments of $387,813 to $967,750. The City issued tax increment bonds to provide funds for the construction of the Empire Parking Garage and retail space. $ 11,830,000 Tax Increment Refunding Bonds Series 2015, issued in the total aggregate amount of $5,170,000 and interest ranging from 2.00%-4.38%, due July 1, 2039, payable in annual installments of $125,000 to $330,000. These bonds were issued to retire the debt for the Special Improvement District 1385 bonds. 4,740,000 Tax Increment Revenue Bonds Series 2015, issued in the total aggregate amount of $3,165,000 and interest ranging from 2.00%-4.65%, due July 1, 2039, payable in annual installments of $85,000 to $200,000. The bond proceeds were used for improvements in the East Billings Urban Renewal District. 2,890,000 Tax Increment Revenue Bonds Series 2016, issued in the total aggregate amount of $4,935,000 and interest ranging from 2.00% to 3.75%, due July 1, 2040, payable in annual installments of $150,000 to $295,000. The bonds were issued for reconstruct and sewer improvements in the South Billings Urban Renewal District. 4,635,000 Tax Increment Revenue Bonds Series 2018, issued in the total aggregate amount of $3,405,000 and interest ranging from 3.00% to 5.00%, due July 2038, payable in installments of $105,000 to $237,000. The bonds were issued for storm sewer, sidewalk, lighting, and landscaping improvements in the East Billings Urban Renewal District. 3,465,000 $27,560,000
Special Assessment Debt With Government Commitment – Special assessment bonds are payable from the collection of special assessments levied against benefited property owners within the special improvement district. State Law states, “To the extent that such special assessment collections are not sufficient to make the required debt service payments, the City is obligated to levy and collect a general property tax on all taxable property in the City to provide additional funding for the debt
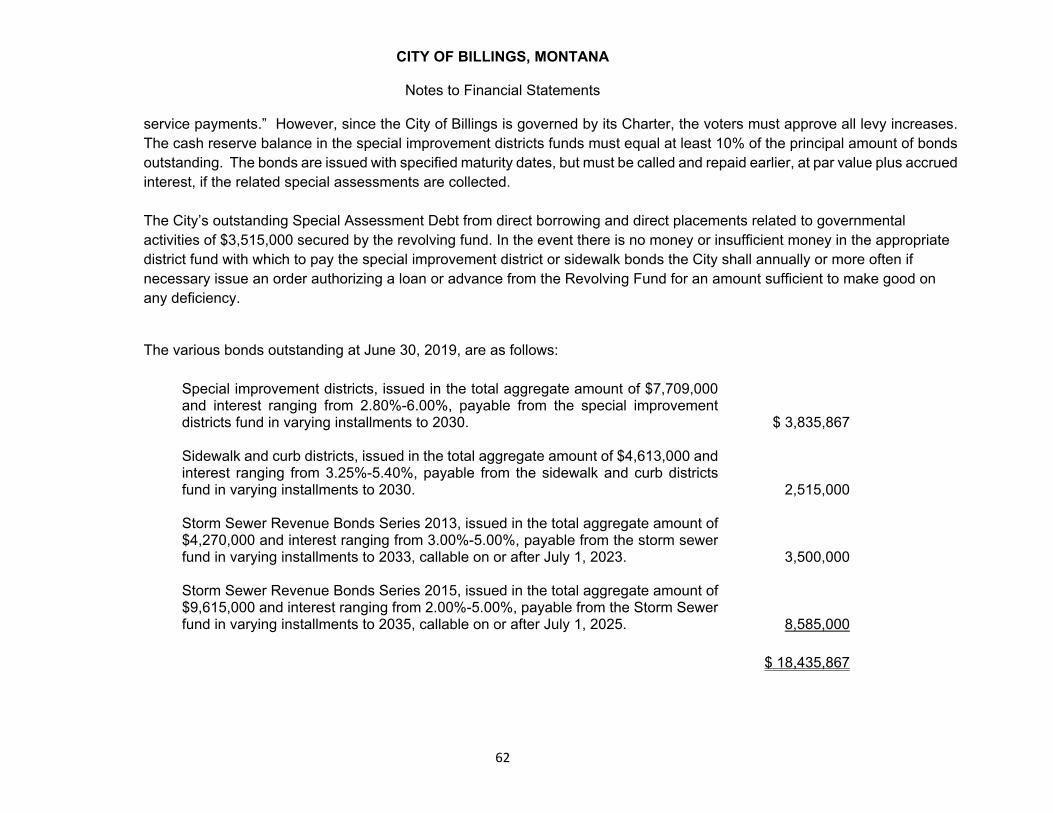
CITY OF BILLINGS, MONTANA
Notes to Financial Statements
62
service payments.” However, since the City of Billings is governed by its Charter, the voters must approve all levy increases. The cash reserve balance in the special improvement districts funds must equal at least 10% of the principal amount of bonds outstanding. The bonds are issued with specified maturity dates, but must be called and repaid earlier, at par value plus accrued interest, if the related special assessments are collected. The City’s outstanding Special Assessment Debt from direct borrowing and direct placements related to governmental activities of $3,515,000 secured by the revolving fund. In the event there is no money or insufficient money in the appropriate district fund with which to pay the special improvement district or sidewalk bonds the City shall annually or more often if necessary issue an order authorizing a loan or advance from the Revolving Fund for an amount sufficient to make good on any deficiency.
The various bonds outstanding at June 30, 2019, are as follows:
Special improvement districts, issued in the total aggregate amount of $7,709,000 and interest ranging from 2.80%-6.00%, payable from the special improvement districts fund in varying installments to 2030. $ 3,835,867 Sidewalk and curb districts, issued in the total aggregate amount of $4,613,000 and interest ranging from 3.25%-5.40%, payable from the sidewalk and curb districts fund in varying installments to 2030. 2,515,000 Storm Sewer Revenue Bonds Series 2013, issued in the total aggregate amount of $4,270,000 and interest ranging from 3.00%-5.00%, payable from the storm sewer fund in varying installments to 2033, callable on or after July 1, 2023. 3,500,000 Storm Sewer Revenue Bonds Series 2015, issued in the total aggregate amount of $9,615,000 and interest ranging from 2.00%-5.00%, payable from the Storm Sewer fund in varying installments to 2035, callable on or after July 1, 2025. 8,585,000 $ 18,435,867

CITY OF BILLINGS, MONTANA
Notes to Financial Statements
63
Business-Type Activities: Notes Payable – The Montana Department of Natural Resources and Conservation (DNRC) authorized the issuance of notes payable for various construction and rehabilitation projects related to the water and wastewater systems as noted in the following table. All notes are due in semi-annual installments with terms of 20 years. The covenants of both the water and wastewater notes require that funds be set aside in reserve for the delinquency of the debt. The required reserve is the highest amount of principal and interest for any annual debt service over the 20-year note payable for Wastewater, and half of the highest annual debt service payment for Water. The amounts reserved as of June 30, 2019, are $1,444,291 for Wastewater and $1,386,571 for Water.
Amount Interest Rate Maturity Date Wastewater:
Headworks Building $ 4,515,000 2.25% July 1, 2025 Briarwood Sewer $ 7,400,000 3.00% July 1, 2028 Ultra-violet System $ 2,900,000 3.00% July 1, 2030 Ultra-violet System $ 816,000 3.00% July 1, 2030 Wastewater Replacement Lines $ 5,387,000 3.00% July 1, 2029 Wastewater Replacement Lines $ 359,300 1.75% July 1, 2029 5 Mile Lift Station $ 3,100,000 3.00% July 1, 2033
Water: Filter Building $17,300,000 2.25% July 1, 2025 Water Replacement Lines $ 2,750,000 3.00% July 1, 2029 Water Replacement Lines $ 333,700 1.75% July 1, 2029 Zone 4 Water Lines $ 7,412,000 3.00% July 1, 2029 2010 Water Replacement Lines $ 2,800,000 3.00% July 1, 2030 Zone 3 Water Lines $ 3,100,000 3.00% July 1, 2032 Zone 3 Chapple Reservoir $ 6,100,000 3.00% July 1, 2034 Briarwood Reservoir $ 3,700,000 2.50% July 1, 2035
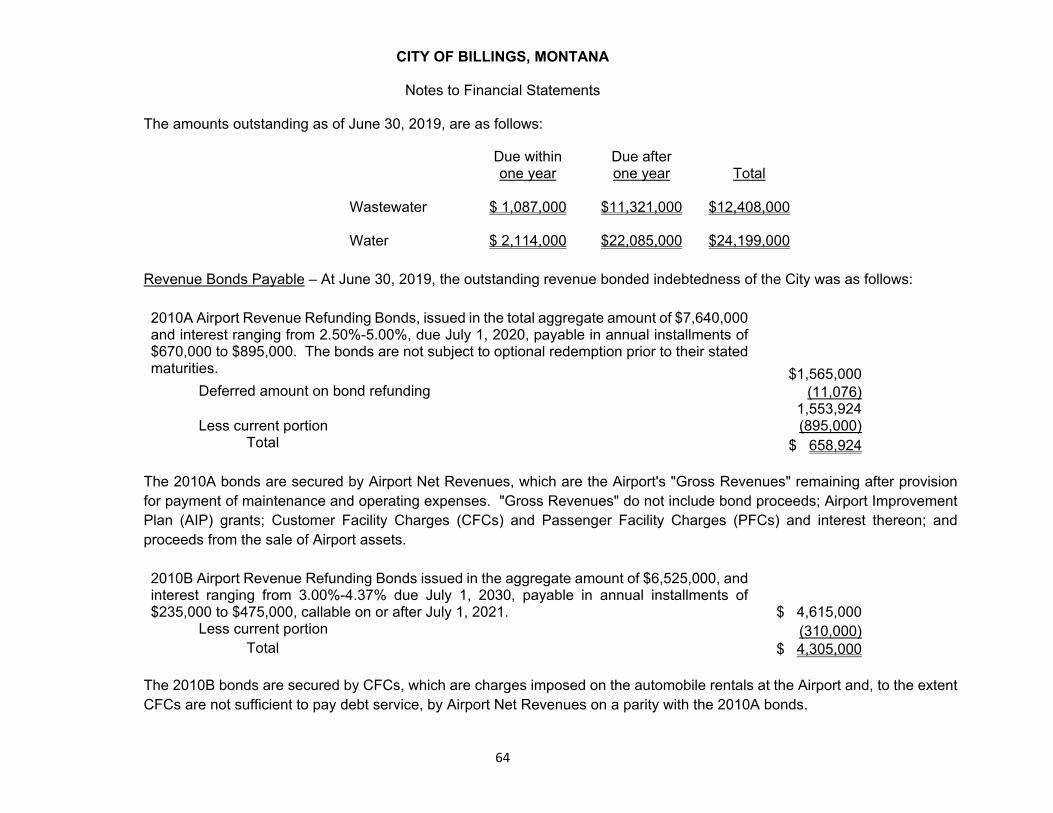
CITY OF BILLINGS, MONTANA
Notes to Financial Statements
64
The amounts outstanding as of June 30, 2019, are as follows:
Due within one year
Due after one year Total
Wastewater $ 1,087,000 $11,321,000 $12,408,000 Water $ 2,114,000 $22,085,000 $24,199,000
Revenue Bonds Payable – At June 30, 2019, the outstanding revenue bonded indebtedness of the City was as follows: 2010A Airport Revenue Refunding Bonds, issued in the total aggregate amount of $7,640,000 and interest ranging from 2.50%-5.00%, due July 1, 2020, payable in annual installments of $670,000 to $895,000. The bonds are not subject to optional redemption prior to their stated maturities. $1,565,000
Deferred amount on bond refunding (11,076) 1,553,924
Less current portion (895,000)Total $ 658,924
The 2010A bonds are secured by Airport Net Revenues, which are the Airport's "Gross Revenues" remaining after provision for payment of maintenance and operating expenses. "Gross Revenues" do not include bond proceeds; Airport Improvement Plan (AIP) grants; Customer Facility Charges (CFCs) and Passenger Facility Charges (PFCs) and interest thereon; and proceeds from the sale of Airport assets. 2010B Airport Revenue Refunding Bonds issued in the aggregate amount of $6,525,000, and interest ranging from 3.00%-4.37% due July 1, 2030, payable in annual installments of $235,000 to $475,000, callable on or after July 1, 2021. $ 4,615,000
Less current portion (310,000)Total $ 4,305,000
The 2010B bonds are secured by CFCs, which are charges imposed on the automobile rentals at the Airport and, to the extent CFCs are not sufficient to pay debt service, by Airport Net Revenues on a parity with the 2010A bonds.

CITY OF BILLINGS, MONTANA
Notes to Financial Statements
65
The 2010A and 2010B bonds are special, limited obligations of the City, and the owners may not look to the general or any other fund of the City for payment of principal, premium, or interest thereof. Revenue bond ordinances include various restrictive covenants. The 2010A and 2010B bond covenants require that revenues and CFC collections equal at least 125% of the debt service requirement for each fiscal year. The more significant reserve covenants require reserves for debt service, facilities and equipment replacement, and for operations. The City is in compliance with all covenants as of June 30, 2019. The revenue bond ordinance restrictions are as follows: Airport Fund 2010A Debt Service $ 764,0002010B Debt Service 500,044Replacement and depreciation 225,000Operations and Maintenance 1,199,300 $ 2,688,344
The City issued Series 2010B revenue bonds to finance its car wash facility and Series 2010A refunding revenue bonds to refund bonds issued to remodel the terminal building. The Airport Fund accounts for all airport activities, which include CFC collections and expenses, PFC collections ($1,161,426) and expenses, AIP grants, and all other Airport operations. However, investors in the Series 2010B revenue bonds rely on the revenue generated by CFC collections ($881,223) and investors in the 2010A revenue bonds rely on airport operating revenues net of AIP grants and CFC and PFC collections. 2017 Sewer System Revenue Bonds, issued in the aggregate amount of $56,505,000 and interest ranging from 2.00% - 5.00%, due July 1, 2036, payable in annual installments of $1,430,000 to $5,125,000, callable on or after July 1, 2027. $ 52,090,000
Less current portion (1,475,000)Total $ 50,615,000
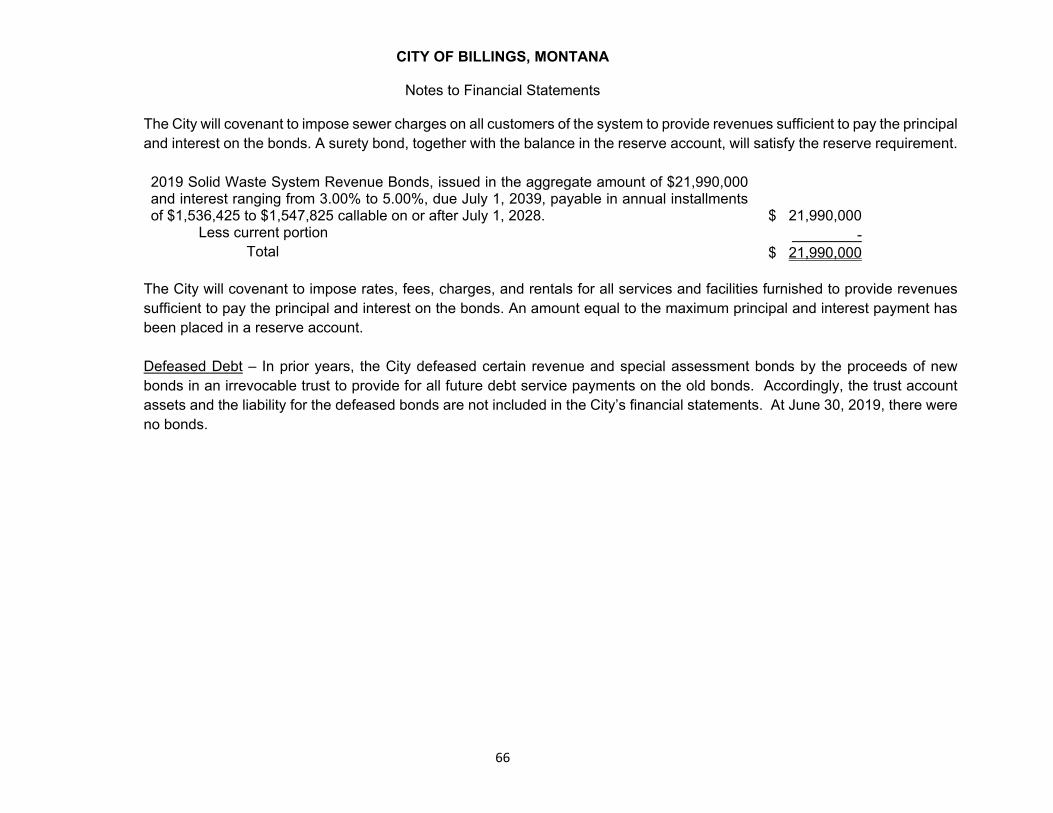
CITY OF BILLINGS, MONTANA
Notes to Financial Statements
66
The City will covenant to impose sewer charges on all customers of the system to provide revenues sufficient to pay the principal and interest on the bonds. A surety bond, together with the balance in the reserve account, will satisfy the reserve requirement. 2019 Solid Waste System Revenue Bonds, issued in the aggregate amount of $21,990,000 and interest ranging from 3.00% to 5.00%, due July 1, 2039, payable in annual installments of $1,536,425 to $1,547,825 callable on or after July 1, 2028. $ 21,990,000
Less current portion -Total $ 21,990,000
The City will covenant to impose rates, fees, charges, and rentals for all services and facilities furnished to provide revenues sufficient to pay the principal and interest on the bonds. An amount equal to the maximum principal and interest payment has been placed in a reserve account. Defeased Debt – In prior years, the City defeased certain revenue and special assessment bonds by the proceeds of new bonds in an irrevocable trust to provide for all future debt service payments on the old bonds. Accordingly, the trust account assets and the liability for the defeased bonds are not included in the City’s financial statements. At June 30, 2019, there were no bonds.

CITY OF BILLINGS, MONTANA
Notes to Financial Statements
67
Summary of Debt Maturities – Annual debt service principal and interest payments required on all outstanding debt at June 30, 2019, are as follows:
GOVERNMENTAL ACTIVITIESYear ending
June 30Principal Interest Principal Interest Principal Interest Principal Interest
2020 1,790,000 613,625 855,000 1,164,238 627,868 541,035 128,000 156,850 2021 1,835,000 554,675 905,000 1,158,094 713,824 504,731 198,000 150,525 2022 1,760,000 501,200 925,000 1,124,709 909,831 508,460 362,500 138,573 2023 1,795,000 447,825 965,000 1,089,044 1,005,892 469,262 426,500 119,728 2024 1,570,000 393,150 1,000,000 1,150,672 972,010 431,884 397,000 101,605
2025-2029 6,565,000 1,112,975 5,720,000 4,548,712 4,436,443 1,644,413 1,527,000 271,258 2030-2034 3,260,000 227,950 7,165,000 3,093,915 4,960,000 667,850 476,000 37,293 2035-2039 - - 8,915,000 1,277,990 1,295,000 44,128 - - 2040-2044 - - 1,110,000 33,807 - - - -
18,575,000$ 3,851,400$ 27,560,000$ 14,641,181$ 14,920,868$ 4,811,763$ 3,515,000$ 975,832$
Principal Interest Principal Interest
2020 5,366 1,010 425,000 53,025 2021 5,366 861 435,000 40,125 2022 5,366 678 450,000 26,850 2023 5,366 497 670,000 16,350 2024 5,366 316 - -
2025-2029 5,376 135 - - 2030-2034 - - - - 2035-2039 - - - -
32,206$ 3,497$ 1,980,000$ 136,350$
Special AssessmentBonds-Direct PlacementBonds
Capital Lease Payable-BOC
BondsGeneral Obligation Special Assessment
Tax Increment
Intercap Notes Payable
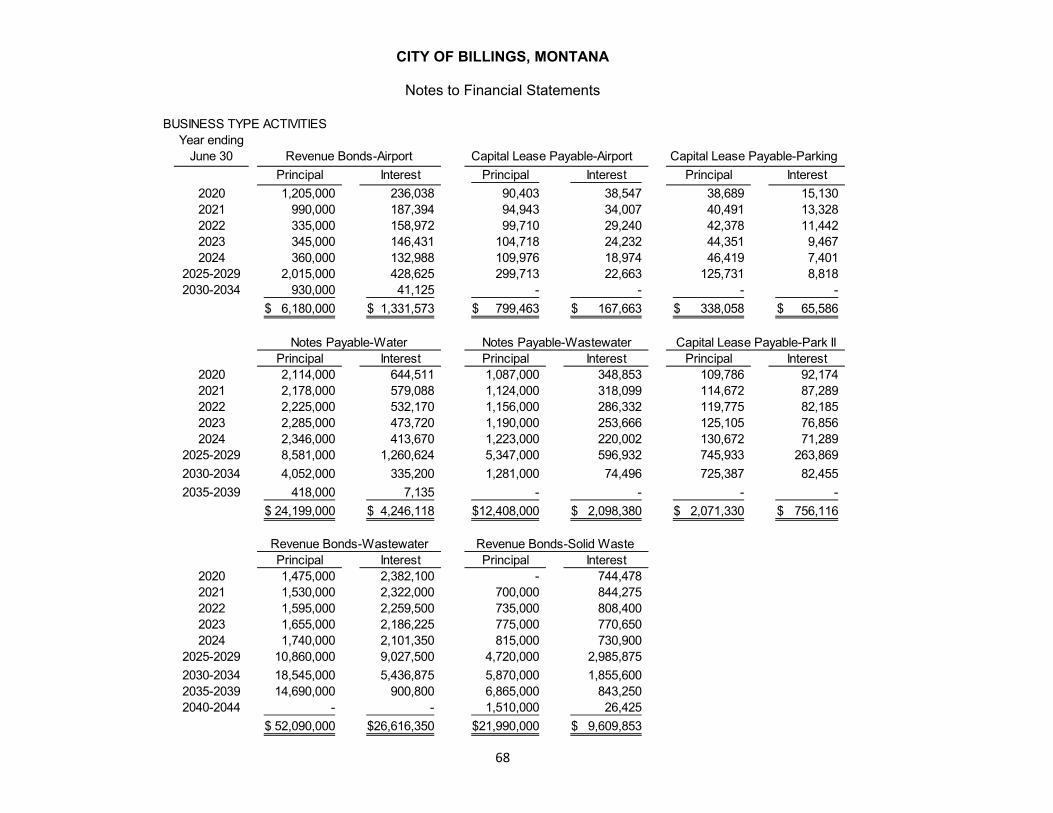
CITY OF BILLINGS, MONTANA
Notes to Financial Statements
68
BUSINESS TYPE ACTIVITIESYear ending
June 30 Capital Lease Payable-AirportPrincipal Interest Principal Interest Principal Interest
2020 1,205,000 236,038 90,403 38,547 38,689 15,130 2021 990,000 187,394 94,943 34,007 40,491 13,328 2022 335,000 158,972 99,710 29,240 42,378 11,442 2023 345,000 146,431 104,718 24,232 44,351 9,467 2024 360,000 132,988 109,976 18,974 46,419 7,401
2025-2029 2,015,000 428,625 299,713 22,663 125,731 8,818 2030-2034 930,000 41,125 - - - -
6,180,000$ 1,331,573$ 799,463$ 167,663$ 338,058$ 65,586$
Principal Interest Principal Interest Principal Interest2020 2,114,000 644,511 1,087,000 348,853 109,786 92,174 2021 2,178,000 579,088 1,124,000 318,099 114,672 87,289 2022 2,225,000 532,170 1,156,000 286,332 119,775 82,185 2023 2,285,000 473,720 1,190,000 253,666 125,105 76,856 2024 2,346,000 413,670 1,223,000 220,002 130,672 71,289
2025-2029 8,581,000 1,260,624 5,347,000 596,932 745,933 263,869 2030-2034 4,052,000 335,200 1,281,000 74,496 725,387 82,455 2035-2039 418,000 7,135 - - - -
24,199,000$ 4,246,118$ 12,408,000$ 2,098,380$ 2,071,330$ 756,116$
Principal Interest Principal Interest2020 1,475,000 2,382,100 - 744,478 2021 1,530,000 2,322,000 700,000 844,275 2022 1,595,000 2,259,500 735,000 808,400 2023 1,655,000 2,186,225 775,000 770,650 2024 1,740,000 2,101,350 815,000 730,900
2025-2029 10,860,000 9,027,500 4,720,000 2,985,875 2030-2034 18,545,000 5,436,875 5,870,000 1,855,600 2035-2039 14,690,000 900,800 6,865,000 843,250 2040-2044 - - 1,510,000 26,425
52,090,000$ 26,616,350$ 21,990,000$ 9,609,853$
Notes Payable-Wastewater Capital Lease Payable-Park II
Revenue Bonds-Airport
Revenue Bonds-Wastewater Revenue Bonds-Solid Waste
Capital Lease Payable-Parking
Notes Payable-Water

CITY OF BILLINGS, MONTANA
Notes to Financial Statements
69
Changes in Long-Term Obligations – During the year ended June 30, 2019, the following changes occurred in liabilities reported in the long-term obligations:
Refunded/Balance Issued/ Redeemed/ Balance Due within
June 30, 2018 Accrued Matured June 30, 2019 one yearGovernmental Activities:
General obligation bonds:Series 2010 Parks 335,000$ -$ 110,000$ 225,000$ 110,000$
Add: premium received 8,472 - 2,825 5,647 - Series 2004A Streets 2,170,000 - 275,000 1,895,000 290,000
Add: premium received 133,789 - 19,112 114,677 - Series 2015 Refunding 6,270,000 - 555,000 5,715,000 565,000
Add: premium received 435,999 - 48,444 387,555 - Series 2012 Library 11,550,000 - 810,000 10,740,000 825,000
Add: premium received 765,350 - 51,023 714,327 - Tax Increment 2013 12,155,000 - 325,000 11,830,000 340,000
Add: premium received 38,287 - 3,481 34,806 - Less: bond discount (1,777) - (162) (1,615) -
Tax Increment 2015 4,895,000 - 155,000 4,740,000 155,000 Less: bond discount (21,817) - (1,039) (20,778) -
Tax Increment 2015-EBURD 2,990,000 - 100,000 2,890,000 100,000 Less: bond discount (29,340) - (1,397) (27,943) -
Tax Increment 2016 4,785,000 - 150,000 4,635,000 155,000 Less: bond discount (34) - (2) (32) -
Tax Increment 2018-East - 3,465,000 - 3,465,000 105,000 Add: premium received - 95,367 - 95,367 -
Special assessment debt withgovernmental commitment 14,717,828 1,090,000 886,961 14,920,867 627,868
Less: bond discounts (38,952) - (8,779) (30,173) - Add: premium received 583,718 - 34,992 548,726 - Direct Placement 3,504,000 535,000 524,000 3,515,000 128,000
Intercap notes payable 37,572 - 5,366 32,206 5,366 Capital lease payable 2,390,000 - 410,000 1,980,000 425,000
Add: premium received 124,688 - 20,782 103,906 - Compensated absences 8,112,664 8,384,006 7,763,500 8,733,170 7,224,456
Total governmental activities 75,910,447$ 13,569,373$ 12,239,107$ 77,240,713$ 11,055,690$
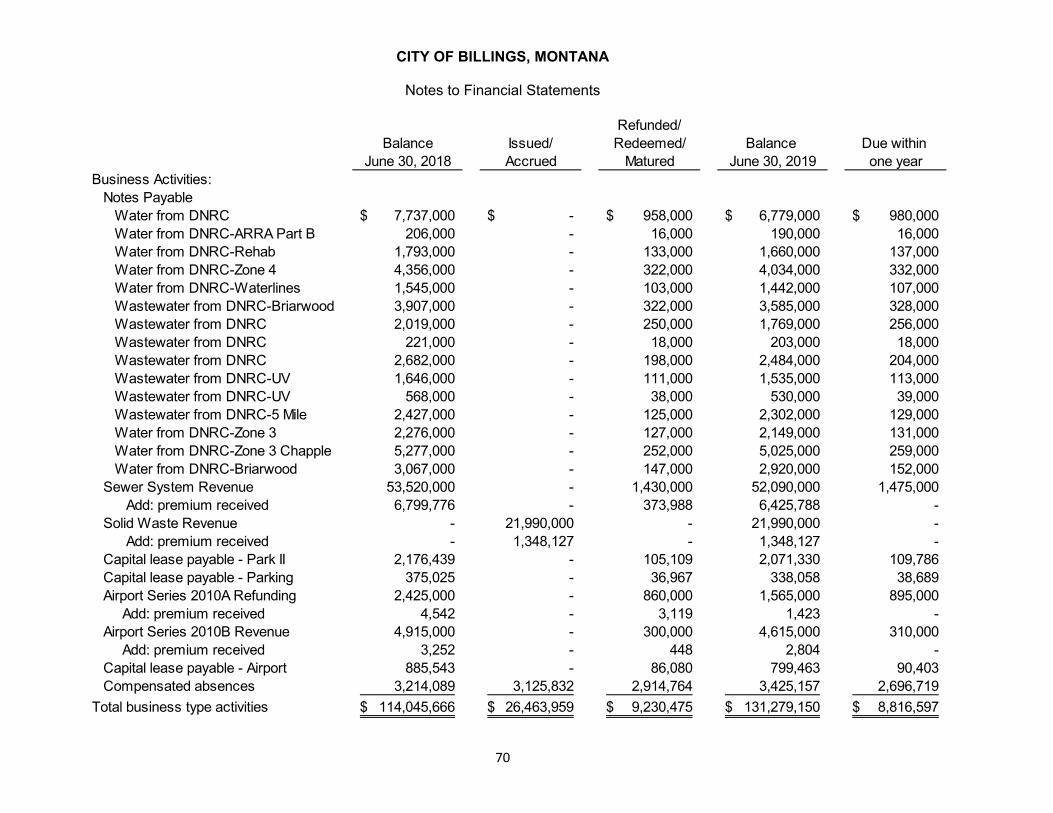
CITY OF BILLINGS, MONTANA
Notes to Financial Statements
70
Refunded/Balance Issued/ Redeemed/ Balance Due within
June 30, 2018 Accrued Matured June 30, 2019 one yearBusiness Activities:
Notes PayableWater from DNRC 7,737,000$ -$ 958,000$ 6,779,000$ 980,000$ Water from DNRC-ARRA Part B 206,000 - 16,000 190,000 16,000 Water from DNRC-Rehab 1,793,000 - 133,000 1,660,000 137,000 Water from DNRC-Zone 4 4,356,000 - 322,000 4,034,000 332,000 Water from DNRC-Waterlines 1,545,000 - 103,000 1,442,000 107,000 Wastewater from DNRC-Briarwood 3,907,000 - 322,000 3,585,000 328,000 Wastewater from DNRC 2,019,000 - 250,000 1,769,000 256,000 Wastewater from DNRC 221,000 - 18,000 203,000 18,000 Wastewater from DNRC 2,682,000 - 198,000 2,484,000 204,000 Wastewater from DNRC-UV 1,646,000 - 111,000 1,535,000 113,000 Wastewater from DNRC-UV 568,000 - 38,000 530,000 39,000 Wastewater from DNRC-5 Mile 2,427,000 - 125,000 2,302,000 129,000 Water from DNRC-Zone 3 2,276,000 - 127,000 2,149,000 131,000 Water from DNRC-Zone 3 Chapple 5,277,000 - 252,000 5,025,000 259,000 Water from DNRC-Briarwood 3,067,000 - 147,000 2,920,000 152,000
Sewer System Revenue 53,520,000 - 1,430,000 52,090,000 1,475,000 Add: premium received 6,799,776 - 373,988 6,425,788 - Solid Waste Revenue - 21,990,000 - 21,990,000 - Add: premium received - 1,348,127 - 1,348,127 - Capital lease payable - Park II 2,176,439 - 105,109 2,071,330 109,786 Capital lease payable - Parking 375,025 - 36,967 338,058 38,689 Airport Series 2010A Refunding 2,425,000 - 860,000 1,565,000 895,000 Add: premium received 4,542 - 3,119 1,423 - Airport Series 2010B Revenue 4,915,000 - 300,000 4,615,000 310,000 Add: premium received 3,252 - 448 2,804 - Capital lease payable - Airport 885,543 - 86,080 799,463 90,403 Compensated absences 3,214,089 3,125,832 2,914,764 3,425,157 2,696,719
Total business type activities 114,045,666$ 26,463,959$ 9,230,475$ 131,279,150$ 8,816,597$

CITY OF BILLINGS, MONTANA
Notes to Financial Statements
71
Governmental activities include internal service fund liabilities for capital lease payable, compensated absences, and intercap notes payable. Internal service fund compensated absences totaled $1,314,169 and $1,130,366 at June 30, 2018 and 2019, respectively and are generally liquidated by the related internal service fund. Compensated absences for the remaining governmental activities are generally liquidated by the general fund and other governmental funds. Arbitrage – The Tax Reform Act of 1986 (ACT) substantially revised the treatment to be afforded to earnings on the proceeds of tax-exempt debt and now requires the City to calculate and remit rebatable arbitrage earnings to the Internal Revenue Service. Certain City debt and interest earned on the proceeds thereof are subject to the requirements of the Act. At June 30, 2019, the City had no arbitrage rebate liability for its governmental and business-type activities.
H. Post-Employment Healthcare Benefits From an accrual accounting perspective, the cost of post-employment healthcare benefits, like the cost of pension benefits, generally should be associated with periods in which the cost occurs, rather than in the future year when it will be paid. In adopting the requirements of GASB Statement No. 75, the City recognizes the cost of post-employment healthcare in the year when the employee services are received, reports the accumulated liability from prior years, and provides information useful in assessing potential demands on the City’s future cash flows. Recognition of the full liability occurred in fiscal year 2017, the year that GASB 75 was implemented. A separate postemployment benefit plan report is not prepared for the health insurance plan. Plan Description. The City provides continuous medical insurance coverage for eligible participants enrolled in the City sponsored plan, a single-employer plan, called the City of Billings Employee Benefit Plan (the Plan). Total plan contributions paid by the City in 2019 were 10.0% of total payroll and benefits. The retiree benefits are provided in the form of an implicit rate subsidy where pre 65 retirees and a closed group of post 65 retirees receive health insurance coverage by paying a combined retiree/active rate. Dental and life insurance benefits are also provided on a fully contributory basis. The Plan does not prepare separate financial statements, but is included in the City’s CAFR and reported as an internal service fund as City Health Insurance Fund. A Plan Document describing the Plan in its entirety, including contribution rates, eligibility, etc., can be obtained from the Human Resources Department of the City of Billings.

CITY OF BILLINGS, MONTANA
Notes to Financial Statements
72
Retirement eligibility is determined based upon the employee’s retirement system and is as follows:
Police and Fire employees: Must complete a minimum of 20 years of membership service and be actively employed and covered by the City’s medical plan prior to retirement. All Other Employees: Must complete a minimum of 25 years of membership service at any age OR complete a minimum of 5 years of membership service at a minimum age of 50, plus the employee must be actively employed and covered by the City’s medical plan prior to retirement.
Eligible retirees receive pre 65 health care coverage through one of two self-insured medical plans: Plan C and Plan D. A closed group of retirees age 65 and older is enrolled in one of the plans. The number of participants as of July 1, 2018, the effective date of the biennial OPEB valuation, follows. There have been no significant changes in the number covered or the type of coverage since that date.
Active employees 896Retired employees 92 Total 988
Funding Policy. The City currently pays for post-employment healthcare benefits on a pay-as-you-go basis. Although the City has studied the establishment of trusts that would be used to accumulate and invest assets necessary to pay for any accumulated liability on an actuarial basis, these financial statements assume that pay-as-you-go funding will continue. The amount of covered payroll related to the plan for the year ending June 30, 2018, is $54,617,000. The ratio of the FY 2019 net OPEB liability to annual covered payroll is 0.16.

CITY OF BILLINGS, MONTANA
Notes to Financial Statements
73
Annual OPEB Cost and Net OPEB Liability. The City’s other post-employment benefit (OPEB) cost (expense) is calculated based on the Entry Age Normal cost method based on a level percentage of projected salary, in accordance with the parameters of GASB Statement 75. The following table shows sources of changes in the net OPEB liability for the City:
Changes in Net OPEB Liability
Total OPEB LiabilityPlan Fiduciary Net
Position
Net OPEB Liability Total OPEB Liability – Start of Year $10,871,015 $ - $10,871,015Changes for the year Service cost 599,538 - 599,538 Interest cost 435,068 - 435,068 Changes of benefit term - - - Differences between expected and actual experience (2,062,008) - (2,062,008) Changes in assumptions or other inputs (972,358) - (972,358) (Other changes, separately identified if significant) - - - Contributions – employer - - - Net Investment Income - - - Benefit payments (354,149) - (354,149) Admin Expense - - - Net change in total OPEB liability $(2,353,908) - $(2,353,908) Total OPEB Liability – End of Year $8,517,107 $- $8,517,107
The annual OPEB expense recognized in fiscal year 2019 is as follows:
Service Cost $ 599,538Interest Cost 435,068Changes of benefit terms -Current recognized deferred outflows/(inflows) Difference between expected and actual experience ($389,737) Changes in assumptions or other inputs 278,796 (Other changes, separately identified, if significant) -Total Expense $923,665

CITY OF BILLINGS, MONTANA
Notes to Financial Statements
74
Recognition of the deferred outflows and inflows occur in future periods and, therefore, are reported on the Statement of Net Position as required by GASB Statement 75. The detailed schedule of deferred outflows and inflows related to the OPEB liability is as follows: Deferred Outflows of Resources Deferred Inflow of ResourcesDifferences between actual and expected experience - ($ 2,334,729)Changes of assumptions $ 1,782,667 (854,352)Total $ 1,782,667 ($ 3,189,081)
Amounts reported as Deferred Outflows of Resources and Deferred Inflows of Resources:
For Fiscal Year End: 2020 $ (110,941) 2021 (110,941) 2022 (110,941) 2023 (110,941) 2024 (283,674) Thereafter (678,976)
Actuarial Methods and Assumptions. Projections of benefits for financial reporting are based on the substantive plan (the plan as understood by the employer and the plan members) and include the types of benefits provided at the time of each valuation and the historical pattern of sharing benefit costs between the employer and plan members to that point. Actuarial valuations of an ongoing plan involve estimates of the value of reported amounts and assumptions about the probability of occurrence of events far into the future. Examples include assumptions about future employment, mortality, and the healthcare cost trend. Amounts determined regarding the funded status of the plan and the annual required contributions of the employer are subject to continual revision as actual results are compared with past expectations and new estimates are made about the future. The schedule of employer contributions to the health insurance plan, presented as required supplementary information following the notes to the financial statements, presents multiyear trend information about whether the actuarial value of plan assets is increasing or decreasing over time relative to the actuarial liabilities for benefits. The City has elected not to fund this liability. The actuarial methods and assumptions used include techniques that are designed to reduce the effects of short-term volatility in actuarial accrued liabilities and the actuarial value of assets, consistent with the long-term perspective of the calculations.

CITY OF BILLINGS, MONTANA
Notes to Financial Statements
75
In the June 30, 2019, actuarial valuation, the liabilities were computed using the entry age normal based on level percentage of projected salary. The actuarial assumptions utilized a 3.86% discount rate. Because the plan is unfunded, the discount rate is based on the index rate for 20-year, tax-exempt, general obligation bonds with an average rating of AA or higher. The valuation assumes a 7% healthcare cost trend increase for fiscal year 2018-2019, reduced each year until an ultimate health care cost trend rate of 4.65% is reached. The contribution to the Plan by the City is determined annually by the City’s Health Insurance Committee, with the aid of a consultant, and subsequently approved and adopted through the City’s budget process. The Health Insurance Committee may modify the Plan. Sensitivity Analysis. Sensitivity measurements of the net OPEB liability based on health care cost trends and discount rates:
Healthcare cost trend sensitivity analysis Net OPEB Liability % Difference1% Decrease $ 7,249,000 -15%Current Trend $8,517,000 0%1% Increase $10,401,000 22%
Discount Rate trend sensitivity analysis Net OPEB Liability % Difference1% Increase 4.5% $ 7,704,000 -10%Current Trend 0% $8,517,000 N/A1% Decrease 2.5% $9,448,000 11%
IV. Other Notes
A. Risk Management
The City is exposed to various risks of losses related to torts; theft of, damage to, and destruction of assets; errors and omissions; injuries to employees; medical insurance costs of employees; pollution liability; and natural disasters.

CITY OF BILLINGS, MONTANA
Notes to Financial Statements
76
For general liability and injuries to employees, the City has elected to participate in the Montana Municipal Interlocal Authority – Liability Coverage (MMIA – Liability Program) and the Montana Municipal Interlocal Authority – Workers’ Compensation (MMIA – Workers’ Compensation) programs. These entities are public entity risk pools currently operating as common risk management and coverage programs, pursuant to their formation by Interlocal Agreements under the Interlocal Cooperation Act. The City pays annual assessments to the MMIA – Liability Program and the MMIA – Workers’ Compensation for its general liability and workers’ compensation coverage. There have been no significant changes to levels of coverage from the previous year. The MMIA – Liability coverage has specific exclusions for airfield operations; subsequently the City’s airport fund annually purchases a separate general liability insurance policy to provide liability coverage for the airport’s operations. This policy is provided through a private insurance company. It provides coverage up to $100 million per occurrence. For damage to and destruction of buildings and facilities, the City has elected to insure its buildings and facilities with insurance purchased from a private carrier. Such insurance has a deductible of $100,000 per occurrence. The rateable exposure limit is $659,299,728 (inclusive of Business Income Coverage) with a blanket policy limit of $500 million, underwritten by Affiliated FM Insurance Company. There have been no significant changes to levels of insurance from the previous year, and settlement payments have not exceeded insurance coverage during the current year or the two previous fiscal years. In addition, the City also elected to purchase, at various limits, Crime Coverage. The Crime Coverage protects against loss in the event of employee theft, computer fraud, computer program data restoration, funds transfer fraud, claim expense, and faithful performance of duty.
The City has established a medical self-insurance fund to pay medical claims of the City’s employees and their covered dependents. Revenues to the plan from the various funds and employee contributions are recorded as a charge for service in the City health insurance fund, an internal service fund. Medical claims over $215,000 per individual per calendar year are covered through a private insurance carrier. The fund records health care costs as expenses when claims are incurred; including incurred but not reported (IBNR) claims. The fund establishes claims liabilities, including IBNR, based on the estimated ultimate cost of settling the claims (including the effects of inflation and other societal and economic factors), using past experience adjusted for current trends, and any other factors that modify past experience. Claims liabilities include only specific, incremental claim adjustment expenses. Estimated recoveries on claims are evaluated in terms of their estimated, realizable value and deducted from the liability for unpaid claims.

CITY OF BILLINGS, MONTANA
Notes to Financial Statements
77
Following is a summary of the changes in the balances of health insurance claim liabilities, which are included in accrued liabilities in the Combined Balance Sheet, during fiscal years 2017, 2018, and 2019:
Beginning-of-
fiscal-year liability
Incurred claims and claim
administrative expenses
Payments of claims and claim
administrative expenses
End-of- fiscal-year
liability 2016-2017 1,000,000 11,689,018 11,939,018 750,0002017-2018 750,000 10,461,124 10,303,328 907,7962018-2019 907,796 9,797,165 9,937,165 767,796
Retired employees may continue their health care coverage through the City’s group health plan until the month end of their 65th birthday. In compliance with COBRA, the City also allows terminated employees to continue their health care coverage for 18 months past the date of termination. Approximately 95 retired and terminated employees participated in the City’s health plan. Claims paid in excess of premiums received for these participants totaled approximately $381,836 for the fiscal year ended June 30, 2019. There have been no material changes in health insurance coverage from the previous year. The City has a two-tiered health insurance plan. The amount of employee contributions is based on the level of coverage chosen from the two tiers. Beginning January 1, 2012, the City implemented a two-tiered health insurance plan and will have only one area hospital in-network. These changes were completed using the RFP process and were approved and implemented by the Health Insurance Committee in order to reduce health care costs and avoid increases in premiums for both the City and employees. All risk management activities are accounted for in the internal service funds. Expenditures and claims are recognized when it is probable that a loss has occurred and the amount of the loss can be reasonably estimated. In determining claims, events that might create claims, but for which none have been reported, are considered. Coverage limits and the deductibles on the commercial policies have not changed materially from the previous year.

CITY OF BILLINGS, MONTANA
Notes to Financial Statements
78
B. Pollution Remediation
Effective July 1, 2008, the City implemented the provisions of GASB Statement No. 49, Accounting and Financial Reporting for Pollution Remediation Obligations. The City has determined that the implementation of GASB 49 had no material effect on prior year financial statements.
C. Subsequent Events
Management has evaluated subsequent events through January 22nd, 2020, the date on which the financial statements were available to be issued. There are no subsequent events to report.
D. Claims and Judgments
The City is involved with numerous other lawsuits from other claimants. Based on past claims history and management’s best estimates, the City expects to pay approximately $1,300,000 for insurance deductibles and amounts not covered by insurance. Changes in Claims and Judgments:
Beginning of Changes in the Claims Payments End of Amount DueFiscal Estimate for Claims Incurred of Fiscal Within
Fiscal Year Year of Prior Periods During Year Claims Year One Year2017 1,300,000$ -$ -$ -$ 1,300,000$ 1,300,000$
2018 1,300,000$ -$ -$ -$ 1,300,000$ 1,300,000$
2019 1,300,000$ -$ -$ -$ 1,300,000$ 1,300,000$

CITY OF BILLINGS, MONTANA
Notes to Financial Statements
79
E. Contingent Liabilities
1. Landfill Closure and Post-closure
State and federal laws and regulations require the City to place a final cover on its landfill site when it stops accepting waste and to perform certain maintenance and monitoring functions at the site for thirty years after closure. Although closure and post-closure care costs will be paid only near or after the date that the landfill stops accepting waste, the City reports a portion of these closure and post-closure care costs as an operating expense in each period based on the estimate of landfill capacity used as of each balance sheet date. The $3,504,776 reported as landfill closure and post-closure care liability at June 30, 2019, represents the cumulative amount reported to date based on the use of approximately 53% of the estimated capacity of the landfill. The City will recognize the remaining estimated cost of closure and post-closure care of $3.1 million as the remaining estimated capacity is filled. These amounts are based on what it would cost to perform all closure and post-closure care in 2019. Revised closure costs were completed during fiscal year 2018, which slightly increased the total estimated remaining costs for closure and post-closure care. The City expects to close the landfill in 39 years, in the year 2058. Actual costs may be higher due to inflation, changes in technology, or changes in regulations. The City has established an irrevocable solid waste management financial assurance trust. The City is required to make payments into the trust over the life of the landfill to provide funds for closure and post-closure care. In fiscal year 2019, $129,196 was paid into, or earned by, the trust. The cumulative amount of payments of $3,367,124 is reported as restricted investments at June 30, 2019.
Balance June 30, 2018
Accrual Amount
Balance June 30, 2019
Net change in Landfill Liability $ 3,354,572 $ 150,204 $ 3,504,776 2. Lawsuits
The City is involved with numerous other lawsuits, from other claimants, which arise out of the normal course of operations by the City. Management has accrued for any deductibles and amounts not covered by the City insurance carriers.

CITY OF BILLINGS, MONTANA
Notes to Financial Statements
80
The City of Billings was sued by a group of employed police officers several years ago. The District Court issued a summary judgment, which the plaintiffs believe will result in favor of the officers. MMIA does not offer coverage for this claim. The judgment did not itemize the amount for the claim. Although the City is vigorously defending this claim, the City has estimated that the summary judgment could result in up to $1,200,000 due to the officers, including attorney fees, penalties, and interest. This amount has been reflected in the Statement of Position and Statement of Activities. The City of Billings is being sued by a group of citizens. Plaintiffs filed a class action complaint on May 16, 2018 asserting that the franchise fees assessed by the City were illegal sales taxes. The City has filed an answer denying the substance of the Plaintiffs’ claims. The District Court stayed further litigation in this case pending resolution of the City’s appeal of the Class Certification Order. It is early in this case and the City of Billings cannot predict the outcome at this time. The City believes that the current accrual for claims and judgments is sufficient in the event of settlements related to these lawsuits.
3. Grants
The City has federal and state grants for specific purposes that are subject to annual audits and other periodic reviews by grantor agencies. Such reviews could result in requests for reimbursement by grantor agencies for costs, which may be disallowed as appropriate expenses under the grant terms. Management of the City believes disallowances, if any, will not be material.
F. Conduit Debt
The City has authorized the issuance of certain bonds in its name to provide financial assistance to private-sector entities for the acquisition and construction of industrial and commercial facilities deemed to be in the public interest. The bonds are secured by the property financed and are payable solely from payments received on the underlying mortgage loans. Upon repayment of the bonds, ownership of the acquired facilities transfers to the private-sector entity served by the bond issuance. Neither the City, State, nor any political subdivision thereof is obligated in any manner for repayment of the bonds. Accordingly, the bonds are not reported as liabilities in the accompanying government-wide financial statements. The only requirement for this type of issue is to request the amount needed for City approval; and when completely paid or called, they must notify the City of this event.
CITY OF BILLINGS, MONTANA
Notes to Financial Statements
81
As of June 30, 2019, there were three series of industrial revenue bonds outstanding. The aggregate principal amount payable for the three series issued was approximately $8.4 million at June 30, 2019.
G. Pension Plans
The City of Billings contributes to four separate pension plans, which cover substantially all full-time employees. They are the Public Employees’ Retirement System-defined benefit retirement plan (PERS-DBRP), Public Employees’ Retirement System-defined contribution plan (PERS-DCRP), Firefighters’ Unified Retirement System (FURS), and the Municipal Police Officers’ Retirement System (MPORS). The PERS-DCRP is a defined contribution plan, and the other plans are defined benefit pension systems. All plans are administered by the Public Employment Retirement Board (PERB). The City’s financial statements include on-behalf contributions made by the State of Montana as described in the following plan descriptions.
CITY OF BILLINGS PERS-DEFINED BENEFIT
GASB 68 NOTES TO THE FINANCIAL STATEMENTS FOR FISCAL YEAR ENDED
JUNE 30, 2018 (MEASUREMENT DATE) JUNE 30, 2019 (REPORTING DATE)
In accordance with GASB Statement 68, Accounting and Financial Reporting for Pensions, employers and the non-employer contributing entity are required to recognize and report certain amounts associated with their participation in the Public Employees’ Retirement System Defined Benefit Retirement Plan (the Plan). This includes the proportionate share of the collective Net Pension Liability; Pension Expense; and Deferred Outflows and Deferred Inflows of Resources associated with pensions. Employers are provided guidance in GASB Statement 68, paragraph 74, where pension amounts must be combined as a total or aggregate for reporting, whether provided through cost-sharing, single-employer, or agent plans. This report provides information for employers who are using a June 30, 2018 measurement date for the 2019 reporting. If an employer’s fiscal year end is after June 30th, the employer will not use the measurements shown in this report but will need to wait for the measurement date as of June 30, 2019. Summary of Significant Accounting Policies

CITY OF BILLINGS, MONTANA
Notes to Financial Statements
82
MPERA prepared financial statements using the accrual basis of accounting. The same accrual basis was used by MPERA for the purposes of determining the Net Pension Liability (NPL); Deferred Outflows of Resources and Deferred Inflows of Resources related to pensions; Pension Expense; the Fiduciary Net Position; and, Additions to or Deductions from Fiduciary Net Position. Member contributions are recognized in the period in which contributions are due. Employer contributions are recognized when due and the employer has made a formal commitment to provide the contributions. Revenues are recognized in the accounting period they are earned and become measurable. Benefit payments and refunds are recognized in the accounting period in which they are due and payable in accordance with the benefit terms. Expenses are recognized in the period incurred. Investments are reported at fair value. MPERA adhered to all accounting principles generally accepted by the United States of America. MPERA applied all applicable pronouncements of the Governmental Accounting Standards Board (GASB). General Information about the Pension Plan Plan Description The PERS-Defined Benefit Retirement Plan (DBRP), administered by the Montana Public Employee Retirement Administration (MPERA), is a multiple-employer, cost-sharing plan established July 1, 1945, and governed by Title 19, chapters 2 & 3, Montana Code Annotated (MCA). This plan covers the State, local governments, certain employees of the Montana University System, and school districts. All new members are initially members of the PERS-DBRP and have a 12-month window during which they may choose to remain in the PERS-DBRP or join the PERS-DCRP by filing an irrevocable election. Members may not be members of both the defined contribution and defined benefit retirement plans. All new members from the universities also have a third option to join the university system’s Montana University System Retirement Program (MUS-RP). Benefits Provided The PERS-DBRP provides retirement, disability, and death benefits to plan members and their beneficiaries. Benefits are established by state law and can only be amended by the Legislature. Service retirement:
Hired prior to July 1, 2011: o Age 60, 5 years of membership service o Age 65, regardless of membership service o Any age, 30 years of membership service
Hired on or after July 1, 2011 o Age 65, 5 years of membership service

CITY OF BILLINGS, MONTANA
Notes to Financial Statements
83
o Age 70, regardless of membership service Early Retirement:
Hired prior to July 1, 2011 o Age 50, 5 years of membership service o Any age, 25 years of membership service
Hired on or after July 1, 2011 o Age 55, 5 years of membership service
Second Retirement: (requires returning to PERS-covered employer or PERS service) Retired before January 1, 2016 and accumulate less than 2 years additional service credit or retired on or after
January 1, 2016 and accumulate less than 5 years additional service credit: o A refund of member’s contributions plus return interest (currently .77% effective July 1, 2017). o No service credit for second employment; o Start the same benefit amount the month following termination; and o Guaranteed Annual Benefit Adjustment (GABA) starts again in the January immediately following the
second retirement. Retired before January 1, 2016 and accumulate at least 2 years of additional service credit:
o A recalculated retirement benefit based on provisions in effect after the initial retirement; and o GABA starts on the recalculated benefit in the January after receiving the new benefit for 12 months.
Retired on or after January 1, 2016 and accumulate 5 or more years of service credit: o The same retirement as prior to the return to service; o A second retirement benefit as prior to the second period of service based on laws in effect upon the
rehire date; and o GABA starts on both benefits in the January after receiving the original and the new benefit for 12 months.
Member’s highest average compensation (HAC) Hired prior to July 1, 2011 - highest average compensation during any consecutive 36 months; Hired on or after July 1, 2011 – highest average compensation during any consecutive 60 months;
Compensation Cap Hired on or after July 1, 2013 – 110% annual cap on compensation considered as a part of a member’s highest
average compensation. Monthly benefit formula
Members hired prior to July 1, 2011 o Less than 25 years of membership service: 1.785% of HAC per year of service credit; o 25 years of membership service or more: 2% of HAC per year of service credit.
Members hired on or after July 1, 2011 o Less than 10 years of membership service: 1.5% of HAC per year of service credit;

CITY OF BILLINGS, MONTANA
Notes to Financial Statements
84
o 10 years or more, but less than 30 years of membership service: 1.785% of HAC per year of service credit;
o 30 years or more of membership service: 2% of HAC per year of service credit. Guaranteed Annual Benefit Adjustment (GABA)
After the member has completed 12 full months of retirement, the member’s benefit increases by the applicable percentage (provided below) each January, inclusive of all other adjustments to the member’s benefit. 3.0% for members hired prior to July 1, 2007 1.5% for members hired between July 1, 2007 and June 30, 2013 Members hired on or after July 1, 2013:
a) 1.5% for each year PERS is funded at or above 90%; b) 1.5% reduced by 0.1% for each 2.0% PERS is funded below 90%; and c) 0% whenever the amortization period for PERS is 40 years or more.
Contributions The state Legislature has the authority to establish and amend contribution rates. Member and employer contribution rates are specified by Montana Statute and are a percentage of the member’s compensation. Contributions are deducted from each member’s salary and remitted by participating employers. Special Funding The state of Montana, as the non-employer contributing entity, paid to the Plan, additional contributions that qualify as special funding. Those employers who received special funding are all participating employers. Not Special Funding Per Montana law, state agencies and universities paid their own additional contributions. The employer paid contributions are not accounted for as special funding for state agencies and universities but are reported as employer contributions.

CITY OF BILLINGS, MONTANA
Notes to Financial Statements
85
1. Member contributions to the system of 7.9% are temporary and will be decreased to 6.9% on January 1 following actuary valuation results that show the amortization period has dropped below 25 years and would remain below 25 years following the reduction of both the additional employer and additional member contribution rates.
2. Employer contributions to the system: a. Effective July 1, 2014, following the 2013 Legislative Session, PERS-employer contributions increase an
additional 0.1% a year and will continue over 10 years through 2024. The additional employer contributions including the 0.27% added in 2007 and 2009, will terminate on January 1 following an actuary valuation that shows the amortization period of the PERS-DBRP has dropped below 25 years and remains below the 25 years following the reduction of both the additional employer and member contributions rates.
b. Effective July 1, 2013, employers are required to make contributions on working retirees’ compensation. Member contributions for working retirees are not required.
c. The portion of employer contributions allocated to the PCR are included in the employers reporting. The PCR was paid off effective March 2016 and contributions previously directed to the PCR are now directed to member accounts.
3. Non-Employer Contributions
Member and employer contribution rates are shown in the table below.
State &Universities
Fiscal Hired HiredYear <7/01/11 >7/01/11 Employer Employer State Employer State
2019 7.9% 7.9% 8.670% 8.570% 0.10% 8.30% 0.370%2018 7.9% 7.9% 8.570% 8.470% 0.10% 8.20% 0.370%2017 7.9% 7.9% 8.470% 8.370% 0.10% 8.10% 0.370%2016 7.9% 7.9% 8.370% 8.270% 0.10% 8.00% 0.370%2015 7.9% 7.9% 8.270% 8.170% 0.10% 7.90% 0.370%2014 7.9% 7.9% 8.170% 8.070% 0.10% 7.80% 0.370%
2012-2013 6.9% 7.9% 7.170% 7.070% 0.10% 6.80% 0.370%2010-2011 6.9% 7.170% 7.070% 0.10% 6.80% 0.370%2008-2009 6.9% 7.035% 6.935% 0.10% 6.80% 0.235%2000-2007 6.9% 6.900% 6.800% 0.10% 6.80% 0.100%
Member Local Government School Districts
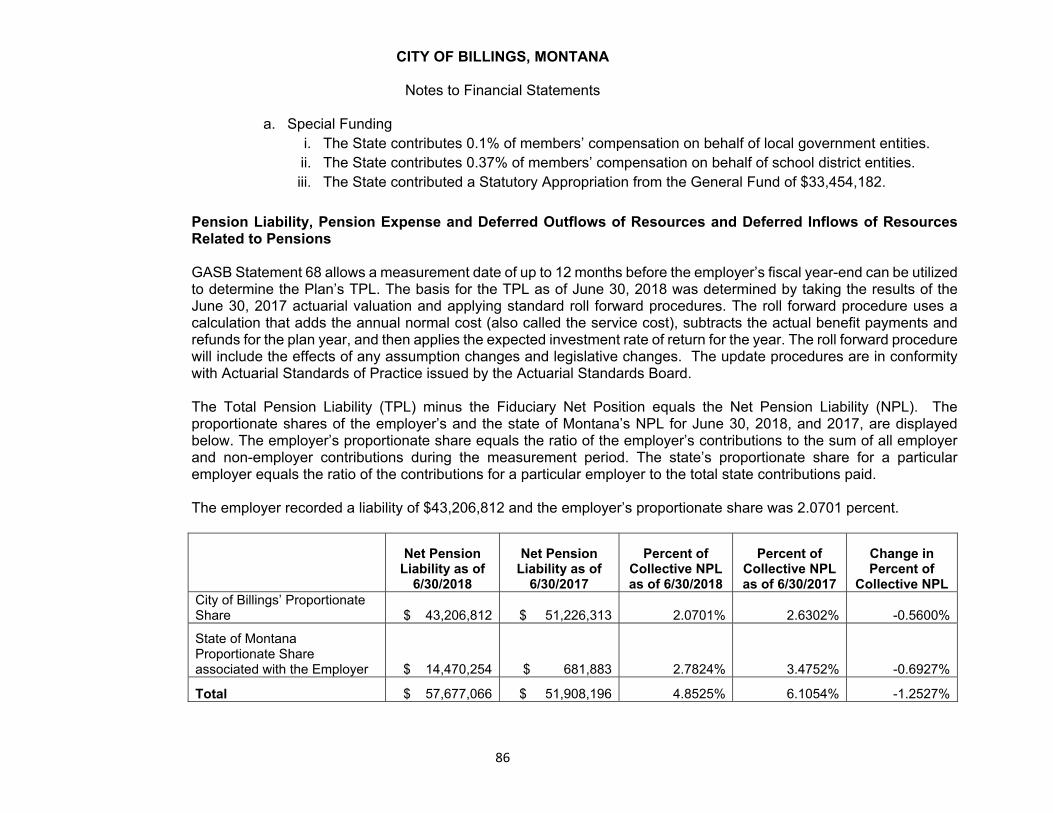
CITY OF BILLINGS, MONTANA
Notes to Financial Statements
86
a. Special Funding i. The State contributes 0.1% of members’ compensation on behalf of local government entities. ii. The State contributes 0.37% of members’ compensation on behalf of school district entities. iii. The State contributed a Statutory Appropriation from the General Fund of $33,454,182.
Pension Liability, Pension Expense and Deferred Outflows of Resources and Deferred Inflows of Resources Related to Pensions GASB Statement 68 allows a measurement date of up to 12 months before the employer’s fiscal year-end can be utilized to determine the Plan’s TPL. The basis for the TPL as of June 30, 2018 was determined by taking the results of the June 30, 2017 actuarial valuation and applying standard roll forward procedures. The roll forward procedure uses a calculation that adds the annual normal cost (also called the service cost), subtracts the actual benefit payments and refunds for the plan year, and then applies the expected investment rate of return for the year. The roll forward procedure will include the effects of any assumption changes and legislative changes. The update procedures are in conformity with Actuarial Standards of Practice issued by the Actuarial Standards Board. The Total Pension Liability (TPL) minus the Fiduciary Net Position equals the Net Pension Liability (NPL). The proportionate shares of the employer’s and the state of Montana’s NPL for June 30, 2018, and 2017, are displayed below. The employer’s proportionate share equals the ratio of the employer’s contributions to the sum of all employer and non-employer contributions during the measurement period. The state’s proportionate share for a particular employer equals the ratio of the contributions for a particular employer to the total state contributions paid. The employer recorded a liability of $43,206,812 and the employer’s proportionate share was 2.0701 percent.
Net Pension Liability as of
6/30/2018
Net Pension Liability as of
6/30/2017
Percent of Collective NPL as of 6/30/2018
Percent of Collective NPL as of 6/30/2017
Change in Percent of
Collective NPL City of Billings’ Proportionate Share $ 43,206,812 $ 51,226,313 2.0701% 2.6302% -0.5600%
State of Montana Proportionate Share associated with the Employer $ 14,470,254 $ 681,883 2.7824% 3.4752% -0.6927%
Total $ 57,677,066 $ 51,908,196 4.8525% 6.1054% -1.2527%

CITY OF BILLINGS, MONTANA
Notes to Financial Statements
87
Changes in actuarial assumptions and methods: There were no changes in assumptions or other inputs that affected the measurement of the TPL.
Changes in benefit terms: There have been no changes in benefit terms since the previous measurement date. Changes in proportionate share: There were no changes between the measurement date of the collective NPL and the employer’s reporting date that are expected to have a significant effect on the employer’s proportionate share of the collective NPL. Pension Expense The employer recognized its proportionate share of the PERS Pension Expense of $ 4,040,568. The employer also recognized grant revenue of $ 965,731 for the support provided by the State of Montana for the proportionate share of the Pension Expense associated with the employer. Additionally, the employer recognized grant revenue from the State Statutory Appropriation from the General Fund of $0. (Two years of pension expense are documented in the below table but are not necessary for the employer’s disclosures.)
Pension Expense as of Pension Expense as of 6/30/2018 6/30/2017
City of Billings’ Proportionate Share of PERS $ 4,040,568 $ 6,311,469 State of Montana Proportionate Share associated with the Employer $ 965,731 $ 36,353 Grant Revenue - State of Montana Coal Tax for employer $ - $ 732,801 Total $ 5,006,299 $ 7,080,623

CITY OF BILLINGS, MONTANA
Notes to Financial Statements
88
Recognition of Deferred Inflows and Outflows At June 30, 2018, the employer recognized its proportionate share of Plan’s deferred outflows of resources and deferred inflows of resources from the following sources:
Deferred Outflows of
Resources Deferred Inflows of
Resources Expected vs. Actual Experience $ 3,285,588 $ -
Projected Investment Earnings vs. Actual Investment Earnings $ - $ 671,001
Changes in Assumptions $ 3,674,091 $ -
Changes in Proportion and Differences Between Employer Contributions and Proportionate Share of Contributions $ - $ 5,658,364
Employer Contributions subsequent to the measurement date $ 2,992,642 $ -
Total $ 9,952,321 $ 6,329,365 Other amounts reported as deferred outflows and inflows of resources related to pensions will be recognized in Pension Expense as follows:
For the Reporting Year ended June 30:
Amount of deferred outflows and deferred inflows recognized in future years as an
increase or (decrease) to Pension Expense 2019 $ 2,027,3672020 $ 1,440,2032021 $ (2,561,548)2022 $ (275,708)2023 $ -
Thereafter $ -
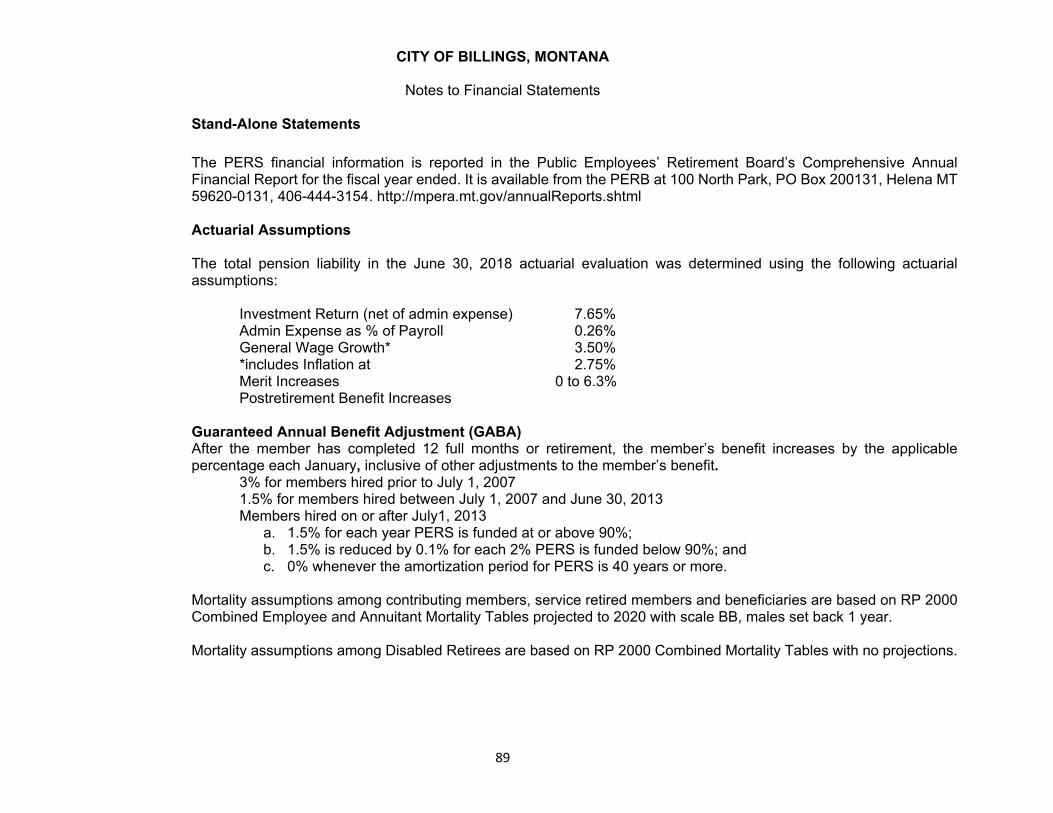
CITY OF BILLINGS, MONTANA
Notes to Financial Statements
89
Stand-Alone Statements The PERS financial information is reported in the Public Employees’ Retirement Board’s Comprehensive Annual Financial Report for the fiscal year ended. It is available from the PERB at 100 North Park, PO Box 200131, Helena MT 59620-0131, 406-444-3154. http://mpera.mt.gov/annualReports.shtml
Actuarial Assumptions The total pension liability in the June 30, 2018 actuarial evaluation was determined using the following actuarial assumptions:
Investment Return (net of admin expense) 7.65% Admin Expense as % of Payroll 0.26% General Wage Growth* 3.50% *includes Inflation at 2.75% Merit Increases 0 to 6.3% Postretirement Benefit Increases Guaranteed Annual Benefit Adjustment (GABA) After the member has completed 12 full months or retirement, the member’s benefit increases by the applicable percentage each January, inclusive of other adjustments to the member’s benefit.
3% for members hired prior to July 1, 2007 1.5% for members hired between July 1, 2007 and June 30, 2013 Members hired on or after July1, 2013
a. 1.5% for each year PERS is funded at or above 90%; b. 1.5% is reduced by 0.1% for each 2% PERS is funded below 90%; and c. 0% whenever the amortization period for PERS is 40 years or more.
Mortality assumptions among contributing members, service retired members and beneficiaries are based on RP 2000 Combined Employee and Annuitant Mortality Tables projected to 2020 with scale BB, males set back 1 year. Mortality assumptions among Disabled Retirees are based on RP 2000 Combined Mortality Tables with no projections.

CITY OF BILLINGS, MONTANA
Notes to Financial Statements
90
Target Allocations The most recent experience study, performed for the period covering fiscal years 2011 through 2016, is outlined in a report dated May 5, 2017 and can be located on the MPERA website. The long-term expected return on pension plan assets is reviewed as part of the regular experience studies prepared for the Plan. Several factors are considered in evaluating the long-term rate of return assumption including historical rates of return, rate of return assumptions adopted by similar public-sector systems, and by using a building-block method in which best-estimate ranges of expected future real rates of return (expected returns, net of pension plan investment expense and inflation) are developed for each major asset class. These ranges were combined to produce the long-term expected rate of return by weighting the expected future real rates of return by the target asset allocation percentage and by adding expected inflation. Best estimates of arithmetic real rates of return for each major asset class included in the target asset allocation (78c & 78f) as of June 30, 2018, are summarized below.
Asset Class Target Asset Allocation Long‐Term Expected Real Rate of Return
Cash Equivalents 2.6% 4.00% Domestic Equity 36.0% 4.55% Foreign Equity 18.0% 6.35% Fixed Income 23.4% 1.00% Private Equity 12.0% 7.75% Real Estate 8.0% 4.00% Total 100% 4.37%
Discount Rate The discount rate used to measure the Total Pension Liability was 7.65%. The projection of cash flows used to determine the discount rate assumed that contributions from participating plan members, employers, and non-employer contributing entities will be made based on the Board’s funding policy, which establishes the contractually required rates under Montana Code Annotated. The State contributes 0.1% of salaries for local governments and 0.37% for school districts. In addition, the State contributes coal severance tax and interest money from the general fund. The interest is contributed monthly and the severance tax is contributed quarterly. Based on those assumptions, the System’s fiduciary net position was projected to be adequate to make all the projected future benefit payments of current plan members through the year 2121. Therefore, the long-term expected rate of return on pension plan investments was applied to all periods of projected benefit payments to determine the Total Pension Liability. A municipal bond rate was not incorporated in the discount rate.

CITY OF BILLINGS, MONTANA
Notes to Financial Statements
91
Sensitivity Analysis The sensitivity of the NPL to the discount rate is shown in the table below. A small change in the discount rate can create a significant change in the liability. The NPL was calculated using the discount rate of 7.65%, as well as what the NPL would be if it were calculated using a discount rate of 1.00% lower or 1.00% higher than the current rate.
1.0% Decrease Current Discount 1.0% Increase
(6.65%) Rate (8.65%) Employer's Net Pension
Liability $62,487,057 $43,206,812 $27,374,658 PERS Disclosure for the defined contribution plan CITY OF BILLINGS contributed to the state of Montana Public Employee Retirement System Defined Contribution Retirement Plan (PERS-DCRP) for employees that have elected the DCRP. The PERS-DCRP is administered by the PERB and is reported as a multiple-employer plan established July 1, 2002, and governed by Title 19, chapters 2 & 3, MCA. All new PERS members are initially members of the PERS-DBRP and have a 12-month window during which they may choose to remain in the PERS-DBRP or join the PERS-DCRP by filing an irrevocable election. Members may not be participants of both the defined benefit and defined contribution retirement plans. Member and employer contribution rates are specified by state law and are a percentage of the member's compensation. Contributions are deducted from each member's salary and remitted by participating employers. The state Legislature has the authority to establish and amend contribution rates. Benefits are dependent upon eligibility and individual account balances. Participants are vested immediately in their own contributions and attributable income. Participants are vested after 5 years of membership service for the employer's contributions to individual accounts and the attributable income. Non-vested contributions are forfeited upon termination of employment per 19-3-2117(5), MCA. Such forfeitures are used to cover the administrative expenses of the PERS-DCRP. At the plan level for the measurement period ended June 30, 2018, the PERS-DCRP employer did not recognize any net pension liability or pension expense for the defined contribution plan. Plan level non-vested forfeitures for the 316 employers that have participants in the PERS-DCRP totaled $746,144.

CITY OF BILLINGS, MONTANA
Notes to Financial Statements
92
Pension plan fiduciary net position: The stand-alone financial statements (76d) of the Montana Public Employees Retirement Board (PERB) Comprehensive Annual Financial Report (CAFR) and the GASB 68 Report disclose the Plan’s fiduciary net position. The reports are available from the PERB at PO Box 200131, Helena MT 59620-0131, (406) 444-3154 or both are available on the MPERA website at http://mpera.mt.gov/index.shtml.
CITY OF BILLINGS FIREFIGHTERS’ UNIFIED RETIREMENT SYSTEM
GASB 68 NOTES TO THE FINANCIAL STATEMENTS FOR FISCAL YEAR ENDED
JUNE 30, 2018 (MEASUREMENT DATE) JUNE 30, 2019 (REPORTING DATE)
In accordance with GASB Statement 68, Accounting and Financial Reporting for Pensions, employers and the non-employer contributing entity are required to recognize and report certain amounts associated with participation in the Firefighters’ Unified Retirement System (the Plan). Employers are required to record and report their proportionate share of the collective Net Pension Liability; Pension Expense; and Deferred Outflows and Deferred Inflows of Resources associated with pensions. This report provides information for employers who are using a June 30, 2018, measurement date for the 2019 reporting. Summary of Significant Accounting Policies
MPERA prepared financial statements using the accrual basis of accounting. The same accrual basis was used by MPERA for the purposes of determining the NPL; Deferred Outflows of Resources and Deferred Inflows of Resources related to pensions; Pension Expense; the Fiduciary Net Position; and Additions to or Deductions from Fiduciary Net Position. Member contributions are recognized in the period in which contributions are due. Employer contributions are recognized when due and the employer has made a formal commitment to provide the contributions. Revenues are recognized in the accounting period they are earned and become measurable. Benefit payments and refunds are recognized in the accounting period in which they are due and payable in accordance with the benefit terms. Expenses are recognized in the period incurred. Investments are reported at fair value. MPERA adhered to all accounting principles generally accepted by the United States of America. MPERA applied all applicable pronouncements of the Governmental Accounting Standards Board (GASB).

CITY OF BILLINGS, MONTANA
Notes to Financial Statements
93
General Information about the Pension Plan Plan Description - The Firefighters’ Unified Retirement System (FURS), administered by the Montana Public Employee Retirement Administration (MPERA), is a multiple-employer, cost-sharing defined benefit plan established in 1981, and governed by Title 19, chapters 2 & 13, MCA. This system provides retirement benefits to firefighters employed by first- and second-class cities, other cities and rural fire district departments that adopt the plan, and to firefighters hired by the Montana Air National Guard on or after October 1, 2001. Benefits are established by state law and can only be amended by the Legislature. The FURS provides retirement, disability, and death benefits to plan members and their beneficiaries. Benefits provided – The FURS provides retirement, disability, and death benefits to plan members and their beneficiaries. Benefits are based on eligibility, years of service, and highest average compensation (HAC). Members’ rights are vested after five years of service. Service retirement and monthly benefit formula:
Hired on or after July 1, 1981, or has elected to be covered by GABA: o 20 years of membership service o 2.5% of HAC x years of service credit
Hired prior to July 1, 1981, and who had not elected to be covered by GABA, the greater of above, or: o If membership service is less than 20 years:
2% of the highest monthly compensation (HMC) x years of service credit and o If membership services is greater or equal to 20 years:
50% of HMC + 2% of HMC x years of service credit in excess of 20 o Early retirement: Age 50 with 5 years of membership service – Normal retirement benefit
calculated using HAC and service credit. Second retirement: Applies to retirement system members re-employed in a FURS position on or after July 1, 2017;
If the member works more than 480 hours in a calendar year and accumulates less than 5 years of service credit before terminating again, the member:
Is not awarded service credit for the period of re-employment; Is refunded the accumulated contributions associated with the period of re-employment;

CITY OF BILLINGS, MONTANA
Notes to Financial Statements
94
Starting the first month following termination of service, receives the same retirement benefit previously paid to the member; and
Does not accrue post-retirement benefit adjustments during the term of re-employment but receives a Guaranteed Annual Benefit Adjustment (GABA) in January immediately following second retirement.
If the member works more than 480 hours in a calendar year and accumulates at least 5 years of service credit before terminating again, the member:
Is awarded service credit for the period of re-employment; Starting the first month following termination of service, receives;
The same retirement benefit previously paid to the member; and A second retirement benefit for the period of re-employment calculated based on the laws
in effect as of the members’ rehire date, and o Does not accrue post-retirement benefit adjustments during the term of re-employment but
receives a GABA: On the initial retirement benefit in January immediately following second retirement, and On the second retirement benefit starting in January after receiving that benefit for at least
12 months. A member who returns to covered service is not eligible for a disability benefit.
Member’s compensation period used in benefit calculation
Hired prior to July 1, 1981 and not electing GABA: highest monthly compensation (HMC); Hired on or after June 30, 1981 and those electing GABA: highest average compensation (HAC) during
any consecutive 36 months. Part-time firefighter: 15% of regular compensation of a newly confirmed full-time firefighter.
Compensation Cap Hired on or after July 1, 2013 – 110% annual cap on compensation considered as part of a member’s
highest average compensation. Guaranteed Annual Benefit Adjustment (GABA)
Hired on or after July 1, 1997, or those electing GABA – and has been retired for at least 12 months - the member’s benefit increases by 3% each January.

CITY OF BILLINGS, MONTANA
Notes to Financial Statements
95
Minimum Benefit Adjustment (non-GABA) If hired before July 1, 1997, and the member did not elect GABA – the monthly benefit adjustment is provided equal to 50% of the current base compensation of a newly confirmed active firefighter of the employer that last employed the member as a firefighter.
Contributions – The state Legislature has the authority to establish and amend contribution rates to the plan. Member and employer contributions rates are specified by the Montana Stature and are a percentage of the members’ compensation. Contributions are deducted from each member’s salary and remitted by participating employers. Special Funding: MCA 19-13-604 requires the State f Montana to contribute a percentage of the total compensation directly to the Plan annually after the end of each fiscal year. Member, Employer and State contribution rates are shown in the table below:
Member Fiscal Year Non-GABA GABA Employer State 1998 - 2019 9.50% 10.70% 14.36% 32.61% 1997 7.80% 14.36% 32.61%
Pension Liability, Pension Expense and Deferred Outflows of Resources and Deferred Inflows of Resources Related to Pensions. GASB Statement 68 allows a measurement date of up to 12 months before the employer’s fiscal year-end can be utilized to determine the Plan’s TPL. The basis for the TPL as of June 30, 2018 was determined by taking the results of the June 30, 2017 actuarial valuation and applying standard roll forward procedures. The roll forward procedure uses a calculation that adds the annual normal cost (also called the service cost), subtracts the actual benefit payments and refunds for the plan year, and then applies the expected investment rate of return for the year. The roll forward procedure will include the effects of any assumption changes and legislative changes. The update procedures are in conformity with Actuarial Standards of Practice issued by the Actuarial Standards Board. The Total Pension Liability (TPL) minus the Fiduciary Net Position equals the Net Pension Liability (NPL). The proportionate shares of the employer’s and the state of Montana’s NPL for June 30, 2018, and 2017, are displayed below. The employer’s proportionate share equals the ratio of the employer’s contributions to the sum of all employer and non-employer contributions during the measurement period. Due to the existence of the special funding situation, the state is required to report a proportionate share of a local government's collective NPL that is associated with the non-state employer. The state’s proportionate share for a particular employer equals the ratio of the contributions for a particular employer to the total state contributions paid.

CITY OF BILLINGS, MONTANA
Notes to Financial Statements
96
The employer recorded a liability of $ 7, 279,674 and the employer’s proportionate share was 6.3207 percent.
Net Pension Liability as of
6/30/2018
Net Pension Liability as of
6/30/2017
Percent of Collective NPL as of 6/30/2018
Percent of Collective NPL as of 6/30/2017
Change in Percent of Collective
NPL
City of Billings’ Proportionate Share
$ 7,279,674 $ 7,217,811 6.3207% 6.3855% (0.0648%)
State of Montana Proportionate Share associated with the Employer $ 16,645,365 $ 16,390,864 21.2626% 21.3635% (0.1009%)
Total $ 23,925,039 $ 23,608,675 27.5833% 27.7490% (0.1657%)
Changes in actuarial assumptions and methods: There were no changes in assumptions or other inputs that affected the measurement of the TPL. Changes in benefit terms: There have been no changes in benefit terms since the previous measurement date. Changes in proportionate share: There were no changes between the measurement date of the collective NPL and the employer’s reporting date that are expected to have a significant effect on the employer’s proportionate share of the collective NPL. Pension Expense – At June 30, 2018 measurement date, the employer recognized its proportionate share of the Plan’s pension expense of $1,039,931. The employer also recognized grant revenue of $3,350,218 for the support provided by the state of Montana for the proportionate share of the pension expense that is associated with the employer. Pension Expense as of Pension Expense as of
6/30/2018 6/30/2017
City of Billings’ Proportionate Share of FURS $ 1,039,931 $ 1,049,572
Employer Grant Revenue - State of Montana Proportionate Share for the Employer $ 3,350,218 $ 3,112,913Total $ 4,390,149 $ 4,162,485

CITY OF BILLINGS, MONTANA
Notes to Financial Statements
97
Recognition of deferred inflows and outflows
At June 30, 2018, the employer reported its proportionate share of FURS’ deferred outflows of resources and deferred inflows of resources relate to FURS from the following sources:
Deferred Outflows
of Resources Deferred Inflows
of Resources Expected vs. Actual Experience $ 817,141 $ 40,103 Projected Investment Earnings vs. Actual Investment Earnings $ - $ 88,299 Changes in Assumptions $ 712,791 $ - Changes in Proportion and Differences Between Employer Contributions and Proportionate Share of Contributions $ - $ 191,509 Employer Contributions subsequent to the measurement date $ 1,498,669 Total $ 3,028,601 $ 319,911
Other amounts reported as deferred outflows and inflows of resources related to pensions will be recognized in Pension Expense as follows:
For the Reporting Year ended June 30:
Amount of deferred outflows and deferred inflows recognized in future years as an
increase or (decrease) to Pension Expense 2019 $ 436,8302020 $ 304,7362021 $ 49,7962022 $ 273,444 Thereafter $ 145,216

CITY OF BILLINGS, MONTANA
Notes to Financial Statements
98
Actuarial Assumptions – The total pension liability in the June 30, 2018 actuarial evaluation was determined using the following actuarial assumptions.
Investment Return (net of admin expense) 7.65% Admin Expense as % of Payroll 0.23% General Wage Growth* 3.50% *includes Inflation at 2.75% Merit Increases 0% to 6.30% Post Retirement Increases 1. Guaranteed Annual Benefit Adjustment (GABA) each January ● Members hired on or after 3.00% July 1, 1997 or those electing GABA
● Requires 12 full months of retirement before GABA will be made 2. Minimum Benefit Adjustment (non-GABA) The minimum benefit provided should be less than 50%
of the current base compensation of a newly confirmed active firefighter of the employer that last employed the member as a firefighter
● Members with 10 or more years of membership service and member did not elect GABA
Mortality: ● Contributing members, Service Retired RP-2000 Combined Employee and Members & beneficiaries Annuitant Mortality Tables projected to 2020 with scale BB, set back one year for males ● Disabled Members PR-2000 Combined Mortality Table with
no projections

CITY OF BILLINGS, MONTANA
Notes to Financial Statements
99
The most recent experience study, performed for the period covering fiscal years 2011 through 2016, is outlined in a report dated May 5, 2017 and can be located on the MPERA website. The long-term expected return on pension plan assets is reviewed as part of the regular experience studies prepared for the Plan. Several factors are considered in evaluating the long-term rate of return assumption including historical rates of return, rate of return assumptions adopted by similar public-sector systems, and by using a building-block method in which best-estimate ranges of expected future real rates of return (expected returns, net of pension plan investment expense and inflation) are developed for each major asset class. These ranges were combined to produce the long-term expected rate of return by weighting the expected future real rates of return by the target asset allocation percentage and by adding expected inflation. Best estimates of arithmetic real rates of return for each major asset class included in the target asset allocation (78c & 78f) as of June 30, 2018, are summarized below.
Asset Class Target Asset Allocation Long-Term Expected Real Rate of
Return Cash Equivalents 2.6% 4.00% Domestic Equity 36.0% 4.55% Foreign Equity 18.0% 6.35% Fixed Income 23.4% 1.00% Private Equity 12.0% 7.75% Real Estate 8.0% 4.00% Total 100%
Discount Rate - The discount rate used to measure the TPL was 7.65%. The projection of cash flows used to determine the discount rate assumed that contributions from participating plan members, employers, and non-employer contributing entities would be made based on the Board’s funding policy, which established the contractually required rates under the Montana Code Annotated. The State contributed 32.61% of the salaries paid by employers. Based on those assumptions, the Plan’s fiduciary net position was projected to be adequate to make all the projected future benefit payments of current plan members through the year 2134. Therefore, the long- term expected rate of return on pension plan investments was applied to all periods of projected benefit payments to determine the TPL. A municipal bond rate was not incorporated in the discount rate.
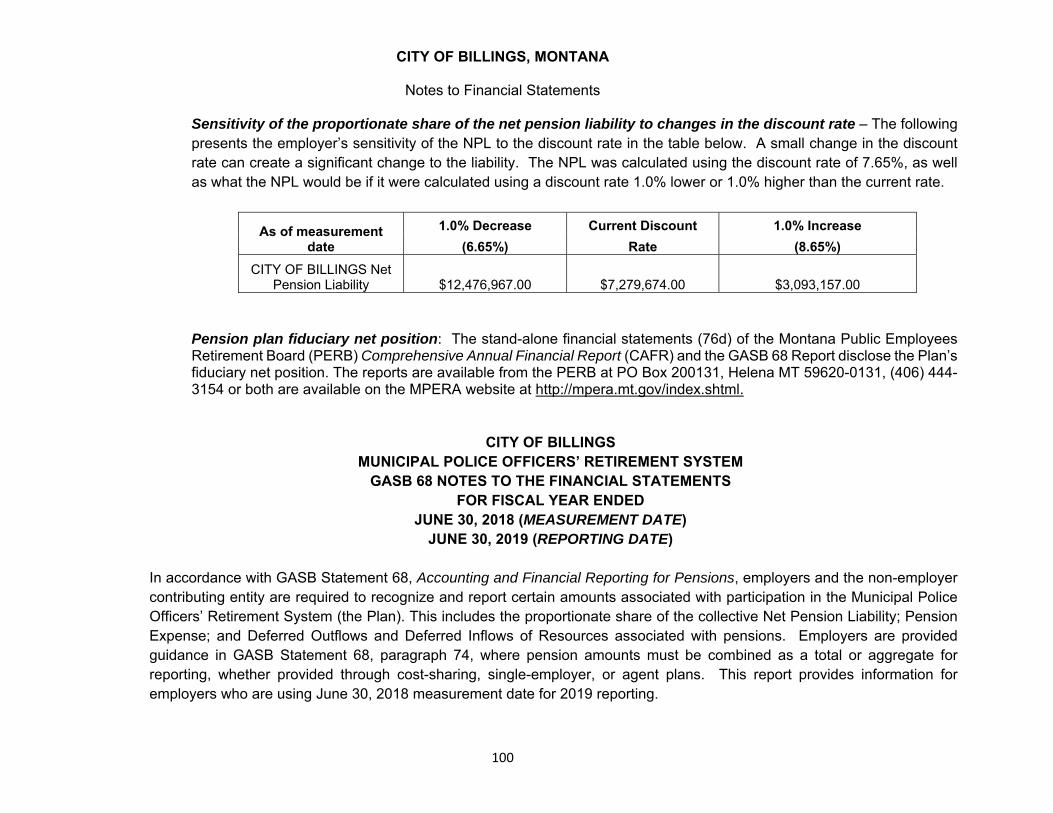
CITY OF BILLINGS, MONTANA
Notes to Financial Statements
100
Sensitivity of the proportionate share of the net pension liability to changes in the discount rate – The following presents the employer’s sensitivity of the NPL to the discount rate in the table below. A small change in the discount rate can create a significant change to the liability. The NPL was calculated using the discount rate of 7.65%, as well as what the NPL would be if it were calculated using a discount rate 1.0% lower or 1.0% higher than the current rate.
As of measurement date
1.0% Decrease Current Discount 1.0% Increase (6.65%) Rate (8.65%)
CITY OF BILLINGS Net Pension Liability $12,476,967.00 $7,279,674.00 $3,093,157.00
Pension plan fiduciary net position: The stand-alone financial statements (76d) of the Montana Public Employees Retirement Board (PERB) Comprehensive Annual Financial Report (CAFR) and the GASB 68 Report disclose the Plan’s fiduciary net position. The reports are available from the PERB at PO Box 200131, Helena MT 59620-0131, (406) 444-3154 or both are available on the MPERA website at http://mpera.mt.gov/index.shtml.
CITY OF BILLINGS
MUNICIPAL POLICE OFFICERS’ RETIREMENT SYSTEM GASB 68 NOTES TO THE FINANCIAL STATEMENTS
FOR FISCAL YEAR ENDED JUNE 30, 2018 (MEASUREMENT DATE)
JUNE 30, 2019 (REPORTING DATE)
In accordance with GASB Statement 68, Accounting and Financial Reporting for Pensions, employers and the non-employer contributing entity are required to recognize and report certain amounts associated with participation in the Municipal Police Officers’ Retirement System (the Plan). This includes the proportionate share of the collective Net Pension Liability; Pension Expense; and Deferred Outflows and Deferred Inflows of Resources associated with pensions. Employers are provided guidance in GASB Statement 68, paragraph 74, where pension amounts must be combined as a total or aggregate for reporting, whether provided through cost-sharing, single-employer, or agent plans. This report provides information for employers who are using June 30, 2018 measurement date for 2019 reporting.
CITY OF BILLINGS, MONTANA
Notes to Financial Statements
101
Summary of Significant Accounting Policies MPERA prepared financial statements using the accrual basis of accounting. The same accrual basis was used by MPERA for the purposes of determining the Net Pension Liability (NPL); Deferred Outflows of Resources and Deferred Inflows of Resources related to pensions, Pension Expense; the Fiduciary Net Position; and Additions to or Deductions from Fiduciary Net Position. Member contributions are recognized in the period in which contributions are due. Employer contributions are recognized when due and the employer has made a formal commitment to provide the contributions. Revenues are recognized in the accounting period they are earned and become measurable. Benefit payments and refunds are recognized in the period incurred. Investments are reported at fair value. MPERA adhered to all accounting principles generally accepted by the United States of America. MPERA applied all applicable pronouncements of the Governmental Account Standards Board (GASB). General Information about the Pension Plan Plan Description: The Municipal Police Officers’ Retirement System (MPORS), administered by the Montana Public Employee Retirement Administration (MPERA), is a multiple-employer, cost-sharing defined benefit plan established in 1974 and governed by Title 19, chapters 2 & 9, Montana Code Annotated (MCA). This plan provides retirement benefits to all municipal police officers employed by first- and second-class cities and other cities that adopt the plan. Benefits are established by state law and can only be amended by the Legislature. Deferred Retirement Option Plan (DROP): Beginning July 2002, eligible members of MPORS can participate in the DROP by filing a one-time irrevocable election with the Board. The DROP is governed by Title 19, Chapter 9, Part 12, MCA. A member must have completed at least twenty years of membership service to be eligible. They may elect to participate in the DROP for a minimum of one month and a maximum of 60 months and may only participate in the DROP once. A participant remains a member of the MPORS, but will not receive membership service or service credit in the system for the duration of the member’s DROP period. During participation in the DROP, all mandatory contributions continue to the retirement system. A monthly benefit is calculated based on salary and years of service to date as of the beginning of the DROP period. The monthly benefit is paid into the member’s DROP account until the end of the DROP period. At the end of the DROP period, the participant may receive the balance of the DROP account in a lump-sum payment or in a direct rollover to another eligible plan, as allowed by the IRS. If the participant continues employment after the DROP period ends, they will again accrue membership service and service credit. The DROP account cannot be distributed until employment is formally terminated.

CITY OF BILLINGS, MONTANA
Notes to Financial Statements
102
Benefits provided: MPORS provides, retirement, disability, and death benefits to plan members and their beneficiaries. Benefits are based on eligibility, years of service, and compensation. Member rights are vested after five years of service.
Service retirement 20 years of membership service, regardless of age Age 50 with 5 years of membership service 2.5% of FAC x years of service credit.
Second retirement: Re-calculated using specific criteria for members who return to covered MPORS employment prior to July 1, 2017.
Less than 20 years of membership service, upon re-employment, repay benefits and subsequent retirement is
based on total MPORS service. More than 20 years of membership service, upon re-employment, receives initial benefit and a new retirement
benefit based on additional service credit and FAX after re-employment. Applies to retirement system members re-employed in a MPORS position on or after July 1, 2017.
1. If the member works more than 480 hours in a calendar year and accumulates less than 5 years of service credit before terminating again, the member:
o Is not awarded service credit for the period of re-employment; o Is refunded the accumulated contributions associated with the period of reemployment; o Starting the first month following termination of service, receives the same retirement benefit previously
paid to the member; and o Does not accrue post-retirement benefit adjustments during the term of reemployment, but receives a
Guaranteed Annual Benefit Adjustment (GABA) in January immediately following second retirement. 2. If the member works more than 480 hours in a calendar year and accumulates at least 5 years of service credit
before terminating again, the member: a. Is awarded service credit for the period of reemployment; b. Starting the first month following termination of service, receives:
The same retirement benefit previously paid to the member, and A second retirement benefit for the period of reemployment calculated based on the laws in effect as of
the member’s rehire date; and c. Does not accrue post-retirement benefit adjustments during the term of reemployment but receives a GABA:
On the initial retirement benefit in January immediately following second retirement, and On the second retirement benefit starting in January after receiving that benefit for at least 12 months.

CITY OF BILLINGS, MONTANA
Notes to Financial Statements
103
3. A member who returns to covered service is not eligible for a disability benefit.
Member’s final average compensation (FAC) Hired prior to July 1, 1977 – average monthly compensation of final year of service; Hired on or after July 1, 1977 – final average compensation (FAC) for last consecutive 36 months.
Compensation Cap
Hired on or after July 1 2013 – 110% annual cap on compensation considered as a part of a member’s FAC. Guaranteed Annual Benefit Adjustment (GABA)
Hired on or after July 1, 1997, or those electing GABA and has been retired for at least 12 months, a GABA will be made each year in January equal to 3%.
Minimum benefit adjustment (non-GABA)
The minimum benefit provided may not be less than 50% of the compensation paid to a newly confirmed police officer of the employer that last employed the member as a police officer in the current fiscal year.
Contributions – The State Legislature has the authority to establish and amend contribution rates to the plan. Member and employer contribution rates are specified by Montana Statute and are a percentage of the member’s compensation. Contributions are deducted from each member’s salary and remitted by participating employers. Special Funding – MCA 19-9-702 requires the State of Montana to contribute a percentage of total compensation directly to the Plan annually after the end of each fiscal year. Member, Employer and State contribution rates are shown in the table below.
Member
Fiscal Year Hired <7/1/75 Hired >6/30/75 Hired >6/30/79 Hired >6/30/97 GABA Employer State
2000-2019 5.80% 7.00% 8.50% 9.00% 14.41% 29.37% 1998-1999 7.80% 9.00% 10.50% 11.00% 14.41% 29.37% 1997 7.80% 9.00% 10.50% 14.36% 29.37%

CITY OF BILLINGS, MONTANA
Notes to Financial Statements
104
Pension Liabilities, Pension Expense and Deferred Outflows of Resources and Deferred Inflows of Resources Related to Pensions. GASB Statement 68 allows a measurement date of up to 12 months before the employer’s fiscal year-end can be utilized to determine the Plan’s TPL. The basis for the TPL as of June 30, 2018 was determined by taking the results of the June 30, 2017 actuarial valuation and applying standard roll forward procedures. The roll forward procedure uses a calculation that adds the annual normal cost (also called the service cost), subtracts the actual benefit payments and refunds for the plan year, and then applies the expected investment rate of return for the year. The roll forward procedure will include the effects of any assumption changes and legislative changes. The update procedures are in conformity with Actuarial Standards of Practice issued by the Actuarial Standards Board. The Total Pension Liability (TPL) minus the Fiduciary Net Position equals the Net Pension Liability (NPL).The proportionate shares of the employer’s and the State of Montana’s NPL for June 30, 2018, and 2017, are displayed below. The employer’s proportionate share equals the ratio of the employer’s contributions to the sum of all employer and non-employer contributions during the measurement period. Due to the existence of the special funding situation, the state is required to report a proportionate share of a local government's collective NPL that is associated with the non-state employer. The state’s proportionate share for a particular employer equals the ratio of the contributions for a particular employer to the total state contributions paid. The employer recorded a liability of $12,572,529 and employer’s proportionate share was 7.3413 percent.
Net Pension
Liability as of 6/30/2018
Net Pension Liability as of
6/30/2017
Percent of Collective NPL as
of 6/30/2018
Percent of Collective NPL as of 6/30/2017
Change in Percent of
Collective NPL City of Billings’ Proportionate Share
$ 12,572,529 $ 12,566,878 7.3413% 7.0635% 0.2778%
State of Montana Proportionate Share associated with the Employer $ 25,694,029 $ 25,613,434 22.3512% 21.4601% 0.8911% Total $ 38,266,558 $ 38,180,312 29.6925% 28.5236% 1.1689%
Changes in actuarial assumptions and methods: There were no changes in assumptions or other inputs that affected the measurement of the TPL. Changes in benefit terms: There have been no changes in benefit terms since the previous measurement date.

CITY OF BILLINGS, MONTANA
Notes to Financial Statements
105
Changes in proportionate share: There were no changes between the measurement date of the collective NPL and the employer’s reporting date that are expected to have a significant effect on the employer’s proportionate share of the collective NPL. Pension Expense – At June 30, 2018 measurement date, the employer recognized its proportionate share of the Plan’s pension expense of $1,484,001. The employer also recognized grant revenue of $3,541,968 for the support provided by the State of Montana for the proportionate share of the pension expense that is associated with the employer. (Two years of pension expense are documented in the above table, but are not necessary for the employer’s disclosures.)
As of measurement date Pension Expense as of Pension Expense as of 6/30/2018 6/30/2017
City of Billings’ Proportionate Share of MPORS $ 1,484,001 $ 1,458,889State of Montana Proportionate Share associated with the Employer $ 3,541,968 $ 3,102,334
Total $ 5,025,969 $ 4,561,223
Recognition of Deferred Inflows and Outflows – At June 30, 2018, the employer reported its proportionate share of the Plan’s deferred outflows of resources and deferred inflows of resources from the following sources:
Deferred Outflows of
Resources Deferred Inflows of
Resources Expected vs. Actual Experience $ 35,242 $ 250,756Projected Investment Earnings vs. Actual Investment Earnings $ - $ 95,331Changes in Assumptions $ 587,733 $ -Changes in Proportion and Differences Between Employer Contributions and Proportionate Share of Contributions $ 398,807 $ -
Employer Contributions subsequent to the measurement date $ 1,727,498 $ -Total $ 2,749,280 $ 346,088
CITY OF BILLINGS, MONTANA
Notes to Financial Statements
106
Other amounts reported as deferred outflows and inflows of resources related to pensions will be recognized in Pension Expense as follows:
For the Reporting Year ended June 30:
Amount of deferred outflows and deferred inflows recognized in future years as an increase or
(decrease) to Pension Expense
2019 $ 453,5092020 $ 395,6592021 $ (117,414)2022 $ (56,060)2023 $ - Thereafter $ -

CITY OF BILLINGS, MONTANA
Notes to Financial Statements
107
Actuarial Assumptions – The total pension liability in the June 30, 2018 actuarial valuation was determined using the following actuarial assumptions.
The most recent experience study, performed for the period covering fiscal years 2011 through 2016, is outlined in a report dated May 5, 2017 and can be located on the MPERA website. The long-term expected return on pension plan assets is reviewed as part of the regular experience studies prepared for the Plan. Several factors are considered in evaluating the long-term rate of return assumption including historical rates of return, rate of return assumptions adopted by similar public-sector systems, and by using a building-block method in which best-estimate ranges of expected future real rates of return (expected returns, net of pension plan investment expense and inflation) are developed for each
Investment Return (net of admin expense) 7.65% Admin Expense as % of Payroll 0.24% General Wage Growth* 3.50% *includes Inflation at 2.75% Merit Increases 0% to 6.60% Post Retirement Increases 1. Guaranteed Annual Benefit Adjustment (GABA) each January ● Members hired on or after July 1, 1997, 3.00% or those electing GABA ● Requires 12 full months of retirement before GABA will be made 2. Minimum Benefit Adjustment (non-GABA) The minimum benefit provided should not ● Benefit for a retired member or member's be less than 50% of the monthly survivor and member did not elect GABA compensation paid to a newly confirmed police officer of the employer that last employed the member as a police officer Mortality: ● Contributing members, Service Retired RP-2000 Combined Employee and Members & beneficiaries Annuitant Mortality Tables projected to 2020 with scale BB, set back one year for males ● Disabled Retirees PR-2000 Combined Mortality Table with no projects
CITY OF BILLINGS, MONTANA
Notes to Financial Statements
108
major asset class. These ranges were combined to produce the long-term expected rate of return by weighting the expected future real rates of return by the target asset allocation percentage and by adding expected inflation. Best estimates of arithmetic real rates of return for each major asset class included in the target asset allocation (78c & 78f) as of June 30, 2018, are summarized below.
Asset Class Target Asset Allocation Long-Term Expected Real
Rate of Return Cash Equivalents 2.6% 4.00% Domestic Equity 36.0% 4.55% Foreign Equity 18.0% 6.35% Fixed Income 23.4% 1.00% Private Equity 12.0% 7.75% Real Estate 8.0% 4.00%
Total 100.0%
Discount Rate – The discount rate used to measure the PPL was 7.65%. The projection of cash flows used to determine the discount rate assumed that contributions from participating plan members, employers, and non-employer contributing entities would be made based on the Board’s funding policy, which established the contractually required rates under the Montana Code Annotated. The state contributed 29.37% of the salaries paid by the employers. Based on those assumptions, the Plan’s fiduciary net position was projected to be adequate to make all the projected future benefit payments of current plan members through the year 2132. Therefore, the long-term expected rate of return on pension plan investments was applied to all periods of projected benefit payments to determine the TPL. A municipal bond rate was not incorporated in the discount rate. Sensitivity of the proportionate share of the net pension liability to changes in the discount rate – The following presents the employer’s sensitivity of the NPL to the discount rate in the table below. A small change in the discount rate can create a significant change to the liability. The NPL was calculated using the discount rate of 7.65%, as well as what the NPL would be if it was calculated using a discount rate 1.0% lower and 1.0% higher than the current rate.

CITY OF BILLINGS, MONTANA
Notes to Financial Statements
109
1.0% Decrease Current Discount 1.0% Increase (6.65%) Rate (8.65%)
City of Billings’ Net Pension Liability $19,093,365 $12,572,529 $7,357,599 Pension plan fiduciary net position – The stand-alone financial statements of the Montana Public Employees Retirement (PERB) Comprehensive Annual Financial Report (CAFR) and the GASB 68 Report disclose the Plan’s fiduciary net position. The reports are available from the PERB at PO Box 200131, Helena MT 59620-0131, 406-444-3154 or both are available on the MPERA website at http://mpera.mt.gov/index.shtml.
PERS-defined contributions retirement plan (DCRP)
The City of Billings contributed to the state of Montana Public Employee Retirement System Defined Contribution Retirement Plan (PERS-DCRP) for employees that have elected the DCRP. The PERS-DCRP is administered by the PERB and is reported as a multiple-employer plan established July 1, 2002, and governed by Title 19, chapters 2 & 3, MCA.
All new PERS members are initially members of the PERS-DBRP and have a 12-month window during which they may choose to remain in the PERS DBRP or join the PERS DCRP by filing an irrevocable election. Members may not be participants of both the defined benefit and defined contribution retirement plans.
Member and employer contribution rates are specified by state law and are a percentage of the member’s compensation. Contributions are deducted from each member’s salary and remitted by participating employers. The state Legislature has the authority to establish and amend contribution rates.
Benefits are dependent upon eligibility and individual account balances. Participants are vested immediately in their own contributions and attributable income. Participants are vested after 5 years of membership services for the employer’s contributions to individual accounts and the attributable income. Non-vested contributions are forfeited upon termination of employment per 19-3-2117(5), MCA. Such forfeitures are used to cover the administrative expenses of the PERS-DCRP.
At the plan level for the measurement period ended June 30, 2017, the PERS-DCRP employer did not recognize any net pension liability or pension expense for the defined contribution plan. Plan level non-vested forfeitures for the 300 employers that have participants in the PERS-DCRP totaled $396,650.
REQUIRED SUPPLEMENTAL INFORMATION

Required Supplemental Information
110
Original Budget Final Budget Actual Variance
Revenues:Taxes 16,790,920$ 16,790,920$ 16,846,703$ (55,783)$ Licenses and permits 2,146,291 2,146,291 2,234,380 (88,089)Intergovernmental 11,430,866 11,430,866 11,404,984 25,882Charges for services 4,032,642 4,032,642 4,256,806 (224,164)Fines and forteitures 1,656,203 1,656,203 1,271,808 384,395Special assessments - - 189 (189)Other 217,000 217,000 727,582 (510,582)
Total revenues 36,273,922 36,273,922 36,742,452 (468,530)
Expenditures:Current: General government 6,772,214$ 7,187,816$ 6,958,759$ 229,057$ Public safety 612,809 697,207 508,379 188,828 Culture and recreation 5,451,134 5,510,321 5,194,880 315,441Capital outlay - - 14,594 (14,594)Debt service:
Total expenditures 12,836,157 13,395,344 12,676,612 718,732
Revenues over (under) expenditures 23,437,765 22,878,578 24,065,840 (1,187,262)
Other financing sources (uses): Transfers in 6,600 6,600 2,022 4,578 Transfers out (31,037,603) (31,855,087) (29,385,533) (2,469,554) Total other financing sources (uses) (31,031,003) (31,848,487) (29,383,511) (2,464,976)
Net change in fund balances (7,593,238)$ (8,969,909)$ (5,317,671) (3,652,238)$
Fund balance, beginning of year 27,717,469Fund balance, end of year 22,399,798$
The notes to the financial statements are an integral part of this statement.
CITY OF BILLINGS, MONTANAGeneral Fund
Schedule of Revenues, Expenditures and Changes in Fund Balance-Budget to ActualFor the Fiscal Year Ended June 30, 2019

Required Supplemental Information
111
Original Budget Final Budget Actual Variance
Revenues:Taxes 12,938,519$ 12,680,422$ 12,947,901$ (267,479)$ Licenses and permits 27,700 23,000 38,922 (15,922)Intergovernmental 2,815,211 2,955,145 3,095,248 (140,103)Charges for services 1,482,387 1,622,321 1,778,084 (155,763)Fines and forteitures 2,400 2,400 2,540 (140)Other 29,395 29,395 78,501 (49,106)Total revenues 17,295,612 17,312,683 17,941,196 (628,513)Expenditures:Current: Public safety 40,713,355 42,016,825 41,529,150 487,675 Public health 954,131 964,820 964,431 389Capital outlay 1,464,000 1,800,604 488,425 1,312,179 Total expenditures 43,131,486 44,782,249 42,982,006 1,800,243 Revenues over (under) expenditures (25,835,874) (27,469,566) (25,040,810) (2,428,756)Other financing sources (uses): Transfers in 27,223,436 28,040,920 25,666,599 2,374,321 Transfers out (1,387,562) (1,387,562) (1,346,998) (40,564) Sale of capital assets - - 2,355 (2,355) Total other financing sources (uses) 25,835,874 26,653,358 24,321,956 2,331,402 Net change in fund balances -$ (816,208)$ (718,854) (97,354)$ Fund balance, beginning of year 2,190,587Fund balance, end of year 1,471,733$
The notes to the financial statements are an integral part of this statement.
CITY OF BILLINGS, MONTANAMajor Special Revenue Fund - Public Safety
Schedule of Revenues, Expenditures and Changes in Fund Balance-Budget to ActualFor the Fiscal Year Ended June 30, 2019

Required Supplemental Information
112
A. Budgetary Information Budgets are legally required and are prepared for all the City’s governmental funds. Except for on-behalf payments by the State of Montana for pension plan contributions, these budgets are prepared on the same basis and use the same accounting practices as are used to account for and prepare financial reports for the governmental funds, consistent with accounting principles generally accepted in the United States of America. The City follows these procedures in establishing the budgetary data reflected in the financial statements: 1) On or before June 1st, all departments and agencies of the City submit requests for appropriations to the city administrator
so that a budget may be prepared.
2) Before June 10th, the proposed budget and tax levy must be submitted to the city clerk and then is presented to the city council for review and approval.
3) The council holds public hearings and a final budget and tax levy must be prepared, adopted, and submitted to the county
auditor, no later than the first Thursday in September or within 30 calendar days of receiving certified taxable values from the Montana Department of Revenue.
The level of budgetary control (that is the level at which expenditures cannot legally exceed the appropriated amount) is established at the fund level. The city council may amend the budget at the fund level by reducing appropriations when (1) a shortfall is anticipated and budgeted revenues occur resulting in expenditures for the year exceeding actual revenues and available cash balances or, (2) savings result from unanticipated adjustments in projected expenditures. Amended appropriations are made at the total expenditure, or fund level, and public hearings are required. Annual appropriated budgets are adopted for all the City’s funds, and all annual appropriations lapse at fiscal yearend. Encumbrances represent commitments related to unperformed contracts for goods or services. Encumbrances outstanding at year end will be re-appropriated and honored during the subsequent year. The annual appropriated budget was amended during the year. The major fund amendments were for the General Fund; Public Safety Fund; Nonmajor Special Revenue Funds: Development Services Grants Fund; Library Fund; Storm Sewer; North 27th Street Tax Increment Operating; South Tax Increment Operating; East Tax Increment Operating; Arterial Streets; EOC 911; Fire Grants; Gas Tax; Park District 1; City County Planning; Baseball Field/Stadium Donation for Capital Maintenance; Nonmajor Debt Service Funds: Sidewalk Debt Service; Nonmajor Capital Project Funds: Storm Sewer Construction; Special Improvement Districts; and Sidewalk and Curb

Required Supplemental Information
113
Districts Fund; Capital Replacement Fund; Enterprise Funds: Water Fund, and Solid Waste Fund; and Internal Service Funds: Facilities Management Fund. Management can transfer appropriations between and among expenditure classes of salaries and benefits, operations and maintenance, capital outlay, interest and debt redemption, or miscellaneous without city council approval or a public hearing, provided that no salary shall be increased above the amount appropriated. As a matter of management accountability, the city council is informed of all appropriation transfers. Spending control is established by the total amount of expenditures budgeted for the fund, but management control is exercised at budgetary line item levels. Individual fund budgets are the same as the appropriation amounts.
B. Reconciliation of Budgetary Revenues and Expenditures and GAAP Revenues and Expenditures Public Safety
FundRevenues
17,941,196$
Differences-budget to GAAP:
On-behalf payments by the State of Montana for pension plan contributions are not a budgetary resource but are revenues for financial reporting purposes 6,924,248
24,865,444$
Expenditures
42,982,006$
Differences-budget to GAAP:
On-behalf payments by the State of Montana for pension plan contributions are not a budgetary outflow but are expenditures for financial reporting purposes 6,924,248
49,906,254$
Actual amounts (budgetary basis) "Total revenues" from the budget
Total revenues as reported on the statement of revenues, expenditures, and changes in fund balances-governmental funds
Actual amounts (budgetary basis) "Total expenditures" from the budget
Total expenditures as reported on the statement of revenues, expenditures, and changes in fund balances-governmental funds

Required Supplemental Information
114
C. Other Post-Employment Benefits Liability Actuarial Assumptions and Methods Valuation Date June 30, 2019 Measurement Date June 30, 2019 Discount Rate 3.86% per annum For unfunded plans: Discount rate is based on index rate for 20-year tax-exempt general obligation bonds with an average rating of AA/Aa or higher [Bond Buyer 20-Bond GO Index]. For fully funded plans: Discount rate is based on expected long-term rate of return on plan investments where assets are projected to cover all future benefit payments. Salary Increase Rate 3.0% per annum Inflation Rate 3.0% per annum Census Data The census was provided by the City as of June 30, 2019. Marriage Rate The assumed number of eligible spouses is based on the current information in the census provided. Spouse Age Male spouses are assumed to be three years older than female spouses. Medicare Eligibility All current and future retirees are assumed to be eligible for Medicare at age 65. Actuarial Cost Method Entry Age Normal based on level percentage of projected salary. Amortization Method Experience gains and losses are amortized over a closed period of 7.7 years starting on the current fiscal year, equal to the average remaining service of active and inactive plan members (who have no future service). Investment gains and losses are amortized over a closed period of five years starting on June 30, 2017. This does not apply to the City. Mortality Rates RP-2014 generational table scaled using MP- 18 and applied on a gender-specific basis for the City of Billings.

Required Supplemental Information
115
Plan Participation Percentage It is assumed that 50% of all employees and their dependents who are eligible for early retiree benefits will participate in the retiree medical plan. This assumes that a one-time, irrevocable election to participate is made at retirement. Health Care Cost Trend Rate The health care cost trend assumptions are used to project the cost of health care in future years. The following annual trends are based on the current HCA Consulting trend study. The initial trends were set based on a combination of employer history, trend surveys, and professional judgment. The ultimate healthcare trend rate is 4.5%. Administrative costs are assumed to trend at 4.5%. Select trends are reduced at 0.5% each year until reaching the ultimate trend rate.
Per Capita Health Claim Cost Expected retiree claim costs were developed using 24 months of historical claim experience through March 2019. The annual age 60 and 70 claim costs for retirees and their spouses are as follows:
Per Capita Cost Age 60 Plan C – Standard Plan $ 9,013 Plan D – HDHP $ 8,316
Per Capita Cost Age 60 Age 70 Non-Claim Expenses Non-claim expenses are based on the current amounts charged per retired employee. These amounts are provided in the table below and are trended at the levels shown in the “Health Care Cost Trend Rate” table.
Expense Type Per Retiree per Month Specific Stop Loss Premium – Single $28.52 Specific Stop Loss Premium – Family $72.33 Benefit Plan Management Fee $23.33
Plan Election Percentage The percentage of retirees electing each of the plans available is shown in the table below. These estimates are based on the current retiree elections.
Plan Name % Election Standard Plan 85% HDHP Plan 15%
Plan Name % election
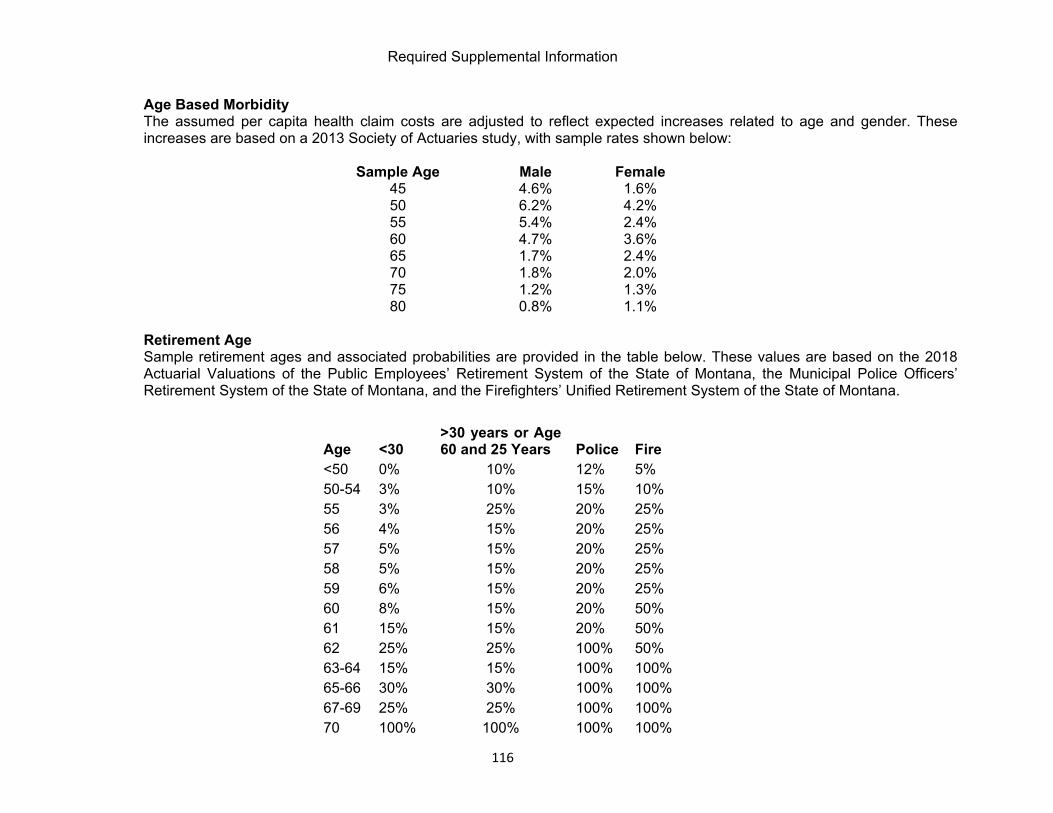
Required Supplemental Information
116
Age Based Morbidity The assumed per capita health claim costs are adjusted to reflect expected increases related to age and gender. These increases are based on a 2013 Society of Actuaries study, with sample rates shown below:
Sample Age Male Female 45 4.6% 1.6% 50 6.2% 4.2% 55 5.4% 2.4% 60 4.7% 3.6% 65 1.7% 2.4% 70 1.8% 2.0% 75 1.2% 1.3% 80 0.8% 1.1%
Age Male Female Retirement Age Sample retirement ages and associated probabilities are provided in the table below. These values are based on the 2018 Actuarial Valuations of the Public Employees’ Retirement System of the State of Montana, the Municipal Police Officers’ Retirement System of the State of Montana, and the Firefighters’ Unified Retirement System of the State of Montana. 6
Age <30 >30 years or Age 60 and 25 Years Police Fire
<50 0% 10% 12% 5% 50-54 3% 10% 15% 10% 55 3% 25% 20% 25% 56 4% 15% 20% 25% 57 5% 15% 20% 25% 58 5% 15% 20% 25% 59 6% 15% 20% 25% 60 8% 15% 20% 50% 61 15% 15% 20% 50% 62 25% 25% 100% 50% 63-64 15% 15% 100% 100% 65-66 30% 30% 100% 100% 67-69 25% 25% 100% 100% 70 100% 100% 100% 100%
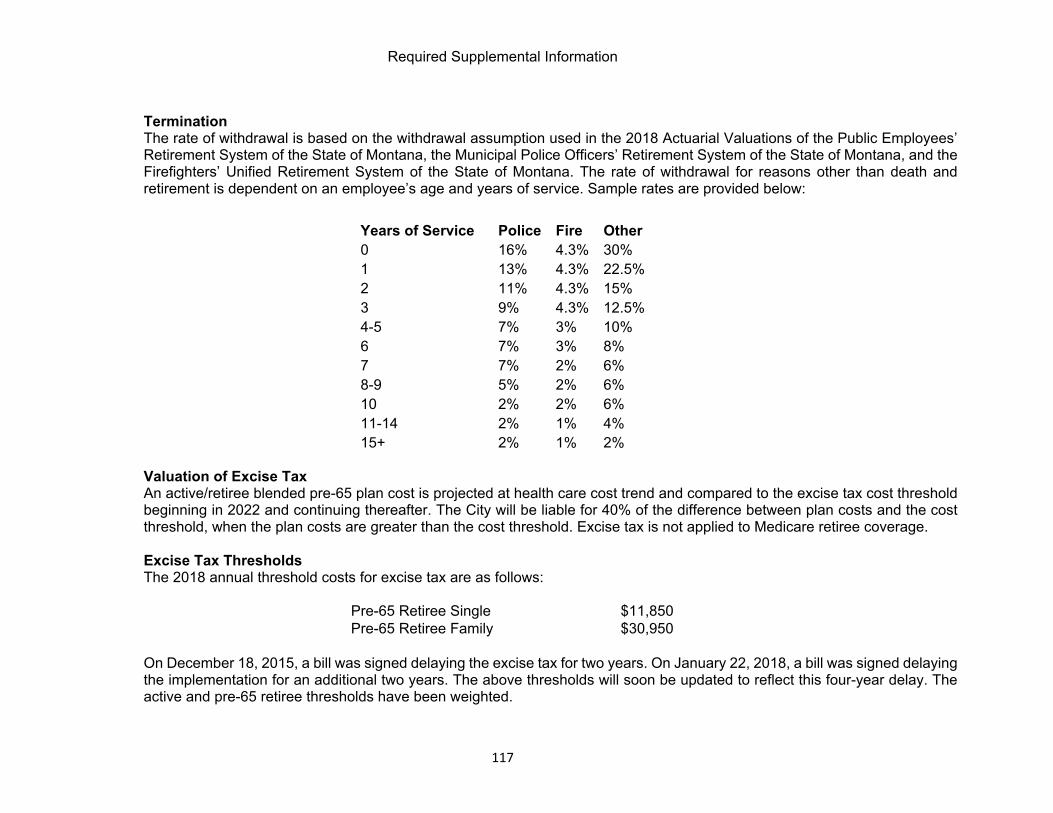
Required Supplemental Information
117
0 and 25 Years Police Fire Termination The rate of withdrawal is based on the withdrawal assumption used in the 2018 Actuarial Valuations of the Public Employees’ Retirement System of the State of Montana, the Municipal Police Officers’ Retirement System of the State of Montana, and the Firefighters’ Unified Retirement System of the State of Montana. The rate of withdrawal for reasons other than death and retirement is dependent on an employee’s age and years of service. Sample rates are provided below: Years of Service Police Fire Other
Years of Service Police Fire Other 0 16% 4.3% 30% 1 13% 4.3% 22.5% 2 11% 4.3% 15% 3 9% 4.3% 12.5% 4-5 7% 3% 10% 6 7% 3% 8% 7 7% 2% 6% 8-9 5% 2% 6% 10 2% 2% 6% 11-14 2% 1% 4% 15+ 2% 1% 2%
Valuation of Excise Tax An active/retiree blended pre-65 plan cost is projected at health care cost trend and compared to the excise tax cost threshold beginning in 2022 and continuing thereafter. The City will be liable for 40% of the difference between plan costs and the cost threshold, when the plan costs are greater than the cost threshold. Excise tax is not applied to Medicare retiree coverage. Excise Tax Thresholds The 2018 annual threshold costs for excise tax are as follows:
Pre-65 Retiree Single $11,850 Pre-65 Retiree Family $30,950
On December 18, 2015, a bill was signed delaying the excise tax for two years. On January 22, 2018, a bill was signed delaying the implementation for an additional two years. The above thresholds will soon be updated to reflect this four-year delay. The active and pre-65 retiree thresholds have been weighted.

Required Supplemental Information
118
2017 2018 2019Present Value of Future BenefitsActives $ 12,984 $ 13,457 $ 10,046 Retirees 2,797 2,350 2,470 Total $ 15,781 $ 15,807 $ 12,516
2017 2018 2019Total OPEB Liability
Actives $ 7,665 $ 7,964 $ 6,047 Retirees 2,797 2,907 2,470
Total OPEB Liability (TOL) 10,462 10,871 8,517 Fiduciary Net Position (FNP) - - - Net OPEB Liability (NOL) $ 10,462 $ 10,871 $ 8,517
Covered-employee payroll 49,636 51,621 54,617 NOL as a % of covered-employee payroll 21.1% 21.1% 15.6%
Total OPEB Expense 2017 2018 2019Service cost $ 556 $ 577 $ 600 Interest cost 320 416 435 Changes of benefit terms - - - Current recognized deferred outflows/(inflows)
Difference between actual and expected experience (123) (123) (390)Changes in assumptions or other inputs 406 405 279 Other changes, separately identified, if significant - - -
Total Expense $ 1,159 $ 1,275 $ 924
1 In FY2017, The City of Billings adopted GASB 75. See Notes to Financial Statements.
Required Supplemental OPEB InformationOther Post Employment Benefits Liability
Last Ten Fiscal Years 1
(Dollar amounts in Thousands)

Required Supplemental Information
119
D. Schedules of the City’s Proportionate Share of the Net Pension Liability
As of measurment date 2018 2017 2016 2015 2014Employer's proportion of the net pension liability 43,207 51,226 41,741 34,676 30,549 Employer's proportion of the net pension liability (percentage) 2.07% 2.63% 2.45% 2.48% 2.45%State's net pension liability 14,470 682 510 426 373 Total 57,677 51,908 42,251 35,102 30,922
Employer's covered payroll 34,044 32,627 29,353 28,950 27,980 Employer's proportionate share as a percent of covered payroll 126.91% 157.01% 142.20% 119.78% 110.07%Plan fiduciary net position as a percent of total pension liability 73.47% 73.75% 74.71% 78.40% 79.90%
1 In FY2015, The City of Billings adopted GASB 68. See Notes to Financial Statements.
Schedule of the City's Proportionate Share of the Net Pension LiabilityPublic Employees Retirement System (PERS)
Last Ten Fiscal Years 1
(Dollar amounts in Thousands)

Required Supplemental Information
120
As of measurment date 2018 2017 2016 2015 2014Employer's proportion of the net pension liability 7,280 7,218 7,367 6,829 6,450 Employer's proportion of the net pension liability (percentage) 6.32% 6.39% 6.45% 6.68% 6.61%State's net pension liability 16,645 16,391 16,690 15,210 14,551 Total 23,925 23,609 24,057 22,039 21,001
Employer's covered payroll 9,955 9,546 9,083 8,973 8,583 Employer's proportionate share as a percent of covered payroll 73.13% 75.61% 81.11% 76.11% 75.15%Plan fiduciary net position as a percent of total pension liability 79.03% 77.77% 75.48% 76.90% 76.70%
1 In FY2015, The City of Billings adopted GASB 68. See Notes to Financial Statements.
Schedule of the City's Proportionate Share of the Net Pension LiabilityFirefighters' Unified Retirement System (FURS)
Last Ten Fiscal Years 1
(Dollar amounts in Thousands)
As of measurment date 2018 2017 2016 2015 2014Employer's proportion of the net pension liability 12,573 12,567 12,571 11,661 11,275 Employer's proportion of the net pension liability (percentage) 7.34% 7.06% 6.98% 7.05% 7.18%State's net pension liability 25,694 25,613 24,955 23,627 22,778 Total 38,267 38,180 37,526 35,288 34,053
Employer's covered payroll 11,585 10,538 9,859 9,757 9,628 Employer's proportionate share as a percent of covered payroll 108.53% 119.25% 127.52% 119.52% 117.11%Plan fiduciary net position as a percent of total pension liability 70.95% 68.34% 65.62% 66.90% 67.00%
1 In FY2015, The City of Billings adopted GASB 68. See Notes to Financial Statements.
Schedule of the City's Proportionate Share of the Net Pension LiabilityMunicipal Police Officers' Retirement System (MPORS)
Last Ten Fiscal Years 1
(Dollar amounts in Thousands)

Required Supplemental Information
121
E. Schedules of the City’s Contributions
As of most recent FYE (reporting date) 2019 2018 2017 2016 2015Contractually required DB contributions 2,993 2,884 2,731 2,453 2,386 Plan choice rate required contributiongs - - - 83 125 Contributions in relation to the contractually required contributions 2,993 2,884 2,731 2,536 2,510 Contribution deficiency (excess) - - - - - Employer's covered payroll 34,920 34,044 32,627 29,353 28,950 Contributions of covered payroll (as a percentage) 8.57% 8.47% 8.37% 8.64% 8.67%
1 In FY2015, The City of Billings adopted GASB 68. See Notes to Financial Statements.
Public Employees Retirement System (PERS)Last Ten Fiscal Years 1
(Dollar amounts in Thousands)
Schedule of the City's Contributions
As of most recent FYE (reporting date) 2019 2018 2017 2016 2015Contractually required contributions 1,499 1,465 1,371 1,299 1,314 Contributions in relation to the contractually required contributions 1,499 1,465 1,371 1,299 1,314 Contribution deficiency (excess) - - - - - Employer's covered payroll 10,436 9,955 9,546 9,083 8,973 Contributions as a percent of covered payroll 14.36% 14.72% 14.36% 14.30% 14.64%
1 In FY2015, The City of Billings adopted GASB 68. See Notes to Financial Statements.
Firefighters' Unified Retirement System (FURS)Last Ten Fiscal Years 1
(Dollar amounts in Thousands)
Schedule of the City's Contributions

Required Supplemental Information
122
As of most recent FYE (reporting date) 2019 2018 2017 2016 2015Contractually required contributions 1,727 1,733 1,522 1,444 1,414 Contributions in relation to the contractually required contributions 1,727 1,733 1,522 1,444 1,414 Contribution deficiency (excess) - - - - - Employer's covered payroll 11,988 11,585 10,538 9,859 9,757 Contributions as a percent of covered payroll 14.41% 14.96% 14.44% 14.65% 14.50%
1 In FY2015, The City of Billings adopted GASB 68. See Notes to Financial Statements.
Municipal Police Officers' Retirement System (MPORS)Last Ten Fiscal Years 1
(Dollar amounts in Thousands)
Schedule of the City's Contributions
Notes to Required Supplementary Information for the year ended June 30, 2018 (as of Measurement Date)
Changes of Benefit Terms The following changes to the PERS plan provisions were made as identified: 2017: Working Retiree Limitations – for PERS
If a PERS retiree returns as an independent contractor to what would otherwise be PERS-covered employment, general contractor overhead costs are excluded from PERS working retiree limitations.
Refunds 1) Terminating members eligible to retire may, in lieu of receiving a monthly retirement benefit, refund their accumulated contributions in
a lump sum. 2) Terminating members with accumulated contributions between $200 and $1,000 who wish to rollover their refund must do so within 90
days of termination of service. 3) Trusts, estates, and charitable organizations listed as beneficiaries are entitled to receive only a lump-sum payment.
Interest credited to member accounts – Effective July 1, 2017, the interest rate credited to member accounts increase from 0.25% to 0.77%.

Required Supplemental Information
123
Lump-Sum payouts Effective July1, 2017, lump-sum payouts in all systems are limited to the member’s accumulated contributions rate than the present value of the member’s benefit. Disabled PERS Defined Contribution (DC) Members
PERS members hired after July 1, 2011 have a normal retirement age of 65. PERS DC members hired after July 1, 2011 who became disabled were previously only eligible for a disability benefit until age 65. Effective July 1, 2017, these individuals will be eligible for a disability benefit until they reach 70, thus ensuring the same 5-year time period available to PERS DC disabled members hired prior to July 1, 2011 who have a normal retirement age of 60 and are eligible for a disability benefit until age 65.
Changes in Actuarial Assumptions and Methods Method and assumptions used in calculations of actuarially determined contributions. The following Actuarial Assumptions were adopted from June 2016 Experience Study: General Wage Growth* 3.5% Investment Rate of Return* 7.65% *Includes inflation at 2.75% Merit salary increase 0% to 6.30% Asset valuation method Four-year smoothed market Actuarial cost method Entry age Normal Amortization Level percentage of payroll, open Remaining amortization period 30 years Mortality (Healthy members) For Males and Females: RP 2000 Combined Employee and Annuitant Mortality Table projected to 2020 using Scale BB, males set back 1 year. Mortality (Disabled members) For Males and Females: RP 2000 Combined Mortality Table, with no projections Admin Expense as % of payroll 0.26% Administrative expense are recognized by an additional amount added to the normal cost contribution rate for the System. This amount varies from year to year based on the prior year’s actual administrative expenses. Changes of Benefit Terms The following changes to the MPORS plan provisions were made as identified: 2017: Working Retiree Limitations – For MPORS
1) Applies to retirement system members who return on or after July 1, 2017 to covered employment in the system from which they retired.

Required Supplemental Information
124
2) Members who return for less than 480 hours in a calendar year: a. May not become an active member in the system; and b. Are subject to a $1 reduction in their retirement benefit for each $3 earned in excess of $5,000 in the calendar year.
3) Members who return for 480 or more hours in a calendar year: a. Must become an active member of the system; b. Will stop receiving a retirement benefit from the system; and c. Will be eligible for a second retirement benefit if they earn 5 or more years of service credit through their second employment.
4) Employee, employer and state contributions, if any, apply as follows: a. Employer contributions and state contributions (if any) must be paid on all working retirees; b. Employee contributions must be paid on working retirees who return to covered employment for 480 or more hours in a calendar
year. Second Retirement Benefit – for MPORS
1) Applies to retirement system members who return on or after July 1, 2017 to active service covered by the system from which they retired.
2) If the member works more than 480 hours in a calendar year and accumulates less than 5 years of service credit before terminating again, the member:
a. Is not awarded service credit for the period of reemployment; b. Is refunded the accumulated contributions associated with the period of reemployment; c. Starting the first month following termination of service, receives the same retirement benefit previously paid to the member;
and d. Does not accrue post-retirement benefit adjustments during the term of reemployment but receives a Guaranteed Annual
Benefit Adjustment (GABA) in January immediately following second retirement. 3) If the member works more than 480 hours in a calendar year and accumulates at least 5 years of service credit before terminating
again, the member: a. Is awarded service credit for the period of reemployment; b. Starting the first month following termination of service, receives:
i. The same retirement benefit previously paid to the member, and ii. A second retirement benefit for the period of reemployment calculated based on the laws in effect as of the member’s
rehire date; and c. Does not accrue post-retirement benefit adjustments during the term of reemployment but receives a GABA:
i. On the initial retirement benefit in January immediately following second retirement, and ii. On the second retirement benefit starting in January after receiving that benefit for at least 12 months.
4) A member who returns to covered service is not eligible for a disability benefit.
Refunds 1) Terminating members eligible to retire may, in lieu of receiving a monthly retirement benefit, refund their accumulated contributions in
a lump sum.

Required Supplemental Information
125
2) Terminating members with accumulated contributions between $200 and $1,000 who wish to rollover their refund must do so within 90 days of termination of service.
3) Trusts, estates, and charitable organizations listed as beneficiaries are entitled to receive only a lump-sum payment. Interest Credited to member accounts
1) Effective July 1, 2017, the interest rate credited to member accounts increased from 0.25% to 0.77%. Lump-sum payouts
1) Effective July 1, 2017, lump-sum payouts in all systems are limited to the member’s accumulated contributions rate than the present value of member’s benefit.
Changes in Actuarial Assumptions and Methods Method and Actuarial Assumptions were adopted from the June 30, 2017 actuarial valuation: General Wage Growth* 3.5% Investment Rate of Return* 7.65% *Includes inflation at 2.75% Merit salary increases 0% to 6.60% Asset Valuation method Four-year smoothed market Actuarial cost method Entry Age Normal Amortization method Level percentage of pay, open Mortality (Healthy members) For Males and Females: RP 2000 Combined Employee and Annuitant Mortality Table
projected to 2020 using Scale BB, males set back 1 year Mortality (Disabled members) For Males and Females: RP 2000 Combined Mortality Table Admin Expense as % of Payroll 0.24% Administrative expenses are recognized by an additional amount added to the normal cost contribution rate of the System. This amount varies from year to year based on the prior year’s actual administrative expenses. Changes of Benefit Terms The following changes to the FURS plan provision were made as identified: 2017: Working Retiree Limitations – for FURS
1) Applies to retirement system members who return on or after July 1, 2017 to covered employment in the system from which they retired.
2) Members who return for less than 480 hours in a calendar year:

Required Supplemental Information
126
a. May not become an active member in the system; and b. Are subject to a $1 reduction in their retirement benefit for each $3 earned in excess of $5,000 in the calendar year.
3) Members who return for 480 or more hours in a calendar year: a. Must become an active member of the system; b. Will stop receiving a retirement benefit from the system; and c. Will be eligible for a second retirement benefit if they earn 5 or more years of service credit through their second employment.
4) Employee, employer and state contributions, if any, apply as follows: a. Employer contributions and state contributions (if any) must be paid on all working retirees; b. Employee contributions must be paid on working retirees who return to covered employment for 480 or more hours in a calendar
year. Second Retirement Benefit – for FURS
1. Applies to retirement system members who return on or after July 1, 2017 to active service covered by the system from which they retired.
2. If the member works more than 480 hours in a calendar year and accumulates less than 5 years of service credit before terminating again, the member:
a. Is not awarded service credit for the period of reemployment; b. Is refunded the accumulated contributions associated with the period of reemployment; c. Starting the first month following termination of service, receives the same retirement benefit previously paid to the member;
and d. Does not accrue post-retirement benefit adjustments during the term of reemployment but receives a Guaranteed Annual
Benefit adjustment (GABA) in January immediately following second retirement. 3. If the member works more than 480 hours in a calendar year and accumulates at least 5 years of service credit before terminating
again, the member: a. Is awarded service credit for the period of reemployment; b. Starting the first month following termination of service, receives:
i. The same retirement benefit previously paid to the member, and ii. A second retirement benefit for the period of reemployment calculated based on the laws in effect as of the member’s
rehire date; and c. Does not accrue post-retirement benefit adjustments during the term of reemployment but receives a GABA:
i. On the initial retirement benefit in January immediately following second retirement, and ii. On the second retirement benefit starting in January after receiving that benefit for at least 12 months.
4. A member who returns to covered service is not eligible for a disability benefit.

Required Supplemental Information
127
Refunds 1) Terminating members eligible to retire may, in lieu of receiving a monthly retirement benefit, refund their accumulated contributions in
a lump sum. 2) Terminating members with accumulated contributions between $200 and $1,000 who wish to rollover their refund must do so within 90
days of termination of service. 3) Trusts, estates, and charitable organizations listed as beneficiaries are entitled to receive only a lump-sum payment.
Interest credited to member accounts 1) Effective July 1, 2017, the interest rate credited to member accounts increased from 0.25% to 0.77%.
Lump-sum payouts
1) Effective July 1, 2017, lump-sum payouts in all systems are limited to the member’s accumulated contributions rate than the present value of the member’s benefit.
Changes in Actuarial Assumptions and Methods Method and assumptions used in calculations of actuarially determined contributions The following Actuarial Assumptions were adopted from the June 30, 2017, actuarial valuation: General Wage Growth* 3.5% Investment Rate of Return* 7.65%
*Includes inflation at 2.75% Merit salary increases 0% to 6.3% Asset valuation method Four-year smoothed market Actuarial cost method Entry Age Normal Amortization method Level percentage of payroll, open Mortality (Healthy members) For Males and Females: RP 2000 Combined Employee and Annuitant Mortality Table projected to 2020 using Scale BB, males set back 1 year. Mortality (Disabled members) For Males and Females: RP 2000 Combined Mortality Table Admin Expense as % of Payroll 0.23%
SUPPLEMENTAL INFORMATION
MAJOR FUNDS
BUDGET AND ACTUAL SCHEDULES

128
Original Budget Final Budget Actual Variance
Revenues:Taxes 16,790,920$ 16,790,920$ 16,846,703$ (55,783)$ Licenses and permits 2,146,291 2,146,291 2,234,380 (88,089)Intergovernmental 11,430,866 11,430,866 11,404,984 25,882Charges for services 4,032,642 4,032,642 4,256,807 (224,165)Fines and forteitures 1,656,203 1,656,203 1,271,808 384,395Special assessments - - 189 (189)Other 217,000 217,000 727,579 (510,579)
Total revenues 36,273,922 36,273,922 36,742,450 (468,528)
Expenditures:Current: Salaries and benefits 8,453,625 8,611,820 8,356,983 254,837 Operations and maintenance 4,382,532 4,783,524 4,305,034 478,490Capital outlay - - 14,594 (14,594)
Total expenditures 12,836,157 13,395,344 12,676,611 718,733
Revenues over (under) expenditures 23,437,765 22,878,578 24,065,839 (1,187,261)
Other financing sources (uses): Transfers in 6,600 6,600 2,022 4,578 Transfers out (31,037,603) (31,855,087) (29,385,533) (2,469,554) Total other financing sources (uses) (31,031,003) (31,848,487) (29,383,511) (2,464,976)
Net change in fund balances (7,593,238)$ (8,969,909)$ (5,317,672) (3,652,237)$
Fund balance, beginning of year 27,717,469Fund balance, end of year 22,399,797$
CITY OF BILLINGS, MONTANAGeneral Fund
Schedule of Revenues, Expenditures and Changes in Fund Balance-Budget to ActualFor the Fiscal Year Ended June 30, 2019

129
Original Budget Final Budget Actual Variance
Revenues:Taxes 12,938,519$ 12,680,422$ 12,947,901$ (267,479)$ Licenses and permits 27,700 23,000 38,922 (15,922)Intergovernmental 2,815,211 2,955,145 3,095,248 (140,103)Charges for services 1,482,387 1,622,321 1,778,084 (155,763)Fines and forteitures 2,400 2,400 2,540 (140)Other 29,395 29,395 78,501 (49,106)Total revenues 17,295,612 17,312,683 17,941,196 (628,513)Expenditures:Current: Salaries and benefits 36,243,588 37,385,118 36,675,224 709,894 Operations and maintenance 5,423,898 5,596,527 5,818,357 (221,830)Capital outlay 1,464,000 1,800,604 488,425 1,312,179 Total expenditures 43,131,486 44,782,249 42,982,006 1,800,243 Revenues over (under) expenditures (25,835,874) (27,469,566) (25,040,810) (2,428,756)Other financing sources (uses): Transfers in 27,223,436 28,040,920 25,666,599 2,374,321 Transfers out (1,387,562) (1,387,562) (1,346,998) (40,564) Sale of capital assets - - 2,355 (2,355) Total other financing sources (uses) 25,835,874 26,653,358 24,321,956 2,331,402 Net change in fund balances -$ (816,208)$ (718,854) (97,354)$ Fund balance, beginning of year 2,190,587Fund balance, end of year 1,471,733$
CITY OF BILLINGS, MONTANAMajor Special Revenue Fund - Public Safety
Schedule of Revenues, Expenditures and Changes in Fund Balance-Budget to ActualFor the Fiscal Year Ended June 30, 2019

NONMAJOR GOVERNMENT FUNDS
NONMAJOR SPECIAL REVENUE FUNDS
The special revenue funds are used to account for the proceeds of specific revenue sources that are administratively or legally restricted to expenditures for specified purposes.
NONMAJOR DEBT SERVICE FUNDS The debt service funds are used to account for the accumulation of resources for, and payment of, interest, principal and related costs on bonded general long-term debt.
NONMAJOR CAPITAL PROJECTS FUNDS The capital projects funds are used to account for financial resources to be used for the acquisition or construction of major capital facilities (other than those financed by proprietary funds) and the construction of public improvements that are financed through assessments to individual property owners.
NONMAJOR PERMANENT FUND The Permanent fund is used to report resources that are legally restricted to the extent that only earnings, not principal, may be used for purposes that support the reporting government’s programs.
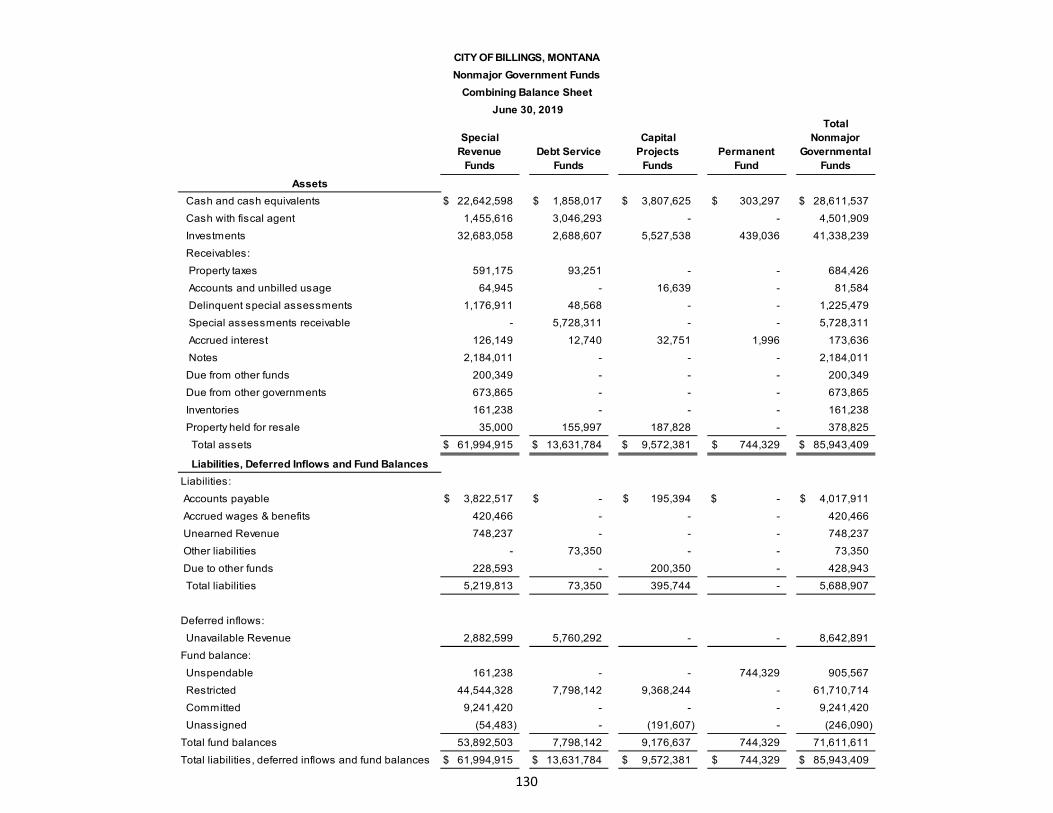
130
Special Revenue
FundsDebt Service
Funds
Capital Projects
FundsPermanent
Fund
Total Nonmajor
Governmental Funds
Assets Cash and cash equivalents 22,642,598$ 1,858,017$ 3,807,625$ 303,297$ 28,611,537$ Cash with fiscal agent 1,455,616 3,046,293 - - 4,501,909 Investments 32,683,058 2,688,607 5,527,538 439,036 41,338,239 Receivables: Property taxes 591,175 93,251 - - 684,426 Accounts and unbilled usage 64,945 - 16,639 - 81,584 Delinquent special assessments 1,176,911 48,568 - - 1,225,479 Special assessments receivable - 5,728,311 - - 5,728,311 Accrued interest 126,149 12,740 32,751 1,996 173,636 Notes 2,184,011 - - - 2,184,011 Due from other funds 200,349 - - - 200,349 Due from other governments 673,865 - - - 673,865 Inventories 161,238 - - - 161,238 Property held for resale 35,000 155,997 187,828 - 378,825 Total assets 61,994,915$ 13,631,784$ 9,572,381$ 744,329$ 85,943,409$
Liabilities, Deferred Inflows and Fund BalancesLiabilities: Accounts payable 3,822,517$ -$ 195,394$ -$ 4,017,911$ Accrued wages & benefits 420,466 - - - 420,466 Unearned Revenue 748,237 - - - 748,237 Other liabilities - 73,350 - - 73,350 Due to other funds 228,593 - 200,350 - 428,943 Total liabilities 5,219,813 73,350 395,744 - 5,688,907
Deferred inflows: Unavailable Revenue 2,882,599 5,760,292 - - 8,642,891Fund balance: Unspendable 161,238 - - 744,329 905,567 Restricted 44,544,328 7,798,142 9,368,244 - 61,710,714 Committed 9,241,420 - - - 9,241,420 Unassigned (54,483) - (191,607) - (246,090) Total fund balances 53,892,503 7,798,142 9,176,637 744,329 71,611,611Total liabilities, deferred inflows and fund balances 61,994,915$ 13,631,784$ 9,572,381$ 744,329$ 85,943,409$
CITY OF BILLINGS, MONTANANonmajor Government Funds
Combining Balance Sheet June 30, 2019

131
Special Revenue
FundsDebt Service
Funds
Capital Projects
FundsPermanent
Fund
Total Nonmajor
Governmental Funds
Revenues: Taxes 7,838,416$ 2,154,455$ -$ -$ 9,992,871$ Licenses and permits 1,800,892 - - - 1,800,892 Intergovernmental 10,707,976 - - - 10,707,976 Charges for services 9,599,149 - - 19,725 9,618,874 Fines and forfeitures 476,480 - - - 476,480 Special assessments 23,395,177 1,478,412 - - 24,873,589 Other 2,793,724 426,216 263,703 18,075 3,501,718 Total revenues 56,611,814 4,059,083 263,703 37,800 60,972,400Expenditures: Current: General government 2,520,238 18,958 1,284 - 2,540,480 Public safety 3,810,302 - 395,800 - 4,206,102 Public works 22,899,821 39,100 267,876 - 23,206,797 Culture and recreation 5,188,958 - - - 5,188,958 Housing and economic development 4,572,631 - 8,957 - 4,581,588 Capital outlay 21,244,911 - 4,796,260 - 26,041,171 Debt service: Principal 730,000 3,166,327 - - 3,896,327 Interest and fiscal charges 1,124,424 1,405,450 - - 2,529,874 Bond issuance costs - - 75,300 - 75,300 Total expenditures 62,091,285 4,629,835 5,545,477 - 72,266,597 Revenues over (under) expenditures (5,479,471) (570,752) (5,281,774) 37,800 (11,294,197)Other financing sources (uses): Transfers in 2,755,381 1,014,544 4,035,191 - 7,805,116 Transfers out (3,213,466) (2,044) - (2,022) (3,217,532) Issuance of debt 3,465,000 - - - 3,465,000 Premium on bond debt 95,367 - - - 95,367 Special assessment bonds issued - - 1,625,000 - 1,625,000 Sale of capital assets 37,886 - 17,563 - 55,449 Total other financing sources (uses) 3,140,168 1,012,500 5,677,754 (2,022) 9,828,400 Net change in fund balances (2,339,303) 441,748 395,980 35,778 (1,465,797)Fund balance, beginning of year 56,231,806 7,356,394 8,780,657 708,551 73,077,408
Fund balance, end of year 53,892,503$ 7,798,142$ 9,176,637$ 744,329$ 71,611,611$
CITY OF BILLINGS, MONTANANonmajor Governmental Funds
Combining Statement of Revenues, Expenditures and Changes in Fund BalanceFor the Year Ended June 30, 2019

NONMAJOR SPECIAL REVENUE FUNDS
The City’s non-major special revenue funds and their purposes are:
The Gas Tax Fund accounts for revenues received from the State of Montana gasoline tax.
The EOC 911 Fund accounts for monies received from the State of Montana 911 program.
The Animal Shelter Donations Fund accounts for donations to the Animal Shelter for specific purposes.
The Development Services Grants Fund accounts for revenues from the Federal government for community and
housing related programs.
The Library Fund accounts for operations of the Billings Library.
The Cemetery Improvements Fund accounts for expansion projects at the cemetery.
The Street Maintenance Districts Fund accounts for various street programs.
The Road Maintenance District Fund accounts for special assessments that support maintenance for an emergency route in and out of Briarwood Subdivision.
The Light Maintenance Districts Fund accounts for the maintenance of street lighting systems within several such districts in the City.
The Park Maintenance Districts Fund accounts for revenues and expenditures which are related to parks maintenance within the various districts of the City.
The Storm Sewer Fund accounts for the operation and maintenance of the storm sewer system.
The North 27th Street Tax Increment Operating Fund accounts for revenues from property tax levies on increased taxable values in the North 27th Street Tax Increment District. Amounts collected are used for the benefit of the tax increment district from which collections were assessed. Major revenue sources include property tax and revenue bond proceeds.
The South Tax Increment Operating Fund accounts for revenues from property tax levies in the South Tax Increment District, not including the Miller Crossing properties, on increased values. Amounts collected are used for the benefit of the tax increment district from which collections were assessed.
The East Tax Increment Operating Fund accounts for revenues from property tax levies on increased taxable values
in the East Tax Increment District. Amounts collected are used for the benefit of the tax increment district from which collections were assessed.
The Parks Program Fund accounts for revenues and expenditures related to park acquisitions and park
improvements.
The Police Programs Fund accounts for the following programs: Montana Board of Crime Control, Justice Assistant Grants, High Intensity Drug Traffic Area, Technology Grants, Homeland Security Grants, Internet Crimes Against Children, Highway Traffic Safety Grants, Community Police Officer, and other law enforcement related programs.
The Amend Park Fund accounts for funds designated for the maintenance of Amend Park.
The Sidewalk Hazard Repair fund was established to repair sidewalk defects. Repairs are completed without bond financing and are charged to the real property owner.
The City-County Planning Fund, through an inter-local agreement, accounts for the operation of the Planning
Department, which promotes the health, safety, convenience, and welfare of the Community.
The Building Inspection Fund accounts for building permits and inspections for private construction in the City.
The Street & Traffic Fund accounts for street cleaning, snow removal, minor street repairs, signage, street striping, forestry, and traffic signal maintenance.
The City Attorney Grants Fund accounts for grants from the Montana Board of Crime Control that includes the Victim/Witness Grant and Domestic Violence Unit Grant to supplement the City Attorney’s efforts.
The Fire Programs Fund accounts for the Regional HazMat Team, grants, donations, and other fire related programs.
The Municipal Court Grants Fund is funded by grants.
The Downtown Revolving Loan Program Fund accounts for low-interest loans to qualified property owners located in downtown Billings. Loans are funded by local banks and the City of Billings.

Baseball Field/Stadium Donations for Capital Maintenance Fund accounts for donations to fund future capital
maintenance for the new baseball field/stadium.
The Arterial Fees Fund complements other funds in the construction of arterial streets within the City.
The Ballpark Repair Fund accounts for minor repairs at the ballpark facility.
The Park District 1 Fund accounts for the city-wide park assessment, maintenance, and improvements.

132
Gas Tax Fund EOC 911 Fund
Animal Shelter
Donations Fund
Development Services
Grants Fund Library Fund
Cemetery Improvements
Fund
Street Maintenance Districts Fund
Road Maintenance
District 6 FundAssets
Cash and cash equivalents 2,934,166$ 1,270,244$ 15,786$ 130,195$ 1,231,494$ 68,140$ 1,532,858$ 4,508$ Cash with fiscal agent - - - - - - - - Investments 4,232,493 1,734,684 23,280 189,029 1,774,246 98,812 2,227,874 6,573 Receivables: Property taxes - - - - 39,934 - - - Accounts and unbilled usage - - - - - - - - Delinquent special assessments - - - - - - 494,137 422 Accrued interest 11,931 8,310 104 698 6,493 444 11,454 29 Notes - - - 165,195 - - - - Due from other funds 200,349 - - - - - - - Due from other governments - - - 172,421 62,095 - - - Inventories - - - - - - - - Property held for resale - - - 35,000 - - - - Total assets 7,378,939$ 3,013,238$ 39,170$ 692,538$ 3,114,262$ 167,396$ 4,266,323$ 11,532$ Liabilities, Deferred Inflows and Fund
BalancesLiabilities: Accounts payable 311,872$ 33,029$ -$ 10,346$ 87,966$ -$ -$ -$ Accrued wages & benefits 2,383 1,204 - 15,905 79,365 - - - Due to other funds - - - 178,820 - - - - Unearned Revenue 748,237 - - - - - - - Total liabilities 1,062,492 34,233 - 205,071 167,331 - - -Deferred inflows: Unavailable Revenue - - - 165,195 7,687 - 176,532 8Fund balances: Unspendable - - - - - - - - Restricted 6,316,447 2,979,005 - 322,272 1,557,799 167,396 4,089,791 11,524 Committed - - 39,170 - 1,381,445 - - - Unassigned - - - - - - - - Total fund balances 6,316,447 2,979,005 39,170 322,272 2,939,244 167,396 4,089,791 11,524Total liabilities, deferred inflows and fund balances 7,378,939$ 3,013,238$ 39,170$ 692,538$ 3,114,262$ 167,396$ 4,266,323$ 11,532$
(continued)
(Page 1 of 4)
Combining Balance Sheet June 30, 2019
CITY OF BILLINGS, MONTANANonmajor Special Revenue Funds

133
Light Maintenance Districts Fund
Park Maintenance Districts Fund
Storm Sewer Fund
North 27th Street Tax Increment Operating
Fund
South Tax Increment Operating
Fund
East Tax Increment Operating
Fund
Parks Program
FundAssets
Cash and cash equivalents 737,833$ 421,154$ 1,017,732$ 912,145$ 2,653,812$ 921,764$ 885,003$ Cash with fiscal agent - - - 647,761 478,447 329,408 - Investments 1,070,952 612,692 1,470,461 1,319,063 3,836,039 1,343,529 1,282,778 Receivables: Property taxes - - - 303,521 212,964 34,756 - Accounts and unbilled usage - - - - - - - Delinquent special assessments 106,847 40,056 232,115 - - - - Accrued interest 5,586 2,237 7,765 2,377 14,263 4,917 5,872 Notes - - - - - - - Due from other funds - - - - - - - Due from other governments - - - - - - - Inventories - - - - - - - Property held for resale - - - - - - - Total assets 1,921,218$ 1,076,139$ 2,728,073$ 3,184,867$ 7,195,525$ 2,634,374$ 2,173,653$ Liabilities, Deferred Inflows and Fund
BalancesLiabilities: Accounts payable 151,544$ 27,309$ 610,284$ 23,287$ 232,403$ 912,599$ 63,201$ Accrued wages & benefits - - - - - - - Due to other funds - - - - - - - Unearned Revenue - - - - - - - Total liabilities 151,544 27,309 610,284 23,287 232,403 912,599 63,201Deferred inflows: Unavailable Revenue 28,732 19,113 81,652 234,285 42,949 11,351 -Fund balances: Unspendable - - - - - - - Restricted 1,740,942 1,029,717 2,036,137 2,927,295 6,920,173 1,710,424 - Committed - - - - - - 2,110,452 Unassigned - - - - - - - Total fund balances 1,740,942 1,029,717 2,036,137 2,927,295 6,920,173 1,710,424 2,110,452Total liabilities, deferred inflows and fund balances 1,921,218$ 1,076,139$ 2,728,073$ 3,184,867$ 7,195,525$ 2,634,374$ 2,173,653$
(continued)
(Page 2 of 4)
Combining Balance Sheet June 30, 2019
CITY OF BILLINGS, MONTANANonmajor Special Revenue Funds

134
Police Programs
FundAmend Park
Fund
Sidewalk Hazard Repair
FundCity-County
Planning Fund
Building Inspection
FundStreet &
Traffic FundCity Attorney Grants Fund
Fire Programs
FundAssets
Cash and cash equivalents 554,357$ 98,898$ 37,390$ 209,623$ 1,016,280$ 1,871,300$ 232$ 106,741$ Cash with fiscal agent - - - - - - - - Investments 805,814 143,226 54,094 304,296 1,471,074 2,701,076 174 154,775 Receivables: Property taxes - - - - - - - - Accounts and unbilled usage 36,835 - 3,134 - 24,976 - - - Delinquent special assessments - - - - - - - - Accrued interest 3,670 653 - 1,321 6,690 8,224 6 649 Notes - - - - - - - - Due from other funds - - - - - - - - Due from other governments 154,195 - - 268,768 - 301 14,985 - Inventories - - - - - 161,238 - - Property held for resale - - - - - - - - Total assets 1,554,871$ 242,777$ 94,618$ 784,008$ 2,519,020$ 4,742,139$ 15,397$ 262,165$ Liabilities, Deferred Inflows and Fund
BalancesLiabilities: Accounts payable 171,434$ -$ 3,272$ 65,885$ 498$ 115,436$ -$ 1,424$ Accrued wages & benefits 10,631 - - 39,933 55,280 183,653 10,815 - Due to other funds - - - - - - - - Unearned Revenue - - - - - - - - Total liabilities 182,065 - 3,272 105,818 55,778 299,089 10,815 1,424Deferred inflows: Unavailable Revenue - - - - - - - -Fund balances: Unspendable - - - - - 161,238 - - Restricted 1,372,806 - 91,346 678,190 2,463,242 4,281,812 4,582 260,741 Committed - 242,777 - - - - - - Unassigned - - - - - - - - Total fund balances 1,372,806 242,777 91,346 678,190 2,463,242 4,443,050 4,582 260,741Total liabilities, deferred inflows and fund balances 1,554,871$ 242,777$ 94,618$ 784,008$ 2,519,020$ 4,742,139$ 15,397$ 262,165$
(continued)
(Page 3 of 4)
Combining Balance Sheet June 30, 2019
CITY OF BILLINGS, MONTANANonmajor Special Revenue Funds

135
Municipal Court Grant
Fund
Downtown Revolving Loan Fund
Baseball Field/Stadium Donations for
Capital Maintenance
FundArterial Fees
FundBallpark
Repair FundPark District 1
Fund
Total Nonmajor
Special Revenue
FundsAssets
Cash and cash equivalents 5,718$ 226,977$ 210,100 2,071,066$ 24,543$ 1,472,539$ 22,642,598$ Cash with fiscal agent - - - - - - 1,455,616 Investments 8,519 326,550 304,187 3,018,272 35,782 2,132,714 32,683,058 Receivables: Property taxes - - - - - - 591,175 Accounts and unbilled usage - - - - - - 64,945 Delinquent special assessments - - - 210,905 - 92,429 1,176,911 Accrued interest 111 - 1,417 11,375 803 8,750 126,149 Notes - 2,018,816 - - - - 2,184,011 Due from other funds - - - - - - 200,349 Due from other governments - - - 1,100 - - 673,865 Inventories - - - - - - 161,238 Property held for resale - - - - - - 35,000 Total assets 14,348$ 2,572,343$ 515,704 5,312,718$ 61,128$ 3,706,432$ 61,994,915$ Liabilities, Deferred Inflows and Fund
BalancesLiabilities: Accounts payable 13,528$ -$ 246,975 655,440$ -$ 84,785$ 3,822,517$ Accrued wages & benefits 5,530 - - - - 15,767 420,466 Due to other funds 49,773 - - - - - 228,593 Unearned Revenue - - - - - - 748,237 Total liabilities 68,831 - 246,975 655,440 - 100,552 5,219,813Deferred inflows: Unavailable Revenue - 2,018,815 - 73,087 - 23,193 2,882,599Fund balances: Unspendable - - - - - - 161,238 Restricted - - - - - 3,582,687 44,544,328 Committed - 553,528 268,729 4,584,191 61,128 - 9,241,420 Unassigned (54,483) - - - - - (54,483) Total fund balances (54,483) 553,528 268,729 4,584,191 61,128 3,582,687 53,892,503Total liabilities, deferred inflows and fund balances 14,348$ 2,572,343$ 515,704 5,312,718$ 61,128$ 3,706,432$ 61,994,915$
(Page 4 of 4)
Combining Balance Sheet June 30, 2019
CITY OF BILLINGS, MONTANANonmajor Special Revenue Funds

136
Gas Tax Fund EOC 911 Fund
Animal Shelter Donations
Fund
Development Services Grants
Fund Library Fund
Cemetery Improvements
Fund
Street Maintenance Districts Fund
Road Maintenance
District 6 FundRevenues:Taxes -$ -$ -$ -$ 1,139,977$ -$ -$ -$ Licenses and permits - - - - - - - -Intergovernmental 3,232,306 1,085,619 - 1,307,294 1,751,471 - - -Charges for services - - - 23,467 17,254 21,526 - -Fines and forteitures - - - - 57,817 - - -Special assessments - - - - - - 8,999,136 2,847Other 145,006 84,308 950 781,119 137,550 4,099 107,146 214Total revenues 3,377,312 1,169,927 950 2,111,880 3,104,069 25,625 9,106,282 3,061Expenditures:Current: General government - - - - - - - - Public safety - 563,780 - - - - - 108 Public works 1,907,776 - - - - - 7,406,413 - Culture and recreation - - - - 3,392,241 26,000 - - Housing and economic development - - - 2,060,438 - - - - Capital outlay 2,129,338 722,085 - - - - - -Debt service: Principal - - - - - - - - Interest and fiscal charges - - - - - - - - Total expenditures 4,037,114 1,285,865 - 2,060,438 3,392,241 26,000 7,406,413 108 Revenues over (under) expenditures (659,802) (115,938) 950 51,442 (288,172) (375) 1,699,869 2,953Other financing sources (uses): Transfers in 1,318,000 - - 62,004 1,035,382 - - - Transfers out (91,500) - - - (20,705) - (1,318,000) - Issuance of debt - - - - - - - - Premium on bond debt - - - - - - - - Sale of capital assets 37,786 - - - - - - - Total other financing sources (uses) 1,264,286 - - 62,004 1,014,677 - (1,318,000) - Net change in fund balances 604,484 (115,938) 950 113,446 726,505 (375) 381,869 2,953Fund balance, beginning of year 5,711,963 3,094,943 38,220 208,826 2,212,739 167,771 3,707,922 8,571Fund balance, end of year 6,316,447$ 2,979,005$ 39,170$ 322,272$ 2,939,244$ 167,396$ 4,089,791$ 11,524$
(continued)
(Page 1 of 4)
Combining Statement of Revenue, Expenditures, and Changes in Fund BalancesFor the Year Ended June 30, 2019
CITY OF BILLINGS, MONTANANonmajor Special Revenue Funds

137
Light Maintenance Districts Fund
Park Maintenance Districts Fund
Storm Sewer Fund
North 27th Street Tax Increment Operating
Fund
South Tax Increment Operating
Fund
East Tax Increment Operating
FundParks
Program FundRevenues:Taxes -$ -$ -$ 2,282,884$ 3,184,108$ 730,149$ -$ Licenses and permits - - 5,200 - - - -Intergovernmental - - - 211,821 256,218 146,654 -Charges for services - - - - - - -Fines and forteitures - - - - - - -Special assessments 2,452,312 1,174,459 4,442,418 - - - -Other 68,184 14,275 171,511 21,050 138,335 52,982 252,792Total revenues 2,520,496 1,188,734 4,619,129 2,515,755 3,578,661 929,785 252,792Expenditures:Current: General government - - - - - - - Public safety - - - - - - - Public works 2,433,632 - 1,474,182 - - - - Culture and recreation - 813,359 - 489 - 99,520 38,944 Housing and economic development - - - 1,063,212 728,043 487,582 - Capital outlay - - 6,497,854 - 2,950,621 3,141,855 -Debt service: Principal - - - 325,000 305,000 100,000 - Interest and fiscal charges - - - 622,852 340,994 160,578 - Total expenditures 2,433,632 813,359 7,972,036 2,011,553 4,324,658 3,989,535 38,944 Revenues over (under) expenditures 86,864 375,375 (3,352,907) 504,202 (745,997) (3,059,750) 213,848Other financing sources (uses): Transfers in - - - - - - 19,389 Transfers out - - (1,012,500) (100,000) - - (460,000) Issuance of debt - - - - - 3,465,000 - Premium on bond debt - - - - - 95,367 - Sale of capital assets - - - - - - 100 Total other financing sources (uses) - - (1,012,500) (100,000) - 3,560,367 (440,511) Net change in fund balances 86,864 375,375 (4,365,407) 404,202 (745,997) 500,617 (226,663)Fund balance, beginning of year 1,654,078 654,342 6,401,544 2,523,093 7,666,170 1,209,807 2,337,115Fund balance, end of year 1,740,942$ 1,029,717$ 2,036,137$ 2,927,295$ 6,920,173$ 1,710,424$ 2,110,452$
(continued)
(Page 2 of 4)
Combining Statement of Revenue, Expenditures, and Changes in Fund BalancesFor the Year Ended June 30, 2019
CITY OF BILLINGS, MONTANANonmajor Special Revenue Funds
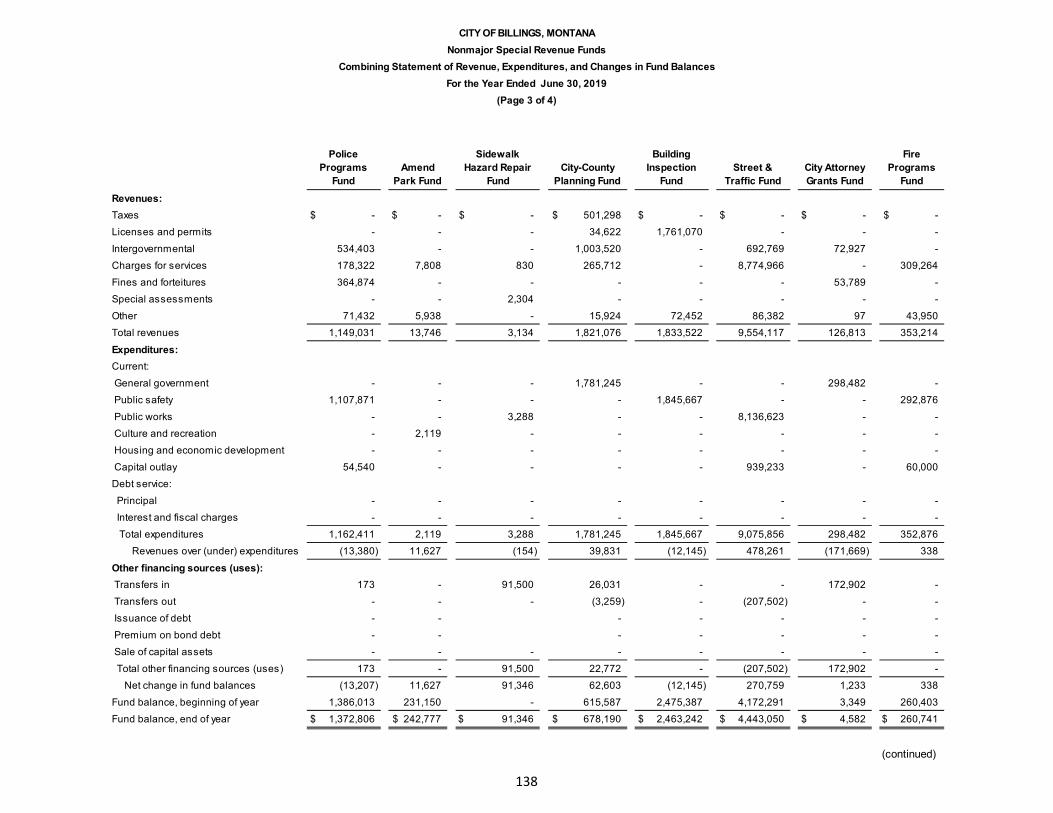
138
Police Programs
FundAmend
Park Fund
Sidewalk Hazard Repair
FundCity-County
Planning Fund
Building Inspection
FundStreet &
Traffic FundCity Attorney Grants Fund
Fire Programs
FundRevenues:Taxes -$ -$ -$ 501,298$ -$ -$ -$ -$ Licenses and permits - - - 34,622 1,761,070 - - -Intergovernmental 534,403 - - 1,003,520 - 692,769 72,927 -Charges for services 178,322 7,808 830 265,712 - 8,774,966 - 309,264Fines and forteitures 364,874 - - - - - 53,789 -Special assessments - - 2,304 - - - - -Other 71,432 5,938 - 15,924 72,452 86,382 97 43,950Total revenues 1,149,031 13,746 3,134 1,821,076 1,833,522 9,554,117 126,813 353,214Expenditures:Current: General government - - - 1,781,245 - - 298,482 - Public safety 1,107,871 - - - 1,845,667 - - 292,876 Public works - - 3,288 - - 8,136,623 - - Culture and recreation - 2,119 - - - - - - Housing and economic development - - - - - - - - Capital outlay 54,540 - - - - 939,233 - 60,000Debt service: Principal - - - - - - - - Interest and fiscal charges - - - - - - - - Total expenditures 1,162,411 2,119 3,288 1,781,245 1,845,667 9,075,856 298,482 352,876 Revenues over (under) expenditures (13,380) 11,627 (154) 39,831 (12,145) 478,261 (171,669) 338Other financing sources (uses): Transfers in 173 - 91,500 26,031 - - 172,902 - Transfers out - - - (3,259) - (207,502) - - Issuance of debt - - - - - - - Premium on bond debt - - - - - - - Sale of capital assets - - - - - - - - Total other financing sources (uses) 173 - 91,500 22,772 - (207,502) 172,902 - Net change in fund balances (13,207) 11,627 91,346 62,603 (12,145) 270,759 1,233 338Fund balance, beginning of year 1,386,013 231,150 - 615,587 2,475,387 4,172,291 3,349 260,403Fund balance, end of year 1,372,806$ 242,777$ 91,346$ 678,190$ 2,463,242$ 4,443,050$ 4,582$ 260,741$
(continued)
(Page 3 of 4)
Combining Statement of Revenue, Expenditures, and Changes in Fund BalancesFor the Year Ended June 30, 2019
CITY OF BILLINGS, MONTANANonmajor Special Revenue Funds
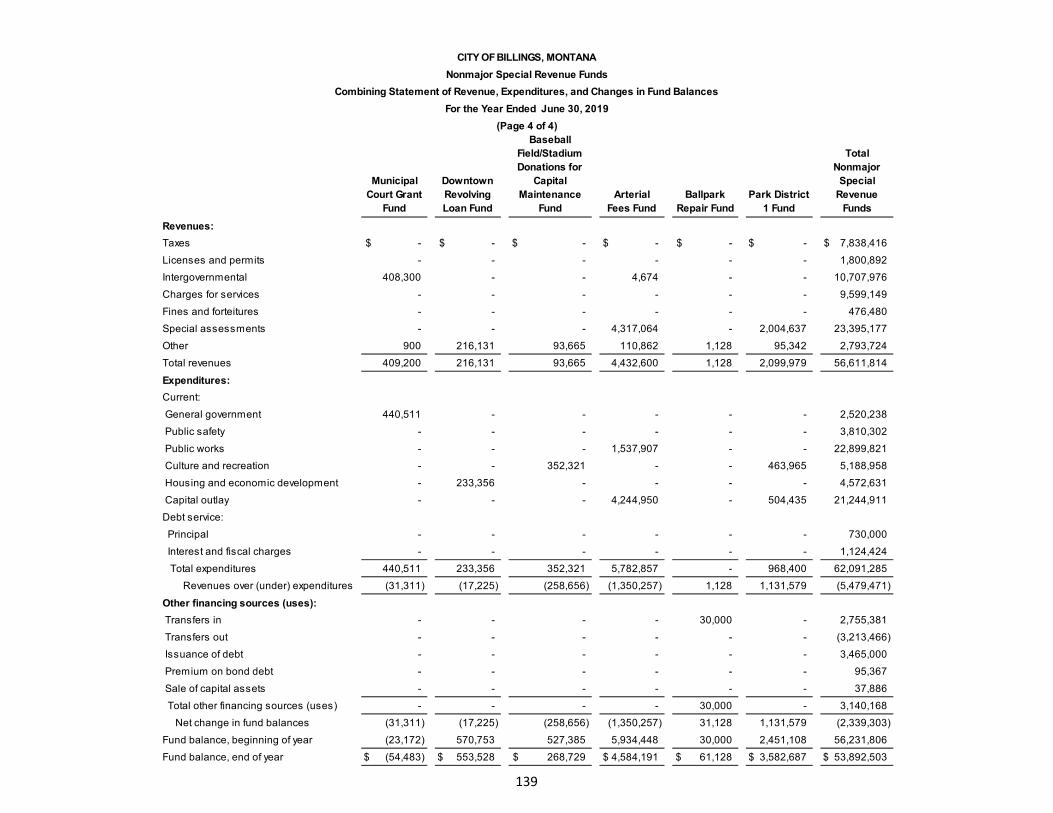
139
Municipal Court Grant
Fund
Downtown Revolving Loan Fund
Baseball Field/Stadium Donations for
Capital Maintenance
FundArterial
Fees FundBallpark
Repair FundPark District
1 Fund
Total Nonmajor
Special Revenue
FundsRevenues:Taxes -$ -$ -$ -$ -$ -$ 7,838,416$ Licenses and permits - - - - - - 1,800,892Intergovernmental 408,300 - - 4,674 - - 10,707,976Charges for services - - - - - - 9,599,149Fines and forteitures - - - - - - 476,480Special assessments - - - 4,317,064 - 2,004,637 23,395,177Other 900 216,131 93,665 110,862 1,128 95,342 2,793,724Total revenues 409,200 216,131 93,665 4,432,600 1,128 2,099,979 56,611,814Expenditures:Current: General government 440,511 - - - - - 2,520,238 Public safety - - - - - - 3,810,302 Public works - - - 1,537,907 - - 22,899,821 Culture and recreation - - 352,321 - - 463,965 5,188,958 Housing and economic development - 233,356 - - - - 4,572,631 Capital outlay - - - 4,244,950 - 504,435 21,244,911Debt service: Principal - - - - - - 730,000 Interest and fiscal charges - - - - - - 1,124,424 Total expenditures 440,511 233,356 352,321 5,782,857 - 968,400 62,091,285 Revenues over (under) expenditures (31,311) (17,225) (258,656) (1,350,257) 1,128 1,131,579 (5,479,471)Other financing sources (uses): Transfers in - - - - 30,000 - 2,755,381 Transfers out - - - - - - (3,213,466) Issuance of debt - - - - - - 3,465,000 Premium on bond debt - - - - - - 95,367 Sale of capital assets - - - - - - 37,886 Total other financing sources (uses) - - - - 30,000 - 3,140,168 Net change in fund balances (31,311) (17,225) (258,656) (1,350,257) 31,128 1,131,579 (2,339,303)Fund balance, beginning of year (23,172) 570,753 527,385 5,934,448 30,000 2,451,108 56,231,806Fund balance, end of year (54,483)$ 553,528$ 268,729$ 4,584,191$ 61,128$ 3,582,687$ 53,892,503$
(Page 4 of 4)
Combining Statement of Revenue, Expenditures, and Changes in Fund BalancesFor the Year Ended June 30, 2019
CITY OF BILLINGS, MONTANANonmajor Special Revenue Funds

140
Original Budget Final Budget Actual Variance
Original Budget Final Budget Actual Variance
Revenues:Taxes -$ -$ -$ -$ -$ -$ - - Licenses and permits - - - - - - - - Intergovernmental 3,729,490 3,729,490 3,232,306 497,184 984,000 984,000 1,085,619 (101,619) Charges for services - - - - - - - - Fines and forteitures - - - - - - - - Special assessments - - - - - - - - Other 40,000 40,000 145,006 (105,006) 54,000 54,000 84,310 (30,310) Total revenues 3,769,490 3,769,490 3,377,312 392,178 1,038,000 1,038,000 1,169,929 (131,929)
Expenditures:Current: Salaries and benefits 71,133 72,856 66,070 6,786 31,771 32,552 32,467 85 Operations and maintenance 287,954 477,571 1,841,706 (1,364,135) 876,170 925,954 531,314 394,640 Capital outlay 3,400,000 6,296,971 2,129,338 4,167,633 - 423,395 722,086 (298,691) Debt service: Principal - - - - - - - - Interest and fiscal charges - - - - - - - - Total expenditures 3,759,087 6,847,398 4,037,114 2,810,284 907,941 1,381,901 1,285,867 96,034 Revenues over (under) expenditures 10,403 (3,077,908) (659,802) (2,418,106) 130,059 (343,901) (115,938) (227,963) Other financing sources (uses): Transfers in 1,318,000 1,500,000 1,318,000 182,000 - - - - Transfers out - (91,500) (91,500) - - - - - Issuance of debt - - - - - - - - Premium on bond debt - - - - - - - - Sale of capital assets - - 37,786 (37,786) - - - - Total other financing sources (uses) 1,318,000 1,408,500 1,264,286 144,214 - - - - Net change in fund balances 1,328,403$ (1,669,408)$ 604,484 (2,273,892)$ 130,059$ (343,901)$ (115,938) (227,963) Fund balance, beginning of year 5,711,963 3,094,943 Fund balance, end of year 6,316,447$ 2,979,005
(continued)
CITY OF BILLINGS, MONTANANonmajor Special Revenue Funds
Combining Schedule of Revenues, Expenditures and Changes in Fund Balance-Budget to ActualFor the Fiscal Year Ended June 30, 2019
Gas Tax Fund EOC 911 Fund
(Page 1 of 15)

141
Original Budget
Final Budget Actual Variance
Original Budget Final Budget Actual Variance
Revenues:Taxes -$ -$ -$ -$ -$ -$ -$ -$ Licenses and permits - - - - - - - -Intergovernmental - - - - 1,320,000 1,426,646 1,307,294 119,352Charges for services - - - - 20,000 20,000 25,541 (5,541)Fines and forteitures - - - - - - - -Special assessments - - - - - - - -Other 750 750 950 (200) 201,100 201,100 779,045 (577,945)Total revenues 750 750 950 (200) 1,541,100 1,647,746 2,111,880 (464,134)
Expenditures:Current: Salaries and benefits - - - - 385,680 987,286 389,105 598,181 Operations and maintenance 6,000 6,000 - 6,000 841,320 2,163,723 1,671,333 492,390Capital outlay - - - - - - - -Debt service: Principal - - - - - - - - Interest and fiscal charges - - - - - - - - Total expenditures 6,000 6,000 - 6,000 1,227,000 3,151,009 2,060,438 1,090,571 Revenues over (under) expenditures (5,250) (5,250) 950 (6,200) 314,100 (1,503,263) 51,442 (1,554,705)Other financing sources (uses): Transfers in - - - - 62,000 60,000 62,004 (2,004) Transfers out - - - - - - - - Issuance of debt - - - - - - - - Premium on bond debt - - - - - - - - Sale of capital assets - - - - - - - - Total other financing sources (uses) - - - - 62,000 60,000 62,004 (2,004) Net change in fund balances (5,250)$ (5,250)$ 950 (6,200)$ 376,100$ (1,443,263)$ 113,446 (1,556,709)$Fund balance, beginning of year 38,220 208,826Fund balance, end of year 39,170$ 322,272$
(continued)
CITY OF BILLINGS, MONTANANonmajor Special Revenue Funds
Combining Schedule of Revenues, Expenditures and Changes in Fund Balance-Budget to ActualFor the Fiscal Year Ended June 30, 2019
Animal Shelter Donation Fund Development Services Grant Fund
(Page 2 of 15)

142
Original Budget
Final Budget Actual Variance
Original Budget
Final Budget Actual Variance
Revenues:Taxes 1,134,648$ 1,134,648$ 1,139,977$ (5,329)$ -$ -$ -$ -$ Licenses and permits - - - - - - - -Intergovernmental 1,310,533 1,310,533 1,751,471 (440,938) - - - -Charges for services 13,825 13,825 17,254 (3,429) 12,000 12,000 21,526 (9,526)Fines and forteitures 76,900 76,900 57,817 19,083 - - - -Special assessments - - - - - - - -Other 123,062 123,062 137,549 (14,487) 1,800 1,800 4,099 (2,299)Total revenues 2,658,968 2,658,968 3,104,068 (445,100) 13,800 13,800 25,625 (11,825)
Expenditures:Current: Salaries and benefits 2,373,252 2,427,974 2,298,984 128,990 - - - - Operations and maintenance 1,300,131 1,301,631 1,093,257 208,374 45,000 45,000 26,000 19,000Capital outlay - - - - - - - -Debt service: Principal - - - - - - - - Interest and fiscal charges - - - - - - - - Total expenditures 3,673,383 3,729,605 3,392,241 337,364 45,000 45,000 26,000 19,000 Revenues over (under) expenditures (1,014,415) (1,070,637) (288,173) (782,464) (31,200) (31,200) (375) (30,825)Other financing sources (uses): Transfers in 1,021,183 1,021,183 1,035,382 (14,199) - - - - Transfers out (20,705) (20,705) (20,705) - - - - - Issuance of debt - - - - - - - - Premium on bond debt - - - - - - - - Sale of capital assets - - - - - - - - Total other financing sources (uses) 1,000,478 1,000,478 1,014,677 (14,199) - - - - Net change in fund balances (13,937)$ (70,159)$ 726,504 (796,663)$ (31,200)$ (31,200)$ (375) (30,825)$ Fund balance, beginning of year 2,212,739 167,771Fund balance, end of year 2,939,243$ 167,396$
(continued)
CITY OF BILLINGS, MONTANANonmajor Special Revenue Funds
Combining Schedule of Revenues, Expenditures and Changes in Fund Balance-Budget to ActualFor the Fiscal Year Ended June 30, 2019
Library Fund Cemetery Improvements Fund
(Page 3 of 15)

143
Original Budget
Final Budget Actual Variance
Original Budget
Final Budget Actual Variance
Revenues:Taxes -$ -$ -$ -$ -$ -$ -$ -$ Licenses and permits - - - - - - - -Intergovernmental - - - - - - - -Charges for services - - - - - - - -Fines and forteitures - - - - - - - -Special assessments 8,717,000 8,717,000 8,999,136 (282,136) 2,875 2,875 2,847 28Other 20,600 20,600 107,144 (86,544) - - 214 (214)Total revenues 8,737,600 8,737,600 9,106,280 (368,680) 2,875 2,875 3,061 (186)
Expenditures:Current: Salaries and benefits - - - - - - - - Operations and maintenance 7,406,410 7,406,410 7,406,413 (3) 112 112 108 4Capital outlay - - - - - - - -Debt service: Principal - - - - - - - - Interest and fiscal charges - - - - - - - - Total expenditures 7,406,410 7,406,410 7,406,413 (3) 112 112 108 4 Revenues over (under) expenditures 1,331,190 1,331,190 1,699,867 (368,677) 2,763 2,763 2,953 (190)Other financing sources (uses): Transfers in - - - - - - - - Transfers out (1,318,000) (1,318,000) (1,318,000) - - - - - Issuance of debt - - - - - - - - Premium on bond debt - - - - - - - - Sale of capital assets - - - - - - - - Total other financing sources (uses) (1,318,000) (1,318,000) (1,318,000) - - - - - Net change in fund balances 13,190$ 13,190$ 381,867 (368,677)$ 2,763$ 2,763$ 2,953 (190)$ Fund balance, beginning of year 3,707,922 8,571Fund balance, end of year 4,089,789$ 11,524$
(continued)
For the Fiscal Year Ended June 30, 2019
CITY OF BILLINGS, MONTANANonmajor Special Revenue Funds
Combining Schedule of Revenues, Expenditures and Changes in Fund Balance-Budget to Actual
(Page 4 of 15)
Street Maintenance Districts Fund Road Maintenance Dist. 6 Fund

144
Original Budget
Final Budget Actual Variance
Original Budget
Final Budget Actual Variance
Revenues:Taxes -$ -$ -$ -$ -$ -$ -$ -$ Licenses and permits - - - - - - - -Intergovernmental - - - - - - - -Charges for services - - - - - - - -Fines and forteitures - - - - - - - -Special assessments 2,350,000 2,350,000 2,452,312 (102,312) 1,050,336 1,050,336 1,174,459 (124,123)Other 10,000 10,000 68,186 (58,186) 1,200 1,200 14,273 (13,073)Total revenues 2,360,000 2,360,000 2,520,498 (160,498) 1,051,536 1,051,536 1,188,732 (137,196)
Expenditures:Current: Salaries and benefits - - - - - - - - Operations and maintenance 2,525,499 2,525,499 2,433,632 91,867 1,078,102 1,078,102 813,359 264,743Capital outlay - - - - - - - -Debt service: Principal - - - - - - - - Interest and fiscal charges - - - - - - - - Total expenditures 2,525,499 2,525,499 2,433,632 91,867 1,078,102 1,078,102 813,359 264,743 Revenues over (under) expenditures (165,499) (165,499) 86,866 (252,365) (26,566) (26,566) 375,373 (401,939)Other financing sources (uses): Transfers in - - - - - - - - Transfers out - - - - - - - - Issuance of debt - - - - - - - - Premium on bond debt - - - - - - - - Sale of capital assets - - - - - - - - Total other financing sources (uses) - - - - - - - - Net change in fund balances (165,499)$ (165,499)$ 86,866 (252,365)$ (26,566)$ (26,566)$ 375,373 (401,939)$ Fund balance, beginning of year 1,654,078 654,342Fund balance, end of year 1,740,944$ 1,029,715$
(continued)
(Page 5 of 15)
CITY OF BILLINGS, MONTANANonmajor Special Revenue Funds
Combining Schedule of Revenues, Expenditures and Changes in Fund Balance-Budget to ActualFor the Fiscal Year Ended June 30, 2019
Light Maintenance Districts Fund Park Maintenance Districts Fund

145
Original Budget Final Budget Actual Variance
Original Budget Final Budget Actual Variance
Revenues:Taxes -$ -$ -$ -$ 2,473,377$ 2,473,377$ 2,282,884$ 190,493$ Licenses and permits 8,000 8,000 5,200 2,800 - - - -Intergovernmental - - - - 211,821 211,821 211,821 -Charges for services - - - - - - - -Fines and forteitures - - - - - - - -Special assessments 4,320,000 4,320,000 4,442,418 (122,418) - - - -Other 47,452 47,452 171,510 (124,058) 5,500 5,500 21,049 (15,549)Total revenues 4,375,452 4,375,452 4,619,128 (243,676) 2,690,698 2,690,698 2,515,754 174,944
Expenditures:Current: Salaries and benefits - - - - - - - - Operations and maintenance 1,487,479 1,484,692 1,474,182 10,510 3,017,557 3,109,145 1,063,701 2,045,444Capital outlay 2,965,000 7,510,879 6,497,854 1,013,025 - - - -Debt service: Principal - - - - 325,000 325,000 325,000 - Interest and fiscal charges - - - - 623,652 623,652 622,852 800 Total expenditures 4,452,479 8,995,571 7,972,036 1,023,535 3,966,209 4,057,797 2,011,553 2,046,244 Revenues over (under) expenditures (77,027) (4,620,119) (3,352,908) (1,267,211) (1,275,511) (1,367,099) 504,201 (1,871,300)Other financing sources (uses): Transfers in - - - - - - - - Transfers out (1,015,000) (1,015,000) (1,012,500) (2,500) (100,000) (100,000) (100,000) - Issuance of debt - - - - - - - - Premium on bond debt - - - - - - - - Sale of capital assets - - - - - - - - Total other financing sources (uses) (1,015,000) (1,015,000) (1,012,500) (2,500) (100,000) (100,000) (100,000) - Net change in fund balances (1,092,027)$ (5,635,119)$ (4,365,408) (1,269,711)$ (1,375,511)$ (1,467,099)$ 404,201 (1,871,300)$Fund balance, beginning of year 6,401,544 2,523,093Fund balance, end of year 2,036,136$ 2,927,294$
(continued)
(Page 6 of 15)
CITY OF BILLINGS, MONTANANonmajor Special Revenue Funds
Combining Schedule of Revenues, Expenditures and Changes in Fund Balance-Budget to ActualFor the Fiscal Year Ended June 30, 2019
Storm Sewer Fund North 27th Street Tax Increment Operating Fund

146
Original Budget Final Budget Actual Variance
Original Budget Final Budget Actual Variance
Revenues:Taxes 2,924,975$ 2,924,975$ 3,184,108$ (259,133)$ 764,500$ 764,500$ 730,149$ 34,351$ Licenses and permits - - - - - - - -Intergovernmental 256,218 256,218 256,218 - 146,000 146,000 146,654 (654)Charges for services - - - - - - - -Fines and forteitures - - - - - - - -Special assessments - - - - - - - -Other 44,000 44,000 138,333 (94,333) 3,606,500 3,606,500 52,982 3,553,518Total revenues 3,225,193 3,225,193 3,578,659 (353,466) 4,517,000 4,517,000 929,785 3,587,215
Expenditures:Current: Salaries and benefits - - - - - - - - Operations and maintenance 312,800 312,800 728,043 (415,243) 400,166 400,166 587,102 (186,936)Capital outlay 4,000,000 5,594,463 2,950,621 2,643,842 4,550,000 4,819,608 3,141,855 1,677,753Debt service: Principal 310,000 310,000 305,000 5,000 260,000 260,000 100,000 160,000 Interest and fiscal charges 342,444 342,444 340,994 1,450 184,138 184,138 160,578 23,560 Total expenditures 4,965,244 6,559,707 4,324,657 2,235,050 5,394,304 5,663,912 3,989,535 1,674,377 Revenues over (under) expenditures (1,740,051) (3,334,514) (745,999) (2,588,515) (877,304) (1,146,912) (3,059,750) 1,912,838Other financing sources (uses): Transfers in - - - - - - - - Transfers out - - - - - - - - Issuance of debt - - - - - - 3,465,000 (3,465,000) Premium on bond debt - - - - - - 95,367 (95,367) Sale of capital assets - - - - - - - - Total other financing sources (uses) - - - - - - 3,560,367 (3,560,367) Net change in fund balances (1,740,051)$ (3,334,514)$ (745,999) (2,588,515)$ (877,304)$ (1,146,912)$ 500,617 (1,647,529)$Fund balance, beginning of year 7,666,170 1,209,807Fund balance, end of year 6,920,171$ 1,710,424$
(continued)
(Page 7 of 15)
CITY OF BILLINGS, MONTANANonmajor Special Revenue Funds
Combining Schedule of Revenues, Expenditures and Changes in Fund Balance-Budget to ActualFor the Fiscal Year Ended June 30, 2019
South Tax Increment Operating Fund East Tax Increment Operating Fund

147
Original Budget
Final Budget Actual Variance
Original Budget
Final Budget Actual Variance
Revenues:Taxes -$ -$ -$ -$ -$ -$ -$ -$ Licenses and permits - - - - - - - -Intergovernmental - - - - 382,689 382,689 534,403 (151,714)Charges for services - - - - 152,059 152,059 178,322 (26,263)Fines and forteitures - - - - 81,000 81,000 364,874 (283,874)Special assessments - - - - - - - -Other 179,160 179,160 252,792 (73,632) 383,697 383,697 71,430 312,267Total revenues 179,160 179,160 252,792 (73,632) 999,445 999,445 1,149,029 (149,584)
Expenditures:Current: Salaries and benefits - - - - 563,875 567,269 264,616 302,653 Operations and maintenance 68,288 72,138 38,944 33,194 474,406 462,957 843,254 (380,297)Capital outlay - - - - - - 54,540 (54,540)Debt service: Principal - - - - - - - - Interest and fiscal charges - - - - - - - - Total expenditures 68,288 72,138 38,944 33,194 1,038,281 1,030,226 1,162,410 (132,184) Revenues over (under) expenditures 110,872 107,022 213,848 (106,826) (38,836) (30,781) (13,381) (17,400)Other financing sources (uses): Transfers in 5,000 5,000 19,389 (14,389) - - 173 (173) Transfers out (460,000) (460,000) (460,000) - - - - - Issuance of debt - - - - - - - - Premium on bond debt - - - - - - - - Sale of capital assets - - 100 (100) - - - - Total other financing sources (uses) (455,000) (455,000) (440,511) (14,489) - - 173 (173) Net change in fund balances (344,128)$ (347,978)$ (226,663) (121,315)$ (38,836)$ (30,781)$ (13,208) (17,573)$ Fund balance, beginning of year 2,337,115 1,386,013Fund balance, end of year 2,110,452$ 1,372,805$
(continued)
Nonmajor Special Revenue Funds
(Page 8 of 15)
Combining Schedule of Revenues, Expenditures and Changes in Fund Balance-Budget to ActualFor the Fiscal Year Ended June 30, 2019
CITY OF BILLINGS, MONTANA
Police Program FundPark Program Fund

148
Original Budget
Final Budget Actual Variance
Original Budget
Final Budget Actual Variance
Revenues:Taxes -$ -$ -$ -$ -$ -$ -$ -$ Licenses and permits - - - - - - - -Intergovernmental - - - - - - - -Charges for services 57,000 57,000 7,808 49,192 - - 830 (830)Fines and forteitures - - - - - - - -Special assessments - - - - - - 2,304 (2,304)Other 2,600 2,600 5,937 (3,337) - - - -Total revenues 59,600 59,600 13,745 45,855 - - 3,134 (3,134)Expenditures:Current: Salaries and benefits - - - - - - - - Operations and maintenance 181,506 181,506 2,119 179,387 - 91,500 3,288 88,212Capital outlay - - - - - - - -Debt service: Principal - - - - - - - - Interest and fiscal charges - - - - - - - - Total expenditures 181,506 181,506 2,119 179,387 - 91,500 3,288 88,212 Revenues over (under) expenditures (121,906) (121,906) 11,626 (133,532) - (91,500) (154) (91,346)Other financing sources (uses): Transfers in - - - - - 91,500 91,500 - Transfers out (1,000) (1,000) - (1,000) - - - - Issuance of debt - - - - - - - - Premium on bond debt - - - - - - - - Sale of capital assets - - - - - - - - Total other financing sources (uses) (1,000) (1,000) - (1,000) - 91,500 91,500 - Net change in fund balances (122,906)$ (122,906)$ 11,626 (134,532)$ -$ -$ 91,346 (91,346)$ Fund balance, beginning of year 231,150 -Fund balance, end of year 242,776$ 91,346$
(continued)
CITY OF BILLINGS, MONTANANonmajor Special Revenue Funds
Combining Schedule of Revenues, Expenditures and Changes in Fund Balances-Budget to ActualFor the Fiscal Year Ended June 30, 2019
Sidewalk Hazard Repair Fund
(Page 9 of 15)
Amend Park Fund

149
Original Budget
Final Budget Actual Variance
Original Budget Final Budget Actual Variance
Revenues:Taxes 472,000$ 472,000$ 501,298$ (29,298)$ -$ -$ -$ -$ Licenses and permits 27,400 27,400 34,622 (7,222) 1,185,850 1,185,850 1,761,070 (575,220)Intergovernmental 844,469 844,469 1,003,520 (159,051) - - - -Charges for services 234,963 234,963 265,712 (30,749) - - - -Fines and forteitures - - - - - - - -Special assessments - - - - - - - -Other 2,600 2,600 15,925 (13,325) 21,000 21,000 72,453 (51,453)Total revenues 1,581,432 1,581,432 1,821,077 (239,645) 1,206,850 1,206,850 1,833,523 (626,673)Expenditures:Current: Salaries and benefits 1,038,836 1,064,554 1,066,906 (2,352) 1,345,832 1,378,661 1,333,422 45,239 Operations and maintenance 737,655 985,619 714,338 271,281 599,180 611,280 512,245 99,035Capital outlay - - - - - - - -Debt service: Principal - - - - - - - - Interest and fiscal charges - - - - - - - - Total expenditures 1,776,491 2,050,173 1,781,244 268,929 1,945,012 1,989,941 1,845,667 144,274 Revenues over (under) expenditures (195,059) (468,741) 39,833 (508,574) (738,162) (783,091) (12,144) (770,947)Other financing sources (uses): Transfers in 26,031 26,031 26,031 - - - - - Transfers out (3,259) (3,259) (3,259) - - - - - Issuance of debt - - - - - - - - Premium on bond debt - - - - - - - - Sale of capital assets - - - - - - - - Total other financing sources (uses) 22,772 22,772 22,772 - - - - - Net change in fund balances (172,287)$ (445,969)$ 62,605 (508,574)$ (738,162)$ (783,091)$ (12,144) (770,947)$ Fund balance, beginning of year 615,587 2,475,387Fund balance, end of year 678,192$ 2,463,243$
(continued)
CITY OF BILLINGS, MONTANANonmajor Special Revenue Funds
Combining Schedule of Revenues, Expenditures and Changes in Fund Balances-Budget to ActualFor the Fiscal Year Ended June 30, 2019
(Page 10 of 15)
City-County Planning Fund Building Inspection Fund

150
Original Budget Final Budget Actual Variance
Original Budget
Final Budget Actual Variance
Revenues:Taxes -$ -$ -$ -$ -$ -$ -$ -$ Licenses and permits - - - - - - - -Intergovernmental 683,000 683,000 692,769 (9,769) 75,000 75,000 72,927 2,073Charges for services 8,547,500 8,547,500 8,774,966 (227,466) - - - -Fines and forteitures - - - - 60,000 60,000 53,789 6,211Special assessments - - - - - - - -Other 40,000 40,000 86,383 (46,383) - - 95 (95)Total revenues 9,270,500 9,270,500 9,554,118 (283,618) 135,000 135,000 126,811 8,189Expenditures:Current: Salaries and benefits 3,979,184 4,120,177 4,117,915 2,262 390,197 399,703 295,139 104,564 Operations and maintenance 3,866,170 4,002,694 4,018,708 (16,014) 1,800 1,800 3,343 (1,543)Capital outlay 3,246,906 3,246,906 939,233 2,307,673 - - - -Debt service: Principal - - - - - - - - Interest and fiscal charges - - - - - - - - Total expenditures 11,092,260 11,369,777 9,075,856 2,293,921 391,997 401,503 298,482 103,021 Revenues over (under) expenditures (1,821,760) (2,099,277) 478,262 (2,577,539) (256,997) (266,503) (171,671) (94,832)Other financing sources (uses): Transfers in - - - - 257,978 257,978 172,903 85,075 Transfers out (207,502) (207,502) (207,502) - - - - - Issuance of debt - - - - - - - - Premium on bond debt - - - - - - - - Sale of capital assets - - - - - - - - Total other financing sources (uses) (207,502) (207,502) (207,502) - 257,978 257,978 172,903 85,075 Net change in fund balances (2,029,262)$ (2,306,779)$ 270,760 (2,577,539)$ 981$ (8,525)$ 1,232 (9,757)$ Fund balance, beginning of year 4,172,291 3,349Fund balance, end of year 4,443,051$ 4,581$
(continued)
Nonmajor Special Revenue FundsCombining Schedule of Revenues, Expenditures and Changes in Fund Balances-Budget to Actual
For the Fiscal Year Ended June 30, 2019
CITY OF BILLINGS, MONTANA
City Attorney Grants Fund
(Page 11 of 15)
Street & Traffic Fund

151
Original Budget
Final Budget Actual Variance
Original Budget
Final Budget Actual Variance
Revenues:Taxes -$ -$ -$ -$ -$ -$ -$ -$ Licenses and permits - - - - - - - -Intergovernmental - - 309,264 (309,264) 433,225 433,225 408,300 24,925Charges for services - - - - - - - -Fines and forteitures - - - - - - - -Special assessments - - - - - - - -Other 6,675 6,675 43,950 (37,275) - - 899 (899)Total revenues 6,675 6,675 353,214 (346,539) 433,225 433,225 409,199 24,026Expenditures:Current: Salaries and benefits 7,000 7,000 3,734 3,266 211,616 216,370 161,378 54,992 Operations and maintenance 62,000 62,000 289,142 (227,142) 222,509 222,509 279,132 (56,623)Capital outlay - 300,000 60,000 240,000 - - - -Debt service: Principal - - - - - - - - Interest and fiscal charges - - - - - - - - Total expenditures 69,000 369,000 352,876 16,124 434,125 438,879 440,510 (1,631) Revenues over (under) expenditures (62,325) (362,325) 338 (362,663) (900) (5,654) (31,311) 25,657Other financing sources (uses): Transfers in - - - - - - - - Transfers out - - - - - - - - Issuance of debt - - - - - - - - Premium on bond debt - - - - - - - - Sale of capital assets - - - - - - - - Total other financing sources (uses) - - - - - - - - Net change in fund balances (62,325)$ (362,325)$ 338 (362,663)$ (900)$ (5,654)$ (31,311) 25,657$ Fund balance, beginning of year 260,403 (23,172)Fund balance, end of year 260,741$ (54,483)$
(continued)
CITY OF BILLINGS, MONTANANonmajor Special Revenue Funds
Combining Schedule of Revenues, Expenditures and Changes in Fund Balances-Budget to ActualFor the Fiscal Year Ended June 30, 2019
Fire Program Fund
(Page 12 of 15)
Municipal Court Grant Fund
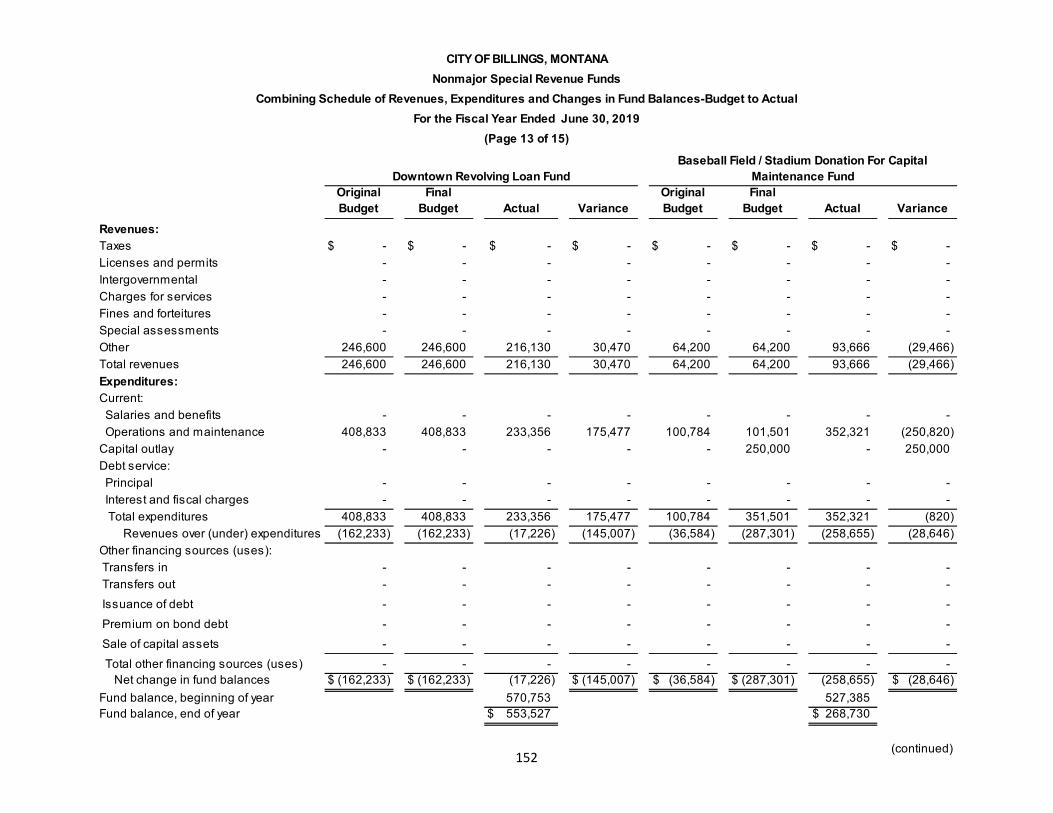
152
Original Budget
Final Budget Actual Variance
Original Budget
Final Budget Actual Variance
Revenues:Taxes -$ -$ -$ -$ -$ -$ -$ -$ Licenses and permits - - - - - - - -Intergovernmental - - - - - - - -Charges for services - - - - - - - -Fines and forteitures - - - - - - - -Special assessments - - - - - - - -Other 246,600 246,600 216,130 30,470 64,200 64,200 93,666 (29,466)Total revenues 246,600 246,600 216,130 30,470 64,200 64,200 93,666 (29,466)Expenditures:Current: Salaries and benefits - - - - - - - - Operations and maintenance 408,833 408,833 233,356 175,477 100,784 101,501 352,321 (250,820)Capital outlay - - - - - 250,000 - 250,000Debt service: Principal - - - - - - - - Interest and fiscal charges - - - - - - - - Total expenditures 408,833 408,833 233,356 175,477 100,784 351,501 352,321 (820) Revenues over (under) expenditures (162,233) (162,233) (17,226) (145,007) (36,584) (287,301) (258,655) (28,646)Other financing sources (uses): Transfers in - - - - - - - - Transfers out - - - - - - - - Issuance of debt - - - - - - - - Premium on bond debt - - - - - - - - Sale of capital assets - - - - - - - - Total other financing sources (uses) - - - - - - - - Net change in fund balances (162,233)$ (162,233)$ (17,226) (145,007)$ (36,584)$ (287,301)$ (258,655) (28,646)$ Fund balance, beginning of year 570,753 527,385Fund balance, end of year 553,527$ 268,730$
(continued)
CITY OF BILLINGS, MONTANANonmajor Special Revenue Funds
Combining Schedule of Revenues, Expenditures and Changes in Fund Balances-Budget to ActualFor the Fiscal Year Ended June 30, 2019
(Page 13 of 15)
Downtown Revolving Loan FundBaseball Field / Stadium Donation For Capital
Maintenance Fund

153
Original Budget Final Budget Actual Variance
Original Budget
Final Budget Actual Variance
Revenues:Taxes -$ -$ -$ -$ -$ -$ -$ -$ Licenses and permits - - - - - - - -Intergovernmental - - 4,674 (4,674) - - - -Charges for services - - - - - - - -Fines and forteitures - - - - - - - -Special assessments 4,215,000 4,215,000 4,317,064 (102,064) - - - -Other 40,000 40,000 110,863 (70,863) - - 1,128 (1,128)Total revenues 4,255,000 4,255,000 4,432,601 (177,601) - - 1,128 (1,128)Expenditures:Current: Salaries and benefits - - - - - - - - Operations and maintenance 140,510 140,510 1,537,907 (1,397,397) - - - -Capital outlay 3,974,000 8,753,788 4,244,950 4,508,838 - - - -Debt service: Principal - - - - - - - - Interest and fiscal charges - - - - - - - - Total expenditures 4,114,510 8,894,298 5,782,857 3,111,441 - - - - Revenues over (under) expenditures 140,490 (4,639,298) (1,350,256) (3,289,042) - - 1,128 (1,128)Other financing sources (uses): Transfers in - - - - 30,000 30,000 30,000 - Transfers out - - - - - - - - Issuance of debt - - - - - - - - Premium on bond debt - - - - - - - - Sale of capital assets - - - - - - - - Total other financing sources (uses) - - - - 30,000 30,000 30,000 - Net change in fund balances 140,490$ (4,639,298)$ (1,350,256) (3,289,042)$ 30,000$ 30,000$ 31,128 (1,128)$ Fund balance, beginning of year 5,934,448 30,000Fund balance, end of year 4,584,192$ 61,128$
(continued)
Ballpark Repair Fund
CITY OF BILLINGS, MONTANANonmajor Special Revenue Funds
Combining Schedule of Revenues, Expenditures and Changes in Fund Balances-Budget to ActualFor the Fiscal Year Ended June 30, 2019
(Page 14 of 15)
Arterial Fees Fund

154
Original Budget Final Budget Actual Variance
Original Budget Final Budget Actual Variance
Revenues:Taxes -$ -$ -$ -$ 7,769,500$ 7,769,500$ 7,838,416$ (68,916)$ Licenses and permits - - - - 1,221,250 1,221,250 1,800,892 (579,642)Intergovernmental - - - - 10,376,445 10,483,091 11,017,240 (534,149)Charges for services - - - - 9,037,347 9,037,347 9,291,959 (254,612)Fines and forteitures - - - - 217,900 217,900 476,480 (258,580)Special assessments 2,000,000 2,000,000 2,004,637 (4,637) 22,655,211 22,655,211 23,395,177 (739,966)Other 16,000 16,000 95,343 (79,343) 5,158,496 5,158,496 2,791,644 2,366,852Total revenues 2,016,000 2,016,000 2,099,980 (83,980) 56,436,149 56,542,795 56,611,808 (69,013)Expenditures:Current: Salaries and benefits 328,379 334,175 281,446 52,729 10,726,755 11,608,577 10,311,182 1,297,395 Operations and maintenance 336,838 338,729 179,518 159,211 26,785,179 28,920,381 28,677,765 242,616Capital outlay 1,300,000 1,495,346 507,435 987,911 23,435,906 38,691,356 21,247,912 17,443,444Debt service: Principal - - - - 895,000 895,000 730,000 165,000 Interest and fiscal charges - - - - 1,150,234 1,150,234 1,124,424 25,810 Total expenditures 1,965,217 2,168,250 968,399 1,199,851 62,993,074 81,265,548 62,091,282 19,174,266 Revenues over (under) expenditures 50,783 (152,250) 1,131,581 (1,283,831) (6,556,925) (24,722,753) (5,479,475) (19,243,278)Other financing sources (uses): Transfers in - - - - 2,720,192 2,991,692 2,755,382 236,310 Transfers out - - - - (3,125,466) (3,216,966) (3,213,466) (3,500) Issuance of debt - - - - - - 3,465,000 (3,465,000) Premium on bond debt - - - - - - 95,367 (95,367) Sale of capital assets - - - - - - 37,886 (37,886) Total other financing sources (uses) - - - - (405,274) (225,274) 3,140,169 (3,365,443) Net change in fund balances 50,783$ (152,250)$ 1,131,581 (1,283,831)$ (6,839,293)$ (24,825,121)$ (2,339,306) (22,474,189)$ Fund balance, beginning of year 2,451,108 56,231,806Fund balance, end of year 3,582,689$ 53,892,500$
CITY OF BILLINGS, MONTANANonmajor Special Revenue Funds
Combining Schedule of Revenues, Expenditures and Changes in Fund Balances-Budget to ActualFor the Fiscal Year Ended June 30, 2019
Total Nonmajor Special Revenue FundsPark District 1 Fund
(Page 15 of 15)

NONMAJOR DEBT SERVICE FUNDS
The City’s non-major debt service funds are their purposes are:
The Series 2012 Library Fund accounts for the payment of debt issued for the construction of the new library building.
The Storm Sewer Fund accounts for the payment of debt used for the construction of storm sewers.
The Series 2010 Parks Fund accounts for payment of debt used for City-wide park improvements.
The Series 2004A Street Improvements Fund accounts for payment of debt used for City-wide street improvements.
The Series 2015 GO Refunding Fund accounts for the payment of the 2007A Baseball Field & Stadium Fund. A crossover refunding was done in 2015 to retire the debt on 7/1/2017.
The Special Improvement Districts Fund accounts for the accumulation for and payment of special assessment debt
used for the construction of projects within special improvement districts.
The Sidewalk and Curb Districts Fund accounts for the accumulation for and payment of special assessment debt used for the construction of sidewalks and curbs.

155
Series 2012 Library Fund
Storm Sewer Fund
Series 2010 Parks Fund
Series 2004A Street
Improvements Fund
Series 2015 G.O.
Refunding Fund
Special Improvement
Districts Fund
Sidewalk Curb
Districts Fund
Total Nonmajor
Debt Service Funds
Assets Cash and cash equivalents 21,332$ 420,534$ 3,954$ 22,262$ 98,641$ 1,130,077$ 161,217$ 1,858,017$ Cash with fiscal agent 1,018,825 785,247 113,375 318,425 659,975 144,622 5,824 3,046,293 Investments 30,951 607,534 4,092 32,350 149,099 1,625,462 239,119 2,688,607 Receivables: Property taxes 39,366 - 5,012 16,122 32,751 - - 93,251 Delinquent special assessments - - - - - 29,081 19,487 48,568 Special assessments receivable - - - - - 3,499,186 2,229,125 5,728,311 Accrued interest 1,184 2,768 134 416 1,249 6,843 146 12,740 Property held for resale - - - - - 155,997 - 155,997
Total assets 1,111,658$ 1,816,083$ 126,567$ 389,575$ 941,715$ 6,591,268$ 2,654,918$ 13,631,784$
Liabilities, Deferred Inflows and Fund Balances
Liabilities: Other liabilities - - - - - 63,350 10,000 73,350 Total liabilities - - - - - 63,350 10,000 73,350Deferred Inflows: Unavailable Revenue 8,923 - 1,142 3,494 7,150 3,504,236 2,235,347 5,760,292Fund balances:
Restricted 1,102,735 1,816,083 125,425 386,081 934,565 3,023,682 409,571 7,798,142 Total fund balances 1,102,735 1,816,083 125,425 386,081 934,565 3,023,682 409,571 7,798,142
Total liabilities, deferred inflows and fund balances 1,111,658$ 1,816,083$ 126,567$ 389,575$ 941,715$ 6,591,268$ 2,654,918$ 13,631,784$
CITY OF BILLINGS, MONTANANonmajor Debt Service Funds
Combining Balance Sheet June 30, 2019

156
Series 2012 Library Fund
Storm Sewer Fund
Series 2010 Parks Fund
Series 2004A Street
Improvements Fund
Series 2015 G.O.
Refunding Fund
Special Improvement Districts Fund
Sidewalk and Curb Districts
Fund
Total Nonmajor
Debt Service Funds
Revenues:Taxes 904,969$ -$ 115,032$ 375,545$ 758,909$ -$ -$ 2,154,455$ Special assessments - - - - - 953,736 524,676 1,478,412Other 313,421 25,696 1,298 3,673 8,980 60,778 12,370 426,216Total revenues 1,218,390 25,696 116,330 379,218 767,889 1,014,514 537,046 4,059,083
Expenditures:Current: General government 8,860 4,800 - - 5,298 - - 18,958 Public works - - - - - 24,800 14,300 39,100 Principal 810,000 545,000 110,000 275,000 555,000 565,327 306,000 3,166,327 Interest and fiscal charges 396,100 463,281 11,271 65,069 195,500 177,266 96,963 1,405,450 Total expenditures 1,214,960 1,013,081 121,271 340,069 755,798 767,393 417,263 4,629,835 Revenues over (under) expenditures 3,430 (987,385) (4,941) 39,149 12,091 247,121 119,783 (570,752)
Other financing sources: Transfers in - 1,012,500 - - - 2,044 - 1,014,544 Transfers out - - - - - - (2,044) (2,044) Total other financing sources (uses) - 1,012,500 - - - 2,044 (2,044) 1,012,500
Net change in fund balances 3,430 25,115 (4,941) 39,149 12,091 249,165 117,739 441,748
Fund balance, beginning of year 1,099,305 1,790,968 130,366 346,932 704,120 2,774,517 291,832 7,138,040
Fund balance, end of year 1,102,735$ 1,816,083$ 125,425$ 386,081$ 716,211$ 3,023,682$ 409,571$ 7,579,788$
CITY OF BILLINGS, MONTANANonmajor Debt Service Funds
Combining Statement of Revenue, Expenditures and Changes in Fund BalancesFor the Year Ended June 30, 2019

157
Original Budget Final Budget Actual Variance
Original Budget Final Budget Actual Variance
Revenues:Taxes 902,444$ 902,444$ 904,969$ (2,525)$ -$ -$ -$ -$ Special assessments - - - - - - - -Other 303,000 303,000 313,421 (10,421) 2,100 2,100 25,696 (23,596)Total revenues 1,205,444 1,205,444 1,218,390 (12,946) 2,100 2,100 25,696 (23,596)Expenditures:Current: Operations and maintenance 8,851 8,851 8,860 (9) 10,109 10,109 8,712 1,397Debt service: Principal 810,000 810,000 810,000 - 545,000 545,000 545,000 - Interest and fiscal charges 396,100 396,100 396,100 - 459,369 459,369 459,369 - Total expenditures 1,214,951 1,214,951 1,214,960 (9) 1,014,478 1,014,478 1,013,081 1,397 Revenues over (under) expenditures (9,507) (9,507) 3,430 (12,937) (1,012,378) (1,012,378) (987,385) (24,993)Other financing sources: Transfers in - - - - 1,015,000 1,015,000 1,012,500 2,500 Transfers out - - - - - - - - Total other financing sources - - - - 1,015,000 1,015,000 1,012,500 2,500 Net change in fund balances (9,507)$ (9,507)$ 3,430 (12,937)$ 2,622$ 2,622$ 25,115 (22,493)$ Fund balance, beginning of year 1,099,305 1,790,968Fund balance, end of year 1,102,735$ 1,816,083$
(continued)
CITY OF BILLINGS, MONTANANonmajor Debt Service Funds
Combining Schedule of Revenues, Expenditures and Changes in Fund Balances-Budget to ActualFor the Fiscal Year Ended June 30, 2019
Series 2012 Library Fund Storm Sewer Fund(Page 1 of 4)

158
Original Budget Final Budget Actual Variance
Original Budget Final Budget Actual Variance
Revenues:Taxes 114,717$ 114,717$ 115,032$ (315)$ 374,743$ 374,743$ 375,545$ (802)$ Special assessments - - - - - - - -Other 300 300 1,298 (998) 600 600 3,673 (3,073)Total revenues 115,017 115,017 116,330 (1,313) 375,343 375,343 379,218 (3,875)Expenditures:Current: Operations and maintenance 5,900 5,900 2,796 3,104 6,556 6,556 3,744 2,812Debt service: Principal 110,000 110,000 110,000 - 275,000 275,000 275,000 - Interest and fiscal charges 8,480 8,480 8,475 5 61,350 61,350 61,325 25 Total expenditures 124,380 124,380 121,271 3,109 342,906 342,906 340,069 2,837 Revenues over (under) expenditures (9,363) (9,363) (4,941) (4,422) 32,437 32,437 39,149 (6,712)Other financing sources: Transfers in - - - - - - - - Transfers out - - - - - - - - Total other financing sources - - - - - - - - Net change in fund balances (9,363)$ (9,363)$ (4,941) (4,422)$ 32,437$ 32,437$ 39,149 (6,712)$ Fund balance, beginning of year 130,366 346,932Fund balance, end of year 125,425$ 386,081$
(continued)
Combining Schedule of Revenues, Expenditures and Changes in Fund Balances-Budget to ActualFor the Fiscal Year Ended June 30, 2019
Series 2004A Street Improvements Fund
CITY OF BILLINGS, MONTANANonmajor Debt Service Funds
Series 2010 Parks Fund(Page 2 of 4)

159
Original Budget Final Budget Actual Variance
Original Budget Final Budget Actual Variance
Revenues:Taxes 757,135$ 757,135$ 758,909$ (1,774)$ -$ -$ -$ -$ Special assessments - - - - 1,350,000 1,350,000 953,736 396,264Other 300 300 8,980 (8,680) 2,200 2,200 60,778 (58,578)Total revenues 757,435 757,435 767,889 (10,454) 1,352,200 1,352,200 1,014,514 337,686Expenditures:Current: Operations and maintenance 3,218 4,518 5,298 (780) 9,300 9,300 54,700 (45,400)Debt service: Principal 555,000 555,000 555,000 - 1,340,000 1,340,000 565,327 774,673 Interest and fiscal charges 196,350 196,350 195,500 850 176,700 176,700 147,366 29,334 Total expenditures 754,568 755,868 755,798 70 1,526,000 1,526,000 767,393 758,607 Revenues over (under) expenditures 2,867 1,567 12,091 (10,524) (173,800) (173,800) 247,121 (420,921)Other financing sources: Transfers in - - - - - - 2,044 (2,044) Transfers out - - - - - - - - Total other financing sources - - - - - - 2,044 (2,044) Net change in fund balances 2,867$ 1,567$ 12,091 (10,524)$ (173,800)$ (173,800)$ 249,165 (422,965)$ Fund balance, beginning of year 704,120 2,774,517Fund balance, end of year 716,211$ 3,023,682$
(continued)
(Page 3 of 4)Special Improvement Districts FundSeries 2015 G.O. Refunding Fund
For the Fiscal Year Ended June 30, 2019
CITY OF BILLINGS, MONTANANonmajor Debt Service Funds
Combining Schedule of Revenues, Expenditures and Changes in Fund Balances-Budget to Actual
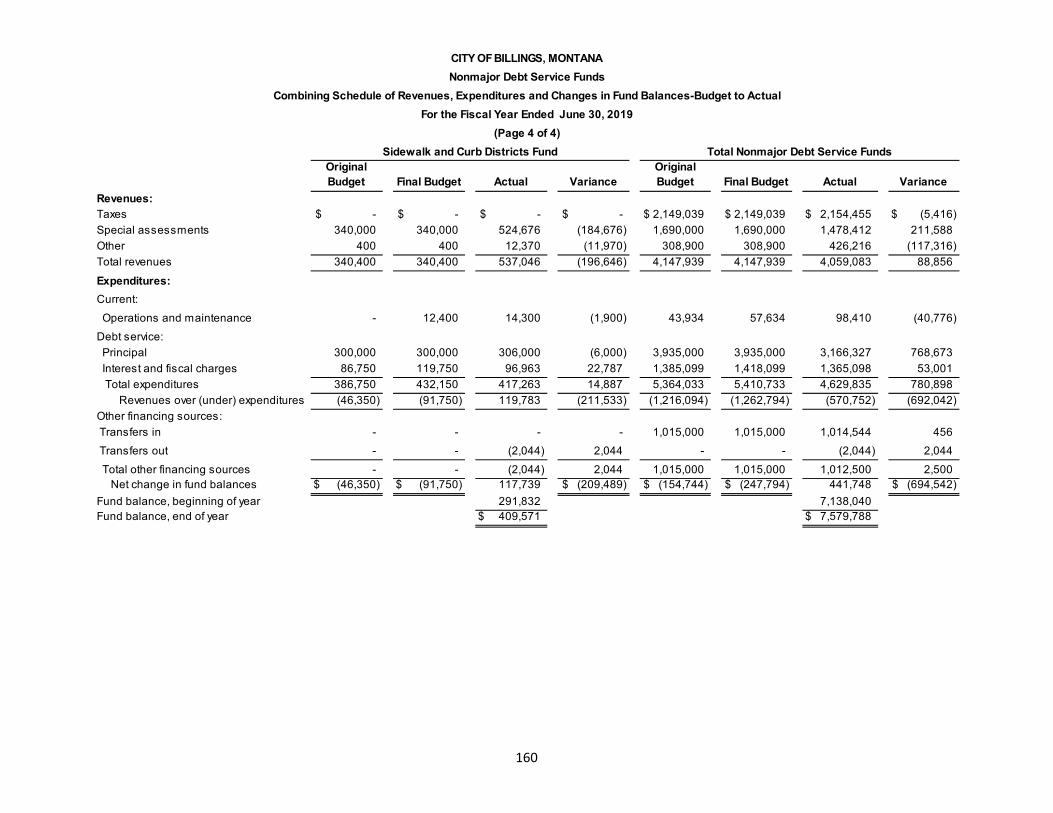
160
Original Budget Final Budget Actual Variance
Original Budget Final Budget Actual Variance
Revenues:Taxes -$ -$ -$ -$ 2,149,039$ 2,149,039$ 2,154,455$ (5,416)$ Special assessments 340,000 340,000 524,676 (184,676) 1,690,000 1,690,000 1,478,412 211,588Other 400 400 12,370 (11,970) 308,900 308,900 426,216 (117,316)Total revenues 340,400 340,400 537,046 (196,646) 4,147,939 4,147,939 4,059,083 88,856Expenditures:Current: Operations and maintenance - 12,400 14,300 (1,900) 43,934 57,634 98,410 (40,776)Debt service: Principal 300,000 300,000 306,000 (6,000) 3,935,000 3,935,000 3,166,327 768,673 Interest and fiscal charges 86,750 119,750 96,963 22,787 1,385,099 1,418,099 1,365,098 53,001 Total expenditures 386,750 432,150 417,263 14,887 5,364,033 5,410,733 4,629,835 780,898 Revenues over (under) expenditures (46,350) (91,750) 119,783 (211,533) (1,216,094) (1,262,794) (570,752) (692,042)Other financing sources: Transfers in - - - - 1,015,000 1,015,000 1,014,544 456 Transfers out - - (2,044) 2,044 - - (2,044) 2,044 Total other financing sources - - (2,044) 2,044 1,015,000 1,015,000 1,012,500 2,500 Net change in fund balances (46,350)$ (91,750)$ 117,739 (209,489)$ (154,744)$ (247,794)$ 441,748 (694,542)$ Fund balance, beginning of year 291,832 7,138,040Fund balance, end of year 409,571$ 7,579,788$
(Page 4 of 4)Sidewalk and Curb Districts Fund Total Nonmajor Debt Service Funds
For the Fiscal Year Ended June 30, 2019
CITY OF BILLINGS, MONTANANonmajor Debt Service Funds
Combining Schedule of Revenues, Expenditures and Changes in Fund Balances-Budget to Actual

NONMAJOR CAPITAL PROJECTS FUNDS The City’s non-major capital projects funds and their purposes are:
The Urban Renewal Property Acquisition Fund is used to account for the local urban renewal projects.
The Sidewalk and Curb Districts Fund accounts for the construction of sidewalks and curbs.
The Special Improvement Districts Fund accounts for the construction of streets, water, and wastewater trunk lines.
The Capital Replacement Fund is used for capital replacement for governmental funds.
The Park Construction Fund is used for the construction of parks.
The Dog Park Construction Fund accounts for the construction of the new dog parks in Billings.
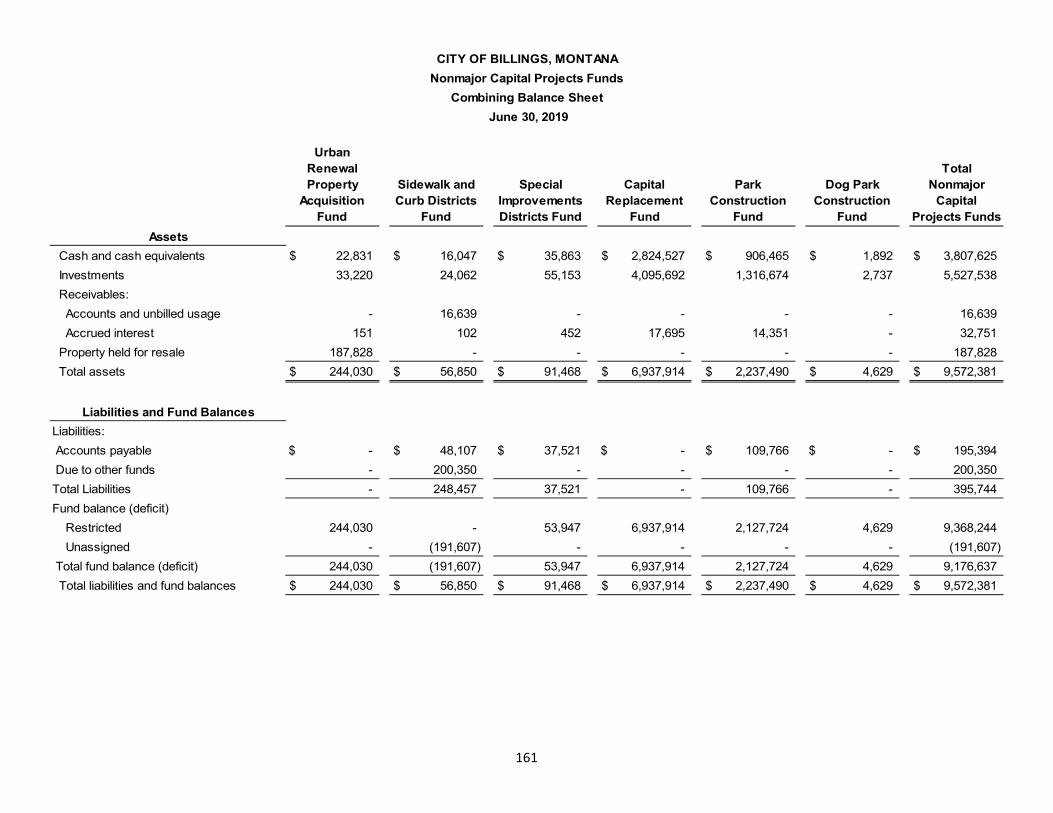
161
Urban Renewal Property
Acquisition Fund
Sidewalk and Curb Districts
Fund
Special Improvements Districts Fund
Capital Replacement
Fund
Park Construction
Fund
Dog Park Construction
Fund
Total Nonmajor
Capital Projects Funds
Assets Cash and cash equivalents 22,831$ 16,047$ 35,863$ 2,824,527$ 906,465$ 1,892$ 3,807,625$ Investments 33,220 24,062 55,153 4,095,692 1,316,674 2,737 5,527,538 Receivables: Accounts and unbilled usage - 16,639 - - - - 16,639 Accrued interest 151 102 452 17,695 14,351 - 32,751 Property held for resale 187,828 - - - - - 187,828 Total assets 244,030$ 56,850$ 91,468$ 6,937,914$ 2,237,490$ 4,629$ 9,572,381$
Liabilities and Fund BalancesLiabilities: Accounts payable -$ 48,107$ 37,521$ -$ 109,766$ -$ 195,394$ Due to other funds - 200,350 - - - - 200,350Total Liabilities - 248,457 37,521 - 109,766 - 395,744Fund balance (deficit) Restricted 244,030 - 53,947 6,937,914 2,127,724 4,629 9,368,244 Unassigned - (191,607) - - - - (191,607) Total fund balance (deficit) 244,030 (191,607) 53,947 6,937,914 2,127,724 4,629 9,176,637 Total liabilities and fund balances 244,030$ 56,850$ 91,468$ 6,937,914$ 2,237,490$ 4,629$ 9,572,381$
CITY OF BILLINGS, MONTANANonmajor Capital Projects Funds
Combining Balance Sheet June 30, 2019
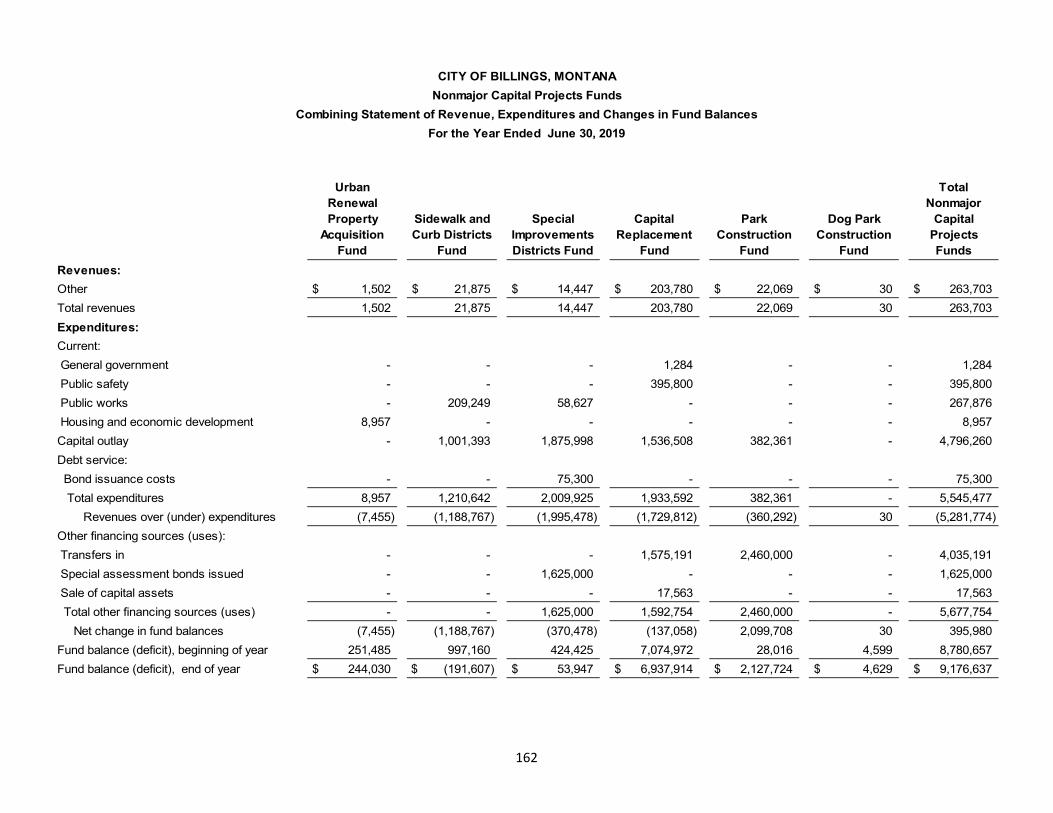
162
Urban Renewal Property
Acquisition Fund
Sidewalk and Curb Districts
Fund
Special Improvements Districts Fund
Capital Replacement
Fund
Park Construction
Fund
Dog Park Construction
Fund
Total Nonmajor
Capital Projects Funds
Revenues:Other 1,502$ 21,875$ 14,447$ 203,780$ 22,069$ 30$ 263,703$ Total revenues 1,502 21,875 14,447 203,780 22,069 30 263,703Expenditures:Current: General government - - - 1,284 - - 1,284 Public safety - - - 395,800 - - 395,800 Public works - 209,249 58,627 - - - 267,876 Housing and economic development 8,957 - - - - - 8,957Capital outlay - 1,001,393 1,875,998 1,536,508 382,361 - 4,796,260Debt service: Bond issuance costs - - 75,300 - - - 75,300 Total expenditures 8,957 1,210,642 2,009,925 1,933,592 382,361 - 5,545,477 Revenues over (under) expenditures (7,455) (1,188,767) (1,995,478) (1,729,812) (360,292) 30 (5,281,774)Other financing sources (uses): Transfers in - - - 1,575,191 2,460,000 - 4,035,191 Special assessment bonds issued - - 1,625,000 - - - 1,625,000 Sale of capital assets - - - 17,563 - - 17,563 Total other financing sources (uses) - - 1,625,000 1,592,754 2,460,000 - 5,677,754 Net change in fund balances (7,455) (1,188,767) (370,478) (137,058) 2,099,708 30 395,980Fund balance (deficit), beginning of year 251,485 997,160 424,425 7,074,972 28,016 4,599 8,780,657Fund balance (deficit), end of year 244,030$ (191,607)$ 53,947$ 6,937,914$ 2,127,724$ 4,629$ 9,176,637$
CITY OF BILLINGS, MONTANANonmajor Capital Projects Funds
Combining Statement of Revenue, Expenditures and Changes in Fund BalancesFor the Year Ended June 30, 2019
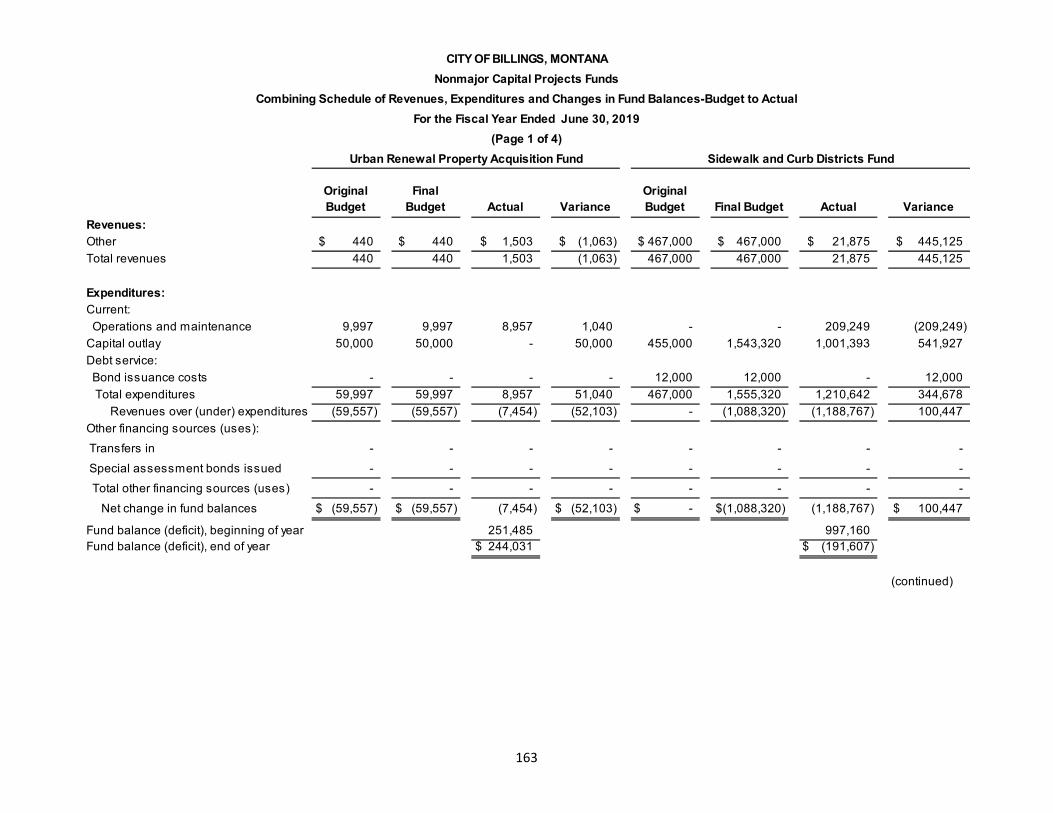
163
Original Budget
Final Budget Actual Variance
Original Budget Final Budget Actual Variance
Revenues:Other 440$ 440$ 1,503$ (1,063)$ 467,000$ 467,000$ 21,875$ 445,125$ Total revenues 440 440 1,503 (1,063) 467,000 467,000 21,875 445,125
Expenditures:Current: Operations and maintenance 9,997 9,997 8,957 1,040 - - 209,249 (209,249)Capital outlay 50,000 50,000 - 50,000 455,000 1,543,320 1,001,393 541,927Debt service: Bond issuance costs - - - - 12,000 12,000 - 12,000 Total expenditures 59,997 59,997 8,957 51,040 467,000 1,555,320 1,210,642 344,678 Revenues over (under) expenditures (59,557) (59,557) (7,454) (52,103) - (1,088,320) (1,188,767) 100,447Other financing sources (uses): Transfers in - - - - - - - - Special assessment bonds issued - - - - - - - - Total other financing sources (uses) - - - - - - - - Net change in fund balances (59,557)$ (59,557)$ (7,454) (52,103)$ -$ (1,088,320)$ (1,188,767) 100,447$
Fund balance (deficit), beginning of year 251,485 997,160Fund balance (deficit), end of year 244,031$ (191,607)$
(continued)
(Page 1 of 4)Urban Renewal Property Acquisition Fund Sidewalk and Curb Districts Fund
CITY OF BILLINGS, MONTANANonmajor Capital Projects Funds
Combining Schedule of Revenues, Expenditures and Changes in Fund Balances-Budget to ActualFor the Fiscal Year Ended June 30, 2019

164
Original Budget Final Budget Actual Variance
Original Budget Final Budget Actual Variance
Revenues:Other 1,137,500$ 1,137,500$ 14,447$ 1,123,053$ 47,080$ 47,080$ 221,342$ (174,262)$ Total revenues 1,137,500 1,137,500 14,447 1,123,053 47,080 47,080 221,342 (174,262)
Expenditures:Current: Operations and maintenance - - 58,627 (58,627) 389,557 389,557 397,084 (7,527)Capital outlay 1,100,000 3,661,399 1,875,998 1,785,401 1,733,201 1,813,099 1,536,508 276,591Debt service: Bond issuance costs 37,500 37,500 75,300 (37,800) - - - - Total expenditures 1,137,500 3,698,899 2,009,925 1,688,974 2,122,758 2,202,656 1,933,592 269,064 Revenues over (under) expenditures - (2,561,399) (1,995,478) (565,921) (2,075,678) (2,155,576) (1,712,250) (443,326)Other financing sources (uses): Transfers in - - - - 1,564,716 1,564,716 1,575,191 (10,475) Special assessment bonds issued - - 1,625,000 (1,625,000) - - - - Total other financing sources (uses) - - 1,625,000 (1,625,000) 1,564,716 1,564,716 1,575,191 (10,475) Net change in fund balances -$ (2,561,399)$ (370,478) (2,190,921)$ (510,962)$ (590,860)$ (137,059) (453,801)$
Fund balance (deficit), beginning of year 424,425 7,074,972Fund balance (deficit), end of year 53,947$ 6,937,913$
(continued)
Special Improvement Districts Fund Capital Replacement Fund(Page 2 of 4)
CITY OF BILLINGS, MONTANANonmajor Capital Projects Funds
Combining Schedule of Revenues, Expenditures and Changes in Fund Balances-Budget to ActualFor the Fiscal Year Ended June 30, 2019

165
Original Budget Final Budget Actual Variance
Original Budget
Final Budget Actual Variance
Revenues:Other -$ -$ 22,069$ (22,069)$ 500$ 500$ 30$ 470$ Total revenues - - 22,069 (22,069) 500 500 30 470
Expenditures:Current: Operations and maintenance - - - - - - - -Capital outlay 2,460,000 2,467,802 382,361 2,085,441 500 500 - 500Debt service: Bond issuance costs - - - - - - - - Total expenditures 2,460,000 2,467,802 382,361 2,085,441 500 500 - 500 Revenues over (under) expenditures (2,460,000) (2,467,802) (360,292) (2,107,510) - - 30 (30)Other financing sources (uses): Transfers in 2,460,000 2,460,000 2,460,000 - - - - - Special assessment bonds issued - - - - - - - - Total other financing sources (uses) 2,460,000 2,460,000 2,460,000 - - - - - Net change in fund balances -$ (7,802)$ 2,099,708 (2,107,510)$ -$ -$ 30 (30)$
Fund balance (deficit), beginning of year 28,016 4,599Fund balance (deficit), end of year 2,127,724$ 4,629$
(continued)
CITY OF BILLINGS, MONTANANonmajor Capital Projects Funds
Combining Schedule of Revenues, Expenditures and Changes in Fund Balances-Budget to ActualFor the Fiscal Year Ended June 30, 2019
(Page 3 of 4)Dog Park Construction FundPark Construction Fund

166
Original Budget Final Budget Actual VarianceRevenues:Other 1,652,520$ 1,652,520$ 281,266$ 1,371,254$ Total revenues 1,652,520 1,652,520 281,266 1,371,254
Expenditures:Current: Operations and maintenance 399,554 399,554 673,917 (274,363)Capital outlay 5,798,701 9,536,120 4,796,260 4,739,860Debt service: Bond issuance costs 49,500 49,500 75,300 (25,800) Total expenditures 6,247,755 9,985,174 5,545,477 4,439,697 Revenues over (under) expenditures (4,595,235) (8,332,654) (5,264,211) (3,068,443)Other financing sources (uses): Transfers in 4,024,716 4,024,716 4,035,191 (10,475) Special assessment bonds issued - - 1,625,000 (1,625,000) Total other financing sources (uses) 4,024,716 4,024,716 5,660,191 (1,635,475) Net change in fund balances (570,519)$ (4,307,938)$ 395,980 (4,703,918)$
Fund balance (deficit), beginning of year 8,780,657Fund balance (deficit), end of year 9,176,637$
CITY OF BILLINGS, MONTANANonmajor Capital Projects Funds
Combining Schedule of Revenues, Expenditures and Changes in Fund Balances-Budget to ActualFor the Fiscal Year Ended June 30, 2019
(Page 4 of 4)Total Nonmajor Capital Project Funds

NONMAJOR PERMANENT FUND The City’s non-major permanent fund is:
The Cemetery Perpetual Care Fund is used to account for principal trust amounts received and related interest income. The interest portion of the trust can be used to maintain the City’s cemeteries.

167
Cemetery Perpetual Care Fund
Assets Cash and cash equivalents 303,297$ Investments 439,036 Accrued interest receivable 1,996 Total assets 744,329$
Fund BalanceLiabilities: Total liabilities -Fund balance:
Unspendable 744,329$ Total fund balance 744,329$
CITY OF BILLINGS, MONTANANonmajor Permanent Fund
Balance Sheet June 30, 2019

168
Original Budget Final Budget Actual Variance
Revenues:Charges for services 12,300$ 12,300$ 19,725$ 7,425$ Other 5,600 5,600 18,075 12,475Total revenues 17,900 17,900 37,800 19,900
Expenditures: Total expenditures 5,600 5,600 - (5,600) Revenues over (under) expenditures 12,300 12,300 37,800 25,500
Other financing sources (uses): Transfers out - - (2,022) (2,022) Total other financing sources (uses) - - (2,022) (2,022)
Net change in fund balances 12,300$ 12,300$ 35,778$ 23,478$
Fund balance, beginning of year 708,551Fund balance, end of year 744,329$
CITY OF BILLINGS, MONTANANonmajor Permanent Fund
Schedule of Revenues, Expenditures and Changes in Fund Balance-Budget to ActualFor the Year Ended June 30, 2019

NONMAJOR ENTERPRISE FUNDS Enterprise funds are used to account for operations that are financed and operated in a manner similar to private business enterprises – where the intent of the government’s council is that the costs of providing goods or services to the general public on a continuing basis be financed or recovered primarily through user charges; or where the government’s council has decided that periodic determination of net income is appropriate for accountability purposes. The City’s nonmajor enterprise funds and their purposes are:
The Transit Fund accounts for the operation of the City’s public transportation system.
The Golf Course Fund accounts for the operation of the Par-3 Golf Course.

169
Transit Fund Golf Course TotalAssets
Current assets: Cash and cash equivalents 900,831$ 195,376$ 1,096,207$ Investments 1,298,557 - 1,298,557 Receivables: Property taxes 85,631 - 85,631 Accounts and unbilled usage 25,736 - 25,736 Accrued interest 5,560 - 5,560 Receivables from other governments 59,560 - 59,560 Inventories 147,289 660 147,949 Prepaid items - 5,886 5,886 Total current assets 2,523,164 201,922 2,725,086Noncurrent assets: Property and equipment: Land 1,435,291 - 1,435,291 Buildings 8,204,968 1,530,865 9,735,833 Improvements other than buildings 1,005,756 - 1,005,756 Equipment and vehicles 9,279,962 - 9,279,962 Construction in progress 210,608 - 210,608 Less: accumulated depreciation (12,987,599) (1,137,439) (14,125,038) Total noncurrent assets 7,148,986 393,426 7,542,412 Total assets 9,672,150 595,348 10,267,498
Deferred Outflows Other post employment benefits 166,384 - 166,384 Pensions 697,181 - 697,181Total assets and deferred outflows 10,535,715$ 595,348$ 11,131,063$
(Page 1 of 2)
CITY OF BILLINGS, MONTANANonmajor Enterprise Funds
Combining Statement of Net Position June 30, 2019

170
Transit Fund Golf Course TotalLiabilities
Current liabilities: Accounts payable 110,463$ 8,191$ 118,654$ Accrued wages and benefits 164,870 42,906 207,776 Compensated absences 410,448 - 410,448 Total current liabilities 685,781 51,097 736,878Noncurrent liabilities: Compensated absences 110,871 - 110,871 Other post employment benefits 556,360 - 556,360 Net pension liability 3,026,730 - 3,026,730 Total noncurrent liabilities 3,693,961 - 3,693,961 Total liabilities 4,379,742 51,097 4,430,839
Deferred Inflows Other post employment benefits 195,992 - 195,992 Pensions 443,386 - 443,386 Total deferred inflows of resources 639,378 - 639,378
Net PositionNet investment in capital assets 7,148,986 393,426 7,542,412Restricted for:Unrestricted (1,632,391) 150,825 (1,481,566)Total net position 5,516,595 544,251 6,060,846Total liabilities, deferred inflows, and net position 10,535,715$ 595,348$ 11,131,063$
CITY OF BILLINGS, MONTANANonmajor Enterprise Funds
Combining Statement of Net Position June 30, 2019(Page 2 of 2)

171
Transit Fund
Golf Course Fund
Total Nonmajor Enterprise
FundOperating revenues: Charges for services and use of facilities 734,742$ 449,932$ 1,184,674$
Operating expenses: Salaries and benefits 4,170,530 229,879 4,400,409 Supplies 807,722 54,858 862,580 Contracted services 344,719 11,074 355,793 Utilities 97,439 25,441 122,880 Other 115,415 75,963 191,378 Depreciation 610,203 68,853 679,056 Total operating expenses 6,146,028 466,068 6,612,096 Operating income (loss) (5,411,286) (16,136) (5,427,422)Nonoperating revenues (expenses): Taxes 2,264,225 - 2,264,225 Intergovernmental 1,001,016 - 1,001,016 Interest and investment income 60,420 - 60,420 Gain (loss) on sale of capital assets 15,061 - 15,061 Other 41,228 1,500 42,728 Total nonoperating revenue (expense) 3,381,950 1,500 3,383,450 Income (loss) before capital contributions and transfers (2,029,336) (14,636) (2,043,972) Transfers out - (20,000) (20,000) Change in net position (2,029,336) (34,636) (2,063,972)Net position, beginning of year 7,545,931 578,887 8,124,818Net position, end of year 5,516,595$ 544,251$ 6,060,846$
CITY OF BILLINGS, MONTANANonmajor Enterprise Funds
Combining Statement of Revenues, Expenses and Changes in Net PositionFor the Year Ended June 30, 2019

172
TotalGolf Nonmajor
Transit Course Enterprise Fund Fund Funds
Cash flows from operating activities:Cash received from customers and users 747,096$ 449,776$ 1,196,872$ Cash received from other sources - 1,500 1,500 Cash paid to employees for services (4,809,749) (229,879) (5,039,628) Cash paid to suppliers and contracted services (697,750) (181,985) (879,735)
Net cash provided (used) by operating activities (4,760,403) 39,412 (4,720,991) Cash flows from noncapital financing activities:
Cash received from tax revenues 2,311,052 - 2,311,052 Cash received from intergovernmental revenues 2,795,919 - 2,795,919 Transfers to other funds - (20,000) (20,000)
Net cash provided (used) by noncapital financing activities 5,106,971 (20,000) 5,086,971 Cash flows from capital and related financing activities:
Acquisition and construction of capital assets (298,388) (34,735) (333,123) Proceeds from sales of capital assets 15,061 - 15,061
Net cash provided (used) by capital and related financing activities (283,327) (34,735) (318,062) Cash flows from investing activities:
Cash received from interest 46,444 - 46,444 Sale of investments 1,217,365 30,107 1,247,472 Purchase of investments (1,065,465) (1,065,465)
Net cash provided (used) by investing activities 198,344 30,107 228,451 Net increase (decrease) in cash and cash equivalents 261,585 14,784 276,369
Cash and cash equivalents, beginning of year 639,246 180,592 819,838 Cash and cash equivalents, end of year 900,831$ 195,376$ 1,096,207$
Cash and cash equivalents consists of:Cash and cash equivalents 900,831$ 195,376$ 1,096,207$
Cash and cash equivalents, end of year 900,831$ 195,376$ 1,096,207$
(continued)
CITY OF BILLINGS, MONTANANonmajor Enterprise Funds
Combining Statement of Cash FlowsFor The Fiscal Year Ended June 30, 2019
(Page 1 of 2)

173
TotalGolf Nonmajor
Transit Course Enterprise Fund Fund Funds
Reconciliation of operating income to net cash provided (used) by operating activities:
Operating income (loss) (5,411,286)$ (16,136)$ (5,427,422)$ Other nonoperating income (expense) 56,289 1,500 57,789 Adjustments to reconcile operating income (loss) to
net cash provided (used) by operating activities:Depreciation expense 610,203 68,853 679,056 (Increase) decrease in receivables (5,140) - (5,140) (Increase) decrease in inventories 17,494 - 17,494 (Increase) decrease in prepaid items - (156) (156) Increase (decrease) in accounts payable 46,323 67 46,390 Increase (decrease) in accrued liabilities (74,286) (14,716) (89,002)
Net cash provided (used) by operating activities (4,760,403)$ 39,412$ (4,720,991)$
Noncash investing, capital and financing activities:Increase (decrease) in investment market value 13,976 - 13,976
Nonmajor Enterprise FundsCombining Statement of Cash Flows
For The Fiscal Year Ended June 30, 2019(Page 2 of 2)
CITY OF BILLINGS, MONTANA

INTERNAL SERVICE FUNDS
The City’s internal service funds and their purposes are:
The Fleet Services Fund accounts for the maintenance and repair of vehicles used in the operation of City services.
The Central Services Fund accounts for postage and copying services used in the operation of the City services.
The Information Technology Fund accounts for technology services used in the operation of the City services.
The City Health Insurance Fund accounts for the accumulation and allocation of costs associated with health benefits of City employees, enrolled dependents, and retired employees under 66 years of age.
The Central Telephone Services Fund accounts for the maintenance and operation of the City-wide telephone
system.
The Property Insurance Fund accounts for property and liability insurance costs.
The Radio Communications Fund accounts for the maintenance and operation of the City-wide 800 MHz radio system.
The Facilities Management Fund accounts for amounts received for paying facility management costs.
The Public Works Administration Fund provides administration services to the Public Works operational divisions.
The Public Works Engineering Fund provides engineering services to the Public Works projects.

174
Fleet Services
Fund
Central Service
Fund
Information Techology
Fund
City Health Insurance
Fund
Central Telephone Services
Fund
Property Insurance
FundAssets
Current assets: Cash and cash equivalents 564,945$ 86,281$ 397,346$ 3,870,569$ 268,210$ 812,004$ Investments 817,974 125,184 580,446 5,617,605 389,076 1,181,235 Receivables: Accounts and unbilled usage - - - - - - Accrued interest 3,606 558 2,595 25,455 1,745 5,497 Notes 120,000 - - - - - Inventories 230,966 - - - - - Prepaid items - - - - - - Total current assets 1,737,491 212,023 980,387 9,513,629 659,031 1,998,736Noncurrent assets: Notes receivable 280,000 - - - - - Property and equipment: Land - - - - - - Buildings 32,091 - - - - - Improvements other than buildings - - 87,575 - - - Equipment and vehicles 880,165 237,336 2,209,210 - 879,174 - Construction in progress - - - - - - Less: accumulated depreciation (866,805) (225,070) (1,786,385) - (749,898) - Total noncurrent assets 325,451 12,266 510,400 - 129,276 - Total assets 2,062,942 224,289 1,490,787 9,513,629 788,307 1,998,736
Deferred OutflowsOther post employment benefits 54,285 - 52,579 - 3,276 2,920Pensions 255,235 - 386,939 - 25,930 22,138
Total assets and deferred outflows 2,372,462$ 224,289$ 1,930,305$ 9,513,629$ 817,513$ 2,023,794$
(continued)
CITY OF BILLINGS, MONTANAInternal Service Funds
Combining Statement of Net Position June 30, 2019(Page 1 of 4)
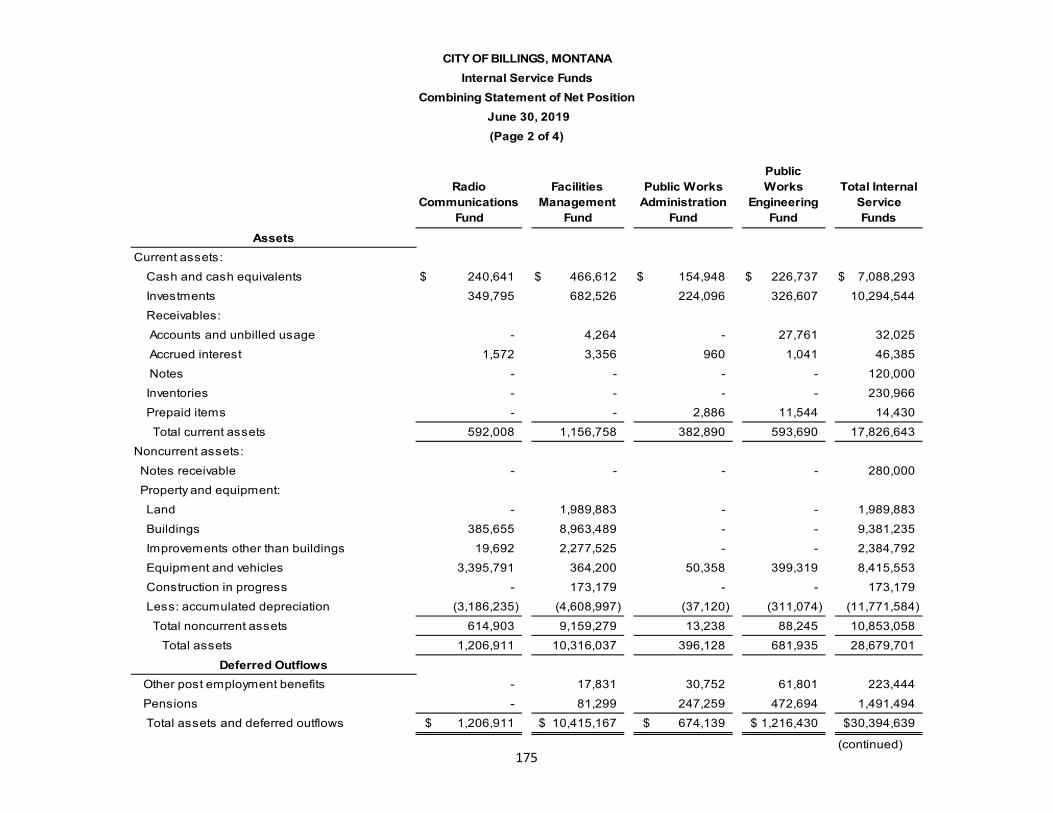
175
Radio Communications
Fund
Facilities Management
Fund
Public Works Administration
Fund
Public Works
Engineering Fund
Total Internal Service Funds
AssetsCurrent assets: Cash and cash equivalents 240,641$ 466,612$ 154,948$ 226,737$ 7,088,293$ Investments 349,795 682,526 224,096 326,607 10,294,544 Receivables: Accounts and unbilled usage - 4,264 - 27,761 32,025 Accrued interest 1,572 3,356 960 1,041 46,385 Notes - - - - 120,000 Inventories - - - - 230,966 Prepaid items - - 2,886 11,544 14,430 Total current assets 592,008 1,156,758 382,890 593,690 17,826,643Noncurrent assets: Notes receivable - - - - 280,000 Property and equipment: Land - 1,989,883 - - 1,989,883 Buildings 385,655 8,963,489 - - 9,381,235 Improvements other than buildings 19,692 2,277,525 - - 2,384,792 Equipment and vehicles 3,395,791 364,200 50,358 399,319 8,415,553 Construction in progress - 173,179 - - 173,179 Less: accumulated depreciation (3,186,235) (4,608,997) (37,120) (311,074) (11,771,584) Total noncurrent assets 614,903 9,159,279 13,238 88,245 10,853,058 Total assets 1,206,911 10,316,037 396,128 681,935 28,679,701
Deferred OutflowsOther post employment benefits - 17,831 30,752 61,801 223,444Pensions - 81,299 247,259 472,694 1,491,494
Total assets and deferred outflows 1,206,911$ 10,415,167$ 674,139$ 1,216,430$ 30,394,639$
(continued)
CITY OF BILLINGS, MONTANAInternal Service Funds
Combining Statement of Net Position June 30, 2019(Page 2 of 4)

176
Fleet Services
Fund
Central Service
Fund
Information Techology
Fund
City Health Insurance
Fund
Central Telephone Services
Fund
Property Insurance
FundLiabilities
Current liabilities: Accounts payable 110,385$ 11,952$ 54,646$ 161,112$ 894$ 30,352$ Accrued wages and benefits 53,356 - 68,140 1,527 4,608 3,909 Compensated absences 253,818 - 270,457 - 7,064 24,677 Accrued interest payable - - - - - - Incurred but not reported health benefits - - - 767,796 - - Notes payable - - - - - - Unearned Revenue - - - 4,145 - - Total current liabilities 417,559 11,952 393,243 934,580 12,566 58,938Noncurrent liabilities: Compensated absences 68,562 - 73,056 - 1,908 6,666 Other post employment benefits 171,266 - 170,736 - 10,993 9,960 Net pension liability 1,108,071 - 1,679,850 - 112,574 96,107 Notes payable - - - - - - Total noncurrent liabilities 1,347,899 - 1,923,642 - 125,475 112,733 Total liabilities 1,765,458 11,952 2,316,885 934,580 138,041 171,671
Deferred InflowsOther post employment benefits 62,186 - 69,036 - 4,212 3,569Pensions 162,321 - 246,081 - 16,491 14,079
Total deferred inflows of resources 224,507 - 315,117 - 20,703 17,648Net Position
Net investment in capital assets 45,451 12,266 510,400 - 129,276 -Unrestricted 337,046 200,071 (1,212,097) 8,579,049 529,493 1,834,475Total net position 382,497 212,337 (701,697) 8,579,049 658,769 1,834,475Total liabilities, deferred inflows, and net position 2,372,462$ 224,289$ 1,930,305$ 9,513,629$ 817,513$ 2,023,794$
(continued)
(Page 3 of 4)
Internal Service FundsCombining Statement of Net Position
June 30, 2019
CITY OF BILLINGS, MONTANA

177
Radio Communications
Fund
Facilities Management
Fund
Public Works Administration
Fund
Public Works
Engineering Fund
Total Internal Service Funds
LiabilitiesCurrent liabilities: Accounts payable 1,395$ 134,693$ 24,433$ 28,870$ 558,732$ Accrued wages and benefits - 16,154 39,618 83,801 271,113 Compensated absences - 51,312 196,679 326,359 1,130,366 Accrued interest payable - 19,800 - - 19,800 Incurred but not reported health benefits - - - - 767,796 Notes payable - 425,000 - - 425,000 Unearned Revenue - - - 1,442 5,587 Total current liabilities 1,395 646,959 260,730 440,472 3,178,394Noncurrent liabilities: Compensated absences - 13,861 53,127 88,157 305,337 Other post employment benefits - 56,183 70,574 194,994 684,706 Net pension liability - 352,950 1,073,445 2,052,145 6,475,142 Notes payable - 1,658,908 - - 1,658,908 Total noncurrent liabilities - 2,081,902 1,197,146 2,335,296 9,124,093 Total liabilities 1,395 2,728,861 1,457,876 2,775,768 12,302,487
Deferred InflowsOther post employment benefits - 21,499 43,058 76,413 279,973Pensions - 51,704 157,249 300,619 948,544
Total deferred inflows of resources - 73,203 200,307 377,032 1,228,517Net Position
Net investment in capital assets 614,903 7,075,371 13,238 88,245 8,489,150Unrestricted 590,613 537,732 (997,282) (2,024,615) 8,374,485Total net position 1,205,516 7,613,103 (984,044) (1,936,370) 16,863,635Total liabilities, deferred inflows, and net position 1,206,911$ 10,415,167$ 674,139$ 1,216,430$ 30,394,639$
(Page 4 of 4)
Internal Service FundsCombining Statement of Net Position
June 30, 2019
CITY OF BILLINGS, MONTANA

178
Fleet Services
Fund
Central Service
Fund
Information Technology
Fund
City Health Insurance
Fund
Central Telephone Services
Fund
Property Insurance
FundOperating revenues: Charges for services and use of facilities 1,792,938$ 114,115$ 2,301,491$ 13,049,339$ 417,858$ 1,504,677$
Operating expenses: Salaries and benefits 1,488,352 - 1,983,615 38,700 134,765 109,766 Supplies 44,227 8,742 72,401 - 4,311 15 Contracted services 139,912 82,611 217,436 10,759,897 36,857 44,110 Utilities 7,560 - 47,348 - 167,755 - Other 65,040 - 93,439 69,618 487 1,975,898 Depreciation 23,416 2,534 171,198 - 27,879 - Total operating expenses 1,768,507 93,887 2,585,437 10,868,215 372,054 2,129,789
Operating income (loss) 24,431 20,228 (283,946) 2,181,124 45,804 (625,112)
Nonoperating revenues (expenses): Taxes - - - - - - Interest expense - - - - - - Interest and investment income 30,574 4,900 23,937 207,509 14,978 44,215 Gain (loss) on sale of capital assets - - 1,630 - - - Other 44,030 - 37,545 807 2,515 6,963 Total nonoperating revenue (expense) 74,604 4,900 63,112 208,316 17,493 51,178 Income (loss) before capital contributions and transfers 99,035 25,128 (220,834) 2,389,440 63,297 (573,934) Transfers in - - - - - - Transfers out (99,770) - (3,975) - - - Change in net position (735) 25,128 (224,809) 2,389,440 63,297 (573,934)Net position, beginning of year 383,232 187,209 (476,888) 6,189,609 595,472 2,408,409Net position, end of year 382,497$ 212,337$ (701,697)$ 8,579,049$ 658,769$ 1,834,475$
(continued)
For the Year Ended June 30, 2019(Page 1 of 2)
CITY OF BILLINGS, MONTANAInternal Service Funds
Combining Statement of Revenues, Expenses and Changes in Net Position

179
Radio Communications
Fund
Facilities Management
Fund
Public Works Administration
Fund
Public Works Engineering
Fund
Total Internal Service Funds
Operating revenues: Charges for services and use of facilities 288,006$ 1,276,945$ 1,457,639$ 2,976,728$ 25,179,736$
Operating expenses: Salaries and benefits - 464,757 1,384,290 2,442,641 8,046,886 Supplies 51 137,890 28,811 36,198 332,646 Contracted services 217,939 308,451 178,192 368,752 12,354,157 Utilities 15,262 277,652 13,877 40,942 570,396 Other - 16,231 40,053 180,997 2,441,763 Depreciation 260,654 325,031 5,734 38,384 854,830 Total operating expenses 493,906 1,530,012 1,650,957 3,107,914 24,600,678
Operating income (loss) (205,900) (253,067) (193,318) (131,186) 579,058
Nonoperating revenues (expenses): Taxes - - - 25,127 25,127 Interest expense - (42,319) - - (42,319) Interest and investment income 13,804 34,428 8,144 7,953 390,442 Gain (loss) on sale of capital assets - 1,411 - - 3,041 Other 76 37,233 23,992 45,867 199,028 Total nonoperating revenue (expense) 13,880 30,753 32,136 78,947 575,319 Income (loss) before capital contributions and transfers (192,020) (222,314) (161,182) (52,239) 1,154,377 Transfers in - 491,320 - - 491,320 Transfers out - (3,000) - - (106,745) Change in net position (192,020) 266,006 (161,182) (52,239) 1,538,952Net position, beginning of year 1,397,536 7,347,097 (822,862) (1,884,131) 15,324,683Net position, end of year 1,205,516$ 7,613,103$ (984,044)$ (1,936,370)$ 16,863,635$
For the Year Ended June 30, 2019(Page 2 of 2)
CITY OF BILLINGS, MONTANAInternal Service Funds
Combining Statement of Revenues, Expenses and Changes in Net Position

180
CentralFleet Central Information City Health Telephone Property
Services Service Technology Insurance Services Insurance Fund Fund Fund Fund Fund FundCash flows from operating activities:
Cash received from customers and users -$ -$ -$ -$ -$ -$ Cash received from interfund services provided 1,811,167 114,115 2,334,562 13,050,313 417,857 1,504,677 Cash received from other sources 44,030 - 39,175 807 6,963 Cash paid to employees for services (1,390,333) - (2,031,089) - (122,834) (107,116) Cash paid to suppliers and contracted services (233,138) (87,007) (386,920) (10,959,477) (215,311) (2,044,899)
Net cash provided (used) by operating activities 231,726 27,108 (44,272) 2,091,643 79,712 (640,375) Cash flows from noncapital financing activities:
Transfers from other funds - - - - - - Transfers to other funds (95,770) - - - - -
Net cash provided (used) by noncapital financing activities (95,770) - - - - -
Cash flows from capital and related financing activities:Acquisition and construction of capital assets (5,209) - (117,557) - (31,350) - Proceeds from sales of capital assets 70,000 - 1,630 - - - Cash paid for interest - - - - - - Principal paid on notes payable and capital lease payable - - - - - - Transfers to other funds (4,000) - (3,975) - - - Transfers from other funds - - - - - -
Net cash provided (used) by capital and related financing activities 60,791 - (119,902) - (31,350) -
Cash flows from investing activities:Cash received from interest 22,852 3,580 17,836 147,384 11,071 36,234 Sale of investments 857,047 119,083 657,621 4,775,925 393,297 1,703,970 Purchase of investments (966,154) (126,035) (463,830) (5,649,758) (391,472) (1,185,919)
Net cash provided (used) by investing activities (86,255) (3,372) 211,627 (726,449) 12,896 554,285 Net increase (decrease) in cash and cash equivalents 110,492 23,736 47,453 1,365,194 61,258 (86,090)
Cash and cash equivalents, beginning of year 454,453 62,545 349,893 2,505,375 206,952 898,094 Cash and cash equivalents, end of year 564,945$ 86,281$ 397,346$ 3,870,569$ 268,210$ 812,004$
(continued)
CITY OF BILLINGS, MONTANAInternal Service Funds
Combining Statement of Cash FlowsFor The Fiscal Year Ended June 30, 2019
(Page 1 of 4)

181
TotalRadio Facilities Public Works Public Works Internal
Communica- Manage- Administration Engineering Servicetions Fund ment Fund Fund Fund Funds
Cash flows from operating activities:Cash received from customers and users -$ 582,173$ -$ 135,725$ 717,898$ Cash received from interfund services provided 288,006 677,583 1,457,639 2,872,304 24,528,223 Cash received from other sources 76 40,055 - 45,867 176,973 Cash paid to employees for services - (465,118) (1,441,118) (2,358,971) (7,916,579) Cash paid to suppliers and contracted services (232,318) (649,228) (219,160) (621,674) (15,649,132)
Net cash provided (used) by operating activities 55,764 185,465 (202,639) 73,251 1,857,383 Cash flows from noncapital financing activities:
Transfers from other funds - - - - - Transfers to other funds - - - - (95,770)
Net cash provided (used) by noncapital financing activities - - - - (95,770)
Cash flows from capital and related financing activities:Acquisition and construction of capital assets - (358,532) - - (512,648) Proceeds from sales of capital assets - 1,411 - - 73,041 Cash paid for interest - (67,201) - - (67,201) Principal paid on notes payable and capital lease payable - (409,999) - - (409,999) Transfers to other funds - (3,000) - - (10,975) Transfers from other funds - 491,320 - - 491,320
Net cash provided (used) by capital and related financing activities - (346,001) - - (436,462)
Cash flows from investing activities:Cash received from interest 10,134 24,805 5,901 5,189 284,986 Sale of investments 345,877 896,015 445,270 332,414 10,526,519 Purchase of investments (352,870) (659,198) (226,339) (331,203) (10,352,778)
Net cash provided by investing activities 3,141 261,622 224,832 6,400 458,727 Net increase (decrease) in cash and cash equivalents 58,905 101,086 22,193 79,651 1,783,878
Cash and cash equivalents, beginning of year 181,736 365,526 132,755 147,086 5,304,415 Cash and cash equivalents, end of year 240,641$ 466,612$ 154,948$ 226,737$ 7,088,293$
(continued)
CITY OF BILLINGS, MONTANAInternal Service Funds
Combining Statement of Cash FlowsFor The Fiscal Year Ended June 30, 2019
(Page 2 of 4)

182
CentralFleet Central Information City Health Telephone Property
Services Service Technology Insurance Services Insurance Fund Fund Fund Fund Fund FundReconciliation of operating income to net cash provided (used) by operating activities:
Operating income (loss) 24,431$ 20,228$ (283,946)$ 2,181,124$ 45,804$ (625,112)$ Other nonoperating income (expense) 44,030 - 39,175 807 2,515 6,963 Adjustments to reconcile operating income (loss) to net
cash provided (used) by operating activities: Depreciation expense 23,416 2,534 171,198 - 27,879 - (Increase) decrease in receivables - - - 974 - - (Increase) decrease in inventories 3,637 - - - - - (Increase) decrease in prepaid items and deposits - - - - - - Increase (decrease) in accounts payable 19,964 4,346 43,704 47,211 (5,901) (24,876) Increase (decrease) in accrued liabilities 116,248 - (14,403) (138,473) 9,415 2,650
Net cash provided (used) by operating activities 231,726$ 27,108$ (44,272)$ 2,091,643$ 79,712$ (640,375)$ Noncash investing, capital and financing activities:
Increase (decrease) in investment market value 7,272 1,168 5,770 49,796 3,532 10,484 (continued)
CITY OF BILLINGS, MONTANAInternal Service Funds
Combining Statement of Cash FlowsFor The Fiscal Year Ended June 30, 2019
(Page 3 of 4)
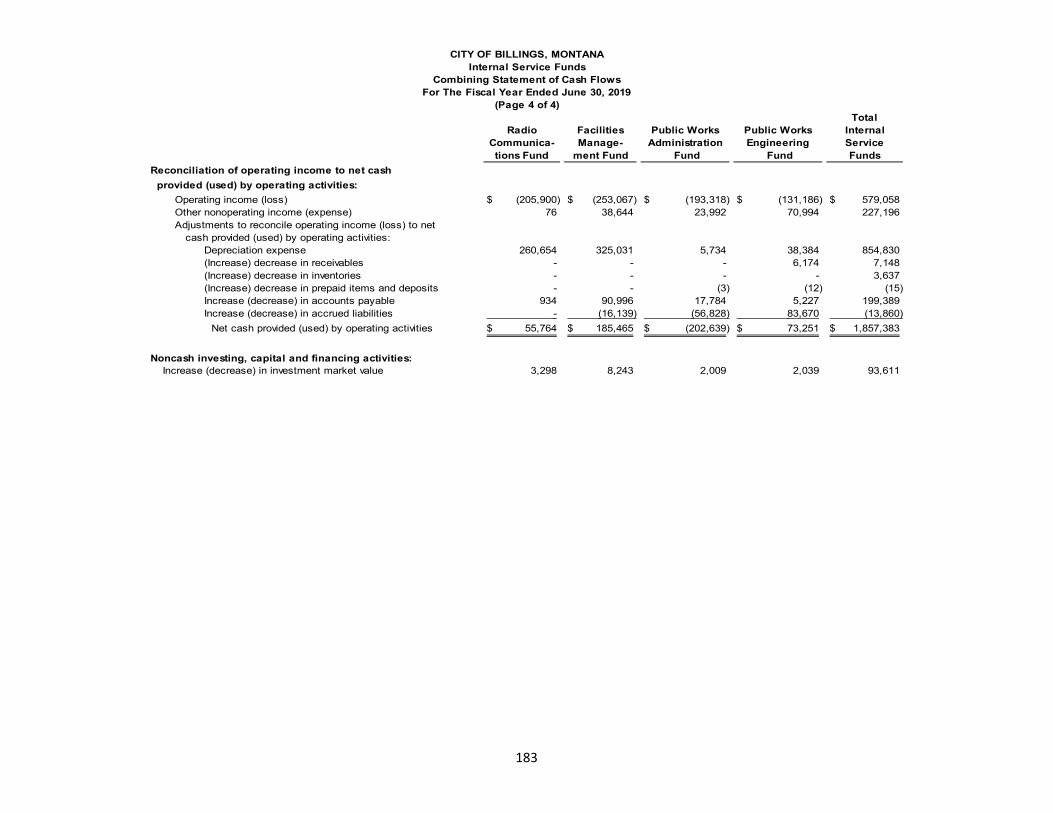
183
TotalRadio Facilities Public Works Public Works Internal
Communica- Manage- Administration Engineering Servicetions Fund ment Fund Fund Fund Funds
Reconciliation of operating income to net cash provided (used) by operating activities:
Operating income (loss) (205,900)$ (253,067)$ (193,318)$ (131,186)$ 579,058$ Other nonoperating income (expense) 76 38,644 23,992 70,994 227,196 Adjustments to reconcile operating income (loss) to net
cash provided (used) by operating activities: Depreciation expense 260,654 325,031 5,734 38,384 854,830 (Increase) decrease in receivables - - - 6,174 7,148 (Increase) decrease in inventories - - - - 3,637 (Increase) decrease in prepaid items and deposits - - (3) (12) (15) Increase (decrease) in accounts payable 934 90,996 17,784 5,227 199,389 Increase (decrease) in accrued liabilities - (16,139) (56,828) 83,670 (13,860)
Net cash provided (used) by operating activities 55,764$ 185,465$ (202,639)$ 73,251$ 1,857,383$ Noncash investing, capital and financing activities:
Increase (decrease) in investment market value 3,298 8,243 2,009 2,039 93,611
CITY OF BILLINGS, MONTANAInternal Service Funds
Combining Statement of Cash FlowsFor The Fiscal Year Ended June 30, 2019
(Page 4 of 4)
AGENCY FUNDS
The City’s agency funds and their purposes are:
The Downtown Business Improvement District Fund accounts for amounts the City receives from Yellowstone County for Billings Business Improvement District (BID) assessments and remits the same to the BID as required by State Statutes.
The Tourism Business Improvement District Fund accounts for amounts the City receives from Yellowstone County
for Billings Tourism Business Improvement District (TBID) assessments and remits the same to the TBID as required by State Statutes.
The License Plate Fund accounts for amounts the City receives from Yellowstone County for license plate
assessments and remits the same to the License Plate Fund as required by State Statutes.
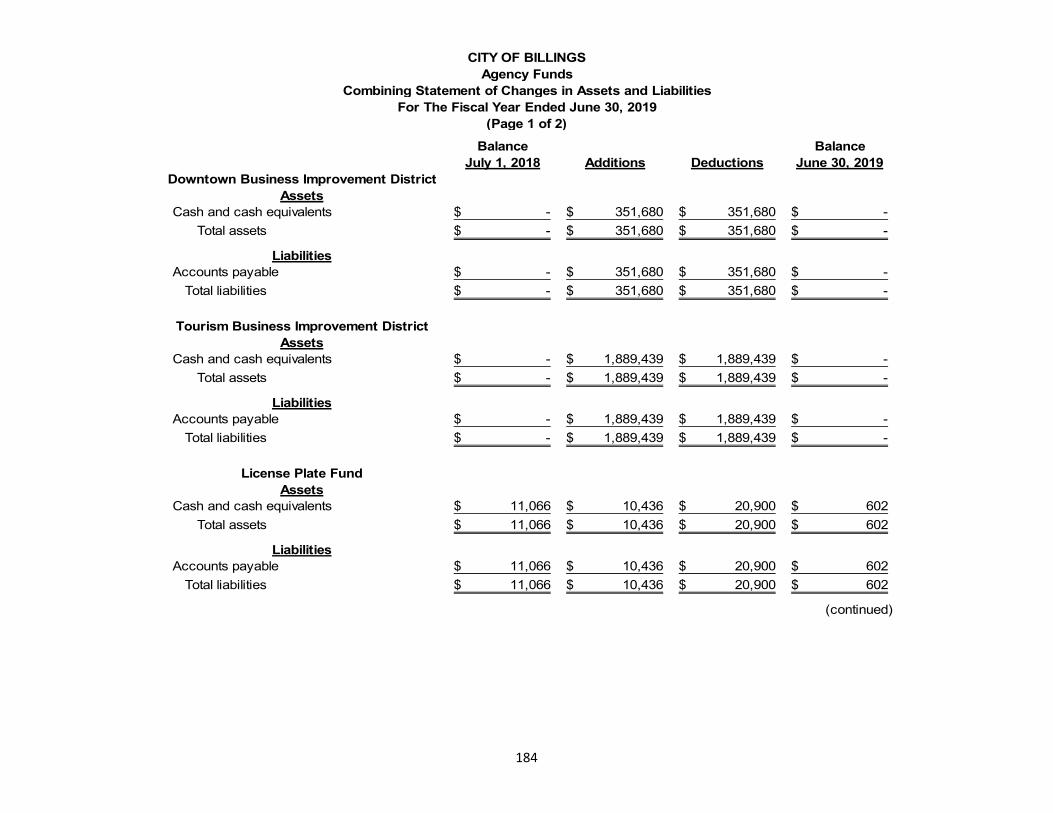
184
Balance BalanceJuly 1, 2018 Additions Deductions June 30, 2019
Downtown Business Improvement DistrictAssets
Cash and cash equivalents -$ 351,680$ 351,680$ -$ Total assets -$ 351,680$ 351,680$ -$
LiabilitiesAccounts payable -$ 351,680$ 351,680$ -$
Total liabilities -$ 351,680$ 351,680$ -$
Tourism Business Improvement DistrictAssets
Cash and cash equivalents -$ 1,889,439$ 1,889,439$ -$ Total assets -$ 1,889,439$ 1,889,439$ -$
LiabilitiesAccounts payable -$ 1,889,439$ 1,889,439$ -$
Total liabilities -$ 1,889,439$ 1,889,439$ -$
License Plate FundAssets
Cash and cash equivalents 11,066$ 10,436$ 20,900$ 602$ Total assets 11,066$ 10,436$ 20,900$ 602$
LiabilitiesAccounts payable 11,066$ 10,436$ 20,900$ 602$
Total liabilities 11,066$ 10,436$ 20,900$ 602$
(continued)
CITY OF BILLINGSAgency Funds
Combining Statement of Changes in Assets and LiabilitiesFor The Fiscal Year Ended June 30, 2019
(Page 1 of 2)

185
Balance BalanceJuly 1, 2018 Additions Deductions June 30, 2019
Totals - All Agency FundsAssets
Cash and cash equivalents 11,066$ 2,251,555$ 2,262,019$ 602$ Total assets 11,066$ 2,251,555$ 2,262,019$ 602$
LiabilitiesAccounts payable 11,066$ 2,251,555$ 2,262,019$ 602$
Total liabilities 11,066$ 2,251,555$ 2,262,019$ 602$
(Page 2 of 2)
CITY OF BILLINGSAgency Funds
Combining Statement of Changes in Assets and LiabilitiesFor The Fiscal Year Ended June 30, 2019

STATISTICAL SECTION (UNAUDITED)
This part of the City of Billings’ comprehensive annual financial report presents detailed information as a context for understanding what the information in the financial statements, not disclosures, and required supplementary information says about the City’s overall financial health. Contents Pages Financial Trends 186-194
These schedules contain trend information to help the reader understand how the City’s financial performance and well-being have changed over time.
Revenue Capacity 195-198
These schedules contain information to help the reader assess the City’s most significant local revenue source, the property tax.
Debt Capacity 199-208
These schedules present information to help the reader assess the affordability of the City’s current levels of outstanding debt and the City’s ability to issue additional debt in the future.
Demographic and Economic Information 209-210
These schedules offer demographic and economic indicators to help the reader understand the environment within the City of Billings.
Operating Information 211-215
These schedules contain service and infrastructure data to help the reader understand how the information in the City’s financial report relates to the services the City provides and the activities it performs.

186
2010 2011 2012 2013 2014 2015 2016 2017 2018 2019Governmental activities
Net invested in capital assets 137,282$ 156,927$ 185,242$ 197,845$ 196,250$ 173,274$ 201,511$ 208,499$ 213,236$ 219,975$ Restricted 58,567 56,725 58,125 67,391 71,418 61,917 62,749 53,672 64,435 57,055 Unrestricted 17,550 20,350 23,962 21,213 24,885 25,416 5,297 11,293 1,067 2,785
Total governmental activities net position 213,399$ 234,002$ 267,329$ 286,449$ 292,553$ 260,607$ 269,557$ 273,464$ 278,738$ 279,815$
Business-type activitiesNet invested in capital assets 271,666$ 285,474$ 286,328$ 304,407$ 321,736$ 337,910$ 353,451$ 309,890$ 325,091$ 372,952$ Restricted 5,175 5,977 5,657 6,142 9,667 7,412 4,930 55,101 28,198 26,771 Unrestricted 45,927 48,090 57,552 60,613 70,894 60,588 73,261 87,687 117,362 90,415
Total business-type activities net position 322,768$ 339,541$ 349,537$ 371,162$ 402,297$ 405,910$ 431,642$ 452,678$ 470,651$ 490,138$
Primary governmentNet invested in capital assets 408,948$ 442,401$ 471,570$ 502,252$ 517,986$ 511,184$ 554,962$ 518,389$ 538,327$ 592,927$ Restricted 63,742 62,702 63,782 73,533 81,085 69,329 67,679 108,773 92,633 83,826 Unrestricted 63,477 68,440 81,514 81,826 95,779 86,004 78,558 98,980 118,429 93,200
Total primary government net position 536,167$ 573,543$ 616,866$ 657,611$ 694,850$ 666,517$ 701,199$ 726,142$ 749,389$ 769,953$
Source: City of Billings, Montana
Fiscal Year
CITY OF BILLINGS, MONTANANet Position by Component
Last Ten Fiscal Years(accrual basis of accounting)
(amounts expressed in thousands)(Unaudited)
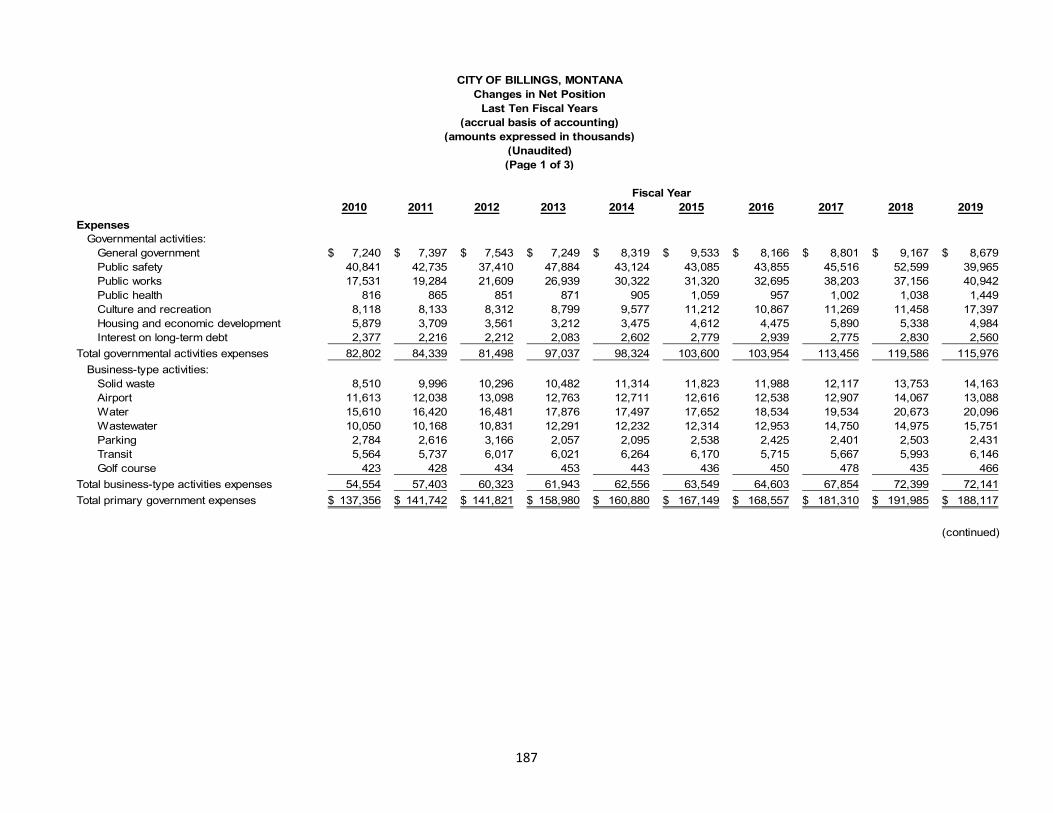
187
2010 2011 2012 2013 2014 2015 2016 2017 2018 2019Expenses
Governmental activities:General government 7,240$ 7,397$ 7,543$ 7,249$ 8,319$ 9,533$ 8,166$ 8,801$ 9,167$ 8,679$ Public safety 40,841 42,735 37,410 47,884 43,124 43,085 43,855 45,516 52,599 39,965 Public works 17,531 19,284 21,609 26,939 30,322 31,320 32,695 38,203 37,156 40,942 Public health 816 865 851 871 905 1,059 957 1,002 1,038 1,449 Culture and recreation 8,118 8,133 8,312 8,799 9,577 11,212 10,867 11,269 11,458 17,397 Housing and economic development 5,879 3,709 3,561 3,212 3,475 4,612 4,475 5,890 5,338 4,984 Interest on long-term debt 2,377 2,216 2,212 2,083 2,602 2,779 2,939 2,775 2,830 2,560
Total governmental activities expenses 82,802 84,339 81,498 97,037 98,324 103,600 103,954 113,456 119,586 115,976 Business-type activities:
Solid waste 8,510 9,996 10,296 10,482 11,314 11,823 11,988 12,117 13,753 14,163 Airport 11,613 12,038 13,098 12,763 12,711 12,616 12,538 12,907 14,067 13,088 Water 15,610 16,420 16,481 17,876 17,497 17,652 18,534 19,534 20,673 20,096 Wastewater 10,050 10,168 10,831 12,291 12,232 12,314 12,953 14,750 14,975 15,751 Parking 2,784 2,616 3,166 2,057 2,095 2,538 2,425 2,401 2,503 2,431 Transit 5,564 5,737 6,017 6,021 6,264 6,170 5,715 5,667 5,993 6,146 Golf course 423 428 434 453 443 436 450 478 435 466
Total business-type activities expenses 54,554 57,403 60,323 61,943 62,556 63,549 64,603 67,854 72,399 72,141 Total primary government expenses 137,356$ 141,742$ 141,821$ 158,980$ 160,880$ 167,149$ 168,557$ 181,310$ 191,985$ 188,117$
(continued)
CITY OF BILLINGS, MONTANAChanges in Net Position
Last Ten Fiscal Years(accrual basis of accounting)
(amounts expressed in thousands)(Unaudited)(Page 1 of 3)
Fiscal Year

188
2010 2011 2012 2013 2014 2015 2016 2017 2018 2019Program Revenues
Governmental activities:Charges for services:
General government 2,291$ 2,365$ 2,788$ 2,611$ 2,463$ 2,855$ 3,286$ 3,414$ 3,560$ 3,439$ Public safety 6,172 6,630 5,982 5,847 4,900 5,857 5,627 5,200 5,166 5,362 Public works 18,238 18,933 21,221 21,433 22,427 23,271 24,763 25,476 27,892 29,006 Culture and recreation 45 46 45 36 59 42 50 48 56 48 Other activities 1,772 1,838 1,887 1,948 2,074 2,326 2,472 2,411 2,301 2,492
Operating grants and contributions 13,125 12,229 7,006 12,503 13,648 16,554 11,713 12,034 18,856 7,914 Captial grants and contributions 7,555 14,133 26,658 28,524 13,626 7,884 9,568 11,036 7,118 6,060
Total governmental activities program revenues 49,198 56,174 65,587 72,902 59,197 58,789 57,479 59,619 64,949 54,321 Business-type activities:
Charges for services:Solid waste 9,144 9,801 10,731 10,161 11,024 13,925 13,888 14,715 15,407 15,474 Airport 8,278 8,483 9,568 9,841 9,046 9,536 9,915 10,078 12,356 12,887 Water 21,099 19,538 23,569 25,904 22,928 24,740 25,914 24,686 27,995 25,326 Wastewater 10,282 10,919 14,144 16,123 18,054 18,469 18,915 19,798 19,518 23,970 Other activities 2,850 2,810 2,902 3,071 2,758 2,752 2,496 2,675 2,856 3,002
Operating grants and contributions 2,384 2,224 2,260 2,533 2,815 2,195 3,894 4,024 3,721 1,462 Captial grants and contributions 9,247 15,707 6,041 8,426 15,274 4,366 12,326 9,163 3,745 3,170
Total business-type activities program revenues 63,284 69,482 69,215 76,059 81,899 75,983 87,348 85,139 85,598 85,291 Total primary government program revenues 112,482$ 125,656$ 134,802$ 148,961$ 141,096$ 134,772$ 144,827$ 144,758$ 150,547$ 139,612$ Net (expense)/revenueGovernmental activities (33,604)$ (25,324)$ (31,450)$ (24,135)$ (39,127)$ (44,811)$ (46,475)$ (53,837)$ (54,637)$ (61,655)$ Business-type activities 8,730 9,159 7,272 14,116 19,343 12,434 22,745 17,285 13,199 13,150 Total primary government (24,874)$ (16,165)$ (24,178)$ (10,019)$ (19,784)$ (32,377)$ (23,730)$ (36,552)$ (41,438)$ (48,505)$
(continued)
Fiscal Year
CITY OF BILLINGS, MONTANAChanges in Net Position
Last Ten Fiscal Years(accrual basis of accounting)
(amounts expressed in thousands)(Unaudited)(Page 2 of 3)

189
2010 2011 2012 2013 2014 2015 2016 2017 2018 2019
General Revenues and Other Changes inNet Position
Governmental activities:Property taxes 28,106$ 31,642$ 31,165$ 32,686$ 36,507$ 32,198$ 36,636$ 37,269$ 38,684$ 39,670$ Franchise fees 2,786 2,946 3,348 3,598 2,770 3,808 3,946 3,833 3,852 1,458 Business license tax 643 744 706 701 740 759 755 763 762 766 Unrestricted federal/state shared revenue 12,707 13,247 13,544 14,023 15,117 15,550 15,878 16,408 17,139 18,109 Unrestricted investment earnings 229 129 133 77 151 196 332 228 428 2,314 Gain on sale of property and equipment (273) (13) 139 465 411 949 (2,212) 267 140 58 Miscellaneous 53 77 59 78 (201) 221 194 144 (783) 441 Transfers 206 (1,561) 146 (4,409) (9,046) (4,144) (101) (502) (309) (85)
Total governmental activities 44,457 47,211 49,240 47,219 46,449 49,537 55,428 58,410 59,913 62,731 Business-type activities:
Property taxes 1,774 1,833 1,880 1,864 1,992 1,865 1,981 2,054 2,230 2,264 Unrestricted federal/state shared revenue 324 341 341 341 - 421 - - - - Unrestricted investment earnings 641 436 419 226 400 445 752 657 1,498 3,596 Gain on sale of property and equipment 20 (24) (547) 468 285 61 - 28 24 170 Miscellaneous 205 150 742 200 273 353 153 835 711 219 Transfers (206) 1,561 (146) 4,409 9,046 4,144 101 502 309 85
Total business-type activities 2,758 4,297 2,689 7,508 11,996 7,289 2,987 4,076 4,772 6,334 Total primary government 47,215$ 51,508$ 51,929$ 54,727$ 58,445$ 56,826$ 58,415$ 62,486$ 64,685$ 69,065$
Change in Net PositionGovernmental activities 10,853$ 21,887$ 17,790$ 23,084$ 7,322$ 4,726$ 8,953$ 4,573$ 5,276$ 1,076$ Business-type activities 11,488 13,456 9,961 21,624 31,339 19,723 25,732 21,361 17,971 19,484 Total primary government net position 22,341$ 35,343$ 27,751$ 44,708$ 38,661$ 24,449$ 34,685$ 25,934$ 23,247$ 20,560$
Source: City of Billings, Montana
Fiscal Year
CITY OF BILLINGS, MONTANAChanges in Net Position
Last Ten Fiscal Years(accrual basis of accounting)
(amounts expressed in thousands)(Unaudited)(Page 3 of 3)

190
BusinessProperty License
Fiscal Year Tax Tax Total2010 28,106$ 643$ 28,749$ 2011 31,642 744 32,386 2012 31,165 706 31,871 2013 32,686 701 33,387 2014 36,507 739 37,246 2015 32,198 759 32,957 2016 36,636 755 37,391 2017 37,269 763 38,032 2018 38,684 762 39,446 2019 39,670 766 40,436
Source: City of Billings, Montana
CITY OF BILLINGS, MONTANAGovernmental Activities Tax Revenues By Source
(Unaudited)
(accrual basis of accounting)Last Ten Fiscal Years
(amounts expressed in thousands)

191
2010 2011 2012 2013 2014 2015 2016 2017 2018 2019
General FundUnspendable -$ -$ -$ -$ -$ -$ -$ -$ -$ -$ Restricted - - - - - - - - - - Committed 8,186 8,610 9,726 8,603 9,890 9,952 10,638 11,651 11,858 12,723 Unassigned 5,007 8,131 10,285 11,612 13,245 14,928 16,553 16,621 15,860 9,676
Total 13,193$ 16,741$ 20,011$ 20,215$ 23,135$ 24,880$ 27,191$ 28,272$ 27,718$ 22,399$
All other governmental fundsUnspendable 601$ 614$ 626$ 637$ 751$ 760$ 800$ 808$ 859$ 906$ Restricted 40,044 39,936 43,818 64,363 56,291 72,549 71,238 72,033 63,728 63,182 Committed 9,477 8,547 7,958 8,681 7,842 10,817 10,258 9,022 10,709 9,242 Unassigned (243) (496) (906) (470) (376) (396) (275) (118) (23) (246)
Total 49,879$ 48,601$ 51,496$ 73,211$ 64,508$ 83,730$ 82,021$ 81,745$ 75,273$ 73,084$
Source: City of Billings, Montana1 In FY2010, The City of Billings adopted GASB 54. See Notes to Financial Statements.
Fiscal Years
CITY OF BILLINGS, MONTANAFund Balances of Governmental Funds
Last Ten Fiscal Years 1
(modified accrual basis of accounting)(amounts expressed in thousands)
(Unaudited)

192
2010 2011 2012 2013 2014 2015 2016 2017 2018 2019Revenues
Taxes 27,841$ 32,062$ 30,654$ 32,131$ 36,457$ 33,763$ 37,286$ 37,213$ 38,619$ 39,787$ Licenses and permits 4,759 5,126 5,611 6,513 5,489 6,984 6,879 6,596 6,456 4,074 Intergovernmental 27,219 27,704 20,698 25,518 27,768 28,279 30,061 28,991 30,225 32,132 Charges for services 9,743 10,725 11,128 10,782 11,512 11,966 13,144 13,565 14,613 15,654 Fines and forfeitures 1,809 2,035 2,052 2,393 2,064 2,079 1,964 1,754 1,838 1,751 Special assessments 17,984 18,635 20,276 21,394 21,548 22,303 22,515 22,921 24,319 24,874 Other 2,761 1,918 1,674 2,337 3,394 3,247 3,569 4,200 4,097 4,308
Total revenues 92,116 98,205 92,093 101,068 108,232 108,621 115,418 115,240 120,167 122,580
ExpendituresCurrent:
General government 7,147 7,208 7,323 7,335 8,288 7,869 8,074 8,331 8,859 9,499 Public safety 38,801 40,529 36,145 43,716 42,386 43,924 45,669 47,106 50,111 53,168 Public works 12,402 13,514 14,133 16,415 18,861 18,472 19,059 21,862 21,926 23,207 Public health 727 766 769 787 814 843 856 821 854 964 Culture and recreation 6,944 6,981 7,133 7,633 8,163 8,374 8,920 8,201 8,911 10,384 Housing and economic development 5,860 3,599 3,478 3,129 3,407 4,423 4,418 5,718 5,217 4,582
Capital outlay 8,313 17,007 13,980 21,874 30,294 18,893 25,726 14,445 17,818 26,544 Debt service:
Principal 4,590 5,934 6,967 13,153 4,811 9,157 4,322 4,801 11,481 3,896 Interest and fiscal charges 2,172 1,942 1,752 2,688 2,349 2,492 2,551 2,734 2,951 2,530 Bond issuance costs 9 64 135 769 133 464 136 69 28 75
Total expenditures 86,965 97,544 91,815 117,499 119,506 114,911 119,731 114,088 128,156 134,849 Excess of revenues over (under) expenditures 5,151$ 661$ 278$ (16,431)$ (11,274)$ (6,290)$ (4,313)$ 1,152$ (7,989)$ (12,269)$
(continued)
Fiscal Years
CITY OF BILLINGS, MONTANAChanges in Fund Balances of Governmental Funds
Last Ten Fiscal Years(modified accrual basis of accounting)
(amounts expressed in thousands)(Unaudited)
(Page 1 of 2)

193
2010 2011 2012 2013 2014 2015 2016 2017 2018 2019Other financing sources (uses)Transfers in 21,267$ 25,054$ 24,532$ 26,535$ 24,086$ 28,504$ 26,615$ 28,252$ 34,501$ 33,474$ Transfers out (21,982) (25,730) (24,886) (28,260) (24,773) (29,094) (27,194) (29,023) (35,098) (33,950) Issuance of debt 881 1,125 3,630 33,055 - 6,270 - - - 3,465 Special assessment bonds issued 988 945 2,325 6,120 4,820 18,655 5,375 226 1,415 1,625 Premium on bonds issued - 31 - 1,435 233 1,130 - - - 95 Bond discounts - (30) (57) (2) - (61) - - - - Sale of capital assets 342 213 343 468 124 1,852 119 267 140 58 Total other financing sources (uses) 1,496 1,608 5,887 39,351 4,490 27,256 4,915 (278) 958 4,767
Net change in fund balances 6,647$ 2,269$ 6,165$ 22,920$ (6,784)$ 20,966$ 602$ 874$ (7,031)$ (7,502)$
Debt service as a percentage of noncapitalexpenditures 8.6% 9.8% 11.2% 16.6% 8.0% 12.1% 7.3% 7.6% 13.1% 5.9%
Source: City of Billings, Montana
Fiscal Years
(modified accrual basis of accounting)(amounts expressed in thousands)
(Unaudited)(Page 2 of 2)
CITY OF BILLINGS, MONTANAChanges in Fund Balances of Governmental Funds
Last Ten Fiscal Years

194
BusinessProperty License
Fiscal Year Tax Tax Total2010 27,841$ 643$ 28,484$ 2011 32,062 744 32,806 2012 30,654 706 31,360 2013 32,131 701 32,832 2014 36,457 740 37,197 2015 33,763 759 34,522 2016 37,286 755 38,041 2017 37,213 763 37,976 2018 38,684 762 39,446 2019 39,787 766 40,553
Source: City of Billings, Montana
CITY OF BILLINGS, MONTANAGeneral Government Tax Revenues By Source
(Unaudited)
(modified accrual basis of accounting)Last Ten Fiscal Years
(amounts expressed in thousands)

195
Ratio ofTaxable
Personal Property Direct Value toFiscal Estimated Taxable Estimated Taxable Estimated Taxable Tax EstimatedYear Market Value Value Market Value Value Market Value 1 Value 2 Rate Market2010 4,846,545,852 150,316,617 289,007,798 8,596,230 5,135,553,650 158,912,847 169.44 3.1%2011 6,045,049,971 158,774,355 261,866,181 7,680,497 6,306,916,152 166,454,852 171.42 2.6%2012 5,391,987,991 160,074,588 253,361,134 7,357,320 5,645,349,125 167,431,908 168.73 3.0%2013 5,578,809,490 159,681,901 257,791,168 5,720,433 5,836,600,658 165,402,334 174.58 2.8%2014 5,867,349,504 161,755,976 272,813,412 6,008,199 6,140,162,916 167,764,175 178.70 2.7%2015 6,141,298,543 163,095,567 209,710,048 3,762,699 6,351,008,591 166,858,266 168.12 2.6%2016 11,372,527,592 7 187,958,670 254,824,924 4,087,311 11,627,352,516 192,045,981 158.84 1.7%2017 11,491,184,706 191,197,155 252,088,832 3,979,017 11,743,273,538 195,176,172 160.40 1.7%2018 12,191,541,683 199,511,334 279,769,621 4,331,658 12,471,311,304 203,842,992 159.00 1.6%2019 12,273,523,077 200,187,216 282,104,998 4,354,464 12,555,628,075 204,541,680 163.12 1.6%
1 State of Montana Department of Revenue (both real and personal property).2 Yellowstone County, Montana, Assessors Office (both real and personal property).3 Market value and taxable value includes Utilities category.4 Breakdown of commercial and residential property values is not available.5 Market value and taxable value for fiscal years beginning in 2006 include incremental increases to the Tax Increment District. 6 For Fiscal Year 2009 State of Montana Department of Revenue did not include exempt properties.7 The 6 year appraisal cycle was done by the State.
(Unaudited)
Total 5Real Property 3,4
CITY OF BILLINGS, MONTANATaxable and Estimated Market Value of Taxable Property
Last Ten Fiscal Years

196
Big Sky TotalGeneral Economic Direct and
Fiscal Public Obligation School School Development OverlappingYear General 4 Library 4 Safety 2 Transit 4 Bonds Total 3 County Education 1 District Authority State Total2010 74.00 5.00 71.92 10.00 8.52 169.44 106.89 102.50 193.87 3.05 47.98 623.732011 74.00 5.00 73.82 10.00 8.60 171.42 114.36 102.50 199.73 3.05 49.34 640.402012 74.00 5.00 70.75 10.00 8.98 168.73 114.44 102.50 199.19 3.05 49.96 637.872013 74.00 5.00 71.11 10.00 14.47 5 160.11 117.19 102.50 204.53 3.09 52.09 639.512014 74.00 5.00 74.36 10.00 15.34 178.70 118.33 102.50 215.54 3.09 49.36 667.522015 74.00 5.00 64.59 10.00 14.53 168.12 117.10 102.50 249.75 3.09 46.10 686.662016 67.64 4.57 64.41 9.17 13.05 158.84 109.58 102.50 253.28 2.87 42.95 670.022017 70.61 4.77 64.30 9.54 11.18 160.40 113.71 102.50 255.52 2.95 50.61 685.692018 70.61 5.00 62.40 10.00 10.99 159.00 112.09 102.50 263.96 3.17 51.64 692.362019 74.00 5.00 62.88 10.00 11.24 163.12 124.76 102.50 272.73 3.29 47.87 714.27
Source: Yellowstone County, Montana, Treasurer1 Includes School Equalization Levy and other Education Levies.2 Tax payers approved additional public safety mills increase annually for fiscal years 2006 through 2010.3 Under State Law, voter approval is required for additional tax rate increases.4 General mills are fixed by charter, increases require an amendment to the charter.5 General Obligation Library Bond for 6.12 mills was issued.
City
(Unaudited)
CITY OF BILLINGS, MONTANAProperty Tax Rates – Direct and Overlapping Governments
(Per $1000 of Assessed Value)Last Ten Fiscal Years

197
Percentage of Percentage ofTaxable Total Taxable Taxable Total Taxable
Taxpayer Value Rank Value Value Rank ValueNorthwestern Energy 10,480,820$ 1 5.1% 6,362,465$ 1 4.2%Montana Dakota Utilities 3,846,485 2 1.9% 1,514,241 3 1.0%Charter Communications 2,214,783 3 1.1% - 0.0%Centurylink Inc 1,418,407 4 0.7% - 0.0%AT&T Communications 1,237,709 5 0.6% 580,004 6 0.4%Rimrock Owner LP 814,512 6 0.4% - 0.0%Wal-Mart Real Estate 599,407 7 0.3% 692,655 4 0.5%Scheels All Sports Inc 654,655 8 0.3% - 0.0%Billings 401 LLC 538,665 9 0.3% - 0.0%Jela LLC 533,221 10 0.3% - 0.0%Verizon Wireless - 0.0% 538,832 8 0.4%Wells Fargo Corporate Prop. - 0.0% 439,261 9 0.3%Qwest Corp - 0.0% 3,127,106 2 2.1%Macerich Rimrock Limited Partner - 0.0% 682,518 5 0.5%Bresnan Broadband - 0.0% 425,955 10 0.3%Western Sugar Co. - 0.0% 564,287 7 0.4%Total 22,338,664$ 10.9% 14,927,324$ 9.9%
Total taxable value 204,836,165$ 150,160,353$
Source: City of Billings, Montana
Tax Year 2018 Tax Year 2009
CITY OF BILLINGS, MONTANAPrincipal Property Taxpayers
June 30, 2019 and Ten Years Ago(Unaudited)

198
Collected within the Collections Total CollectionsTotal Tax Fiscal Year of the Levy in to Date
Fiscal Levy1 for Percentage Subsequent PercentageYear Fiscal Year Amount of Levy Years Amount of Levy Delinquent2010 25,249,468 23,902,572 94.7% 723,714 24,626,286 97.5% 1,346,896 2011 26,450,937 24,813,236 93.8% 1,330,906 26,144,142 98.8% 1,637,701 2012 26,003,866 23,934,858 92.0% 1,051,668 24,986,526 96.1% 2,069,008 2013 26,886,158 25,426,270 94.6% 642,009 26,068,279 97.0% 1,459,888 2014 27,818,662 26,310,736 94.6% 658,806 26,969,542 96.9% 1,507,926 2015 26,391,143 25,590,811 97.0% 4,894,272 30,485,083 115.5% 800,332 2016 28,231,663 27,220,145 96.4% 1,041,105 28,261,250 100.1% 1,011,518 2017 28,795,414 27,087,538 94.1% 770,715 27,858,253 96.7% 1,707,876 2018 30,101,821 28,340,613 94.1% 1,644,651 29,985,264 99.6% 1,761,208 2019 31,249,233 29,999,888 96.0% 1,699,576 31,699,464 101.4% 1,249,345
Source: City of Billings, Montana1 The total tax levy, collections and outstanding delinquent taxes are net of tax increment amounts.
CITY OF BILLINGS, MONTANAProperty Tax Levies and Collections 1
Last Ten Fiscal Years(Unaudited)
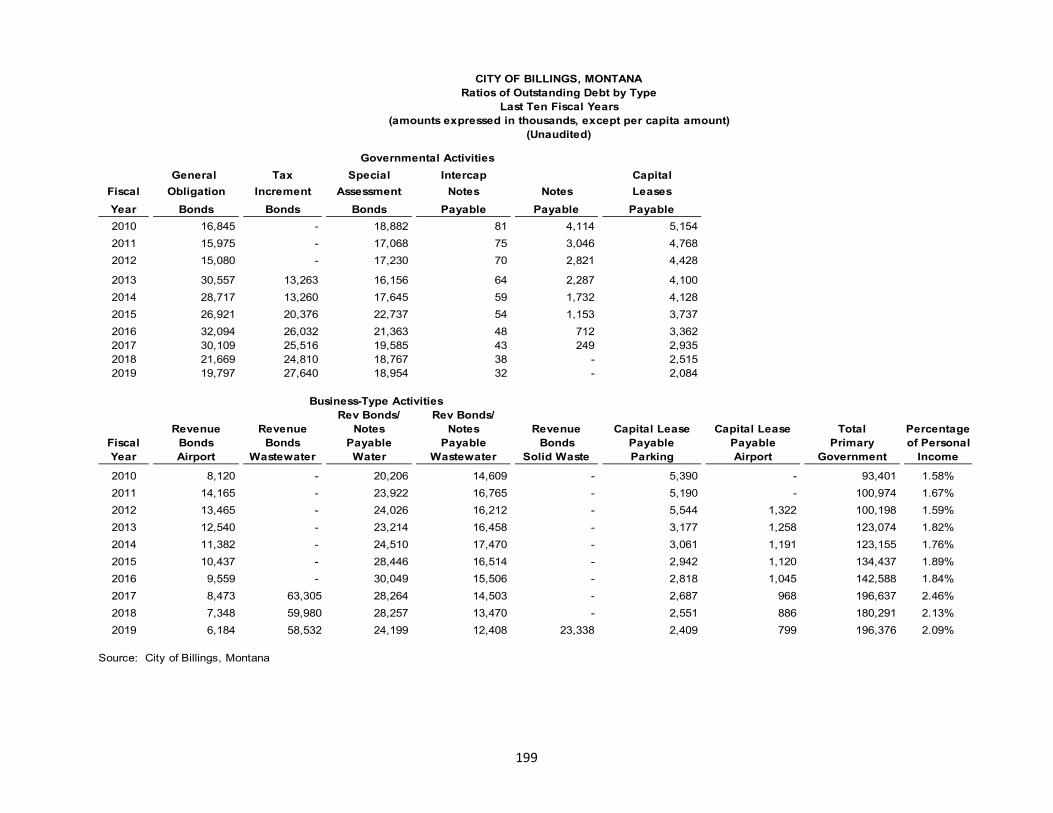
199
CITY OF BILLINGS, MONTANARatios of Outstanding Debt by Type
Last Ten Fiscal Years(amounts expressed in thousands, except per capita amount)
(Unaudited)
General Tax Special Intercap CapitalFiscal Obligation Increment Assessment Notes Notes LeasesYear Bonds Bonds Bonds Payable Payable Payable2010 16,845 - 18,882 81 4,114 5,154 2011 15,975 - 17,068 75 3,046 4,768 2012 15,080 - 17,230 70 2,821 4,428
2013 30,557 13,263 16,156 64 2,287 4,100 2014 28,717 13,260 17,645 59 1,732 4,128 2015 26,921 20,376 22,737 54 1,153 3,737 2016 32,094 26,032 21,363 48 712 3,362 2017 30,109 25,516 19,585 43 249 2,935 2018 21,669 24,810 18,767 38 - 2,515 2019 19,797 27,640 18,954 32 - 2,084
Rev Bonds/ Rev Bonds/Revenue Revenue Notes Notes Revenue Capital Lease Capital Lease Total Percentage
Fiscal Bonds Bonds Payable Payable Bonds Payable Payable Primary of PersonalYear Airport Wastewater Water Wastewater Solid Waste Parking Airport Government Income
2010 8,120 - 20,206 14,609 - 5,390 - 93,401 1.58%2011 14,165 - 23,922 16,765 - 5,190 - 100,974 1.67%2012 13,465 - 24,026 16,212 - 5,544 1,322 100,198 1.59%2013 12,540 - 23,214 16,458 - 3,177 1,258 123,074 1.82%2014 11,382 - 24,510 17,470 - 3,061 1,191 123,155 1.76%2015 10,437 - 28,446 16,514 - 2,942 1,120 134,437 1.89%2016 9,559 - 30,049 15,506 - 2,818 1,045 142,588 1.84%2017 8,473 63,305 28,264 14,503 - 2,687 968 196,637 2.46%2018 7,348 59,980 28,257 13,470 - 2,551 886 180,291 2.13%2019 6,184 58,532 24,199 12,408 23,338 2,409 799 196,376 2.09%
Source: City of Billings, Montana
Business-Type Activities
Governmental Activities

200
Percentage ofEstimated
General Less: Amounts Actual Taxable NetFiscal Taxable Obligation Available in Debt Value of Bonded DebtYear Population 1 Value 2 Bonds 3 Service Funds 4 Net Property Per Capita2010 105,845 158,912,847 16,845,000 1,720,203 15,124,797 9.5% 142.90 2011 104,170 166,454,852 15,975,000 1,549,809 14,425,191 8.7% 138.48 2012 104,170 167,431,908 15,080,000 1,233,678 13,846,322 8.3% 132.92 2013 106,954 165,402,334 30,556,896 2,465,881 28,091,015 17.0% 262.65 2014 109,059 167,764,175 28,716,650 2,310,101 26,406,549 15.7% 242.13 2015 108,869 166,858,266 26,921,315 2,653,784 24,267,531 14.5% 222.91 2016 110,263 181,997,580 32,093,610 2,852,317 29,241,293 16.1% 265.20 2017 110,323 185,589,273 30,109,235 2,505,033 27,604,202 14.9% 250.21 2018 109,642 193,797,788 21,668,610 2,392,468 19,276,142 9.9% 175.81 2019 109,544 195,708,313 19,797,206 2,468,288 17,328,918 8.9% 158.19
Sources and other information:1 Census taken every ten years. Actual census figures given for 2011. All other years are estimated by City/County Planning, Yellowstone County, Montana.2 Yellowstone County, Montana, Assessors Office (these amounts do not include the incremental increases to the Tax Increment District).3 Amount does not include Special Assessment, tax increment or revenue bonds. In 2013, 2014, 2015 and 2016 recorded net of adjustments. 4 Amount does not include Special Assessment, tax increment debt service funds
Last Ten Fiscal Years(Unaudited)
CITY OF BILLINGS, MONTANARatio of General Obligation Bonded Debt Outstanding
To Taxable Value and Net General Obligation Bonded Debt Per Capita

201
EstimatedPercent Share of
Debt Applicable to OverlappingGovernmental Unit Outstanding City 2 Debt
Overlapping:Yellowstone County 10,435,500$ 1 55.62% 5,804,225$
School Districts School District #2 133,609,940$ 1 43.44% 58,040,158$ Elder Grove SD #4 18,745,000 1 0.10% 18,745$ Elysian SD #23 7,615,000 1 5.43% 413,495$ Canyon Creek SD #44 410,000 1 0.31% 1,271$ Independent SD #52 2,240,000 1 0.31% 6,944$
Total School Districts 162,619,940 58,480,612
Total Overlapping Debt 173,055,440 64,284,838
Direct:City of Billings General Obligation 19,797,206$ Tax Increment 27,639,805 Special Assesment 18,954,420 Intercap Notes 32,206 Notes Payable - Capital Lease 2,083,906 Total Direct Debt 68,507,543$ 100.0% 68,507,543$
Total Direct and Overlapping Debt 241,562,983 132,792,381
Source and other information:1 Finance Department, Yellowstone County, Montana.2 The percentage of overlapping debt applicable to the City is estimated using taxable property values. Applicable percentages were estimated by determining the portion of the other government's taxable value that is within the City's boundaries and dividing it by the other government total taxable value.
CITY OF BILLINGS, MONTANADirect and Overlapping General Obligation Bonded Debt
June 30, 2019(Unaudited)

202
2010 2011 2012 2013 2014 2015 2016 2017 2018 2019Debt limit 126,264$ 110,757$ 125,971$ 145,915$ 153,504$ 158,762$ 289,112$ 291,981$ 311,783$ 313,872$
Total net debt applicable to limit 20,030 19,343 13,846 27,875 26,407 23,326 27,260 32,622 23,758 21,887
Legal debt margin 106,234$ 91,414$ 112,125$ 118,040$ 127,098$ 135,436$ 261,852$ 259,360$ 288,024$ 291,985$
Total net debt applicable to the limit as a percentage of debt limit 15.86% 17.46% 10.99% 19.10% 17.20% 14.69% 9.43% 11.17% 7.62% 6.97%
Legal Debt Margin Calculation for Fiscal Year 2019
Assessed market value:Real property 11,973,868,035$ Personal property 281,342,145 Utilities 299,655,042
Total assessed value 12,554,865,222$ Debt amount limited to 2.5% of total assessed value 313,871,631$
Less: General obligation bonded debt outstanding 19,797,206
Total net debt applicable to limit 19,797,206 Plus:
Amount set aside for repayment of GO debt (2,089,750) Total net debt applicable to limit 17,707,456
Legal debt margin 291,984,675$
Source: City of Billings, MontanaNote: Under state law, the City of Billings, Montana's outstanding general obligation debt was not to exceed 1.51% prior to FY 08 and 2.50% starting in FY 08 of total assessed market value.
CITY OF BILLINGS, MONTANALegal Debt Margin Information
Last Ten Fiscal Years(amounts expressed in 000's)
(Unaudited)
Fiscal Year

203
Less: Net RevenueFiscal Gross Operating Available for Debt Service RequirementsYear Revenue 1 Expense 2 Debt Service Principal Interest Total Coverage2010 31,671,419$ 16,516,713$ 15,154,706$ 1,389,000$ 1,155,659$ 2,544,659$ 596%2011 30,683,732 16,666,260 14,017,472 1,926,000 1,415,188 3,341,188 420%2012 37,852,987 17,146,622 20,706,365 1,938,000 1,493,738 3,431,738 603%2013 41,905,740 19,526,272 22,379,468 2,417,119 1,473,370 3,890,489 575%2014 40,923,714 18,809,342 22,114,372 2,345,000 1,059,745 3,404,745 650%2015 43,267,946 18,684,310 24,583,636 2,572,407 1,196,733 3,769,140 652%2016 44,906,310 19,688,620 25,217,690 2,924,000 1,232,897 4,156,897 607%2017 46,152,358 21,104,769 25,047,589 2,957,000 1,229,859 4,186,859 598%2018 48,671,532 21,804,167 26,867,365 6,025,000 3,572,904 9,597,904 280%2019 51,824,655 21,032,368 30,792,287 4,550,000 3,447,181 7,997,181 385%
Source: City of Billings, Montana1 Includes operating revenue and interest income.2 Total operating expenses exclusive of depreciation.3 SRF Loan proceeds began in FY 05-06 as well as the related principal and interest payments.
Note: Details regarding the City's outstanding debt can be found in the notes to the financial statements.
CITY OF BILLINGS, MONTANAPledged-Revenue CoverageWater and Wastewater Debt
Last Ten Fiscal Years(Unaudited)

204
Add:CFC revenue Less: Net Revenue Debt Service RequirementsFiscal Gross not to exceed Operating Available for 2000/2010A 2000/2010A 2010B 2010BYear Revenue 1 2010B Debt Serv Expense 2 Debt Service Principal Interest Principal Interest Total Coverage2010 8,400,519$ -$ 6,455,160$ 1,945,359$ 515,000$ 538,455$ -$ -$ 1,053,455$ 185%2011 8,725,159 170,796 6,589,404 2,306,551 3 ,4 550,000 349,642 - 170,796 1,070,438 215%2012 9,792,472 292,793 7,229,282 2,855,983 700,000 295,068 - 292,793 1,287,861 222%2013 9,997,736 475,469 7,156,337 3,316,868 690,000 275,968 235,000 240,469 1,441,437 230%2014 9,159,665 483,194 7,306,389 2,336,470 710,000 254,968 250,000 233,194 1,448,162 161%2015 9,683,881 495,394 7,198,727 2,980,548 730,000 229,719 270,000 225,394 1,455,113 205%2016 10,279,572 492,219 7,095,930 3,675,861 765,000 199,818 275,000 217,219 1,457,037 252%2017 10,556,892 493,819 7,453,340 3,597,371 795,000 166,631 285,000 208,819 1,455,450 247%2018 11,761,416 495,119 8,618,384 3,638,151 825,000 131,728 295,000 200,119 1,451,847 251%2019 11,396,600 491,006 7,526,174 4,361,432 860,000 95,362 300,000 191,006 1,446,368 302%
Source: City of Billings, Montana1 Includes operating revenue, intergovernmental revenue, other revenue, interest income net of CFC and PFC interest.2 Total operating expense exclusive of depreciation.3 The 2000 series bonds were refunded in July of 2010 in exchange for 2010A revenue bonds.4 In Fiscal year 2011, Airport series 2010B revenue bonds were issued for the CFC project.
Note: Details regarding the City's outstanding debt can be found in the notes to the financial statements.
CITY OF BILLINGS, MONTANAPledged-Revenue Coverage
Airport Revenue BondsLast Ten Fiscal Years
(Unaudited)

205
Fiscal Gross 1 Debt Service RequirementsYear Revenue Principal Interest Total Coverage2010 2,519,745 2,090,111 1,060,094 3,150,205 80.0%2011 2,984,730 1,803,815 970,296 2,774,111 107.6%2012 5,581,675 4,614,070 915,622 5,529,692 100.9%2013 6,665,868 7,013,621 1,539,100 8,552,721 77.9%2014 2,623,645 2,085,862 690,009 2,775,871 94.5%2015 7,183,892 6,593,709 613,603 7,207,312 99.7%2016 1,855,339 1,641,069 343,342 1,984,411 93.5%2017 1,676,582 1,527,648 308,749 1,836,397 91.3%2018 1,774,099 1,686,466 257,392 1,943,858 91.3%2019 1,551,560 871,327 274,229 1,145,556 135.4%
Source: City of Billings, MontanaNote: Details regarding the City's outstanding debt can be found in the notes to the financial statements.1 Gross Revenue includes special assessments and investment earnings on reserves.
Last Ten Fiscal Years(Unaudited)
CITY OF BILLINGS, MONTANAPledged-Revenue CoverageSpecial Assessment Bonds
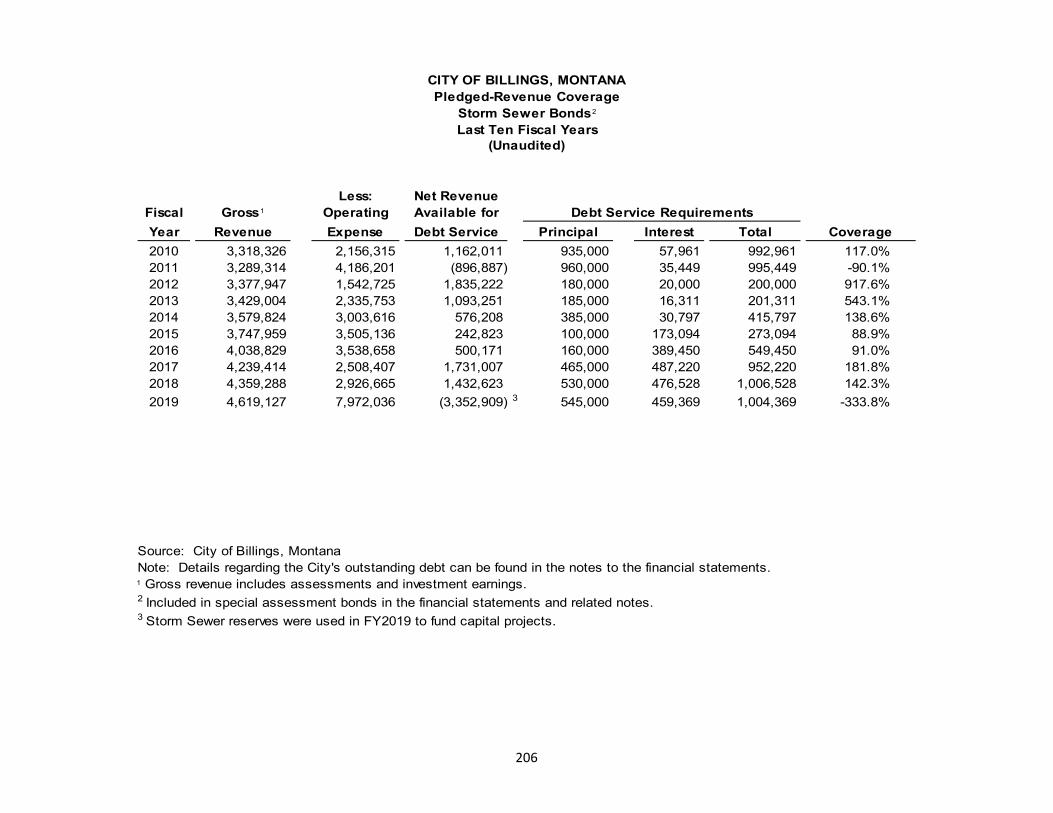
206
Less: Net RevenueFiscal Gross 1 Operating Available for Debt Service RequirementsYear Revenue Expense Debt Service Principal Interest Total Coverage2010 3,318,326 2,156,315 1,162,011 935,000 57,961 992,961 117.0%2011 3,289,314 4,186,201 (896,887) 960,000 35,449 995,449 -90.1%2012 3,377,947 1,542,725 1,835,222 180,000 20,000 200,000 917.6%2013 3,429,004 2,335,753 1,093,251 185,000 16,311 201,311 543.1%2014 3,579,824 3,003,616 576,208 385,000 30,797 415,797 138.6%2015 3,747,959 3,505,136 242,823 100,000 173,094 273,094 88.9%2016 4,038,829 3,538,658 500,171 160,000 389,450 549,450 91.0%2017 4,239,414 2,508,407 1,731,007 465,000 487,220 952,220 181.8%2018 4,359,288 2,926,665 1,432,623 530,000 476,528 1,006,528 142.3%2019 4,619,127 7,972,036 (3,352,909) 3 545,000 459,369 1,004,369 -333.8%
Source: City of Billings, MontanaNote: Details regarding the City's outstanding debt can be found in the notes to the financial statements.1 Gross revenue includes assessments and investment earnings.2 Included in special assessment bonds in the financial statements and related notes.3 Storm Sewer reserves were used in FY2019 to fund capital projects.
Last Ten Fiscal Years(Unaudited)
CITY OF BILLINGS, MONTANAPledged-Revenue Coverage
Storm Sewer Bonds 2

207
Less: Net RevenueFiscal Gross 1 Operating Available for Debt Service Requirements
Year Revenue Expense 2 Debt Service Principal Interest 6 Total Coverage2010 1,764,693$ 1,678,525$ 86,168$ 189,622$ 305,773$ 495,395$ 17%2011 1,732,269 1,551,195 181,074 200,014 295,381 495,395 37%2012 1,724,876 2,110,306 (385,430) 210,974 284,421 495,395 -78%2013 1,755,582 1,220,805 534,777 5 222,536 272,859 495,395 108%2014 1,525,125 1,455,807 69,318 115,863 139,917 255,780 27%2015 1,519,591 1,717,715 (198,124) 119,120 136,660 255,780 -77%2016 1,590,253 1,520,808 69,445 124,485 131,295 255,780 27%2017 1,636,217 1,538,722 97,495 130,092 125,688 255,780 38%2018 1,673,213 1,673,343 (130) 135,952 119,828 255,780 0%2019 1,755,684 1,608,964 146,720 142,076 113,704 255,780 57%
Source: City of Billings, MontanaNote: Details regarding the City's outstanding debt can be found in the notes to the financial statements.1 Gross revenue includes operating revenue and interest income.2 Total operating expense exclusive of depreciation3 Included in note payable in the financial statements and related notes.4 Note payable was issued in fiscal year 2007. Prior to 2007, there was no pledged revenue debt for Parking.5 The Capital lease for Parking was refinanced in FY2013. The debt service requirements will decrease in subsequent years. 6 This interest reported is cash basis. However, the interest reported in the Government-Wide financial statement is accrued.
Last Ten Fiscal Years 4
(Unaudited)
CITY OF BILLINGS, MONTANAPledged-Revenue Coverage
Parking Notes Payable 3

208
Less: Net Revenue Debt Service Requirements 3
Fiscal Gross Operating Available for Year Revenue 1 Expense 2 Debt Service Principal Interest Total Coverage2019 15,905,395 11,232,020 4,673,375 - 313,590 313,590 1490%
Source: City of Billings, Montana1 Includes operating revenue, other revenue, and interest income.2 Total operating expense exclusive of depreciation.3 The Solid Waste revenue bonds were sold in FY2019 and the first principal payment occurs in FY2020.
Note: Details regarding the City's outstanding debt can be found in the notes to the financial statements.
CITY OF BILLINGS, MONTANAPledged-Revenue CoverageSolid Waste Revenue Bonds
Last Ten Fiscal Years(Unaudited)

209
Total PersonalFiscal Income 5 Per Capita School UnemploymentYear Population 1 (In thousands) Personal Income 5 Median Age 2 Enrollment 3 Rate 4
2010 105,845 5,900,362 38,737 38.1 15,608 5.5%2011 104,170 6,060,376 39,212 39.0 15,715 5.2%2012 104,170 6,308,626 38,488 39.0 16,223 4.3%2013 106,954 6,765,732 41,546 37.0 16,238 3.7%2014 109,059 7,014,133 42,417 36.8 16,328 2.9%2015 108,869 7,110,250 42,606 38.3 16,120 2.9%2016 110,263 7,749,711 46,052 38.1 16,644 3.2%2017 110,323 8,002,260 47,148 38.1 16,648 3.2%2018 109,642 8,484,100 49,760 38.3 16,649 3.0%2019 109,544 9,383,500 52,019 37.6 16,649 2.9%
Sources and other information:1 Census taken every ten years. Actual census figures given for 2011.
All other years are estimated by City/County Planning, Yellowstone County, Montana.2 Census and Economic Information Center (CEIC), Montana Department of Commerce3 Billings School District #2.4 State of Montana Research & Analysis Bureau.5 Bureau of Economic Analysis. Current Fiscal Year given as estimate only.
CITY OF BILLINGS, MONTANADemographic StatisticsLast Ten Fiscal Years
(Unaudited)

210
Percentage PercentageNumber of of Total City Number of of Total City
Employees 1 Rank Employment 2 Employees 1 Rank Employment 3
EmployerBillings Clinic 4,116 1 5.09% 3,508 1 4.37%School District #2 3,000 2 3.71% 2,209 2 2.75%St. Vincent Healthcare 2,213 3 2.74% 2,150 3 2.68%Stillwater Mining Company 1,781 4 2.20% 1,315 4 1.64%City of Billings 922 5 1.14% 872 7 1.09%Wells Fargo 848 6 1.05% N/A - -Yellowstone County 757 7 0.94% 760 8 0.95%Wal Mart 723 8 0.89% 966 6 1.20%St John's Lutheran Home 699 9 0.86% 600 9 0.75%Montana State University-Billings 577 10 0.71% 580 10 0.72%Avitus Group N/A - - 1,003 5 1.25%
Total 15,636 19.34% 13,963 17.38%
Sources and other information:1 Information obtained from each individual company. Numbers given may be estimates.2 Montana Research and Analysis Bureau, State of Montana. Based on 80,854 employees in the greater Billings Metro Area.3 Based on 80,358 employees in the greater Billings Metro Area.
2019
CITY OF BILLINGS, MONTANAPrincipal Employers
Current Year and Ten Years Ago(Unaudited)
2010

211
2010 2011 2012 2013 2014 2015 2016 2017 2018 2019General government 83.0 83.5 84.8 87.8 90.6 84.6 84.6 85.9 88.9 86.9 Planning and community services 28.0 31.0 31.6 31.6 31.8 38.8 39.5 40.3 44.6 42.1 Library 30.7 31.7 31.7 31.7 31.7 31.9 31.8 32.8 32.8 32.8 Public safety
Police 167.0 167.0 167.0 165.0 166.0 166.0 167.3 173.3 170.3 171.3 Animal shelter 7.0 7.0 7.0 7.0 7.0 7.0 7.0 7.0 7.0 7.0 Police Grants - - - - - - - - - 4.0
Fire 148.0 146.0 146.0 146.5 146.5 146.5 147.1 157.1 156.8 158.8 Emergency Operating Center - - - - - - - - - 0.3
Streets/Traffic 43.0 43.0 45.0 45.0 45.0 45.0 47.0 47.0 48.0 48.0 Water and Wastewater 104.0 104.0 103.0 103.0 103.0 103.0 103.0 104.1 104.0 103.0 Sanitation 62.5 63.5 63.5 63.5 64.5 64.5 63.5 63.5 63.5 64.5 Parking 15.3 15.3 15.3 12.3 12.0 12.0 12.0 12.5 12.5 12.5 Aviation 56.0 56.0 56.0 56.0 56.0 56.0 56.0 55.6 54.4 54.4 Transit 55.3 55.3 55.3 55.3 55.3 55.3 55.3 55.7 55.9 55.9 Internal services 72.0 74.0 75.0 75.0 75.0 75.0 78.0 77.0 78.0 79.0 Total 871.8 877.3 881.2 879.7 884.4 885.6 892.1 911.8 916.7 920.5
Source: City of Billings Annual Budget
FY 2015 Grant positions moved out of general government
CITY OF BILLINGS, MONTANAFull-Time Equivalent City of Billings Employees by Function
Last Ten Fiscal Years(Unaudited)

212
Report Period1 2010 2011 2012 2013 2014 2015 2016 2017 2018 2019
ActivityPolice Dispatched Calls FY 59,840 60,686 63,915 66,510 66,111 68,817 78,484 88,447 95,214 92,912 Arrests CY 6,815 7,324 9,116 9,265 10,214 10,064 11,942 12,084 11,011 11,026 Traffic Violations CY 24,024 27,240 30,473 26,478 24,813 15,460 17,068 24,463 23,973 27,149 Traffic Accidents CY 2,912 3,623 3,524 3,329 3,988 3,845 2,518 2,521 2,395 2,610Fire Dispatched Calls FY 10,499 10,841 11,228 11,194 11,989Not Available2 13,263 13,880 14,441 15,810 Inspections CY 1,021 1,972 1,191 1,209 1,553 2,027 1,043 2,516 1,058 1,497Solid Waste Residential Customers FY 31,554 31,800 32,359 32,772 33,127 35,623 31,721 31,874 32,055 32,413 Commerical Customers FY 3,704 3,889 3,982 4,071 4,136 2,900 2,559 2,624 2,603 2,586 Landfill trips FY 143,046 153,010 164,667 166,777 165,729 146,635 140,007 154,894 151,795 174,773Water Customers FY 29,248 29,309 29,537 29,811 30,113 30,326 30,651 30,311 31,435 32,811 Average Daily Consumption (millions of gallons) FY 20 19 23 23 21 21 21.5 21.3 22 19Wastewater Customers FY 32,193 32,390 32,586 32,951 33,357 33,894 34,292 34,543 35,302 35,292 Average Daily Treatment (millions of gallons) FY 16 16 16 16 16 16 15 16 18.7 19
Source: City of Billings Operating Budget, Billings, Montana1 CY represents a Calendar Year, FY represents a Fiscal Year (July 1-June 30). Calendar Year stats are to date at the time of data inquiry (typically end of November).2 A new system was implemented, so an acurate number cannot be given for FY15.
City of BillingsOperating Indicators by Activity
Last Ten Years(Unaudited)
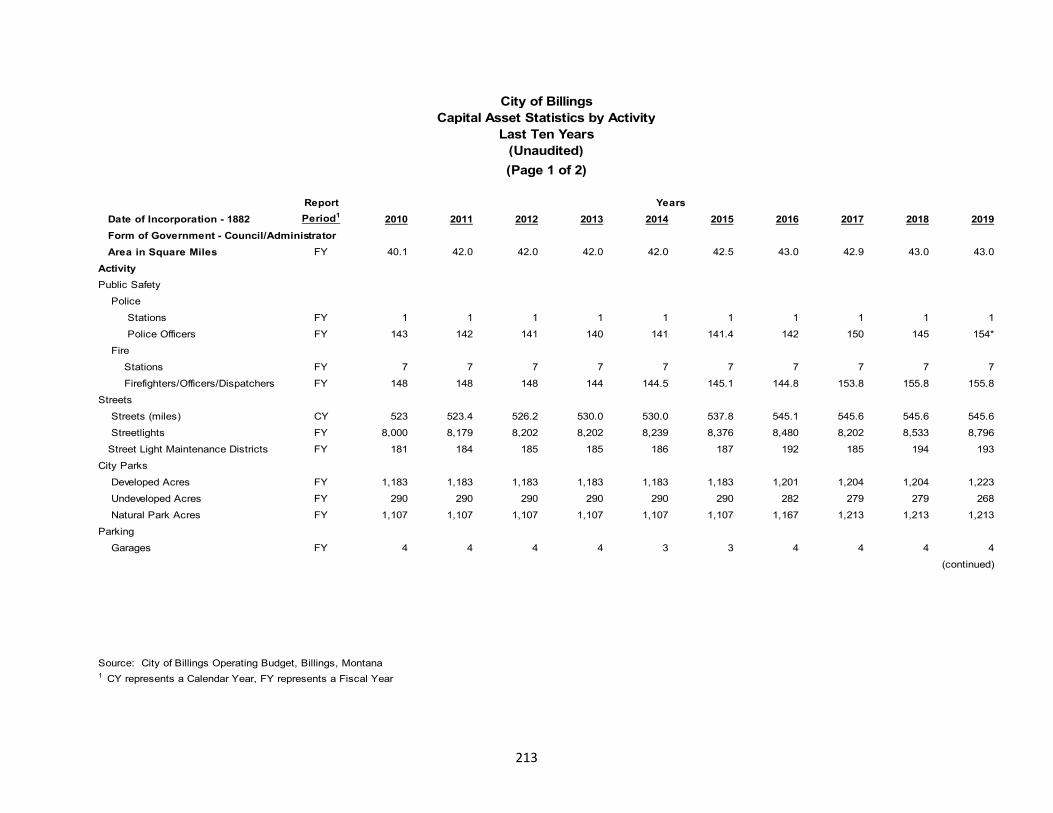
213
Report Date of Incorporation - 1882 Period1 2010 2011 2012 2013 2014 2015 2016 2017 2018 2019 Form of Government - Council/Administrator Area in Square Miles FY 40.1 42.0 42.0 42.0 42.0 42.5 43.0 42.9 43.0 43.0
ActivityPublic Safety Police Stations FY 1 1 1 1 1 1 1 1 1 1 Police Officers FY 143 142 141 140 141 141.4 142 150 145 154* Fire Stations FY 7 7 7 7 7 7 7 7 7 7 Firefighters/Officers/Dispatchers FY 148 148 148 144 144.5 145.1 144.8 153.8 155.8 155.8Streets Streets (miles) CY 523 523.4 526.2 530.0 530.0 537.8 545.1 545.6 545.6 545.6 Streetlights FY 8,000 8,179 8,202 8,202 8,239 8,376 8,480 8,202 8,533 8,796 Street Light Maintenance Districts FY 181 184 185 185 186 187 192 185 194 193City Parks Developed Acres FY 1,183 1,183 1,183 1,183 1,183 1,183 1,201 1,204 1,204 1,223 Undeveloped Acres FY 290 290 290 290 290 290 282 279 279 268 Natural Park Acres FY 1,107 1,107 1,107 1,107 1,107 1,107 1,167 1,213 1,213 1,213Parking Garages FY 4 4 4 4 3 3 4 4 4 4
(continued)
Source: City of Billings Operating Budget, Billings, Montana1 CY represents a Calendar Year, FY represents a Fiscal Year
City of BillingsCapital Asset Statistics by Activity
Last Ten Years(Unaudited)
Years
(Page 1 of 2)

214
ReportPeriod1 2010 2011 2012 2013 2014 2015 2016 2017 2018 2019
Water Water Mains (miles) FY 447 447 465 467 468 476 468 481 487 492 Fire Hydrants FY 4,145 4,204 4,211 4,242 4,357 4,392 4,405 4,211 4,517 4,645 Maximum Daily Capacity (millions of gallons) FY 60 60 60 60 60 60 60 60 60 60Wastewater Storm Sewers (miles) FY 149 149.2 149.2 149.2 213.8 232.0 219 264 270 272 Sanitary Sewers (miles) FY 466 473 461 486 488 497 494.5 499 502 507 Maximum Daily Capacity (millions of gallons) FY 26 26 26 26 26 26 26 26 26 30
Years
City of BillingsCapital Asset Statistics by Activity
Last Ten Years(Unaudited)(Page 2 of 2)

215
Construction 1
Commercial Residential 2
Number of Number of Bank DepositsFiscal Year Permits Value Permits Value (in thousands) 3 Property Value 4,6
2010 67 61,242,125 278 51,019,706 3,737,755 5,135,553,650 2011 99 69,548,962 230 47,522,702 3,799,467 6,306,916,152 2012 62 44,776,009 265 53,596,078 4,091,359 5,645,349,125 2013 74 109,879,817 9 434 97,412,566 4,315,837 5,836,600,658 2014 79 52,150,771 333 78,673,385 4,597,034 6,140,162,916 2015 76 75,258,982 419 100,954,761 4,886,513 6,350,470,915 2016 84 79,697,699 503 93,464,621 4,904,589 11,626,879,232 2017 67 78,801,883 294 69,702,982 5,019,961 11,743,014,785 2018 55 59,259,933 308 71,519,348 5,169,216 12,470,840,779 2019 69 67,294,314 304 77,974,865 5,207,328 12,559,773,345
Sources and other information:1 Building Department (new construction permits), City of Billings, Montana.2 Single family only.3 Individual banks and credit unions.4 State of Montana Department of Revenue.5 Commercial values increased although the number of permits issued decreased because a new commercial area is being developed, which includes hotels, a hospital, and an educational facility. Other large projects in the City include a new parking garage and trauma care center.6 For fiscal years beginning in 2006 the property value includes the Tax Increment District.7 Medical facilities had permits that totaled $27 million. Other large projects included a senior living center, motel, office building, retail stores, bank processing center and church additions.8 For Fiscal Year 2009 the State of Montana Department of Revenue did not include exempt properties.9 Commercial values increased due to several large projects, including a new library, parking garage, a large sporting goods retailer and a VA clinic.
Last Ten Fiscal Years(Unaudited)
CITY OF BILLINGS, MONTANAProperty Value, Construction and Bank Deposits
SINGLE AUDIT SECTION

INDEPENDENT AUDITORS' REPORT ON INTERNAL CONTROL OVER FINANCIAL REPORTINGAND ON COMPLIANCE AND OTHER MATTERS BASED ON AN AUDIT OF FINANCIAL STATEMENTS
PERFORMED IN ACCORDANCE WITH GOVERNMENT AUDITING STANDARDS
To the Honorable Mayor, Members of the City Council and and City AdministratorCity of Billings, Montana
We have audited, in accordance with auditing standards generally accepted in the United States of America and the standards applicable to financial audits contained inGovernment Auditing Standards, issued by the Comptroller General of the United States, the financial statements of the governmental activities, the business-typeactivities, each major fund, and the aggregate remaining fund information of the City of Billings, Montana as of and for the year ended June 30, 2019, and the relatednotes to the financial statements, which collectively comprise the City of Billings, Montana's basic financial statements and have issued our report thereon dated January22, 2020.
Internal Control Over Financial Reporting
In planning and performing our audit of the financial statements, we considered the City of Billings, Montana's internal control over financial reporting (internal control)to determine the audit procedures that are appropriate in the circumstances for the purpose of expressing our opinions on the financial statements, but not for the purposeof expressing an opinion on the effectiveness of the City of Billings, Montana's internal control. Accordingly, we do not express an opinion on the effectiveness of the Cityof Billings, Montana's internal control.
A deficiency in internal control exists when the design or operation of a control does not allow management or employees, in the normal course of performing theirassigned functions, to prevent, or detect and correct, misstatements on a timely basis. A material weakness is a deficiency, or a combination of deficiencies, in internalcontrol, such that there is a reasonable possibility that a material misstatement of the entity's financial statements will not be prevented, or detected and corrected, on atimely basis. A significant deficiency is a deficiency, or a combination of deficiencies, in internal control that is less severe than a material weakness, yet importantenough to merit attention by those charged with governance.
Our consideration of internal control was for the limited purpose described in the first paragraph of this section and was not designed to identify all deficiencies ininternal control that might be material weaknesses or significant deficiencies and therefore, material weaknesses or significant deficiencies may exist that have not beenidentified. Given these limitations, during our audit we did not identify any deficiencies in internal control that we consider to be material weaknesses. However, we dididentity a certain deficiency in internal control, described in the accompanying schedule of findings and questioned costs as finding 2019-1 that we consider to be asignificant deficiency.
216
501 Park Dr S / Great Falls, MT 59405
Office: (406) 761-2820 / Fax: (406) 761-2825 / jccscpa.com

Compliance and Other Matters
As part of obtaining reasonable assurance about whether the City of Billings, Montana's financial statements are free from material misstatement, we performed tests ofits compliance with certain provisions of laws, regulations, contracts, and grant agreements, noncompliance with which could have a direct and material effect on thedetermination of financial statement amounts. However, providing an opinion on compliance with those provisions was not an objective of our audit, and accordingly, wedo not express such an opinion. The results of our tests disclosed no instances of noncompliance or other matters that are required to be reported under GovernmentAuditing Standards.
The City of Billings, Montana's Response to Findings
The City of Billings, Montana's response to the finding identified in our audit is described in the accompanying schedule of findings and questioned costs. The City ofBillings, Montana's response was not subjected to the auditing procedures applied in the audit of the financial statements and, accordingly, we express no opinion on it.
Purpose of this Report
The purpose of this report is solely to describe the scope of our testing of internal control and compliance and the results of that testing, and not to provide an opinion onthe effectiveness of the entity’s internal control or on compliance. This report is an integral part of an audit performed in accordance with Government AuditingStandards in considering the entity’s internal control and compliance. Accordingly, this communication is not suitable for any other purpose.
Junkermier, Clark, Campanella, Stevens, P.C.
Great Falls, MontanaJanuary 22, 2020
217
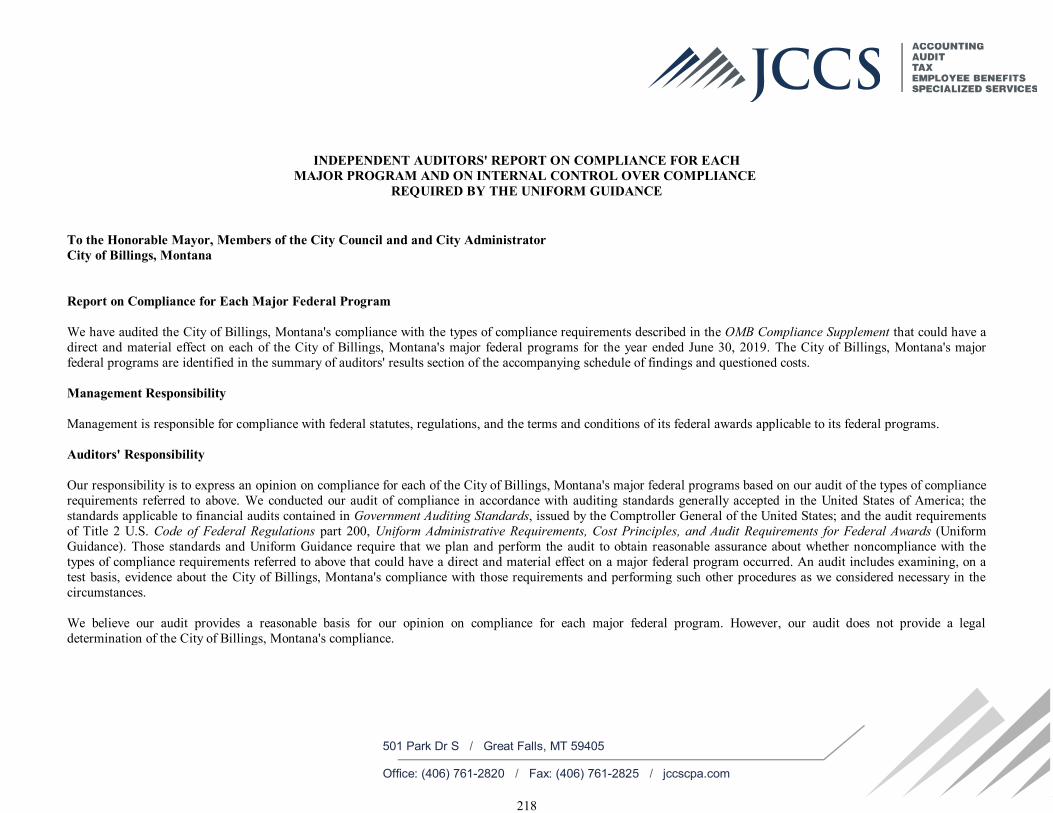
INDEPENDENT AUDITORS' REPORT ON COMPLIANCE FOR EACHMAJOR PROGRAM AND ON INTERNAL CONTROL OVER COMPLIANCE
REQUIRED BY THE UNIFORM GUIDANCE
To the Honorable Mayor, Members of the City Council and and City AdministratorCity of Billings, Montana
Report on Compliance for Each Major Federal Program
We have audited the City of Billings, Montana's compliance with the types of compliance requirements described in the OMB Compliance Supplement that could have adirect and material effect on each of the City of Billings, Montana's major federal programs for the year ended June 30, 2019. The City of Billings, Montana's majorfederal programs are identified in the summary of auditors' results section of the accompanying schedule of findings and questioned costs.
Management Responsibility
Management is responsible for compliance with federal statutes, regulations, and the terms and conditions of its federal awards applicable to its federal programs.
Auditors' Responsibility
Our responsibility is to express an opinion on compliance for each of the City of Billings, Montana's major federal programs based on our audit of the types of compliancerequirements referred to above. We conducted our audit of compliance in accordance with auditing standards generally accepted in the United States of America; thestandards applicable to financial audits contained in Government Auditing Standards, issued by the Comptroller General of the United States; and the audit requirementsof Title 2 U.S. Code of Federal Regulations part 200, Uniform Administrative Requirements, Cost Principles, and Audit Requirements for Federal Awards (UniformGuidance). Those standards and Uniform Guidance require that we plan and perform the audit to obtain reasonable assurance about whether noncompliance with thetypes of compliance requirements referred to above that could have a direct and material effect on a major federal program occurred. An audit includes examining, on atest basis, evidence about the City of Billings, Montana's compliance with those requirements and performing such other procedures as we considered necessary in thecircumstances.
We believe our audit provides a reasonable basis for our opinion on compliance for each major federal program. However, our audit does not provide a legaldetermination of the City of Billings, Montana's compliance.
218
501 Park Dr S / Great Falls, MT 59405
Office: (406) 761-2820 / Fax: (406) 761-2825 / jccscpa.com
Opinion on Each Major Federal Program
In our opinion, the City of Billings, Montana complied, in all material respects, with the types of compliance requirements referred to above that could have a direct andmaterial effect on each of its major federal programs for the year ended June 30, 2019.
Report on Internal Control Over Compliance
Management of the City of Billings, Montana, is responsible for establishing and maintaining effective internal control over compliance with the types of compliancerequirements referred to above. In planning and performing our audit of compliance, we considered the City of Billings, Montana's internal control over compliance withthe types of requirements that could have a direct and material effect on each major federal program to determine the auditing procedures that are appropriate in thecircumstances for the purpose of expressing an opinion on compliance for each major federal program and to test and report on internal control over compliance inaccordance with the Uniform Guidance, but not for the purpose of expressing an opinion on the effectiveness of internal control over compliance. Accordingly, we do notexpress an opinion on the effectiveness of the City of Billings, Montana's internal control over compliance.
A deficiency in internal control over compliance exists when the design or operation of a control over compliance does not allow management or employees, in thenormal course of performing their assigned functions, to prevent, or detect and correct, noncompliance with a type of compliance requirement of a federal program on atimely basis. A material weakness in internal control over compliance is a deficiency, or combination of deficiencies, in internal control over compliance, such that thereis a reasonable possibility that material noncompliance with a type of compliance requirement of a federal program will not be prevented, or detected and corrected, on atimely basis. A significant deficiency in internal control over compliance is a deficiency, or a combination of deficiencies, in internal control over compliance with a typeof compliance requirement of a federal program that is less severe than a material weakness in internal control over compliance, yet important enough to merit attentionby those charged with governance.
Our consideration of internal control over compliance was for the limited purpose described in the first paragraph of this section and was not designed to identify alldeficiencies in internal control over compliance that might be material weaknesses or significant deficiencies and therefore, material weaknesses or significantdeficiencies may exist that have not been identified. We did not identify any deficiencies in internal control over compliance that we consider to be material weaknesses.However, we did identity a certain deficiency in internal control over compliance, described in the accompanying schedule of findings and questioned costs as finding2019-1 that we consider to be a significant deficiency.
The City of Billings, Montana's Response to Findings
The City of Billings, Montana’s response to the internal control over compliance finding identified in our audit is described in the accompanying schedule of findings andquestioned costs. The City of Billings, Montana’s response was not subjected to the auditing procedures applied in the audit of compliance and, accordingly, we expressno opinion on the response.
The purpose of this report on internal control over compliance is solely to describe the scope of our testing of internal control over compliance and the results of thattesting based on the requirements of the Uniform Guidance. Accordingly, this report is not suitable for any other purpose.
Junkermier, Clark, Campanella, Stevens, P.C.
Great Falls, MontanaJanuary 22, 2020
219
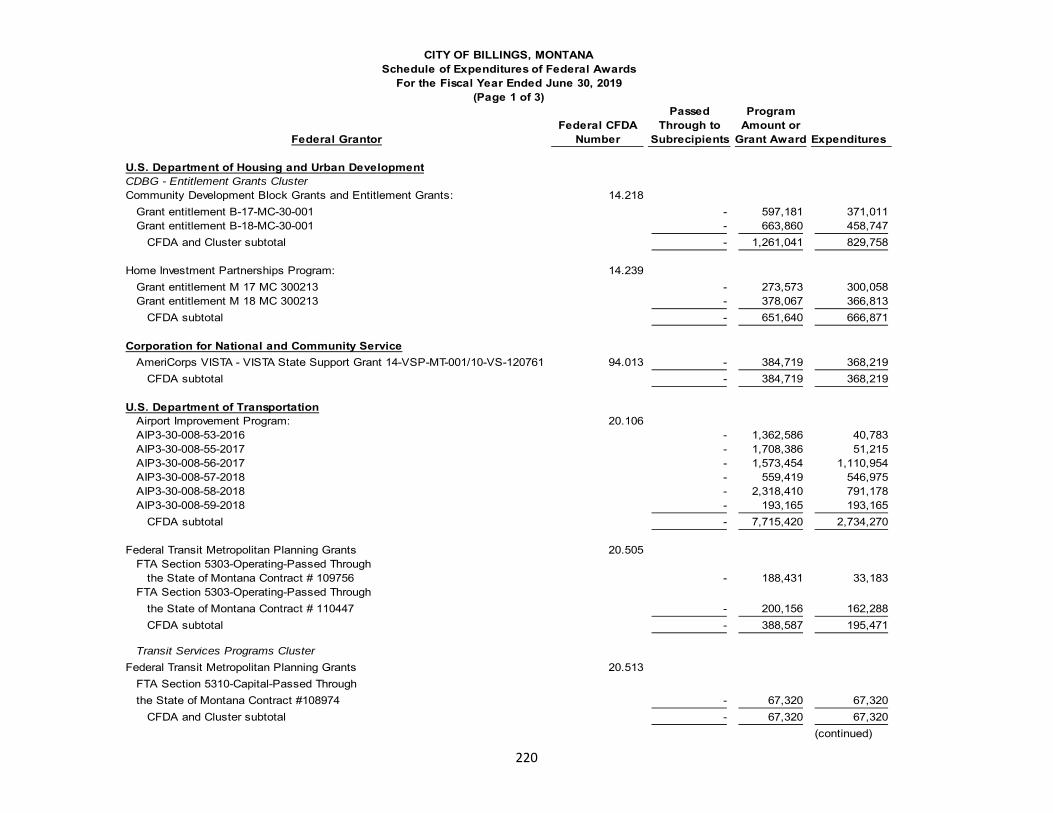
220
Passed ProgramFederal CFDA Through to Amount or
Federal Grantor Number Subrecipients Grant Award Expenditures U.S. Department of Housing and Urban DevelopmentCDBG - Entitlement Grants ClusterCommunity Development Block Grants and Entitlement Grants: 14.218
Grant entitlement B-17-MC-30-001 - 597,181 371,011 Grant entitlement B-18-MC-30-001 - 663,860 458,747
CFDA and Cluster subtotal - 1,261,041 829,758
Home Investment Partnerships Program: 14.239Grant entitlement M 17 MC 300213 - 273,573 300,058 Grant entitlement M 18 MC 300213 - 378,067 366,813
CFDA subtotal - 651,640 666,871
Corporation for National and Community Service AmeriCorps VISTA - VISTA State Support Grant 14-VSP-MT-001/10-VS-120761 94.013 - 384,719 368,219
CFDA subtotal - 384,719 368,219
U.S. Department of Transportation Airport Improvement Program: 20.106AIP3-30-008-53-2016 - 1,362,586 40,783 AIP3-30-008-55-2017 - 1,708,386 51,215 AIP3-30-008-56-2017 - 1,573,454 1,110,954 AIP3-30-008-57-2018 - 559,419 546,975 AIP3-30-008-58-2018 - 2,318,410 791,178 AIP3-30-008-59-2018 - 193,165 193,165
CFDA subtotal - 7,715,420 2,734,270
Federal Transit Metropolitan Planning Grants 20.505FTA Section 5303-Operating-Passed Through
the State of Montana Contract # 109756 - 188,431 33,183 FTA Section 5303-Operating-Passed Through
the State of Montana Contract # 110447 - 200,156 162,288 CFDA subtotal - 388,587 195,471
Transit Services Programs ClusterFederal Transit Metropolitan Planning Grants 20.513
FTA Section 5310-Capital-Passed Through the State of Montana Contract #108974 - 67,320 67,320
CFDA and Cluster subtotal - 67,320 67,320 (continued)
CITY OF BILLINGS, MONTANASchedule of Expenditures of Federal Awards
For the Fiscal Year Ended June 30, 2019(Page 1 of 3)
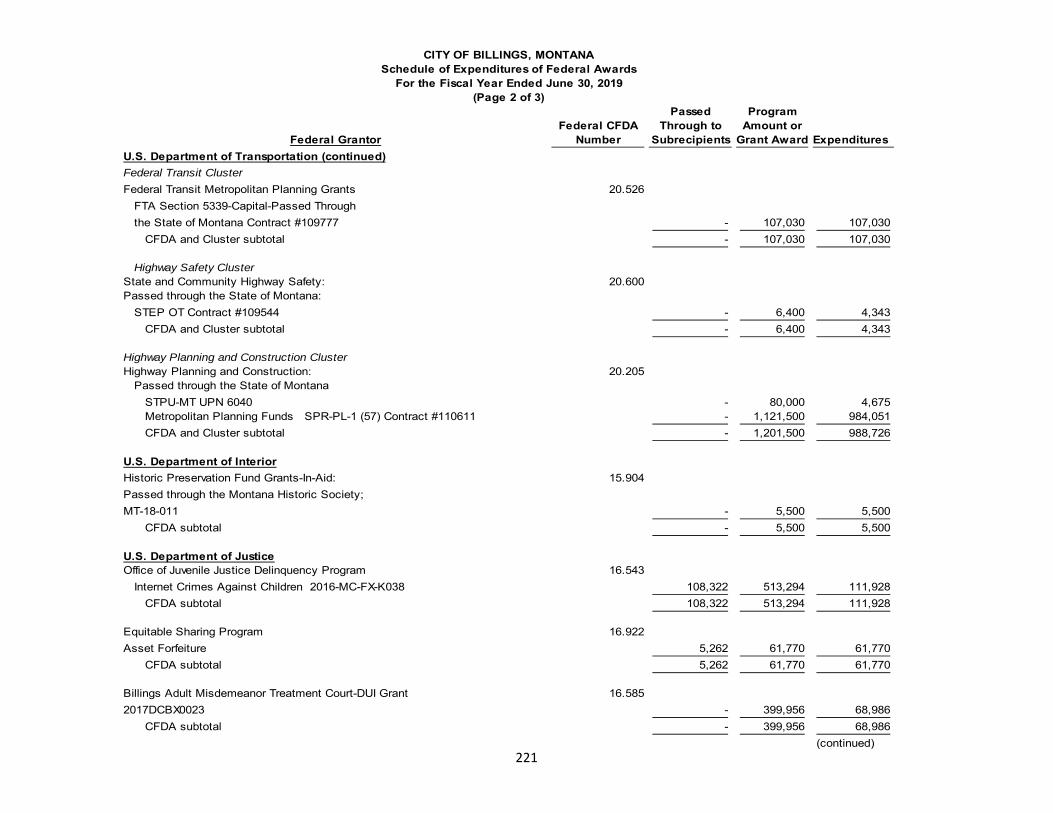
221
Passed ProgramFederal CFDA Through to Amount or
Federal Grantor Number Subrecipients Grant Award ExpendituresU.S. Department of Transportation (continued)Federal Transit ClusterFederal Transit Metropolitan Planning Grants 20.526
FTA Section 5339-Capital-Passed Through the State of Montana Contract #109777 - 107,030 107,030
CFDA and Cluster subtotal - 107,030 107,030
Highway Safety ClusterState and Community Highway Safety: 20.600Passed through the State of Montana:
STEP OT Contract #109544 - 6,400 4,343 CFDA and Cluster subtotal - 6,400 4,343
Highway Planning and Construction ClusterHighway Planning and Construction: 20.205
Passed through the State of Montana STPU-MT UPN 6040 - 80,000 4,675 Metropolitan Planning Funds SPR-PL-1 (57) Contract #110611 - 1,121,500 984,051 CFDA and Cluster subtotal - 1,201,500 988,726
U.S. Department of InteriorHistoric Preservation Fund Grants-In-Aid: 15.904Passed through the Montana Historic Society;MT-18-011 - 5,500 5,500
CFDA subtotal - 5,500 5,500
U.S. Department of JusticeOffice of Juvenile Justice Delinquency Program 16.543 Internet Crimes Against Children 2016-MC-FX-K038 108,322 513,294 111,928
CFDA subtotal 108,322 513,294 111,928
Equitable Sharing Program 16.922Asset Forfeiture 5,262 61,770 61,770
CFDA subtotal 5,262 61,770 61,770
Billings Adult Misdemeanor Treatment Court-DUI Grant 16.5852017DCBX0023 - 399,956 68,986
CFDA subtotal - 399,956 68,986 (continued)
CITY OF BILLINGS, MONTANASchedule of Expenditures of Federal Awards
For the Fiscal Year Ended June 30, 2019(Page 2 of 3)

222
Passed ProgramFederal CFDA Through to Amount or
Federal Grantor Number Subrecipients Grant Award ExpendituresU.S. Department of Justice (continued)Billings Supportive Housing & Reentry Project passed through 16.U01State of Montana Board of Crime Control
Supportive Housing 18-HG01-92216 125,873 198,065 125,873 CFDA subtotal 125,873 198,065 125,873
Violence Against Women Formula Grants passed through 16.588State of Montana Board of Crime Control
Domestic Violence Unit 18-W03-92246 - 34,000 25,279 Domestic Violence Unit 17-W02-92092 - 24,877 7,350
CFDA subtotal - 58,877 32,629
Justice Assistance Grants: 16.7382016-DJ-BX-0844 - 75,590 41,322 2015-DJ-BX-0684 - 77,820 24,552 2017-DJ-BX-0534 - 86,119 3,501
CFDA subtotal - 239,529 69,375
Billings Adult Misdemeanor Treatment Court-Mental Health Grant 16.7452016-DC-BX-0099 - 349,253 57,422
CFDA subtotal - 349,253 57,422
Department of Health and Human ServicesSubstance Abuse and Mental Health Services 93.243
Billings Adult Misdemeanor Drug Court-SAMHSA SAMHSA 12TI24208A - 971,630 108,012 CFDA subtotal - 971,630 108,012
Department of Homeland SecurityHomeland Security Grant Program 97.067 EMW-2018-SS-00021 - 89,982 71,927
CFDA subtotal - 89,982 71,927
Office of National Drug Control PolicyHigh Intensity Drug Traffic Area Award: 95.0012018 HIDTA #G18RM0038A - 223,812 87,630 2019 HIDTA #G19RM0038A - 231,796 142,669
CFDA subtotal - 455,608 230,299
239,457 15,127,121 6,905,729
CITY OF BILLINGS, MONTANASchedule of Expenditures of Federal Awards
For the Fiscal Year Ended June 30, 2019(Page 3 of 3)

223
CITY OF BILLINGS, MONTANA Notes to the Schedule of Expenditures of Federal Awards
Year Ended June 30, 2019
(1) Basis of Presentation
The accompanying Schedule of Expenditures of Federal Awards includes the federal grant activity of the City of Billings, Montana for the year ended June 30, 2019. The City’s reporting entity is described in Note 1 in the City’s basic financial statements. All federal financial assistance received directly from federal agencies, as well as federal financial assistance passed through other governmental agencies, is included in the schedule. The information in this schedule is presented in accordance with requirements of Title 2 U.S. Code of Federal Regulations Part 200, Uniform Administrative Requirements, Cost Principles, and Audit Requirements for Federal Awards (Uniform Guidance). Therefore, some amounts presented in this schedule may differ from amounts presented in, or used in the presentation of, the basic financial statements.
(2) Significant Accounting Policies
Amounts reported in the schedule of expenditures of federal awards are recognized on the modified accrual basis when they become a demand on current available federal resources and eligibility requirements are met, or on the accrual basis, at the time liabilities are incurred and all eligibility requirements are met, depending on the basis of accounting used by the respective fund. Such expenditures are recognized following the cost principles in the Uniform Guidance wherein certain types of expenditures are not allowable or are limited as to reimbursement.
(3) Indirect Cost Rate
The City has elected not to use the 10% De Minimis indirect cost rate allowed under the Uniform Guidance.

CITY OF BILLINGS, MONTANASCHEDULE OF FINDINGS AND QUESTIONED COSTS
JUNE 30, 2019
Financial Statements
Type of auditors' report issued Unmodified
Internal control over financial reporting:
Material weakness(es) identified? NoSignificant deficiencies identified not considered to be material weakness? Yes
Non-compliance material to financial statements noted? No
Federal Awards
Internal control over major programs:
Material weakness(es) identified? NoSignificant deficiencies identified not considered to be material weakness? Yes
Type of auditor's report issued on compliance for major programs Unmodified
Audit findings that are required to be reported in accordance with the Uniform GuidanceSection 200.516 in Part III are reported in this schedule. Yes
Identification of major programs:
Community Development Block Grants and Entitlement Grants - CFDA 14.218Home Investment Partnerships Program- CFDA 14.239Airport Improvement Program- CFDA 20.106
Dollar threshold used to distinguish between Type A and Type B $750,000
Auditee qualified as low-risk auditee? Yes
224

CITY OF BILLINGS, MONTANASCHEDULE OF FINDINGS AND QUESTIONED COSTS
JUNE 30, 2019
FINDINGS:
Program Income not Included on SEFA (Significant Deficiency)
2019-1 Criteria: Program income is required to be included in the Schedule of Expenditures of Federal Awards (SEFA) for a complete presentation andfor purposes of determining major programs.
Condition: The City did not identify and include program income on the SEFA provided for audit.
Effect: The SEFA was misstated, initial single audit procedures had to be reperformed, and expansion of major program testing was required.
Cause: The City's compliance responsibility is decentralized among various departments. While personnel in the respective departments areskilled at managing the funds as required by the federal government, they often do not understand the full related reporting requirements for theCAFR and SEFA. Those responsibilities fall to personnel in the Finance department, who may not be familiar enough with program operationsand how they affect reporting requirements.
Recommendation: The City should implement specific federal funds training for all Finance staff involved in the reporting process in order toobtain a greater understanding of the reporting requirements.
Management Response: The City agrees with the finding and will identify training for Finance staff to attend.
225

CITY OF BILLINGS, MONTANASUMMARY SCHEDULE OF PRIOR AUDIT FINDINGS
JUNE 30, 2019
FINDINGS - NONE
226

City of Billings, Montana

9-1-1Landline
MSAG & ALITCS
IntradoCellPhone& VOIP ALI
NortelPBX
ALI Links (2)
!
ThirdSignal.comMarch 2014
TTY-TDD
BusinessOffice
Residential
PayPhone
PBX
Billings City / County 9-1-1 9-1-1 Location: Triangulation
Out-of-ServiceCellphones
GPS
Billings 9-1-1 SelectiveRouter
New WorldMDTs
BillingsCenturyLink
Central Office
CountyCentral Offices
9-1-1Calls
GPS
Wireless MobileSwitching
Center (MSC)
Internet9-1-1
Smart Phones9-1-1 Apps
Voice Over IP:Vonage
Magic Jack
CellphoneExtenders
InternetAdmin Line
(406) 657-82003 Lines
9-1-1Calls
9-1-1Calls
9-1-1 Call-Transfer Center
GPS TrackingDevices &
Satellite Phones
AutomotiveTelematics
Alarm MonitoringCompanies
9-1-1Calls
Cellphone 9-1-1
9-1-1 Transfer ServicesInternet-Based 9-1-1
Landline 9-1-1
NewWorldCAD
BullBerryMAP
ALISplitter
Cassidian9-1-1
Stancil
VLRs
Exacom
9-1-1 Stations Layout
Net Clock13:08
CassidianRadio
Cassidian9-1-1
New WorldCAD & MAPCJIN
Station StatusBusy9-1-1
Radio
9-1-1 Workstation
DispatcherTraining & QC
PanicAlarms
MSAG & ALIUpdates
RecordsRetention
Policies &Procedures
NCICCJIN
CrimeStoppers
ElevatorPhones
Life Flight
Billings 9-1-1 Dispatch Center & P25 Control Site
Supervisor
SheriffStation 1 Station 2 Station 3 Station 4
Station 5 Station 7Station 6
9-1-1Fire-EMS
Police 2Police
9-1-1
(BullBerry Map)
EmergencyOperations
Center
Station 8
(In Basement)
NetClocks
CJINJBC1-4
MidRivers
NeMontTriangle
AT&TCellularOne
MidRiversSagebrush
Verizon
9-1-1Location:
GPS
VHF Radio154.370 / 158.835Motorola Com 750
UHF Radio458.725 / 453.725
MidlandVHF Radio
153.770 / 154.340GE Master II
VHF Radio159.210 / 156.210MotorolaXTL 5000
VHF Radio158.910 / 154.785MotorolaXTL 5000
VHF Radio159.300 / 155.760MotorolaXTL 5000
2 Ch UHF Radio466.475 / 461.475Midland 70-530B
UHF Radio(Frequency TBD)Kenwood TK860
UHF Radio(Frequency TBD)Kenwood TK860
4 Dances 800 Mhz
VHF Radio158.865 / 155.880
EFJ AscendVHF Radio
158.865 / 155.880EFJ Ascend
LL I/F4-wire leased lineMidRivers TelcoYellowstone Co DES
& Rural Fire2 Tone Page & Voice
County Sheriff
Interoperability Equipment
Outpost 1(2 Ch)
Outpost 2(2 Ch)
Outpost 3(2 Ch)
TAG 1(5 Ch)
TAG 2(5 Ch)
County DES 1
County DES 2
County DES 3
FD Page 2Tone
Old Fire 1(Fire 2)
Street Dept
County Sheriff 1
County Sheriff 2
County Sheriff 3
Stete MA Silver
Stete MA Blue
800 MhzSimplex 1
800 MhzSimplex 2
T1 I/F
T1 I/F
MWR
Police 800Mhz RadioXTL 5000
AirPort: FireVHF Paging
4 Dances: Police 800Fire 800
Custer: DESRepeater
Greeno: SOWest RptrDES East
Dunn Mountain: SO West Rptr
Cassidian P25Radio System
800Mhz
MedicalAlerts+
9-1-1 Lines6 Trunks3 Protected
BackupGenerator
FacilityBatteries
Power ManagementUPSs
DieselFuel
Twenty FirstCentury Reverse9-1-1 Services
New WorldCAD
Internet
BullBerry Map
Cassidian9-1-1 & ALI Radio
Cassidian
MT CJINNCIC
1 2
3
4
5
6
7
8
9
10
11
12
13
14
15
1617
1819 20
21
22
23
24
25
26
27
28
29
30
31
32 33
3435
36 37
38
39
40
41
42
4344 45
46 47 48
49
50
51
5253
54 55
56
57
58
59
60
6162
63 6465 66 67
68
69
70
71
72
73
74
75
76
77
78
79
80
81
13
121 (2201) 123 (2203)
126 (2206)125 (2205)
122 (2202)
127 (2207)
124 (2204)
128 (2208)
Fox Radio Site: BFOX800 Mhz Repeaters
Site Switchwith T1 Link
Backup Master Repeater Site
Landfill Radio Site: LNDF800 Mhz Repeaters
Site SwitchTAG & T1 Link
Street Dept UHF RepeaterGold Channel Base RadioFBI Repeater: Standalone
Swords Radio Site: SWDP
Police 800 Interop Repeater
800 Mhz RepeatersControllers & TAGs w/ mw Link
FBI Repeater: Standalone
Sheriff Lockwood RepeaterPD1 Patch: VHF Rebroadcast
Q-21-cam