caixabank - the leading force in spanish retail banking · peer group includes: bbva, bkia, popular...
TRANSCRIPT

CaixaBank - the leading force in Spanish retail banking May 2012 Corporate presentation

2
Important note
The purpose of this presentation is purely informative. In particular, regarding the data provided by third parties, neither CaixaBank, S.A. (“CaixaBank”) as a legal entity, nor any of its administrators, directors or employees, is obliged, either explicitly or implicitly, to vouch that these contents are exact, accurate, comprehensive or complete, nor to keep them updated, nor to correct them in the case that any deficiency, error or omission were to be detected. Moreover, in reproducing these contents in any medium, CaixaBank may introduce any changes it deems suitable, may omit partially or completely any of the elementsof this document, and in the case of any deviation between such a version and this one, assumes no liability for any discrepancy.
This document has at no time been submitted to the Comisión Nacional del Mercado de Valores (CNMV – the Spanish Stock Markets regulatory body) for approval or scrutiny. In all cases its contents are regulated by the Spanish law applicable at time of writing, and it is not addressed to any person or legal entity located in any other jurisdiction. For this reason it may not necessarily comply with the prevailing norms or legal requisites as required in other jurisdictions.
This presentation on no account should be construed as a service of financial analysis or advice, nor does it aim to offer any kind of financial product or service. In particular, it is expressly remarked here that no information herein contained should be taken as a guarantee of future performance or results.
Without prejudice to legal requirements, or to any limitations imposed by CaixaBank that may be applicable, permission is hereby expressly refused for any type of use or exploitation of the contents of this presentation, and for any use of the signs, trademarks and logotypes which it contains. This prohibition extends to any kind of reproduction, distribution, transmission to third parties, public communication or conversion into any other medium, for commercial purposes, without the previous express permission of CaixaBank and/or other respective proprietary title holders. Any failure to observe this restriction may constitute a legal infraction which may be sanctioned by the prevailing laws in such cases.

• 3rd financial group in Spain • Assets: €277.6 bn • Business volume: €429.5bn (€183.9bn loans + €245.6bn customer funds)
CaixaBank at a glance
• 10.4 million customers serviced by a segmented business model • Multi-channel platform: branches (5,172); ATMs (7,979); online and mobile banking • Excellence in customer service and highly-rated brand
• Diversified and good quality loan portfolio • NPL Ratio: 5.25%; Coverage ratio 61% (138% with mortgage guarantees)
• Comfortable liquidity position: €29.4 bn • Solid base of capital: core capital of 12.4% (BIS II), ~ 10.5% Core capital (BIS III,
fully phased-in)
Figures as of March 2012
A flagship institution
Ranked 1st in retail banking in Spain
Sound Risk profile
Robust financial metrics
3
1. CaixaBank overview

“la Caixa” Group Reorganisation
4
Real Estate assets
New structure
81.1%1
Retail Banking & Insurance Other industrial
portfolio
(former Criteria, Listed)
Repsol + Telefonica
100%
(1) Does not take into account the mandatory convertible bond of €1.5 Bn (2) Book Value as of June 2011
International Banking portfolio
Welfare Projects
CaixaBank Book Value2: €21.6 bn
CaixaHolding Book Value2: €10.3 bn
(Not listed)

5
Strategic rationale
Consolidates CaixaBank’s leadership position in Spanish banking
Increases number of core markets with dominant position (#1 player in 5 regions)
Leads to c. 15% market share in key retail products
€540 M of expected annual cost synergies by 2014; 12.5% of total combined costs
NPV of cost synergies of €1.8 Bn
€1.1 Bn of net restructuring costs
Material income synergies to be expected
€3.41 bn business combination fair value adjustments, implying a zero cost of risk for the acquired loan book.
The combined entity will have 82% NPL coverage
Sound capital (>10% FY12E Core Capital) and liquidity position
Solid balance sheet metrics maintained
Improves competitive
position
Enhances profitability
(1) Includes €2.8 bn of adjustments in the loan portfolio, €0.3 bn of real estate adjustments and €0.3 bn of other adjustments
EPS accretive from 2013 and +20% by 2014
Strengthens CaixaBank dividend policy in the medium term
Sustainable RoE improvement (PF 2011 ROE of 7% vs. 5% CABK)
ROIC ~ 20% by 2014
Increases Shareholder
value
Integration agreement with Banca Cívica

Significant asset clean-up to result from the transaction
6 6
As a result, the combined entity will have a sound balance sheet, with 82% NPL coverage level, significantly above the 58.2% sector average
Fair value adjustment – €3.4 Bn
A fair value adjustment will be made against BCIV’s reserves:
No P&L impact: offset against any potential gain arising from acquiring BCIV below book value
This significant effort will imply a reduction in future provisioning requirements, leading to related improvements in future net profits
These adjustments are on top of €2Bn fair value adjustments of BCIV made July 2011.
2.8
0.30.3
Loan portfolio
Real Estate1
Other
(1) Includes €0.2 bn of adjustments related to foreclosed assets + €0.1 bn of other adjustments
Balance Sheet: Integration agreement with Banca Cívica

128%
82%67%
60% 54% 48% 45% 45% 44%
BCIV PF CABK + BCIV PF
BCIV CABK Peer 1 Peer 2 Peer 3 Peer 4 Peer 5
7
The combination results in one of the best levels of asset quality
NPL loans ratio well below the sector average
4.9% 4.9%5.5% 5.5%
5.9% 6.0%
7.4% 7.6%
CABK Peer 1 CABK + BCIV PF
Peer 2 Peer 3 Peer 4 BCIV Peer 5
Sector Average: 7.62%
NPL coverage significantly above the sector average
Sector Average: 58.2%
Peer group includes: BBVA, BKIA, Popular + Pastor, Sabadell and Grupo Santander Spain Banca Cívica pro forma for the extraordinary provisioning Information as of December 2011 except for NPL loans of Popular + Pastor PF (July 2011) . BBVA excluding Unnim & Sabadell excluding CAM (NPL loans and coverage are not homogeneous due to APS – Asset Protection Scheme)
NPL loans (%) NPL coverage (%)
Balance Sheet: Integration agreement with Banca Cívica

Banca Cívica was Spain’s 10th largest financial institution based on total assets
Banca Cívica: key figures
Resulting from the merger of Caja Navarra, CajaSol, Caja Burgos and Caja Canarias
45%
11%
12%
16%
16%
Free float
Caja Canarias
CAN
CajaSol
Caja de Burgos Shareholders agreement
55%
Shareholding structure
Assets
Net loans
Deposits1
Shareholder’s funds
Core Capital2
Branches
Customers
Employees
€72 Bn
€49 Bn
€38 Bn
€2.9 Bn
9.0%
1,394
3.9 M
7,800
Information as of December 2011 (1) Excluding “cédulas multicedentes” (2) FROB included
8
2.3% market share by total assets
Integration agreement with Banca Cívica

A market leader in complementary regions
9 Information as of December 2011 Source FRS
Leading market shares in core regions Market share (%)
3.1% market share in deposits and
loans
Branch network focused in core regions Branches by CCAA
174
634
125
206
1,394 branches, o/w 80% in core regions
25.7
16.0
10.1
4.5
34.5
17.6
8.7 7.1
40.4
20.6
12.4
7.2
Navarra Canarias Andalucía C. León
Branches Loans Deposits
Integration agreement with Banca Cívica

A retail oriented bank with 3.9 million customers
49% 40%
11%
Demand deposits
Other
Time deposits
In % In %
46%
17%
25% Corporate & SMEs
Consumer
Retail mortgages
8%
RE Developers & construction
10
Total deposits1 €38 bn Total net loans €49 bn
Deposits breakdown Loan book breakdown
Information as of December 2011 (1) Excluding “cédulas multicedentes”
4%
Public sector
Integration agreement with Banca Cívica
11
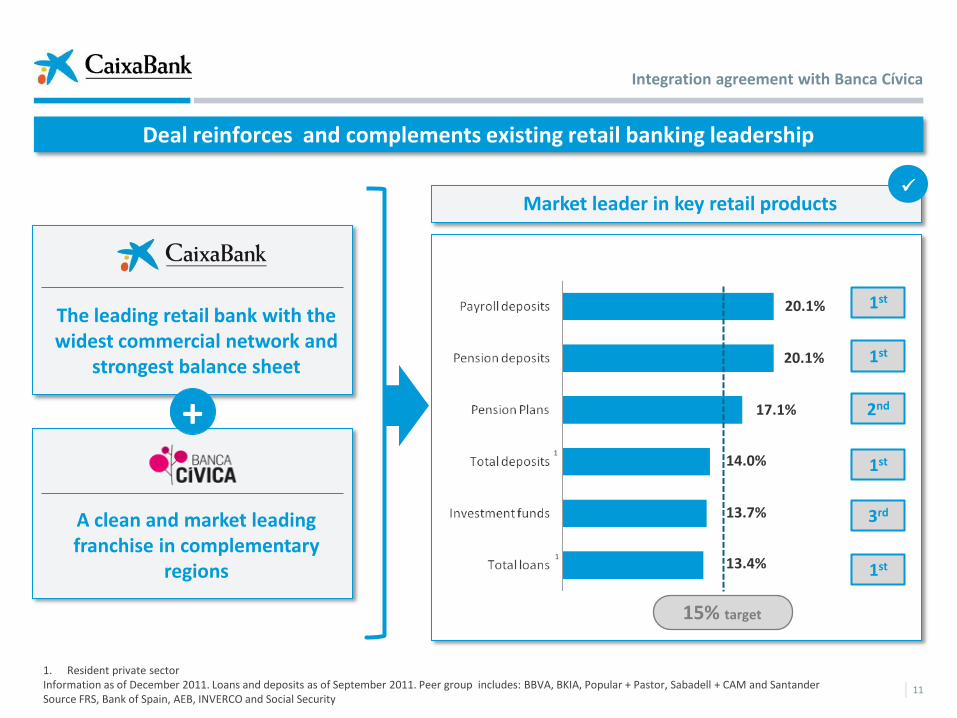
Deal reinforces and complements existing retail banking leadership
A clean and market leading franchise in complementary
regions
Market leader in key retail products
1. Resident private sector Information as of December 2011. Loans and deposits as of September 2011. Peer group includes: BBVA, BKIA, Popular + Pastor, Sabadell + CAM and Santander Source FRS, Bank of Spain, AEB, INVERCO and Social Security
The leading retail bank with the widest commercial network and
strongest balance sheet
+
15% target
20.1%
20.1%
17.1%
14.0%
13.7%
13.4%
1st
1st
2nd
1st
3rd
1st
1
1
Integration agreement with Banca Cívica

12
Deal consolidates retail banking leadership across key performance indicators
Total assets - € Bn
Deposits(1) - € Bn
Net loans to customers - € Bn
BCIV: 72
CABK: 270
342 339 338
306
171 161
1st
BCIV: 50
CABK: 129
179 174 155
134 108
96
1st
BCIV: 49
CABK: 182
231 227 218 186
120 118
1st
Market share by branches(2) (%)
BCIV: 3.5%
CABK: 12.7%
16.2%
11.3%
9.7% 8.9% 6.0% 5.6%
1st
Information as of December 2011. Peer group includes: BBVA (Spain) + Unnim, BKIA, Popular + Pastor, Sabadell + CAM and Grupo Santander Spain (1) Deposits as shown in financial reports (2) Market share information based on branches as of December 11 (CABK + BCIV – before network optimisation)
Integration agreement with Banca Cívica

Credit quality still mostly driven by developer book
13 (1) Includes Servihabitat and other subsidiaries of Caja de Ahorros y Pensiones de Barcelona, CaixaBank’s major shareholder (2) Includes contingent liabilities
Increase in total NPL ratio mostly explained by real estate developers
Limited deterioration in other segments; in line with expectations
Loans to individuals
Residential mortgages
Consumer credit
Loans to businesses
Corporate and SMEs
Real estate developers
ServiHabitat and other “la Caixa” Group subs1
Public sector
Total loans
Loan book and NPL by segments
93.7
69.7
24.0
81.0
55.5
22.4
3.1
11.3
186.0
1.82%
1.48%
2.81%
9.54%
3.49%
25.84%
0.00%
0.40%
4.90%
€bn NPL ratio2
31st December 2011
92.5
69.1
23.4
79.8
55.0
21.7
3.1
11.6
183.9
1.95%
1.57%
3.07%
10.37%
3.93%
28.16%
0.00%
0.66%
5.25%
€bn NPL ratio2
31st March 2012
Solid balance sheet

Uptick in NPLs in line with 2011 trends but supported by higher coverage
14
NPLs and NPL ratio (€MM) Provisioning effort to reinforce high NPL coverage
NPLs
NPL ratio
NPL Coverage ratio
Credit Provisions
Sector:
8.16% (Feb’12)
Sector:
57% (Feb’12)
(1) €1.9 bn additions and €1.3 bn derecognitions from NPLs, of which €156 M correspond to loan write offs
(1)
Solid balance sheet

Exposure to real estate developers continues to decline
15
28% reduction in balance of real estate developer loans since December 2008
Real estate developer loan breakdown (€ bn)
€12.7bn
€2.9bn
€6.1bn
(1) Source: Bank of Spain (Table 4.18 “Actividades inmobiliarias”) (2) Impacted by the acquisition of Caixa Girona
€21.7 bn Coverage (%)
€4.5 bn provisions
for RE developers
Provisions required by Royal Decree 2/12 reinforce RE coverage ratios
Real estate developer loan evolution: CaixaBank vs sector1
-7%
-28%
Performing
Substandard
NPL
7.0%
41.1%
40.2%
Solid balance sheet

Building Center1 Repossessed real estate assets
Intense commercial activity with low losses on sales prove fair assets valuations
16
31st March
Net
amount %
coverage
RE assets from loans to construction and RE development
1,200 37%
Finished buildings 884 25%
Buildings under construction 54 44%
Land 262 59%
RE assets from mortgage loans to households
343 30%
Other repossessed assets 31 21%
(1) The real estate holding company of CaixaBank, S.A. (2) Data from Dec 31st 2011 to April 5th 2012 (3) Calculated as selling price minus direct selling and administrative expenses (4) Total stock of rental assets: €141 M for Building Center
Inflows of foreclosures in line with aggressive management of developer book
1,574
36% coverage of portfolio (inc. write-downs)
All assets appraised in 2011
Limited land exposure
36%
16
Building Center 2012 commercial activity2
TOTAL (NET)
Sales
€318M
Rental Assets4
Commitments
€M
4.9% Yield on
rental sales
-4.2% Margin on
sales3 1,707 units
Solid balance sheet

17
Real estate: problematic assets and total exposure coverage
Real Estate problematic assets coverage Total Real Estate exposure coverage
Total assets
Foreclosed1
NPLs
Substandard
Performing
RE provisions
Foreclosed
NPLs
Substandard
Performing
Total RE exposure coverage
RE problematic assets
Foreclosed1
NPLs
Substandard
RE provisions
Foreclosed
NPLs
Substandard
Performing
RE problematic exposure coverage
24.1
2.4
6.1
2.9
12.7
5.3
0.9
2.4
1.2
0.8
22%
24.3
1.8
5.8
3.0
13.7
2.9
0.6
1.8
0.5
0.0
12%2
11.4
2.4
6.1
2.9
10.6
1.8
5.8
3.0
5.3
0.9
2.4
1.2
0.8
2.9
0.6
1.8
0.5
0.0
27%2
Dec’11 Mar’12 Billion euros Dec’11 Mar’12 Billion euros
1. Loan equivalent 2. Does not include generic provision
47% 22%
Solid balance sheet
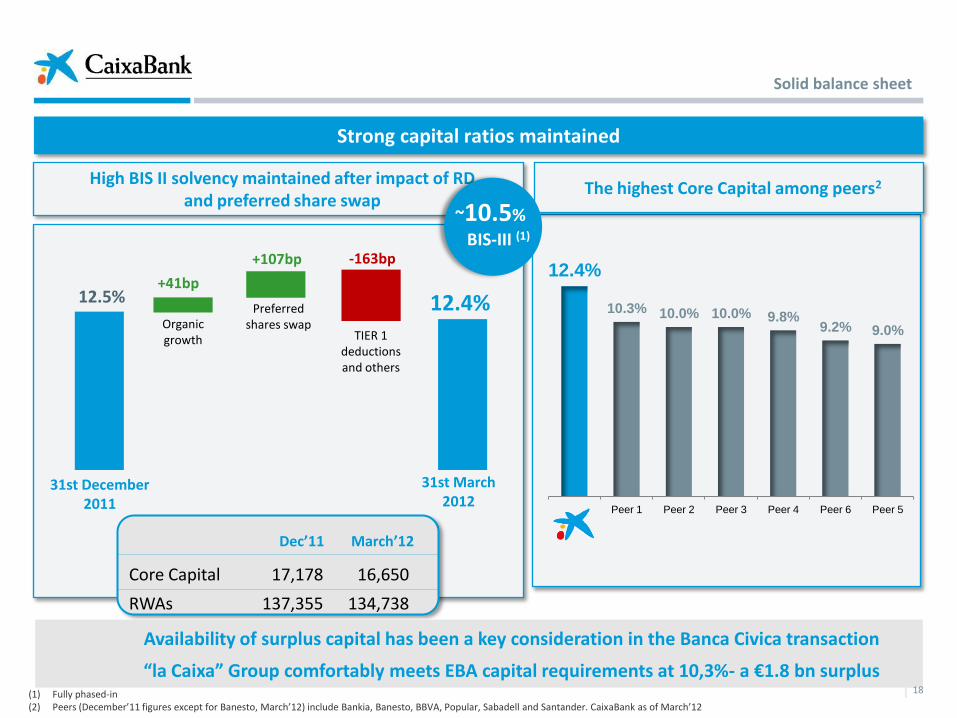
Strong capital ratios maintained
18 (1) Fully phased-in (2) Peers (December’11 figures except for Banesto, March’12) include Bankia, Banesto, BBVA, Popular, Sabadell and Santander. CaixaBank as of March’12
Availability of surplus capital has been a key consideration in the Banca Civica transaction
“la Caixa” Group comfortably meets EBA capital requirements at 10,3%- a €1.8 bn surplus
17,178
137,355
31st December 2011
31st March 2012
Organic growth
Preferred shares swap
+41bp
+107bp
12.5% 12.4% ~10%
BIS-III (1)
Dec’11
16,650
134,738
March’12
Core Capital
RWAs
The highest Core Capital among peers2 High BIS II solvency maintained after impact of RD
and preferred share swap
TIER 1 deductions and others
-163bp
~10.5%
BIS-III (1)
12.4%
10.3% 10.0% 10.0% 9.8% 9.2% 9.0%
Peer 1 Peer 2 Peer 3 Peer 4 Peer 6 Peer 5
Solid balance sheet

+ 71 bp
+ 51 bp- 39 bp - 45 bp- 26 bp
- 218 bp
12.5% 12.1%
10.4%
Dec 11 Hybrid debtbuy-back(CABK)
Dec 11Pro formaHyb. debt
buy-back CABK
Capitalincrease
TransactionGoodwill
Restructuringcosts
Capitalrequirements
Hybrid debtbuy-back
(BCIV)
Dec 11CABK + BCIV PF
Balance Sheet: Integration agreement with Banca Cívica
19
Core Capital BIS II
Resulting in a more efficient capital base (10.4% PF Dec 11 BIS II Core Capital)
Capital impact: 167 bps
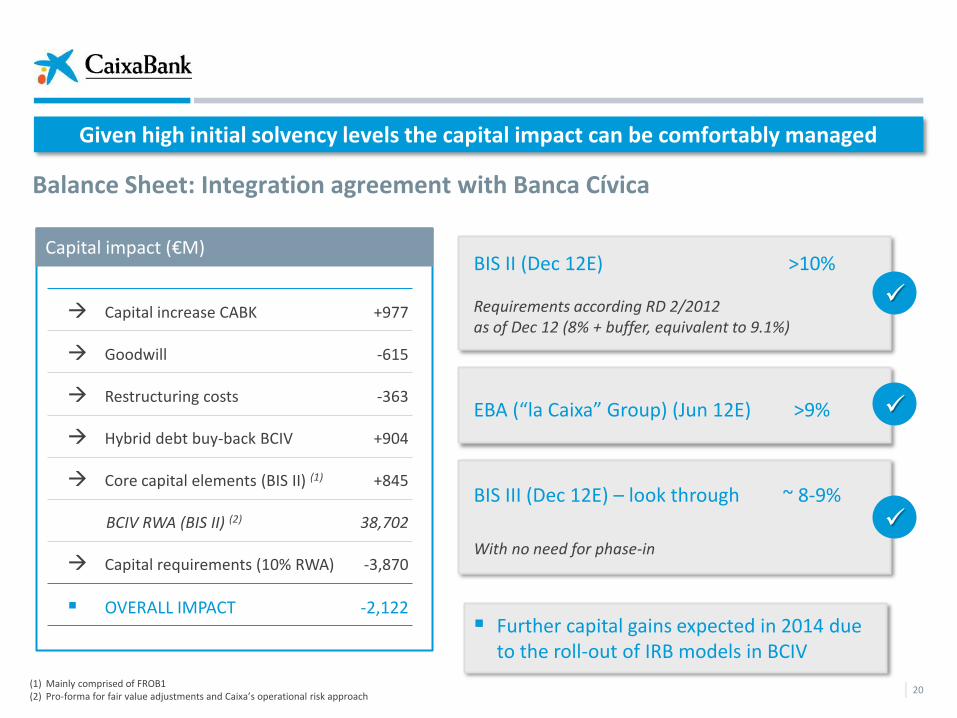
Given high initial solvency levels the capital impact can be comfortably managed
20
BIS II (Dec 12E) >10%
Requirements according RD 2/2012 as of Dec 12 (8% + buffer, equivalent to 9.1%)
EBA (“la Caixa” Group) (Jun 12E) >9%
BIS III (Dec 12E) – look through ~ 8-9%
With no need for phase-in
Capital increase CABK
Goodwill
Restructuring costs
Hybrid debt buy-back BCIV
Core capital elements (BIS II) (1)
BCIV RWA (BIS II) (2)
Capital requirements (10% RWA)
OVERALL IMPACT
+977
-615
-363
+904
+845
38,702
-3,870
-2,122
Capital impact (€M)
(1) Mainly comprised of FROB1 (2) Pro-forma for fair value adjustments and Caixa’s operational risk approach
Further capital gains expected in 2014 due to the roll-out of IRB models in BCIV
Balance Sheet: Integration agreement with Banca Cívica

21
Liquidity flexiblity remains a key tool for balance sheet management
(1) Includes cash, interbank deposits, accounts at central banks and short duration unencumbered Spanish sovereign debt.
€29.4bn 10.6%
CaixaBank Assets
€20.9bn
Unused ECB discount facility
Balance sheet liquidity1
Solid balance sheet
€20.9bn
Unused ECB discount facility
Balance sheet liquidity1
€19.6bn
7.7% CaixaBank
Assets
1st ECB 3YR facility: €12.4 bn, used to:
o Anticipate 2012 maturities o Replace LCH repo funding o Provide additional liquidity cushion
2t ECB 3YR facility: €6.08 bn, used to:
o Anticipate 2013 maturities
€ 19.6bn

22
(1) Defined as: gross loans (€183,886 M) net of loan provisions (€6,203 M) (total loan provisions excluding those corresponding to contingent guarantees) and excluding pass-through funding from multilateral agencies (€5,900 M) / retail funds (deposits, retail issuances) (€133,211 M)
(2) From April to December 2012
Wholesale maturities remain at comfortable levels
Wholesale maturities (€bn)
1Q12: €0.4 bn redeemed and €1.0 bn issued
LTD ratio(1) reduced by 4 pp over the year
Net loans declined by 1.6% and retail customer funds increased by 1.7%
129%
2

11.1
1.0
9.8
2.1
Dec 2011
23
Total liquidity: €24 Bn
~ 7.0% CABK + BCIV
PF Assets 65%
12%
23%
Client funds
Net Interbank Deposits
and repos
Wholesale funding
Current liquidity covers future maturities
Manageable maturity profile
Total Financing: €259 Bn
Information as of December 2011 (1) Includes collateral that can be included in the facility (2) Mortgage and public sector covered bonds
€12.2 Bn ECB discount
facility(1)
€11.9 Bn Balance sheet
liquidity
(€ Bn)
Additional issuance
capacity(2): 31.7 Bn
2.3
6.16.9
4.3
1.91.36.6
8.0 8.2
2012 2013 2014
Liquidity levels to remain comfortably high after the proposed deal
BCIV
CABK
BCIV
CABK
BCIV
CABK
Liquidity level Financing structure Wholesale maturities
Balance Sheet: Integration agreement with Banca Cívica
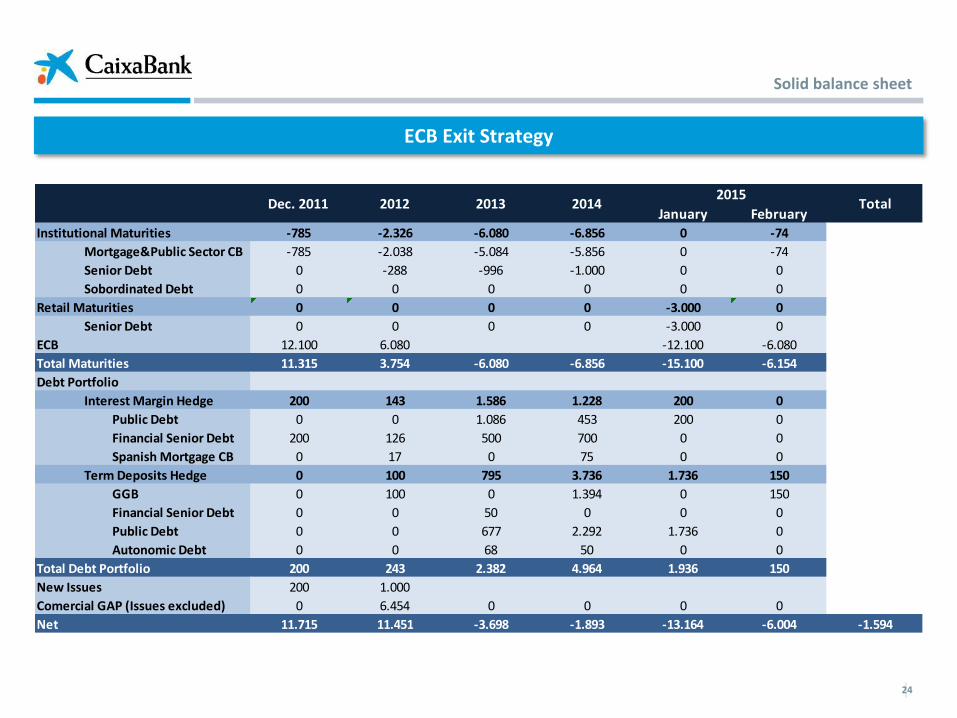
ECB Exit Strategy
24
2015
January February
Institutional Maturities -785 -2.326 -6.080 -6.856 0 -74
Mortgage&Public Sector CB -785 -2.038 -5.084 -5.856 0 -74
Senior Debt 0 -288 -996 -1.000 0 0
Sobordinated Debt 0 0 0 0 0 0
Retail Maturities 0 0 0 0 -3.000 0
Senior Debt 0 0 0 0 -3.000 0
ECB 12.100 6.080 -12.100 -6.080
Total Maturities 11.315 3.754 -6.080 -6.856 -15.100 -6.154
Debt Portfolio
Interest Margin Hedge 200 143 1.586 1.228 200 0
Public Debt 0 0 1.086 453 200 0
Financial Senior Debt 200 126 500 700 0 0
Spanish Mortgage CB 0 17 0 75 0 0
Term Deposits Hedge 0 100 795 3.736 1.736 150
GGB 0 100 0 1.394 0 150
Financial Senior Debt 0 0 50 0 0 0
Public Debt 0 0 677 2.292 1.736 0
Autonomic Debt 0 0 68 50 0 0
Total Debt Portfolio 200 243 2.382 4.964 1.936 150
New Issues 200 1.000
Comercial GAP (Issues excluded) 0 6.454 0 0 0 0
Net 11.715 11.451 -3.698 -1.893 -13.164 -6.004 -1.594
Dec. 2011 2012 2013 2014 Total
Solid balance sheet

25
Encumbered vs Unencumbered Assets: Remaining Issuing Capacity
LOAN PORTFOLIO as of March 31st 2012 TOTAL COVERED BONDS RMBS/ABS
AVAILABLE FOR
SENIOR DEBT
USED COLLATERAL UNUSED
MORTGAGES PORTFOLIO 117.533 49.846 49.495 18.193
PUBLIC SECTOR PORTFOLIO 12.413 7.714 4.684 15
OTHER LOAN PORTFOLIO 43.130 - - 4.007 39.123
LOANS TO CUSTOMERS 173.077 57.560 54.179 22.215 39.123
ENCUMBERED ASSETS (REPOS) 4.612
INSURANCE COMPANIES ASSETS 24.843
REST OF ASSETS 75.078 75.078
TOTAL ASSETS as of March 31st 2012 277.610 57.560 54.179 22.215 114.202
As of March 31st 2012 PUBLIC ISSUANCE
RETAINED /
ECB COLLATERAL TOTAL USED
MORTGAGES COVERED BONDS (€49,633 collateral) (*) 39.252 625 39.877
PUBLIC SECTOR COVERED BONDS (€7,714 collateral) (*) 1.400 4.000 5.400
RMBS/ABS 22.215 22.215
SENIOR DEBT 5.000 5.000
TOTAL issued 45.653 26.840 72.492
(*) Used Collateral = Issued amount of Cédulas Hipotecarias divided by 0.80
and Issued amount of Cédulas Territoriales divided by 0.70

26
CaixaBank Covered Bond Issuing Capabities (as of March 31st 2012)
18,193 15 18,208
Mortgages Public Sector Total
LOAN PORTFOLIO 117,534 12,413 131,824
Used in RMBS/ABS <18,193> <15> <18,208>
Total Collateral for Covered Bonds 99,341 12,398 111,249
Elligible Portfolio (1) 71,822 12,398
Cedulas
Hipotecarias
Cedulas
Territoriales
Used Collateral (2) 49,846 7,714
Covered Bond Issued Amount 39,877 5,400
Over Collaterization 249% 230%
Available Collateral (1-2) 21,976 4,684
REMAINING ISSUING CAPACITY (*) 17,581 3,279 20,860 Available Issuing Capacity
(*) Issuing Capacity= 80% of Collateral Available for C. Hipotecarias and 70% for Cedulas Territoriales

27
CaixaBank: Institutional and Retail Issues: Maturity Profile

Overview Balance per LTV-band
Specific Loan and Borrower
characteristics
CATALONIA 35.8%
VALENCIA 7.0%
ANDALUSIA 12.7%
MADRID 15.9%
Main Country regional Distribution
Cover Pool Information (ex-securitizations) – Residential Assets, as of March 2012
WA Seasoning (in months) 60.4
BALEARIC I.
5%
(*) Regions with weight >5.0% 28
Total Mortgage Loans (ex securitization) (€ mll) 68,791,100
Number of loans 870,901
Average Loan balance 78,988
Number of Borrowers 739,442
Number of properties 818,329
WA Seasoning in months 66
WA Remaining term in months 277
Avg LTV (%) 48%
WA LTV (%) 59.5%
% of Floating Rate loans: 99.7%
WA Interest Rate (Floating Rate loans) 2.98%
WA Interest Rate (Fixed Rate loans) 5.33%
17%
12%
16%
23%21%
4% 4% 3%1% 0% 0%
0%
5%
10%
15%
20%
25%
6%
9%
6%
19%
59%
< 12
≥12-<24
≥24-<36
≥36-<60
≥60
First Home91%
2nd Home6%
Rented2%
Other1%

Overview Balance per LTV-band
CATALONIA 29.7%
VALENCIA 6.5%
ANDALUSIA 16.0%
MADRID 24.6%
Main Country regional Distribution
Cover Pool Information (ex-securitizations) – Commercial Assets as of March 2012
Loan Maturity
(*) Regions with weight >5.0%
29
Total Mortgage Loans (ex securitization) (€ mll) 30,549,914
Number of loans 153,562
Average Loan balance 198,942
Number of Borrowers 59,517
Number of properties 161,919
WA Seasoning in months 54
WA Remaining term in months 202
Average LTV (%) 46.7%
WA LTV (%) 59.6%
% of Floating Rate loans: 98.7%
WA Interest Rate (Floating Rate loans) 3.17%
WA Interest Rate (Fixed Rate loans) 4.94%
18%14%
18%
24%
14%
2% 2% 2% 4%0% 2%
0%
5%
10%
15%
20%
25%
30%
18%
15%
14%
16%
37%
≤ 5
>5 - ≤10
>10 - ≤15
>15 - ≤25
>25 - ≤50
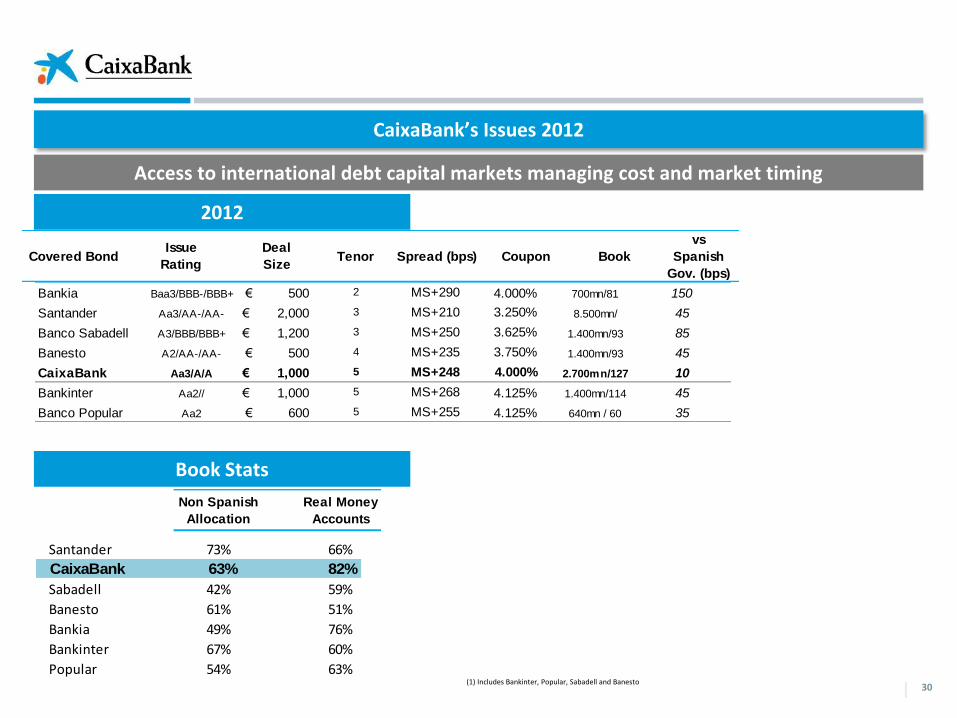
CaixaBank’s Issues 2012
30
Access to international debt capital markets managing cost and market timing
2012
Book Stats
Covered BondsRating
Emisión
Deal
Size
Plazo
añosSpread Cupón Demanda
vs
Spanish Gov
Bankia Baa3/BBB-/BBB+ 500€ 2 MS+290 4.000% 700mn/81 150
Santander Aa3/AA-/AA- 2,000€ 3 MS+210 3.250% 8.500mn/ 45
Banco Sabadell A3/BBB/BBB+ 1,200€ 3 MS+250 3.625% 1.400mn/93 85
Banesto A2/AA-/AA- 500€ 4 MS+235 3.750% 1.400mn/93 45
CaixaBank Aa3/A/A 1,000€ 5 MS+248 4.000% 2.700mn/127 10
Bankinter Aa2// 1,000€ 5 MS+268 4.125% 1.400mn/114 45
Banco Popular Aa2 600€ 5 MS+255 4.125% 640mn / 60 35
Non Spanish
Allocation
Real Money
Accounts
Santander 73% 66%
CaixaBank 63% 82%
Sabadell 42% 59%
Banesto 61% 51%
Bankia 49% 76%
Bankinter 67% 60%
Popular 54% 63%(1) Includes Bankinter, Popular, Sabadell and Banesto
Covered BondIssue
Rating
Deal
SizeTenor Spread (bps) Coupon Book
vs
Spanish
Gov. (bps)
CaixaBank 63% 82%

31
Ratings
Ratings
(1) Ratings on review for possible downgrade
Moody’s Investors Service A3
BBB+
A-
P-2
A-2
F2
(1)
(1)
(1)
Long term
Short term
Outlook Cédulas Hipotecarias
AA+
Aa2

Repsol and Telefonica provide revenue diversification and a potential capital cushion
32
Income diversification: two international leaders in defensive sectors
Financial flexibility: very liquid stakes
Potential capital buffer
Value: solid fundamentals, excellent track record and high dividend yield
Profitability: attractive return
Low regulatory capital consumption
Tax-efficient (≥ 5%)
Geographical diversification: ~65% generated outside Spain
5.1%2
12.8%2
Market value1: €5.8 bn
(1) As of March 31st 2012 (2) 12.8% stake in Repsol: 156,509,448 shares; 5.1% stake in Telefónica; 233,844,420 shares
Investment diversification

33
CaixaBank, the leading retail banking player in Spain
o Commercial strengh with sustained market share gains across the board
Solid balance sheet
o Excellent level of liquidity (€29.4bn): a key tool for balance sheet management
o Low NPL Ratio (5.25%) compared with Spanish banks combined with solid coverage (61%)
o Coverage reinforced by taking the full hit of the RDL 2/12 provisions
o Solid capital (12.4% core capital BIS II and ~10.5% core capital1 BIS III look-through 2019 in 2012)
The transaction with BCIV
o Consolidates CaixaBank’s leadership position in Spanish banking
o Increases shareholder value with sustainable increases in ROE and EPS, while maintaining strong balance sheet metrics and solvency
Key takeaways
(1) Proforma post preferred shares swap, fully phased-in. (2) Figures as of December 2011
Final remarks
APENDIX
34

35
Financial Sector Reform
Additional Provisions & Capital Buffers (1st and 2nd Stages)
Exitings
provisions
+
60% + 20%
Problematic
Assets 50% + 15%
(€176.000Mn)
Exitings
provisions
as of Jan
2012
Land
(€ 25 bn)0%
Building under
Construction
(€ 16 bn)
0%
Funished
Buildings
( € 60 bn)
0%
Personal
Guarantee
& 2nd mortgage
(€ 20.7 bn)
0%
unchanged
35% 0%+
2nd DecreeMay 2012
Generic Provisions Generic Provisions
1st DecreeFeb 2012
Generic Provisions
35%
28%
25% unchanged
unchanged
7%
7%
7%
7%
2nd DecreeMay 2012
1st DecreeFeb 2012
14%
52%
Capital
Buffer
Specific
Provisions
as of Jan
2012
Performing
Assets
(€121,7.000Mn)
Land
(€73 bn)
Building under
Construction
(€ 15 bn)
Funished
Buildings
( € 88 bn)
52%
29%

36
FULL ABSORPTION OF THE 1ST ROYAL DECREE
IMPACT ON Q1 RESULTS
CaixaBank Royal Decree Impact
PROVISION´S IMPACT ABSORVED AGAINST THE
€ 3.4 bn MERGED ADJUSTMENT IMPOSED ON ITS BOOKS.

2.700
4.722
1.800
2.102
1.287
3.305
325
2.166
2.300
1.600
1.830
Total (gross)
5.000
6.552
3.966
3.714
4.905
Total (net of Taxes)
3.500
4.586
2.776
P&L:1.471 R/E: 1.128
P&L: 2.814 R/E: 619
Pending Impact
(con Pastor)
0
857 761 1.618 1.132
412 1.607 2.019 P&L: 1.413 R/E: n.d.
Millions €
Impacto RDL 18/2012 en principales competidores
+
+
+
+
+
+
+
+
2nd Decree New
Reuirements
1st Decree Pending
to be booked

FROB
Entities oblidged to increase their capital as a consequence of being unable to cope with the new
stablished provisions, will have raise capital or apply for FROB`s financial asistance.
The FROB would be able to inject Capital via Common Equity or via Contingent Convertibles.
Contingent Convertibles would have a maturity of 5 years.
Entities asking for FROB´s support will have to present a Restructuring Plan
FROB’s Financial Capabilities of €42.000Mn (€27.300Mn still available):
Available Liquidity: €5.300Mn
Credit Facility: €3.000Mn
Capital not disbursed: €6.000Mn
Additional Issuance Cappacity (i) €13.000Mn (explicit, unconditional and irrevocable)
Total: €27.300Mn
(i) With current Government Authorization
38
FROB – Fund for Orderly Bank Restructuring
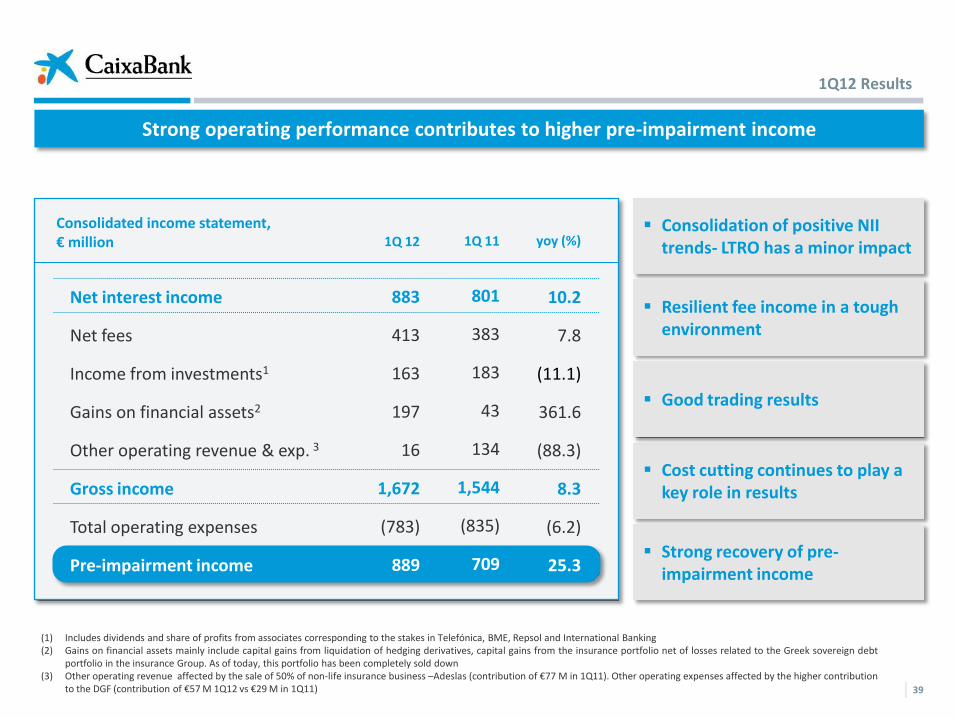
Strong operating performance contributes to higher pre-impairment income
39
1Q 11 yoy (%) Consolidated income statement, € million 1Q 12
Consolidation of positive NII trends- LTRO has a minor impact
(1) Includes dividends and share of profits from associates corresponding to the stakes in Telefónica, BME, Repsol and International Banking (2) Gains on financial assets mainly include capital gains from liquidation of hedging derivatives, capital gains from the insurance portfolio net of losses related to the Greek sovereign debt
portfolio in the insurance Group. As of today, this portfolio has been completely sold down (3) Other operating revenue affected by the sale of 50% of non-life insurance business –Adeslas (contribution of €77 M in 1Q11). Other operating expenses affected by the higher contribution
to the DGF (contribution of €57 M 1Q12 vs €29 M in 1Q11)
Resilient fee income in a tough environment
Cost cutting continues to play a key role in results
Strong recovery of pre-impairment income
Net interest income
Net fees
Income from investments1
Gains on financial assets2
Other operating revenue & exp. 3
Gross income
Total operating expenses
Pre-impairment income
801
383
183
43
134
1,544
(835)
709
10.2
7.8
(11.1)
361.6
(88.3)
8.3
(6.2)
25.3
883
413
163
197
16
1,672
(783)
889
Good trading results
1Q12 Results
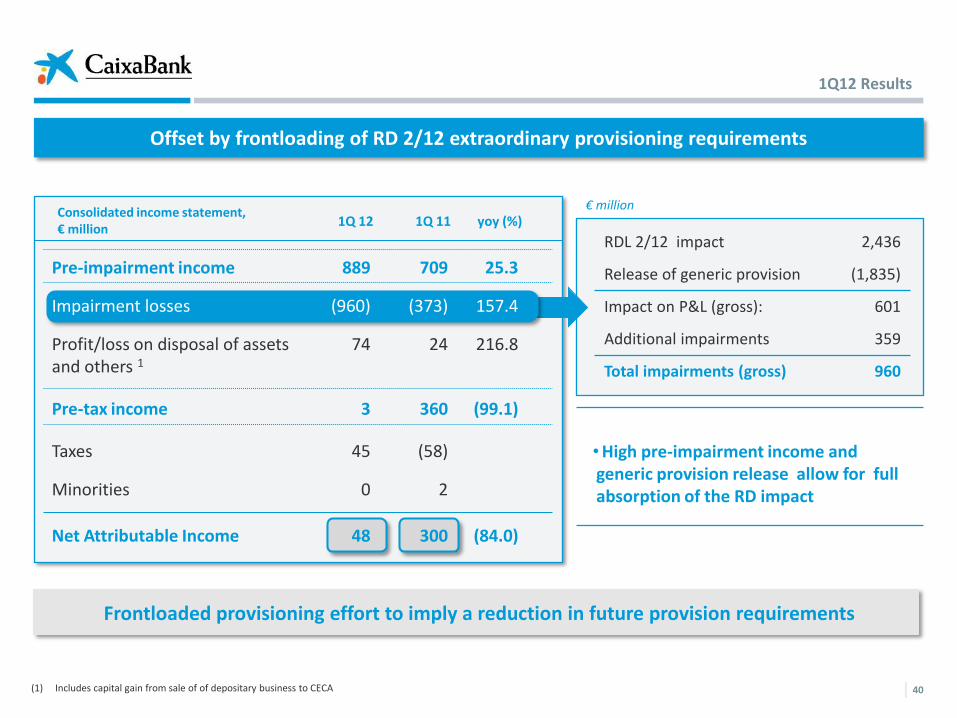
Offset by frontloading of RD 2/12 extraordinary provisioning requirements
40
Frontloaded provisioning effort to imply a reduction in future provision requirements
RDL 2/12 impact 2,436
Release of generic provision (1,835)
Impact on P&L (gross): 601
Additional impairments 359
Total impairments (gross) 960
1Q 11 yoy (%) Consolidated income statement, € million 1Q 12
• High pre-impairment income and generic provision release allow for full absorption of the RD impact
Pre-impairment income
Impairment losses
Profit/loss on disposal of assets and others 1
Pre-tax income
Taxes
Minorities
Net Attributable Income
889
(960)
74
3
45
0
48
709
(373)
24
360
(58)
2
300
25.3
157.4
216.8
(99.1)
(84.0)
€ million
(1) Includes capital gain from sale of of depositary business to CECA
1Q12 Results

€ million
Net interest income still supported by repricing of mortgage portfolio and increased loan spreads
Net interest income reflects repricing trends
41
Net interest margin increases by 9bs YoY
1Q11 2Q11 3Q11 4Q11 1Q12
+10.2%
+3.9%
1Q12 Results

Stable customer spread despite higher deposit yields
1Q11 2Q11 3Q11 4Q11
42
1Q12
Front book credit spreads
improve
Spreads in front book
time deposits
deteriorate as rates fall
YoY mortgage yields variation (bps) Customer spread
Repricing of mortgage loan
book tones down
Loans and credits Customer spread Customer deposits
1Q12 Results

43
Strong increase in fee income in a tough environment as franchise proves its worth
1Q’ 12 YoY(%)
Banking Services 311 11.8%
Mutual funds 38 0%
Insurance and pension plans
49 15.5%
Custody and distribution fees(1) 15 (40.0%)
Net Fees
€ million
Net fees break-down
Increased banking service fees a good indication of business health
413 7.8%
(1) Includes distribution fees for regional government securities
€ million
Net Fees
+7.8%
-2.8%
1Q12 Results

44
€ million
Strong capacity of generating pre-impairment income Cost-cutting discipline plays a significant role and leads to improved efficiency
Strong efforts in cost reduction
(1) Trailing 12 months including depreciation (2) On a non-consolidated basis to exclude impact of ADESLAS.
Operational improvements + cost cutting = strong pre-impairment income : €889 M (+25.3%)
Cost-to-income ratio falling below 50%1
No of branches: 5,172 (-105 yoy)
CaixaBank employees: 24,893 (-289 yoy)2
%
Trend is impacted by the deconsolidation of the non-life insurance business (ADESLAS).
In line for -3% annual reduction in recurring expenses
Personnel
General
Amortization
835 783
-6.2%
-2.3%
-13.4%
-15.1%
1Q12 Results

Expect €540 M of cost synergies by 2014 with an NPV of €1.8 bn
45 45
Annual gross costs savings (€ M)
12.5% of total combined costs
€540 M of annual costs savings achieved by 2014
€1.1 Bn of net restructuring costs
NPV of €1.8 Bn equals 1.8x price paid
Proven integration skills of CaixaBank
2011 PF cost-to-income ratio 49% (7 pp lower than combined ratio)
Cost/income expectations for 2014 in line with previously reported guidance
270
540
54
2012E 2013E 2014E
2011 Cost-to-income ratio (%)
51%
78%56% 49%
CABK BCIV CABK + BCIV PF
(exc. synergies)
CABK + BCIV PF
(100% synergies)
Information as of December 2011 (based on reported statutory accounts)
Integration agreement with Banca Cívica

140113
BCIV CABK
557438
BCIV CABK
In addition we are targeting material income synergies
46 46 Information as of December 2011. CaixaBank gross margin adjusted for income from stakes. Comparable number of clients. (1) BCIV time deposit base of €18.5 bn, according to public information as of December (excluding “cédulas multicedentes”)
Substantial income synergies:
Reduction in time deposit1 costs:
25-30 bps p.a. could be reduced over
time
High potential to improve profitability
per client (reaching CABK levels)
Cross-selling potential based on CABK
leadership in key retail products (e.g.
Mutual funds, pension plans, life
insurance, mortgages)
1.3x
1.2x
Commissions / client (€)
Gross margin / client (€)
Integration agreement with Banca Cívica

Leading platform: existing scale advantage
M&A not a “need”, but an opportunity
As such, will only consider value-creating opportunities
Minimum thresholds:
o Return on investment > Cost of equity by year 3
o EPS accretive by year 3
o Maintain financial strength (core 8%-9% Basel-3)
Transaction is consistent with CaixaBank’s M&A policy as stated to the market
ROIC ~ 20% by 2014
ROI substantially higher
Positive EPS impact from 2013 >20% EPS accretion by 2014
Core Basel-III (Fully phased-in) ~8-9%
Room for both organic and M&A growth
Indicative criteria for M&A
47 47
Inaugural Analyst Presentation (Feb. 2011)
Integration agreement with Banca Cívica
48
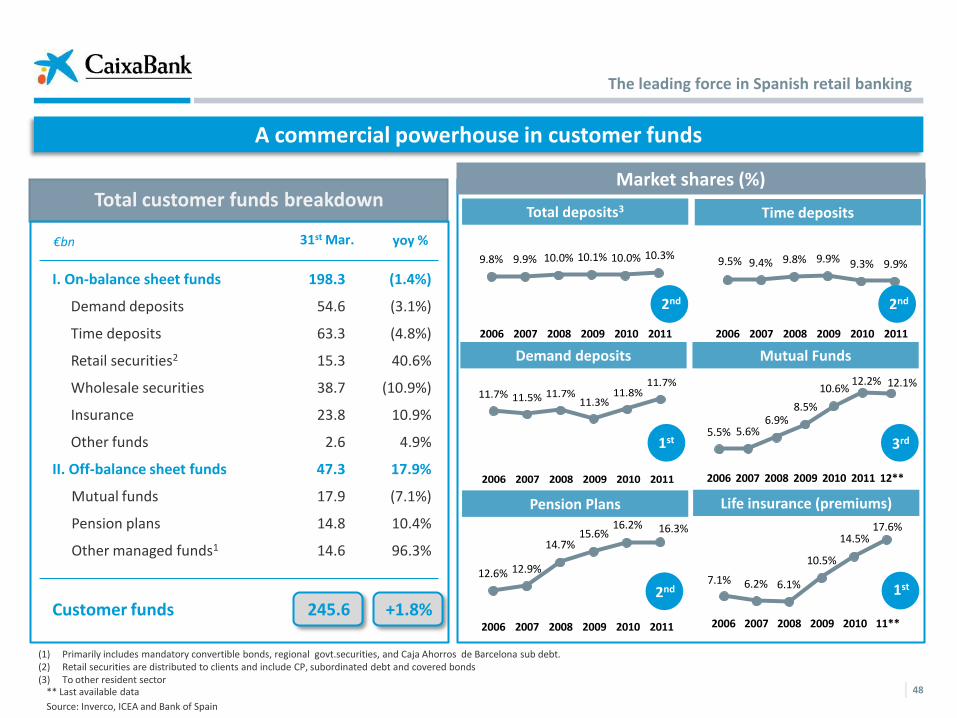
Total customer funds breakdown Total customer funds breakdown
A commercial powerhouse in customer funds
Total deposits3 Time deposits
9.8% 9.9% 10.0% 10.1% 10.0% 10.3%
2006 2007 2008 2009 2010 2011
9.5% 9.4% 9.8% 9.9% 9.3% 9.9%
2006 2007 2008 2009 2010 2011
Mutual Funds
12.6% 12.9%
14.7%15.6%
16.2% 16.3%
2006 2007 2008 2009 2010 2011
Pension Plans
7.1% 6.2% 6.1%
10.5%
14.5%17.6%
2006 2007 2008 2009 2010 11**
11.7% 11.5% 11.7%11.3%
11.8%11.7%
2006 2007 2008 2009 2010 2011
Life insurance (premiums)
Demand deposits
2nd 2nd
2nd
3rd
1st
1st
Market shares (%)
** Last available data
Source: Inverco, ICEA and Bank of Spain
(1) Primarily includes mandatory convertible bonds, regional govt.securities, and Caja Ahorros de Barcelona sub debt. (2) Retail securities are distributed to clients and include CP, subordinated debt and covered bonds (3) To other resident sector
5.5% 5.6%6.9%
8.5%
10.6%12.2% 12.1%
2006 2007 2008 2009 2010 2011 12**
31st Mar.
I. On-balance sheet funds
Demand deposits
Time deposits
Retail securities2
Wholesale securities
Insurance
Other funds
II. Off-balance sheet funds
Mutual funds
Pension plans
Other managed funds1
Customer funds
198.3
54.6
63.3
15.3
38.7
23.8
2.6
47.3
17.9
14.8
14.6
(1.4%)
(3.1%)
(4.8%)
40.6%
(10.9%)
10.9%
4.9%
17.9%
(7.1%)
10.4%
96.3%
€bn yoy %
+1.8% 245.6
The leading force in Spanish retail banking

Management of loan book to adapt to market environment
(1) To other resident sector
** Last available data
Source: SWIFT, Bank of Spain and Factoring Spanish association 49
Loan Book Breakdown
9.0% 9.1%9.6% 10.0%
10.6%10.6%
2006 2007 2008 2009 2010 2011
Total loans1 Mortgages
11.1%11.0%10.9%10.5%11.0%11.1%10.6%
2006 2007 2008 2009 2010 2010 12**
Commercial loans
6.0% 6.5%7.8%
8.9% 9.5% 9.9%
2006 2007 2008 2009 2010 11**
1st 1st
2nd 7.2% 7.3% 8.1%
11.6%13.3%
15.4%
2006 2007 2008 2009 2010 jul-05
Factoring & Confirming
5.1% 5.7%
9.4%
14.2%17.1%
2007 2008 2009 2010 2011
Foreign trade - exports
9.6% 10.3%12.7% 13.0% 14.0%
2007 2008 2009 2010 2011
Foreign trade- imports
3rd
Market shares (%)
Loan balances to real estate developers continue to decline at a greater pace than the market
Exposure to businesses (ex-developers) increases by 1.3%
31st Mar.
I. Loans to individuals
Residential mortgages
Consumer credit
II. Loans to businesses
Non RE business
Real Estate developers
ServiHabitat & other RE subsidiaries
III. Public sector
Total loans
92.5
69.1
23.4
79.8
55.0
21.7
3.1
11.6
(1.8%)
(1.2%)
(3.8%)
(5.0%)
1.3%
(15.1%)
(26.1%)
11.1%
€bn, gross yoy %
-2.5% 183.9
The leading force in Spanish retail banking

50
Reinforced by a premium brand reputation
“la Caixa”: the financial brand
with the best reputation
In 2011, reduction in the number of complaints: 17%
Leading institution in reputation and interest in operating (FRS
Inmark 2011 – individuals) and customer retention in business
segment (FRS Inmark 2011 - businesses)
The first institution for 36% of business clients (internal survey
among 3,385 companies)
The most highly rated online service in all segments (individuals
and businesses) (Aqmetrix)
Quality of service – Brand reputation
The leading force in Spanish retail banking

Av. Diagonal, 621 08028 Barcelona
www.CaixaBank.com
+34 93 411 75 03
Institutional Investors & Analysts Contact
contact us, please call or write to us at the following email address and telephone number: We are at your entire disposal for any questions or suggestions you may wish to make. To