cajá-flavored drinks: a proposal for mixed flavor
TRANSCRIPT

Food Sci. Technol, Campinas, 35(1): 143-149, Jan.-Mar. 2015 143
Food Science and Technology ISSN 0101-2061
DI:D http://dx.doi.org/10.1590/1678-457X.6563
1 IntrodutionCajá is a fruit of the genus Spondias family Anacardiaceae of
3-4cm long and with an oval shape. Df the exotic Brazilian fruits, cajá stands out as a good source of carotenoids and ascorbic acid and for its typical flavor and aroma (Bora et al., 1991; Maia et al., 2007). It is mostly cultivated in the north and northeast of Brazil where it has an expressive part in agribusiness, being marketed direct for consumption as the fresh fruit and/or as a raw material for the preparation of juices, ice-lollies, ice-creams, nectars and jams (Soares et al., 2006).
Brazil is an expressive consumer of ready-to-drink juices, and the search for the product follows tendencies such as a focus on the cost/benefit and practicality/convenience ratios, and a consumer profile with greater power of decision (Sabbe et al., 2009). Df the attributes cited as appreciated by juice consumers, flavor is the most valued one (Estima et al., 2011). The orange flavor is the most consumed on the world market (Varela et al., 2010), but the search for other flavors and flavor mixtures has been growing and appears as an innovation on the juice market (Vidigal et al., 2011; Silva et al., 2009, 2011).
Powdered drink preparations are products based on juices or vegetable extracts with the addition of sugars and sweeteners. They are used for the elaboration of beverages for immediate consumption by the addition of water (Brasil, 1998). The product is present in more than 54% of Brazilian homes,
with an annual consumption of 16 L (Instituto Nacional de Metrologia, Normalização e Qualidade Industrial, 2013), and is regularly consumed in all income groups (A, B, C, D and E) (Cunha, 2010). Between 2003 and 2009, the increase in volume of powdered drink marketed was greater than that observed for concentrated and natural juices (Carvalho, 2010). In 2012, sales reached above R$1.4 billion, or the equivalent of 3.29 billion liters of prepared beverage (Souza, 2012).
The acceptance of a product depends on the socio-demographic profile of the consumers (Vidigal et al., 2011). During the development and improvement of food products, companies should make efforts to understand the consumers’ wants and needs, as well as their perception of food products, in order to assure the success of the products on the marketplace (Gofman et al., 2009).
The literature has reported how cultural diversification affects product acceptance. Bonany et al. (2013), studying the acceptance of different apple varieties in different European countries, described a strong interaction between the country and the variety. The authors indicated that the differences in eating quality acceptance of the apple varieties were influenced by differences in the consumers from each country. Koppel et al. (2014) determined how consumers from different cultures accepted the taste and flavor combinations of a healthy juice.
Cajá-flavored drinks: a proposal for mixed flavor beverages and a study of the consumer profile
Maria Eugênia de Dliveira MAMEDE1*, Daneysa Lahis KALSCHNE2, Adriana Pereira Coelho SANTDS1 , Marta de Toledo BENASSI2
a
Received 12 Nov., 2014 Accepted 10 Feb., 20151Departamento de Análises Bromatológicas, Faculdade de Farmácia, Universidade Federal da Bahia – UFBA, Salvador, BA, Brazil2Departamento de Ciência e Tecnologia de Alimentos, Centro de Ciências Agrárias, Universidade Estadual de Londrina – UEL, Londrina, PR, Brazil*Corresponding author: [email protected]
AbstractMixed flavor beverages represent a trend that is gaining the allegiance of potential fruit juice consumers. The present study proposed to prepare mixed flavor beverages and verify their consumer acceptance. Cajá beverage (sample A) was used as the standard. The other beverages were prepared by mixing the cajá-flavored product with other flavors: strawberry (B), pineapple (C), jabuticaba (D), mango (E) and cashew (F). The consumer profiles in the two regions studied were similar. Dverall beverages B, A and F were the most accepted, with scores of 7.7, 6.4 and 6.2, respectively. Internal Preference Mapping showed that most of the consumers were located near beverages A, B and F, confirming the acceptance results. The consumers indicated appearance and flavor as the most appreciated characteristics in beverages A, B and F. Beverages A, B and F presented higher total soluble solids contents and viscosities than the other beverages. Consumer segmentation did not depend on the different levels of familiarity with the cajá flavor. Thus the preparation of mixed flavor beverages of cajá-strawberry and cajá-cashew is an excellent proposal because it presents flavors with good potential for marketing in different regions of Brazil.
Keywords: consumer segmentation; physical and chemical characteristics; strawberry; cashew; internal preference mapping.
Practical Application: Mixed cajá beverages have potential for marketing amongst Brazilian regions.

Acceptance of mixed cajá-flavored
Food Sci. Technol, Campinas, 35(1): 143-149, Jan.-Mar. 2015144
The authors observed larger differences in acceptance between consumer clusters across countries and pointed out that industries, instead of looking for individual products for certain countries, should seek products that work well across consumer segments for multiple countries.
Internal preference map provides a clear presentation of the relationships among the products and the individual differences in liking by consumers. For these products Preferences of individual consumers can be projected as vectors through the space to show directions of increased liking. This information can suggest directions for product optimization. Also, differences in the preferred directions for different consumers can help discover market segments or groups with different likes and dislikes (Lawless & Heymann, 2010).
Thus for marketing in a national ambience in a country with as wide a cultural diversification as Brazil, the acceptance of a potential product should be verified in different regions, also considering differences in the familiarity of the consumer with the determined flavor. Hence the present study proposed to evaluate cajá-based juices with different flavor mixtures by internal preference mapping, involving consumers from different regions with different familiarities with cajá flavor, so as to propose a flavor mixture with good sensory acceptance by consumers in both the regions studied.
2 Materials and methods2.1 Samples and preparation
A commercial powdered cajá-flavored drink (General Brands – Brazil) was used as a base to prepare all the beverages. Beverage A was prepared by diluting the powdered cajá-flavored drink in 1000 mL of water as recommended by the manufacturer. To obtain the other five products with different flavors and characteristics, the beverages were prepared by mixing the powdered cajá-flavored drink with other commercial powdered flavored drinks, such as strawberry (Mondeléz- Brazil), pineapple (Ajinomoto - Brazil), jabuticaba (Ajinomoto - Brazil), mango (Ajinomoto - Brazil) and cashew (Mondeléz - Brazil) (Table 1). The formulations were established based on preliminary tests (data not available) to define the flavors and proportion of the ingredients, in order to obtain a large spectrum of diversity in flavor and other characteristics. All the samples were prepared and cooled to 5 ± 2°C on the day of the analysis.
2.2 Physical and chemical analyses
The total soluble solids (TSS) contents were determined using an Atago pocket refractometer PAL-BX/RI (Tokyo, Japan) with automatic temperature compensation. The results were expressed as °Brix. The viscosity was determined using a Brookfield digital viscometer RVTDV-II (Harlow, United Kingdom) with a #1 spindle at 100 rpm.
The titratable acidity (TA) of the samples (10 mL) was carried out by titration with 0.1M NaDH using phenolphthalein as the indicator. The results were expressed as g of citric acid /100 mL. The pH was determined using a pH meter (Hanna HI 3221, USA).
For the color analysis, the samples were conditioned in cuvettes (10 mL), and the readings made using a Minolta CR 410 colorimeter (Tokyo, Japan) with a CIE D65 illuminant and standard CIE 10° observer. The chroma (C*) and hue (h°) values were obtained.
2.3 Consumer test
The consumer acceptance test was applied in the cities of Londrina/PR (south region) and Salvador/BA (northeast region). Regular fruit juice consumers were recruited at the State University of Londrina and at the Federal University of Bahia, based on their interest and availability to take part in the study. Dne hundred and six consumers (fifty five from Londrina and fifty one from Salvador), between 18 and 43 years of age, took part in the consumer tests.
The demographic sociological characteristics of the consumers, including gender, age, and educational level, and habits regarding fruit juice consumption (frequency of consumption and which flavor they liked) were collected to characterize the panels. The consumers were also asked if they used to consuming mixed flavor juices and, if positive, which flavors they would like to mix. The panels were previously informed about the products and procedures (scale and evaluation test), as described in the project registered with the National Research Ethics System (Project 057/2014 UEL, CAAE 17523914.1.0000.5231).
The evaluations were carried out in individual booths under artificial daylight, a temperature between 22 and 24 °C and air
Table 1. Beverage preparation
Beverage flavors Preparation*
Cajá (sample A) Dilution of 25 g of powdered cajá-flavored drink in 1000 mL water
Cajá-strawberry (sample B)
Dilution of 12.5 g of powdered cajá-flavored drink and 15 g powdered strawberry-flavored
drink in 1000 mL water
Cajá-pineapple (sample C)
Dilution of 12.5 g of powdered cajá-flavored drink and 2 g powdered pineapple-flavored
drink in 1000 mL water
Cajá-jabuticaba (sample D)
Dilution of 12.5 g of powdered cajá-flavored drink and 5 g powdered jabuticaba-flavored
drink in 1000 mL water
Cajá-mango (sample E)
Dilution of 12.5 g of powdered cajá-flavored drink and 1.6 g powdered mango-flavored drink
in 1000 mL water
Cajá-cashew (sample F)
Dilution of 12.5 g of powdered cajá-flavored drink and 15 g powdered cashew-flavored drink
in 2000 mL water.*Ingredients of the powdered flavored drinks: Cajá: crystal sugar, acidulants, flavoring (identical to natural cajá), stabilizers, dehydrated cajá pulp, sweeteners, vitamin C, natural organic and inorganic dyes; Strawberry: sugar, malt dextrin, dehydrated strawberry pulp, iron, vitamins A and C, acidulant, thickeners, sweeteners, flavoring (natural identical), natural and artificial dyes and the foam enhancer quillaja powder; Pineapple: malt dextrin, dehydrated pineapple pulp, acidulant, pineapple flavor (natural identical), inorganic and organic dyes, sweeteners and stabilizer; Jabuticaba: sugar, dehydrated jabuticaba pulp, vitamin C, acidulant, sweeteners, jabuticaba flavor (natural identical), stabilizers, inorganic and organic natural and artificial dyes; Mango: malt dextrin, dehydrated mango pulp, acidulant, stabilizer, mango flavor (natural identical), sweeteners, inorganic and organic dyes; Cashew: sugar, malt dextrin, dehydrated cashew pulp, iron, vitamins C and A, flavoring (natural identical), acidulant, thickeners, inorganic and organic natural and artificial dyes, sweeteners and the foam enhancer quillaja powder.

Mamede et al.
Food Sci. Technol, Campinas, 35(1): 143-149, Jan.-Mar. 2015 145
3 Results and discussion3.1 Consumer characterization
A comparison of the profiles of the sensory panels showed that the age range was predominantly between 18 and 25 years of age (more than 60%), representative of the target public for the product, but the Salvador panel showed a greater predominance of females (72.5% as against 54.5% in Londrina) and a lower scholastic level (19.6% university graduates as against 58.5% in Londrina). The fruit juice consumption frequency was well equilibrated, with 27% consuming once a week, 23.5% three to five times a week and 18.2% every day; although for the first group (once a week), the frequency was considerably lower in Salvador (19.6%) than in Londrina (27.3%). The socio-demographic profiles indicated similarities between the consumers in the two cities under study.
Figure 2 shows the indication of the flavors most cited by the consumers, citations corresponding to more than 5% of the responses for each panel being considered, lower citation percentages being inserted in “others”. The flavors orange, grape,
circulation. The samples were evaluated in a monadic way. Each consumer evaluated the six beverage samples (A, B, C, D, E and F) in two sessions, according to an experimental design of complete balanced and randomized blocks. The samples (50 mL) were served in plastic glasses coded with random 3-digit numbers. A 10-cm hybrid hedonic scale anchored with verbal terms at the extremes (Villanueva et al., 2005) was used to evaluate overall acceptance (Figure 1). The consumers were asked to specify the most and least appreciated characteristics of each sample on the same score sheet. Mineral water and saltwater cracker biscuits were provided for mouth rinsing between samples.
2.4 Data analysis
The acceptance data were evaluated by a main effects ANDVA procedure, and the physical and chemical data evaluated by a one-way ANDVA and Tukey test (at a 5% significance level) using the STATISTICA version 8.0. Internal preference mapping was carried out by Multidimensional Scaling and Cluster analysis using the SENSTDDLS software package version 2.3.28 (DP & P Product Research, 1998).
Figure 1. Illustration of the score sheet used in acceptance test.
Figure 2. Flavors cited as most liked in Londrina (A) and Salvador (B). In Londrina, ‘others’ includes the flavors: apple, peach, acai, raspberry, tangerine, guava and water melon. In Salvador, ‘others’ includes the flavors: strawberry, peach, cashew, tangerine, pineapple, guava, acerola, umbu, guava and mangaba.

Acceptance of mixed cajá-flavored
Food Sci. Technol, Campinas, 35(1): 143-149, Jan.-Mar. 2015146
3.2 Beverage acceptance
In Londrina the results of the acceptance test showed that the consumers preferred, in sequence, the beverages cajá-strawberry, cajá-cashew and cajá (samples B, F and A) in relation to the other mixtures, and the results were similar in Salvador. The general mean score for acceptance of the mixed flavor beverages varied from 4.1 to 7.7 on a 10-cm scale. In general, the beverages cajá-strawberry (B), cajá (A) and cajá-cashew (F) stood out for receiving higher scores (7.7, 6.4 and 6.2) and a percent approval above 80% (Table 2), showing that slight familiarity with a flavor and regional differences did not affect consumer behavior (Table 2). Silva et al. (2011) obtained a similar result, with acceptance scores from 5.8-7.0 on a 9-point scale for a mixed cajá-cashew beverage with added prebiotics.
Considering the general mean score, with the exception of the beverage cajá-jabuticaba (sample D) (mean score 4.1 with 42.5% approval), all the beverages presented scores above or equal to 5 and percent approval (% of scores of 5 or above) above 50% (Table 2), showing good potential for mixed flavor beverages.
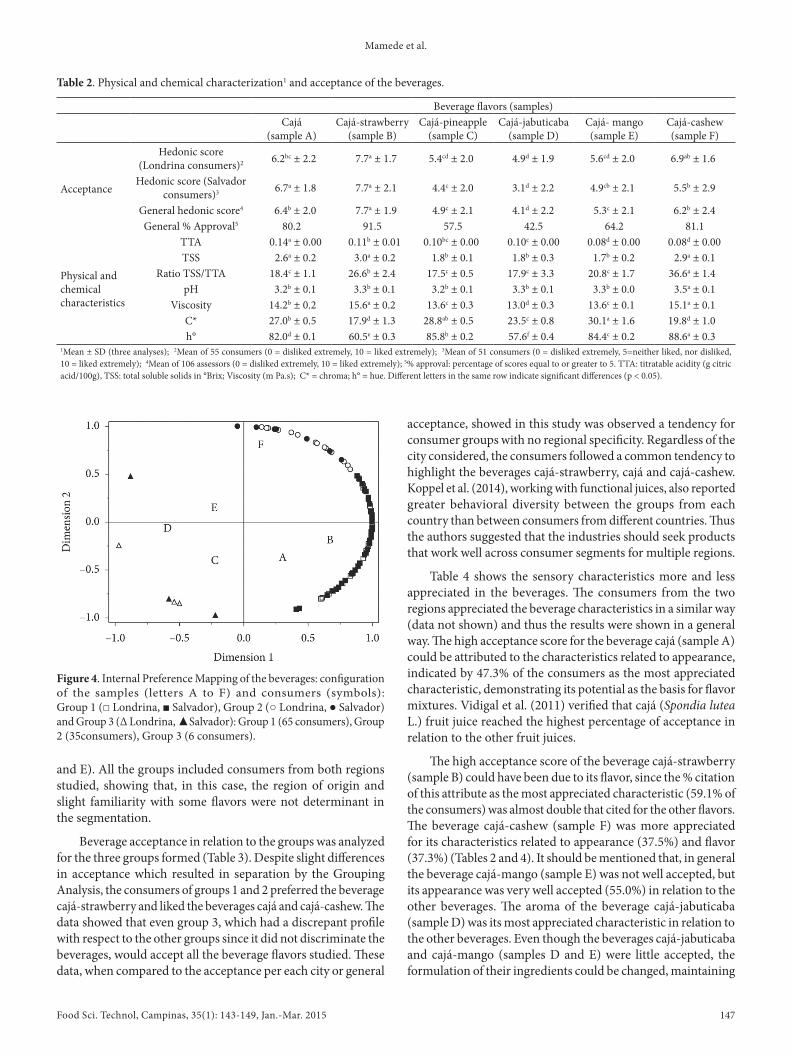
The results for acceptance were also analyzed by Internal Preference Mapping so as to verify the segmentation of the consumers of each product (Figure 4). The first and second dimensions explained 71% of the variability of the data. This behavior reinforced that already verified by the mean score for acceptance of the beverages (Table 2), since 94% of the consumers were allocated to the right of the graph where the juices cajá, cajá-strawberry and cajá-cashew were located (samples A, B and F) (Figure 4).
Segmentation of the consumers showed the presence of 3 groups: group 1 (65 consumers, 61%) allocated near the beverages cajá and cajá-strawberry (samples A and B); group 2 (35 consumers, 33%) close to the beverage cajá-cashew (sample F); and group 3 (6 consumers, 6%) closer to the beverages cajá-pineapple, cajá-jabuticaba and cajá-mango (samples C, D
passion fruit and lemon were well cited by both panels, the preference for orange flavor standing out, more so in Londrina (27.6%) than in Salvador (15.8%).
The flavors cashew and mango were exclusively cited by consumers in Salvador (8.3% and 12.8%), since cashew is cultivated and consumed principally in the northern and northeastern regions of Brazil. The state of Bahia standing out (Soares et al., 2006) justifying the citation of this flavor by the consumers in Salvador. The same argument can be applied to mango flavor, a fruit mainly produced in the northeastern region, notably in the state of Bahia (Instituto Brasileiro de Geografia e Estatística, 2014).
The flavor strawberry was amongst the five flavors most cited by the consumers in Londrina. The production and consumption of strawberries occurs mainly in the south and southeast of Brazil (Dliveira et al., 2005; Specht & Blume, 2009), which could explain the greater percentage of strawberry citations by the consumers in Londrina.
The majority of the consumers in Londrina (90.9%) reported they had already consumed mixed flavor fruit juices, an option less known by the panel in Salvador (66.7%). The consumers who had already consumed mixed flavored juices were asked which flavors they would like to “mix”. The flavor of orange was clearly the most cited for the composition of mixtures, and suggestions of mixing it with acerola, mango, pineapple, strawberry and passion fruit were made by both panels and with lemon, papaya and apple by the panel in Londrina (Figure 3). The consumers in Londrina stood out for citing a greater number of juice combinations with orange and also for proposing two mixtures with strawberry (passion fruit and grape), whereas the consumers in Salvador mentioned options with mango (peach and acerola) and a mixture of pineapple with cashew (Figure 3), showing regional specificity.
Figure 3. Proposals for mixtures of flavors made by consumers in Londrina (A) and Salvador (B). In Londrina, ‘others’ includes the flavors: tangerine-lime; acai-orange; mango-strawberry; water melon-ginger; acai-grape; acai-strawberry; water melon-grape; orange-tangerine; per-apple; pineapple-coconut; and grape-lemon, amongst others. In Salvador ‘others’ includes the flavors: tomato-apple; passion fruit-mango; passion fruit-lemon; acerola-cashew; peach-grape; cashew-passion fruit; pineapple-mango; guava-acerola; pear-apple; pineapple-coconut; grape-lemon; and apple-mango, amongst others.
Mamede et al.
Food Sci. Technol, Campinas, 35(1): 143-149, Jan.-Mar. 2015 147
acceptance, showed in this study was observed a tendency for consumer groups with no regional specificity. Regardless of the city considered, the consumers followed a common tendency to highlight the beverages cajá-strawberry, cajá and cajá-cashew. Koppel et al. (2014), working with functional juices, also reported greater behavioral diversity between the groups from each country than between consumers from different countries. Thus the authors suggested that the industries should seek products that work well across consumer segments for multiple regions.
Table 4 shows the sensory characteristics more and less appreciated in the beverages. The consumers from the two regions appreciated the beverage characteristics in a similar way (data not shown) and thus the results were shown in a general way. The high acceptance score for the beverage cajá (sample A) could be attributed to the characteristics related to appearance, indicated by 47.3% of the consumers as the most appreciated characteristic, demonstrating its potential as the basis for flavor mixtures. Vidigal et al. (2011) verified that cajá (Spondia lutea L.) fruit juice reached the highest percentage of acceptance in relation to the other fruit juices.
The high acceptance score of the beverage cajá-strawberry (sample B) could have been due to its flavor, since the % citation of this attribute as the most appreciated characteristic (59.1% of the consumers) was almost double that cited for the other flavors. The beverage cajá-cashew (sample F) was more appreciated for its characteristics related to appearance (37.5%) and flavor (37.3%) (Tables 2 and 4). It should be mentioned that, in general the beverage cajá-mango (sample E) was not well accepted, but its appearance was very well accepted (55.0%) in relation to the other beverages. The aroma of the beverage cajá-jabuticaba (sample D) was its most appreciated characteristic in relation to the other beverages. Even though the beverages cajá-jabuticaba and cajá-mango (samples D and E) were little accepted, the formulation of their ingredients could be changed, maintaining
and E). All the groups included consumers from both regions studied, showing that, in this case, the region of origin and slight familiarity with some flavors were not determinant in the segmentation.
Beverage acceptance in relation to the groups was analyzed for the three groups formed (Table 3). Despite slight differences in acceptance which resulted in separation by the Grouping Analysis, the consumers of groups 1 and 2 preferred the beverage cajá-strawberry and liked the beverages cajá and cajá-cashew. The data showed that even group 3, which had a discrepant profile with respect to the other groups since it did not discriminate the beverages, would accept all the beverage flavors studied. These data, when compared to the acceptance per each city or general
Table 2. Physical and chemical characterization1 and acceptance of the beverages.
Beverage flavors (samples)Cajá
(sample A)Cajá-strawberry
(sample B)Cajá-pineapple
(sample C)Cajá-jabuticaba
(sample D)Cajá- mango(sample E)
Cajá-cashew(sample F)
Acceptance
Hedonic score (Londrina consumers)2 6.2bc ± 2.2 7.7a ± 1.7 5.4cd ± 2.0 4.9d ± 1.9 5.6cd ± 2.0 6.9ab ± 1.6
Hedonic score (Salvador consumers)3 6.7a ± 1.8 7.7a ± 2.1 4.4c ± 2.0 3.1d ± 2.2 4.9cb ± 2.1 5.5b ± 2.9
General hedonic score4 6.4b ± 2.0 7.7a ± 1.9 4.9c ± 2.1 4.1d ± 2.2 5.3c ± 2.1 6.2b ± 2.4General % Approval5 80.2 91.5 57.5 42.5 64.2 81.1
Physical and chemical characteristics
TTA 0.14a ± 0.00 0.11b ± 0.01 0.10bc ± 0.00 0.10c ± 0.00 0.08d ± 0.00 0.08d ± 0.00TSS 2.6a ± 0.2 3.0a ± 0.2 1.8b ± 0.1 1.8b ± 0.3 1.7b ± 0.2 2.9a ± 0.1
Ratio TSS/TTA 18.4c ± 1.1 26.6b ± 2.4 17.5c ± 0.5 17.9c ± 3.3 20.8c ± 1.7 36.6a ± 1.4pH 3.2b ± 0.1 3.3b ± 0.1 3.2b ± 0.1 3.3b ± 0.1 3.3b ± 0.0 3.5a ± 0.1
Viscosity 14.2b ± 0.2 15.6a ± 0.2 13.6c ± 0.3 13.0d ± 0.3 13.6c ± 0.1 15.1a ± 0.1C* 27.0b ± 0.5 17.9d ± 1.3 28.8ab ± 0.5 23.5c ± 0.8 30.1a ± 1.6 19.8d ± 1.0h° 82.0d ± 0.1 60.5e ± 0.3 85.8b ± 0.2 57.6f ± 0.4 84.4c ± 0.2 88.6a ± 0.3
1Mean ± SD (three analyses); 2Mean of 55 consumers (0 = disliked extremely, 10 = liked extremely); 3Mean of 51 consumers (0 = disliked extremely, 5=neither liked, nor disliked, 10 = liked extremely); 4Mean of 106 assessors (0 = disliked extremely, 10 = liked extremely); 5% approval: percentage of scores equal to or greater to 5. TTA: titratable acidity (g citric acid/100g), TSS: total soluble solids in °Brix; Viscosity (m Pa.s); C* = chroma; h° = hue. Different letters in the same row indicate significant differences (p < 0.05).
Figure 4. Internal Preference Mapping of the beverages: configuration of the samples (letters A to F) and consumers (symbols): Group 1 (□ Londrina, ■ Salvador), Group 2 (○ Londrina, ● Salvador) and Group 3 (Δ Londrina, ▲Salvador): Group 1 (65 consumers), Group 2 (35consumers), Group 3 (6 consumers).
Acceptance of mixed cajá-flavored
Food Sci. Technol, Campinas, 35(1): 143-149, Jan.-Mar. 2015148
(2006) reported ratios of up to 20.1 in twelve commercial orange drink preparations.
The beverages cajá, cajá-strawberry and cajá-cashew were also differentiated from the others for showing higher values for viscosity (Table 2). The values for hº varied from 60.5 to 88.6 for these same beverages, which were considered to be beverages with orangey yellow, yellowy red and yellow hues, respectively. The beverage cajá presented a value for C* of 27.0, suggesting a beverage with a saturated color (Table 2).
The beverages cajá-pineapple, cajá-jabuticaba and cajá-mango (samples C, D and E) were less accepted. This result could be due to the low values for TSS and viscosity (Table 2), and consumers reported that the flavors of these beverages were not good (least appreciated characteristic) (Table 4).
By evaluating the physicochemical characteristics together with the acceptance and most appreciated characteristics (flavor and appearance) of the beverages cajá-strawberry, cajá and cajá-cashew, one can obtain an indication of the reason why these beverages were more accepted by the consumers (Tables 2, 3 and 4 and Figure 4). Df the mixed flavor beverages studied, those of cajá-strawberry and cajá-cashew showed the greatest potential for commercialization.
4 ConclusionThe study of cajá-based juices with different flavor mixtures,
showed the feasibility of proposing mixed flavors that show good sensory acceptance by consumers in the two regions studied. Consumer segmentation did not depend on the different levels of familiarity with the cajá flavor and was also independent of the regional preferences. Thus the elaboration of mixed flavor beverages of cajá-strawberry and cajá-cashew, with the physicochemical characteristics described in this paper, is an excellent proposal, since it presents flavors with good potential for commercialization in Brazil.
AcknowledgementsTo General Brands – Brazil for their donation of the powdered
drinks. To the Fundação de Apoio a Pesquisa do Estado da Bahia – FAPESB, CNPq and CAPES for the fellowships.
ReferencesBonany, J., Buehler, A., Carbo, J., Codarin, S., Donati, F., Echeverria, G.,
Egger, S., Guerra, W., Hilaire, C., Höller, I., Iglesias, I., Jesionkowska, K., Konopacka, D., Kruczyńska, D., Martinelli, A., Pitiot, C., Sansavini, S., Stehr, R., & Schoorl, F. (2013). Consumer eating quality acceptance of new apple varieties in different European countries. Food Quality and Preference, 30(2), 250-259. http://dx.doi.org/10.1016/j.foodqual.2013.06.004.
Bora, P. S., Narain, N., Holschuh, H. J., & Vasconcelos, M. A. S. (1991). Changes in physical and chemical composition during maturation of yellow mombin (Spondias mombin) fruits. Food Chemistry, 41(3), 341-348. http://dx.doi.org/10.1016/0308-8146(91)90058-V.
Brasil. Ministério da Agricultura e do Abastecimento. (1998). Portaria 544, de 16 de Novembro de 1998. Aprova o Regulamento Técnico para
Table 4. Most appreciated and least appreciated sensory characteristics of each beverage and frequency of reporting (%)
Beverages Most appreciated characteristics
Least appreciated characteristics
Cajá(sample A)
Appearance (47.3%)Aroma (19.6%)Flavor (30.0%)
Viscosity (3.2%)
Appearance (13.3%)Aroma (15.6%)Flavor (48.8%)
Viscosity (14.9%)Astringency (7.5%)
Cajá-strawberry(sample B)
Appearance (20.0%)Aroma (16.9%)Flavor (59.1%)
Viscosity (4.0%)
Appearance (55.1%)Aroma (10.0%)Flavor (28.2%)
Viscosity (6.7%)
Cajá-pineapple(sample C)
Appearance (39.7%)Aroma (29.9%)Flavor (25.5%)
Viscosity (5.1%)
Appearance (15.9%)Aroma (9.0%)Flavor (59.3%)
Viscosity (15.9%)
Cajá-jabuticaba(sample D)
Appearance (39.2%)Aroma (44.6%)Flavor (12.8%)
Viscosity (3.4%)
Appearance (26.5%)Aroma (8.4%)Flavor (51.4%)
Viscosity (11.5%)Astringency (2.3%)
Cajá-mango(sample E)
Appearance (55.0%)Aroma (15.0%)Flavor (27.8%)
Viscosity (2.3%)
Appearance (18.3%)Aroma (12.5%)Flavor (51.6%)
Viscosity (14.4%)Astringency (3.4%)
Cajá-cashew(sample F)
Appearance (37.5%)Aroma (18.1%)Flavor (37.3%)
Viscosity (7.6%)
Appearance (14.0%)Aroma (23.2%)Flavor (55.2%)
Viscosity (7.7%)
the characteristics of appearance for beverage E and aroma for beverage D (Table 4).
The beverages cajá, cajá-strawberry and cajá-cashew (samples A, B and F) were differentiated from the others for presenting higher total soluble solids contents, the latter two also showing high ratios (36.6 and 26.6, respectively) (Table 2). Caleguer et al.
Table 3. Beverage acceptance considering the Internal Preference Mapping groups
Consumers/beverages1
Groups1 2 3
Number of consumers 65 35 6
Cajá (sample A) 6.3b ± 2.1 6.9b ± 1.8 5.7a ± 2.5Cajá-strawberry
(sample B) 7.7a ± 1.8 8.3a ± 0.8 3.7a ± 3.1
Cajá-pineapple (sample C) 4.4c ± 1.8 5.9b ± 1.8 5.0a ± 3.6
Cajá-jabuticaba (sample D) 3.5cd ± 2.1 4.9c ± 1.9 5.4a ± 2.8
Cajá-mango (sample E) 5.2c ± 1.9 5.5bc ± 2.1 5.7a ± 3.3
Cajá-cashew (sample F) 6.2b ± 2.7 6.7b ± 1.3 3.8a ± 2.2
1Different letters in the same column indicate significant difference (p ≤ 0.05) (0 = disliked extremely, 5=neither liked, nor disliked, 10 = liked extremely).

Mamede et al.
Food Sci. Technol, Campinas, 35(1): 143-149, Jan.-Mar. 2015 149
DP & P Product Research (1998). Senstools versão 2.3. Utrecht: DP & P Product Research. CD-RDM.
Sabbe, S., Verbeke, W., Deliza, R., Matta, V., & Van Damme, P. (2009). Effect of a health claim and personal characteristics on consumer acceptance of fruit juices with different concentrations of açaí (Euterpe oleracea Mart.). Appetite, 53(1), 84-92. http://dx.doi.org/10.1016/j.appet.2009.05.014. PMid:19467277
Silva, L. M. R., Lima Ada, S., Maia, G. A., Rodrigues Mdo, C., Figueiredo, R. W., & Sousa, P. H. (2011). Development of mixed beverages made of caja (Spondias mombin L.) and cashew apple (Anacardium occidentale) added of fructooligosaccharides and inulin. Archivos Latinoamericanos de Nutricion, 61(2), 209-215. PMid:22308948.
Silva, P. A., Carvalho, A. V., & Pinto, C. A. (2009). Elaboração e caracterização de fruta estruturada mista de goiaba e cajá. Revista de Ciências Agrárias (Belém.), 51, 99-113.
Soares, E. B., Gomes, R. L. F., Carneiro, J. G. M., Nascimento, F. N., Silva, I. C. V., & Costa, J. C. L. (2006). Caracterização física e química de frutos de cajazeira. Revista Brasileira de Fruticultura, 28(3), 518-519. http://dx.doi.org/10.1590/S0100-29452006000300039.
Souza, V. (2012). Supermercado moderno, marketing – especial verão 40°C. São Paulo: Supermercado Moderno. Retrieved from http://www.sm.com.br/
Specht, Z., & Blume, R. (2009). Competitividade e segmento de mercado à cadeia do morango: algumas evidências sobre o panorama mundial e brasileiro. In Anais do 47º CDNGRESSD, Sociedade Brasileira de Econômia, Adminsitração e Sociologia Rural – SDBER. Porto Alegre. Retrieved from http://www.sober.org.br/palestra/13/1245.pdf
Varela, P., Ares, G., Giménez, A., & Gámbaro, A. (2010). Influence of brand information on consumers’ expectations and liking of powdered drinks in central location tests. Food Quality and Preference, 21(7), 873-880. http://dx.doi.org/10.1016/j.foodqual.2010.05.012.
Vidigal, M. C. T. R., Minim, V. P. R., Carvalho, N. B., Milagres, M. P., & Gonçalves, A. C. A. (2011). Effect of a health claim on consumer acceptance of exotic Brazilian fruit juices: Açaí (Euterpe oleracea Mart.), Camu-camu (Myrciaria dubia), Cajá (Spondias lutea L.) and Umbu (Spondias tuberosa Arruda). Food Research International, 44(7), 1988-1996. http://dx.doi.org/10.1016/j.foodres.2010.11.028.
Villanueva, N. D. M., Petenate, A. J., & Silva, M. A. A. P. (2005). Performance of the hybrid hedonic scale as compared to the traditional hedonic, self-adjusting and ranking scales. Food Quality and Preference, 16(8), 691-703. http://dx.doi.org/10.1016/j.foodqual.2005.03.013.
Fixação dos Padrões de Identidade e Qualidade para Preparado Sólido para Refresco. Diário Dficial da República Federativa do Brasil.
Caleguer, V. F., Toffoli, C., & Benassi, M. T. (2006). Avaliação da aceitação de preparados sólidos comerciais para refresco sabor laranja e correlação com parâmetros físico-químicos. Semina: Ciências Agrárias, 27(4), 587-598.
Carvalho, A. (2010). Mercado global de bebidas 2010. São Paulo: Tetra Pak. Retrieved from http://www.valor.com.br/sites/default/files/alexandre.pdf.
Cunha, L. (2010). Nestlé vai disputar o mercado bilionário de suco em pó. Jornal Valor Econômico: Notícias de Mercado. Retrieved from http://www.canaldoprodutor.com.br/comunicacao/noticias/nestle-vai-disputar-o-mercado-bilionario-de-suco-em-po.
Estima, C. C. P., Philippi, S. T., Araki, E. L., Leal, G. V. S., Martinez, M. F., & Alvarenga, M. S. (2011). Consumo de bebidas e refrigerantes por adolescentes de uma escola pública. Revista Paulista de Pediatria, 29(1), 41-45. http://dx.doi.org/10.1590/S0103-05822011000100007.
Gofman, A., Moskowitz, H. R., & Mets, T. (2009). Developing new corporate understanding of an existing product. Journal of Product and Brand Management, 18(2), 84-94. http://dx.doi.org/10.1108/10610420910948988.
Instituto Brasileiro de Geografia e Estatística – IBGE. (2014). Produção de manga. Rio de Janeiro: IBGE. Retrieved from http://cod.ibge.gov.br/232FR.
Instituto Nacional de Metrologia, Normalização e Qualidade Industrial – INMETRD. (2013). Informação ao consumidor - Preparado sólido artificial para refresco (pó para refresco). Rio de Janeiro: INMETRD. Retrieved from http://www.inmetro.gov.br/consumidor/produtos/refresco.asp.
Koppel, K., Chambers, I. V. E. 4th, Vázquez-Araújo, L., Timberg, L., Carbonell-Barrachina, A. A., & Suwonsichon, S. (2014). Cross-country comparison of pomegranate juice acceptance in Estonia, Spain, Thailand, and United States. Food Quality and Preference, 31, 116-123. http://dx.doi.org/10.1016/j.foodqual.2013.03.009.
Lawless, H. T., & Heymann, H. (2010). Sensory evaluation of food – Principles and practices (2a ed.). London: Springer.
Maia, G. A., Sousa, P. H. M., & Lima, A. S. L. (2007). Processamento de frutas tropicais. Fortaleza: Edicoes UFC.
Dliveira, R. P., Nino, A. F. P., & Scivittaro, W. B. (2005). Mudas certificadas de morangueiro: maior produção e melhorqualidade da fruta. A Lavoura, 108(655), 35-38.