cal-cet2018 technical support document
TRANSCRIPT

1 November 16, 2018
CAL-CET2018 Technical Support Document
Technical Memorandum
November 16, 2018
© 2018 California Department of Transportation
1. Introduction
This technical support document for Caltrans Construction Emissions Tool (CAL-CET2018) includes
technical terminology that may be unfamiliar to the user. The terminology is related to construction
project emissions assessments. A glossary of terms is provided at the end of this document, and it is
recommended that the tool user review the glossary before reading the rest of the document to
understand technical details of CAL-CET2018.
Construction equipment usage at transportation projects is a source of both fine (PM2.5) and coarse
(PM10) particulate matters. It is also a source of oxides of nitrogen (NOx), which contributes to the
formation of PM2.5 and ozone in the atmosphere, and other pollutants such as carbon dioxide (CO2).
Air districts and other regulatory agencies have shown growing interest in evaluating transportation-
related construction emissions to support transportation and air quality planning. The Caltrans
construction emissions tool (CAL-CET) was developed to help Caltrans analysts improve the
calculation of construction-related emissions. In summary, CAL-CET requires user input on project
characteristics (e.g., project length, working days, type, and construction cost1), and the user can
override default values in any of the optional input fields. From this starting point, the tool performs
the following functions.
Calculates equipment-related costs for the project based on construction cost allocation
assumptions for each of seven project types;
Calculates total equipment activity (i.e., hours of operation) by applying a usage rate in units
of hours per $100,000 of equipment costs;
Allocates total equipment hours for the project to operational phases and equipment types;
and
Estimates emissions for each phase by applying emission rates (e.g., grams of NOx per
horsepower-hour of operation) to equipment activity estimates.
CAL-CET estimates exhaust emissions of total organic gases (TOG), reactive organic gases (ROG),
carbon monoxide (CO), NOx, PM10, PM2.5, CO2, methane (CH4), nitrous oxide (N2O), and black carbon
(BC) from off-road equipment and on-road vehicles. It also estimates hydrofluorocarbon (HFC) AC
1 This construction cost estimate should include only roadway and structural construction costs. Mobilization, contingency, and right-
of-way acquisition costs should not be included.

2 November 16, 2018
system leakage emissions from on-road vehicles, PM emissions from area-wide fugitive dust, and
evaporative emissions from painting and asphalt concrete paving.
This document provides detailed information on the underlying methods and data that CAL-CET2018
Version 1.0 relies upon to (1) estimate project-level equipment activity; and (2) calculate emissions
resulting from that activity. Note that instructions for applying CAL-CET to project-level assessments
are included in a user’s guide that is embedded in the tool itself.
2. Equipment Activity Estimates
Background
In 2002, a UC Davis-Caltrans Air Quality Project research team began work on a construction
emission estimation tool specifically designed for Caltrans highway projects. This work, which
eventually laid the foundation for the development of CAL-CET, initially derived equipment activity
estimates from unit rates that associated equipment hours with material quantities (e.g., cubic yards
of material moved) for eight primary operational phases of a construction project. Equipment activity
hours used to develop the unit rates for each operational phase were derived from actual field
inspectors’ diaries for 30 projects selected as representative of the types of Caltrans projects under
construction between 2000 and 2005 (Kable, 2006). Corresponding material quantities for each phase
were assembled from a larger data set of 7,768 Caltrans project bids that Caltrans Headquarters,
Division of Engineering Services, had compiled for their materials testing workload estimation
models (Niemeier et al., 2012). Preliminary testing and consultation with Caltrans Headquarters,
Division of Construction (Construction), indicated that this approach underestimated total equipment
hours for small projects compared to estimates developed by Construction from projected daily
production rates2.
After further consultation with Construction, CAL-CET was updated using Construction’s engineering
economic analysis rather than material quantities to estimate equipment activity, incorporating
statewide data on equipment rental costs and usage rates. This approach is consistent with Caltrans’
construction payment methods, which treat costs for equipment rental as a component of
construction costs. The cost-based method would account for all work activities, including minor
work items, allowing CAL-CET to estimate the expected population of equipment and the number of
hours that the equipment will be present on the job site.
Another key enhancement to CAL-CET was the application of established construction field operation
practices to estimate the proportion of time that specific types of equipment are not in operation
and producing no emissions for various operational phases. Equipment may be on the job site and
rented to the project, yet not in continuous use and, therefore, not emitting pollutants at all times.
Typical construction field operation practices involve a combination of human labor and equipment
2 Amount of work and construction materials expended per day (e.g., linear feet of drainage pipe installed per working day).

3 November 16, 2018
usage, whereby equipment would be off or idle during periods when the labor force is completing
preparation steps or other aspects of the operation that do not require equipment usage.
Figure 1 summarizes the step-by-step process used by CAL-CET to estimate and allocate equipment
activity, as well as the input parameters required to complete each step in the process.
Figure 1. Flow chart summarizing the CAL-CET equipment activity estimation process.

4 November 16, 2018
Overview of Data Sources
The CAL-CET input parameters shown in Figure 1 above were developed from a variety of data
sources, including data published by the Caltrans Division of Construction and information from the
30 project dataset assembled from field inspector diaries. Table 1 summarizes the data sources used
to develop the CAL-CET input parameters. A more detailed description of each parameter and its
development is provided in the sub-sections that follow.
Table 1. Parameters used by CAL-CET2018 to estimate and allocate equipment activity.
Parameter Data Source(s) Notes
Selected by the user from a drop-Project type
down menu
Seven project types are available:
1. Mainline improvements
2. Roadside improvements
3. Pavement preservation
4. Bridge construction and
preservation
5. Traffic safety and operations
6. Storm water and drainage
7. Landscaping
The cost should include only roadway
and structure construction. Consult with Construction cost Provided by the user
the project engineer to compile the
necessary project cost information.
Developed by Caltrans construction These factors assign a percentage of
Cost allocation factors engineers based on four years (2012- overall project cost to equipment costs
2015) of Force Account billables based on project type.
Equipment activity rates
Developed using:
Caltrans equipment rental rates
in effect from April 1, 2016
through March 21, 2017
(Caltrans, 2016)
Caltrans equipment usage
reports from January 1, 2013 to
December 2017.
Diary-based equipment activity
data from the 30 project dataset
(Kable, 2006)
Units are hours/$100,000 (hours of
equipment usage per $100,000 of
equipment costs, in year 2017 dollars).
These rental hours include time periods
for which the equipment is inactive (i.e.,
the engine is off).
Derived from diary-based equipment Activity allocation factors
These factors vary by project type.activity data from the 30 by operational phase
representative projects (Kable, 2006)
Derived from diary-based equipment Activity allocation factors These factors vary by operational
activity data from the 30 by equipment type phase.
representative projects (Kable, 2006)

5 November 16, 2018
Parameter Data Source(s) Notes
Provided by Caltrans construction
Operating hours per engineers based on project
workday experience and engineering
judgement
Project Type
These factors are used to adjust usage
hours for each type of equipment to
account for periods when the engine is
off and no emissions are produced.
CAL-CET allows users to classify a project into one of seven different project types. These types are
similar to the project categories in the quarterly and annual Project Delivery Reports that Caltrans
prepares for the California Transportation Commission and the California State Legislature.3
The
seven project types and their associated work activities are:
1. Mainline improvements – new roadway construction; roadway widening, reconstruction, or
realignment; addition of connectors, ramps, or lanes (e.g., truck, passing, or high-occupancy
vehicle [HOV] lanes).
2. Roadside improvements – shoulders, sidewalks, curbs, sound walls, bike lanes, vista points,
park-and-ride lots, rest stops.4
3. Pavement preservation – overlay installation, resurfacing, rehabilitation.
4. Bridge construction and preservation – replacement, widening, retrofit, repair, railing addition.
5. Traffic safety and operations – medians, barriers, signage and striping, lighting, signalization,
ramp meters, vehicle detectors.
6. Storm water and drainage – water quality, filtration, culverts, drains, dikes, ditches, basins.
7. Landscaping – planting, irrigation, preservation.
The construction items for each operational phase in CAL-CET are summarized in Appendix A.
Construction Cost
The input cost value should include only roadway and structure construction costs. Mobilization,
contingency, and right-of-way acquisition costs should not be included. Because equipment activity
rates (hours/$100,000) are based on 2017 dollars, users have the option of rolling the cost estimate
back to 2017 by using the Caltrans Construction Price Index value.5
The user must provide the last 12
months index value for the most recent 4th
Quarter, and CAL-CET will use this value in conjunction
with the last 12 months index value for the 4th
Quarter of 2017 to adjust the construction cost.
Cost Allocation Factors
3 See for example: http://www.dot.ca.gov/projmgmt/ctc/PDReport_Legislature_FY1415.pdf.
4 Rest stops include the construction of restroom buildings.
5 This information can be found at: http://www.dot.ca.gov/hq/esc/oe/hist_price_index.html.
6 November 16, 2018
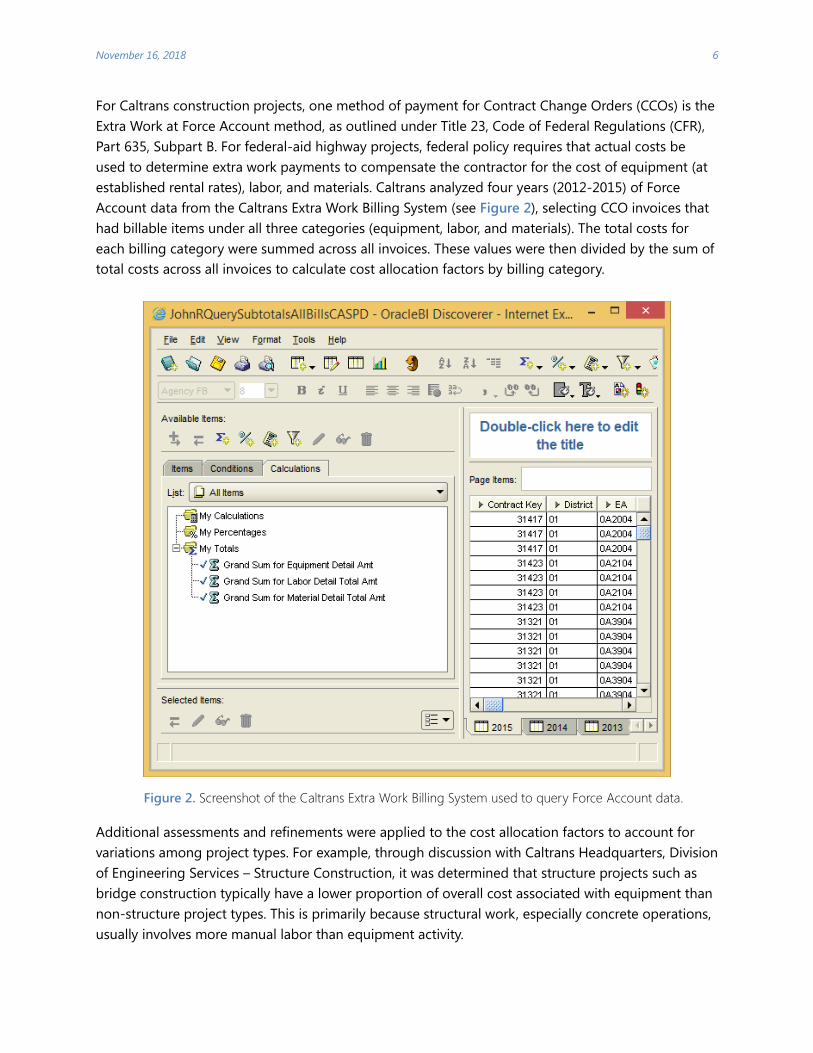
For Caltrans construction projects, one method of payment for Contract Change Orders (CCOs) is the
Extra Work at Force Account method, as outlined under Title 23, Code of Federal Regulations (CFR),
Part 635, Subpart B. For federal-aid highway projects, federal policy requires that actual costs be
used to determine extra work payments to compensate the contractor for the cost of equipment (at
established rental rates), labor, and materials. Caltrans analyzed four years (2012-2015) of Force
Account data from the Caltrans Extra Work Billing System (see Figure 2), selecting CCO invoices that
had billable items under all three categories (equipment, labor, and materials). The total costs for
each billing category were summed across all invoices. These values were then divided by the sum of
total costs across all invoices to calculate cost allocation factors by billing category.
Figure 2. Screenshot of the Caltrans Extra Work Billing System used to query Force Account data.
Additional assessments and refinements were applied to the cost allocation factors to account for
variations among project types. For example, through discussion with Caltrans Headquarters, Division
of Engineering Services – Structure Construction, it was determined that structure projects such as
bridge construction typically have a lower proportion of overall cost associated with equipment than
non-structure project types. This is primarily because structural work, especially concrete operations,
usually involves more manual labor than equipment activity.

7 November 16, 2018
Table 2 summarizes the resulting cost allocation factors, which are used within CAL-CET to estimate
the fraction of total project costs that are associated with construction equipment. Across all project
types, the percentage of total costs associated with equipment rentals range from 15% to 22%. While
the distribution factors associated with labor and material costs fluctuate each year, analysis of the
Caltrans Extra Work Billing System indicated that the factor associated with equipment costs remains
consistent across the four analysis years.
Table 2. Cost allocation percentages by project type.
Project Type
Mainline improvements
Roadside improvements
Pavement preservation
Bridge construction and preservation
Traffic safety and operations
Storm water and drainage
Landscaping
Equipment Activity Rates
Percentage of Construction Costs
Labor
33%
36%
31%
35%
33%
33%
38%
Materials
47%
46%
47%
50%
45%
45%
42%
Equipment
20%
18%
22%
15%
22%
22%
20%
To estimate overall equipment hours associated with a given project, the tool development team
estimated equipment activity rates in units of hours per $100,0006
of equipment costs. The first step
in developing these activity rates was calculating an average hourly rental rate for each type of
construction equipment covered by CAL-CET. These average rental rates were calculated using two
data sets:
1. Caltrans Division of Construction Annual Equipment Rental Rates – the Division of
Construction compiles an equipment rental rate book each year that provides hourly rental
rates for various makes and models of equipment. The rental rates adhere to the principles
and guidelines of the Federal Acquisition Regulation codified under Title 48, CFR Part 31.105.
The rental rate information corresponded to the publication period of April 1, 2016 through
March 21, 2017 (Caltrans, 2016).
2. Caltrans Division of Construction Annual Equipment Usage Report – as part of their financial
database, the Division of Construction records the rental hours for various equipment makes
and models each year. Five most recent usage reports (2013, 2014, 2015, 2016, and 2017)
were used to evaluate the equipment models most commonly used on Caltrans projects
throughout the state.
6 For project analysis purposes, the dollar amounts referenced in this document should be treated as 2017 dollars, unless otherwise
specified.

8 November 16, 2018
For a given equipment type, fractions of total equipment hours by model for the years 2013-2017
from the Caltrans usage reports were used as weighting factors to calculate a weighted average
rental rate for each type of equipment provided in CAL-CET. All equipment models were included in
this calculation, which was performed using the equation below:
𝑛
𝐴𝑅𝑅 = ∑ 𝑊𝐹𝑖 × 𝑅𝑅𝑖 𝑖=1
Where:
ARR = The average rental rate for a given equipment type
WFi = The weighting factor for equipment model i, which is the fraction of annual
equipment hours from the Caltrans usage reports associated with that model
RRi = The rental rate for equipment model i
This process ensured that, for each equipment type, rental rates for the most commonly used
equipment models had the greatest influence on the final result. Once the average rental rate for
each equipment type was determined, the rates were applied to diary-based equipment activity data
from the 30 representative projects to calculate total equipment costs for each project in 2017
dollars.
To get a single representative activity rate for each project type, the hours of equipment usage and
equipment costs were summed across all individual projects of a given type. The total hours of
equipment usage were then divided by total equipment costs to generate the final equipment
activity rate. More specifically, for all individual projects within each project type (e.g., mainline
improvement, traffic safety, and bridge construction), the hours of equipment usage were divided by
the total equipment cost, and this value was then multiplied by 100,000 to develop an activity rate in
units of hours per $100,000 of equipment costs. Sample data for the “Mainline Improvements”
project type are shown in Table 3, both for individual projects and the overall project type. This
process was repeated across all project types to generate the final equipment activity rates shown in
shown in Table 4.7
7 For non-Caltrans projects, consideration should be given to accounting for differences between Caltrans equipment rental rates
and construction fleets and the lead agency’s construction practices.

9 November 16, 2018
Table 3. Equipment hours and costs for projects of the “Mainline Improvements” type.
Project Type
Mainline
Improvements
Project ID Equipment
Hours Equipment Cost Hrs/$100,000
03-0C5304 706 $30,457 2,549
03-366404 33,547 $1,694,625 2,167
03-367714 38,851 $1,740,842 2,302
03-374214 4,666 $237,153 2,017
06-336604 10,535 $461,317 2,437
06-342154 11,853 $881,824 1,444
All Projects 100,157 $5,046,218 2,112
Table 4. Equipment activity rates by project type.
Project Type Equipment Activity Rate
(Hours/$100,000)
Mainline improvements 2,112
Roadside improvements 2,624
Pavement preservation 1,830
Bridge construction and preservation 2,279
Traffic safety and operations 2,674
Storm water and drainage 3,379
Landscaping 3,379
Note that the average equipment activity rates for each project type provide a reasonable
representation of the range of activity rates across individual projects within that overall project type,
as shown in Figure 3.

10 November 16, 2018
Figure 3. Individual and average equipment activity rates for projects within a given project type.
Equipment Hours Allocations
Once total equipment activity (in hours) is estimated using project equipment costs and the
equipment activity rates, these total hours must be allocated to operational phases and equipment
types. In CAL-CET, these allocations are done using diary data derived from the 30 representative
Caltrans projects. Originally, these 30 projects were categorized into six project types to correlate
with the overall distribution of projects under construction by Caltrans between 2000 and 2005.
These six previous project types were:
Resurface existing highway
Pavement rehabilitation/widening
Construct freeway/extra lane
Construct, reconstruct bridge
Construct median, thrie beam barrier
Landscaping
Since these six previous project types used for the original categorization differ somewhat from the
current seven project types defined in CAL-CET, a cross-walk was developed to establish a
relationship between the two categorization schemes, as shown in Table 5. Note that a one-to-one
match does not exist for all project types between the two categorization schemes. For example, the
“Pavement Rehabilitation/widening” project type from the original 30 project dataset may involve

11 November 16, 2018
work that falls into both the “Pavement Preservation” and “Mainline Improvements” project types in
the new categorization scheme. However, these projects appeared to mainly involve rehabilitation
work, making it more appropriate to classify them as “Pavement Preservation.” Once this mapping
between categorization schemes was complete, the reallocated equipment activity percentages for
CAL-CET were calculated, as shown in Table 6.
Once total equipment hours for a project have been allocated to operational phases, the next step is
to allocate hours to each individual equipment type. This step also relies on diary data from the 30
representative projects and is largely consistent with the initial CAL-CET methodology.8
The diary
data were used to identify key equipment types used during each phase of construction and to
develop a distribution of the percentage of equipment hours associated with each equipment type.
For example, within the base/subbase/imported borrow operational phase, 18 equipment types used
to complete the work were identified. Among those equipment types, excavators accounted for 4.5%
of the total equipment hours associated with that phase. A complete list of allocation percentages by
operational phase and equipment type is shown in Table 7.
Table 5. Cross-walk for allocating equipment hours by operational phase.
Project Type Data Source for Allocating Equipment Hours by
Operational Phase
Mainline improvements
Roadside improvements
Pavement preservation
Bridge construction and preservation
Traffic safety and operations
Storm water and drainage
Landscaping
Percentages taken directly from the “Construct freeway/extra
lane” project type
Percentages represent the average of data from the following
project types (no pavement or bridge work):
Construct freeway/extra lane
Construct median, thrie beam barrier
Landscaping
Percentages represent the average of data from the “Resurface
existing highway” and “Pavement rehabilitation/widening”
project types
Percentages taken directly from the “Construct, reconstruct
bridge” project type
Percentages taken directly from the “Construct median, thrie
beam barrier” project type
Percentages taken directly from the “Landscaping” project type
Percentages taken directly from the “Landscaping” project type
Note that the initial version of CAL-CET included the striping/painting activities as a part of the Paving operational phase. In the
current version of CAL-CET striping/painting activities are moved into the Traffic Signalization Signage phase.
8

-
12 November 16, 2018
Table 6. Equipment activity allocation percentages by project type and operational phase.
Phase
Project Type
Mainline
Improvements
Roadside
Improvements
Pavement
Preservation
Bridge
Construction,
Reconstruction
Traffic
Safety &
Operations
Storm
Water &
Drainage
Land
scaping
Land Clearing and
Grubbing
Roadway Excavation &
Removal
Structural Excavation &
Removal
Base and Subbase
Structural Concrete
Paving
Drainage / Environmental
/ Landscaping
Traffic Signalization /
Striping / Painting
Total
2.3% 1.3% 0.1% 0.7% 0.0% 1.7% 1.7%
15.5% 8.7% 19.0% 4.1% 10.9% 0.1% 0.1%
2.2% 0.7% 0.3% 11.4% 0.0% 0.0% 0.0%
13.2% 5.8% 7.8% 9.0% 4.0% 0.8% 0.8%
11.3% 5.1% 2.1% 46.6% 0.0% 4.5% 4.5%
12.6% 6.7% 27.1% 2.4% 7.7% 0.0% 0.0%
11.8% 35.1% 6.0% 4.2% 0.2% 92.6% 92.6%
31.2% 36.6% 37.6% 21.6% 77.1% 0.4% 0.4%
100.0% 100.0% 100.0% 100.0% 100.0% 100.0% 100.0%

13 November 16, 2018
Table 7. Distribution of hours by equipment type, across eight construction operational phases used to characterize Caltrans projects. (Page 1 of 2)
Equipment Type
(some equipment types are not
used in all operational phases)
% Average Hours of Equipment Use by Operational Phase
Base/Subbase
/Imp. Borrow
Drainage/Env/
Landscaping
Land
Clearing/
Grubbing
Paving
Roadway
Excavation
& Removal
Structural
Concrete
Structural
Excavation
& Removal
Traffic
Signalization/
Striping/
Painting
Heavy-Duty Trucks 14.57
Light-Duty Truck 10.88
Aerial Lifts
Bore/Drill Rigs
Cement & Mortar Mixers
Commercial Turf Equipment
Concrete/Industrial Saws 0.21
Cranes
Crawler Tractors/Dozers 6.63
Crushing/Processing Equipment
Excavators 4.52
Graders 10.13
Lt. Commercial Air Compressors 0.60
Lt. Commercial Generator Sets
Lt. Commercial Pressure Washers
Lt. Commercial Pumps
Lt. Commercial Welders
Off-Highway Tractors
Off-Highway Trucks
12.47
19.61
0.29
1.73
1.28
0.42
0.51
1.16
1.96
0.43
2.77
9.42
8.42
18.45
6.84
0.95
3.05
23.29
2.49
18.77
16.24
14.43
5.25
0.08
0.16
1.78
1.20
1.02
0.93
13.77
12.13
0.72
1.74
5.73
4.83
7.10
0.63
0.55
1.18
8.56
23.66
3.84
1.45
4.47
1.58
1.77
0.25
0.85
0.24
6.86
12.67
1.48
9.44
14.57
9.10
0.94
0.52
0.46
1.68
0.68
17.89
16.66
1.12
2.79
4.71
0.06
0.26
0.65
0.41
5.99
11.34
6.91
1.06
0.28
1.57
0.63
0.07 0.03

-
14 November 16, 2018
Table 7. Distribution of hours by equipment type, across eight construction operational phases used to characterize Caltrans projects. (Page 2 of 2)
Equipment Type
(some equipment types are not used
in all operational phases)
% Average Hours of Equipment Use by Operational Phase
Base/Sub
base/Imp.
Borrow
Drainage/Env/
Landscaping
Land
Clearing/
Grubbing
Paving
Roadway
Excavation
& Removal
Structural
Concrete
Structural
Excavation
& Removal
Traffic
Signalization/
Striping/
Painting
Other Construction Equipment
1.83
1.47
1.81
8.22
0.55
4.84
12.30
3.19
0.46
1.85
4.10
0.68
4.02
0.35
6.80
100
Other General Industrial Equipment
Pavers/Shoulder Backing/AC Dikes
Paving Equipment
Plate Compactors
Rollers
Rough Terrain Forklifts
Rubber Tire Dozers
Rubber Tire Loaders
Scrapers
Signal Boards
Skid Steer Loaders
Surfacing Equipment
Sweepers/Scrubbers
Tampers/Rammers
Tractors/Loaders/Backhoes
Trenchers
Water Trucks
Total
0.96
1.58
1.63
0.83
1.37
0.41
2.60
0.37
1.88
5.68
0.11
1.36
0.26
6.07
13.43
1.00
100
0.94
2.71
5.61
3.96
2.34
0.82
1.69
1.91
1.32
4.87
100
0.68
7.90
7.52
0.84
17.20
0.39
3.87
0.36
2.67
1.90
1.89
4.97
0.49
5.65
2.58
100
0.93
0.31
0.86
0.74
5.85
0.38
4.90
8.19
5.14
1.16
3.13
3.78
0.52
8.51
7.23
100
2.92
2.80
0.82
0.42
1.12
9.75
3.02
0.81
3.51
1.72
1.21
0.12
0.23
2.28
1.04
0.57
100
0.13 1.69
1.31
0.29
1.03 0.05
1.02 0.56
2.96 1.49
2.24 0.57
0.15
5.48 40.02
1.59 1.09
6.36 0.91
0.06 0.76
0.13
2.95 1.72
0.85
14.33 0.44
100 100
This table presents summary findings from the 30 project diaries concerning the equipment types used for each construction operational phase and the percent of hours within an operation assigned to a given equipment type. Numbers may not sum to
100% because of rounding.

15 November 16, 2018
Engine Operating Hours
Individual pieces of construction equipment may be present on a job site but not in continuous use
throughout a typical 8-hour workday (with the exception of equipment like signal boards used for
traffic control). As a result, a given piece of equipment may be onsite and “rented” to the project, but
not actively working (i.e., the engine is off and no emissions are produced). Since the purpose of
CAL-CET is to estimate emissions, total equipment hours derived from rental rates must be adjusted
to account for engine-off periods.
To support this adjustment, Caltrans engineers provided a table of estimated engine operating (i.e.,
engine on) hours per 8-hour workday for equipment types to which CAL-CET assigns hours for each
operational phase, as previously shown in Table 7. These estimates culminated from Caltrans
Construction engineers’ field experience and engineering judgement and are shown in Table 8.
Factors that limit equipment daily operation include preparation work that must be undertaken at
the beginning of a work shift before any equipment can be used and cleanup work that must be
done at the end of the shift before the job site is shut down for the day.
In addition, any required lane closures at a construction site limit the amount of time available to
conduct actual work activities. To provide for the safety of the public and construction workers, no
work may be performed on a highway until a lane closure is properly set up, and all work operations
must be cleared from the highway by the end of the lane closure time period. Other factors
considered by Caltrans Construction engineers in developing the data in Table 8 include the type of
equipment and the typical work activities it performs during each operational phase. For example,
during operations that involve earthwork or excavation, a water truck would be used heavily to
control fugitive dust and maintain soil saturation. However, for other operations, the water truck is
primarily onsite to provide support and would typically be stationary. In addition, engines on
equipment such as aerial lifts are only used to move the equipment into position. The lift is then
locked in place while work is being conducted. Therefore, a lift may be used for an entire work shift,
though the engine is running for only a limited time.
Finally, note that in Table 8, some fields for operating hours are blank, which represent equipment
types to which CAL-CET does not assign hours for a given operational phase. However, users have
the option of manually altering the default equipment populations (number of pieces of equipment)
produced by the tool based on the requirements of their project. Given the atypical nature of such
equipment assignments, a 50% utilization rate will be assumed (i.e., 4 hours of engine operation
during an 8-hour workday). This value is within the range of average equipment usage across
individual operational phases, which varies from 3.0 to 4.7 hours.

- -
16 November 16, 2018
Table 8. Typical engine operating hours by equipment type, across eight construction operational phases used to characterize Caltrans projects. (Page 1 of 2)
Equipment Type
Typical Operating (Engine on) Hours Per 8 hour Workday
Base/Subbase
/Imp. Borrow
Drainage/Env/
Landscaping
Land
Clearing/
Grubbing
Paving
Roadway
Excavation
& Removal
Structural
Concrete
Structural
Excavation
& Removal
Traffic
Signalization/
Striping/
Painting
Heavy-Duty Trucks 7.00
Light-Duty Truck 4.00
Aerial Lifts
Bore/Drill Rigs
Cement & Mortar Mixers
Commercial Turf Equipment
Concrete/Industrial Saws 2.00
Cranes
Crawler Tractors/Dozers 7.00
Crushing/Processing Equipment
Excavators 5.00
Graders 7.00
Lt. Commercial Air Compressors 2.00
Lt. Commercial Generator Sets 5.00
Lt. Commercial Pressure Washers
Lt. Commercial Pumps
Lt. Commercial Welders
Off-Highway Tractors
Off-Highway Trucks
5.00
2.00
1.00
2.00
3.00
7.00
2.00
2.00
3.00
3.00
2.00
3.00
4.00
1.00
6.00
2.00
2.00
6.00
6.00
6.00
5.00
6.00
3.00
1.00
2.00
4.00
2.00
3.00
3.00
3.00
1.00
6.00
7.00
2.00
3.00
6.00
6.00
7.00
7.00
3.00
5.00
6.00
2.00
3.00
2.00
5.00
1.00
5.00
1.00
1.00
1.00
6.00
7.00
3.00
5.00
2.00
2.00
6.00
4.00
4.00
3.00
4.00
4.00
4.00
3.00
4.00
3.00
1.00
5.00
4.00
1.00
7.00
2.00
6.00
5.00
2.00
1.00
5.00
3.00
4.00 1.00

- -
-
17 November 16, 2018
Table 8. Typical engine operating hours by equipment type, across eight construction operational phases used to characterize Caltrans projects. (Page 2 of 2)
Equipment Type
Typical Operating (Engine on) Hours Per 8 hour Workday
Base/Sub
base/Imp.
Borrow
Drainage/Env/
Landscaping
Land
Clearing/
Grubbing
Paving
Roadway
Excavation
& Removal
Structural
Concrete
Structural
Excavation
& Removal
Traffic
Signalization/
Striping/
Painting
Other Construction Equipment
7.00
7.00
2.00
7.00
2.00
5.00
6.00
3.00
2.00
2.00
4.00
2.00
5.00
2.00
6.00
Other General Industrial Equipment
Pavers/Shoulder Backing/AC Dikes
Paving Equipment
Plate Compactors
Rollers
Rough Terrain Forklifts
Rubber Tire Dozers
Rubber Tire Loaders
Scrapers
Signal Boards
Skid Steer Loaders
Surfacing Equipment
Sweepers/Scrubbers
Tampers/Rammers
Tractors/Loaders/Backhoes
Trenchers
Water Trucks
7.00
7.00
3.00
3.00
2.00
5.00
1.00
3.00
6.00
1.00
4.00
3.00
6.00
6.00
3.00
3.00
6.00
7.00
3.00
6.00
3.00
2.00
4.00
1.00
7.00
7.00
7.00
4.00
7.00
2.00
2.00
2.00
3.00
4.00
6.00
6.00
2.00
2.00
2.00
7.00
7.00
2.00
7.00
2.00
7.00
7.00
3.00
2.00
6.00
3.00
4.00
4.00
7.00
4.00
7.00
7.00
1.00
1.00
5.00
4.00
1.00
3.00
3.00
3.00
2.00
1.00
4.00
3.00
2.00 5.00
7.00
7.00 7.00
4.00 1.00
4.00 2.00
2.00 2.00
6.00 2.00
2.00
3.00 3.00
3.00 3.00
2.00 4.00
2.00 2.00
2.00
6.00 3.00
4.00
4.00 3.00
This table presents engine operating hours per 8-hour workday for the equipment types assigned to each construction operation phase by CAL-CET. For example, a value of 2.00 indicates that the given equipment engine is typically on and generating
emissions for 2.00 hours during each 8-hour workday, or 25% of the time. Where fields for operating hours are blank, CAL-CET does not assign hours to that equipment type for the specified operational phase. However, users have the option of
manually assigning equipment to operational phases. Given the atypical nature of these assignments, a 50% utilization rate will be assumed (i.e., 4 hours of engine operation during an 8-hour workday).

18 November 16, 2018
3. Emissions Estimates
Once the equipment activity by operational phase and equipment type has been adjusted to account
for engine-off hours, CAL-CET estimates exhaust emissions by applying appropriate emission factors
(g/hp-hr) to the estimated activity data (hours) and rated horse power for each type of equipment. In
addition, the tool estimates PM emissions from area-wide fugitive dust and evaporative emissions
from painting and asphalt concrete paving. CAL-CET outputs both emissions and fuel consumption
estimates by operational phase, source type, and calendar year for the total project (tons) and for an
average day (lb). The current version of the tool also provides an estimate of maximum daily average
emissions over the course of the project. This section provides information on how emissions
estimates are prepared and reported in CAL-CET.
Exhaust Emissions
Off-Road Mobile Sources
The off-road mobile source category includes emissions from construction equipment and off-road
trucks. CAL-CET estimates exhaust emissions from off-road mobile sources using the following
formula:
𝑛
𝐸𝑂𝐹𝐹 = ∑ 𝑁𝑖 × 𝐸𝐹𝑖 × 𝑃𝑖 × 𝐿𝑖 × 𝐻𝑖 𝑖=1
Where:
EOFF = Total off-road exhaust emissions for the project
Ni = Number of pieces of equipment for equipment type i
EFi = Emission factor for equipment type i (g/brake-hp-hr)
Pi = Rated power of equipment type i (hp)
Li = Load factor for equipment type i (ratio of actual power used to available power)
Hi = Hours of use per day for equipment type i
The exhaust emission factors used in CAL-CET were derived from the California Air Resources Board’s
(CARB) OFFROAD2017 model, which estimates emissions for a variety of off-road mobile sources
(https://www.arb.ca.gov/msei/ordiesel/ordas_ef_fcf_2017.pdf). Data from the OFFROAD2017 - ORION
Web Database were processed to obtain the following statewide parameters: zero-hour emission
factors (steady-state emission factors for new equipment), equipment model years based on
horsepower and tier categories (and, subsequently accumulated use hours), and fuel correction
factors. Where applicable, parameters were calculated as averages weighted by calendar year- and
model year-specific activity (hours/year). CAL-CET uses default zero-hour emission factors that are an
activity-weighted average across all model years and horsepower categories. Users can select an
emission standard tier category (e.g., Tier 4) that will be applied to all off-road construction
equipment, and can also select different tiers for individual types of equipment. Note that changing

19 November 16, 2018
the tier standard from the default value to the latest Tier 4 will substantially reduce equipment
emissions for various pollutants (e.g., NOx and PM), but not for fuel consumption and CO2 because
fuel consumption rates and CO2 emission rates are not specifically regulated under the engine tier
standards. Deterioration rates were calculated as averages across model years in each horsepower
and tier category using data in the OFFROAD2017 spreadsheet tool
(https://www.arb.ca.gov/msei/ordiesel/ordas_ef_fcf_2017_v7.xlsx). For CO, TOG, ROG, NOx, PM10,
PM2.5, and CO2, emission factors for any equipment type are computed using the following formula:
𝐸𝐹 = (𝐸𝐹0 + 𝐷𝑅 × 𝐶𝐻𝑟𝑠) × 𝐹𝐶𝐹
Where:
EF0 = zero-hour emission factor (g/hp-hr)
DR = deterioration rate (g/hp-hr2)
CHrs = cumulative engine hours
FCF = fuel correction factor (unitless)
Note that emission factors for any equipment type are computed by adjusting the zero-hour
emission factors to account for the transient demands of equipment operation and emission changes
with the age of the engine (deterioration). The FCF is applied to adjust for differences in sulfur and
aromatic content between federal and California fuel.
Emission factors for CH4, N2O, and BC for off-road equipment were obtained from California's
Greenhouse Gas Inventory for 2015 (https://www.arb.ca.gov/cc/inventory/doc/doc_index.php).
Default load factors are directly from OFFROAD2017 for various types of equipment and default
horsepower values are calculated as OFFROAD2017 population-weighted averages across engine
model years and horsepower categories. These factors represent the fraction of available power that
is typically used during operations. For example, for diesel excavators, the load factor of 0.38 means
that 38% of available power is typically used while an excavator is in operation.
On-road Mobile Sources
The on-road mobile source category includes emissions from light-duty trucks and heavy-duty trucks
(including water trucks) used to transport materials or employees to and from the construction site
(excluding commute trips). The basic formula used to calculate on-road exhaust emissions is:
𝑛
𝐸𝑂𝑁 = ∑ 𝑁𝑖 × 𝐴𝑖 × 𝐸𝐹𝑖 𝑖=1
Where:
EON = Total on-road emissions for the project
Ni = Number of vehicle round trips for vehicle type i
Ai = Average round trip distance for vehicle type i (mi/round trip)

20 November 16, 2018
EFi = Emission factor for vehicle type i (g/mi)
The daily vehicle activity (i.e., vehicle miles) for trucks in the on-road mobile source emissions
calculation is estimated based on the user’s input of number of round trips per day and an average
round trip distance (CAL-CET includes a default of 20 miles per vehicle round trip for heavy-duty
trucks and a default of two times the length of the project per vehicle round trip for light-duty
trucks). Emission and fuel consumption factors for light-duty trucks and heavy-duty trucks were
obtained from EMFAC2017 for an average speed of 30 miles per hour. In CAL-CET, light-duty truck
corresponds to light-duty truck 1 and 2 in EMFAC2017; heavy-duty truck corresponds to light heavy-
duty, medium heavy-duty, and heavy heavy-duty trucks in EMFAC2017. Water trucks are specified as
medium heavy-duty trucks and their emission factors were obtained from EMFAC2017 for an average
speed of 10 miles per hour. For on-road trucks, emission factors for CH4 and N2O are from
EMFAC2017; HFC emission factors for on-road trucks were estimated by CARB by combining data
from SAE International’s Test Procedure for Determining Refrigerant Emissions from Mobile Air
Conditioning Systems (SAE J2763) (SAE International, 2015) and CARB’s annual average HFC leakage
data (Gallagher et al., 2016; Schwarz, 2001; Wimberger and Stover, 2009; Vincent et al., 2004); BC
emission factors are from CARB speciation profiles (https://www.arb.ca.gov/ei/speciate/speciate.htm).
Fugitive Dust Emissions
Disturbed areas on the construction site emit fugitive dust, which is mostly in the form of PM10 (i.e.,
coarse particles). CARB’s area-wide emissions methodology for road construction dust (California Air
Resources Board, 1997) recommends a constant PM10 emission factor of 220 lb/acre-month. This
factor was developed by Midwest Research Institute (1996) and is applied in CAL-CET as follows:
𝐹𝐷𝑃𝑀10 = 𝜃 × 𝐴𝑖 × 𝐸𝐹 / 22
Where:
FDPM10 = Daily PM10 emissions from fugitive dust
θ = Dust control effect (default is assumed to be 50%)
Ai = Acres disturbed during operation i
EF = Emission factor for PM10 (220 lb/acre-month)
22 = Assumed number of working days per month
Note that in this method, the total disturbed area for an operation is distributed evenly across all
working days for that operation. The total disturbed area is computed based on the projected
roadway length using parameters suggested by CARB for road construction (California Air Resources
Board, 1997), as shown in Table 9.

21 November 16, 2018
Table 9. Disturbed acreage parameters by road type.
Road Type Disturbed Acres Per Mile
Freeway 12.1
Highway 9.2
City and County 7.8
Evaporative Emissions
The main pollutant from painting and asphalt application is volatile organic compound (VOC)
emissions, which are reported as TOG and ROG in CAL-CET. Painting primarily refers to surface
coatings, which can be water-based or solvent-based. Evaporative emissions from painting
operations are calculated in CAL-CET as follows:
𝐸𝑉𝑉𝑂𝐶 = 𝐸𝐹𝑤𝑏 × 𝑉𝑤𝑏 + 𝐸𝐹𝑠𝑏 × 𝑉𝑠𝑏
Where:
EVVOC = Total evaporative VOC emissions from painting
EFwb = Emission factor for water-based paints (0.74 lb/gal)
Vwb = Volume of water-based paints (gal)
EFsb = Emission factor for solvent-based paints (3.87 lb/gal)
Vsb = Volume of solvent-based paints (gal)
Note that the VOC emission rate for water-based coatings is much lower than the emission rate for
solvent-based coatings, which is due to the lower VOC content in water-based paints.
Estimation of asphalt emissions follows EPA’s AP-42 compendium (U.S. Environmental Protection
Agency, 1995), which bases VOC emissions on the amount of volatile petroleum distillates, or
diluents, used to liquefy (or “cutback”) the asphalt cement. This method assumes naphtha is used as
a diluent, with a density of 0.7 kg/l, and that the density of asphalt cement is 1.1 kg/l. It is also
assumed that 95% of the diluent evaporates. CAL-CET requires the user to input the total mass of the
asphalt being applied and the diluent content (% by volume); a default value of 35% diluent content
is included in the tool.
Daily Emissions
Length of Operations
CAL-CET calculates the duration of each operational phase, or “Length of Operations” for each phase,
using the user-defined estimated working days for the project and default values for the percentage
of working days for each phase by project type. The phase duration is calculated as the number of
working days. These working days are a preliminary estimate. It is the analyst’s responsibility to

22 November 16, 2018
ensure that the estimated working days are reflective of the anticipated work schedule for the
project. The analyst should consult with the the number of contract working days. Experience and
judgment should be used in the final determination of contract working days for each project.
The default working day percentages shown in Figure 4 and Table 10 are derived from the diary data
of off-road equipment usage in the 30 Caltrans representative projects. On-road vehicles and signal
boards were not considered in developing the default length of operations since they can be used
for various purposes in addition to the primary operational activities. This minimizes the potential for
over-estimating the length of operation and ensures that the number of working days are properly
accounted for when major construction equipment are in use and emissions would be highest. The
following steps outline the analysis methodology:
1. Identify dates that are working days in the diary data for the 30 projects; working days are
dates on which there is at least one piece of off-road equipment with non-zero work shifts.
2. Sum the working days by phase for each of the 30 projects from the diary data.
3. For each project type in the 30 projects, sum the working days by phase across the corresponding projects; these are project type-specific working days by phase.
4. For each project type in the 30 projects, sum the working days across phases; these are the
total working days for each project type.
5. For each project type in the 30 projects, calculate the length of operation percentages by
phase (LOOphase, project type (%)) by dividing the project type-specific working days by phase
(Step 2) by the total working days for each project type (Step 3).
6. Map the length of operation percentages by phase for the project types in the 30 projects to
the project types used in CAL-CET using simple averaging.
7. Normalize the length of operation percentages (Step 5) to ensure the sum across phases for
each project type equals 100%.
The Length of Operations (LOO) in working days by phase and project type is then calculated as the
number of work days (Monday through Friday) using the default percentage of working days
between the project start date and end date determined from the estimated working days for the
project. The default percentages of working days, or length of operations, for each phase and project
type are shown in Table 10. LOO is rounded to the nearest day.

23 November 16, 2018
Figure 4. Default distribution of working days by operation phase and project type.

-
24 November 16, 2018
Table 10. Length of operation percentages by project type and operational phase.
Phase
Project Type
Mainline
Improvements
Roadside
Improvements
Pavement
Preservation
Bridge
Construction,
Reconstruction
Traffic
Safety &
Operations
Storm
Water &
Drainage
Land
scaping
Land Clearing and
Grubbing
Roadway Excavation &
Removal
Structural Excavation &
Removal
Base and Subbase
Structural Concrete
Paving
Drainage / Environmental
/ Landscaping
Traffic Signalization /
Striping / Painting
Total
6% 5% 3% 2% 0% 5% 5%
19% 17% 17% 7% 42% 1% 1%
4% 4% 7% 12% 0% 0% 0%
12% 9% 14% 11% 14% 7% 7%
18% 15% 5% 47% 0% 0% 0%
11% 9% 30% 5% 10% 0% 0%
17% 29% 10% 5% 3% 84% 84%
12% 13% 15% 12% 31% 2% 2%
100% 100% 100% 100% 100% 100% 100%
25 November 16, 2018
Average Daily Emissions
To estimate average daily emissions for each operational phase, CAL-CET divides the total emissions
for a given phase by the default or user-defined duration of that phase in units of working days.
Users also have the option of defining a start date for each individual phase and allowing overlap to
occur between two or more phases. If start dates for individual phases are not provided, CAL-CET
assumes that each operational phase occurs in sequential order with no overlap.
Maximum Daily Average Emissions
Several air quality management districts in California have adopted air quality thresholds of
significance for criteria pollutants under California Environmental Quality Act (CEQA) guidelines to
assess air quality impacts from development projects. Emissions resulting from construction activities
are typically assessed by daily average or annual average. For example, the Sacramento Metropolitan
Air Quality Management District (SMAQMD) defined a construction-related NOx emissions threshold
within their region as a maximum daily value of 85 lb. To assist project analysts in their discussion
with the local air districts, CAL-CET includes estimates of maximum daily average emissions.
The methodology is consistent with the approach established by SMAQMD for the Roadway
Construction Emissions Model (RCEM), which reports the highest average daily emissions across all
construction operational phases as the maximum daily value. CAL-CET, like RCEM, allows operations
to overlap as needed and considers this overlap in the calculation of maximum daily emissions.
Given the default schedule of operations, and any user-changes to the default schedule, functionality
was added to CAL-CET to estimate maximum daily average emissions as follows:
1. Average daily emissions are estimated for each operational phase based on the user-defined
estimated working days for the project.
2. If applicable, user-defined changes to the default project schedule (i.e., phase-specific start
dates and phase durations) are checked to determine whether any phases overlap in time.
3. If no overlap occurs, the highest average daily value across all phases is identified as the
maximum daily average emissions for each pollutant.
4. If overlap occurs, the average daily emissions for overlapping phases are summed and
compared to the average daily emissions for individual phases to identify a maximum value
for each pollutant.
Note that this approach accounts for variability in equipment activity and emissions between
different operational phases. However, this approach does not consider daily variations within a given
phase, because such daily variations are difficult to predict for a given project at the planning stage.

26 November 16, 2018
References
California Air Resources Board (1997) Miscellaneous process methodologies: road construction dust.
Available at http://www.arb.ca.gov/ei/areasrc/index7.htm.
Caltrans (2016) Labor surcharge and equipment rental rates: effective April 1, 2016, through March
21, 2017. Available at http://www.dot.ca.gov/hq/construc/eqrr/Book_2016.pdf.
Gallagher G., Deshpande B., Gupta P., and Huang A. (2016) California’s high global warming potential
gases emission inventory. Emission inventory methodology and technical support document
by the State of California Air Resources Board, Air Quality Planning and Science Division,
Sacramento, CA, April. Available at
https://www.arb.ca.gov/cc/inventory/slcp/doc/hfc_inventory_tsd_20160411.pdf.
Kable J.M. (2006) Collecting construction equipment activity data from Caltrans project records. M.S.
Thesis, University of California at Davis, Davis, CA. Available at
http://www.uctc.net/research/papers/828.pdf.
Midwest Research Institute (1996) Improvement of specific emission factors (BACM Project No. 1). Final
report prepared for the South Coast Air Quality Management District, Contract No. 95040, March.
Niemeier D., Eisinger D., Bai S., and Benson P. (2012) Updated guidance for estimating equipment
activity. Technical memorandum prepared for the California Department of Transportation,
Sacramento, CA, by Sonoma Technology, Inc., Petaluma, CA, STI-909115-4320-TM, April.
SAE International (2015) Test procedure for determining refrigerant emissions from mobile air
conditioning systems. Standard SAE J2763_201502.
Schwarz W. (2001) Emission of refrigerant R-134a from mobile air-conditioning systems. Prepared for
the the German Federal Environment Office, September.
U.S. Environmental Protection Agency (1995) AP-42: Compilation of air pollutant emission factors.
Fifth Edition, Volume I, Chapter 4: Evaporation Loss Sources. Available at
http://www.epa.gov/ttn/chief/ap42/ch04/final/c4s05.pdf.
Vincent R., Cleary K., Ayala A., and Corey R. (2004) Emissions of HFC-134a from light-duty vehicles in
California. SAE Technical Paper 2004-01-2256, doi: 10.4271/2004-01-2256.
Wimberger E. and Stover C. (2009) Emissions of HFC-134a in auto dismantling and recycling. Final report
prepared for the California Air Resources Board, October 15; revised July 16, 2010.

27 November 16, 2018
Glossary of Terms
Construction diary A record that documents construction project activities, including work
progress, site conditions, and labor and equipment usage
Equipment activity Hours of equipment operation
Equipment hours Hours of equipment operation (also referred to as equipment activity)
Operational phase A distinct part of the construction process in which activities are grouped
together (e.g., construction activities in the Land Clearing/Grubbing
operational phase result in preparing the work area by removing trees,
vegetation, or other material that may interfere with roadway construction)
Production rate Amount of work and construction materials expended for a construction item
per day (e.g., linear feet of drainage pipe installed per working day for
drainage activity
Usage rate Hours of equipment use per $100,000 of equipment costs

28 November 16, 2018
Appendix A. Construction Items for the Eight Operational Phases
Land Clearing/Grubbing
Clearing and grubbing
Remove shrub
Roadside clearing
Roadway Excavation & Removal
Cold plane asphalt concrete pavement
Crack existing concrete pavement
Grind existing concrete pavement
Obliterate surfacing
Remove asphalt concrete dike
Remove base and surfacing
Remove concrete barrier
Remove concrete (curb and gutter)
Remove concrete curb and sidewalk
Remove concrete pavement and base
Remove concrete (miscellaneous)
Remove culvert
Remove downdrain
Remove flared end section
Remove headwall
Remove inlet
Remove structural section
Roadway excavation
Structural Excavation & Removal
Bridge removal
Bridge removal (portion)
Core concrete
Grind bridge deck

29 November 16, 2018
Structural Excavation & Removal
Remove concrete deck surface
Remove headwall
Remove unsound concrete
Salvage broken concrete
Structure excavation (bridge)
Structure excavation (pumping plant)
Structure excavation (retaining wall)
Structure excavation (Type A)
Structure excavation (Type D)
Structure excavation (Type DH)
Base/Subbase/Imported Borrow
Class 2 aggregate base
Imported borrow
Imported material (shoulder backing)
Lean concrete base
Maintenance vehicle pullout
Sand cover
Shoulder backing
Structure backfill (bridge)
Structure backfill (retaining wall)
Structural Concrete
Bar reinforcing steel
Bar reinforcing steel (bridge)
Bar reinforcing steel (epoxy coated)
Bar reinforcing steel (epoxy coated) (bridge)
Bar reinforcing steel (pumping plant)
Cap reinforced concrete box opening
Cast-in-drilled-hole concrete piling
Cast-in-drilled-hole concrete pile (sign foundation)

30 November 16, 2018
Structural Concrete
Concrete closure wall
Drill and bond dowel
Drill and bond dowel (epoxy cartridge)
Drive steel piles
Drive steel pipe pile
Erect precast prestressed concrete girder
Furnish bridge deck treatment material (low odor)
Furnish polyester concrete overlay
Furnish precast prestressed concrete girder
Furnish steel pipe piling
Inject crack (epoxy)
Jeene joint systems
Joint seal
Joint seal assembly
Minor concrete (backfill)
Minor concrete (curb, sidewalk, and curb ramp)
Minor concrete (headwall)
Minor concrete (minor structure)
Minor concrete (miscellaneous construction)
Miscellaneous iron and steel
Miscellaneous metal (bridge)
Miscellaneous metal (restrainer – cable type)
Paving notch extension
Place polyester concrete overlay
Prepare concrete bridge deck surface
Prestressing cast-in-place concrete
Random width weathered plank texture
Rapid setting concrete (patch)
Refinish bridge deck
Seal joint with epoxy sealant
Structural concrete approach slabs

31 November 16, 2018
Structural Concrete
Structural concrete bridge
Structural concrete bridge footing
Structural concrete retaining wall
Structure backfill (slurry cement)
Structure concrete (pumping plant)
Treat bridge deck
Paving
Asphalt concrete (Type A; open graded)
Asphaltic emulsion (fog seal coat; paint binder; polymer modified)
Asphalt-rubber binder
Cold foam in-place recycling
Concrete pavement
Finishing roadway
Minor concrete (curb and sidewalk)
Minor concrete (curb ramp)
Minor concrete (curb)
Minor concrete (curb, gutter, and sidewalk)
Minor concrete (textured paving)
Pavement reinforcing fabric
Paving asphalt (binder-pavement reinforcing fabric)
Paving notch extension
Place asphalt concrete (miscellaneous area)
Replace asphalt concrete surfacing
Replace concrete pavement (asphalt concrete)
Screenings (hot-applied; medium)
Seal pavement joint
Drainage/Environment/Landscaping
Abandon culvert
Adjust frame and cover to grade

32 November 16, 2018
Drainage/Environment/Landscaping
Adjust frame and grate to grade
Adjust inlet
Adjust manhole to grade
Adjust slotted drain to grade
Alternative pipe culverts
Anchor assembly
Asphalt concrete
Backflow preventer assembly and enclosure
Base station
Booster pump and electrical system
Cap inlet
Channel excavation
Class 2 concrete (box culvert; headwall; wingwalls)
Clean bridge deck, drains, expansion joint
Commercial fertilizer (erosion control)
Compost (erosion control)
Concrete flared end sections
Control and neutral conductors
Corrugated steel pipes
Corrugated steel pipe downdrain
Develop water supply
Drainage pumping equipment
Drill seed (erosion control)
Duff
Electric remote control valves
Electric service (irrigation)
Entrance tapers
Fiber (erosion control)
Galvanized steel pipes
Gate valve
Highway planting

33 November 16, 2018
Drainage/Environment/Landscaping
Install manhole
Irrigation controller enclosure cabinet
Maintain existing plants
Manhole frame and cover
Modify inlet
Mulch (erosion control)
Perforated plastic pipe underdrain
Place asphalt concrete (miscellaneous area)
Place asphalt concrete dikes
Place weed control (rubber mat)
Plants
Plant establishment work
Plastic pipes
Plastic pipe liners
Prepare storm water pollution prevention plan
Pressure regulating valve
Prune existing plants
Pumping plant electrical equipment
Pure live seed (erosion control)
Quick coupling valve
Reconstruct downdrain, inlet, underdrain
Reinforced concrete pipes
Relocate valve
Relocate inlet
Rock slope protection
Rubberized asphalt concrete dike
Salvage rock slope protection
Soil treatment
Spring check valve
Sprinklers
Stabilizing emulsion (erosion control)

34 November 16, 2018
Drainage/Environment/Landscaping
Station field units
Steel flared end sections
Straw (erosion control)
Supply line (bridge)
Temporary fences
Temporary sandbag headwall
Temporary silt fence
Temporary straw bale
Topsoil
Water pollution control
Traffic Signalization/Signage/Striping/Painting
Barricade
Barrier railing
Buried post anchor
Cable anchor assembly
Cable railing
Chain link fence
Chain link railing
Concrete barriers
Concrete headlight glare screen
Construction area signs
Crash cushions
Delineator
Detector loop
Double thrie beam barrier
Electrical and instrumental work
Emergency vehicle pre-emption system
End section
Entrance taper
Fence

35 November 16, 2018
Traffic Signalization/Signage/Striping/Painting
Flashing arrow sign
Furnish sign structure
Highway lighting
Highway post marker
Install signs and structures
Lighting (temporary)
Lighting and communication conduit (bridge)
Lighting and sign illumination
Markers
Message signs
Metal (barrier mounted sign)
Metal beam guard railings
Modify electrical equipment, flashing beacon, lighting, signal and lighting, traffic count and monitoring
station
Portable radar trailer
Quadguard system
Quick change moveable barrier system
Reconstruct metal beam guard railings
Reconstruct thrie beam barrier
Relocate chain link fence
Relocate mailbox
Relocate roadside sign
Relocate terminal system
Remove beam guard railing
Remove chain link fence
Remove concrete barrier
Remove crash cushions
Remove fence
Remove headlight glare screen
Remove roadside sign
Remove terminal section
Replace loop detectors

36 November 16, 2018
Traffic Signalization/Signage/Striping/Painting
Reset roadside signs
Rumble strip
Salvage count station, metal beam guard railing, single thrie beam barrier, trail marker
Sign illumination
Signal and lighting
Steel pipes and conduits
Terminal system
Traffic control surveillance and system
Traffic monitoring system
Traffic plastic drum
Tubular handrailing
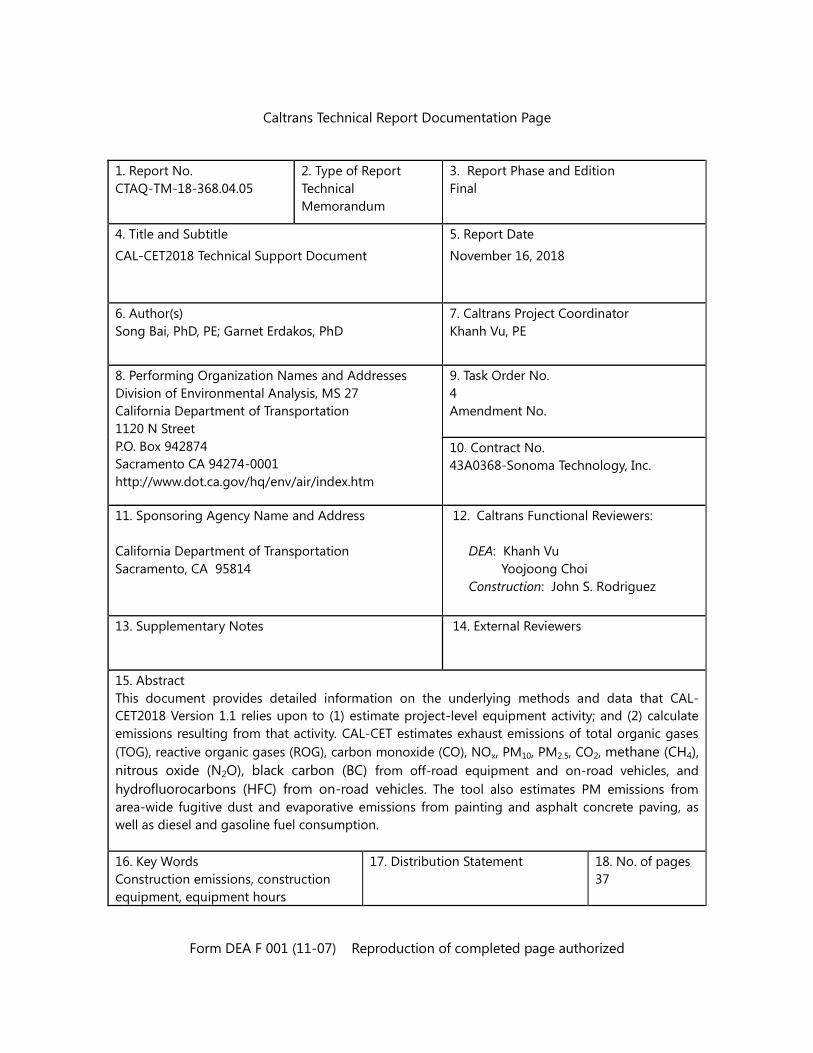
Caltrans Technical Report Documentation Page
1. Report No.
CTAQ-TM-18-368.04.05
2. Type of Report
Technical
Memorandum
3. Report Phase and Edition
Final
4. Title and Subtitle
CAL-CET2018 Technical Support Document
5. Report Date
November 16, 2018
6. Author(s)
Song Bai, PhD, PE; Garnet Erdakos, PhD
7. Caltrans Project Coordinator
Khanh Vu, PE
8. Performing Organization Names and Addresses
Division of Environmental Analysis, MS 27
California Department of Transportation
1120 N Street
P.O. Box 942874
Sacramento CA 94274-0001
http://www.dot.ca.gov/hq/env/air/index.htm
9. Task Order No.
4
Amendment No.
10. Contract No.
43A0368-Sonoma Technology, Inc.
11. Sponsoring Agency Name and Address
California Department of Transportation
Sacramento, CA 95814
12. Caltrans Functional Reviewers:
DEA: Khanh Vu
Yoojoong Choi
Construction: John S. Rodriguez
13. Supplementary Notes 14. External Reviewers
15. Abstract
This document provides detailed information on the underlying methods and data that CAL-
CET2018 Version 1.1 relies upon to (1) estimate project-level equipment activity; and (2) calculate
emissions resulting from that activity. CAL-CET estimates exhaust emissions of total organic gases
(TOG), reactive organic gases (ROG), carbon monoxide (CO), NOx, PM10, PM2.5, CO2, methane (CH4),
nitrous oxide (N2O), black carbon (BC) from off-road equipment and on-road vehicles, and
hydrofluorocarbons (HFC) from on-road vehicles. The tool also estimates PM emissions from
area-wide fugitive dust and evaporative emissions from painting and asphalt concrete paving, as
well as diesel and gasoline fuel consumption.
16. Key Words
Construction emissions, construction
equipment, equipment hours
17. Distribution Statement 18. No. of pages
37
Form DEA F 001 (11-07) Reproduction of completed page authorized