calbee group financial results
TRANSCRIPT

TSE code : 2229
2019.10.29
First half of fiscal year ending March 31, 2020April 1, 2019 – September 30, 2019
Calbee Group Financial Results

Copyright © Calbee, Inc. All rights reserved. 1
Table of contents
1.FY2020/3 Business summary of first half and management direction
Shuji Ito President and CEO
2.FY2020/3 Review of fist half resultsKoichi Kikuchi Senior Managing Director

Copyright © Calbee, Inc. All rights reserved. 2
1.FY2020/3 Business summary of first half and management direction
2. FY2020/3 Review of fist half results

Copyright © Calbee, Inc. All rights reserved. 3
Our value and vision for 2030
Vision for 2030
Establish our pivotal growth drivers in overseas markets and new food domainsMedium-
term business
plan
FY2024/3
Transformation and Challenge toward achieving
next generation growth
Corporate Philosophy
We are committed to harnessing nature's gifts, to bringing taste and fun, and to contributing to healthy life styles.
Group Vison"We must earn respect,admiration and love firstly
of our customers,suppliers and distributors,secondly of our
employees and their families, thirdly of the communities, and finally of our stockholders."
Corporate Message
Harvest the power of nature. Creating the future of food.
Today

Copyright © Calbee, Inc. All rights reserved. 4
【Management base】 Reform base to support global management and sustainable growth
【Co-creation with society】 Achieve a sustainable society【Collaboration with PepsiCo】 Strengthen collaboration with PepsiCo
Medium-term business plan(FY2020/3-FY2024/3)
■6 key initiatives1 【Existing domestic businesses】 Create new value and realize high profit
【Overseas business】 Establish revenue-generating bases in 4 key regions 【New businesses】 Establish businesses in new food areas
23
4
56
■Financial indices(FY2024/3)
¥310bn13%
¥80bn
12%
Net sales
Sales
ROE
25%
¥40bn Operating Profit
Operating Margin15%
Domestic Overseas
Calbee Group Efficiency(Operating
margin)
(Overseas sales ratio)

Copyright © Calbee, Inc. All rights reserved. 5
Recap of H1 (domestic)
Key initiatives
Major actions and recap of FY2020/3 H1
Existing domestic businesses
Create new value and realize high profit
Raise prices and revise content standards for snacks• Measures to stimulate demand were successful, sales are
recovering• Snacks surpassed plan overall
(domestic snack sales +¥2.3bn vs. plan)Product lineup to expand new customer segments for cereals• Launched two products under nutritious and functional
Granola+ brand• Launched Granola, non-sweet granolaStrengthen profitability of existing businesses• Task force lowered costs, raised productivity, drove labor
savings • Began planning towards promoting DX
Co-creation
Achieve a sustainable society
Reduce food losses• Extend sell-by dates for Potato Chips• Change labeling from Day-Month-Year to Month-Year
Launch initiatives under the new organizational structure to create new value

Copyright © Calbee, Inc. All rights reserved. 6
Recap of H1 (overseas)
Key initiatives
Major actions and recap of FY2020/3 H1
Overseas business
Establish revenue-generating bases in 4 key regions
North Am
erica
Strengthened sales of Harvest Snaps, but challenges remained• Harvest Snaps sales declined due to lower sales at some
major customers (Harvest Snaps sales -9% YoY)
Expand product lineup in the ethnic market• Grew snack, Frugra sales
(Ethnic market sales +50% YoY)
Greater China
Strengthened sales and marketing via E-commerce • Frugra sales through general e-commerce grew strongly
(General e-commerce sales (incl. snacks) +198% YoY)
Raise awareness of Calbee brand and advance business expansion in key regions

Copyright © Calbee, Inc. All rights reserved. 7
Key initiatives
Plan for FY2020/3 H2 and beyond
Existing domestic
businesses
Create new value and realize high profit
Strengthen product lineup in response to diverse needs• Launch new products that leverage texture, prepare new
production facilities/methods (Thin Potato, Crunch Potato, etc.)• Explore new products using new ingredients Expand occasions for granola• Launch Calbits, a new product focused on portability Strengthen profitability of existing businesses• Rationalize and increase efficiency of distribution• Create DX promotion task force to rationalize business• Reform distribution
New
business
Establish businesses in new food areas
Develop from existing businesses (Potato based ingredients for frozen foods/restaurants, agriculture support platform business, etc.)
Co-creation
Achieve a sustainable company
Begin considering measures against global warming Start analysis based on the TCFD(Task Force on Climate-related Financial Disclosures)
Management Direction (domestic)
Continue and strengthen initiatives to create new value

Copyright © Calbee, Inc. All rights reserved. 8
Key initiatives
Plan for FY2020/3 H2 and beyond
Overseas business
Establish revenue-generating bases in 4 key regions
North Am
erica
Rebuild existing brands • Work to maintain Harvest Snaps brand• Expand Japanese product brands in ethnic market
Grow product portfolio and expand distribution channel• Accelerate product development through acquisition of
Warnock
Greater China
Raise recognition of Calbee brand, expand sales channels• Strengthen organization for full-scale expansion offline • Expand promotion linked to e-commerce and inbound • Begin considering measures to expand snack business
Management Direction (overseas)
Accelerate new market and new product initiatives to strengthen Calbee brand

Copyright © Calbee, Inc. All rights reserved. 9
North America/Acquisition of Warnock
[Warnock Food Products, Inc.]• US(California) snack food manufacturer founded in 1986• Able to rapidly product development capabilities using
potatoes, corn and other ingredients• Has non-GMO, gluten-free, organic, and other
certifications• Has long-term relationship and sales network with
customers as a contract manufacturer
Status and issues in North America • Product structure where Harvest Snaps account for
approx. 90% of North American sales • North America sales growth stagnant
Acquired 80% stake in Warnock, which produces diverse snack foods
Need to redefine existing brands and expand portfolio for medium- to long-term sales growth
Market
Product lineup
“Better-for-You”
Ethnic
Expansion of snack categories through
Warnock
0.0
5.0
10.0
15.0
North America Net sales(Billion yen)
Calbee America, Inc.(100% subsidiary of Calbee, Inc.)
Warnock Food Products, Inc.
Calbee North America, LLC
80% stake
Collaborative business
100% stake

Copyright © Calbee, Inc. All rights reserved. 10
1.FY2020/3 Business summary of first half and management direction
2. FY2020/3 Review of fist half results

Copyright © Calbee, Inc. All rights reserved.
■Domestic: Snack sales grew on initiatives to stimulate demand despite revisionsto prices and content standards
■Overseas: Sales rose in the UK, Greater China and Indonesia■Ordinary profit includes impact of foreign exchange
(+¥0.8bn H1 of last fiscal year, -¥0.5bn H1 of current year)■Net profit includes extraordinary income (¥2.4bn) from sale of consolidated subsidiary
in the H1 of last fiscal year*
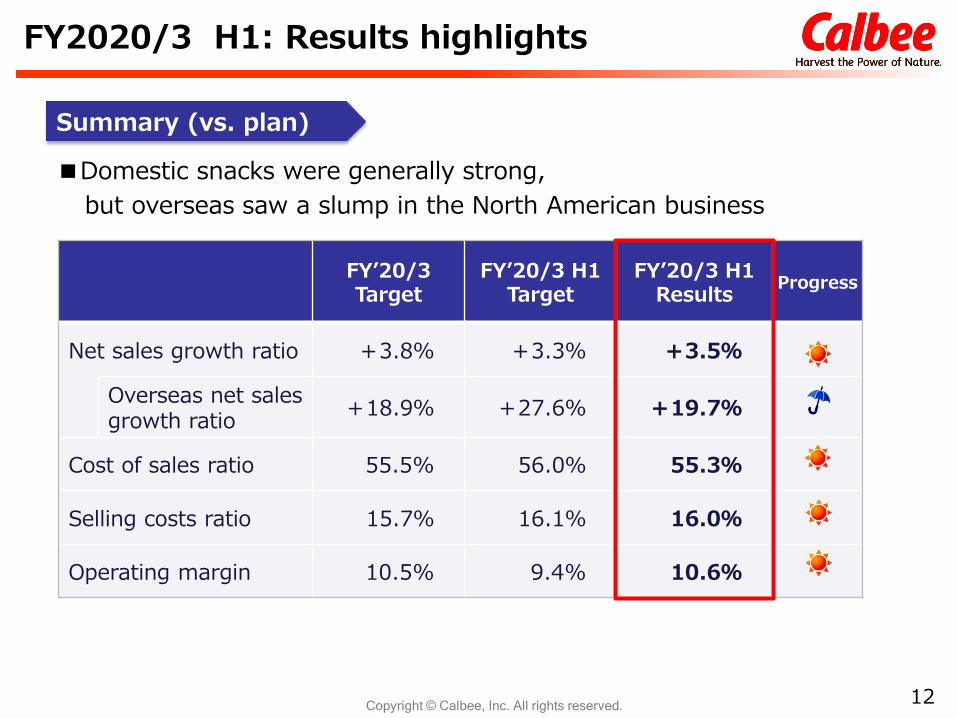
FY2020/3 H1: Results highlights
11
Summary(vs. last fiscal year)
FY2019/3 H1 FY2020/3 H1 Change
(Million yen) Ratio to net sales(%) (Million yen) Ratio to net
sales(%) (%)
Net sales 121,067 100.0 125,246 100.0 +3.5
Domestic net sales(Change excl. impact of sale of
consolidated subsidiary*)
102,586 84.7 103,121 82.3 +0.5(+1.3)
Overseas net sales 18,480 15.3 22,124 17.7 +19.7
Operating profit 11,740 9.7 13,258 10.6 +12.9
Ordinary profit 12,560 10.4 12,819 10.2 +2.1
Net profit 9,628 8.0 8,820 7.0 −8.4*All shares of CalNeCo (production/sale of promotional tools) were transferred in September 2018
Copyright © Calbee, Inc. All rights reserved.
FY’20/3 Target
FY’20/3 H1 Target
FY’20/3 H1 Results Progress
Net sales growth ratio +3.8% +3.3% +3.5%
Overseas net sales growth ratio +18.9% +27.6% +19.7%
Cost of sales ratio 55.5% 56.0% 55.3%
Selling costs ratio 15.7% 16.1% 16.0%
Operating margin 10.5% 9.4% 10.6%
FY2020/3 H1: Results highlights
12
■Domestic snacks were generally strong, but overseas saw a slump in the North American business
Summary (vs. plan)

Copyright © Calbee, Inc. All rights reserved.
■Sales Rose on strong domestic snack sales[Snacks] Sales of Potato Chips and flour-based snacks rose[Cereals] Domestic consumption was nearly unchanged YoY
■Operating income Rose on factors including increased snack sales and having controlled selling expenses despite higher distribution and packaging costs
XxxxzzzFY2020/3 H1
YoY
Domestic net sales(Change excl. impact of sale of consolidated subsidiary*) 103,121 +535 +0.5%
(+1.3%)
Snacks 89,229 +1,037 +1.2%
Potato Chips 40,375 +408 +1.0%
Jagarico 18,604 −150 −0.8%
Other snacks than that above 30,248 +779 +2.6%
Cereals(of which overseas consumption)
12,599(724)
+191(+157) +1.5%
Domestic operating profit(Operating margin)
12,597(12.2%) +815 +6.9%
(+0.7pts)
FY2020/3 H1: Domestic business
(Million yen)
13*All shares of CalNeCo (production/sale of promotional tools) were transferred in September 2018

Copyright © Calbee, Inc. All rights reserved.
+0.9
■Price hikes and cost impactAlthough price hikes had an impact, there were strong sales of products not subject to price hikes
・ Sales decreased for regular items of Potato Chips which underwent price hikes from late May, but are recovering on measures such as an increased volume campaign
・ Products not subject to price hikes such as Potato Chips Giza Giza and character products such asPro Baseball Chips drove sales
・ Strong sales of Kappa Ebisen and Sapporo Potato due in part to impact of Potato Chips price hike
■Jagarico・ Strong sales of regular and L size products・ Reduced number of items, such as limited time
products, due to prioritizing supplies for regular products
FY2020/3 H1: Domestic business
14
Snacks
Cereals・ Strong sales of Frugra Less Carbohydrates continue following renewal in last fiscal year・ Whole sales does not rise despite of two Granola+ nutritional contributed to sales
Price hike
Price hike
Price hike
Increased volume
Increased volume
Increased volume
−0.5
+0.7
−0.4
Operating profit :Price hikes and cost impact
(Billion yen)costs, etc.
distribution costs
Volume decreasedby price hikes−0.7 Impact of price hikes
and content standardrevisions
Sales rose forproducts not subject
to price hikes
Rose packaging
Rose

Copyright © Calbee, Inc. All rights reserved.
<Business results by region>FY2020/3 H1
YoY Change ex. forex in %
Overseas net sales 22,124 +3,644 +19.7% +23.3%
North America 4,884 −294 −5.7% −4.8%
Greater China 6,131 +953 +18.4% +21.7%
United Kingdom 2,931 +2,104 +254.4% +280.7%
Indonesia 2,435 +580 +31.3% +31.3%
Other regions 5,741 +299 +5.5% +9.8%
Overseas operating profit(Operating margin)
661(3.0%)
+701 ー(+3.2pts)
ー
North America 4 −176 ー ー
Greater China 409 +311 ー ー
United Kingdom 37 +290 ー ー
Indonesia −279 +26 ー ー
Other regions 489 +249 ー ー
<Net sales by product>zzzFY2020/3 H1
YoY
Snacks 18,858 +2,559 +15.7%Cereals overseas real consumption
(of which, overseas consumption included in domestic sales)
3,990(724)
+1,242(+157)
+45.2%
FY2020/3 H1 : Overseas business
15
(Million yen)

Copyright © Calbee, Inc. All rights reserved.
FY2020/3 H1 : Overseas business
North America
16
■Sales Demand for Harvest Snaps decreased ・ Sales rose in Q2 YoY on Harvest Snaps having
done a large promotion・ Continued decline in sales for some major customers
Sales of Frugra and snacks rose in ethnic foods sections ■Operating profit Profit fell on lower sales and selling
expenses increase due to large promotion
Greater China■Sales Rose substantially on expanded general e-commerce sales
・ Hold sales promotion events on major e-commerce sites・ Increased shipped quantities towards W11 major sales event・ Expanded Frugra lineup
(Chocolate crunch & Banana, Less Carbohydrates )■Operating profit Profits in e-commerce are almost flat due to
strengthened sales structureProfit rose on factors including dissolution ofTaiwan subsidiary
0
1,000
2,000
3,000
4,000
5,000
6,000
7,000
Operating profitNet sales(Frugra:Retail stores)*Net sales(Frugra:E-commerce)Net sales(Snacks)
Greater China results
(Million yen)
FY2019/3H1
FY2020/3H1
−2%
* Retail store sales are recorded under domestic sales

Copyright © Calbee, Inc. All rights reserved.
FY2020/3 H1 : Overseas business
UK
17
■Sales Rose substantially on Oct. 2018 acquisition of Seabrook (production/sale of potato chips)
■Operating profit Turned a profit after amortization of goodwill on the effects of reduced indirect costs and of contribution of Seabrook consolidated
Indonesia■Sales Sales rose due to high sales of Potabee potato chips
and the launch of new brands such as Japota■Operating profit Reduced major increased volume campaigns
in light of market competition, improved costs ratioOperating loss improved slightly due to listing fee for new products launches
AustraliaRose substantially on expanded Harvest Snaps lineup
on sale in AustraliaHarvest Snaps Black Bean

Copyright © Calbee, Inc. All rights reserved.
FY2020/3 H1 : Factors increasing operating profit
18
11,740
13,258
↑904↓257 ↑1,088
↓391↓500 ↑236
↑437
(Million yen)
FY2019/3H1
FY2020/3H1
YoY +1,517 million yen
Change in operating profit (YoY)
Sales: Increased sales of products not affected by price hikes, impact of consolidated UK Seabrook Raw material costs: Rose packaging costs, improved raw material of FrugraCosts: (Domestic) Improved cost ratio by price hike, solved cost deterioration due to not having conducted
an increased volume campaign for Potato Chips(Overseas) Costs improvements in Indonesia, etc.
Selling costs: (Domestic) Controlled selling costs(Overseas) Investment promotional expenses in North America,
e-commerce Greater China, and IndonesiaDistribution costs: Domestic distribution costs rose
Domestic ↑ 171Overseas ↓ 562
Domestic ↑ 562Overseas ↑ 728Increase in depreciation expenses
↓ 202
IncreaseDecrease
SalesRaw material
costs
CostsSellingcosts Labor
Costs(SG&A)
Distributioncosts
OtherSG&A
expenses
[Costs breakdown] [Selling costs breakdown]

Copyright © Calbee, Inc. All rights reserved. 19
Reference material
For detailed figures for sales by product, sales by overseas country/region, etc., please refer to FY2020/3 H1 Supplementary Information.https://www.calbee.com/ir/library/earnings.php
Copyright © Calbee, Inc. All rights reserved.
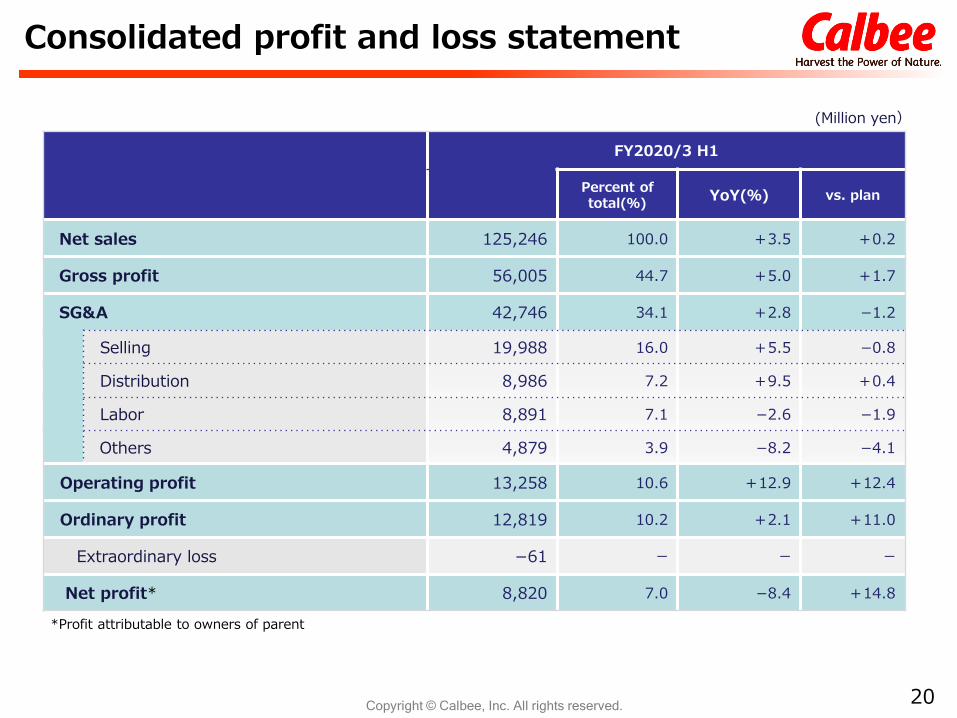
XxxxzzzFY2020/3 H1
Percent of total(%) YoY(%) vs. plan
Net sales 125,246 100.0 +3.5 +0.2
Gross profit 56,005 44.7 +5.0 +1.7
SG&A 42,746 34.1 +2.8 −1.2
Selling 19,988 16.0 +5.5 −0.8
Distribution 8,986 7.2 +9.5 +0.4
Labor 8,891 7.1 −2.6 −1.9
Others 4,879 3.9 −8.2 −4.1
Operating profit 13,258 10.6 +12.9 +12.4
Ordinary profit 12,819 10.2 +2.1 +11.0
Extraordinary loss −61 ー ー ー
Net profit* 8,820 7.0 −8.4 +14.8
Consolidated profit and loss statement
(Million yen)
20
*Profit attributable to owners of parent

Copyright © Calbee, Inc. All rights reserved.
Investing CF
【Main changes】
Purchase / redemption of
securities+6,449
Financing CF
【Main changes】
Decrease innet increasein short-termborrowings
-4,203
Operating CF
【Main changes】
Decrease in trade
receivables +9,572
(Effects from bank
Holidays in last fiscal year)
FY2020/3 H1: Financial conditions and cash flows
21
12,283
−14,600
−1,421
25,154
−10,567−6,125
FY2019/3 H1FY2020/3 H1
Current assets
115,491(+3,632)
Non-current assets88,957
(−1,933)【 Main changes 】Intangible assets
−899Property, plant and
equipment−335
Current liabilities34,355(+312)
Net assets161,903(+1,412)
【 Main changes 】Retainedearnings+2,391
Foreign Currency Translation adjustment
−999
Non-current liabilities
8,190(−26)
September 30, 2019Total assets 204,449 (+1,698)
■ Consolidated balance sheets
【Main changes】Note and accounts
payable - trade +2,553
Income taxes payable−1,883
(Million yen)
(Million yen)(+4,856)
Cash and cash equivalentsSeptember 30, 2018 September 30, 2019
38,723 43,579
■ Consolidated cash flows
(change from March 31, 2019)
【Main changes】
Securities+4,855
Notes and accounts
receivable – trade−12,304
Cash and deposits+9,860

Copyright © Calbee, Inc. All rights reserved.
30%
40%
50%
60%
FY'16/3 FY'17/3 FY'18/3 FY'19/3 Apr. May Jun. Jul. Aug. Sep.
Domestic business
Potato chips market share FY’20/3 H1 total 71.3%
Snack market share FY’20/3 H1 total 53.7%YoY
1.1P↓
YoY3.3P↑
YoY0.9P↓
■ Market share*
22
FY’20/3
Cereals market share FY’20/3 H1 total 38.3%
Granola market share FY’20/3 H1 total 61.1%
YoY+0.8P↑
FY’20/3
40%
50%
60%
70%
80%
FY'16/3 FY'17/3 FY'18/3 FY'19/3 Apr. May Jun. Jul. Aug. Sep.
*Source: Intage SRI based on sales (nationwide, all retail formats) FY’20/3 Q1 total :April 2019 – September 2019Comparison period: April 2018 - September 2018FY’16/3-FY’20/3: April 2015 – March 2020
Snack market shareTotal of Calbee and Japan Frito-Lay
Potato chips: Total of potato chips (thick- and thin-sliced),shoestring and kettle types; includes private brand products

Copyright © Calbee, Inc. All rights reserved.
Overseas business
China: Qingdao CalbeeYantai CalbeeCFSSCalbee (Hangzhou)
South Korea: Haitai-Calbee
Hong Kong: Calbee Four SeasCalbee E-commerce
Singapore: Calbee Moh Seng
Indonesia: PT. Calbee-Wings Food
Thailand: Calbee Tanawat
Australia: Calbee Australia
North America: Calbee North AmericaWarnock Food Products
UK: Calbee (UK)Seabrook Crisps
★★
★★★★★
★
★
★★
23
Expanded to 9 countries/regions■ Overseas locations (as of October 29, 2019)
★ Production facilities
★

Copyright © Calbee, Inc. All rights reserved.
Contact details for IR inquiries:Calbee, Inc. IR Group
E-mail: [email protected]://www.calbee.com/ir/
■ The Company’s fiscal year ends on March 31. The fiscal year ended March 31, 2020 is referred to throughout this report as “FY2020/3,” and other fiscal years are referred to in a corresponding manner. References to years not specified as being fiscal years to calendar years.
■ This document contains Calbee’s current plans, outlook and strategies. Items which are not historical facts are forecasts pertaining to future performance, and are discretionary and based on information currently available to Calbee. This document does not purport to provide any guarantee of actual results. Actual results may differ significantly from forecasts due to various factors.
■ This document also contains unaudited figures for reference purposes only.
24