calculating the thermodynamics of weakly hydrogen-bonded
TRANSCRIPT

1112 HELVETICA CHIMICA ACTA ~ VOl. 78 (1995)
91. Calculating the Thermodynamics of Weakly Hydrogen-Bonded Complexes from Heteronuclear NMR Data: Base-Pairing Stabilities of a
5-Methyl('5N,)[02,04-1702]~ridine ( = (15N2)[ 02,04-1702]Ribo~ylthymine) Derivative, and Structural Implications
by Peter Strazewski
Institut fur Orgdnische Chemie der Universitat Basel, St. Johanns-Ring 19, CH4056 Basel
Dedicated to Prof. Dr. AIberr Eschenrnoser on the occasion of his 70th birthday
(8.11.95)
2',3'-0 -Is~propylidene-S-methyl('~N,)[O~,O~-~~O~]~ridine ( = 2',3'-O-isopropylidene (1sN2)[02,04-1702J- ribosylthymine; 1) was analyzed by "N- and "0-NMR spectroscopy. The I5N and "0 chemical shifts revealed, in the absence and presence of unlabelled 2',3'-O-isopropylideneadenosine (Z), the formation of thymine-thymine and thymine-adenine base pairs in CHCI,. As expected, cyclic complexes stabilized by two H-bonds occurred at low temperatures, but at elevated temperatures, the data suggest that open complexes involving only one H-bond prevailed. The "0-NMR data showed the cyclic thymine-adenine pair in a reverse base pair geometry. The open base pair involved contacts to the urea-derived carbonyl 0-atom of thymine. The thermodynamics of complex formation of the cyclic and open forms in both homo and hetero pairs were calculated from the temperature and concentration dependence of the "N-NMR data using a new method. It involves a fitting procedure onto the experimental isotherms using a theoretically derived function with the standard Gihhs free energy as a parameter to be optimized. A H o and ASo were derived from a linear regression of AGo(T) vs. T. The fitting procedure circumvents the baseline problem and could be automated and used to calculate correct thermodynamics from UV-monitored melting curves of oligonucleotides. Since titrations are not involved, this dilution method should also be a useful alternative for stability studies of supramolecular complexes in H,O and in organic solvents.
Introduction. - The chemistry of noncovalent molecular interactions has become a rapidly growing research field in organic chemistry. Among these relatively weak but often specific interactions, H-bonded complexes play an important role in higher-order structures of many natural compounds, such as peptides, proteins, and nucleic acids, as well as in large artificial systems commonly circumscribed as supramolecular complexes. The structural aspects of such complexes give insight into the fundamental process of molecular recognition between two or more interacting subunits. The overall 3D struc- ture of supramolecular complexes or the tertiary structure of large biomolecules are very often deduced from molecular-modelling studies in conjunction with more or less exten- sive nuclear magnetic resonance (NMR) investigations. In addition, X-ray crystal-struc- ture analysis is a highly welcome means of understanding molecular recognition and, among supramolecular chemists, has become a major research goal. The dynamics, or more precisely, the energetic aspects of H-bonded complexes, however, cannot be studied by X-ray crystallography very well. The computation of absolute interaction enthalpies and entropies is still a very difficult task, leaving calorimetric and spectroscopic tech- niques as the major tools to obtain quantitative statements about H-bonded complexes.
A well working spectroscopic method has been developed for the calculation of the thermodynamics of nucleic acid double-strand formation some time ago. Usually, the

HELVETICA CHIMICA ACTA ~ VOl. 78 (1995) 1113
monochromatic UV absorption of the dissolved molecule is monitored at various temper- atures, to obtain a 'melting curve' of the denaturing process. For more local aspects of strand or complex formation, NMR monitoring is a very useful alternative. As long as one can completely shift the equilibrium of complex formation from one side to the other by changing the temperature and concentration, virtually any spectroscopic monitoring method will yield reliable results about the thermodynamic stability of the complex. If, however, the accessible temperature or concentration range will not suffice to observe both complexed and uncomplexed states, the calculation of the thermodynamics can become unreliable or even impossible. This might be a reason for the relative scarcity of spectroscopic stability studies in the field of supramolecular chemistry; it also limits quantitative descriptions of the stability of weak complexes of nucleic acids and proteins.
Since we are investigating the formation of secondary and, possibly weak, tertiary structures of "N-labelled ribonucleic acids (["NIRNA), we decided to study first the thermodynamics of the thymine-thymine and thymine-adenine base pairs by means of "N-NMR spectroscopy. It should be emphasized that the adenine-uracil pairing and uracil selfpairing thermodynamics were already calculated from IR experiments in the late sixties [ 11 [2]. Similarly, nucleobase and nucleoside pairing properties were studied by 'H- [3], "N- [4], 13C- [5] [6], and I70-NMR spectroscopy [6] [7], but the thermodynamics were calculated only from a minor part of this data. In particular, no thermodynamics of the adenosine-uridine pairing on the nucleoside level were calculated from "N-NMR data. On the oligonucleotide level, however, thermodynamics were calculated from "N-NMR data [8]. This monitoring method proved to be a powerful tool for the determination of local aspects of DNA base pairing. The examples, so far, involved the formation of relatively stable duplexes allowing the thermodynamics to be elucidated from a complete data set, i.e., from a data set where both fully complexed and fully denatured specimens could be monitored within the accessible temperature range.
A method had to be developed allowing the thermodynamics to be calculated from a reduced data set. The least stable canonical base pair on the nucleobase and nucleoside level was shown by many authors to be the A . U pair, hence, this pair should be an ideal model system for our purposes. In addition, we wished to study the same base pair by "0-NMR spectroscopy, to compare the two monitoring methods and to see whether I70-NMR could be used to deduce some structural information of the base pair as well. In the following, the heteronuclear NMR analysis of a doubly labelled uracil derivative, 2',3'-O-isopropylidene-5-methyl( "N,)[ 0 2,0 4-'70,]uridine ( = 2',3'-0 -isopropylidene- (~SN,)[02,04-'70,]ribosylthymine; l)'), in the absence and presence of commercial 2,3'-0- isopropylideneadenosine (2) is described.
Results. ~ "N-NMR Spectroscopy. To study the base-pairing properties of 5-methyl- uridine (= ribosylthymine, T) with adenosine (A), H,O could not be used as a solvent, because monomeric nucleosides would not pair, rather only stack, in this medium [9]. A suitable aprotic and non-H-bonding solvent is CHC1, [3b] [4a] [lo]. The first sign that base pairing occurred, when the synthetic precursor of the nucleoside (see preceding publication), 2',3'-O-isopropylidene derivative 1, was mixed with 2',3'-O-isopropyl- ideneadenosine (2) was the solubility of the compounds. Compound 2 is virtually insolu-
I ) For convenience, the l8O isotopes are not indicated (cf. preceding paper)

1114 H E L V E T I C A CHIMICA ACTA - VOl. 78 (1995)
ble in CHCl,, 1 is well soluble. A 46 mM suspension of 2 dissolved very rapidly upon addition of 1 equiv. of crystalline 1. Therefore, 1 was used for a systematic investigation by "N-NMR spectroscopy in H,O- and EtOH-free CDCl,.
Compound 1 was measured at 5 and 6 different concentrations (46.13, 23.06, 11.53, 5.77, 2.88, and 1.44 mM from a dilution series) and 12 temperatures (55 to 0" in 5' steps), once alone ( A series) and once with an equimolar amount of unlabelled 2 (AB series). In the A series, the monomeric compound is in equilibrium with its selfpaired species
Scheme 1. Possible Serfpairing and Pairing Geometries between the 2 '3- 0-Isopropylidene Derivatives 1 and 2 of 5-Methvluridine ( T ) and Adenosine ( A ) , Respectively. in Chloroform. a) A Series: 04' O4 reverse-wobble (a-1. l), 02.02 reverse-wobble (b-1. l), and 02. O4 wobble pair (c-1 '1). b) AB Series: Watson-Crick (d-l.2), reverse-Wat-
son-Crick ( e - l ' 2 ) , Hoogsteen ( f - l . 2 ) , and reverse-Hoogsteenpair (g-1 .2)
a )
c-1.1

HELVETICA CHIMICA ACTA - Val. 78 (1995) 1115
(Scheme l a ) . In principle, three pairing geometries are possible: the reverse-wobble arrangement involving both C(4)=0 groups (a-1 . l), the reverse-wobble arrangement involving both C(2)=0 groups (b-1. l), and the ordinary wobble arrangement involving one of both C=O groups each (c-1.1). In the A B series, an additional pairing equilibrium with the adenine species occurs (Scheme Ib). Here, four geometries are possible: the Watson-Crick (d-l.2), the reverse- Watson-Crick (e-l.2), the Hoogsteen (f 1.2), and the reverse-Hoogsteen arrangement (g-1.2). In addition, 2 can selfpair in three geometries involving its Watson-Crick and Hoogsteen binding sites (not shown). In the "N-NMR experiment, however, none of the alternative geometries ax-1 .1 and d-g-1 ' 2 are distin- guishable, because only the N-atom of 1 is observed. I5N-NMR spectroscopy appears to be ideal for precise measurements at high dilution, because the peaks are narrow and clearly visible down to a concentration corresponding to ca. 0.3 mg per ml or 1.4 mM. The shifts of the N signals over a range of up to 3.6 ppm can be observed with a precision of < 0.01 ppm. Base-pair formation is uniformly accompanied by a downfield shift of both
and d,(,,, as expected for a proton donor and a glycosidic N-atom [4] [8]. Fig. 1 shows the temperature and concentration dependence of the chemical shifts of
the glycosidic N(l) signals in the A and A B series. Although a significant difference between the A and A B series is visible, it spans at most 0.3 ppm. This was expected because this N-atom is not involved in base-base interactions. N(3), however, shows a marked difference between the A and A B series as depicted in Figs. 2 and 3. The diagrams are identically scaled as the above ones. The differential data ( A B minus A series) in Figs. 2c and 3c show chemical-shift differences that are only due to the effect of added 2.
Theory. To quantify the measured base-pairing interactions, the theory of thermody- namics must be briefly explored. We are dealing with two kinds of observed chemical equilibria:
A + B + A B and A + A + A A
A corresponds to 1 and B to 2. The 1st equilibrium is a non-selfcomplementary and the 2nd a selfcomplementary system.
For an ideal solution (activity coefficients ya = yB = yaA = yAB = l.O), the equilibrium constant of the non-selfcomplementary system is given by KAB = [ A B ] / [ A ] . [ B ] . In our case, [ A ] always equals [ B ] , therefore, Eqn. I holds. The other constant in this experiment is the concentration cA of the observed molecule (Eqn. 2). Let c1 be defined as the fraction of A in the paired state (Eqn. 3). c1 is always between 0 and 1. Thus, the actual concentra- tions are given by Eqn. 4 . Replacing the actual concentrations in Eqn. I with Eqn. 4 yields the quadratic Eqn. 5 .
*) Several groups reported a measurable selfpairing of adenine derivatives in organic solvents [2] [3b] [3d-e]. The ethyladenine (9-etAde) selfpairs in CHCI, with an equilibrium constant half of the selfpairing constant of 1-cyclohexyluracil (1-cyUra) and 1/30 of the mixed pairing constant at 25". In a 5 - m ~ 9-etAde solution containing an equimolar amount of 1-cyUra, 1.6% 9-etAde and 3% I-cyUra form cyclic dimers. Therefore, the bias of the [A]/[B] ratio in favor of [A] lies within the experimental uncertainty of cB and was (as in [2]) neglected for the formulation of KAB.
49

1116 HELVETICA CHIMICA ACTA - Val. 78 (1995)
-t 46.l3mu --+- I 1 53 --.w- ZRX -t- 23.M t- 511 --t 1.44
I 6h , , , l p~ml l i R O
1178
117.6
1174
I17 2
1 n f l
i in .
I IR.
11%
117.
I17
I I 7
117. 1% n s in IS LO 2s M 3s 40 45 50 ss m
7- PCI
, , . . , . . -- , . , 11701 ; , ; , , , , , , I
11n.u 117.8
117.6
1174
1177 o.o 5.0 inn 1511 2111) 25.0 3ii.o 3511 400 3s.o s o i i
cone IrnU]
Fig. 1. a) Twipcraiure and b) toncentrotion dependmw u/'the chemical s h ~ f r s c f N ( I) ofl. Above: A series; below: A B series; pptn values locked deliberatly relative to external aq. "NH,Cl.
. . . . , . (3(,x , , , . . , . . . . . (5 ) I1 5 10 I S 20 2s M 35 41) 45 541 5s fa
r PCI
Fig. 2. Temperature dependence of the chemical sh@s o f N ( 3 ) o f l : a) A Series (for the calcu- lation of the infinite dilution curve, see later in the text), b) AB series, and c) AB minus A series

HFLVFTICA CHIMICA ACTA vol. 78 (1995) 1117
h ) D,,,,[ppm] -C- 5YC ---A- 4iF --+- F + 1(P --.- yp . . - I .._. 350 -ia-- M + Y
I . , . ....................... .......
.............................. ........ ........ . . . . . .
0.0 5.0 10.0 I S 0 2J.U 250 30.0 350 40.0 45.0 WO Conc lmvl
Fig. 3. Concenrration dependence of rhe chemical shifts o j " ( 3 ) of 1 ; a) A Series, b) AB series, und c) AB minus A series. Note that the lines at around 3.2 ppm/40 mM do not truly cross hut define a twisted surface in this projection.
a = [ A B ] / ( [ A ] + [ A B ] ) = [AB]/C, ( 3 )
[AB] = a -c, and [ A ] = (1 - a).cA (4)
Solving Eqn. 5 for a gives two solutions, one of which yields an a between 0 and 1 (Eqn. 6). Since, for any process at equilibrium, AGO = -RTlnK,, ( R = 1.98586 cal mol-' K-I), we can substitute KAB with e(--dCDIRn. After some rearrangements, we obtain Eqn. 7. This expression contains both independent quantities, concentration and temperature, as variables. AGO and a are the unknown. Replacement of AGO by AH" - T.ASo yields a function showing the dependence of a on the wanted thermodynamic parameters AHo and AS" (Eqn. 8).

lllX HELVETICA CHIMICA ACTA - Vol.78 (1995)
2 cA + e ( A t i - TASO)/RT - e ( A P - TAP)/ZKT 4 4 c, + e ( A P ~ TAS)/KT
a(c,, T ) = (8) 'A
For selfcomplementary systems, Eqns. 9-1 I hold. The difference between the two systems becomes apparent in the dependence of [ A A ] on c,, because [ A ] decreases more rapidly upon shifting the equilibrium towards the selfpaired species (Eqns. 12), yielding a different equilibrium constant in terms of a (Eqn. 13).
K A A = [AA IAA 1'
c, = [ A ] + 2 . [ A A ]
a = 2.[AA]/([A] + 2.[AA]) = 2 . [AA] /c ,
(9)
(10)
(1 1 )
Hence, Eqns. 14-16 are obtained.
What is the shape of the Eqns. 7 and 15? Figs. 4 and 5 show some graphical displays of Eqn. 7. Since it is a 4-dimensional function, 3-dimensional projections are shown at deliberate concentrations, temperatures, or Gibbs free energies. Fig. 4a demonstrates the sigmoidal curvature of a vs. AGO at all temperatures. Fig. 4b visualizes that, at T = 0 K, a equals 1 and at T = 00 K, a equals 0, irrespective of AGO (see Eqns. 17). Fig. 4c shows that the same sigmoidal curvature of a vs. AGO is present at all concentrations. Note that while
') Eqn. 5 corresponds to the common equation KAB(or) (e.8. Eqn. 2 in [ll]). However, when an equilibrium is monitored by UV spectroscopy, total concentrations ctOI = [A] + [B] + [AB] are used. For [ A ] = [ B ] , or = 2[AB]/(2[A] + [ A B ] ) and K,, = 2or /(ctot(l - or)'). Solving this eqn. yields or(cm, KAB) =
(1 + cmtK,u - (1 + 2ciolj(AB)"')/(.I"iKAB.

HELVETICA CHIMICA ACTA ~ Vol. 78 (1995) 1119
the sigmoidal dependence of a on AGO is symmetrical with respect to the lower vs. the upper part (0 < a < 0.5 vs. 0.5 < a < 1), the sigmoidal dependence of a on T is not, at least not on the isoenergetic surface (.f. F i g s . 4 ~ and 4b). Fig.4d visualizes the typical concentration dependence of a within a representative range of Gibbs free energies. The curvature is steeper the higher -AGO, but at infinite dilution, a always equals 0, and at infinite concentration, a equals 1 (Eqns. 18).
lim a (cA, T ) = 1 and lim a (cA, T ) = 0 (17) T-0 T- rn
lim a (cA, T ) = 1 and lim a (cA, T ) = 0 'A-oo 'A+O
Figs.5a and 5b show the concentration and temperature dependence of a(cA, T) , i.e., the isotherms and melting curves of a non-selfcomplementary bimolecular process at a constant Gibbs free energy.
Eqns. 7 and 15 are real solutions for a bimolecular reaction; the same procedure can be applied to equilibria of any molecularity. The general form of Eqns. 5 and 13 are given by Eqns. 19 and 20, respectively, where n is the molecularity of the reaction [ 111.
A monomolecular equilibrium of the kind A e A ' , such as the hairpin formation of a single strand, is concentration-independent (Eqns. 21 and 22).
a(K,)= l/(l + K ; ! ) or a(T)= l /( l +e(dw-TdSO)'R 7 (22)
A non-selfcomplementary trimolecular reaction equilibrium of the kind A + B + C e A B C with equimolar single reaction partners, ctot = 3 [ A ] + [ABC] and a I 3 [ABC]/c,,,, is defined by Eqn. 23, and the selfcomplementary equilibrium constant for the process A + A + A S A A A by Eqn. 24.
9 a &.(l - a)3 K A B C =
a KAAA = 3 &;(l - a)3
Both cubic equations can be solved for a and yield one real solution each (Eqns. 25 and 26).

1120 HFLVETICA CHIMICA ACTA ~~ Vol. 78 (1995)
Fig. 4. Gruphicul displays of Eqn. 7 showing the AGO dependence o/.n over u wide T undcA runge

H~LVETICA CHIMICA ACTA - VOl. 78 ( I 995) 1121
Fig. 5 . a) b) Concentrulion und lemperuture dependence of a( AGO) uccording to Eqn.7. c) d) Concentrarion and temperature dependence of a( AH", AS') according to Eqn. 8
Despite the complexity of Eqns. 25 and 26, or the more so after they had been replaced by the functions a (cLoc, T) , the curvature of a vs. AGO, T, and ctOl is much the same as in the bimolecular case. Tetramolecular equilibria of the kind A + B + C + D G A B C D or 4 A G A A A A are described by the corresponding equations for KABcD or K,,,, and yield similar solutions for 1 2 a(clot, T ) 2 0 (not shown).
Returning to the bimolecular reaction, the statistical difference between non-selfcom- plementary and selfcomplementary but otherwise identical reaction partners formally concerns only As", not AH". In the former system, each molecule A that pairs with B forms one complex AB, whereas in the latter it needs two molecules A to form one complex AA. Thus, for a given amount of complexes AB, the amount of unpaired species A is larger at equilibrium than for the same amount of complexes AA of identical stability. Therefore, since So is proportional to the number of molecules involved: Is",, - s",(non.se,ol > Is",, - SOa(se,ol. The reduced entropic penalty for the selfcomplemen- tary system becomes apparent when the a vs. T or c, curves are calculated for both

1122 H~LVETICA CHIMICA ACTA - Vol. 78 (1995)
0 .2
0 0 2 0 . 0 4 0 . 0 6 0 . 0 8 0 . 1 c,lrnollli
Fig. 6 . Temperature and concentrution dependencies o f w of u selfcomplementary and a non-selfcomplementary system at the same Gibbs,free energy: a) Melting curves at cA = I0 VIM and AGO = --2.0 kcul mo1-l and b) isotherms a1 T 300
K and AGO = -2.0 kcat n w - ' . - Selfcomplementary ; - non-selfcomplementary.
systems at the same Cihbs free energy: the selfcomplementary system appears to be more stable (Fig. 6).
So far, a (cA, T ) was only depicted at the same AC" for all temperatures or concentra- tions. This implies that we only observed systems where no temperature dependence of AC", i.e., no entropy term T .As" occurred. This might be realistic for isomerizations, such as certain tautomeric equilibria, but has little relevance to base-pair or other complex formation. If we calculate an a vs. Tor c, curve at a given AGO, e.g. -1 kcal mol-', with no AS" involved, a relatively flat and unsymmetrical sigmoidal curvature a ( T ) results, where the temperature for A close to 0 (lower baseline) can only be extrapolated ( F i g . 7 ~ ) . Through stepwise doubling the interaction enthalpy and, at the same time, through
- 600 8 0 0
c , >",,>I,,,
1 4 0 0
1 2 0 0
1 0 0 0
8 0 0
6 0 0
400
2 0 0
TlKl 0 0 . 2 0 . 4 0.6 0 . 8 1
<.,rn",ill
Fig. 7. Temperuture and concentrution dependencies ofcc andpurtial derivatives ofr at the .sume Gibbs./ree energy at 298 K hut with increasing enthalpy and entrap-v terms (AGO (298 K) = --1.0 kcal mol-l = AH" ~ 298. AS") : a) MeltinE curves at cA = 500 mM, melting temperatures T,, at a = 0.5; b) same as in a), but differential melting curves &(T)/aT; T,,, at a2a(T)/dT2 = O ; c) same us in a), but dflerentiul melting curves aw(T)/d(I/T): T,,, at
a'a(T)/a(l/T)'= 0, TI andT2u t 0.5~(aw(T)Ia(lIT)];d)isothermsurT273 K

HELVETICA CHIMICA ACTA - Vol. 78 (1995) 1123
concomittantly increasing the entropy difference so that at one temperature, e.g. 298 K, the resulting Gibbs free energy is identical (AGO = -1 kcal mol-' = AH" - 298.AS0), the curvature becomes increasingly steeper and symmetric with respect to both baselines.
The melting temperatures T,, the characteristic stability values for complex forma- tions at a = 0.5, were calculated to shift from 363.2 to 301.5 K with an increasing entropy term (Fig. 7a). Some common software packages that were designed to calculate melting temperatures from UV melting curves determine the inflection points of a, [act (T)/dT],,,, of the experimental melting curves. In Fig. 7b, the corresponding differential melting curves da (T)/dT vs. Tare depicted along with the calculated T,,, values. Note that, while the inflection point becomes more and more apparent as the entropy term rises, the inflection-point temperatures T,,, do not correspond to the true melting temperatures T, at all (compare with Fig. 7a). The only T,, values that are fairly close to the real melting temperatures T, are the ones involving high-entropy terms. These differences are derived from the asymmetry of the melting curves involving low-entropy terms with respect to the baselines a = 1 and 0. The inverse way of constructing differential melting curves is to plot da ( T ) / d ( l / T ) vs. T (Fig. 7c). Here T,,,, T I , and T2 are Characteristic values defining the maximum temperature and the half-width of the transition. Again the T,,, values do not agree with the melting temperatures. The advantage of the inverse differential plot is a smaller temperature range that fully characterizes a melting curve, when compared to baseline temperatures at, e.g., a = 0.999 and 0.001 in the normal plot. In Fig. 7d, the corresponding isotherms at 273 K are shown. Note that they visibly converge towards c,+oo, whereas in Fig. 5a (on the isoenergetic surface), they appear parallel between 250 and 300 K. The effect of the entropy term is also visualized in Figs. 5c and 5dwhere Eqn. 8 is plotted. It shows LX (cA, T ) on a non-isoenergetic surface with a separate enthalpy and entropy term. The values for AH" and As" correspond to the T .A base pair under investigation (vide infra). F i g . 5 ~ suggests a to be 0 at high temperatures but, as the concentration range is extrapolated to irrealistic values (crystalline state around 3 ~ ) , the stability of the base pair increases showing the expected curvature (Fig. 5 4 . In reality, the base pair would be even more stable at very high concentrations owing to aggregation effects (base stacking).
Calculating Thermodynamics. The thermodynamics of nucleic acid double strand formation are calculated from melting curves usually monitored by UV spectroscopy at one wavelength (see e.g. [12a]), although 'H- [12b] or "N-NMR [S] detection is also possible. The sigmoidal melting curves are transformed into a (c,,~, T ) by determining the ratio of the change in UV absorption or chemical shift at a given temperature (relative to the low-temperature baseline) to the UV-absorption or chemical-shift difference between the complexed state (low-temperature baseline) and the single strand (high-temperature baseline). If only one melting curve was measured at one concentration, the obtained values for a ( T ) are used to detertmine Knon.se,f or KsClf using Eqns. 19 and 20, respectively. The thermodynamics are then obtained from a van't Hoffanalysis, i.e., by means of a linear regression of In K vs. T-' based on Eqn. 27. A more reliable method is to measure several melting curves at different concentrations (dilution method). After conversion of the measured data points into a(ctot, T ) , T, at a = 0.5 is determined for each concentra- tion, and the parameters AH" and AS" are determined from a linear regression of l / T , vs. In ctot based on Eqns. 28 and 29 for non-selfcomplementary and selfcomplementary bimolecular systems, respectively [l 11.
50

1124 HELVETICA CHIMICA ACTA - Vol. 78 (1995)
In K = ASo/R - AHo/RT (27)
1 R ASo T,,, AH" d H" In ct,, + ~ (28529) - 1 R
T, AH" AS" - R In 4
and --__ In ctot + -
Eqns. 27-29 imply two assumptions, that of a two-state transition mechanism where only single and double strands are present with no contribution from intermediate states, and a temperature-independent enthalpy and entropy of complex formation. For long DNA strands, the monomolecular intermediate helix growth steps become dominant, thereby producing an artificially reduced concentration dependence or a pseudo -first- order equilibrium for which the melting temperature is concentration-independent. For such systems, it is better to determine AH" and AS" using the calorimetric method where the heat capacity is measured, and the transition enthalpy does not depend on the nature of transition [ l 11.
On the other end of DNA lengths, there is the so-called baseline problem. The way of transforming a melting curve into a function tl ( T ) requires linearly sloped baselines. Short strands having low stabilities, or strands that are mispaired, either do not fully pair at the freezing point of H,O or even melt below this temperature (T, < O"), particularly at high dilutions. In such systems, it is difficult or impossible to determine correct K's or T,'s, because the lower baseline of the melting curves corresponding to tl = 0 cannot be determined. If the error is systematic in a series of measurements involving various concentrations, the slope of Eqns. 28 or 29, i.e. AH", will be correct, but AS" is likely to be underestimated.
The lower baseline problem is partly circumvented through the use of an alternative method involving inverse differentiated melting curves da / d ( l /T ) as shown in Fig. 7c. As long as the temperature window is within the range of TI and T,,,, i.e., within the 'upper half of the melting curve, the determination of T,,, and TI from a corresponding plot allows the van'? Hofftransition enthalpy to be calculated [ l l ] [13] (see Eqn. 30). B'(n) is a constant that depends on the molecularity n of the process; e.g. B'(2) = -4.38. If, however, the equilibrium does not involve large entropy terms, as often found in short oligonucleotides or, particularly, in supramolecular complexes consisting of relatively rigid monomeric species, TI may be too different from T,,, for both values to be measurable within a realistic temperature window. Fig. 7r demonstrates how sensitive the difference between TI and T,,, is upon variation of the entropy term. Therefore, if the baseline problem is such that neither the upper nor the lower baseline can be reliably determined and the system under investigation involves rather small entropy terms, then the methods presented so far are bound to yield unreliable results. For the analysis of weak nucleobase pairings and in the growing field of supramolecular chemistry, K(a, T ) must be fitted onto the monitored data.
In most of the studies involving spectroscopic monitoring of weak complexation equilibria, one partner is titrated against the other [ 141. The Gibbs free energy of complex- ation is usually derived from a nonlinear least-squares curve-fitting procedure based on a Benesi-Hildebrand analysis. It operates with chemical shifts or extinction coefficients for fully monomeric and fully complexed states, thus, correlating titration curves with equi-

HELVETICA CHIMICA ACTA ~ Vol. 78 (1995)
librium constants. If the titrations are carried out at several temperatures, a subsequent van 't Hoj'analysis reveals enthalpy and entropy of complex formation.
An alternative to the titration method is a fitting procedure that correlates equi- librium constants with melting instead of titration curves. This was done with UV- and 'H-NMR-monitored melting data of short selfcomplementary RNA oligomers that all showed a clean sigmoidal curvature but not always clearly visible lower baselines [ 121. The authors fitted Eqn. 13 onto their melting curves with the assumption that (1 - a ) and a were linearly dependent on the extinction coefficients or the chemical shifts of the single and double strands, respectively. K ( a ) = exp(( - AH"/RT) + AS"/R) was directly fitted by the Murquurt least-squares method (minimizing x = Zb, -f(x,)]'; {x~, y L } are data points andf(x,) is the applied function). The parameters to be optimized were AH", ASO, and four constants: two slopes and two intercepts determining the assumed linear real- tionship between a, (1 - a), and the corresponding extinction coefficients or chemical shifts, respectively. Interestingly, calculating the UV data revealed that, although the average fitted thermodynamic parameters from the individual melting curves agreed well with the values from the dilution method (Eqn.29; T,'s from fitted curves), a slight temperature dependence of AH" and AS" could be detected, suggesting that single- to double-strand transition was not purely two-state.
Fitting Isotherms. In the following, a similar fitting method for the calculation of transition enthalpies and entropies independent of T,,, is presented. It differs from the above method in that it does not fit K ( a ) onto the actual melting curves, but rather the concentration dependence of a (c,) separately for each measured temperature, i.e., the isotherms. The data points are (cA, AG,,,,(AB - A ) } (from Fig. 3c), and the function is Eqn. 7 multiplied by a factor x for the relationship between ci and Appm (see Eqn.31, a ' x = Appm).
112s
T = (328.16, 323.16, .. ., 273.16 K}
In this form, x may be a constant, a linear, or a nonlinear function of T. With the boundary condition that
(from Eqns. I 7 and 18)
an imaginable temperature dependence of x can be seen and might perhaps be formu- lated. The apparent slightly negative temperature dependence of Appm at the highest concentration c, (Fig. 2c) and the way how the experimental isotherms not only converge but 'cross' at high concentrations (Fig. 3 c ) shows that the T . A pairing data involves more than a significant entropy term: a significant temperature dependence of x.
The variable is c,, and the parameters to be optimized are x ( T ) and AGo(T). Appm was fitted by a linear combination of a with x; no separate constant as an intercept was added because of the use of differential data points (lim x ' a (cA, T ) = lim X'CI (c,, T ) = 0
ppm). AGO ( T ) was optimized by minimizing x = C(Appm - with a precision of &5 cal mol-' for AGO, which appeared to be sufficiently accurate with respect to the experimental error range of Ad,,,,. Fig.8 depicts the fitted curves with the respective
lim x . a (c,, T ) = lim x ' ci (cA, T ) = x ppm 7-0 $1 + .u
<,-0 [ A B J - 0

1126 HELvtr1C:A CHIMICA ACTA - VOl. 78 (1 995)
I K l leallmol] [Appml 273.16 -3100 4.336 278.16 -2960 4589 283.16 -2830 4.882 286.16 -2710 5.176 293.16 -2620 5.378 298.16 -2460 6061 303.16 -2400 6.242 308.16 -2390 6320 313.16 -2310 6.734 31816 -2220 7.295
2% -0.522ppm 328.16 -2080 8.445 323.16 -2180 7.843
x 2 I(ppm)'! 0 033516 0 030596 0 032960 0 026947 0 030330 0 015146 0 023262 0016115 0 010692 0 029930 0 012554 0 010649
0 0.01 0.02 0 . 0 3 0 . 0 4 0 . 0 5 cA[molll]
Fig. 8. Fitted concentration dependence ofAppmfor the T . A pniring
AGo[callmoli vs 71273 16303 16 K1 AG"lcallmol] vs TI303 16328 18 K!
count 7 CO""t 6 Num missing 5 Num missing 6
0 991 0 984 ri 0 993 ri 0 969 Adjusted ? 0 992 Adjusted ri 0 962 r m s Residual 23 129 r m s Resedual 24 708
AG" [callmot] vs T[273.1&303 18 K]
Coenlclent Std error Std coefl !Value PValve
tn1ercept - 9538 738 252 061 ~ 9538 738 - 37.843 C 0 0001 r 1 2 7 w o 3 KI 23643 0874 0997 27046 < O O W 1
AGD[calImol] YS T[303 16326.16Kl
Coefficient Std error Std coeff. (Value PVatue
Intercept - 6448 083 373 013 - W48.083 - 17 286 < 0 OW1 TI303428 K1 13 257 1181 0.984 11 223 00004
Fig. 9. Lincur regression of AGO (TI vs. T ( A A - A series)
optimized parameters (AGO and x), temperature, and ,y '. The optimized parameters AG"(T) were subsequently submitted to a linear regression vs. ?'directly revealing AH0 by the intercept and AS" by the slope (Fig. 9).
The correlation coefficient Y of the linear regression is a direct measure for the temperature (in)dependence of AH" and AS" and, therefore, a test for the assumption of a pure two-state model. In this system, no monomolecular helix growth contribution could devaluate the two-state model, of course. However, significant base and/or base-pair stacking would show in a monotone temperature dependence of AH" and AS" [3d]. Since the compound was measured in CDC1, where aggregation is thought to be suppressed by solvation, a simple two-state model was expected to be applicable [3b].
The linear regression over the whole measured temperature range furnishes a coeffi- cient r of 0.985, a residual root mean square (r.m.s.) deviation for AGO of ca. 60 cal mol-', and an intercept and slope corresponding to the enthalpy and entropy change of AH" = -7.8 f 0.3 kcal molY and AS" = -17.7 f 1.0 cal mol-' K-', respectively (the

HBLVFTICA CHIMICA ACTA - Vol. 78 (1995) 1127
uncertainties are standard deviations). A more critical look at the regression plot in Fig. 9, however, suggests that the temperature dependence of AGO might not be linear over the whole temperature range, but biphasic showing two different linear dependencies. A linear regression within the temperature range between 273 and 303 K results in a substantially better fit producing different enthalpy and entropy differences: A e = -9.5 & 0.3 kcal mol-', A$ = -23.6 & 0.9 cal mol-' K-'. The corresponding correlation coefficient r amounts to 0.997 and the r.m.s. residual for AGO is only 23 cal mol-I. A linear regression of the high-temperature range between 303 and 328 K produces a fit of a similar quality as the regression over the whole temperature range ( r = 0.984), but with an expected smaller r.m.s. residual of 24 cal mol-I and smaller negative enthalpy and entropy differences: AH: = -6.4 f 0.4 kcal mol-', AS: = -13.3 f 1.2 cal mol-' K-I. Ap- parently, a two-step pairing process was observed each of which predominated within a certain temperature range.
For the calculation of the thermodynamics of the selfpair 1.1, a function from Eqn. 15 was used to fit onto the data points (cA, i&](A)} of the A series by the described procedure, but with an additional parameter pprn O, a temperature-dependent constant for the intercept of the linear combination of a and x (a. x + ppm" = pprn ; see Eqn. 32)
4 cA + eAG"/RT - eAGD/2RT d m ppm = ppm" + x .
(32) 4 c,
T = (328.16, 323.16, ..., 273.16 K}
The fit is better with respect to Zx * (Fig. 10) than the fit from the AB - A series. The optimized intercepts ppmo(T) were used to construct the temperature dependence of the chemical shifts of totally unpaired 1, namely at infinite dilution (c, = 0, dotted line in F i g . 2 ~ ) . The optimized AGo(T) from this fit are plotted against T for a linear regression (Fig. 11). When all data points are included, the regression is rather bad resulting in an unacceptable correlation coefficient, r = 0.887 (not shown). Again, the regression plot suggests the selfpaired data to express two pairing equilibria of quite different stabilities producing a biphasic temperature dependence of AGO. A linear regression within the
1 AG- p m P IKI Icallmoll IPPmI IAPPmI
273.16 -1620 131.697 2.630
278.16 -1840 131.845 2.636
283.16 -1610 131.533 2.832
288.16 -1610 131.479 2.830
293.18 -1Bx) 131.381 2.861
298.16 -1570 131.277 2.791
303.16 -1710 131210 2.917
308.16 -1760 131.128 2 . M
313.16 -1830 131.083 2.417
318.16 -1950 131.014 2.320 ' 323.16 - 2 W O 130.996 1.997
328.16 -2100 130.917 1.951
0 0.01 0.02 0.03 0.04 0 . 0 5 c, Irnol~l]
Fig. 10. F;//ed CuIiwiifrufiuii tlepemletir~e (!/ ppin fur rlw T - TpuO.iiig

1128 HELVETICA CHIMICA ACTA - VOl. 78 (1995)
Aseries Regression plot AGD(~allm~l] VJ Tl3D8.16273 16 K]
C0""l 7 COY"1 5
AG'[callmoll vs. TI326 16308 16 K I
Num m1swng 5 Num missing 7
P 0 986 r' 0 150 Adlusted P 0 965 Adjusted r' r m 5 Residual 22 166 r m 5 R e s i d u a l 13 036
0 994 0.367 -1m ~
-1m - - .
AGD[csl/moll YS TI273 1C-303 16 K] - Coenlclenl S l d error S l d coen tVslue PVslue -
Intercept - 6703.269 241 586 ~ 6703 269 ~ 27 747 i 0 Ow1 - TIKI 16657 0638 0994 20119 <0.0001
AG'lealimOll vs TI273 16303 16 K1 270 aB0 Wl 3m 310 JM 330
TfKl Coeniclenl S l d error Sld coell lValue PVslue
Intercept - 6703 269 241 566 - 6703 269 ~ 27 747 < 0 0001 T1308-326KI 16857 0636 0 994 20 119 < OOWl
Fig. I I . Linear regression oJAGo( T) vs. T ( A series)
temperature range between 273 and 308 K results in a coefficient r = 0.994 and an r.m.s. residual for AGO of 22 cal mol-', showing an enthalpy and entropy difference of AH; = -6.7 f 0.2 kcal mol-I and A$ = -16.9 & 0.8 cal mol-I K-'. The regression in the temperature range between 308 and 328 K suggests the Gibbs free energy to be essentially temperature-independent: AGO = AH: = -1.4 * 0.3 kcal mol-I (A% z 0)'). The r.m.s. residual of AGO is only 13 cal mo1-l (the correlation coefficient is very low due the flat slope).
4, Theoretically, this unexpected low pairing entropy could have resulted from the neglection of a significant activity coefficient y a A < 1.0 at higher concentrations cA. However, a fit and regression involving the high- temperature data points from the A series (308.16 328.16 K) at low concentrations (1.44-1 1.53 mM) only did not produce a more negative ASP value within its standard deviation.
HELVETICA CHIMICA ACTA - Vol. 78 (1995) 1129
With the thermodynamics of all pairing equilibria at hand, the mole fractions of monomeric 1 ([A]/c,) and of both 1 . 1 selfpairs ([AAJc, and [AA2]/cA) in the A series can be calculated using aAA, (cA, T),,,,,,, and aAA2(cA, T),,,,,,,, from Eqn. 16 (Fig. 12a). Note how the weak pairing AA, predominates at elevated temperatures owing to its insignifi- cant entropic penalty. Similarly, the mole fractions of 1 . 2 ([AB,]/cA and [ABJc, using aAB
monomeric 1 ([A]/c,) in the A B series can be calculated (Fig. 126). The comparison of the plots in Fig. 12a and 12b demonstrates how effectively the more stable hetero pairing AB, competes with selfpairing AA,.
"0 -NMR Spectroscopy. The "N-NMR analysis is a reliable method for the calcula- tion of the thermodynamics of the observed system. However, because only one N-atom was observed, it does not allow for any structural conclusions. According to the litera- ture, I70-NMR spectroscopy is a very sensitive method for the detection of H-bonds involving various compounds (see e.g. [6] [7] [ 151 [ 161). The removal or addition of an 0-bound proton is accompanied by a significant change in the chemical shift d(0) ; so is the deprotonation of an 0-containing functional group where the proton was not neces- sarily bound to the 0-atom (e.g. lactams). Generally, the higher the n-bond order is, the larger are the shifts. Thus, ether 0-atoms produce small, phosphate 0-atoms intermedi- ate, and carbonyl 0-atoms the largest shifts upon H-bonding or protonation. While deprotonations of lactam groups induce upfield shifts of 40-100 ppm, the hydration of a carbonyl group usually involves upfield shifts of ca. 25 f 10 ppm per H-atom, but can be higher in intramolecular cases. In some cases, however, H-bond formation was found to direct not upfield but downfield shifts of a smaller magnitude. The formation of a H-bond to the OH group of H,O or MeOH was measured to induce a downfield shift of 12 and 6 ppm depending on whether the OH group acted as a H-donor or H-acceptor, respectively [17]. The H-bonding of the NH, group of adenine produced downfield shifts in the complexed thymine carbonyl 0-atom of up to 11 ppm [7]. In any case, a linear correlation between the degree of H-bonding and I70-NMR chemical shift is legitimate.
Since compound 1 is doubly labelled, the involvement of the 0-atoms of 1 paired with 2 and with itself could be studied by I70-NMR spectroscopy under the same conditions as by 15N-NMR. From the published data on the selfassociation of 2',3'-O-isopropylidene- uridine in MeCN [6] and on adenine-thymine pairing in DMSO [7] monitored by "0-NMR, small but significant shifts of the involved base 0-atoms were expected upon decreasing temperatures in either direction, depending on whether the H-donor was a lactam (upfield), an OH (upfield), or an NH, group (downfield). Larger downfield shifts should occur upon addition of 2.
The solvents used for this investigation were non-deuterated, H,O and EtOH-free MeCN, and CHCl,. MeCN was used because of its low viscosity. The line width w of NMR signals derived from quadrupolar nuclei is related to the viscosity q of the medium through the linear dependence of w on the rotational correlation time 7 which, in turn, is proportional to q at a given temperature [15g]: w cczocq/T. Hence, well resolved and relatively narrow peaks were expected from the spectra in MeCN. CHC1, was used to be able to compare the results with those from the 15N-NMR-spectroscopic investigation. Neat 1,4-dioxane served as an external standard, because its chemical shift was measured to be essentially temperature-independent (not shown). As usual in I70-NMR spec- troscopy, no deuterium lock was applied, because the 'H frequency is too close to the "0
(cA, T),w,,dpl and a,m2(cA> T ) d H o 2 , d s 2 from Eqn.819 1 . 1 ([AAilicA and [AA2l/cA), and

1130 HELVETICA CHIMICA ACTA ~ Vol. 78 (1995)
frequency (61.4 vs. 54.2 MHz in a 9.3948-T field of a 'H-400-MHz magnet [16]). Regular controls with the standard showed that the ppm scale hardly ever shifted more than 1 pprn during prolonged measurements. In each solvent, two temperature-dependent measurements were carried out, one containing 1 and one containing an equimolar mixture of 1 and 2. The concentration of 1 and 2 was 46 mM each, the highest concentra- tion in the "N-NMR measurements. The temperatures spanned from 70 to 25" in MeCN and from 55 to 0" in CHC1,. Fig. 13 shows two representative spectra of 1 and 1/2 in MeCN (Fig. 130) and all spectra in CHC1, (Figs. Z3h and 13c). In Figs. 14 and 15, all chemical shifts and half-intensity widths, respectively, are plotted vs. T.
First of all, "0 chemical shifts cannot be determined nearly as accurately as "N chemical shifts. This is only partly due to the fact that the measurements were carried out with no lock frequency. A certain systematic error between the measurements of two different solutions can occur owing to baseline rolling, a phenomenon that makes it difficult to find the correct phases for the Fourier transformation. However, much more disturbing is the increasingly bad signal-to-noise ratio owing to signal broadening at lower temperatures. Therefore, the chemical shifts depicted in Fig. 14 are the less reliable, the lower the temperature is. The half-intensity widths of the signals (Fig.15) can be measured more accurately, but the relative errors increase with the line widths for the same reason.
Despite the very well-resolved signals in MeCN (Fig. I h ) , the spectra show disap- pointingly small differences in both chemical shift and signal half-intensity widths at even lowest temperature. With decreasing temperatures, an upfield shift of 1.5 to 2 pprn for O2
a ) 4, = 251 41 ppm
( w , ~ = 439 HI)
a,, = 250.35 ppm 4
0 5 10 15 20 25 30 35 40 45 50 55°C b) c) in ch1oroJorm

HELVETICA CHIMICA ACTA - Vol. 78 (1995) 1131
and O4 is observed over the temperature range of 45". The insignificant upfield (!) shift of ca. 1 f 1.0 ppm upon addition of 2 is hardly temperature-dependent suggesting that practically no base pairing between 1 and 2 occurred in this medium. The difference between both measurements might be due to baseline rolling. The present results includ- ing the "N-NMR investigation suggest that, if no pairing with 2 is observed under the applied conditions, a selfpairing can be safely excluded as well. Fig. 15 shows that the half-intensity widths of both 0-atoms change only very slightly within 45" ( A W , ~ = 145- 248 Hz), irrespective of the presence or absence of 2. These differences, as well as the difference of ca. 50 to 100 Hz between both solutions ( A and AB series), are attributed to the increasing viscosity of the medium with decreasing temperatures and in the presence of 2, respectively [15g]. All in all, not much happens in MeCN. The solvent is a too good H-bond acceptor being able to effectively compete with 1 and 2.
In contrast, CHCI, once again proved to be the ideal solvent for the system, as can be immediately seen from Fig. 13b. The substantial temperature-dependent line broadenings in both solutions are witnesses of the intermolecular interactions that gave rise to significant changes in the average rotational correlation time z of the complexes involved (z is also proportional to the molecular volume P',n [15g]). Furthermore, the more pro- nounced broadening in the AB series demonstrates the effect of added 2. From a first glance, the data seem to be sufficiently significant to be used for a fit as described for the "N-NMR data. However, Fig. I3c shows all corresponding spectra overlapped in such a way that not the integrals - as in Fig. 13b - but the intensities remain roughly constant. Now, one sees the difficulties in determining the exact chemical shifts and signal widths, especially in the low-temperature range, which is the reason why only a qualitative rather than quantitative analysis is anticipated. Despite these difficulties, important tendencies are visible in the corresponding plots in Fig. 14.
The 0' signal in the A series (T, CHCI,) is shifted upfield by ca. 5 to 6 ppm between 50 and 0". Three reasons are imaginable: a selfpairing in the 02.04 wobble, in the 02.02 reverse-wobble geometry, and a contribution from the intramolecular H-bonding of O2 to the 5'-OH group. The apparent temperature independence of the corresponding O4 signal is rather puzzling. However, the signal does seem to shift upfield between 55 and 20", i.e., in the more reliable range, by ca. 1 ppm. Below that temperature, the errors in the chemical shifts are too large to be safely interpreted as temperature-independent.
The selfpairing of uracil and thymine in DMSO and added MeOH or H20 was previously shown to be governed by the 04.04 and 02.02 reverse-wobble geometries with no contribution from the 02. O4 wobble arrangement [7]. In addition, several studies involving nucleoside or alkylnucleobase derivatives rather support a preference for the 04.04 reverse-wobble geometry for this pair [5] [6] [18]. In one particular investigation, the existence of an intramolecular complexation equilibrium between O2 and OH-C(5') was deduced from "0-NMR spectra of 2',3'-0 -isopropylideneuridine and 5'-deoxy analogs thereof ([6] and refs. cit. therein). Therefore, it seems likely that the intramolecu- lar H-bonding may be a major contributor to the large shift difference for 0 . The shifts of both signals indicate that the selfpairing of 1 is strongly overlapped by this interaction making it difficult to distinguish between the possible wobble geometries.
In the AB series, the shifts are more significant. As expected from the H-bonding of an NH, group to a carbonyl group, the O2 signal is shifted downfield upon addition of 2 by up to 4 to 6 ppm (at 0"). The temperature dependence of the shift is less pronounced but,
51

1132 HELVETICA CHIMICA ACTA Vol.78 (1995)
. , , . . . . , , I , ' . . . . . . . . . I , , . . , . , . . , . . , , . .
... . ............ ,... .. -1 1 ~~I ~
, . 244 f , , , , , , , , ' , , ,
0 5 10 I5 20 25 30 55 40 45 55 55 60 65 10
-t O'(T1c - O'(T+AJc
-C- O ' ( T t A ) a
---+-- O'(T+A)a
0 5 10 15 20 25 30 35 4) 45 50 55 M 65 70 TIXI
Fig. 14. Temperature dependence #/'the I7O chernicul sh(jis of the 0' and O4 afoms of 1
c CHCI,(+14%) B MeCN(+1-2%1
0 S 10152025M35404530~5M6Sl~ TITI
Fig. 15. Temperature dependence oJ the170 half' intensity widths of the O2 and O4 atoms of 1
within the uncertainty limits, the shift difference is 1-2 ppm between 55 and 0'. This experimental evidence supports the notion that the pairing between a pyrimidine- and a purine-nucleoside derivative favors a (02-bound) reverse- Watson-Crick or reverse-Hoog- steen geometry over the normal (04-bound) one. The reverse pairing induces an upfield shift of possibly (see Fig. 14, CHCI,, AB series) up to 6 ppm in the O4 signal. This indirect effect (owing to the N-H. . . N H-bond) additionally excludes the possibility of a normal Watson-Crick or Hoogsteen pairing, because it points into the upfield direction.
Most interestingly, both chemical shifts in the A B series show a biphasic temperature dependence. The tendency changes somewhere between 35 and 25", in agreement with the results from the '5N-NMR analysis (Fig. 9 ) . Upon cooling, the O2 signal is shifted first slightly upfield (possibly due to N-H. . .N), then downfield (0. . .H,N), but is always significantly downfield from the corresponding signal in the A series. The O4 signal, in contrast, hardly changes between 55 and 25" as in the A series, but, upon further cooling, is shifted into the mentioned upfield direction. This behavior is consistent with the assumption that base-pair formation occurs in two steps. The higher temperatures merely allow for one H-bond to be formed. In such an 'open base pair', the NH, group preferentially contacts the O2 atom. A fraction of iinino proton-bound open base pair might contribute to the slight initial upfield shift of 6(02) (if real). At lower temperatures, the cyclic reverse base-pairing geometry predominates.
The signal half-intensity widths in both homo- and hetero-paired systems seem to be a better means of monitoring the pairing equilibrium than the chemical shifts (cf. Figs. 14 and 15) . The curvatures obtained from wyA are reminiscent of the melting curves obtained

HFLVETICA CHIMICA ACTA ~ Vol 78 (1995) 1133
from the ''N chemical shifts and, if not for the fact that the ''N data were more accurate, could be used to calculate the thermodynamics by fitting a(cA, T ) onto {c,, w,(T)}. Like the chemical-shift differences, the half-intensity width differences seem to be more sensi- tively monitored by the O4 than the 0' signal, albeit less reliably at low temperatures in this case. In the A series, wy, ranges from ca. 600 to 2200 Hz for both signals ( A w , = 1600 Hz). In the AB series, the O2 half-intensity width shifts from ca. 1300 to 4500 Hz ( A w , = 3200 Hz), whereas the 04-signal half-width shifts from 1600 to (proba- bly) ca. 5800 Hz ( A w K z 4200 Hz). The enhanced sensitivity shows in the significantly higher and steeper differential melting curve for O4 (1000 to ca. 4000 Hz, A w , = 3000 Hz) than for 0' (500 to 2000 Hz, A W , , ~ = 1500 Hz). This difference may be related to the different electronic-field gradients at the O4 and O2 nuclei in the hetero base pair, that define the oxygen quadrupole coupling constant (QCC), i.e., the proportionality factor between wy, and t [15g].
Discussion. - Fitting Procedure. The presented fitting procedure is based on the optimization of the parameter AGO within a function Appm = x ( T ) . a ( A G " , c,, T ) or ppm = p p m o ( T ) + x(T) .a(AGO, c,, T ) to such a degree that the mean square difference x between the function and the experimental data points is minimized (first-degree-poly- nomial fit). Function a is linearly scaled by factor x and, in the analysis of the selfpair T 'T , positioned onto the experimental absolute ppm values by an intercept ppm". Since AGO is temperature-dependent, the fittings are performed with each experimental isotherm separately. An inspection of the theoretical functions depicted in Figs. 4 and 5 shows that, by fitting isotherms, the relative order of data points at one temperature is fully characterized by its Gibbs free energy of interaction, i.e., only the curvature of every single isotherm is relevant for the fitting, irrespective of the relation of the isotherms relative to each other. Therefore, the fitting is independent on the actual concentration of a particular base pair (or complex) under investigation. This allows us to subtract contributions from other base pairs present, the data points of which are derived from a separate experiment. In our example, the data points of the selfpairing could be sub- tracted from the data points of mixed pairing, although the actual concentration of the selfpair in the A series was different from the same pair in the AB series, as can be clearly seen in Fig. 12. The difference in the actual concentrations merely manifests itself in the assymptotes x ( T ) of the isotherms of the reduced data set (Fig. 3c) , not in their curvature. Therefore, this second parameter x ( T ) not only accounts for the translation of the chemical-shift differences into a, it is also dependent on the chemical nature of the H-bond (0. . .H-N w, N . . 'H-N) and the differential actual concentrations of base pairs that are stabilized by different kinds of H-bonds. Hence, no assumption with respect to the temperature dependence of x was made.
It is interesting how x depends on T. As already mentioned, x accounts - albeit not exclusively ~ for the chemical-shift difference between monomeric and fully complexed molecules and can by derived from lim ppm - ppmo and lim Appm. The selfpairing data
from the A series suggest x ( A ) to be essentially constant between 0 and 30"; it decreases steadily at higher temperatures (Fig. 16, lower data points). The constant value of some- where around 2.83 ppm originates from the AA, pairing and, given the fact that the assymptote represents an extrapolated value at infinite concentrations, shows only small deviations. x ( A ) decreases steadily at higher temperatures where the contribution from
<,-= <,-ffi

1134 HELVETICA CHIMICA ACTA - Vol. 78 (1995)
x(AB-A)
2 . . 270 280 290 300 310 320 330
TIKI
Fig. 16. Temperature dependence of x
the AA, pairing becomes dominant. The ( A B - A ) data that were used to calculate the T. A pairing produced x ( A B - A j values that are far from constant, in fact they range from ca. 4.3 to 8.4 ppm (Fig. 16, middle data points). The positive temperature depen- dence is probably linear in the lower temperature range where the AB, pairing predomi- nates, but drifts away from linearity in the temperature range where AB, takes over.
The reason, why x ( A B - A ) is a different function of T (and AGO, not shown) than x ( A j is based on the fact that this differential data set is inherently different from the selfpaired data set. Subtracting selfpairing from mixed pairing ( A B - A ) involves the subtraction of a concentration-dependent curvature from another one, for each isotherm separately. From the addition of the x values from both fitted data sets it seems that the temperature dependence of x derived from the original mixed A B data, x,,,,(AB) = x ( A ) + x ( A B - A ) , is linearly dependent on T. A linear regression produces a straight line through the combined data points for x,,,,(AB) with r = 0.982 revealing a temperature dependence of x,,,,(AB) of 0.054 ppm K ' (Fig.16, upper data points). indeed, fitting Eqn. 7 to the data points from the A B series results in x ( A B ) vaiues that show a linear, albeit higher temperature dependence over the whole temperature range (xl , , (AB) = 0.096. T - 19.7, r = 0.985, not shown). The difference between x c r & 4 B ) and x, , , (AB) originates from the fact that fitting the A B - A data points involved a no-inter- cept expression (Eqn. 31 ). The constraint of forcing the isotherms through the origin narrows down the range of x ( A B - A ) values. Releasing this constraint by fitting the A B - A data with an additional intercept parameterppm' (as in Eqn.32, but using Eqn. 7 instead of Eqn. 15 for a ) produces a similarly shaped but steeper temperature dependence of x'(AB - A ) (not shown). Addition of these values to the original x ( A j assymptotes results in new xl,,,(AB) values which lie within the uncertainty limits of x, , (AB)
HELVETICA CHIMICA ACTA - Vol. 78 (1995) 1135
(xfal,(AB> = x ( A ) + x'(AB - A ) = 0.093. T - 18.9, r = 0.983). Hence, the assymptotes x not only relate to the physical and chemical nature of the measured system, they also depend on the details of the fitting procedure.
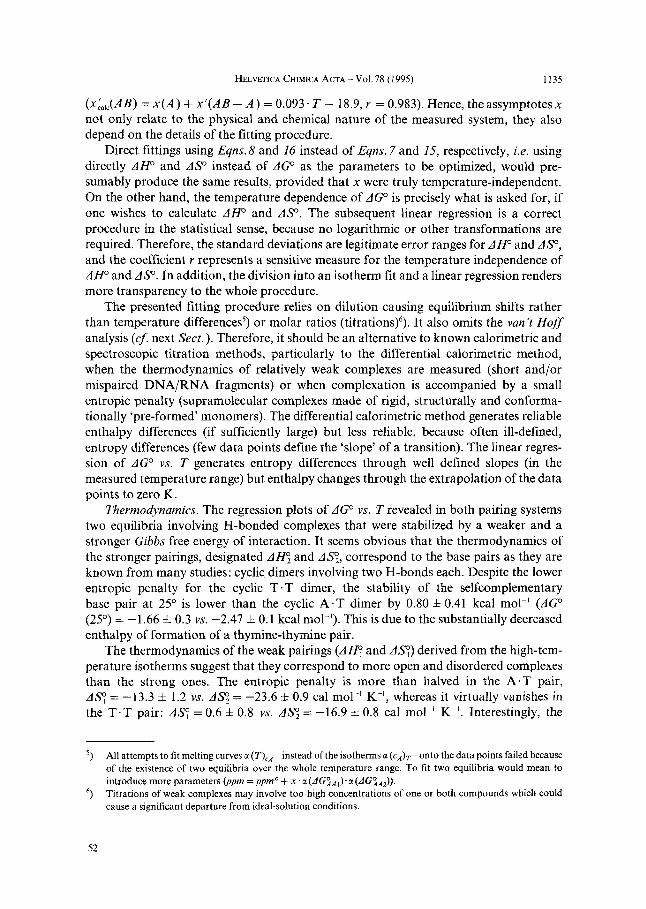
Direct fittings using Eqns.8 and 16 instead of Eqns. 7 and 15, respectively, i.e. using directly AHo and ASo instead of AGO as the parameters to be optimized, would pre- sumably produce the same results, provided that x were truly temperature-independent. On the other hand, the temperature dependence of AGO is precisely what is asked for, if one wishes to calculate AH" and AS". The subsequent linear regression is a correct procedure in the statistical sense, because no logarithmic or other transformations are required. Therefore, the standard deviations are legitimate error ranges for AH" and AS", and the coefficient r represents a sensitive measure for the temperature independence of AH" and AS". In addition, the division into an isotherm fit and a linear regression renders more transparency to the whole procedure.
The presented fitting procedure relies on dilution causing equilibrium shifts rather than temperature differences') or molar ratios (titrations)6). It also omits the van't Hoff analysis (cf. next Sect. ). Therefore, it should be an alternative to known calorimetric and spectroscopic titration methods, particularly to the differential calorimetric method, when the thermodynamics of relatively weak complexes are measured (short and/or mispaired DNA/RNA fragments) or when complexation is accompanied by a small entropic penalty (supramolecular complexes made of rigid, structurally and conforma- tionally 'pre-formed' monomers). The differential calorimetric method generates reliable enthalpy differences (if sufficiently large) but less reliable, because often ill-defined, entropy differences (few data points define the 'slope' of a transition). The linear regres- sion of AGO vs. T generates entropy differences through well defined slopes (in the measured temperature range) but enthalpy changes through the extrapolation of the data points to zero K.
Thermodynamics. The regression plots of AGO vs. T revealed in both pairing systems two equilibria involving H-bonded complexes that were stabilized by a weaker and a stronger Gibbs free energy of interaction. It seems obvious that the thermodynamics of the stronger pairings, designated AHC; and AS",, correspond to the base pairs as they are known from many studies: cyclic dimers involving two H-bonds each. Despite the lower entropic penalty for the cyclic T . T dimer, the stability of the selfcomplementary base pair at 25" is lower than the cyclic A . T dimer by 0.80 f 0.41 kcal mol-I (AGO (25") = -1.66 f 0.3 vs. -2.47 & 0.1 kcal mol-'). This is due to the substantially decreased enthalpy of formation of a thymine-thymine pair.
The thermodynamics of the weak pairings (AH: and AT) derived from the high-tem- perature isotherms suggest that they correspond to more open and disordered complexes than the strong ones. The entropic penalty is more than halved in the A . T pair, ASp = -13.3 f 1.2 vs. AS; = -23.6 f 0.9 cal mol-I K-', whereas it virtually vanishes in the T . T pair: AS? = 0.6 f 0.8 vs. AS", = -16.9 f 0.8 cal mol-I K-I. Interestingly, the
') All attempts to fit melting curves a (T)cA -instead of the isotherms a (c,)~- onto the data points failed because of the existence of two equilibria over the whole temperature range. To tit two equilibria would mean to introduce more parameters (ppm =ppm" + x.a(dGg,,).a(dCg,,)). Titrations of weak complexes may involve too high concentrations of one or both compounds which could cause a significant departure from ideal-solution conditions.
6 ,
52

1136 HELVETICA CHIMICA ACTA ~ Voi 78 (1995)
enthalpy changes less dramatically in the A . T pair, AH: = -6.4 & 0.4 vs. A% = -9.5 f 0.3 kcal mol-I, than in the T . T pair: AH: = -1.4 f 0.3 vs. AH; = -6.7 i- 0.2 kcal mol-'.
N-H. . .O bonds are generally thought to be more stable than N-H. . . N bonds. A closer look at published standard enthalpies of H-bond formation, however, does not confirm this general assumption. The standard enthalpy of formation of an indole- pyridine, a pyrrole-pyridine H-bond in CCl,, and an aniline-pyridine H-bond in hexane were reported to be -3.6 f 1.2, -3.2, and -3.43 kcal mol-I, respectively. In contrast, y -butyrolactam and pyridin-2( lH)-one in CC1, were reported to selfpair with a standard enthalpy of -3.5 f 0.4 and -4.4 f 0.4 kcal mol-' involving two N-H. . .O=C bonds each (p. 20-122 in [19]). IR-Monitored selfpairing and pairing enthalpies of l-cyclohexyl- uracil and 9-ethyladenine in CHCI, were reported to be -4.3 f 0.4 (U . U) and -6.2 & 0.6 kcal mol-' (U.A), respectively [2]. The corresponding entropy changes were -1 1.0 f 1.0 and - 11.8 f 1.2 cal mol-l K-'. The enthalpy difference between homo and hetero pairing was 1.9 f 1.0 kcal mol-' vs. 2.8 f 0.6 kcal mol-' in this study. Moreover, the corresponding entropy difference was 0.8 f 2.2 cal mol-' K-' vs. 6.7 f 1.9 cal mol-l K-' in this study. The latter might be due to a significant entropy difference between alkyl and ribosyl substituents. Other published selfassociation thermodynamics of uracil deriva- tives in CHCI, and the calculated association energies of thymine and adenine using quantum-mechanical methods agree with our values to different degrees. The l-cyclo- hexyluracil was reported to self-associate with a pairing enthalpy of -5.3 kcal mol-' and a pairing entropy of -14.7 cal mol-' K-' as measured by 'H-NMR spectroscopy [3e]. From a combined I3C- and "0-NMR spectroscopic study investigating the hydration of 2',3'- 0 -isopropylideneuridine in wet MeCN [6], a standard selfpairing enthalpy of - 10.1 f 1.2 kcal mol-' was calculated (extrapolated to zero H,O content). Using the atomic-dipole approximation, the selfpairing energy of thymine in the 04-04 and 02. O2 reversed-wobble arrangement was calculated to be -5.21 and -3.73 kcal mol-', respec- tively, the adenine-thymine pairing energy in the Wutson-Crick geometry -7.00 kcal mol-l [18c].
Hence, the quoted AH" values among themselves and compared to the ones derived from the low-temperature isotherms measured in this study (AH;) differ by roughly f 30-50 %. Our selfpairing enthalpy (AKA,) (-6.7 kcal mol-I) is somewhere between the extremes (-4.3 and -10.1 kcal mol-I), while the hetero pairing (AH&* = -9.5 kcal mol-I) appears somewhat more stable than in other studies. Neglection of the biphasic nature of the AG?, vs. T plot (Fig. 9 ) would have resulted in a lower (averaged) pairing enthalpy of -7.8 kcal mol-' '). Recent calorimetric titration studies involving strong neutral H- bonds in organic solvents, e.g. pairings between diamines and diols in benzene, seem to confirm an enthalpy change of cu. 4-5 kcal mol-' per H-bond [20].
The strong concentration dependence of the high-temperature isotherms indicates that both observed 'weak' equilibria (AB and A series) are at least bimolecular. Therefore, neither conformational changes owing to intramolecular interactions (first-order equi- librium), nor solvation-desolvation equilibria (pseudo-first-order at the applied concen-
7, Neglection of the influence of selfpairing in the A B series, i.r.. an intercept fitting of Eqn. 7 onto the A B d a t a points (Fig. 3b) would suggest pairing enthalpies of AH; = - 8.5 i 0.4 and AH? = - 4.4 f 0.9 kcal mol-' and entropies of A S ; = ~ 21.3 f 0.4 and ASP = -7.7 f 2.8 cal mol-' K-',

HFLVETICA CHIMICA ACTA - Vol. 78 (1995) 1137
trations) could account for the shift differences. A bimolecular pairing equilibrium involving only one H-bond and base-base stacking equilibria of possibly even higher molecularity could, in principle, give rise to the observed high-temperature isotherms. The former was suggested by Rich and coworkers to be the most likely process in CHCl, (‘open base pairs’ [2]). The authors mentioned in their IR study that the linearity of their plots of In K vs. 1/T for the 1-cyclohexyluracil. 1-cyclohexyluracil and the 1-cyclohexyl- uracil. 9-ethyladenine pair indicated that only cyclic dimers formed, but the same plot for the 9-ethyladenine dimer showed some degree of a biphasic behavior comparable to this study (Fig. 3 in [2]). A two-step process involving an open and cyclic 9-ethyladenine dimer could not be ruled out.
It is conceivable that In K vs. 1/T regression plots are less sensitive to the departure from linearity than those of AGO vs. T, if not the plots themselves then so the resulting correlation coefficients. A comparative regression analysis of the fitted data derived from the AB - A series, In K = -AG,O,/RT vs. 1/T including the whole temperature range, produced the same thermodynamics within the standard deviation, but a seemingly better correlation coefficent than the AGO vs. T regression ( r = 0.993 vs. 0.985). If an unnoticed biphasic dependence was analyzed as one straight line, the outcoming enthalpy and entropy changes would correspond to averaged values for open and cyclic forms, thus, would underestimate the thermodynamics of cyclic-complex formation.
In addition, one has to bear in mind that the enthalpy and entropy changes obtained are not simply differences resulting from the formation of H-bonds. They express the entire heat of formation of solvated dimer from solvated monomers. Therefore, different enthalpies of H-bond formation derived from different molecules should be compared with caution.
Structural Interpretations. The structures of the base pairs depicted in Scheme I are based an general assumptions. Rich and coworkers [2] concluded from their quantitative IR-spectroscopic studies that U. U selfpairing was dominated by one particular geometry rather than a mixture of the three (as in a-, b-, and c-1.1; most probably the one corresponding to a-1.1). Furthermore, A . U pairing was similarly dominated by one of the four possible geometries, yet the authors could not determine which one. Although the Watson-Crick arrangement is the predominant one for the A .T or A . U pair in DNA and RNA oligomers, the monomeric compounds are not as constrained in their pairing geometry. Cocrystal structures of 1 : I mixtures of related compounds gave no conclusive indication, since many possible contacts were found (refs. cit. in [2]).
A subsequent quantification of the IR-monitored association of 1-cyclohexylthymine and 9-ethyladenine in CHCl, revealed association constants under the same conditions: K,,+, , = 3.2 and K:RAeT A = 130 [l gal. Later, the thermodynamics of these pairings were calculated from I3C-NMR spectroscopic data [5]. The concentration-dependent shifts of both carbonyl groups of 1-cyclohexylthymine were used to calculate the correspond- ing association constants under the same conditions: K::, ,(04.04) = 4.2 f 0.2, K i Z , ,(02.02) = 2.2 f 0.1, A(04) = 60 f 5 and K::CAeT .(02) = 73 f 4. These Val- ues agreed fairly well with the IR-derived values. They were also the first experimental data that quantified the preference of the 04.04 over the 02.02 reverse-wobble pairing in the selfassociation of a thymine derivative and the preference of the reverse (0’-bound) over normal (04-bound) thymine-adenine pairing, albeit, again, not in which geometry, Watson-Crick or Hoogsteen.
IR

1138 HELVETICA CHIMICA ACTA ~ Vol. 78 (1995)
The 04.04 reversed-wobble geometry of the selfpair does agree with the solid-state IR spectrum of 1-cyclohexyluracil, with several related crystal structures - among them 3’,5’-di-O-acetylthymidine [18b] - and with the ‘IC-NMR spectroscopic study of 2’,3‘-0- isopropylideneuridine in MeCN [6]. Yet, a correlation between I3C and 170 chemical shifts of the C(4)=0 group of the latter compound revealed that the 13C shifts were not related to the degree of H-bonding in a linear fashion, suggesting that quantitative conclusions based on I3C-NMR-derived data may be subject to error. An indication for which geometry of the adenine-thymine pair is dominant may be obtained from additional investigations: experiments involving the protonation of adenosine revealed that the Watson-Crick site of the purine nucleoside is more basic than the Hoogsteen site with N( 1) being the most basic N-atom [21]. Several calculations suggested that N(3) of adenine and adenosine might be a second protonation site leaving N(7), the ‘Hoogsteen atom’ to the end of the hierarchy [22]. These studies suggest that the Watson-Crick or reverse- Watson- Crick pairs (d- and e-1.2) are more likely candidates than the Hoogsteen or reverse-Hoog- steen pairs (f- and g-1.2).
In this study, the temperature dependence of the ”0 chemical shifts and the half-in- tensity widths of the 02- and 04-atoms of 1 were measured in the presence (AB series) and absence ( A series) of an equimolar amount of unlabelled 2 (46 mM each). Comparably inaccurate as the chemical shift measurements were, they nevertheless allowed us to draw some interesting conclusions. In CHCl,, the temperature-dependent chemical-shift differences of the O2 and O4 signals suggest that, at higher temperatures, the T .A pair forms surprisingly stable open base pairs involving only one H-bond between the NH, group of adenine and the O2 rather than O4 carbonyl 0-atom of thymine. Open base pairs that are stabilized by N-H . . . N bonds cannot be ruled out. At lower temperatures, a cyclic reverse base pair, most probably in the reverse- Watson-Crick geometry, domi- nates.
The geometry of neither the weak nor the strong T . T selfpair in the A series can be deduced from the 1 7 0 chemical shifts. Other studies ([6] and refs. cit. therein) suggest that it could be the 02. . . HO-C(5’) intramolecular interaction in monomeric 1 that overlaps any base-pairing effects. The interaction forces the base into the syn -glycosidic conforma- tion. Although imaginable, it is impossible to determine from the ”0-NMR data whether this first-order equilibrium also exists in the open and cyclic base pairs. In analogy to the weak hetero pairing, the weak selfpairing could be stabilized by one H-bond between NH and O2 and 04, respectively, forming rather labile but entropically favored selfpairs. At lower temperatures, the base pairs form cyclic dimers, both, in the 02.02 and 04.04 reverse-wobble geometry, as suggested by several other studies. Scheme 2 summarizes these interpretations.
The apparently higher sensitivity of the I7O chemical shifts and half-intensity widths of the C(4)=0 group upon H-bonding, as compared to the C(2)=0 group, is usually explained by its higher ground-state n-bond order and other electronic factors ([6] [Isa] and ref. cit. therein). This physical property is also the reason for O4 to be the favored protonation site in uridine derivatives [22a, b]. Therefore, one wonders why the adenosine derivative favors the complexation of the C(2)=0 group? Moreover, if the enthalpies of formation of 02. O2 and 04-O4 reverse-wobble pairs are roughly equal or at least similar, why do O2 .04 wobble selfpairs not occur? The reason might be based on the difference in symmetry of the reverse vs. normal base pairs.

HELVETICA CHIMICA ACTA - Vol. 78 (1995) 1139
Scheme 2 . Selfpairing and Pairing Equilibria between the 2',3'- 0-Isopropylidene Derivatives of 5-Methyluridine (Tj and Adenosine ( A ) in Chloroform
+
The relation between symmetry and the stability of molecules can be described by the theory of statistical thermodynamics. The statistical entropy Sofa macroscopic ensemble can be calculated from the quantum-mechanical degrees of freedom of a single molecule by Eqn. 33, k being the Boltzman constant, AU the internal energy, and Q the canonical (in vacuo) partition function of the system under investigation. Q = qN for a mixture of distinguishable molecules, and Q = q N / N ! for non-distinguishable species. N is the num- ber of molecules ( N . k = n . R , n being the number of mol and R the universal gas constant), and q is the molecular partition function. The Gibbs free-energy difference AG of the ensemble is then given by Eqns. 34.
S = A U / T - k l n Q (33)
AG = -nRT In q (distinguishable) and AG = -nRT In ( q / N ) (non-distinguishable) (34)
The molecular partition function q is dependent on the energy contributions from all possible molecular degrees of freedom. It is calculated from the translational, rotational, vibrational, and electronic contributions to the internal energy of the molecule:

I140 HFLVETICA CHIMICA ACTA ~ Vol 78 (1995)
q = qtranS. q'"'. q"Ib. qelec. The translational, vibrational, and electronic terms are symmetry- independent, they are only dependent on the ensemble volume, the molecular mass (Vim 'Iz), the vibrational frequencies, and the degeneracy of the electronic ground state, respectively. The rotational contribution is derived from Eqn. 35 where A , B, and C are the rotation constants (being inversely proportional to the principal moments of inertia Z, B c ) and CT = 1,2,3,. . . is the symmetry number. The temperature dependence cancels out with the same inverse-temperature dependence of the translational component. The symmetry number u, however, relates through Egns. 35 and 33 the symmetry group to which the molecule belongs with its contribution to entropy S of the ensemble (e.g. u(CJ = 1, u(C,) = 2, etc.). The internal-energy difference AU itself, in principle, does depend on [a In Q/(a(I/kT)],, but at temperatures that are well above 0 K, it becomes constant with respect to-qTot, since all rotational energy levels are then equally available (loss of quantum-mechanical effects). Hence, if we wish to calculate the statistical entropy of a selfpair in vacuo (e.g. 1.1) in two particular geometries, we assume that all energetic contributions to the entropy of the pair remain constant except for the contribution from rotational freedoms (Eqn.36). If we further assume that the difference in the rotation constants between both geometries is negligible for S'"', we are able to estimate the effect of symmetry on the entropy. The entropy difference between a molecular complex belonging to one particular symmetry group and the 'same' complex belonging to an- other one is proportional to In 0, - In a,.
The selfpair 1.1 can either be a wobble or a reverse-wobble pair. The selfpair in the wobble geometry (c-1.1 in Scheme I ) belongs to the symmetry group C , while the same selfpair in the reverse-wobble geometry (a- and b-1.1 in Scheme 1 ) belongs to the C, group. According to Eqn. 36, the entropy difference in vacuo between both geometries AS'"' equals nR In 2 = 1.38 cal mol-I K-', a symmetry-derived contribution to the overall stability rendering the reverse-wobble geometry more stable owing to its smaller entropic penalty for base-pair formation. The equilibrium constant of selfpairing is twice as high for the reverse geometry and, at room temperature, the Gibbs free-energy difference amounts to AG (298 K) = 0.41 kcal mol-' which is ca. 25 YO of the corresponding Gibbs free-energy difference for the selfassociation of 1.
Hence, statistical thermodynamics merely involving in vacuo partition functions sup- port a predominance of selfpairing geometries of higher symmetry. The symmetry-related enhanced stability of the reverse-wobble pair indicates why, despite of a possibly identical enthalpy of formation, a homobase pair like 1.1, uracil.uraci1, or thymine.thymine chooses to adopt the mixed 04.04 and 02.02 reverse-wobble rather than the 02-04 wobble geometry. Note that the same conclusion is valid for polymeric homo-paired nucleic acids such as, presumably, double-stranded polyadenylic acid at acidic pH. X-Ray fibre-diffraction data suggested that the strands were oriented parallel [23].
However, in homo and hetero pairs involving the Watson-Crick or Hoogsteen geometries such as 1.2, both reverse and normal geometries belong to the C, symmetry

HELVETICA CHIMICA ACTA -Val. 78 (1995) 1 I41
group containing only a C, pseudosymmetry axis (in an idealized pairing geometry: C, with respect to the ribose moieties, C, with respect to the bases). Therefore, if there is a difference in rotational entropy between both geometries, AS'"' equals 0.5. R .(ln (A2B2C2) - In (A,B,C,)) (according to Eqn. 36), a presumably negligible contribution to the overall entropy difference. It follows that the apparently strong preference of 1 . 2 for the reverse over the normal pairing geometry must either originate in differential enthalpic rather than entropic contributions, which agrees with the favored hydration but not protonation site to be O2 [22a, b], or in a significant entropic effect due to the higher symmetry of the ribose moieties of the reverse base pair. The role of pseudosymmetry in statistical thermodynamics seems unclear.
I70-NMR Spectroscopy of isotope-enriched nucleosides and other compounds has proven to be a valuable method for the elucidation of local structural properties of H-bonded systems. In this study, some structural information was obtained from the temperature dependence of the I7O chemical shifts. The corresponding half-intensity widths are, by virtue of their accuracy, potentially useful for the calculation of the thermodynamics of base pairing. Further studies with higher-molecular weight com- pounds under aqueous conditions are planned, to learn whether this nucleus could be used in RNA strands as a local marker for the monitoring of secondary- and tertiary- structure formation.
The financial support from the Swiss National Science Foundation is gratefully acknowledged
Experimental Part
S o h . of 1 and 2 were pre-dried over activated molecular sieves (4 A). CDCI, and CHCI, were filtered over neutral A120, (act. I) prior to use. NMR Spectra: Vurian-VXR-400. 'jN-NMR (41 MHz): see preceding paper; post-acquisition delay during temp.-dependent measurements: 500 s. I70-NMR (54 MHz): see preceding paper; post-acquisition delay during temp.-dependent measurements: 500 s; line broadening: 50-200 MHz; wx was measured directly when the signal separation was sufficiently large, otherwise the downfield half-widths and the upfield half-widths of the 0-C(4) and 0-C(2) resonances at half their intensities, resp., were doubled.
Calculations, fitting procedures, and graphical plots were perfomed with a MacintoshTM version of Muthe- muticue' from Wo[fram Research, Inc. In the A B - A series, function cc(ca, T, A G O ) from Eqn. 7 was first separately solved for each measured temp. The resulting functions a(c,, A G O ) , were then separately solved for several AGO values in steps of 10 cal mol-' to give L X ( C ~ ) ~ , ~ ~ ~ . The experimental isotherms were fitted with the input expression
Table 1. aNi3 ) [ppm] in AB Series
T ["CI 46.13 mM 23.06 mM 11.53 mM 5.77mM 2.88 mM
55 50 45 40 35 30 25 20 15 10 5 0
135.177 135.253 135.422 135.458 135.622 135.827 136.046 136.095 136.292 136.441 136.585 136.718
133.867 134,000 134.146 134.335 134.521 134.716 134.946 135.147 135.423 135.674 135.908 136.111
132.849 132.971 133.093 133.257 133.441 133.603 133.884 134.137 134.432 134.712 135.026 135.305
132.058 132.189 132.331 132.482 132.665 132.860 133.109 133.397 133.676 133.991 134.307 134.61 5
131.611 13 I .724 131.849 131.956 132.111 132.272 132.452 132.728 132.981 133.250 133.562 133.863

1142 HELVETICA CHIMICA ACTA - Vol. 78 (1995)
Table 2. ~5,,,(~, [ppm] in A Series
TICo] 46.13 mM 23.06 mM 11.53 mM 5.77 mM 2.88 mM 1.44 mM extr. -0
55 13 1.704 13 1.450 131.288 13 1,142 131.029 130.977 130.895 50 131.819 131.562 131.350 13 1.205 131.101 131.012 130.957 45 131.976 131.686 131.443 131.298 13 1.126 131.046 13 1.033 40 132.094 131.804 131.557 131.383 13 1.240 131.167 131.097 35 132.264 131.947 131.671 13 1.468 131.302 131.230 131.175 30 132.432 132.107 13 1.788 131.555 131.414 131.316 131.243 25 132.589 132.248 13 1.930 131.713 131.532 13 1.39 1 13 1.324 20 132.785 132.447 132.130 131.850 1 3 1.648 13 1.540 131.480 15 132.950 132.6 18 132.297 132,005 131.785 131.661 131.580 10 133.140 132.779 132.483 132.176 131.914 131.755 131.679 5 133.308 132.987 132.668 132.355 132.055 131.908 131.778 0 133.477 133.123 132.865 132.495 132.201 132.017 13 1.882
‘Fit[{cA,y,}, { a ( ~ ~ ) ~ , ~ ~ } , cA]’for the no-intercept fitting involving the datapointsyi = AS,(,)(AB - A ) . The output expression ‘x.a(c,),,,‘ was followed by the input expression ‘Limit[%, c,+InfinityY for the confirmation of xT,dco. The other fitting ( A series) was performed with the input expression ‘Fit[{cAi, y , } , { I , ~ ( c ~ ) ~ , ~ ~ ~ } , cA]’ involving the data points yi = JN(,)(A) and function ~ ( c ~ ) ~ , ~ ~ derived accordingly from Eqn. 15. Following output expression ‘ppm’ + x ’ C L ( C ~ ) ~ , ~ ~ O I , x ~ , ~ ~ ~ was calculated from the difference between ‘Limit[%, cA +Infinity]’ and ppm?, the corresponding assymptote and intercept, resp. The AGO values that produced the smallestX2= Xb, - ~ . a ( c ~ ~ ) ~ , ~ ~ ~ ] ~ and Cb, - ~ p m ” + x . ~ ( e ~ , ) ~ , ~ ~ ~ ) ] ~ for each isotherm were chosen for a linear regression vs. T.
REFERENCES
[l] E. Kuechler, J. Derkosch, Z . Naturforsch., B 1966,21. 209. [2] Y. Kyogoku, R. C. Lord, A. Rich, J. Am. Chem. Soc. 1967,89,496. [3] a) R. R. Shoup, H. Todd Miles, E.D. Becker, Biochem. Biophys. Res. Commun. 1966, 23, 194; b) L. Katz,
S. Penman, J . Mol. Biol. 1966, 15, 220; c) R. A. Newmark, C. R. Cantor, J. Am. Chem. Soc. 1968, 90, 5010; d) S. M. Wang, N. C. Li, ibid. 1968,90, 5069; e) G. Lancelot, C. HtiEne, Nucleic Acids Res. 1979,6, 1063.
[4] a) C. D. Poulter, C. L. Livingston, Tetrahedron Lett. 1979, 755; b) C. Dyllick-Brenzinger, G. R. Sullivan, P.P. Pang, J .D. Roberts, Proc. Nail. Acud. Sci. U.S.A. 1980, 77, 5580; c) G. Barbarella, A. Bertoluzza, V. Tugnoili, Magn. Reson. Chem. 1987,25, 864.
[5] H. Iwahashi, Y. Kyogoku,J. Am. Chem. Soc. 1977,99,7761. [6] H. M. Schwartz, M. MacCoss, S. S. Danyluk, J. Am. Chem. Soc. 1983, 105, 5901. [7] M. I. Burgar, D. Dhawan, D. Fiat, Org. Magn. Reson. 1982,20, 184. [8] X. Gao, R. A. Jones, J . Am. Chem. Soc. 1987,209,3169; B. Goswami, B. L. Gaffney, R.A. Jones, ibid. 1993,
[9] M. P. Schweizer, S. I. Chan, P. 0. P . Ts’o, J . Am. Chem. Soc. 1965,87, 5241. 115,3832.
[lo] R. Hamlin, R.C. Lord, A. Rich, Science 1965,148, 1734; Y . Kyogoku. R.C. Lord, A. Rich, ibid. 1966,154,
[ l l ] L. Marky A,, K. J. Breslauer, Biopolymers 1987,26, 1601. 1121 a) M. Petersheim, D. H. Turner, Biochemistry 1983, 22, 256; h) M. Petersheim, D. H. Turner, ibid. 1983,22,
[I31 J. Gralla, D.M. Crothers, J. Mol. BioL 1973, 73,497. 1141 B. E. Fischer, H. Sigel, J. Am. Chem. Soc. 1980, 102,2998; I. Horman, B. Dreux, Helv. Chim. Acta 1984,67,
754; M.D. Cowart, I. Sucholeiki, R.R. Bukownik, C.S . Wilcox, J. Am. Chem. Soc. 1988, 110, 6204; K. Kobayashi, Y. Asakawa, Y . Kato, Y. Aoyama, ibid. 1992, 114. 10307; Y. Kato, M.M. Cann, J. Rebek, ibid. 1994, 116, 3279; T. R. Kelly, M.H. Kim, ibid. 1994, 116, 7072; Y. Kato, M. M. Conn, J. Rebek, Proc. Nut!. Acad. Sri. USA 1995, 92, 1208; J. Cuntze, L. Owens, V. Alcazar, P. Seiler, F. Diederich, Helv. Chim. Artu 1995, 78, 367.
518.
269.
HELVETICA CHIMICA ACTA - Vol. 78 (1995) I I43
[I51 a) H.M. Schwartz, M. MacCoss, S . S . Danyluk, Tetrahedron Lett. 1980, 21, 3837; b) A. Steinschneider, M. I. Burgar, A. Buku, D. Fiat, Int. J . Pept. Protein Res. 1981, 18, 324; c) B. Valentine, A.T. E. St, D. Fiat, Org. Magn. Reson. 1984,22,697; d) S. Chandrasekaran, W. D. Wilson, D. W. Boykin, J . Org. Chem. 1985,50, 829; e) A. Spisni, E. D. Gotsis, D. Fiat, Biochem. Biophys. Res. Commun. 1986,135,363; f) H. Eckert, D. Fiat, Int. J. Pept. Protein Res. 1986, 27, 613; g) G. Jaccard, J. Lauterwein, Helv. Chim. Acta 1986, 69, 1469; h) G. Jaccard, P. A. Carrupt, J. Lauterwein, Magn. Reson. Chem. 1988,26,239; i) E. Ponnusamy, H. Eckert, D. Fiat, Znt. J . Pepl. Protein Res. 1988, 32, 21; j) D. W. Boykin, D. W. Sullins, N. Pourahmady, E.J. Eisenbraun, Heterocycles 1989, 29, 307; k) J.A. Wilde, P.H. Bolton, A. Mazumder, M. Manoharan, J . A . Gerlt, J . Am. Chem. Soc. 1989, 211, 1894; 1) C. Sakarellos, I.P. Gerothanassis, N. Birlirakis, T. Karayannis, D. M. Sakarellos, M. Marraud, Biopolymers 1989,28, 15; m) M. Schumacher, J. Lauterwein, J . Magn. Reson. 1989,83,97; n) H. Dahn, P. Pechy, T. V. Van, Angew. Chem. 1990,102,681; 0) J.C. Zhuo, H. Wyler, P. PCchy, H. Dahn, Helv. Chim. Acta 1994, 77, 317.
[I61 ‘NMR-Spektroskopie von Nichtmetallen: Grundlagen, I7O-, 33S- und ”’Xe-NMR-Spektroskopie’, Eds. S. Berger, S. Braun, and H.-0. Kalinowski, Thieme Verlag, Stuttgart, 1992, Vol. 1.
[I71 J. Reuben, J . Am. Chem. SOC. 1969,91, 5725. [IS] a) Y. Kyogoku, R. C. Lord, A. Rich, Proc. Natl. Acad. Sci. U.S.A. 1967,57,250; b) C. C. Wilson, J. N. Low,
P. Tollin, H. R. Wilson, Acta Crystallogr., Sect. C 1984,40, 1712; c) Z. G. Zudritskaya, V. 1. Danilov, 1. Theor. Biol. 1979,59, 303.
[19] S.N. Vinogradov, R. H. Linnell, ‘Hydrogen Bonding’, Van Nostrand Reinhold Company, New York, 1971. [20] J:N. Aebischer, N. Ghoneim, E. Haselbach, ‘Calorimetric Investigation of Groundstate Diastereotopic
Interactions in H-Bonded Complexes’ in Abstracts of ‘Znd CHiral2 Workshop’ - Gwatt (March 95). [21] H. Lonnberg, in ‘Biocoordination Chemistry: Coordination Equilibria in Biologically Active Systems’, Ed.
K. Burger, Ellis Horwood, London, 1990, pp.284. [22] a) J . Del Bene, J. Phys. Chem. 1983,87, 367; b) S. Miertus, M. Trebaticka, Collect. Czech. Chem. Commun.
1983, 48, 3517; c) C. Glemarec, Y. Besidsky, J. Chattopadhyaya, J . Kusmierek, M. Lahti, M. Oivanen, H. Lonnberg, Tetrahedron 1991,47,6689.
[23] A. M. Michelson, ‘The Chemistry of Nucleosides and Nucleotides’, Academic Press, London-New York, 1963, pp. 465.