calculus students’ understanding of rate a...
TRANSCRIPT
0
CALCULUS STUDENTS’ UNDERSTANDING OF RATE
A Thesis Submitted in Partial Fulfillment of the Requirements for
Master of Science in Mathematics
Mathematics Education Sequence
Josephine A. Hackworth
San Diego State University
Conducted under the direction of Patrick W. Thompson
(THIS IS NOT THE OFFICIAL COPY)
0
CALCULUS STUDENTS’ UNDERSTANDING OF RATE
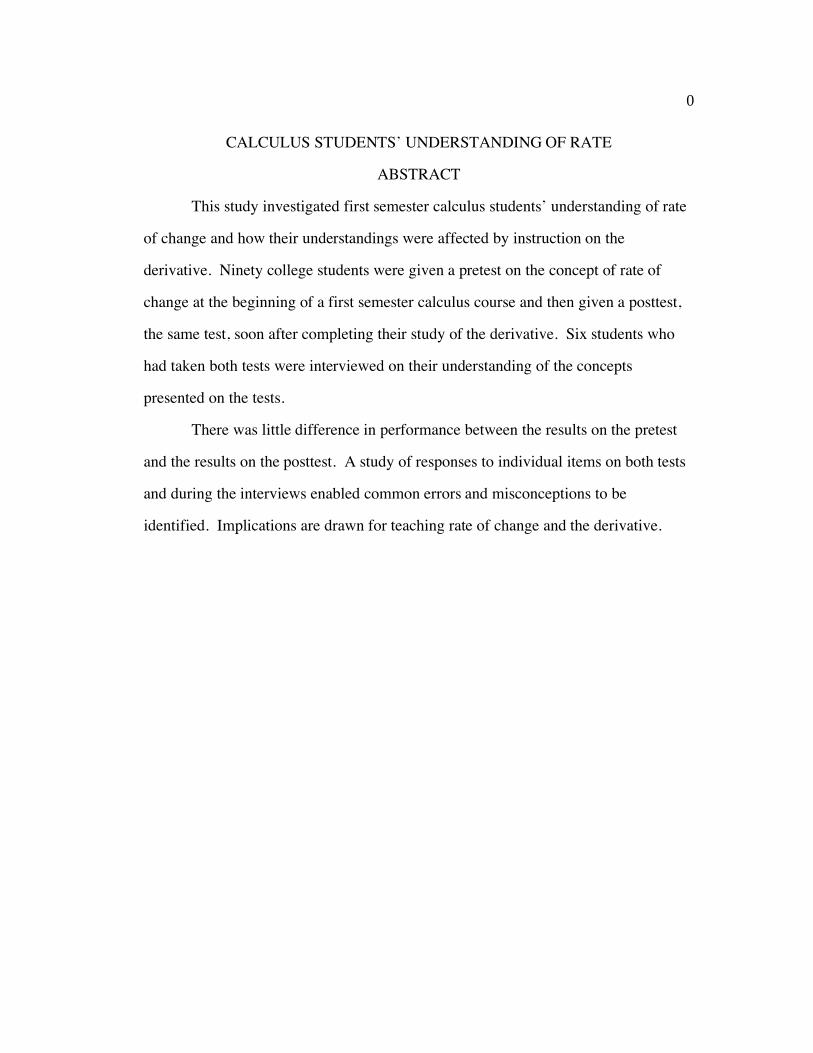
ABSTRACT
This study investigated first semester calculus students’ understanding of rate
of change and how their understandings were affected by instruction on the
derivative. Ninety college students were given a pretest on the concept of rate of
change at the beginning of a first semester calculus course and then given a posttest,
the same test, soon after completing their study of the derivative. Six students who
had taken both tests were interviewed on their understanding of the concepts
presented on the tests.
There was little difference in performance between the results on the pretest
and the results on the posttest. A study of responses to individual items on both tests
and during the interviews enabled common errors and misconceptions to be
identified. Implications are drawn for teaching rate of change and the derivative.

0
TABLE OF CONTENTS
INTRODUCTION ............................................................................................................................................... 3
CURRENT FAILINGS OF CALCULUS INSTRUCTION............................................................................................ 3
Conceptual Understanding ......................................................................................................................... 4
Purpose......................................................................................................................................................... 5
REVIEW OF THE LITERATURE.................................................................................................................. 6
CURRENT STATE OF CALCULUS EDUCATION AND THE UNDERSTANDING OF RATE ...................................... 6
STUDY OF RATE AT THE SECONDARY LEVEL................................................................................................... 7
What is Rate of Change?............................................................................................................................. 8
Development of the Concept of Rate .......................................................................................................... 9
Students’ Difficulties with the Derivative................................................................................................. 12
METHODS ......................................................................................................................................................... 14
SUBJECTS AND SETTING .................................................................................................................................. 14
Initial Procedures ...................................................................................................................................... 15
Written Examination Procedures ............................................................................................................. 15
Interviews ................................................................................................................................................... 16
Data Analysis ............................................................................................................................................. 17
RESULTS AND FINDINGS ............................................................................................................................ 18
ANALYSES OF INDIVIDUAL PROBLEMS........................................................................................................... 18
Problem 1 ................................................................................................................................................... 19
Problem 2 ................................................................................................................................................... 23
Problem 3 ................................................................................................................................................... 28
Problem 4a ................................................................................................................................................. 35

1
Problem 4b ................................................................................................................................................. 40
Problem 5a ................................................................................................................................................. 46
Problem 5b ................................................................................................................................................. 51
Problem 5c ................................................................................................................................................. 56
Problem 5d ................................................................................................................................................. 62
Problem 5e ................................................................................................................................................. 67
Problem 6a ................................................................................................................................................. 73
Problem 6b ................................................................................................................................................. 78
Problem 6c ................................................................................................................................................. 83
Problem 6d ................................................................................................................................................. 89
Problem 7a ................................................................................................................................................. 95
Problem 7b ............................................................................................................................................... 102
Problem 8 ................................................................................................................................................. 108
Problem 9 ................................................................................................................................................. 113
Problem 10a............................................................................................................................................. 119
Problem 10b............................................................................................................................................. 126
Problem 10c ............................................................................................................................................. 131
Problem 11 ............................................................................................................................................... 138
SUMMARY OF RESULTS............................................................................................................................ 147
COMPARISON OF PRETEST AND POSTTEST PERFORMANCE ......................................................................... 148
PROBLEMS HAVING LITTLE OR NEGATIVE IMPROVEMENT IN PERFORMANCE. ............................................ 149
PROBLEMS HAVING POSITIVE IMPROVEMENT IN PERFORMANCE................................................................. 150
COMPARISON OF PRETEST AND POSTTEST PROCESS ................................................................................... 150
PROBLEMS ON WHICH STUDENTS SHOWED LITTLE OR NEGATIVE IMPROVEMENT IN PROCESS................... 151
PROBLEMS THAT SHOWED IMPROVEMENT IN PROCESS................................................................................ 152
2
DISCUSSION ................................................................................................................................................... 153
CONCLUSIONS................................................................................................................................................ 154
Overall Results......................................................................................................................................... 154
Limitations................................................................................................................................................ 156
Implications.............................................................................................................................................. 158
Teacher Education................................................................................................................................... 160
Calculus Curriculum and Pedagogy ...................................................................................................... 160
FORM A.............................................................................................................................................................. 0

3
CHAPTER I
INTRODUCTION
Current Failings of Calculus Instruction
Up through the 1950’s calculus, at the undergraduate college level, was a course
taken during a student’s sophomore year, and the freshman year prepared for it (Douglas,
1986). However, the freshman year’s course was not a “precalculus” course. The
freshman course contained an overview of many topics, focusing on fundamental
concepts and interesting ideas of mathematics. For most students it was a terminal course
and all they needed for their majors. For those students who continued, it was the
common base from which they started calculus. This freshman course disappeared in the
1960’s when calculus became a freshman course.
Little changed in the freshman curriculum after calculus became a freshman
course until 1979, when dissatisfaction with students’ learning of calculus began to
emerge. The failure rate among first semester calculus students had approached fifty
percent. These factors contributed to a shortage of college students choosing
mathematics, physics, or engineering as careers.

4
Conceptual Understanding
Calculus builds on many fundamental mathematical concepts and skills which
must have been previously understood by students. Skemp (1978) distinguishes between
two types of understanding, “relational understanding” and “instrumental
understanding”. He wrote:
“By the former is meant what I have always meant by understanding, and probably most readers of this article: knowing both what to do and why. Instrumental understanding I would until recently not have regarded as understanding at all. It is what I have in the past described as ‘rules without reasons’ without realizing that for many pupils and their teachers the possession of such a rule, and ability to use it, was what they meant by understanding.”
There is a clear reference in this to the distinction between processes which can be
carried out by using rules, such as taking the derivative of a polynomial function in first
semester calculus, and the ideas or concepts which underlie the processes. These concepts
may be extremely difficult to understand, particularly if insufficient time is spent on
them. In calculus, understanding instantaneous rate of change, for example, depends on
understanding functions, average rate of change, and on limits. Instructors from all
college departments are less concerned that all the standard topics be covered than that
students learn and understand these fundamental background concepts in order to become
better problem solvers.
One reason that conceptual understanding of rate and ratio is so important is their
usefulness in solving real world problems to acquire consumer skills, to develop
proportional thinking as a problem-solving technique and to acquire skills for vocational
application (NCTM, 1989). People in government, industry and business often
communicate ideas using graphs; a knowledge of calculus helps to read and understand

5
those graphs. Reading and understanding a graph includes the ability to understand
relationships among change, average rate of change and instantaneous rate of change.
The concepts of rate, ratio and proportion are a major concern to science
educators. Wollman and Lawson (1978, p 227) emphasize the importance of ratio and
proportion as the most universal mathematical tools of any introductory science course.
Douglas (1986) argued that almost all of science is concerned with the study of systems
that change, and the study of change is the very heart of the calculus.
As argued earlier, the concept of rate of change is foundational to students’
understanding of ideas in calculus, and most certainly is foundational to their
understanding of the derivative as instantaneous rate of change. When do students come
to understand the ideas of rate of change? Casual conversations with mathematics faculty
suggest that they presume very little understanding of rate of change beyond “d = rt” and
that any deeper understanding will come by studying the derivative in calculus. This
leads to an empirical question: Do students enrich their understanding of rate of change
by studying the derivative in a college calculus course?
Purpose
The purpose of this research is two-fold. It is intended to survey students’
understanding of rate of change at the beginning of a first semester calculus course and
again soon after completing their typical study of the derivative. By examining students’
understandings of rate of change at the beginning of the first semester calculus course and
soon after their typical study of the derivative, we can gain insight into the reasons why
some calculus students have difficulty acquiring a conceptual understanding of the
derivative.
6
CHAPTER II
REVIEW OF THE LITERATURE
This chapter will review the basis for the present study of calculus students’
understanding of rate of change. A brief section will describe the current state of calculus
education, its implications, and the role that the typical study of the derivative plays in
students’ understanding of the concept
of rate of change.
Current State of Calculus Education and the Understanding of Rate
The failure rate of first semester calculus students in the United States today is
approaching fifty percent. Douglas (1986) stated that this failure rate among first
semester calculus students “cannot be tolerated any longer”. Also, regarding students
who completed first semester calculus, he stated that “physicists and others complain that
students don’t understand the basics of calculus, such as motion, velocity or
acceleration.”
Many calculus students do not have a rich, meaningful, conceptual base from
which to understand the fundamental concepts of the calculus. They do not know how to
use the calculus, what can be done with it and do not have a feeling for what it is about.
Yet calculus is one of the greatest technical advances in exact thinking in history. A
7
reform of the calculus curriculum is underway, but as Douglas (1986) emphasized, “no
real consensus has been reached on the problem of reducing the failure rate and the
methods for teaching conceptual understanding of calculus.”
Study of Rate at the Secondary Level
Indications are that many concepts within the domain of multiplicative structures
are not well taught nor are they well learned. Numerous studies have shown that early
adolescents and many adults have a great deal of difficulty with the basic concepts of
fraction, rates, and proportion (Boyer, 1946; Confrey, 1992; Hart, 1978; Heller, Post,
Behr & Lesh, 1990; Karplus, Pulos & Stage, 1983; Monk, 1992; Orton, 1984; Thompson,
1992; Tournaire & Pulos 1983). These studies indicate that students often use incorrect
and inappropriate qualitative reasoning in solving problems involving basic
multiplicative concepts, often using additive approaches where multiplicative approaches
are required.
Heller, Post, Behr and Lesh (1990) stressed the importance of rate, ratio, and
proportion in the interpretation of dynamic phenomena. They observed that one of the
extreme deficiencies in the cognitive development of students at the secondary level is
their failure to master reasoning involving ratios. Their poor performance on Piagetian
tasks of ratio reasoning indicate that only about one-fifth of seventh graders and one-
fourth of eighth graders have an understanding of simple rate and proportion. Lesh, Post,
and Behr (1988) argue that proportional reasoning is both the capstone of the middle
school mathematics program and the cornerstone of all that is to follow.
8
What is Rate of Change?
One indication of the complexity of the concept of rate of change is the lack of
consensus in distinguishing between rate and ratio. Thompson (1994) illustrated the lack
of consensus by noting:
Perhaps the lack of conventional distinction between ratio
and rate is the reason that the two terms are used often without
definition. Lesh, Post, and Behr noted that “... there is disagreement
about the essential characteristics that distinguish, for example rates
from ratios ... In fact, it is common to find a given author changing
terminology from one publication to another” (1988, p. 108). The most
frequent distinctions given between ratio and rate are:
1) A ratio is a comparison between quantities of like nature
(e.g., pounds vs. pounds) and a rate is a comparison of
quantities of unlike nature (e.g., distance vs. time;
Vergnaud, 1983, 1988).
2) A ratio is a numerical expression of how much there is of
one quantity in relation to another quantity; a rate is a
ratio between a quantity and a period of time (Ohlsson,
1988).
3) A ratio is a binary relation which involves ordered pairs
of quantities. A rate is an intensive quantity - a
relationship between one quantity and one unit of another
quantity (Kaput, Luke, Poholsky, & Sayer, 1986; Lesh,
Post, & Behr, 1988; Schwartz, 1988).

9
Thompson offered a unifying definition of rate by focusing on the ideas of rate
and ratio from a developmental perspective.
Development of the Concept of Rate
Thompson stated that
“the development of images of rate starts with children’s image of
change in some quantity (e.g., displacement of position, increase in
volume), progresses to loosely coordinated images of two quantities (e.g.,
displacement of position and duration of displacement), which progresses
to an image of the covariation of two quantities so that their measures
remain in constant ratio.”
Young children, according to Piaget (1970, p 226-325), understand movement as
a change of location instead of as a distance traveled. That is, children’s earliest
conception of movement is concerned only with starting and stopping points, and is
unconcerned with an amount of displacement. Speed, for young children, is simply the
intuition of overtaking. That is, if two objects are in motion simultaneously, the one
which is in front of the other has the greatest speed, regardless of where they started. The
young child does not understand that speed is a relationship between distance and time
but rather equates speed with distance or time. For example, some children think that
taking a longer time to travel a certain distance implies a greater speed. Monk (1992)
stated that perhaps students have only the most naive ideas about speed, distance, and
time, regardless of how information about them is represented. Monk (1992) also stated
that it is not uncommon for adults to be able to interpret a speedometer reading only in
terms of a primitive intuition that might be called “fastness”, having little idea of how to
interpret this reading to changes in position in relation to changes in time.

10
Adolescents’ ratio and proportional reasoning, according to Piaget (1970),
develops from a single strategy, often additive in nature, to the mature scheme of constant
rate of change which involves the understanding that increases are in the same proportion
as that of the previously acquired amounts, and hence, in the same proportion as that of
the total amounts acquired including the increases. He also stated that the scheme of rate
and proportion is a late acquisition.
The ideas of average rate of change of one quantity with respect to changes in
another, average rate of change of a function over an interval, secant to a graph and
tangent to a graph are related. Average rate of change of one quantity with respect to
changes in another is the constant rate of change at which one quantity would vary with
respect to the other so that the same total changes occur as before. A function, f(x), may
be used to describe the relationship between the real-life quantities. Then the average rate
of change of one real-life quantity with respect to changes in the other, say from x to x+h,
can be related to the average rate of change of the function f(x) over the interval [x, x+h]
since they describe they same idea. In the latter case, the average rate of change of a
function f as x ranges from x0 to x0+h would be the function which has a constant rate of
change and which produces the same total change over [x0,x0+h] as did f. However, we
may discuss the average rate of change of a function over an interval without referring to
a real-life situation.
The secant to a graph can also be related to the average rate of change of one
quantity with respect to another. If a function f(x), used to describe the relationship
between the real-life quantities is graphed, the secant to the graph of the function is the
graph of the function which has a constant rate of change and which produces the same
total change over the interval [x, x+h] as did the original function. We think of the secant
11
as a graphic illustration of the average rate of change of one quantity with respect to
another and the average rate of change of a function over an interval which are numerical.
The tangent to the graph is the graph of the function which is the limit of the
sequence of functions associated with the secants. The slope of the tangent to a graph is
defined to be the instantaneous rate of change of a function.
The derivative, used to represent point properties of a curve or a function, can be
thought of as the average rate of change “at a point”, the velocity of a body in motion at
any given time or the instantaneous velocity. Instantaneous velocity, the derivative, could
be defined as the limit of the average velocity as the time interval approaches zero. Strang
stated that, “the whole subject of calculus is built on the relation between velocity and
distance.” A conceptual understanding of the derivative of any function f differentiable at
a point a, is thinking of f’(a) as the rate of change of f at a. Many students tested and
interviewed do not have this conceptual understanding of the derivative. Also, it was seen
that their informal image of rate of change is kept separate from related ideas of the
derivative being studied formally.
An important aid in visualizing the relationship between average rate of change
and the derivative is graphing. From the above definitions of (average) rate of change and
derivative, if f is a function of t, it is possible to graph the relationship between f and t.
The slope of the secant between two points on the graph, representing the average rate of
change, and the slope of the tangent at a point, representing the derivative, are very
closely related. On the graph of f(t) from a to a+h the distance up divided by the distance
across gives the slope of the secant and represents the constant rate of change which
produces the same total change over [a, a + h] as does the original function. As h
approaches 0, the slope of the tangent at a, representing the derivative, can be calculated.
12
For grades 9 to 12, the Summary of Changes in Content and Emphasis in the
Standards states that students be able to make “the connections among a problem
situation, its model as a function in symbolic form, and the graph of that function”. If a
student were given a problem situation involving distance and time, he may be able to
express the situation as a function f(t), where f(t) is the distance as a function of time, and
then graph the function. He then may be able to relate the slope of a secant line to
average velocity. Finding the slope of the tangent at a point on the graph of the function
by defining the velocity at a particular point along the graph of the function would lead to
the concept of the derivative. At any point along the graph of the function, the derivative
or the slope of the tangent may be used to describe the rate at which a graph rises (or
falls) and instantaneous velocity is the rate at which the distance changes with respect to
time. We can apply the derivative concept to any quantity that can be represented by a
function. Since quantities of this type occur in nearly every field of knowledge,
applications of the derivative are numerous and varied, but each concerns a rate of
change.
Students’ Difficulties with the Derivative
Ferrini-Mundy and Graham (1994) studied connections students had made
between the graphical and algebraic representations of a function and how these
connections relate to their understanding of the limit, continuity, derivative and definite
integral of a function. They stated that the students they interviewed had the most
difficulty relating their graphical and formula-based understandings of a function to the
derivative. Their ability to compute derivatives using algorithms was excellent, as well as
their ability to test points, and determine positive and negative derivatives from curves.
However, their connections between procedural and conceptual knowledge of the
derivative was weak since they had no idea how the derivative of a function related to the

13
function itself or how the tangent line related to the derivative. Also, they could not relate
the idea of differentiability to the idea of the smoothness of a graph.
Orton (1984) investigated elementary calculus students’ basic algebra and
algebraic manipulation, their understanding of rate of change and its relationship with
differentiation, their use of limits, and their understanding of basic calculus’ symbols
using a wide range of questions which occur when calculus is being introduced. Students
found eight questions difficult; four concerned with understanding integration as the limit
of a sum and four concerned with understanding differentiation based on rate of change
and limits. He noted that students’ routine performance on differentiation items was
adequate, but that little intuitive or conceptual understanding of the derivative is present.
He argued that calculus should be introduced only after background work on limits and
rate of change had been included within the curriculum over a period of years.
Orton and Ferrini-Mundy had examined students’ difficulties in understanding the
derivative from a perspective that was highly symbolic. Another possibility was that
students’ difficulties with symbolic calculus was an expression of their inability to
connect the symbolism with anything conceptual which would be naturally expressed by
the notational methods they attempted to memorize. The present study investigates that
possibility by examining students’ conceptual understanding of rate of change before and
after they study the derivative. If it turns out that their understanding of rate of change
improves substantially, they probably connected their thinking, while studying the
derivative, to intuitions they already had - thereby transforming both their conceptual
understanding and its connections with the notational methods of calculus. If it turns out
that their understanding of rate is poor both before and after studying the derivative, then
it would be reasonable that they have difficulty using techniques of calculus skillfully and
thoughtfully, for those techniques would have no basis in understanding.

14
CHAPTER III
METHODS
Subjects and Setting
Subjects for the study were students enrolled in Math 150, Single Variable
Calculus, at San Diego State University during the Spring 1994 semester. All sections of
Math 150 used (Swokowski, 1991) as their primary text.
Of the six Math 150 calculus sections offered during this semester, the three
largest classes, with approximately 30 students each, participated in the investigation.
The remaining three classes, with fewer than 10 students each, did not participate in the
investigation. The three largest Math 150 classes were tested twice with one written
examination administered on two occasions. The first administration was given to a total
of 90 students. Two classes were given the pretest at the end of the first week of the
course and the third class was given the pretest at the beginning of the second week of
classes. The second administration was given soon after these same students had
completed their study of the derivative, about six weeks after the start of the course.
However, only 57 students of the original 90 students were present to participate in the
posttest.

15
Initial Procedures
After developing the written examination, the investigator presented the
examination to four people for review. Some of the questions were then modified for
readability and others were removed or replaced.
Prior to the start of the study, the investigator obtained approval from the
professors whose classes would be used for the written examinations. It was emphasized
to the students and stated on the first page of the examinations that participation in the
research was voluntary and their results on the examinations would not affect their grade
in the course. It was assumed, however, that the students completed both written
examinations to the best of their ability.
Written Examination Procedures
The pretest was administered during students’ normal class time. The pretest was
administered during the first or second week, prior to any discussion of the derivative.
The posttest was administered after students had taken their last course exam on the
derivative and before they began studying the integral. Times between the pretest and
posttest ranged from 6.5 weeks to 8.5 weeks.
Three forms of the test (Form A, B, and C) were constructed by putting items of
Form A in two random orders (Forms B and C). Each class was given approximately 10
copies of each form. By giving identical problems but in a different order each problem
would be attempted by at least some of the students. The entire examination was
designed to take approximately 50 minutes, the length of their normal class period. Some
students finished earlier and others did not complete the pretest during this time.
The posttest was given just after the students had completed their study of the
derivative, at about six weeks into the course. Each student took the same test form as on

16
the pretest. Each question is presented and discussed separately in Chapter IV. The entire
test is presented in Appendix A.
Interviews
Each pretest had a checkbox where students could indicate their willingness to be
interviewed. Six students who took both pretest and posttest were selected to be
interviewed. The selection of these six students was made as follows. First, the upper,
middle, and lower range of the performance scores were determined. Then names of two
students from each of the performance groups, who had responded with lengthy
explanations of their answers on the written examinations and had indicated a willingness
to be interviewed, were selected. Of the three classes, three students were from one class,
two students were from another class and one student was from the third class. The
investigator then contacted each selected student to schedule an interview.
Interviews were held in a faculty office with only the interviewee and investigator
present. All interviews were videotaped, and each interview lasted approximately 2.5
hours. Students were asked to explain, in as much detail as possible, their understandings
of and responses to each question on the examination. The investigator would interject
prompts where appropriate to elicit clarifications and expansions (e.g., “What did you
mean when you wrote ...?” and “I don’t quite understand what you mean when you say
...”). The investigator then watched the videotapes in order to gain a richer sense of
students’ understanding of the concept of rate. Information from interviews was analyzed
separately and was used to place students’ performance data in a larger context of how
they connected the exam with what they already knew and with their work in
introductory calculus.

17
Data Analysis
Tests were analyzed from two perspectives: performance and process.
Performance data was gotten by scoring students’ answers according to whether they
were correct. Process data was gotten by analyzing students’ solution methods and
scratch work. Performance was scored 0 or 1; solution processes were categorized. In
both cases, data from pretest and posttest were analyzed by constructing contingency
tables to examine pre-post differences.
Students’ performance on an item was scored 1 (correct), 0 (not correct), N (no
response), or A (absent). Criteria for correctness varied from problem to problem, and is
discussed in Chapter 4 in the context of each item’s results. A score of “A” was given
only on the posttest, and only for students who were present at the pretest but absent on
the posttest. The score “N” (no response) was assigned only if an item was left
completely blank. Thirty-three of 90 students who took the pretest were absent for the
posttest. Data analyses were performed only on the 57 students who took both pretest and
posttest.
Categories of students’ processes were constructed from students’ responses. For
each item, the investigator sorted responses by initially “putting those together that go
together.” When finished with the initial sort, the investigator refined the categories by
reassigning responses to groups that they seemed to fit better. When the sort was stable
(i.e., the investigator saw no further refinements to be made), the investigator then
examined the groupings and assigned descriptive names to each group of responses. The
resulting categories are explained in Chapter 4 in the context of each item’s results.
18
CHAPTER IV
RESULTS AND FINDINGS
Analyses of Individual Problems
Each problem revealed unique aspects of students reasoning, and students’
performance varied considerably from problem to problem. As such, the investigator
discusses data on each problem, and the discussion has this organization: Discussions of
students’ performance (on those problems where such analyses make sense), discussions
of students’ thought processes which the investigator inferred from their work, and a
summary of the interviews held with the sample of six students.
In the discussions of students’ performance, the investigator explains the intent of
the problem, discusses criteria for assigning scores, presents pretest results, presents
posttest results, and compares the two performance results. In the discussions of inferred
thought processes, the investigator explains the categories into which students’ work
were put, presents the categories to which students were assigned on the pretest, the
categories to which students were assigned on the posttest, and presents cross-tabulations
of the two.
In the interview summaries, the investigator presents excerpts and illustrations of
students’ thinking which serve to illuminate the measurement data. At times the
19
interviews will be consistent with the data, but at times it will show that students were
thinking at a much less sophisticated level than their work might suggest.
Problem 1
A textbook stated: “A car traveled 5 miles across town in 15 minutes.” Is it
reasonable for the teacher to ask how far the car went in the first 2 minutes?
(a) Yes. It went ____ miles.
(b) No. Because … (explain)
Intent of Problem 1
Problem 1 presents a situation which, in junior high school, is often intended to
have students reason proportionally. What is often presumed, but unstated, is that in order
to use proportional reasoning one must assume that the car traveled at a constant velocity.
But nowhere in the text is such a condition stated. Alternative (a) was offered with the
intention that students who assumed, consciously or unconsciously, that the car traveled
at a constant velocity would select it. Alternative (b) was included so that students who
recognized the inappropriateness of assuming constant velocity would be free to state as
such.
Criteria for Assigning Scores
The nature of Problem 1 is such that students’ answers are not strictly correct or
strictly incorrect. So performance data does not actually reflect correct performance.
Rather, it reflects, to some extent, what students presumed about the situation.
The investigator assigned a “1” to any answer which suggested that the student
thought that going 5 miles in 15 minutes says nothing about where the car was at any
20
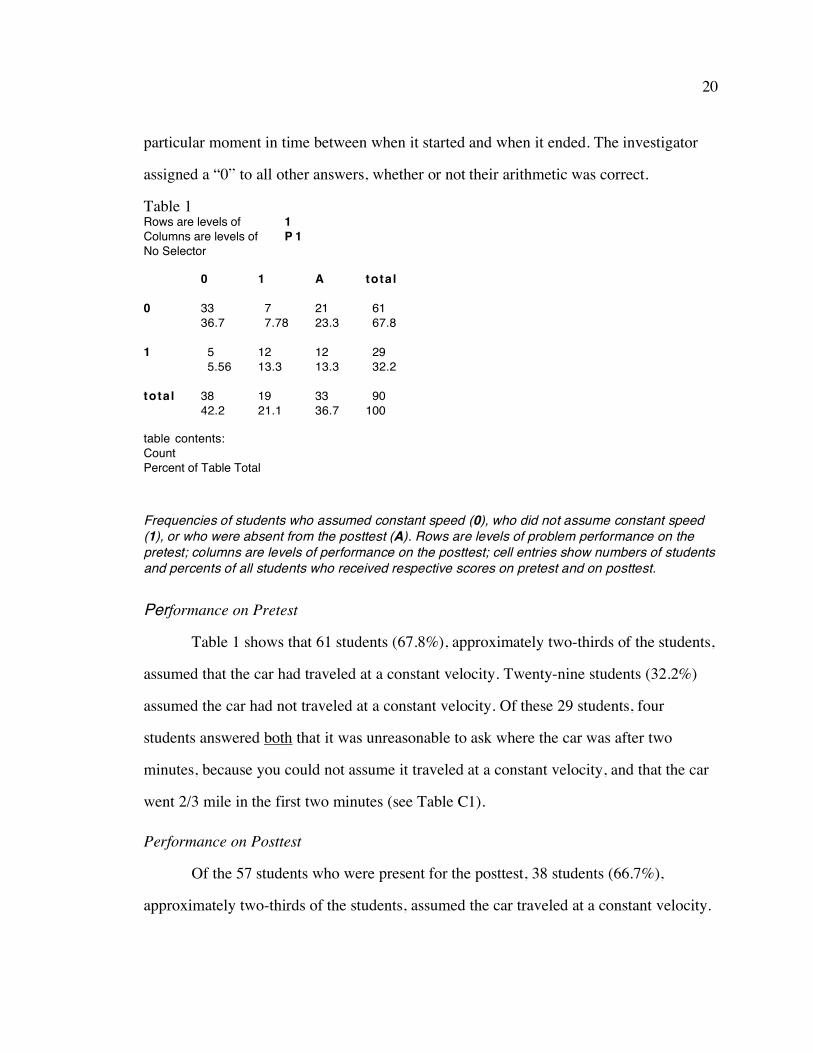
particular moment in time between when it started and when it ended. The investigator
assigned a “0” to all other answers, whether or not their arithmetic was correct.
Table 1 Rows are levels ofColumns are levels ofNo Selector
1P 1
0
1
total
0
3336.7
55.56
3842.2
1
77.78
1213.3
1921.1
A
2123.3
1213.3
3336.7
total
6167.8
2932.2
90100
table contents:CountPercent of Table Total
Frequencies of students who assumed constant speed (0), who did not assume constant speed (1), or who were absent from the posttest (A). Rows are levels of problem performance on the pretest; columns are levels of performance on the posttest; cell entries show numbers of students and percents of all students who received respective scores on pretest and on posttest.
Performance on Pretest
Table 1 shows that 61 students (67.8%), approximately two-thirds of the students,
assumed that the car had traveled at a constant velocity. Twenty-nine students (32.2%)
assumed the car had not traveled at a constant velocity. Of these 29 students, four
students answered both that it was unreasonable to ask where the car was after two
minutes, because you could not assume it traveled at a constant velocity, and that the car
went 2/3 mile in the first two minutes (see Table C1).
Performance on Posttest
Of the 57 students who were present for the posttest, 38 students (66.7%),
approximately two-thirds of the students, assumed the car traveled at a constant velocity.
21
This is consistent with the pretest results. Nineteen students (33.3%) assumed the car had
traveled at an average velocity. Of these 19 students, three students answered both that it
was unreasonable to ask where the car was after two minutes, because you could not
assume it traveled at a constant velocity, and that the car went 2/3 mile in the first two
minutes (see Table C2).
Comparison of Pretest and Posttest Performance
We can see how consistent were students pretest and posttest performance by
examining the (0,0) and (1,1) cells of Table 1. These cells show that, of the 57 students
who took both tests, 45 (78.9%) were consistent from pretest to posttest. The (0,1) cell
shows that seven students (12.3%) changed from assuming constant velocity to not
assuming it. Cell (1,0) shows that five students (8.8%) changed from not assuming
constant velocity to assuming it.
Table C1
Rows are levels ofColumns are levels ofNo Selector
C1PC1
averv
both
cnstv
total
averv
1017.5
11.75
58.77
1628.1
both
00
23.51
11.75
35.26
cnstv
35.26
11.75
3459.6
3866.7
total
1322.8
47.02
4070.2
57100
table contents:CountPercent of Table Total
averv Average velocity. Realized this was an average speed not constant.

22
both Both. Answered both parts. cnstv Constant velocity. Took 5 miles in 15 minutes as a constant speed, not
an average speed.
Categories of Inferred Thought Processes
Table C1 shows the grouping of the inferred thought processes. The nature of
Problem 1 was such that performance was essentially equivalent to inferred thought
processes. Therefore, no further discussion will be given for Problem 1 regarding inferred
thought processes.
Summary of Interviews
Of the six students interviewed, four assumed the car was traveling at a constant
velocity during the car’s trip across town. These students stated that the car traveled 1
mile in 3 minutes, hence 2/3 mile in 2 minutes. When these four students were asked to
describe a trip through a typical town, they immediately realized that their velocity would
not be constant. They changed from assuming that the velocity was constant to not
assuming it, stating that it wouldn’t be reasonable to ask how far the car traveled in the
first 2 minutes. However, one of these students added that in the first 2 minutes the car
“would be about 2/3 miles”. From this last comment, it can be presumed that there is not
much distinction between this student’s concept of average velocity and constant
velocity.
The remaining two students who were interviewed did not assume constant
velocity for the car’s trip through town. They stated that “the car did not travel at a
constant speed due to stops, etc., so we cannot guess how far the car went in two
minutes”. However, one of these two students had assumed constant velocity for the car’s
trip through town during the pretest.
23
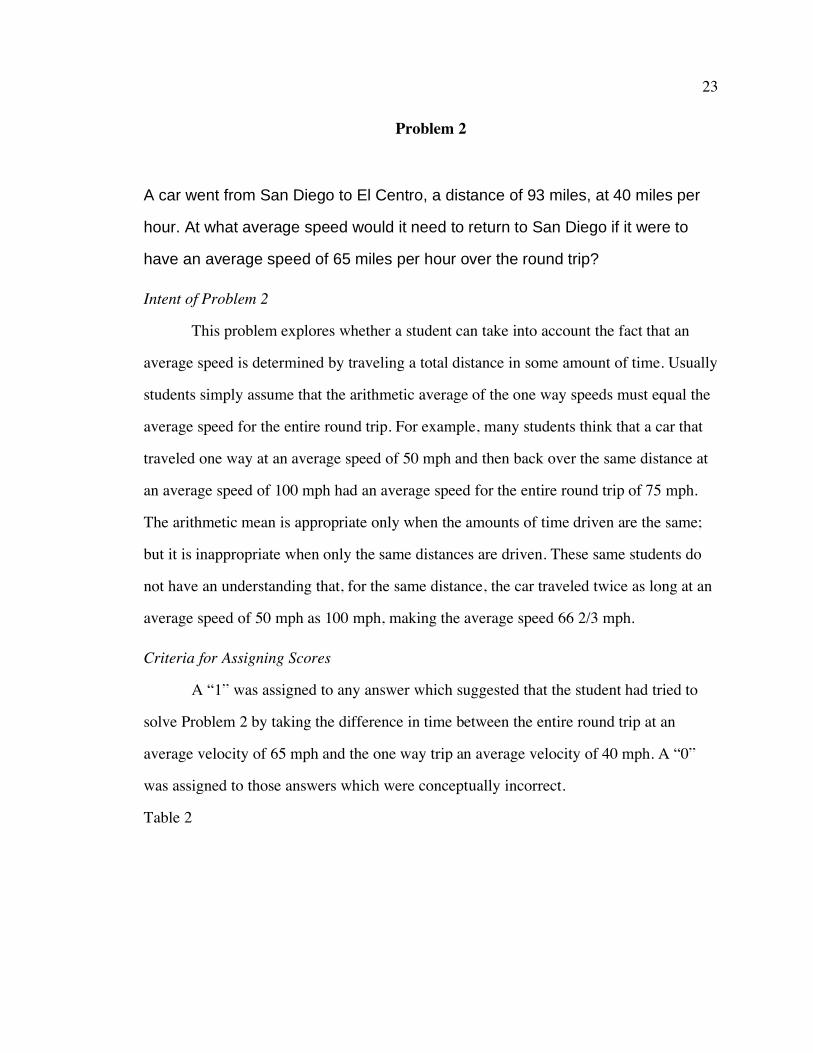
Problem 2
A car went from San Diego to El Centro, a distance of 93 miles, at 40 miles per
hour. At what average speed would it need to return to San Diego if it were to
have an average speed of 65 miles per hour over the round trip?
Intent of Problem 2
This problem explores whether a student can take into account the fact that an
average speed is determined by traveling a total distance in some amount of time. Usually
students simply assume that the arithmetic average of the one way speeds must equal the
average speed for the entire round trip. For example, many students think that a car that
traveled one way at an average speed of 50 mph and then back over the same distance at
an average speed of 100 mph had an average speed for the entire round trip of 75 mph.
The arithmetic mean is appropriate only when the amounts of time driven are the same;
but it is inappropriate when only the same distances are driven. These same students do
not have an understanding that, for the same distance, the car traveled twice as long at an
average speed of 50 mph as 100 mph, making the average speed 66 2/3 mph.
Criteria for Assigning Scores
A “1” was assigned to any answer which suggested that the student had tried to
solve Problem 2 by taking the difference in time between the entire round trip at an
average velocity of 65 mph and the one way trip an average velocity of 40 mph. A “0”
was assigned to those answers which were conceptually incorrect.
Table 2

24
Rows are levels ofColumns are levels ofNo Selector
2P 2
0
1
N
total
0
4954.4
22.22
11.11
5257.8
1
11.11
11.11
00
22.22
A
2831.1
22.22
33.33
3336.7
N
22.22
11.11
00
33.33
total
8088.9
66.67
44.44
90100
table contents:CountPercent of Table Total
Frequencies of students whose answers were conceptually incorrect (0), who considered the difference in times of travel between the entire round trip at an average of 65 mph and the one way trip at 40 mph (1), who were absent from the posttest (A), or who gave no response (N). Rows are levels of performance on the pretest; columns are levels of performance on the posttest; cell entries show numbers of students and percents of all students who received respective scores on pretest and on posttest.
Performance on Pretest
Table 2 shows that 80 students (88.9%) solved this problem incorrectly. Only six
students (6.67%), the third lowest number of correct responses overall, considered the
times of travel for the two round trips in order to find the average velocity of the return
trip. The remaining four students (4.44%) did not give a response to this question.
Performance on the Posttest
Of the 57 students present for the posttest, 52 students (91.2%) solved this
problem incorrectly. Two students (3.5%) gave the correct response by considering the
times of travel for the two round trips. The remaining three students (5.26%) did not give
a response.
25
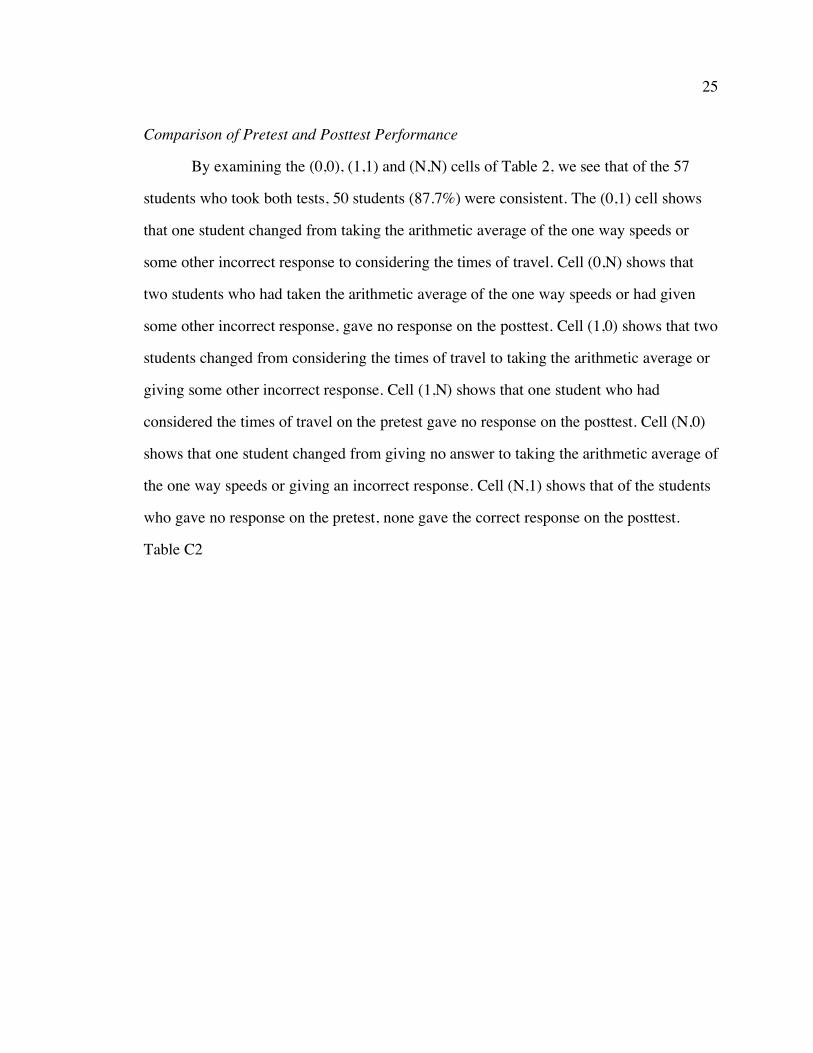
Comparison of Pretest and Posttest Performance
By examining the (0,0), (1,1) and (N,N) cells of Table 2, we see that of the 57
students who took both tests, 50 students (87.7%) were consistent. The (0,1) cell shows
that one student changed from taking the arithmetic average of the one way speeds or
some other incorrect response to considering the times of travel. Cell (0,N) shows that
two students who had taken the arithmetic average of the one way speeds or had given
some other incorrect response, gave no response on the posttest. Cell (1,0) shows that two
students changed from considering the times of travel to taking the arithmetic average or
giving some other incorrect response. Cell (1,N) shows that one student who had
considered the times of travel on the pretest gave no response on the posttest. Cell (N,0)
shows that one student changed from giving no answer to taking the arithmetic average of
the one way speeds or giving an incorrect response. Cell (N,1) shows that of the students
who gave no response on the pretest, none gave the correct response on the posttest.
Table C2
26
Rows are levels ofColumns are levels ofNo Selector
C2PC2
N
aaver
cmprt
cni
nwk
onet
total
N
00
11.75
23.51
00
00
00
35.26
aaver
00
2543.9
23.51
11.75
58.77
11.75
3459.6
cmprt
00
11.75
11.75
00
00
00
23.51
cni
00
23.51
00
11.75
00
00
35.26
nwk
00
23.51
00
11.75
610.5
23.51
1119.3
onet
11.75
23.51
00
00
11.75
00
47.02
total
11.75
3357.9
58.77
35.26
1221.1
35.26
57100
table contents:CountPercent of Table Total
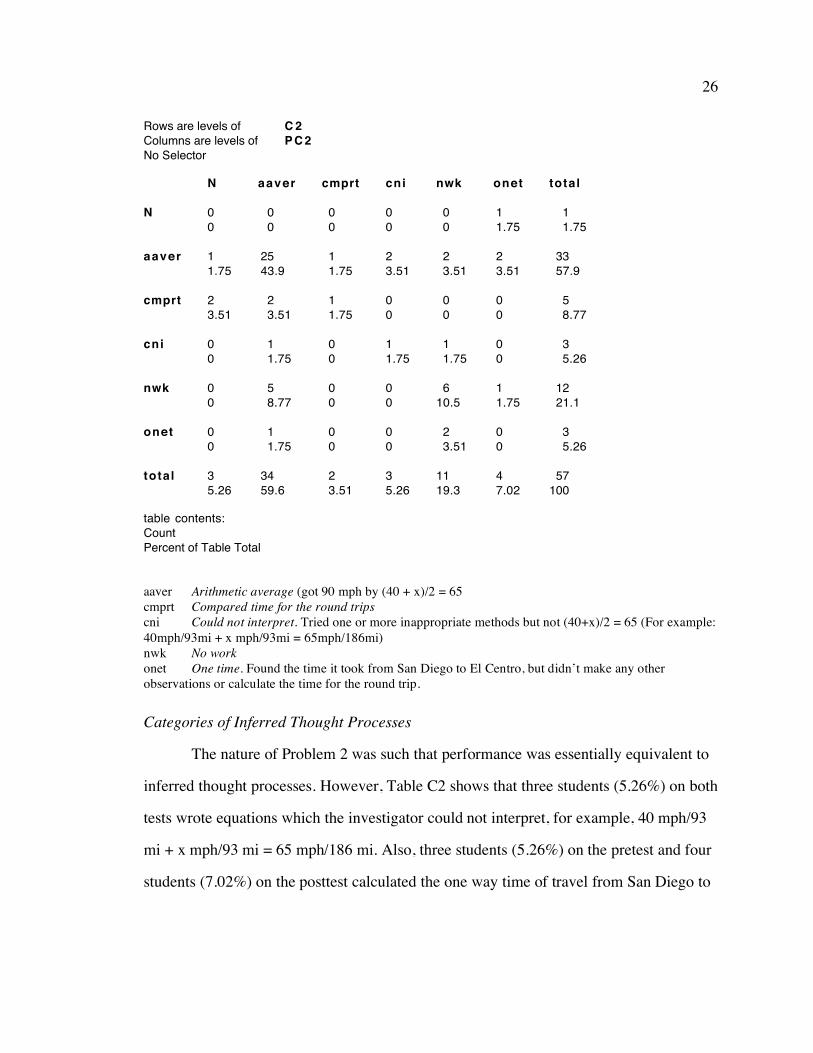
aaver Arithmetic average (got 90 mph by (40 + x)/2 = 65 cmprt Compared time for the round trips cni Could not interpret. Tried one or more inappropriate methods but not (40+x)/2 = 65 (For example: 40mph/93mi + x mph/93mi = 65mph/186mi) nwk No work onet One time. Found the time it took from San Diego to El Centro, but didn’t make any other observations or calculate the time for the round trip.
Categories of Inferred Thought Processes
The nature of Problem 2 was such that performance was essentially equivalent to
inferred thought processes. However, Table C2 shows that three students (5.26%) on both
tests wrote equations which the investigator could not interpret, for example, 40 mph/93
mi + x mph/93 mi = 65 mph/186 mi. Also, three students (5.26%) on the pretest and four
students (7.02%) on the posttest calculated the one way time of travel from San Diego to

27
El Centro (from that trip’s given distance and speed) but did not make any other
observations or calculations.
Summary of Interviews
Of the six students interviewed, four students solved Problem 2 incorrectly by
taking the arithmetic average of the one way speeds. These students concluded that the
return trip needed be at an average speed of 90 mph for the entire round trip to have an
average speed of 65 mph since the average one way speed was 40 mph. They were then
asked to compare the times of travel for these two round trips. They did not perform any
calculations but strongly believed that the times of travel were the same for these two
equal distance round trips.
Four interview students solved Problem 2 by finding the arithmetic average of the
one way speeds. Three of these four students did not use the equation (40 + x)/2 = 65.
Instead, these three students discussed Problem 2 in terms of “balancing” the one-way
speeds. They stated that “since 40 mph is 25 mph less than 65 mph, 25 mph would need
to be added to the 65 mph on the return trip in order that the average speed for the round
trip be 65 mph”.
Another interviewed student stated that Problem 2 did not have an answer, since
Problem 2 may be similar to Problem 1. That is, the car in Problem 2 may also be
traveling through a town where the car’s velocity varies along the way. It was presumed
that this student had an inadequate conceptual image of the average velocities, not
understanding that average velocity allows for variations during a trip.
The sixth interviewed student had received the highest score overall on both tests
and was one of the two students who had given a correct response on the posttest to

28
Problem 2. He had focused on the arithmetic average of the speeds in the pretest but on
the posttest had written “186 mi/65 mph = 93 mi/40 mph + 93 mi/x mph”. This last
equation indicated to the investigator that he now had an understanding of the
relationship between the times of travel in Problem 2. This equation indicated that he
understood that the time of travel for the round trip at an average speed of 65 mph was
the same as the time of travel for the round trip with a one way average speed of 40 mph
and the other one way with an average speed of x mph. However, when asked to explain
his understanding of Problem 2 and how this led to the equation which he had written, he
replied, “I don’t know how I got this equation.” He explained that he had basically set up
a proportion, being careful to place the same units in the numerator or denominator but
was unconcerned about which units would be in the numerator as compared to the
denominator. The order of placement, of course, is significant in order for the times of
travel for the round trips to be equal. It was found through interviewing this student
regarding his understanding of Problem 2, that he had selected the correct order of
placement of the units in setting up his proportion purely by chance. The investigator had
assumed, from the proportion that this student had written, that this student possessed the
understanding in Problem 2 that the times of travel for the round trips had to be equal in
order to solve this problem. This, however, was an incorrect assumption.
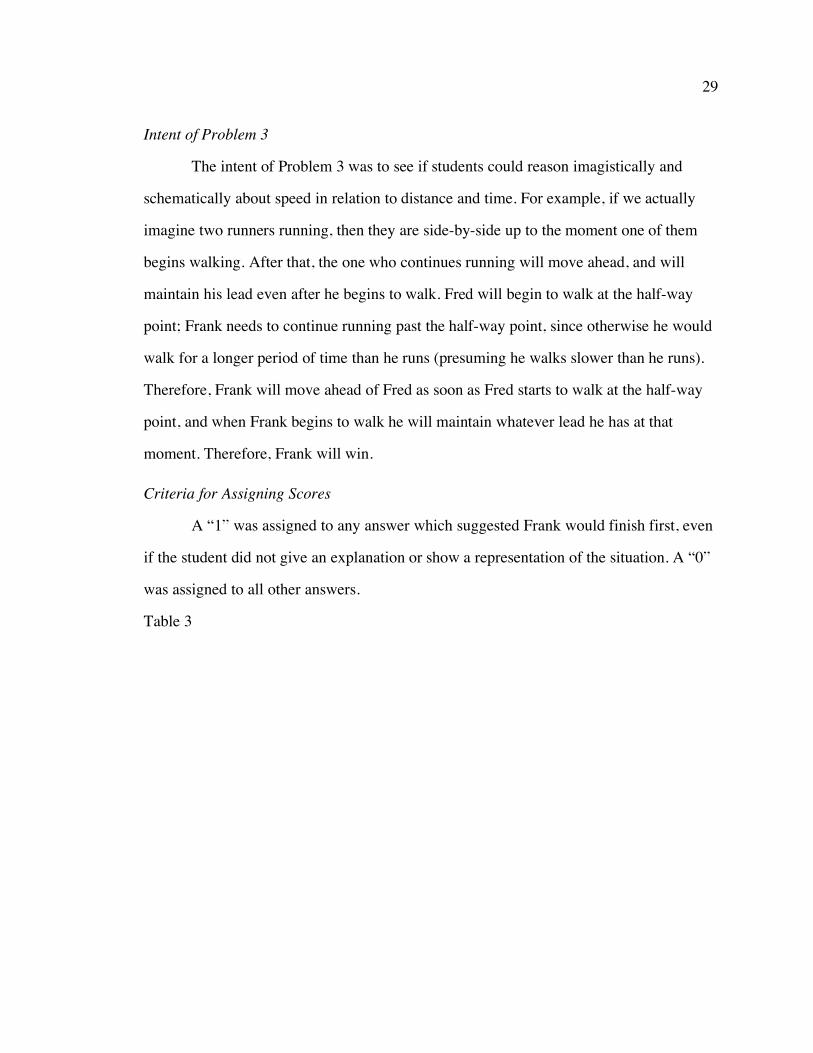
Problem 3
Fred and Frank are two fitness fanatics. On a run from A to B, Fred runs half the way and
walks the other half. Frank runs for half the time and walks for the other half. They both
run and walk at the same speed. Who finishes first?
29
Intent of Problem 3
The intent of Problem 3 was to see if students could reason imagistically and
schematically about speed in relation to distance and time. For example, if we actually
imagine two runners running, then they are side-by-side up to the moment one of them
begins walking. After that, the one who continues running will move ahead, and will
maintain his lead even after he begins to walk. Fred will begin to walk at the half-way
point; Frank needs to continue running past the half-way point, since otherwise he would
walk for a longer period of time than he runs (presuming he walks slower than he runs).
Therefore, Frank will move ahead of Fred as soon as Fred starts to walk at the half-way
point, and when Frank begins to walk he will maintain whatever lead he has at that
moment. Therefore, Frank will win.
Criteria for Assigning Scores
A “1” was assigned to any answer which suggested Frank would finish first, even
if the student did not give an explanation or show a representation of the situation. A “0”
was assigned to all other answers.
Table 3

30
Rows are levels ofColumns are levels ofNo Selector
3P 3
0
1
N
total
0
3640
22.22
11.11
3943.3
1
910
88.89
00
1718.9
A
2123.3
66.67
66.67
3336.7
N
11.11
00
00
11.11
total
6774.4
1617.8
77.78
90100
table contents:CountPercent of Table Total
Frequencies of students who gave an answer other than Frank finished first (0), who answered that Frank finished first (1), who were absent from the posttest (A), or who gave no response (N). Rows are levels of problem performance on the pretest; columns are levels of performance on the posttest; cell entries show numbers of students and percents of all students who received respective scores on pretest and on posttest.
Performance on Pretest
Table 3 shows that 67 students, about three-fourths (74.4%) of the students, gave
an answer other than Frank finished first, such as, “Fred and Frank finished at the same
time” or “Fred finished first”. Sixteen students (17.8%) stated that Frank would finish
first, and seven students (7.78%) gave no response.
Performance on Posttest
Table 3 shows that, of the 57 students who took the posttest, 39 students (68.4%)
gave an answer other than Frank finished first. Seventeen students (29.8%) stated that
Frank would finish first and one student (1.8%) gave no response.
31
Comparison of Pretest and Posttest Performance
There was a substantial increase in the percentage of correct responses on the
posttest as compared to the pretest. Also, the percentage of those who did not answer this
question decreased from 7.78% on the pretest to 1.8% on the posttest. Cells (0,0), (1,1)
and (N,N) of Table 3 indicate that, of the 57 students who took both tests, 44 students
(77.2%) were consistent from pretest to posttest. The (0,1) cell indicates that nine
students changed from saying that Frank did not finish first to thinking that Frank
finished first. The (0,N) cell indicates that one student who thought that Frank did not
finish first on the pretest gave no answer on the posttest. The (1,0) cell indicates that two
students changed from thinking that Frank finished first to some other answer. The (1,N)
cell indicates that, of the students who thought Frank finished first on the pretest, all of
them gave a response on the posttest. Of the students who gave no response on the
pretest, cell (N,0) indicates that one student gave an incorrect answer on the posttest and
cell (N,1) indicates that there were no students who thought Frank finished first on the
posttest.
Table C3
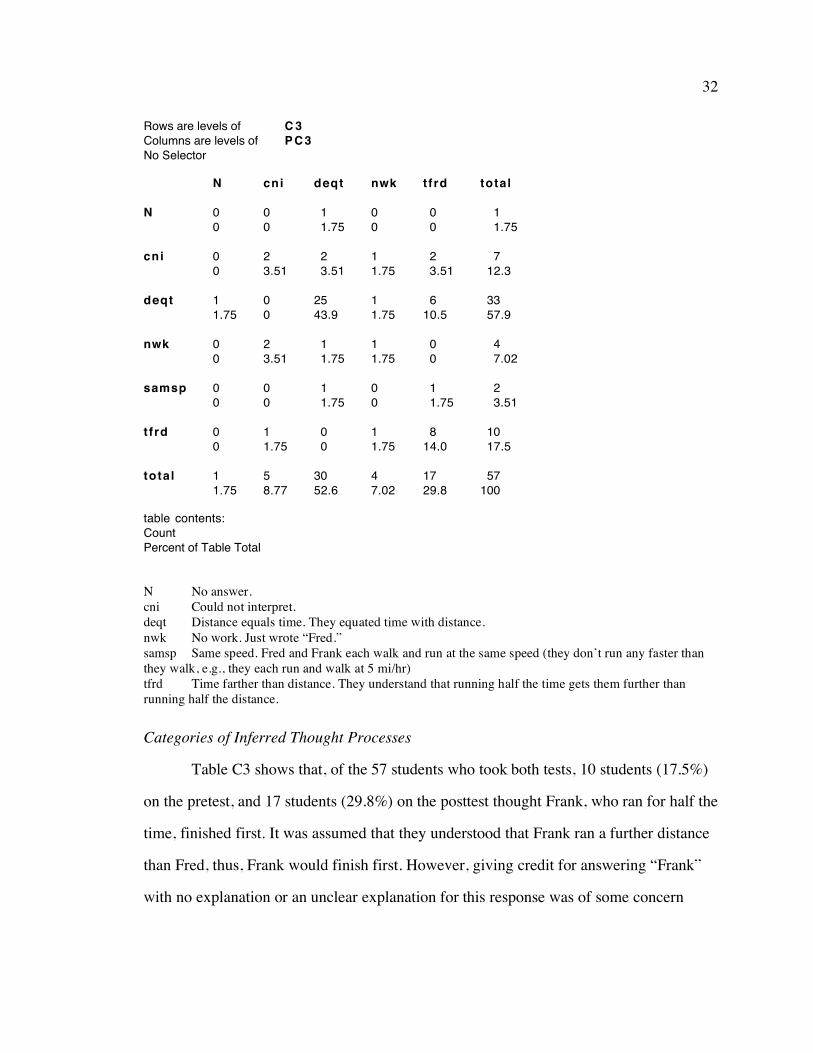
32
Rows are levels ofColumns are levels ofNo Selector
C3PC3
N
cni
deqt
nwk
samsp
tfrd
total
N
00
00
11.75
00
00
00
11.75
cni
00
23.51
00
23.51
00
11.75
58.77
deqt
11.75
23.51
2543.9
11.75
11.75
00
3052.6
nwk
00
11.75
11.75
11.75
00
11.75
47.02
t f rd
00
23.51
610.5
00
11.75
814.0
1729.8
total
11.75
712.3
3357.9
47.02
23.51
1017.5
57100
table contents:CountPercent of Table Total
N No answer. cni Could not interpret. deqt Distance equals time. They equated time with distance. nwk No work. Just wrote “Fred.” samsp Same speed. Fred and Frank each walk and run at the same speed (they don’t run any faster than they walk, e.g., they each run and walk at 5 mi/hr) tfrd Time farther than distance. They understand that running half the time gets them further than running half the distance.
Categories of Inferred Thought Processes
Table C3 shows that, of the 57 students who took both tests, 10 students (17.5%)
on the pretest, and 17 students (29.8%) on the posttest thought Frank, who ran for half the
time, finished first. It was assumed that they understood that Frank ran a further distance
than Fred, thus, Frank would finish first. However, giving credit for answering “Frank”
with no explanation or an unclear explanation for this response was of some concern
33
since the student’s reasoning may not have been correct. For example, one student on his
posttest had written “Time is faster than distance so that Frank finishes an obvious first”.
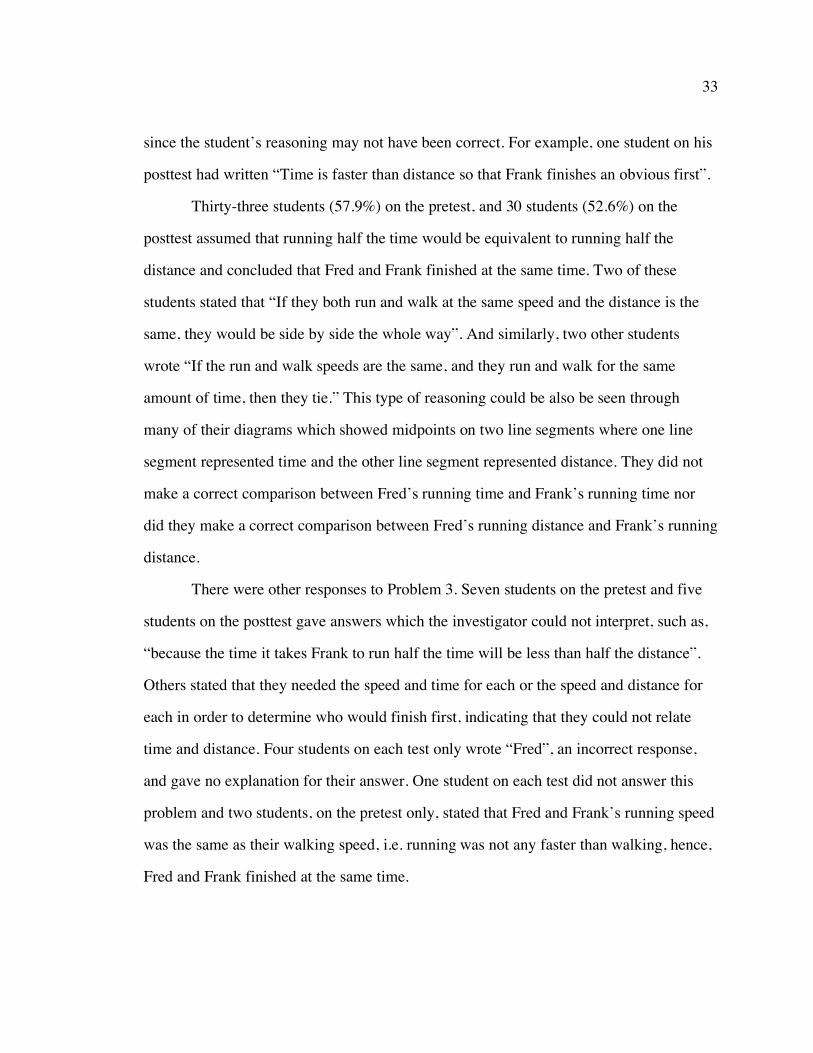
Thirty-three students (57.9%) on the pretest, and 30 students (52.6%) on the
posttest assumed that running half the time would be equivalent to running half the
distance and concluded that Fred and Frank finished at the same time. Two of these
students stated that “If they both run and walk at the same speed and the distance is the
same, they would be side by side the whole way”. And similarly, two other students
wrote “If the run and walk speeds are the same, and they run and walk for the same
amount of time, then they tie.” This type of reasoning could be also be seen through
many of their diagrams which showed midpoints on two line segments where one line
segment represented time and the other line segment represented distance. They did not
make a correct comparison between Fred’s running time and Frank’s running time nor
did they make a correct comparison between Fred’s running distance and Frank’s running
distance.
There were other responses to Problem 3. Seven students on the pretest and five
students on the posttest gave answers which the investigator could not interpret, such as,
“because the time it takes Frank to run half the time will be less than half the distance”.
Others stated that they needed the speed and time for each or the speed and distance for
each in order to determine who would finish first, indicating that they could not relate
time and distance. Four students on each test only wrote “Fred”, an incorrect response,
and gave no explanation for their answer. One student on each test did not answer this
problem and two students, on the pretest only, stated that Fred and Frank’s running speed
was the same as their walking speed, i.e. running was not any faster than walking, hence,
Fred and Frank finished at the same time.
34
Summary of Interviews
The six interviews support the fact that most students had difficulty relating time
to distance in Problem 3. During one interview, a student stated that it would have been
easier to solve this problem if the running distances for both Fred and Frank were given
or if the running times for both Fred and Frank were given. During his interview he was
never able to compare Fred’s running distance to Frank’s running distance or Fred’s
running time to Frank’s running time from the given information.
All the students during their interviews were able to understand and represent
Fred’s situation, i.e. Fred ran half the distance and walked half the distance on a run from
A to B. However, after representing Fred’s situation using a line segment from A to B,
they had tremendous difficulty representing Frank’s situation which involved two half
times from A to B and relating this to Fred’s situation involving distances. One student
during his interview tried to resolve this problem by stating that “time and distance are
considered the same”, hence, Fred and Frank finish at the same time.
During another student’s interview, when given specific times that Frank ran and
walked (Frank ran for 1/2 hr and walked for 1/2 hr from A to B), said, “Don’t we need to
know how far that is?” indicating that she was trying to relate these times to the distances
running and walking but could not determine from these times that Frank ran for more
than half the distance from A to B and walked less than half the distance. It is interesting
to note, however, that when this same student was asked to focus instead on Fred’s
situation (Fred ran for half the distance and walked for half the distance), she was able to
state that “running would take less time” than walking but she still could not determine
who would finish first.
Another student stated that Fred finished first because she believed, “Running half
the distance is greater than running half the time.” Her statement indicated to the
35
investigator that perhaps the concept of distance is dominant in her thinking as compared
to the concept of time.
About half the students interviewed needed to use specific distances and times in
order to determine an answer to Problem 3. This was also seen on their tests. One of these
students, although he had represented Fred’s running and walking distances and Frank’s
running and walking times correctly using specific values could not determine who
would finish first.
The student with the best overall score on both tests, when interviewed, stated that
“Fred (who runs half the way and walks the other half) reached the half way point sooner
than half the time” but could not determine who would finish first. Not until he focused
on Frank’s situation (Frank runs for half the time and walks for the other half) and
realized that Frank runs past the half way point, could he determine that Frank finished
first.
Problem 4a
A car’s speed from a standing start increases at the rate of 5 ft/sec/sec over a 25 second
interval.
(a) What does 5 ft/sec/sec mean in this situation?
Intent of Problem 4a
The intent of Problem 4a was to investigate students’ understanding of
acceleration by having the students explain exactly what a constant acceleration of 5
ft/sec/sec means to them.
Criteria for Assigning Scores
A “1” was assigned to any answer similar to the following statement: “5 ft/sec/sec
means that for every second the car’s speed increased by 5 ft/sec, that is, 5 ft/sec/sec
36
represents a rate of change of velocity of the car.” If the student stated that for every
second the speed doubled, this answer was also assigned a “1” since he may have
recognized that “5 ft/sec/sec” implied a variable speed or thought only about the first two
seconds. A “0” was assigned to the answer “acceleration” if the student gave no further
explanation of what acceleration meant to him. The investigator felt that “acceleration”
was just a word substitution for the statement “a car’s speed from a standing start
increases at the rate of ...” and was not an explanation of meaning. Also, a “0” was
assigned to an answer which was a similar form of 5 ft/sec/sec, for example, 5 ft/sec^2.
The investigator was seeking the particular interpretation of 5 ft/sec/sec stated above
which showed that the student had a clear understanding of acceleration.
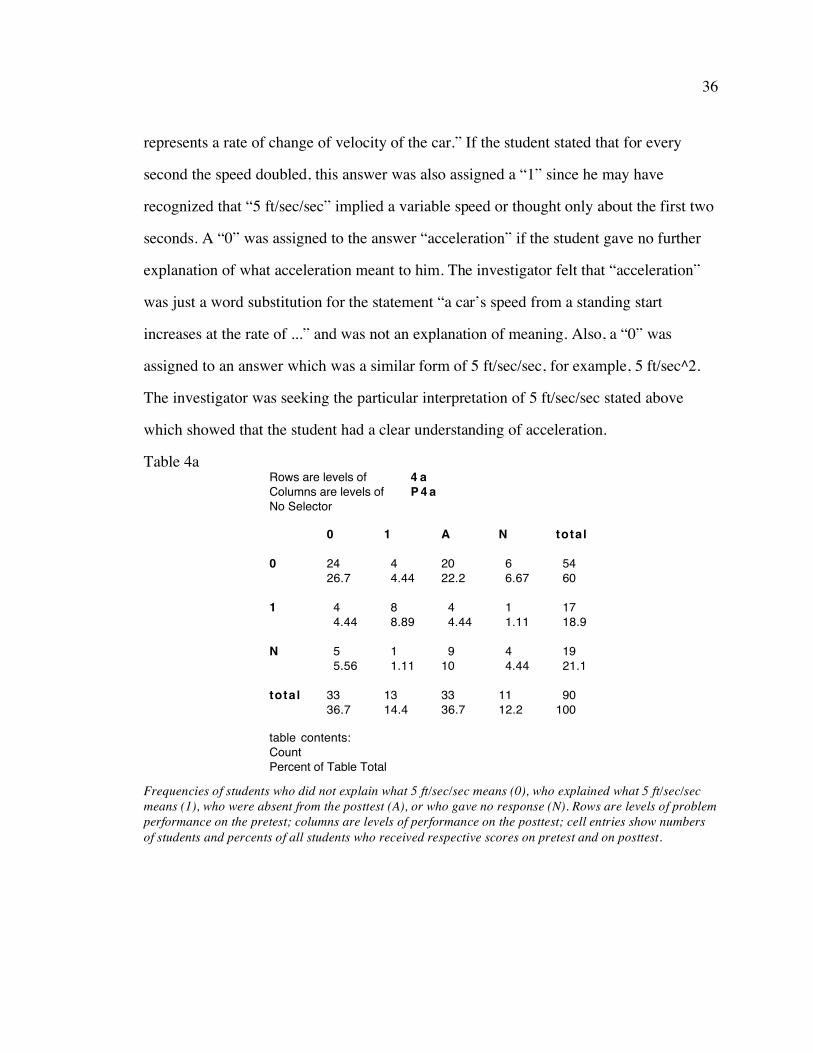
Table 4a Rows are levels ofColumns are levels ofNo Selector
4 aP4a
0
1
N
total
0
2426.7
44.44
55.56
3336.7
1
44.44
88.89
11.11
1314.4
A
2022.2
44.44
910
3336.7
N
66.67
11.11
44.44
1112.2
total
5460
1718.9
1921.1
90100
table contents:CountPercent of Table Total
Frequencies of students who did not explain what 5 ft/sec/sec means (0), who explained what 5 ft/sec/sec means (1), who were absent from the posttest (A), or who gave no response (N). Rows are levels of problem performance on the pretest; columns are levels of performance on the posttest; cell entries show numbers of students and percents of all students who received respective scores on pretest and on posttest.
37
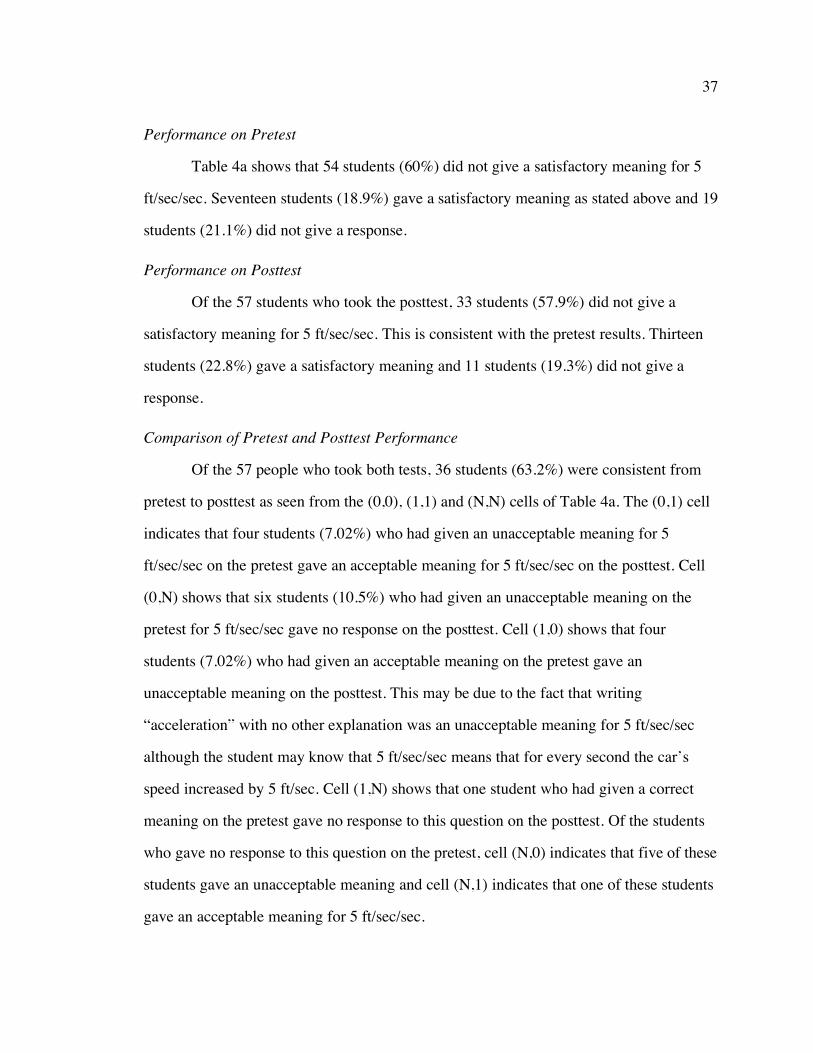
Performance on Pretest
Table 4a shows that 54 students (60%) did not give a satisfactory meaning for 5
ft/sec/sec. Seventeen students (18.9%) gave a satisfactory meaning as stated above and 19
students (21.1%) did not give a response.
Performance on Posttest
Of the 57 students who took the posttest, 33 students (57.9%) did not give a
satisfactory meaning for 5 ft/sec/sec. This is consistent with the pretest results. Thirteen
students (22.8%) gave a satisfactory meaning and 11 students (19.3%) did not give a
response.
Comparison of Pretest and Posttest Performance
Of the 57 people who took both tests, 36 students (63.2%) were consistent from
pretest to posttest as seen from the (0,0), (1,1) and (N,N) cells of Table 4a. The (0,1) cell
indicates that four students (7.02%) who had given an unacceptable meaning for 5
ft/sec/sec on the pretest gave an acceptable meaning for 5 ft/sec/sec on the posttest. Cell
(0,N) shows that six students (10.5%) who had given an unacceptable meaning on the
pretest for 5 ft/sec/sec gave no response on the posttest. Cell (1,0) shows that four
students (7.02%) who had given an acceptable meaning on the pretest gave an
unacceptable meaning on the posttest. This may be due to the fact that writing
“acceleration” with no other explanation was an unacceptable meaning for 5 ft/sec/sec
although the student may know that 5 ft/sec/sec means that for every second the car’s
speed increased by 5 ft/sec. Cell (1,N) shows that one student who had given a correct
meaning on the pretest gave no response to this question on the posttest. Of the students
who gave no response to this question on the pretest, cell (N,0) indicates that five of these
students gave an unacceptable meaning and cell (N,1) indicates that one of these students
gave an acceptable meaning for 5 ft/sec/sec.
38
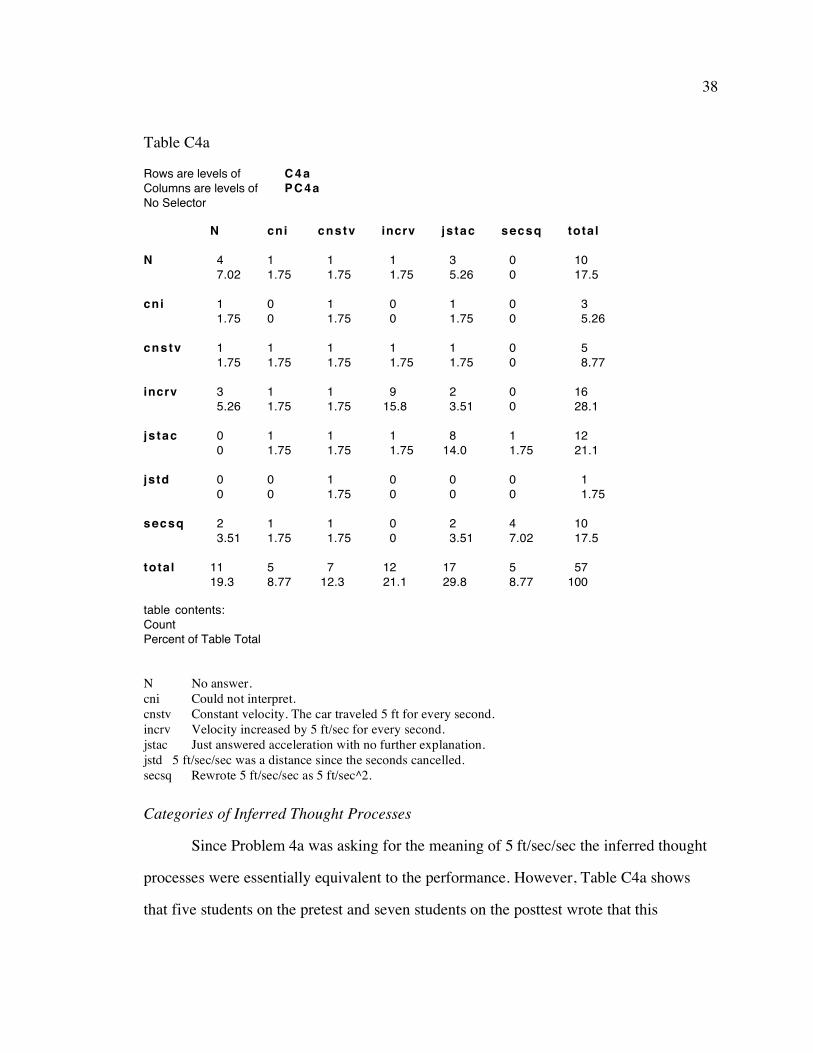
Table C4a
Rows are levels ofColumns are levels ofNo Selector
C4aPC4a
N
cni
cnstv
incrv
js tac
jstd
secsq
total
N
47.02
11.75
11.75
35.26
00
00
23.51
1119.3
cni
11.75
00
11.75
11.75
11.75
00
11.75
58.77
cnstv
11.75
11.75
11.75
11.75
11.75
11.75
11.75
712.3
incrv
11.75
00
11.75
915.8
11.75
00
00
1221.1
js tac
35.26
11.75
11.75
23.51
814.0
00
23.51
1729.8
secsq
00
00
00
00
11.75
00
47.02
58.77
total
1017.5
35.26
58.77
1628.1
1221.1
11.75
1017.5
57100
table contents:CountPercent of Table Total
N No answer. cni Could not interpret. cnstv Constant velocity. The car traveled 5 ft for every second. incrv Velocity increased by 5 ft/sec for every second. jstac Just answered acceleration with no further explanation. jstd 5 ft/sec/sec was a distance since the seconds cancelled. secsq Rewrote 5 ft/sec/sec as 5 ft/sec^2.
Categories of Inferred Thought Processes
Since Problem 4a was asking for the meaning of 5 ft/sec/sec the inferred thought
processes were essentially equivalent to the performance. However, Table C4a shows
that five students on the pretest and seven students on the posttest wrote that this
39
expression meant the “car goes 5 ft for every second”. This was either a careless error or
these students equated the constant acceleration expression 5 ft/sec/sec with the constant
speed expression 5 ft/sec with which they are probably more familiar. One student on the
pretest stated that 5 ft/sec/sec represented a distance since he thought the seconds in the
expression 5 ft/sec/sec canceled each other.
Summary of Interviews
The six interviews supported the fact that many students recognized 5 ft/sec/sec as
an acceleration although they may not have explained what acceleration meant to them.
Three of the students interviewed, who had written only “acceleration” on both tests,
were able to explain, that the speed of the car increased by 5 ft/sec for every second.
Their explanation went as follows: “at the end of first second, the speed would be 5
ft/sec, at the end of the second second, the speed would be 10 ft/sec, and at the end of the
third second, the speed would be 15 ft/sec, etc.”
Another student, when asked what the car’s speed was at the end of the second
second replied “15 feet” giving as his reason, “I always thought that accelerating, your
distance increases.” His understanding of acceleration is apparently limited to the fact
that during equal time intervals, the distance the car travels increases. During his
interview, he was never able to give the car’s speed at the end of every second.
The remaining two students who were interviewed gave an acceptable meaning
for 5 ft/sec/sec on both tests and during their interviews indicating that they appeared to
have a clear understanding of acceleration.

40
Problem 4b
A car’s speed from a standing start increases at the rate of 5 ft/sec/sec over a 25 second
interval.
(b) Circle the graph that represents the car’s distance over this 25 second interval.
i
ii
iii
Intent of Problem 4b
The intent of Problem 4b was to determine if students could identify the graph
which represented the distance traveled as a function of time of an accelerating object.
The students were given a choice between three different graphs or the student could
choose “none of these graphs”. In addition to the correct graph, two other graphs depicted
a constant rate (no acceleration) and a rate of zero (no displacement).
Criteria for Assigning Scores
A student received a “1” if he selected the quadratic graph. All other answers
received a “0”.
iv None of these represents the car’s distance.

41
Table 4b Rows are levels ofColumns are levels ofNo Selector
4bP4b
0
1
N
total
0
1617.8
77.78
22.22
2527.8
1
55.56
2123.3
22.22
2831.1
A
1617.8
1112.2
66.67
3336.7
N
11.11
22.22
11.11
44.44
total
3842.2
4145.6
1112.2
90100
table contents:CountPercent of Table Total
Frequencies of students who did not select the quadratic graph (0), who did select graph (i) (1), who were absent from the posttest (A), or who gave no response (N). Rows are levels of problem performance on the pretest; columns are levels of performance on the posttest; cell entries show numbers of students and percents of all students who received respective scores on pretest and on posttest.
Performance on Pretest
Table 4b shows that 38 students (42.2%) did not select the quadratic graph as
their answer to Problem 4b. Nine of these 38 students were able to give a correct meaning
for 5 ft/sec/sec in Problem 4a on the pretest. This appears to indicate that, although these
nine students were able to relate acceleration to speed as a function of time in their
description of 5 ft/sec/sec, they could not extend this understanding of an increase in
speed during equal time intervals to determine which graph represented the distance the
car traveled as a function of time. Table 4a also shows that 41 students (45.6%) chose the
correct answer and 11 students (12.2%) gave no answer to Problem 4b on the pretest.
42
Performance on Posttest
Of the 57 students present for the posttest, 25 students (43.9%) did not choose the
quadratic graph, 28 students (49.1%) did choose the quadratic graph, and four students
(7.02%) did not give an answer.
Comparison of Pretest and Posttest Performance
By examining cells (0,0), (1,1) and (N,N) of Table 4b, of the 57 students who
took both tests, we see that 38 students (66.6%) were consistent from pretest to posttest.
The (0,1) cell shows that five students (8.77%) who did not select the correct graph,
which represented distance as a function of time for an accelerating car, on the pretest
chose the correct graph on the posttest. The (0,N) cell shows that one student who did not
select the correct graph on the pretest gave no answer on the posttest. However, the (1,0)
cell shows that seven students (12.3%) who selected the correct graph on the pretest
selected an incorrect graph on the posttest. The (1,N) cell shows that two students who
selected the correct graph on the pretest gave no answer on the posttest. The (N,0) and
(N,1) cells show that of four students who did not give an answer on the pretest to
Problem 4b, two students selected an incorrect graph and two students selected the
correct graph on the posttest.
43
Table C4b
Rows are levels of
Columns are levels of
No Selector
C4b
PC4b
N
quad
lingr
none
total
N
1
1.75
2
3.51
0
0
1
1.75
4
7.02
quad
2
3.51
22
38.6
3
5.26
3
5.26
30
52.6
lingr
0
0
4
7.02
8
14.0
3
5.26
15
26.3
none
2
3.51
1
1.75
2
3.51
2
3.51
7
12.3
nwk
0
0
1
1.75
0
0
0
0
1
1.75
total
5
8.77
30
52.6
13
22.8
9
15.8
57
100
table contents:
CountPercent of Table Total
N No answer. quad Quadratic graph represented the correct relationship between distance and time. lingr Linear graph. Graph represented velocity as a function of time. none None of the graphs represented the relationship between distance and time.
Categories of Inferred Thought Processes
Since the students were required to only select the graph which represented the
distance as a function of time of an accelerating car in Problem 4b, it was difficult to
determine their thought processes. However, a few students who selected the correct
graph, graph (i), did give a reason for their selection which helped in understanding their
thought processes. One student stated that “you are accelerating exponentially so (i)
would be the curve” and another student stated that in the expression “5 ft/sec^2, the
square causes the graph to increase exponentially not directly”. The first reason given is
incorrect since the car’s acceleration is constant, not exponential, but more importantly,
both of these students refer to an exponential graph representing distance as a function of
44
time. One wonders that if the given graphs were not distance as a function of time, but
velocity or acceleration as a function of time, if these students would still choose the
graph that appeared curved, not linear. A curved graph seems to represent an exponential
function to these students irrespective of what the axes may represent. Another example
of students ignoring the axes and focusing on the shape of the graph can be seen when
one student selected the linear graph as his answer because “constant acceleration would
be a straight line.”
Part of the confusion between distance, velocity and acceleration comes from
students using incorrect units in describing these concepts. This was seen on both tests in
statements such as, “It is the only one that works at 5 sec, it would be going 25 miles”
and “Velocity increases 5 feet every second.”
Summary of Interviews
During the six interviews, students usually mentioned that they had seen these
graphs in classes other than their first semester calculus class, such as, in a physics class.
However, they could not remember which graph represented distance as a function of
time for an accelerating car.
One student stated that each graph looked like the derivative of the graph
preceding it, adding that he had learned this in a “Math for Business and Economics
Majors class”. He explained that since the acceleration was constant, the constant-
function graph was the acceleration, the linear graph was the velocity, and the quadratic
graph was the distance as a function of time of the accelerating car. Another student had
learned a similar technique but rather than stating that each graph looked like the
derivative of the graph preceding it, he had learned to look at the increase in area under
each graph, the integral, as the x values increased. He also explained that since
acceleration was constant, the constant-function graph was the acceleration as a function
45
of time. The increase in area under the constant-function graph as the x values increased
led this student to conclude that the linear graph represented the velocity as a function of
time and, similarly, the increase in area under the linear graph led to the quadratic graph.
During the interview with these two students, they did not discuss nor were they able to
understand the following relationship between acceleration, speed and distance as a
function of time: If a car accelerates at a constant rate, its speed increases during each
successive time interval and, hence, the distance traveled in each successive time interval
increases also. Therefore, the quadratic graph represents the total distance traveled at any
particular time t. Apparently, these two students had only learned a “trick”, using either
the derivative or the integral, to help them decide which graph represented the distance as
a function of time for a constantly accelerating object.
Two other students, during their interviews, stated that constant acceleration
meant that the graph would be represented by a straight line. They chose the linear graph
as their answer rather than the constant graph, since the horizontal line was at a y value of
125 which conflicted with the constant acceleration value of 5 ft/sec/sec. These students
did not ignore the fact that Problem 4b was referring to the graph of the distance as a
function of time and not constant acceleration as a function of time. In fact, one of these
students gave the following reason for equating constant acceleration with the distance
the car traveled: “The car’s speed is increasing at a constant speed so it should be
increasing the same amount of distance too.” Also, note that this student’s phrase
“increasing at a constant speed” is usually stated as “increasing at a constant rate”
indicating that rate may only be synonymous to speed for this student.
46
Problem 5a
Joe dropped a ball from the top of a building. It took 9 seconds for the ball to hit the
ground. The distance the ball fell in t seconds after it was released is given by the
function d(t), where d(t) = 16t2, 0 t 9.
(a) What was the ball’s average speed for the time between when it was released and
when it hit the ground?
Intent of Problem 5a
The intent of Problem 5a was to offer a situation which clearly involved non-
constant velocity and determine if students could see that the average velocity of an
object is determined solely by how far it went and how long it took to go that far.
Criteria for Assigning Scores
I assigned a “1” to any answer similar to “average speed = (change in
distance)/(change in time)” or “average speed = d(9)/9”. Another answer which was also
assigned a “1” and seen only on the posttest was “average velocity = d’(9)/2”. This last
answer, involving the derivative of d(t) at 9 seconds divided by 2, was given credit since
it produced a correct answer when applied to the second degree polynomial d(t) = 16t^2,
which involved a constant acceleration. However, this technique works only in the case
of constant acceleration. All other answers received a “0”.
Table 5a

47
Rows are levels ofColumns are levels ofNo Selector
5 aP5a
0
1
N
total
0
1516.7
910
88.89
3235.6
1
00
910
00
910
A
77.78
910
1718.9
3336.7
N
55.56
33.33
88.89
1617.8
total
2730
3033.3
3336.7
90100
table contents:CountPercent of Table Total
Frequencies of students who gave the incorrect average velocity (0), who gave the correct average velocity during the ball s travel (1), who were absent from the posttest (A), or who gave no response (N). Rows are levels of problem performance on the pretest; columns are levels of performance on the posttest; cell entries show numbers of students and percents of all students who received respective scores on pretest and on posttest.
Performance on Pretest
Table 5a shows that 27 students (30%) did not give the correct average velocity
for the ball’s travel on the pretest. Four of these students wrote “v = (9.8 m/sec^2)(9) =
88.2” which, to the investigator meant, “velocity = (acceleration due to gravity) x (9
seconds). Perhaps these students were thinking about the formula “velocity =
(acceleration)(time)” or “v = at”. Thirty students (33.3%) gave a correct response, either
“v = d/t = 16(9)^2/9” or “v = [d(9) d(0)]/[9-0]”. Thirty-three students (36.7%) gave no
response on the pretest.
Performance on Posttest
Of the 57 students who were present for the posttest, 32 (56.1%) did not give a
satisfactory answer for the average velocity of the ball during its travel. Nine students
(15.8%) gave a satisfactory answer and 16 students (28.1%) gave no response.

48
Comparison of Pretest and Posttest Performance
By examining cells (0,0), (1,1) and (N,N) of Table 5a, of the 57 students who took
both tests, 32 students (56.1%) were consistent from pretest to posttest. The (0,1) and
(0,N) cells show that, of those students who gave an unsatisfactory answer on the pretest,
there were no students who gave a satisfactory answer on the posttest and five students
who gave no answer on the posttest. Cells (1,0) and (1,N) indicate that, of those students
who gave a satisfactory answer on the pretest, nine students gave an unsatisfactory
answer on the posttest and three students did not give an answer on the posttest. Cells
(N,0) and (N,1) indicate that, of those students who gave no answer on the pretest, eight
students gave an unsatisfactory answer on the posttest and no student gave a satisfactory
answer on the posttest. As stated previously, a correct response found only on one
posttest was “average velocity from 0 to 9 seconds = d’(9)/2 = 32(9)/2”. These students
used the derivative of the distance formula d(t) = 16t^2 to find the velocity v(t) = 32t.
Since the velocity increased at a constant rate, dividing 32(9) by 2 would give the average
velocity from 0 seconds to 9 seconds. However, many students, who used this last
procedure wrote “v(t) = 32t = 32(9) = 288” and did not divide this answer by 2, in order
to find the average velocity between 0 and 9 seconds. They did not realize that 288 is the
velocity of the ball at 9 seconds and not the average velocity of the ball between 0 and 9
seconds. This misunderstanding accounted for the high increase in the percentage of
incorrect responses on the posttest as compared to the pretest.
Table C5a

49
Rows are levels ofColumns are levels ofNo Selector
C5aPC5a
N
cd /c t
cni
grav
v=d / t
total
N
814.0
00
47.02
00
47.02
1628.1
cd /c t
11.75
11.75
00
00
00
23.51
cni
712.3
610.5
712.3
47.02
47.02
2849.1
grav
00
11.75
00
00
11.75
23.51
v=d / t
00
00
00
00
915.8
915.8
total
1628.1
814.0
1119.3
47.02
1831.6
57100
table contents:CountPercent of Table Total
N No answer. cd/ct Wrote “average velocity = (change in distance)/(change in time)”. cni Could not interpret. grav Wrote a formula involving the acceleration due to gravity, 9.8 m/sec/sec. v = d/t Wrote “v = d/t = 16(9)^2/9”. This is not as sophisticated as v = (change in distance)/(change in time).
Categories of Inferred Thought Processes
Responses for Problem 5a fell into five categories based on students’ inferred
thought processes (See Table C5a). Of the 57 students who took both tests, Table C5a
shows that 16 students (28.1%) on both tests gave no response. Eleven students (19.3%)
on the pretest and 28 students (49.1%), about half, on the posttest gave an answer which
the investigator could not interpret, for example, “d(t) = 16(9)^2 = 1296” or “v(t) = 32t =
32(9) = 288”. As verified in the interviews, some students didn’t realize that v(9) = 32(9)
= 288 is the speed at which the ball hit the ground at 9 seconds. These students did not
appear to have a strong conceptual understanding of the fact that the derivative of the
50
distance function at time t gives the velocity of the ball at that time t, not the average
velocity. Table C5a also shows that 18 students (31.6%) on the pretest and nine students
(15.8%) on the posttest found the average velocity of the ball’s travel by using the
equation v = d/t, substituting 9 for t in the denominator and 1296 for d in the numerator
since d(9) = 16(9)^2 = 1296.
Eight students (14%) on the pretest and two students (3.51%) on the posttest used
a more sophisticated formula for finding the “average” velocity of the ball. These
students used the formula “average velocity = (change in distance)/(change in time)”. It is
particularly interesting that so few of the students used this formula since it is emphasized
in first semester calculus in developing the concept of the derivative.
Four students (7.02%) on the pretest and two students (3.51%) on the posttest
either wrote “gravity = 9.8 m/sec/sec” or “velocity = (acceleration)(time) = (9.8
m/sec/sec)(9 sec) = 88.2 m/sec”, both of which involved the acceleration of the ball due
to gravity. Although the ball accelerated due the gravitational pull on the ball, these
equations did not give the average velocity of the ball during its travel.
Summary of Interviews
The investigator assumed that when students wrote “v = d/t = d(9)/9” in order to
calculate the average velocity of the ball, they were not aware of the formula “average
velocity = (change in distance)/(change in time) = [d(9) - d(0)]/[9 - 0]”. Three of the six
students interviewed seemed to support this assumption. These three students stated that
they substituted 9 for t in d(t) = 16t^2, which gave them distance, then divided by 9 sec,
the time, which would gave them the velocity. The student with the highest overall score
on both tests gave the satisfactory response, “d(9)/9”, on both tests. However, when
asked to explain why this equation would give the average speed of the ball, he
responded, “The speed at the beginning plus the speed at the end divided by the total time

51
would give the average speed.” He seems to have confused two methods for finding the
average speed of the ball in this particular problem, which did not become clear until he
was interviewed regarding his acceptable answers on the tests. One method would have
been to add the speeds of the ball when it was released and when it hit the ground and
divide by 2, and the other would have been to take the difference of the distances from
where the ball was released and when it hit the ground and divide this difference by the
difference of the times, in this case, the total time.
Another of these students was asked if this velocity would be the average velocity
of the ball from the top of the building to the ground or the velocity of the ball when it hit
the ground. She replied, “The rate that it hit the ground” and added that in order to
calculate the ball’s average velocity “take the value at the top of the building, 0, and add
this to some other value (of which she wasn’t sure) and then divide by 2”. Since she
could not determine this second value of the velocity, she would “take the average
seconds between 0 and 9 seconds, 4.5 seconds, and try to find the ball’s speed at this
time” but she did not discuss how she would calculate the ball’s speed at 4.5 seconds.
Another student, during her interview, used the more sophisticated formula
“average speed = (change in distance)/(change in time)” in order to calculate the answer
to this problem and stated that she had just learned this formula in her physics class.
Problem 5b
Joe dropped a ball from the top of a building. It took 9 seconds for the ball to hit the
ground. The distance the ball fell in t seconds after it was released is given by the
function d(t), where d(t) = 16t^2, 0 <= t <= 9.
(b) Write an expression that represents how far the ball fell during the period between t
seconds and t+2 seconds after it was released.

52
Intent of Problem 5b
The intent of Problem 5b was to test students’ ability to write an expression which
represented the distance the ball fell in a certain interval of time given that the equation
d(t) = 16t^2 described “the distance the ball fell in t seconds after it was released.”
Understanding what the equation represented was needed in order to determine that the
solution to this problem was a difference between two distances. More importantly, this
leads to understanding that rate is a change or difference in some quantity (distance) as
compared to a change or difference in another (time).
Criteria for Assigning Scores
A “1” was assigned to the answer “d(t+2) - d(t)” or “16(t+2)^2 - 16t^2”, which
represents the difference of the distances at t+2 and t seconds, that is, how far the ball fell
during the period between t and t+2 seconds. All other answers received a “0”.
Table 5b Rows are levels ofColumns are levels ofNo Selector
5bP5b
0
1
N
total
0
1213.3
44.44
77.78
2325.6
1
33.33
44.44
22.22
910
A
1314.4
00
2022.2
3336.7
N
33.33
22.22
2022.2
2527.8
total
3134.4
1011.1
4954.4
90100
table contents:CountPercent of Table Total
Frequencies of students who incorrectly represented the distance the ball fell between t and t+2 seconds (0), who correctly represented the distance the ball fell between t and t+2 seconds (1), who were absent from the posttest (A), or who gave no response (N). Rows are levels of problem
53
performance on the pretest; columns are levels of performance on the posttest; cell entries show numbers of students and percents of all students who received respective scores on pretest and on posttest.
Performance on Pretest
Table 5b shows that 31 students (34.4%) gave an expression which incorrectly
represented the distance the ball fell between t and t+2 seconds. Of these 31 students, five
students wrote “[16(t+2)^2-16t^2]/[(t+2)-t]”, a (change in distance)/(change in time),
which represents the average velocity of the ball between t and t+2 seconds, not the
change in distance between these times. Two students wrote “d(t)= (t+2) - t” which is the
difference of the times, t and t+2. Also, of these 31 students, two other students wrote
“16(t+2)^2” and “16t^2” but did not take their difference. Only 10 students (11.1%) gave
a correct representation of the distance the ball fell between t and t+2 seconds and 49
students (54.4%) gave no response.
Performance on Posttest
Of the 57 students who took the posttest, 23 students (40.4%) gave an expression
which did not represent the distance the ball fell between t and t+2 seconds, four students
wrote “[16(t+2)^2-16t^2]/[(t+2)-t]”, a (change in distance)/(change in time), the average
velocity of the ball between t and t+2 seconds. Perhaps these four students were still
thinking about Problem 5a, which asked for the average velocity of the ball from the time
it was released until it hit the ground. One other student took the sum of 16(t+2)^2 and
16t^2, and two other students on the posttest wrote “16(t+2)^2” and “16t^2” but did not
take their difference. Nine students (15.8%) gave a correct representation of the distance
the ball fell between t and t+2 seconds and 25 students (43.9%) gave no response.

54
Comparison of Pretest and Posttest Performance
Of the 57 students that took both tests, cells (0,0), (1,1) and (N,N) of Table 5b
indicate that 36 students (63.2%) were consistent from pretest to posttest. Cells (0,1) and
(0,N) indicate that, of those who gave an unsatisfactory expression for the distance the
ball traveled between t and t+2 seconds on the pretest, three students gave a satisfactory
answer and three students gave no answer on the posttest. Cells (1,0) and (1,N) indicate
that, of the students who correctly answered this problem on the pretest, four students
gave an unsatisfactory answer on the posttest and two students gave no answer on the
posttest. Cells (N,0) and (N,1) indicate that, of the students who gave no answer on the
pretest, seven students gave an unsatisfactory answer on the posttest and two students
gave a correct answer on the posttest. It was interesting to note that on the posttest only,
two students had written the expression “[(32(t)+32(t+2))/2]t” to represent the distance
the ball fell between t and t+2 seconds, however, the last t should have been a 2. The
investigator presumed they used the equation “distance = velocity x time” and substituted
t, not 2, for the time and “[32(t) + 32(t+2)]/2” for the velocity from t to t+2 seconds
obtained from the derivative of d(t) = 16t^2.
Table C5b
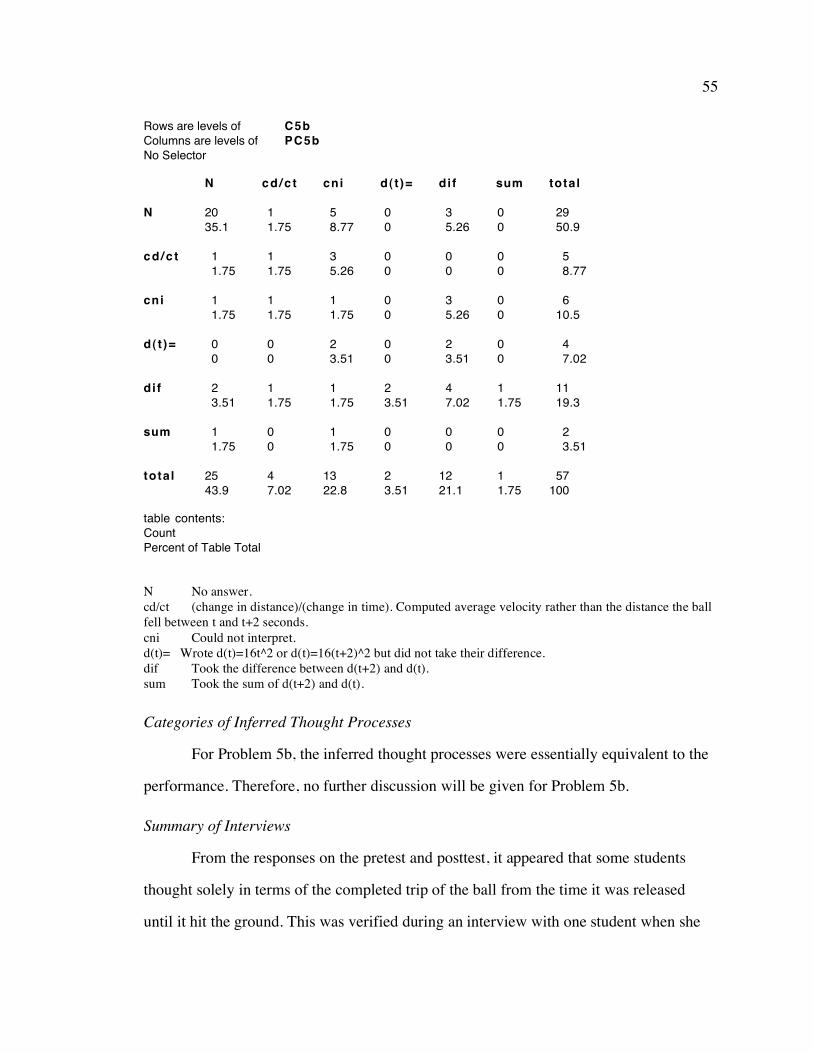
55
Rows are levels ofColumns are levels ofNo Selector
C5bPC5b
N
cd /c t
cni
d( t )=
di f
sum
total
N
2035.1
11.75
11.75
00
23.51
11.75
2543.9
cd /c t
11.75
11.75
11.75
00
11.75
00
47.02
cni
58.77
35.26
11.75
23.51
11.75
11.75
1322.8
d(t )=
00
00
00
00
23.51
00
23.51
dif
35.26
00
35.26
23.51
47.02
00
1221.1
sum
00
00
00
00
11.75
00
11.75
total
2950.9
58.77
610.5
47.02
1119.3
23.51
57100
table contents:CountPercent of Table Total
N No answer. cd/ct (change in distance)/(change in time). Computed average velocity rather than the distance the ball fell between t and t+2 seconds. cni Could not interpret. d(t)= Wrote d(t)=16t^2 or d(t)=16(t+2)^2 but did not take their difference. dif Took the difference between d(t+2) and d(t). sum Took the sum of d(t+2) and d(t).
Categories of Inferred Thought Processes
For Problem 5b, the inferred thought processes were essentially equivalent to the
performance. Therefore, no further discussion will be given for Problem 5b.
Summary of Interviews
From the responses on the pretest and posttest, it appeared that some students
thought solely in terms of the completed trip of the ball from the time it was released
until it hit the ground. This was verified during an interview with one student when she

56
asked, “Doesn’t the t represent 1296 feet?” From this question, perhaps it can be
concluded that this student believed that the t in the equation d(t) = 16t^2 was not a
variable which had given the distance the ball fell at time t but could only equal 9
seconds, yielding a distance of 1296 feet.
Another student, during her interview, was asked what d(t) = 16t^2 meant. She
gave a satisfactory answer which was the distance the ball fell in t seconds. However,
when asked to substitute 2 seconds for t, she stated that the answer was 64 ft/sec, adding
that the “64 was the rate it went for the distance”. When it was pointed out to her that her
answer was incorrect, she stated that “the 64 was the seconds”. It was explained to her
that 64 was the distance the ball had fallen in 2 seconds, and, if 1 second was substituted
for t, the distance the ball would have fallen would be 16 feet. From this information, she
was able find the distance the ball had fallen between 1 and 2 seconds by taking the
difference between 64 and 16 feet. However, she was never able to find the distance the
ball had fallen between t and t+2 seconds in order to answer this problem.
Another student, during his interview, computed the difference in time between t
and t+2 seconds, which was 2 seconds, and, concluded that the distance the ball fell
between t and t+2 seconds was “d(2) = 16(2)^2 = 64 feet”, not realizing that the distance
the ball falls is not 64 feet for every 2 second interval of time.
Problem 5c
Joe dropped a ball from the top of a building. It took 9 seconds for the ball to hit the
ground. The distance the ball fell in t seconds after it was released is given by the
function d(t), where d(t) = 16t^2, 0 <= t <= 9.
(c) What was the ball’s average speed during the period between 1/2 second and 2 3/4
seconds after it was released?
57
Intent of Problem 5c
The intent of Problem 5c was similar to Problem 5a except this problem explores
whether students would see that “velocity = distance/time” could not be used since the
object is not at rest at 1/2 second. (The velocity at t = 1/2 second is not zero.) In order to
solve this problem they would need to think in terms of the more sophisticated formula
“average velocity = (change in distance)/(change in time)”, a generalized form for rate of
change.
Criteria for Assigning Scores
I assigned a “1” to an answer similar to “average velocity between 1/2 and 2 3/4
second = (change in distance between 1/2 and 2 3/4 second)/(change in time between 1/2
and 2 3/4 second) = [d(2 3/4) - d(1/2)]/(2 3/4 - 1/2)”. Since the acceleration was constant,
a “1” was also assigned to an answer involving the arithmetic average of the velocities at
1/2 and 2 3/4 seconds, that is, “average velocity between 1/2 and 2 3/4 second = [v(1/2) +
v(2 3/4)]/2” where v(1/2) and v(2 3/4) were the values of the derivative of d(t) = 16t^2 at
t = 1/2 and t = 2 3/4 seconds. A “0” was assigned to all other answers.
Table 5c

58
Rows are levels ofColumns are levels ofNo Selector
5 cP5c
0
1
N
total
0
1011.1
44.44
910
2325.6
1
22.22
55.56
22.22
910
A
55.56
55.56
2325.6
3336.7
N
44.44
00
2123.3
2527.8
total
2123.3
1415.6
5561.1
90100
table contents:CountPercent of Table Total
Frequencies of students who did not correctly calculate the average velocity between 1/2 and 2 3/4 seconds (0), who correctly calculated the average velocity between 1/2 and 2 3/4 seconds (1), who were absent from the posttest (A). or who gave no response (N). Rows are levels of problem performance on the pretest; columns are levels of performance on the posttest; cell entries show numbers of students and percents of all students who received respective scores on pretest and on posttest.
Performance on Pretest
Table 5c shows that 21 students (23.3%) gave an unacceptable answer, such as,
“32(2 3/4-1/2)”, which the investigator assumed was derived from “v(t) = d’(t) = 32t”.
Another example of an unacceptable answer which some students gave was “16(2 3/4)^2
- 16(1/2)^2”, the difference of distances from 1/2 to 2 3/4 seconds. Fourteen students
(15.6%) gave an acceptable answer as described above and 55 students (61.1%) gave no
answer to this problem on the pretest.
Performance on Posttest
Of the 57 students who were present for the posttest, 23 students (40.4%) gave an
unacceptable answer, nine students (15.8%) gave an acceptable answer as described
above and 25 students (43.9%) gave no answer.
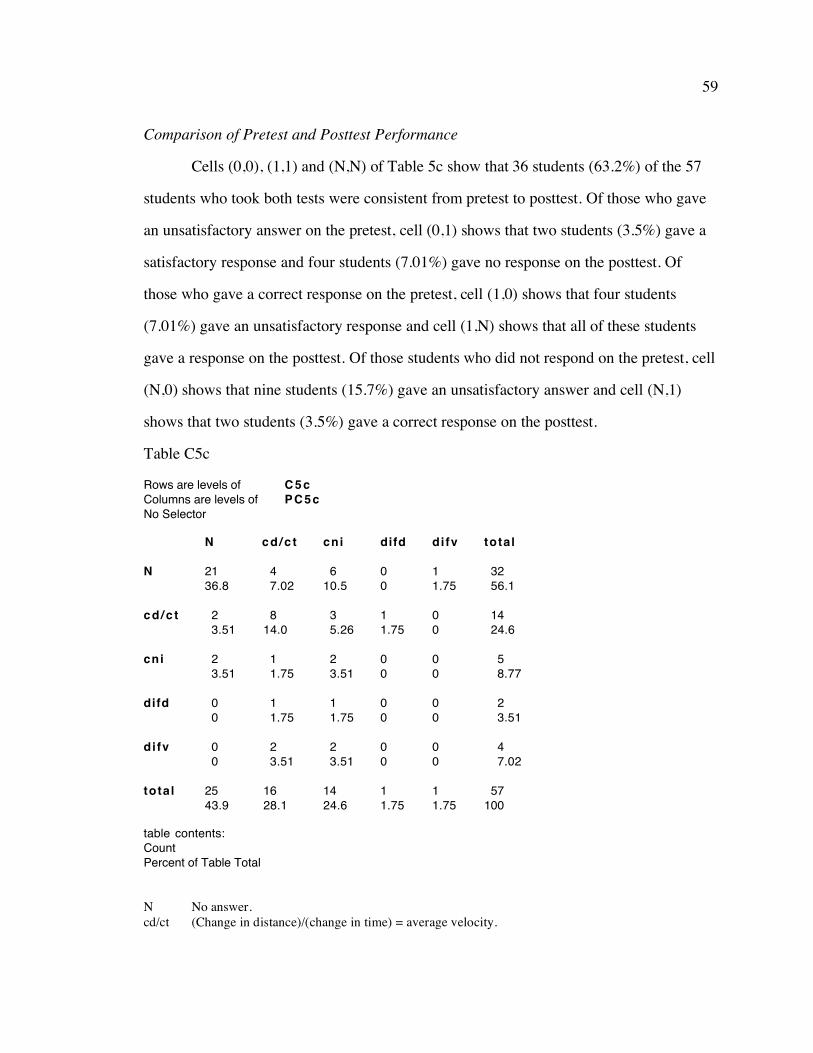
59
Comparison of Pretest and Posttest Performance
Cells (0,0), (1,1) and (N,N) of Table 5c show that 36 students (63.2%) of the 57
students who took both tests were consistent from pretest to posttest. Of those who gave
an unsatisfactory answer on the pretest, cell (0,1) shows that two students (3.5%) gave a
satisfactory response and four students (7.01%) gave no response on the posttest. Of
those who gave a correct response on the pretest, cell (1,0) shows that four students
(7.01%) gave an unsatisfactory response and cell (1,N) shows that all of these students
gave a response on the posttest. Of those students who did not respond on the pretest, cell
(N,0) shows that nine students (15.7%) gave an unsatisfactory answer and cell (N,1)
shows that two students (3.5%) gave a correct response on the posttest.
Table C5c
Rows are levels ofColumns are levels ofNo Selector
C5cPC5c
N
cd /c t
cni
difd
difv
total
N
2136.8
23.51
23.51
00
00
2543.9
cd /c t
47.02
814.0
11.75
11.75
23.51
1628.1
cni
610.5
35.26
23.51
11.75
23.51
1424.6
difd
00
11.75
00
00
00
11.75
difv
11.75
00
00
00
00
11.75
total
3256.1
1424.6
58.77
23.51
47.02
57100
table contents:CountPercent of Table Total
N No answer. cd/ct (Change in distance)/(change in time) = average velocity.
60
cni Could not interpret. difd Difference of distances . They took the difference of distances from 1/2 to 2 3/4 seconds as the
average velocity of the ball between 1/2 and 2 3/4 seconds. difv Difference of velocities. They took the difference of velocities between 1/2 and 2 3/4 seconds as
the average velocity of the ball between 1/2 and 2 3/4 seconds.
Categories of Inferred Thought Processes
Students’ performance on Problem 5c was essentially equivalent to their thought
processes. However, of the 16 students who used an acceptable approach in arriving at an
answer to Problem 5c on the posttest, five students wrote “average velocity = [32(2 3/4)
+ 32(1/2)]/2”, the arithmetic average of the velocities at 1/2 and 2 3/4 seconds, using the
derivative of d(t) = 16t^2. This computation of the average velocity using the derivative
of d(t) and the arithmetic average of the velocities at 1/2 and 2 3/4 seconds was only seen
on the posttest and was a new way of thinking about this problem for several students.
However, this new approach to solving Problem 5c lead to a great increase in the
percentage of incorrect responses from pretest to posttest. Many students on the posttest
incorrectly used the derivative of d(t) to calculate the average velocity of the ball between
1/2 and 2 3/4 seconds. For example, several students had written “average velocity = d’(t)
= 32t = 32(2 3/4 - 1/2)” which is the change in velocity between 1/2 and 2 3/4 seconds,
not the average velocity of the ball between these two given times.
Summary of Interviews
Prior to a student’s interview regarding Problem 5c, it should be remembered that
the student had discussed the concept of the average speed of the ball from start to finish
in Problem 5a, and the distance the ball fell between t and t+2 seconds in Problem 5b and
perhaps incorporated these concepts into their answer in Problem 5c.
One student, in answering Problem 5c, the average velocity of the ball between
1/2 and 2 3/4 seconds, calculated the change in distance between 1/2 and 2 3/4 seconds,
61
recalling what he had calculated in Problem 5b. He did not proceed any further without
explicit directions.
Another student, during his interview, tried to remember a formula that could be
used to calculate the average velocity of the ball between 1/2 and 2 3/4 seconds. He
ended his discussion of Problem 5c by stating that the only formula he knew which
involved any kind of velocity was “velocity = distance/time” and this did not appear to
help him solve this problem involving average velocity. He did not realize that this
formula could lead to the correct answer for the average velocity of the ball from 1/2 to 2
3/4 seconds if he interpreted “distance/time” as “(change in distance from 1/2 to 2 3/4
second)/(change in time between 1/2 and 2 3/4 second)”.
Another student was able to find the average velocity of the ball between 1/2 and
2 3/4 seconds by stating that the velocity, v(t), was the derivative of d(t). He used the
arithmetic average of the velocities at these times stating that “average velocity =
[32(1/2) + 32(2 3/4)]/2”. However, when asked if he could think of any other way to
solve this problem he was unable to do so (although he was asked to examine Problem 5b
again which referred to a change in distance between two different times). The
investigator was trying to determine if this student also knew that the average velocity =
(change in distance)/(change in time).
One student was able to find the average speed of the ball between 1/2 and 2 3/4
seconds by using the formula “average velocity = (change in distance)/(change in time)”
which she had learned in a physics class which she was attending. When asked to explain
this formula, she referred to the slope of a line between the two points (1/2, d(1/2)) and (2
3/4, d(2 3/4)) if distance were graphed as a function of time and “instantaneous velocity
was the tangent” (not mentioning the slope of the tangent at a particular point). She
added, as did other students during their interview, that in first semester calculus they

62
never covered real world problems such as these. However, it is the investigator’s belief
that this student did cover real world problems in first semester calculus but lacked the
understanding that the slope of a line between two points on a graph represents the
average rate of change between those points. Also, she may not understand that the slope
of the tangent at a point is the instantaneous rate of change at that point. In this student’s
own words, “this method of finding the instantaneous velocity through graphing doesn’t
really help you see it.”
Another student did say that they “discussed velocity, acceleration, average
velocity, and instantaneous velocity in first semester calculus”. When asked what
instantaneous meant to him, he replied “when you put a limit in front of it or get closer
and closer to our answer but it is an approximation to our answer.” When asked again
about the instantaneous velocity of the ball at, for example, 2 seconds, he talked about the
average velocity from 0 to 2 seconds and ended by saying he was confused.
Problem 5d
Joe dropped a ball from the top of a building. It took 9 seconds for the ball to hit the
ground. The distance the ball fell in t seconds after it was released is given by the
function d(t), where d(t) = 16t^2, 0 <= t <= 9.
(d) Write an expression (a formula) for the ball’s average speed during the period
between u and u+h seconds after it was released, where h>0 and u+h <=9.
Intent of Problem 5d
The intent of this problem was to determine whether the students could now write
the general formula for the ball’s average velocity during any time interval of the ball’s
travel after completing problems 5a and 5c which dealt with specific time intervals.
63
Again, students would need to have a clear understanding that average velocity is a
change in displacement as compared to a change in time.
Criteria for Assigning Scores
A “1” was assigned to an answer similar to “average velocity = [d(u+h) - d(u)]/h”
or “average velocity = [v(u) + v(u+h)]/2”. A “0” was assigned to all other responses.
Table 5d Rows are levels ofColumns are levels ofNo Selector
5dP5d
0
1
N
total
0
66.67
11.11
88.89
1516.7
1
22.22
55.56
22.22
910
A
44.44
33.33
2628.9
3336.7
N
33.33
11.11
2932.2
3336.7
total
1516.7
1011.1
6572.2
90100
table contents:CountPercent of Table Total
Frequencies of students who gave an unsatisfactory formula for the ball s average velocity between u and u+h seconds (0), who gave a satisfactory formula for the ball s average velocity between u and u+h seconds (1), who were absent from the posttest (A), or who did not respond (N). Rows are levels of problem performance on the pretest; columns are levels of performance on the posttest; cell entries show numbers of students and percents of all students who received respective scores on pretest and on posttest.
Performance on Pretest
Table 5d shows that 15 students (16.7%) gave an unsatisfactory formula for the
ball’s average velocity during the interval u and u+h seconds. Ten students (11.1%) gave
a satisfactory formula, and almost three-fourths (72.2%) of the students on the pretest
gave no response for the ball’s average velocity between u and u+h seconds.
64
Performance on Posttest
Of the 57 students who took both tests, 15 students (26.3%) gave an
unsatisfactory answer, nine students (15.8%) gave a satisfactory answer, and almost
three-fifths (57.9%) of the students on the posttest, gave no response to Problem 5d
which asked for a general formula for the average velocity of a ball between u and u+h
seconds.
Comparison of Pretest and Posttest Performance
We can see how consistent were students pretest and posttest performance by
examining cells (0,0), (1,1) and (N,N) of Table 5d. Of the 57 students who took both
tests, 40 students (70.1%) were consistent. Of those students who gave an unsatisfactory
response on the pretest, cell (0,1) indicates that two students (3.51%) gave a correct
response on the posttest and cell (0,N) indicates that three students (5.26%) did not
respond on the posttest. Of those students who gave a satisfactory answer on the pretest,
cell (1,0) indicates that one student (1.75%) gave an unsatisfactory answer on the posttest
and cell (1,N) shows that one student (1.75%) gave no response on the posttest. Of those
who gave no response on the pretest, cell (N,0) indicates that eight students (14%) gave
an incorrect response, and cell (N,1) indicates that two students (3.51%) gave a correct
response on the posttest.
Table C5d
65
Rows are levels ofColumns are levels ofNo Selector
C5dPC5d
N
cd /c t
cni
sum
total
N
2950.9
11.75
23.51
11.75
3357.9
cd /c t
23.51
610.5
00
11.75
915.8
cni
610.5
00
35.26
00
915.8
slter
11.75
35.26
11.75
00
58.77
sum
11.75
00
00
00
11.75
total
3968.4
1017.5
610.5
23.51
57100
table contents:CountPercent of Table Total
N No answer. cd/ct (Change in distance)/(change in time) = average velocity cni Could not interpret. slter Slight error from an acceptable answer. These were found on the posttest only. sum Summed two quantities, other than v(u) and v(u+h), and divided by 2.
Categories of Inferred Thought Processes
Responses for Problem 5d fell into five main categories based on students’
inferred thought processes (See Table C5d). Table C5d shows that 39 students (68.4%)
on the pretest, and 33 students (57.9%) on the posttest did not give a response.
Six students (10.5%) on the pretest and nine students (15.8%) on the posttest gave
an answer which the investigator could not interpret. For example, five of the nine
students on the posttest began their formula for the average velocity of the ball between u
and u+h with “lim as h approaches 0”, which perhaps indicated confusion between
average velocity and instantaneous velocity of the ball.
Ten students (17.5%) on the pretest and nine students (15.8%) on the posttest
thought about average velocity correctly, as the change in distance the ball traveled as
compared to the change in time from u and u+h seconds. Two students (3.52%) on the
pretest and one student (1.75%) on the posttest in writing an expression which

66
represented the average velocity of the ball between u and u+h seconds summed two
quantities, other than v(u) and v(u+h), and divided by 2. For example, these students
wrote “[(u+h) + u]/2” or “[16u^2 + 16(u+h)^2]/2” perhaps not realizing that these
arithmetic averages represent the average time and average distance the ball traveled
between u and u+h seconds.
Only in the posttest were slight errors from an acceptable answer made but these
may indicate that the student had some major misconceptions involving the average
velocity. For example, one student wrote “[f(u+h) + f(u)]/h” which indicates a change in
the time in the denominator but a sum of the distances in the numerator between u and
u+h seconds. Another student, using the derivative v(t) = d’(t) = 32t, wrote “[32(u+h) -
32u]/2” which indicates this student confounded several different perspectives: the
formula for average rate of change, the derivative of 16t^2, and the arithmetic mean of
two numbers. The following three examples, “[(u+h) -u]/h”, “[d(u) -d(u+h)]/u”, and
“[16(u+h)^2 -16u^2]/u”, indicate a change in some quantity over the change in another
but either one or both of these changes were incorrect for determining the average
velocity between u and u+h seconds. The investigator presumed that the students who
had written one of the last five expressions for average velocity unsuccessfully
memorized the formula for average velocity but had no conceptual understanding of what
the formula for average velocity or what the formula they had written represented.
Summary of Interviews
Two of the six students interviewed, from what had been discussed in Problems
5a to 5c, appeared to understand that the average velocity of the ball during the time
interval u to u+h was the change in distance during that interval as compared to the
change in time during that interval. From their understanding of Problem 5b, these two
students were able to write the expression for the change in distance during the time
67
interval u to u+h. However, these students had difficulty writing the expression for the
change in time during the interval u to u+h seconds which was needed for the
denominator of their answer. One of these two students wrote 9 seconds in the
denominator of their expression for the average velocity of the ball during the time
interval u to u+h seconds.
Another student, using the derivative of the distance d’(t) = v(t) = 32t, took the
arithmetic average of the velocities at times u and u+h stating that this was the average
velocity of the ball between u and u+h seconds. Another student, during the
interview, studied the answers she had given to this problem on the pretest and posttest,
since they were incompatible, and was able to determine and explain why her answer on
the pretest was correct. The remaining two students, who were repeating first semester
calculus, had given a satisfactory answer to this problem on both tests and during their
interviews.
Problem 5e
Joe dropped a ball from the top of a building. It took 9 seconds for the ball to hit the
ground. The distance the ball fell in t seconds after it was released is given by the
function d(t), where d(t) = 16t^2, 0 <= t <= 9.
(e) Suppose that t and w represent numbers of seconds and d is the function defined
above. What does the expression [d(t+w) - d(t)]/w represent about the falling ball?
Intent of Problem 5e
The intent of problem 5e was to determine if students could interpret that a
change in distance during the time interval from t to t+w seconds as compared to the
change in time over the same interval represented the average velocity of the ball.

68
Students who have the limited view that (constant) velocity is simply distance/time might
not be aware that (average) velocity actually involves a change in distance as compared
to a change in time for a specific time interval. In other words, the distinction between
constant velocity and average velocity would not have been made.
Criteria for Assigning Scores
A “1” was assigned to an answer which was similar to “This expression
represents the average speed (or velocity) of the ball.” A “1” was assigned this answer
whether or not the time interval, t to t+w seconds, was specified. A “0” was assigned to
all other responses including “speed” or “velocity” since these may have referred to
instantaneous speed or instantaneous velocity which some students gave as their
response.
Table 5e Rows are levels ofColumns are levels ofNo Selector
5 eP5e
0
1
N
total
0
44.44
66.67
55.56
1516.7
1
22.22
44.44
22.22
88.89
A
55.56
33.33
2527.8
3336.7
N
66.67
00
2831.1
3437.8
total
1718.9
1314.4
6066.7
90100
table contents:CountPercent of Table Total
Frequencies of students who gave a response other than “average speed” or “average velocity” (0), who gave the response “average speed” or “average velocity” (1), who were absent from the posttest (A), or who gave no response (N). Rows are levels of problem performance on the pretest; columns are levels of performance on the posttest; cell entries show numbers of students and percents of all students who received respective scores on pretest and on posttest.
69
Performance on Pretest
As Table 5e shows, 17 students (18.9%) gave a response other than “average
speed” or “average velocity” and 13 students (14.4%) gave an acceptable answer.
However, of the 13 students who gave the acceptable answer “average speed” or
“average velocity”, only two students included the fact that this was during the time
interval between t and t+w seconds. Two-thirds (66.7%) of the students gave no answer
to this problem.
Performance on Posttest
Of the 57 students who took both tests, 15 students (26.3%) gave an unacceptable
answer and eight students (14%) gave an acceptable answer as described above. Five of
the eight students, who had given an acceptable answer, included the fact that this was
during the time interval between t and t+w seconds. Thirty-four (59.6%) of the students
gave no answer to this problem on the posttest.
Comparison of Pretest and Posttest Performance
From cells (0,0), (1,1) and (N,N) of Table 5e we can see that, of the 57 people
who took both tests, 36 students (63.2%) were consistent from pretest to posttest. Of
those who gave an unacceptable answer on the pretest, cell (0,1) shows that two students
gave a satisfactory answer on the posttest and cell (0,N) shows that six students gave no
response on the posttest. Of those who had given an acceptable response on the pretest,
cell (1,0) shows that six students gave an unacceptable response on the posttest and cell
(1,N) shows that all of these students gave a response on the posttest. Of those who gave
no response on the pretest, cell (N,0) shows that five students gave an incorrect response
on the posttest and cell (N,1) shows that two students gave a correct response on the
posttest.
Table C5e

70
Rows are levels ofColumns are levels ofNo Selector
C5ePC5e
N
a c
averv
cni
instv
js tv
total
N
2849.1
00
00
35.26
23.51
11.75
3459.6
a c
11.75
00
11.75
11.75
00
00
35.26
averv
23.51
11.75
35.26
11.75
00
00
712.3
cni
35.26
00
11.75
00
00
35.26
712.3
instv
11.75
00
00
00
00
11.75
23.51
j s tv
00
11.75
23.51
00
00
11.75
47.02
total
3561.4
23.51
712.3
58.77
23.51
610.5
57100
table contents:CountPercent of Table Total
N No answer. ac “Acceleration”. averv “Average veleocity” or “average speed”. cni Could not interpret. instv “Instantaneous velocity”. jstv Answered just “velocity” or “speed”.
Categories of Inferred Thought Processes
Responses to problem 5e fell into six main categories of inferred thought
processes (See Table C5e). Table C5e shows that of the 57 students who took both tests,
35 students (61.4%) on the pretest and 34 students (59.6%) on the posttest gave no
answer. Five students (8.77%) on the pretest and seven students (12.3%) on the posttest
gave an answer which the investigator could not interpret. For example, one student
wrote that the expression [d(t+w) - d(t)]/w represented “the slope”. Perhaps this student

71
was thinking about the graph of the function d(t) = 16t^2 and, hence, the expression
“[d(t+w) - d(t)]/w” would be the slope of the line through the points (d(t), t) and (d(t+w),
t+w). He did not state, however, what this slope represented about the falling ball, as the
question had asked.
Seven students (12.3%) on both tests gave the acceptable answer “average speed”
or “average velocity”, but, one student on the pretest and two students on the posttest
stated that the given expression was “the average velocity between t and w seconds”, not
between t and t+w seconds. Either this was a slight error or these students didn’t realize
that this expression referred to the time interval between t and t+w seconds.
Six students (10.5%) on the pretest and four students (7.02%) on the posttest just
wrote the word “speed” or “velocity”. These students were not given credit for this
answer since the investigator assumed that this was an instinctive response to the given
expression when these students realized that this expression represented a distance/time.
Other students who did not receive credit for this problem realized that the
numerator involved distances but had difficulty understanding the denominator and how
the denominator related to the numerator. For example, one student wrote “distanced
traveled with respect to w” and another wrote “this says that distance is a function of
time”.
Two students (3.51%) on each test wrote that this formula represented the
“instantaneous velocity”, or “the derivative d’(t)”. The formula given in Problem 5e does
appear similar to the formula for the instantaneous velocity of the ball at time t, that is,
lim as w approaches 0 of [d(t+w) -d(t)]/w, but perhaps these students did not understand
the distinction between these two expressions. Perhaps these students have lost or never
understood that the instantaneous velocity is the limit of the average velocity as the time
interval approaches 0.

72
Two students (3.51%) on the pretest and three students on the posttest (5.26%)
wrote that the expression in Problem 5e represented the acceleration of the falling ball.
Perhaps these students thought about the ball accelerating downward due to gravity or
perhaps the given formula was the rate of change of the average speed.
Answers to Problem 5e reveal that most first semester calculus students cannot
identify the most common of rate of change, average speed, when presented with it. It is
also interesting to note that these students had written comments regarding their
confusion in answering the questions in Problem 5 more than they had any other
problem. The following are some examples of the students comments: “I don’t
understand this concept very well”, or “The concept of velocity is not well defined in my
mind”, or “The entire problem puzzles me” or “I’ve seen this type of problem in physics
but I don’t remember the right equations to use to solve these problems” or “This looks
like a homework problem I just had and did not understand” or “Does the ball fall at the
same speed constantly (till it hits the ground)?”
Summary of Interviews
All six students interviewed recognized that Problem, 5e was similar to Problem
5d which they had just discussed. Hence, five of the students stated that the given
formula in Problem 5e represented the “average speed” while one student stated that the
formula represented “speed since it was a distance over a time”. This student did not
appear to distinguish between constant velocity and average velocity. One of the students
added, “or some kind of speed”, also having difficulty distinguishing between constant
velocity and average velocity, and another student thought the denominator should be w-t
not w.
One student was then asked to refer to his answer on the posttest to the previous
question, Problem 5d. He had used the derivative of d(t) to find the average speed of the

73
ball between u and u+h seconds by taking the arithmetic average of the speeds at these
times. When asked how he would find the average speed of the ball during the same time
interval if the function for the distance were changed to d(t) = 16t^3 (a cubic equation) he
replied that he would proceed in the same way. That is, he would take the derivative of
d(t) = 16t^3 which would yield v(t) and calculate the arithmetic average of the velocities
at the two times. This method is incorrect, yet the investigator believed that he never had
or no longer thinks in terms of the rate of change expression for the average velocity,
(average velocity = (change in distance)/(change in time)), after learning that the
derivative of the distance function yields the velocity function. He appears to have
developed a schema which he consistently uses to calculate the average velocity between
two given times by taking the arithmetic average of the velocities at these times although
this may be incorrect in some situations.
Problem 6a
A spherical storage tank stood empty one morning and then was filled to capacity with
water. The water’s volume increased as its height increased. A supervisor, who had a dip
stick but no clock, measured the water’s depth repeatedly as the tank filled. The graph at
the right represents the water’s volume, in cubic feet, as a function of its height above the
tank’s bottom. The tank is 8 feet high and holds 268 feet of water.

74
.
(a) What would be the unit for “average rate of change of volume with respect to height”?
Intent of Problem 6a
This is the first problem that used the words “average rate of change” and, in
addition, the rate in this problem did not involve speed or time. The intent of this problem
was to determine if the students could see that the unit for average rate of change of
volume with respect to height was found by focusing on the unit for volume and the unit
for height and combining these units to form the composite unit of cubic feet per foot.
Criteria for Assigning Scores
A “1” was assigned to any answer similar to “(cubic feet)/foot” even if the student
then changed this to “square feet”. Later, in the discussions of the students’ thought
processes, these answers are not considered equivalent. A “0” was assigned to all other
answers.
Table 6a
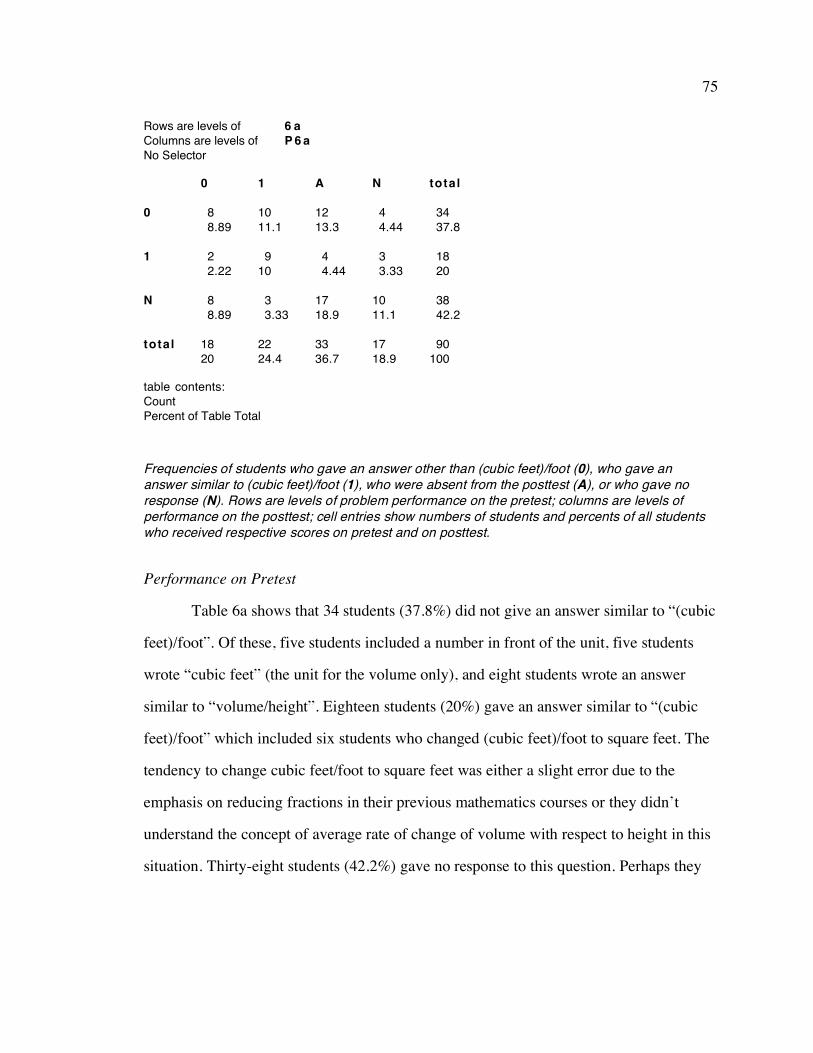
75
Rows are levels ofColumns are levels ofNo Selector
6 aP6a
0
1
N
total
0
88.89
22.22
88.89
1820
1
1011.1
910
33.33
2224.4
A
1213.3
44.44
1718.9
3336.7
N
44.44
33.33
1011.1
1718.9
total
3437.8
1820
3842.2
90100
table contents:CountPercent of Table Total
Frequencies of students who gave an answer other than (cubic feet)/foot (0), who gave an answer similar to (cubic feet)/foot (1), who were absent from the posttest (A), or who gave no response (N). Rows are levels of problem performance on the pretest; columns are levels of performance on the posttest; cell entries show numbers of students and percents of all students who received respective scores on pretest and on posttest.
Performance on Pretest
Table 6a shows that 34 students (37.8%) did not give an answer similar to “(cubic
feet)/foot”. Of these, five students included a number in front of the unit, five students
wrote “cubic feet” (the unit for the volume only), and eight students wrote an answer
similar to “volume/height”. Eighteen students (20%) gave an answer similar to “(cubic
feet)/foot” which included six students who changed (cubic feet)/foot to square feet. The
tendency to change cubic feet/foot to square feet was either a slight error due to the
emphasis on reducing fractions in their previous mathematics courses or they didn’t
understand the concept of average rate of change of volume with respect to height in this
situation. Thirty-eight students (42.2%) gave no response to this question. Perhaps they

76
did not understand what a unit was or perhaps they were not able to determine the unit in
this atypical situation.
Performance on Posttest
Of the 57 students who were present for the posttest, 18 students (31.6%) gave an
answer other than “(cubic feet)/foot”. Of these, two students included a number in front
of the unit, two students wrote “cubic feet” (the unit for the volume only), and 10
students wrote an answer similar to “volume/height”. Twenty-two students (38.6%) gave
an answer similar to “(cubic feet)/foot” which included 10 students who changed “(cubic
feet)/foot” to “square feet”. Seventeen students (29.8%) gave no response to this
question.
Comparison of Pretest and Posttest Performance
Of the 57 students who took both tests, cells (0,0), (1,1) and (N,N) of Table 6a
show that 27 students (47.4%) were consistent in their answers from pretest to posttest.
Of those who gave an unsatisfactory response on the pretest, cell (0,1) shows that 10
people (17.5%) gave a correct response on the posttest, and cell (0,N) shows that four
students (7.02%) gave no response on the posttest. Of those who gave a satisfactory
answer on the pretest, cell (1,0) shows that two students (3.51%) gave an incorrect
answer on the posttest and cell (1,N) shows that three students (5.26%) gave no response
on the posttest. Of those who gave no response on the pretest, cell (N,0) shows that eight
students (14%) gave an incorrect response on the posttest and cell (N,1) shows that three
students (5.26%) gave a correct response on the posttest.
Table C6a
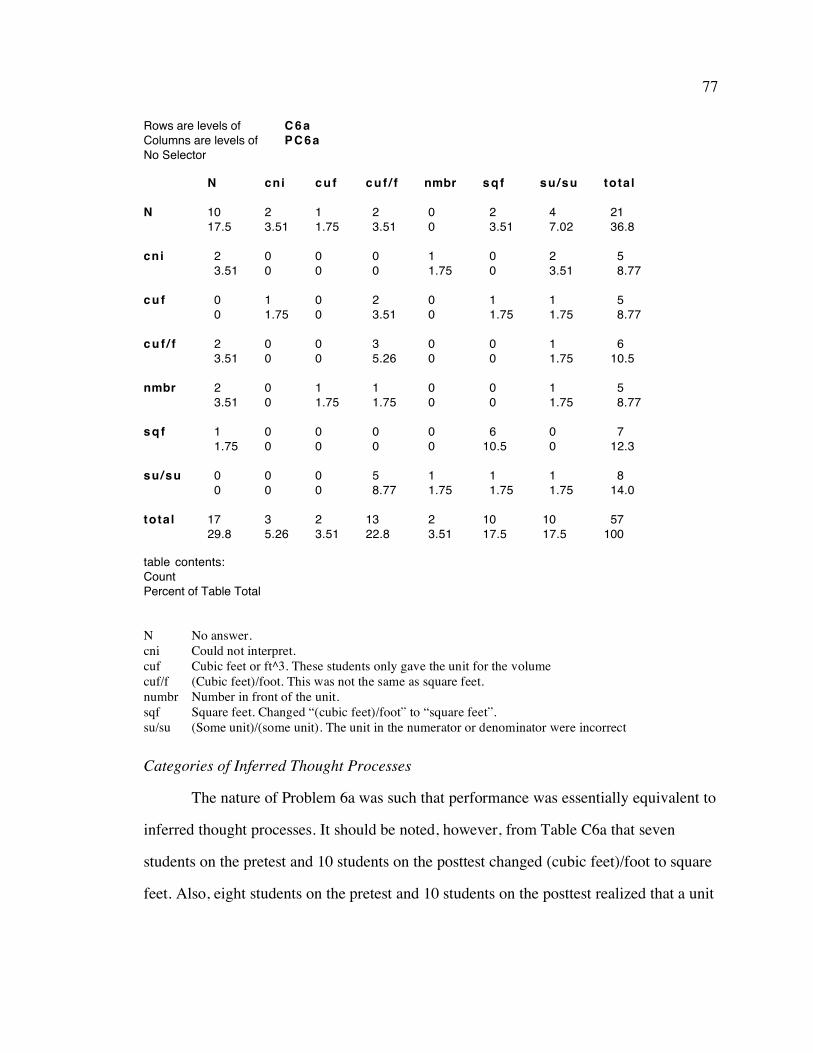
77
Rows are levels ofColumns are levels ofNo Selector
C6aPC6a
N
cni
cu f
cu f / f
nmbr
sq f
su/su
total
N
1017.5
23.51
00
23.51
23.51
11.75
00
1729.8
cni
23.51
00
11.75
00
00
00
00
35.26
cu f
11.75
00
00
00
11.75
00
00
23.51
cu f / f
23.51
00
23.51
35.26
11.75
00
58.77
1322.8
nmbr
00
11.75
00
00
00
00
11.75
23.51
sq f
23.51
00
11.75
00
00
610.5
11.75
1017.5
su/su
47.02
23.51
11.75
11.75
11.75
00
11.75
1017.5
total
2136.8
58.77
58.77
610.5
58.77
712.3
814.0
57100
table contents:CountPercent of Table Total
N No answer. cni Could not interpret. cuf Cubic feet or ft^3. These students only gave the unit for the volume cuf/f (Cubic feet)/foot. This was not the same as square feet. numbr Number in front of the unit. sqf Square feet. Changed “(cubic feet)/foot” to “square feet”. su/su (Some unit)/(some unit). The unit in the numerator or denominator were incorrect
Categories of Inferred Thought Processes
The nature of Problem 6a was such that performance was essentially equivalent to
inferred thought processes. It should be noted, however, from Table C6a that seven
students on the pretest and 10 students on the posttest changed (cubic feet)/foot to square
feet. Also, eight students on the pretest and 10 students on the posttest realized that a unit
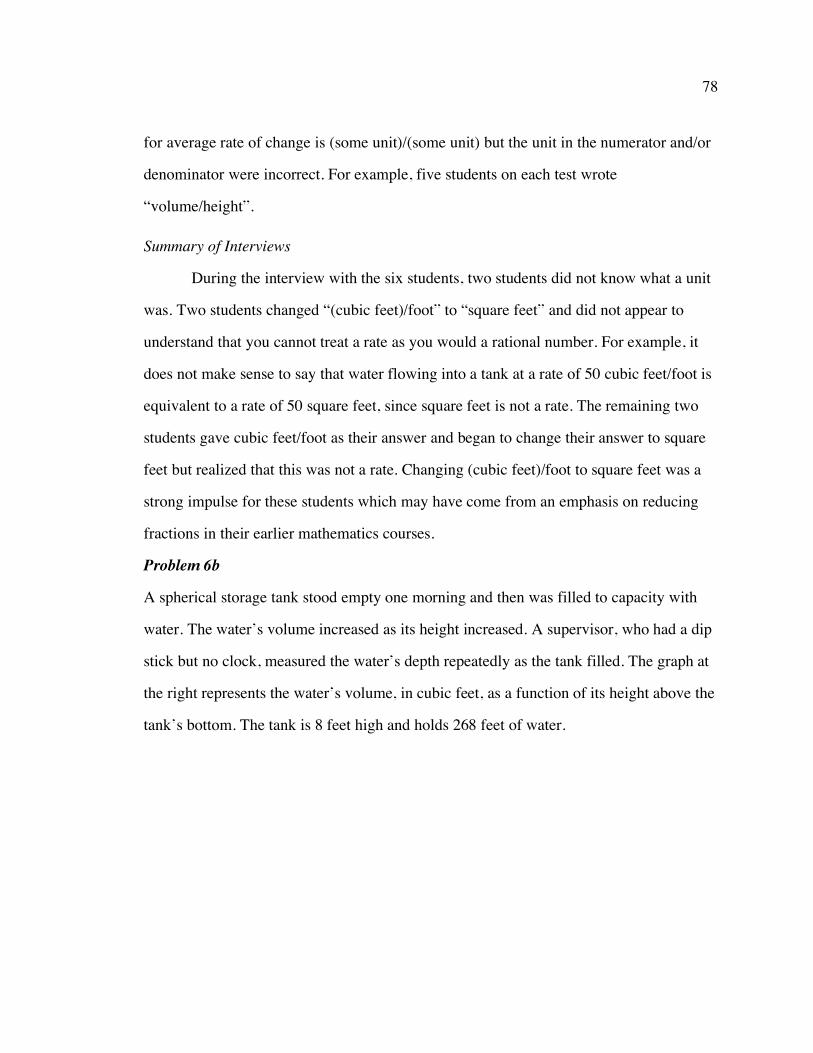
78
for average rate of change is (some unit)/(some unit) but the unit in the numerator and/or
denominator were incorrect. For example, five students on each test wrote
“volume/height”.
Summary of Interviews
During the interview with the six students, two students did not know what a unit
was. Two students changed “(cubic feet)/foot” to “square feet” and did not appear to
understand that you cannot treat a rate as you would a rational number. For example, it
does not make sense to say that water flowing into a tank at a rate of 50 cubic feet/foot is
equivalent to a rate of 50 square feet, since square feet is not a rate. The remaining two
students gave cubic feet/foot as their answer and began to change their answer to square
feet but realized that this was not a rate. Changing (cubic feet)/foot to square feet was a
strong impulse for these students which may have come from an emphasis on reducing
fractions in their earlier mathematics courses.
Problem 6b
A spherical storage tank stood empty one morning and then was filled to capacity with
water. The water’s volume increased as its height increased. A supervisor, who had a dip
stick but no clock, measured the water’s depth repeatedly as the tank filled. The graph at
the right represents the water’s volume, in cubic feet, as a function of its height above the
tank’s bottom. The tank is 8 feet high and holds 268 feet of water.
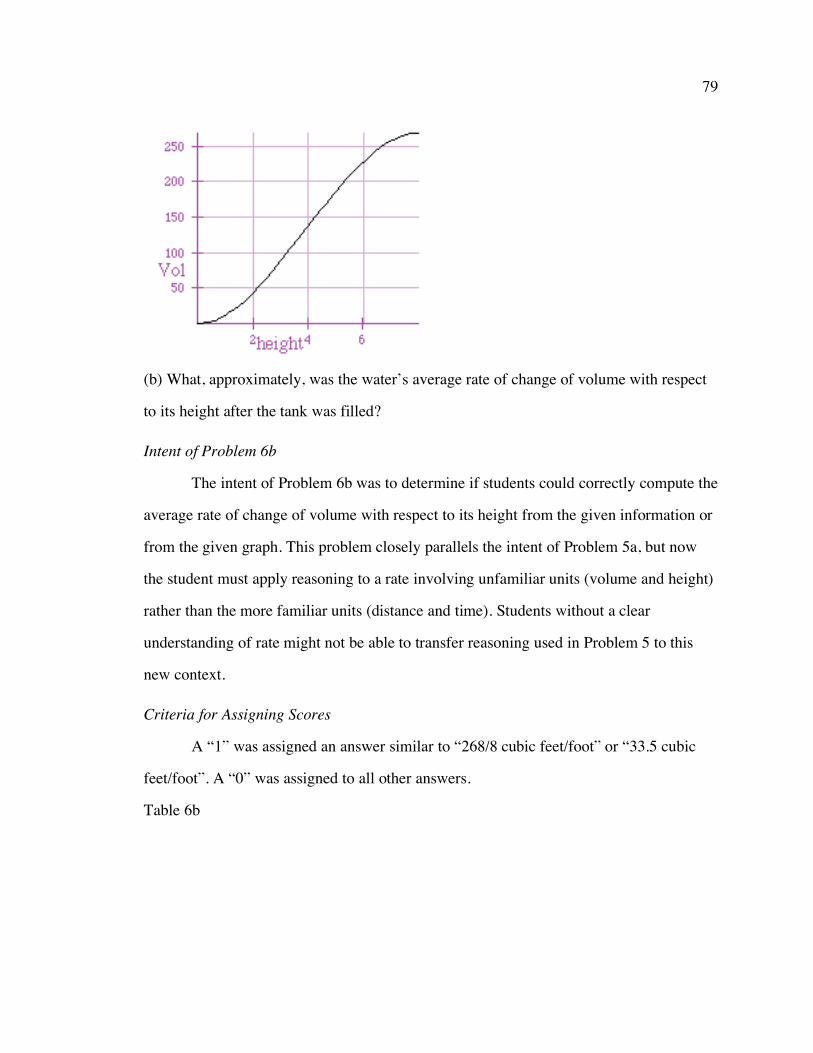
79
(b) What, approximately, was the water’s average rate of change of volume with respect
to its height after the tank was filled?
Intent of Problem 6b
The intent of Problem 6b was to determine if students could correctly compute the
average rate of change of volume with respect to its height from the given information or
from the given graph. This problem closely parallels the intent of Problem 5a, but now
the student must apply reasoning to a rate involving unfamiliar units (volume and height)
rather than the more familiar units (distance and time). Students without a clear
understanding of rate might not be able to transfer reasoning used in Problem 5 to this
new context.
Criteria for Assigning Scores
A “1” was assigned an answer similar to “268/8 cubic feet/foot” or “33.5 cubic
feet/foot”. A “0” was assigned to all other answers.
Table 6b
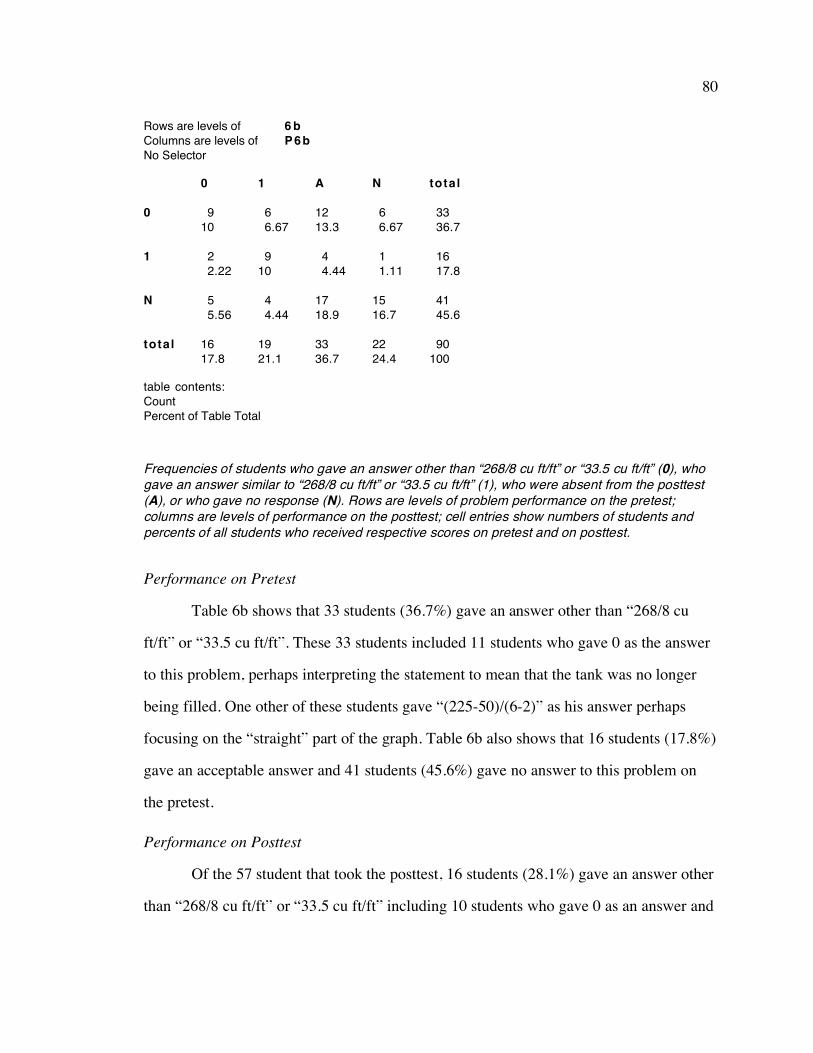
80
Rows are levels ofColumns are levels ofNo Selector
6bP6b
0
1
N
total
0
910
22.22
55.56
1617.8
1
66.67
910
44.44
1921.1
A
1213.3
44.44
1718.9
3336.7
N
66.67
11.11
1516.7
2224.4
total
3336.7
1617.8
4145.6
90100
table contents:CountPercent of Table Total
Frequencies of students who gave an answer other than “268/8 cu ft/ft” or “33.5 cu ft/ft” (0), who gave an answer similar to “268/8 cu ft/ft” or “33.5 cu ft/ft” (1), who were absent from the posttest (A), or who gave no response (N). Rows are levels of problem performance on the pretest; columns are levels of performance on the posttest; cell entries show numbers of students and percents of all students who received respective scores on pretest and on posttest.
Performance on Pretest
Table 6b shows that 33 students (36.7%) gave an answer other than “268/8 cu
ft/ft” or “33.5 cu ft/ft”. These 33 students included 11 students who gave 0 as the answer
to this problem, perhaps interpreting the statement to mean that the tank was no longer
being filled. One other of these students gave “(225-50)/(6-2)” as his answer perhaps
focusing on the “straight” part of the graph. Table 6b also shows that 16 students (17.8%)
gave an acceptable answer and 41 students (45.6%) gave no answer to this problem on
the pretest.
Performance on Posttest
Of the 57 student that took the posttest, 16 students (28.1%) gave an answer other
than “268/8 cu ft/ft” or “33.5 cu ft/ft” including 10 students who gave 0 as an answer and

81
two other students who gave “(225-50)/(6-2)” as their answer. Nineteen students (33.3%)
gave an acceptable response and 22 students (38.6%) gave no response to this problem on
the posttest.
Comparison of Pretest and Posttest Performance
By examining the (0,0), (1,1) and (N,N) cells of Table 6b, of the 57 students who
took both tests, 33 students (57.9%) were consistent from pretest to posttest. Of those
students who gave an unacceptable response on the pretest, cell (0,1) indicates that six
students gave a correct response on the posttest and cell (0,N) indicates that six students
gave no response on the posttest. Of those who gave an acceptable response on the
pretest, cell (1,0) indicates that two students gave an unacceptable response on the
posttest and cell (1,N) indicates that one student did not give a response on the posttest.
Of those who did not answer this problem on the pretest, cell (N,0) indicates that five
students gave an unacceptable response on the posttest and cell (N,1) indicates that four
students gave an acceptable response on the posttest.
Table C6b
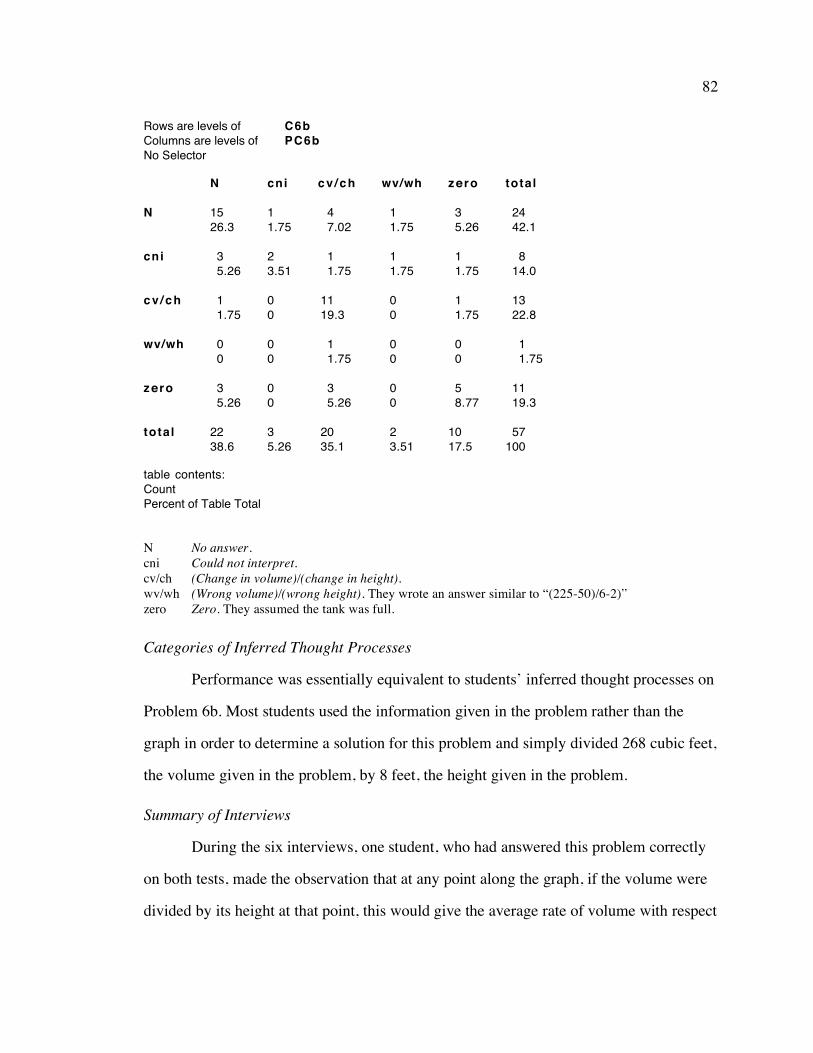
82
Rows are levels ofColumns are levels ofNo Selector
C6bPC6b
N
cni
cv /ch
wv/wh
zero
total
N
1526.3
35.26
11.75
00
35.26
2238.6
cni
11.75
23.51
00
00
00
35.26
cv /ch
47.02
11.75
1119.3
11.75
35.26
2035.1
wv/wh
11.75
11.75
00
00
00
23.51
zero
35.26
11.75
11.75
00
58.77
1017.5
total
2442.1
814.0
1322.8
11.75
1119.3
57100
table contents:CountPercent of Table Total
N No answer. cni Could not interpret. cv/ch (Change in volume)/(change in height). wv/wh (Wrong volume)/(wrong height). They wrote an answer similar to “(225-50)/6-2)” zero Zero. They assumed the tank was full.
Categories of Inferred Thought Processes
Performance was essentially equivalent to students’ inferred thought processes on
Problem 6b. Most students used the information given in the problem rather than the
graph in order to determine a solution for this problem and simply divided 268 cubic feet,
the volume given in the problem, by 8 feet, the height given in the problem.
Summary of Interviews
During the six interviews, one student, who had answered this problem correctly
on both tests, made the observation that at any point along the graph, if the volume were
divided by its height at that point, this would give the average rate of volume with respect
83
to height from the start. Another student also made an insightful observation. He stated
that “what went on while filling the tank can be ignored, only the amount of cubic feet of
water and the height at the end is important” in order to compute the average rate of
volume with respect to height after the tank was filled. He compared the computation of
average rate of change of volume with respect to height to the computation of a class
average. He stated that the class average is “the number of points that each person would
get equally and not how many points they received individually.”
However, other students did not have the insight and understanding of the rate of
change of volume with respect to height as did the students above. One student when
asked about the rate of change of volume with respect to height replied “I don’t see how
you can do it without time...I guess I think in terms of rate of change as being time.”
Another student divided 268 by 8, which he computed to be 33.5 cubic feet/foot
and thought this result was the amount of water in every foot. He then stated that “the
tank is cylindrical”. When he was reminded that the tank was spherical he was unable to
explain what the 33.5 cubic feet/foot meant. Later it was explained to him what “average”
rate of change of volume with respect to height meant, which in this case was 33.5 cubic
feet/foot, and he appeared to understand this concept. Another student who had focused
on the “straight” part of the graph in order to compute the average rate of change of
volume with respect to height stated that “a normal tank would be constant from top to
bottom” and, hence, thought that there was something wrong near the endpoints of the
graph where the graph curved.
Problem 6c
A spherical storage tank stood empty one morning and then was filled to capacity with
water. The water’s volume increased as its height increased. A supervisor, who had a dip
stick but no clock, measured the water’s depth repeatedly as the tank filled. The graph at

84
the right represents the water’s volume, in cubic feet, as a function of its height above the
tank’s bottom. The tank is 8 feet high and holds 268 feet of water.
(c) What, approximately, was the water’s average rate of change of volume with respect
to its height after the water’s height varied from 3 to 5 feet?
Intent of Problem 6c
The intent of Problem 6c was to determine if students could correctly compute,
from the graph, the average rate of change of volume with respect to height for a specific
interval of the height. This computation was not a matter of dividing one given number
by another, as in Problem 6b, but rather involved obtaining the needed information from
the graph in order to divide a change in volume by a change in height for the specific
interval of height. During the interviews, one goal was to determine if the students
realized that the average rate of change of volume with respect to height from 3 to 5 feet
in this problem was not the same as the average rate of change of volume for the entire
spherical tank (computed in Problem 6b). The only way to answer this was by
interpreting the given graph during the appropriate interval (3 to 5 feet).

85
Criteria for Assigning Scores
A “1” was assigned an answer approximately equal to “(175-75)/(5-3) cubic
feet/foot” or “50 cubic feet/foot”. This answer, the average rate of change of volume with
respect to height from 3 to 5 feet, was derived from the information in the graph and was
computed from the change in volume as compared to the change in height from 3 to 5
feet. A “0” was assigned to all other answers.
Table 6c Rows are levels ofColumns are levels ofNo Selector
6 cP6c
0
1
N
total
0
33.33
22.22
33.33
88.89
1
88.89
1011.1
1112.2
2932.2
A
910
55.56
1921.1
3336.7
N
44.44
11.11
1516.7
2022.2
total
2426.7
1820
4853.3
90100
table contents:CountPercent of Table Total
Frequencies of students who gave an answer which was not approximately “50 cu ft/ft”
(0), who gave an answer approximately equal to “50 cu ft/ft” (1), who were absent from
the posttest (A), or who gave no answer (N). Rows are levels of performance on the
pretest; columns are levels of performance on the posttest; cell entries show numbers of
students and percents of all students who received respective scores on pretest and on
posttest.
86
Performance on Pretest
Table 6c indicates that 24 students (26.7%) gave an answer that was not
approximately equal to “(175 - 75)/(5 - 3) cu ft/ft” or “50 cu ft/ft”, the (change in
volume)/(change in height) from 3 to 5 feet. Of these 24 students, it appears that six
students computed only the change of volume from 3 to 5 feet from information given in
the graph, that is, they wrote “100 cubic feet” as their answer to this problem in the
pretest. Two other students, for the average rate of change of volume with respect to
height from 3 to 5 feet, wrote “(75/3 + 175/5)/2 cu ft/ft” which perhaps is the arithmetic
average of the average rates of change of volume with respect to height from 0 to 3 feet
and from 0 to 5 feet. Table 6C also shows that 18 students (20%) gave an answer similar
to “50 cu ft/ft” and 48 students (53.3%) gave no answer to this problem on the pretest.
Performance on Posttest
Table 6C indicates that, of the 57 students who took both tests, eight students
(14%) gave an answer which was not similar to “50 cu ft/ft”, 29 students (50.9%) gave an
answer similar to “50 cu ft/ft” and 20 students (35.1%) gave no answer to this problem on
the posttest.
Comparison of Pretest and Posttest Performance
Table 6C shows how consistent students’ performance was from pretest to
posttest by examining the (0,0), (1,1) and (N,N) cells. Of the 57 students who took both
tests, these cells indicate that 28 students (49.1%) were consistent. Of those who gave an
unsatisfactory answer on the pretest, cell (0,1) shows that eight students then gave a
satisfactory answer on the posttest, and cell (0,N) shows that four students then gave no
answer on the posttest. Of those who gave a satisfactory answer on the pretest, cell (1,0)
indicates that two students gave an unsatisfactory answer on the posttest and cell (1,N)
indicates that one student gave no response. Of those who did not give a response on the

87
pretest, cell (N,0) indicates that three students gave an unsatisfactory answer on the
posttest and cell (N,1) indicates that 11 students gave a satisfactory answer on the
posttest.
Table C6c Rows are levels ofColumns are levels ofNo Selector
C6cPC6c
N
aaver
cni
cv /ch
cvol
total
N
1526.3
11.75
23.51
11.75
11.75
2035.1
cni
35.26
00
23.51
00
11.75
610.5
cv /ch
1119.3
11.75
35.26
915.8
47.02
2849.1
cvol
00
00
11.75
23.51
00
35.26
total
2950.9
23.51
814.0
1221.1
610.5
57100
table contents:CountPercent of Table Total
N No answer. aaver Arithmetic average. They calculated the arithmetic average of the average rates of change of
volume with respect to height from 0 to 3 feet and 0 to 5 feet. cni Could not interpret. cv/ch (Change in volume)/(change in height). cvol Change in volume. They calculated only the change in volume from 3 to 5 feet.
Categories of Inferred Thought Processes
The nature of Problem 6c was such that performance was essentially equivalent to
inferred thought processes. Hence, no further discussion will be given for Problem 6c.

88
Summary of Interviews
Of the six students interviewed, four students were able to answer this problem
from the information given in the graph and compute the change in volume as compared
to the change in height from 3 to 5 feet, although one student made an arithmetic error.
All four of these students seemed to have a strong understanding of what their
calculations represented also. However, none of these students compared their answer in
Problem 6c to their answer in Problem 6b. One student was later asked to make this
comparison and discuss the reasons why the answers to Problem 6b and 6c were
different.
One student, who had difficulty answering this problem, stated that this problem
involved a constant rate of change of volume with respect to height of 268/8 = 33.5 cubic
feet of water for every foot of the tank which she had calculated in Problem 6b. She then
drew a straight line on top of the given graph to indicate a constant rate of change. In her
discussions of Problems 5a to 5e, she indicated that she knew the formula for the average
speed of the ball during a certain time interval, that is, average speed = (change in
distance)/(change in time). However, she did not apply this knowledge to the solution of
Problem 6c which involved a (change in volume)/(change in height) in order to calculate
the average rate of change of volume with respect to height during a certain interval of
height. Her knowledge of average rate of change seems to be limited to having
memorized the formula for average speed.
Another student, who had difficulty answering this problem, ignored the given
graph, and wrote “[(5-3) feet]/[8 feet] = 1/4”, and stated that the units canceled each
other. After asking him to explain what the question was asking, he understood that he
was to compute the average rate at which volume of water increased as the height
increased from 3 to 5 feet. However, he focused on the units and stated that his answer,

89
1/4, was incorrect since his answer “had no units but the units of the answer should be
cubic feet/foot”. Still ignoring the given graph, he was unable to correctly answer
Problem 6c. The interviewer then pointed out that, according to the graph, the answer
would be approximately (175 - 75)/(5-3) = 50 cubic feet/foot but he had difficulty
comprehending this. Not until he was asked to draw a spherical tank and explain why this
answer was greater than the answer in Problem 6b, 33.5 cubic feet/foot, did he
comprehend these answers. He pointed out, on a drawing of a spherical tank 8 feet high,
that the spherical tank is widest in the middle and, hence, the average rate of volume of
water with respect to the height between 3 and 5 feet would be greater than the average
rate of volume of water with respect to height for the entire spherical tank.
Problem 6d
A spherical storage tank stood empty one morning and then was filled to capacity with
water. The water’s volume increased as its height increased. A supervisor, who had a dip
stick but no clock, measured the water’s depth repeatedly as the tank filled. The graph at
the right represents the water’s volume, in cubic feet, as a function of its height above the
tank’s bottom. The tank is 8 feet high and holds 268 feet of water.

90
(d) Suppose someone claimed that the water was poured into the storage tank at a
constant rate of 85 cubic feet per minute. Would that claim be consistent with the above
graph? Explain.
Intent of Problem 6d
The intent of Problem 6d was to determine if students, when presented with this
situation involving three changing quantities (volume, height and time), could recognize
that the average rate of change of volume with respect to height was not affected by a
constant rate of change of volume with respect to time. In other words, could the students
recognize that a change in a quantity (in this case volume) with respect to time had no
bearing on the given graph, which did not involve time.
Criteria for Assigning Scores
A “1” was assigned to the answer “yes” which included an explanation for this
answer similar to the following: “The given graph, which represents volume as a function
of height, would be consistent with the claim that water was being poured into the tank at
a constant rate of 85 cu ft/min or any other constant rate of volume with respect to time
since the average rate of change of volume with respect to height was not affected by the
amount of time it took the water to reach a particular height.” A “0” was assigned to all
other answers.
Table 6d
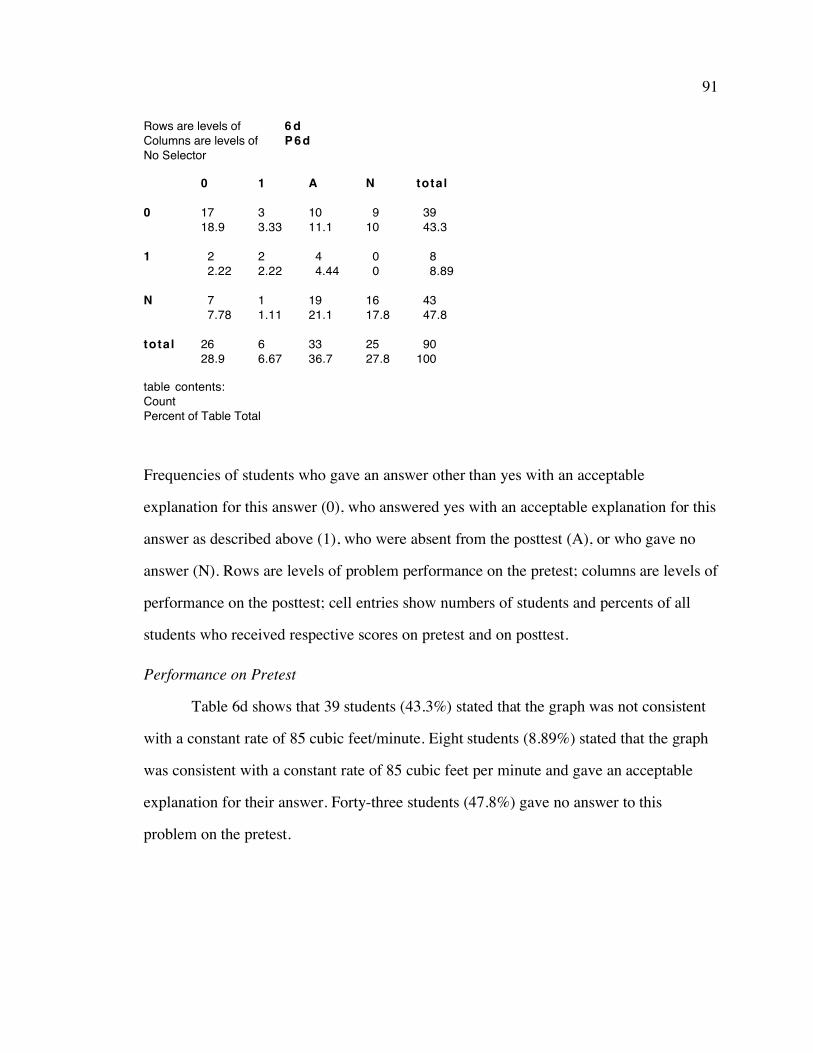
91
Rows are levels ofColumns are levels ofNo Selector
6dP6d
0
1
N
total
0
1718.9
22.22
77.78
2628.9
1
33.33
22.22
11.11
66.67
A
1011.1
44.44
1921.1
3336.7
N
910
00
1617.8
2527.8
total
3943.3
88.89
4347.8
90100
table contents:CountPercent of Table Total
Frequencies of students who gave an answer other than yes with an acceptable
explanation for this answer (0), who answered yes with an acceptable explanation for this
answer as described above (1), who were absent from the posttest (A), or who gave no
answer (N). Rows are levels of problem performance on the pretest; columns are levels of
performance on the posttest; cell entries show numbers of students and percents of all
students who received respective scores on pretest and on posttest.
Performance on Pretest
Table 6d shows that 39 students (43.3%) stated that the graph was not consistent
with a constant rate of 85 cubic feet/minute. Eight students (8.89%) stated that the graph
was consistent with a constant rate of 85 cubic feet per minute and gave an acceptable
explanation for their answer. Forty-three students (47.8%) gave no answer to this
problem on the pretest.

92
Performance on Posttest
Of the 57 students who took both tests, 26 students (45.6%) stated that the graph
was not consistent with a constant rate of 85 cubic feet/minute or stated that the graph
was consistent with a constant rate of 85 cubic feet/minute but gave an unacceptable
explanation for this answer. Six students (10.5%) stated that the graph was consistent
with a constant rate of 85 cubic feet/minute and gave an acceptable explanation. Twenty-
five students (43.9%) gave no answer to this problem on the posttest.
Comparison of Pretest and Posttest Performance
Cells (0,0), (1,1) and (N,N) of Table 6d show that 35 students (61.4%), of the 57
students who took both tests, were consistent from pretest to posttest. Of those who gave
an unsatisfactory response on the pretest, cells (0,1) an (0,N) indicate that three students
gave a satisfactory response and nine students did not give a response on the posttest. Of
those who gave a satisfactory response on the pretest, cells (1,0) and (1,N) indicate that 2
students gave an unsatisfactory response and none failed to give a response on the
posttest. Of those who gave no response on the pretest, cells (N,0) and (N,1) indicate that
seven students gave an unsatisfactory response and one student gave a satisfactory
response on the posttest.
Table C6d

93
Rows are levels ofColumns are levels ofNo Selector
C6dPC6d
N
calc
cnst
notgr
nwk
st ln
total
N
1628.1
11.75
11.75
35.26
00
47.02
2543.9
ca lc
11.75
23.51
11.75
11.75
00
11.75
610.5
cnst
11.75
00
11.75
00
00
11.75
35.26
notgr
35.26
11.75
11.75
23.51
11.75
23.51
1017.5
nwk
11.75
00
00
23.51
11.75
23.51
610.5
st ln
23.51
00
11.75
11.75
00
35.26
712.3
total
2442.1
47.02
58.77
915.8
23.51
1322.8
57100
table contents:CountPercent of Table Total
N No answer. calc Tried a calculation. cnst A constant rate of 85 cu ft/min was consistent with the graph. notgr Time was not in the graph. These students stated that they couldn’t determine the answer since
time was not one of the variables in the graph. nwk Stated an answer but gave no explanation for their answer. stln Straight line. They stated that the graph of volume as a function of height would be a straight line
if the constant rate of flow of water was 85 cu ft/min.
Categories of Inferred Thought Processes
Table C6d shows that responses, for the 57 students who took both tests, fell into
six main categories based on inferred thought processes. Thirteen students on the pretest
and seven students on the posttest indicated that the given graph was not consistent with a
constant rate of 85 cubic feet of water per minute since “a constant rate would refer to a
graph with a straight line.” Twenty-four students on the pretest and 25 students on the

94
posttest gave no answer. Five students on the pretest and three students on the posttest
gave an acceptable response, as described above. Nine students on the pretest and 10
students on the posttest either stated that the graph was not consistent with a constant rate
of 85 cu ft/min or could not determine the answer to this problem since time was not a
variable of the given graph. One of these students wrote, “It has no relation. One is time,
the other is height”. Four students on the pretest and six students on the posttest stated
that the graph was not consistent with a constant rate of 85 cubic feet of water per minute
since it would take 3.15 minutes to fill the 268 cubic foot tank but the graph shows it was
filled at 8. Perhaps these students confused height and time or simply replaced height
with time on the horizontal axis. One student on the pretest and one student on the
posttest stated that the answer to Problem 6d was “No, because during the steepest part of
the curve, the average is only 50 cu ft/min”. They had changed “foot” to “minutes” in “50
cubic feet/foot”, their answer to Problem 6c, when giving their answer to this problem.
Summary of interviews
During the six interviews, when Problem 6d introduced the unit “cubic
feet/minute”, it appeared that two students thought that the horizontal axes then
represented time rather than height. These students stated that it would take 3.15 minutes
to fill the tank at a rate of 85 cu ft/min, not 8, and one of the students added that the graph
should be a straight line since the water was flowing in at a “constant” rate. Three other
students also stated that the given graph was inconsistent with a constant rate of 85 cubic
feet per minute since “constant” implied a straight line, and the graph was not a straight
line.
Another student, also thought the graph was inconsistent with a constant rate of
change of volume with respect to time. He stated that the given graph showed “what the
volume is with respect to how far the tank is filled up, not how long it took to fill the tank

95
up...they are unrelated and the units cu ft/ft and cu ft/min are unrelated”. When asked to
describe the graph of a constant rate of 85 cubic feet/minute if the horizontal axis were
changed to time, he was not able to answer this question.
It is interesting to note that none of the students, during their interview regarding
Problem 6d, made a real effort to understand why the given graph, representing the
volume of water as a function of height of the spherical tank, had “curves” at both ends
although they appeared to understand that “The water’s volume increased as its height
increased.” They also had difficulty understanding that the time it took the water to reach
certain heights would not affect the given graph which represented the volume as a
function of the height. Hence, they had difficulty understanding that the given graph was
consistent with a constant rate of change of 85 cubic feet per minute.
Problem 7a
Two cars, Car A and Car B, started from the same point, at the same time, and traveled in
the same direction. Their speeds increased, as shown in the graph (heavy graph is for Car
A, light graph is for Car B), so that after one minute they were both traveling at 100 mph.

96
(a) Was the distance between the cars increasing or decreasing 0.8 minutes after they
started? Explain.
Intent of Problem 7a
The intent of Problem 7a was to determine if students, given the graphs of the
speeds of two cars as a function of time, could describe the change in the distance
between the two cars at a particular moment in time. Students who confuse speed with
distance (in the graph) might expect the distance between the cars to decrease as the
difference between their speeds decreases. Students with a clearer understanding of the
graph and of relative speed would recognize that, since Car A is going faster than Car B
throughout the first minute, the distance between the cars is continually increasing
throughout the time interval from 0 to 1 minute.
Criteria for Assigning Scores
A “1” was assigned to any answer which suggested that the student thought the
distance between the two cars was increasing at 0.8 minutes since Car A’s speed was still
faster than Car B’s speed at this particular moment in time. All other answers were
assigned a “0”.
Table 7a
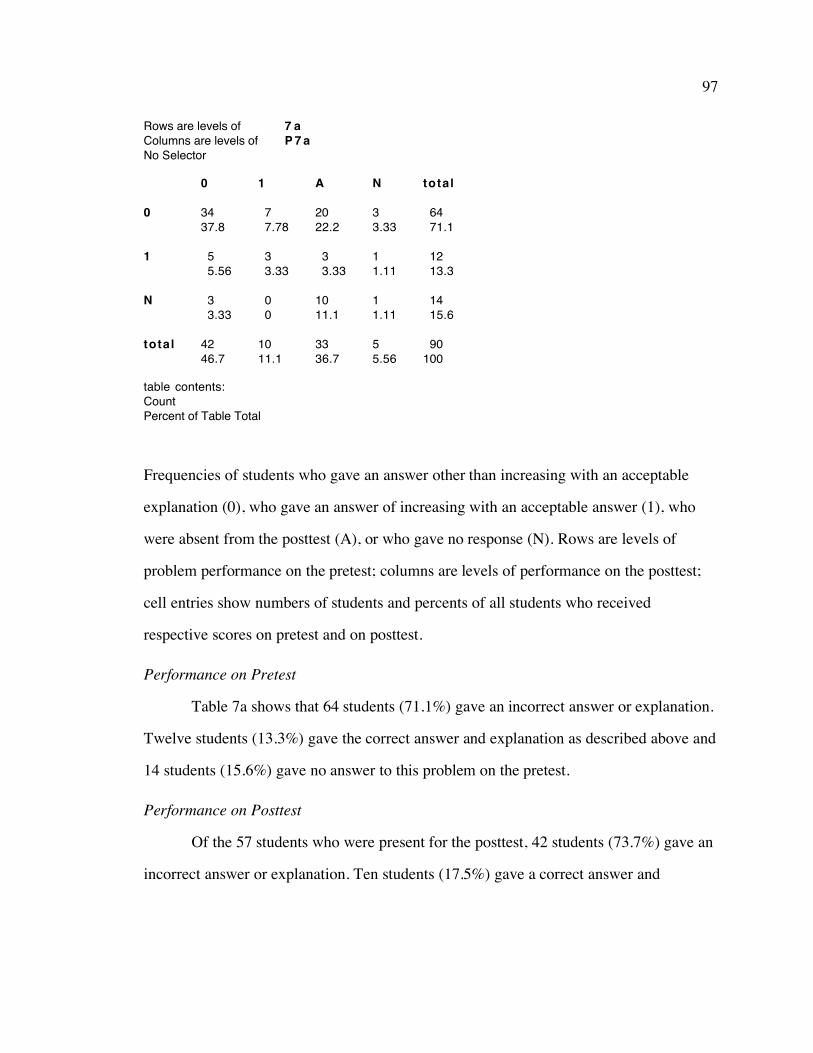
97
Rows are levels ofColumns are levels ofNo Selector
7 aP7a
0
1
N
total
0
3437.8
55.56
33.33
4246.7
1
77.78
33.33
00
1011.1
A
2022.2
33.33
1011.1
3336.7
N
33.33
11.11
11.11
55.56
total
6471.1
1213.3
1415.6
90100
table contents:CountPercent of Table Total
Frequencies of students who gave an answer other than increasing with an acceptable
explanation (0), who gave an answer of increasing with an acceptable answer (1), who
were absent from the posttest (A), or who gave no response (N). Rows are levels of
problem performance on the pretest; columns are levels of performance on the posttest;
cell entries show numbers of students and percents of all students who received
respective scores on pretest and on posttest.
Performance on Pretest
Table 7a shows that 64 students (71.1%) gave an incorrect answer or explanation.
Twelve students (13.3%) gave the correct answer and explanation as described above and
14 students (15.6%) gave no answer to this problem on the pretest.
Performance on Posttest
Of the 57 students who were present for the posttest, 42 students (73.7%) gave an
incorrect answer or explanation. Ten students (17.5%) gave a correct answer and

98
explanation as described above and five students (8.77%) gave no answer to this problem
on the posttest.
Comparison of Pretest and Posttest Performance
By examining the (0,0), (1,1) and (N,N) cells of Table 7a we can see that 38
students (66.7%), of the 57 students who took both tests, were consistent from pretest to
posttest. Of the 41 students who gave an unsatisfactory answer or explanation on the
pretest, cell (0,1) shows that seven students gave a satisfactory answer and explanation on
the posttest and cell (0,N) shows that three students gave no response on the posttest. Of
the nine students who gave a satisfactory answer and explanation on the pretest, cell (1,0)
shows that five students gave an unsatisfactory answer or explanation on the posttest and
cell (1,N) shows that one student gave no answer. Of the four students who gave no
answer on the pretest, cell (N,0) shows that three students gave an unsatisfactory answer
or explanation on the posttest and cell (N,1) shows that none of these students gave the
correct answer on the posttest.
Table C7a

99
Rows are levels ofColumns are levels ofNo Selector
C7aPC7a
N
axsgr
cni
ind
jstdc
jstgr
total
N
00
00
00
11.75
00
00
11.75
axsgr
00
1221.1
00
11.75
11.75
47.02
1831.6
cni
23.51
35.26
35.26
23.51
11.75
00
1119.3
ind
00
23.51
11.75
35.26
00
35.26
915.8
jstdc
00
47.02
11.75
23.51
23.51
11.75
1017.5
jstgr
00
23.51
11.75
00
00
58.77
814.0
total
23.51
2340.4
610.5
915.8
47.02
1322.8
57100
table contents:CountPercent of Table Total
N No answer. axsgr Focused on the axes and graph. They stated that Car B was increasing its acceleration at a faster
rate than Car A at 0.8 minutes, hence, the distance between them was decreasing. cni Could not interpret. ind Increasing distance at 0.8 minutes. jstdc Just wrote “decreasing”. justgr Focused just on the graph. Wrote “decreasing” since the lines of the graph came closer together at
0.8 minutes.
Categories of Inferred Thought Processes
Table C/a indicates that the responses of the 57 students who took both tests fell
into six categories based upon the inferred thought processes of these students. It was
presumed that there were several reasons why many of these students incorrectly decided
that the distance between the cars was decreasing, rather than increasing, at 0.8 minutes.
Twenty-three students (40.4%) on the pretest and 18 students (31.6%) on the posttest,

100
although they realized that this was a graph of the speed of the cars as a function of time,
gave a reason similar to the following, “B was increasing its acceleration and also A but
at a slower rate so B was getting closer to A at 0.8 minutes”. These students perhaps had
confused acceleration with speed. Although Car B’s acceleration was greater than Car
A’s acceleration at 0.8 minutes, as the tangents to the graph at this moment in time would
indicate, Car B’s speed is still slower than Car A’s speed at this time. Hence, the distance
between the cars is still increasing at 0.8 minutes. Thirteen students (22.8%) on the
pretest and eight students (14.0%) on the posttest either thought the axes represented
distance and time rather than speed and time or ignored the axes and believed the graphs
were “paths” the cars had followed, hence, at 0.8 minutes the distance between the cars
would be decreasing.
Two students (3.51%) on the pretest and one student (1.75%) on the posttest gave
no answer to Problem 7a. Six students (10.5%) on the pretest and 11 students (19.3%) on
the posttest gave an answer which the investigator could not interpret. For example, one
student wrote “25 miles apart” and another wrote “This problem is confusing because I
do not have any idea of where the cars are in space relative to each other. I am only
presented with data pertaining to the relative speeds of both cars.” Four students (7.0%)
on the pretest and 10 students (17.5%) on the posttest wrote “decreasing” but gave no
explanation. Nine students (16.1%) on both tests gave an acceptable answer and
explanation; the distance between the cars is increasing at 0.8 minutes since Car A’s
speed was still greater than Car B’s speed at that moment in time. They were able to
relate the speed of the cars to the change in distance between the cars at a particular
moment in time.
101
Summary of Interviews
During the six interviews, one student stated that he was “confused” and could not
answer this problem since he was only presented with a graph which pertained to the
cars’ speeds and not with the distance the cars had traveled or where the cars were
located. He was unable to relate the distance between the cars given the graph of the
speeds of the cars as a function of time.
Three other students stated that the distance between the cars was decreasing
since they assumed the graph represented the “paths” the cars traveled and at 0.8 minutes
the distance between the paths was decreasing. However, one of these three students then
described the speeds of the cars from 0 to 1 minute and stated that Car A’s speed was
always greater than Car B’s speed but he still could not relate this understanding to the
distance between the cars at 0.8 minutes.
Two other students came to the correct conclusion that the distance between the
cars was increasing at 0.8 minutes but their thought processes differed. One student, who
had achieved the highest score overall on both tests, gave a reason which was unique. He
stated that the areas below the speed as a function of time graphs represented the
distances the cars had traveled and at 0.8 minutes Car A was increasing its area more than
Car B. Hence, the distance between the cars was increasing at 0.8 minutes. This student
added that he had learned this technique before he enrolled in Math 150. The other
student, who on his pretest had written that the distance between the cars was
“decreasing” at 0.8 minutes and on his posttest had written that the distance between the
cars was “increasing” at 0.8 minutes, during the interview stated that he agreed with his
answer on the posttest. He stated on his posttest and during the interview that “Car A was
still pulling away from Car B at 0.8 minutes since Car A’s speed was still greater than
Car B’s speed at 0.8 minutes.”

102
Problem 7b
Two cars, Car A and Car B, started from the same point, at the same time, and traveled in
the same direction. Their speeds increased, as shown in the graph (heavy graph is for Car
A, light graph is for Car B), so that after 1 minute they are both traveling at 100 mph.
(b) Describe the cars’ relative positions 1 minute after they started. Explain.
Intent of Problem 7b
The intent of Problem 7b was to determine if students, given the graphs of the
speeds of two cars as a function of time, could compare the distances the two cars
traveled during an interval of time. This question examined whether students’ understood
that the car with the greater speed traveled further than the slower car for the same time
interval. Because the distance between the cars was continually increasing throughout the
time interval 0 to 1 minute, at 1 minute the cars were farthest apart.
Criteria for Assigning Scores
A “1” was assigned to an answer which suggested that the student thought that
Car A had traveled further than Car B during the same time interval, from 0 to 1 minute,

103
since the graph indicated that Car A’s speed was always greater than Car B’s speed
during this time interval. A “0” was given to all other responses.
Table 7b Rows are levels ofColumns are levels ofNo Selector
7bP7b
0
1
N
total
0
2831.1
11.11
44.44
3336.7
1
77.78
1011.1
00
1718.9
A
1820
44.44
1112.2
3336.7
N
44.44
22.22
11.11
77.78
total
5763.3
1718.9
1617.8
90100
table contents:CountPercent of Table Total
Frequencies of students who gave an answer other than Car A traveled further than Car B
since Car A’s speed was always greater than Car B’s speed from 0 to 1 minute (0), who
answered that Car A traveled further than Car B since Car A’s speed was always greater
than Car B’s speed from 0 to 1 minutes (1), who were absent from the posttest (A), or
who gave no response (N). Rows are levels of problem performance on the pretest;
columns are levels of performance on the posttest; cell entries show numbers of students
and percents of all students who received respective scores on pretest and on posttest.
Performance on Pretest
Table 7b shows that 57 students (63.3%) gave an incorrect response or
explanation. For example, the student may have stated that the cars had traveled the same
distance or only discussed the speeds of the two cars and not the cars’ relative positions.

104
Seventeen students (18.9%) gave the correct response and explanation and 16 students
(17.8%) gave no response.
Performance on Posttest
Of the 57 students who took the posttest, 33 students (57.9%) gave an incorrect
response or explanation, 17 students (29.8%) gave the correct response and explanation
and seven students (12.2%) gave no response.
Comparison of Pretest and Posttest Performance
Cells (0,0), (1,1) and (N,N) of Table 7b show that 39 students (68.4%), of the 57
students who took both tests, were consistent from pretest to posttest. Of the 39 students
who gave an incorrect answer or explanation on the pretest, cell (0,1) shows that seven
students gave a correct answer and explanation on the posttest, and cell (0,N) shows that
four students gave no answer on the posttest. Of the 13 students who gave a correct
answer and explanation on the pretest, cell (1,0) shows that one student gave an incorrect
answer or explanation on the posttest and cell (1,N) shows that two students gave no
answer on the posttest. Of the 5 students who gave no answer on the pretest, cell (N,0)
shows that four students gave an incorrect answer or explanation on the posttest and cell
(N,1) shows that none of these students gave a correct answer and explanation on the
posttest.
Table C7b
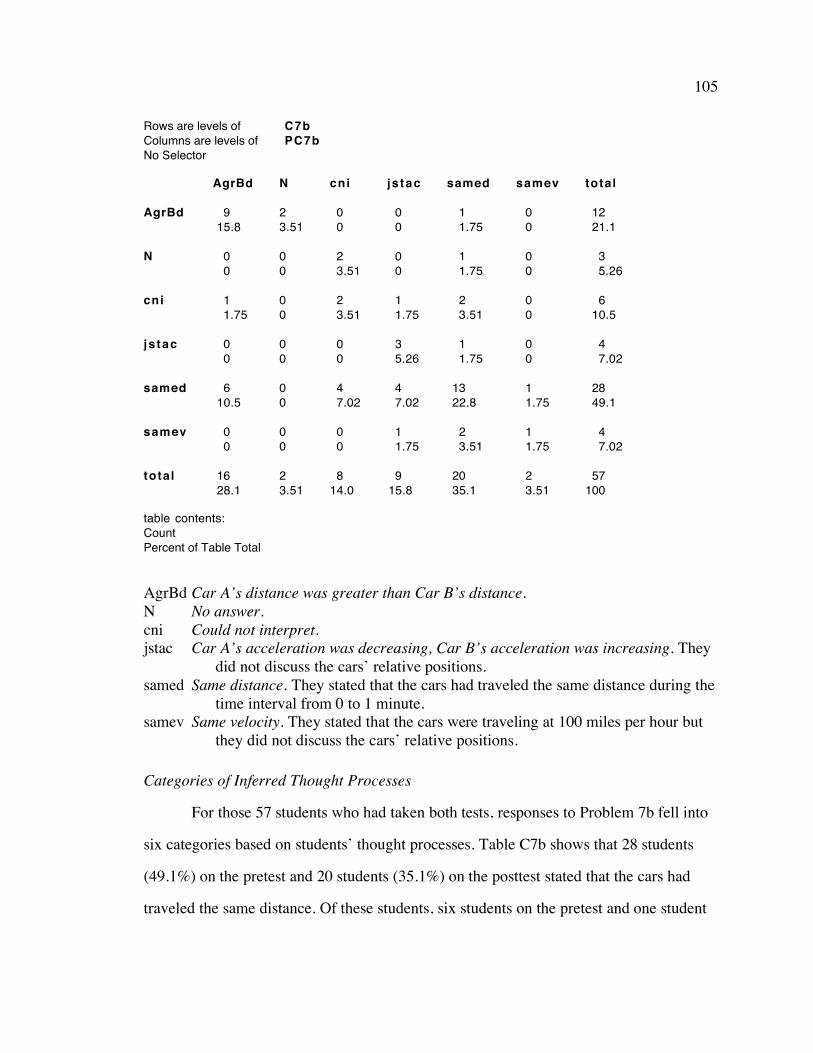
105
Rows are levels ofColumns are levels ofNo Selector
C7bPC7b
AgrBd
N
cni
js tac
samed
samev
total
AgrBd
915.8
00
11.75
00
610.5
00
1628.1
N
23.51
00
00
00
00
00
23.51
cni
00
23.51
23.51
00
47.02
00
814.0
js tac
00
00
11.75
35.26
47.02
11.75
915.8
samed
11.75
11.75
23.51
11.75
1322.8
23.51
2035.1
samev
00
00
00
00
11.75
11.75
23.51
total
1221.1
35.26
610.5
47.02
2849.1
47.02
57100
table contents:CountPercent of Table Total
AgrBd Car A’s distance was greater than Car B’s distance. N No answer. cni Could not interpret. jstac Car A’s acceleration was decreasing, Car B’s acceleration was increasing. They
did not discuss the cars’ relative positions. samed Same distance. They stated that the cars had traveled the same distance during the
time interval from 0 to 1 minute. samev Same velocity. They stated that the cars were traveling at 100 miles per hour but
they did not discuss the cars’ relative positions.
Categories of Inferred Thought Processes
For those 57 students who had taken both tests, responses to Problem 7b fell into
six categories based on students’ thought processes. Table C7b shows that 28 students
(49.1%) on the pretest and 20 students (35.1%) on the posttest stated that the cars had
traveled the same distance. Of these students, six students on the pretest and one student
106
on the posttest, thought of the graphs as “paths” the cars traveled along. These students
stated that the “cars ran into each other” or “there was a collision” at 1 minute. Three
other students on the pretest also thought the cars traveled the same distance but
considered the speeds of the cars in the time interval 0 to 1 minute. They discussed the
average acceleration of the cars when they stated that “The cars are at exactly the same
distance from the start. Car A started out fast, but slowed down. Car B started slow but
sped up rapidly because its slope is steep. The curves are identical except for them being
reversed from each other.” The remainder of the students thought that the cars, having
reached the same speed at 1 minute, traveled the same distance at 1 minute. This can be
seen in statements similar to “They are now traveling at the same speed, 100 mph, and so
they are both beside each other having traveled the same distance.”
Three students (5.26%) on the pretest and two students (3.15%) on the posttest
gave no response to this problem. It appeared that these students were not persistent in
their attempt to find the relative distance between the cars at 1 minute given a graph of
the cars’ speeds as a function of time. Six students (10.5%) on the pretest and eight
students (14%) on the posttest gave an answer which the investigator could not interpret,
such as, “There was no distance.” Twelve students (21.1%) on the pretest and 16 students
(28.1%) on the posttest gave the correct answer and an acceptable explanation. One of the
students, who had given a correct answer and acceptable explanation, on the posttest
stated that “Car A is ahead because his average speed with relation to time is better.”
Four students (7.0%) on the pretest and two students (3.5%) on the posttest only stated
that both cars were traveling at 100 mph at 1 minute. These students did not discuss the
cars’ relative positions. Four students (7.0%) on the pretest and nine students (15.8%) on
the posttest only stated that Car A was slowing down and Car B was speeding up. These
students also did not discuss the cars’ relative positions.

107
Summary of Interviews
During one of the six interviews, a student described her thoughts regarding the
given graph in Problem 7b as follows: “Car A took off fast and kept at a steady pace but
Car B took off slowly and gradually increased so they both meet at 1 minute. For some
reason they look like they are on a little path.” It is interesting to note that, from her first
comment, she was able to accurately interpret the graph and compare the speed of Car A
to Car B. However, she states that “they both meet at 1 minute” since the cars “look like
they are on a little path”. She appears to be viewing the graph at two levels. One is at a
naive level (the graph represents a path on which the cars travel), and the other is at an
interpretive level (the graph represents speed as a function of time which must then be
related a situation regarding their relative positions). When it was pointed out to her that
Car A’s speed was always greater than Car B’s speed during the time interval 0 and 1
minute, she still insisted that the cars were traveling next to each other at 1 minute. She
again interpreted the graph correctly in terms of their speeds but also looked at the graph
as the “paths” the cars traveled. She also insisted throughout the interview that since the
cars reached the same speed at 1 minute they had traveled the same distance at 1 minute.
Another student said the cars were traveling next to each other at 1 minute since
“their average velocity was the same” during the time interval 0 to 1 minute. He drew a
straight line from the origin through the intersection point of the graphs at 1 minute to
represent this “average velocity”. He did not realize that this straight line represented the
average acceleration of each car and not the average velocity of each car.
Two other students correctly stated that Car A was ahead of Car B at 1 minute but
gave different reasons for this answer. One student looked at the area under each graph
from 0 to 1 minute, which he said represented the distance each car traveled, and
concluded that Car A had traveled further than Car B during the first minute since the
108
area under its graph was greater. The other student related the graphs of speeds as a
function of time to the distances the cars traveled. He concluded Car A traveled further
than Car B since Car A’s speed was always greater than Car B’s from 0 to 1 minute after
which time “Car B will begin to catch up”.
Two other students during their interview stated that they could not determine the
relative positions of the cars from the graph which represented the speeds of the cars as a
function of time. They only commented that the cars were both traveling at 100 mph at 1
minute. However, after it was pointed out to them that the graph showed that Car A’s
speed was always greater than Car B’s speed from 0 to 1 minute, they were able to relate
Car A’s position to Car B’s position, and stated that Car A was ahead of Car B at 1
minute.
Problem 8
When the Discovery space shuttle is launched, its speed increases continually until its
booster engines separate from the shuttle. During the time it is continually speeding up,
the shuttle is never moving at a constant speed. What, then, would it mean to say that at
precisely 2.15823 seconds after launch the shuttle is traveling at precisely 183.8964 miles
per hour?
Intent of Problem 8
Problem 8 was intended to explore students’ understanding of an accelerating
object given a specific situation with specific numerical values. Students with a clear
understanding of instantaneous velocity would be aware that if the shuttle were to stop
accelerating at precisely 2.15823 seconds after the launch, it would continue to travel at a
constant velocity of 183.8964 miles per hour. One reason this question was of interest
was the fact that instantaneous velocity is a term used frequently in many calculus texts.

109
Criteria for Assigning Scores
A “1” was assigned to an answer which suggested that the student understood that
if the object stopped accelerating at precisely 2.15823 seconds the object would continue
to travel at the constant velocity 183.8964 miles per hour or if they expressed
instantaneous velocity as a limit of average velocities over intervals of decreasing lengths
(no students actually gave this explanation, however). A “0” was assigned to all other
answers including an answer similar to “instantaneous velocity”. “Instantaneous velocity”
is a term used to describe the given situation but does not indicate that the student
understood the concept “instantaneous velocity” or the situation in the given problem.
Table 8
Rows are levels ofColumns are levels ofNo Selector
8P 8
0
1
N
total
0
4145.6
11.11
910
5156.7
1
11.11
00
00
11.11
A
2224.4
00
1112.2
3336.7
N
33.33
00
22.22
55.56
total
6774.4
11.11
2224.4
90100
table contents:CountPercent of Table Total
Frequencies of students who gave an answer that did not include stopping the
acceleration of the shuttle at a precise moment (0), who gave an answer that did include
stopping the acceleration of the shuttle at a precise moment after which it would continue
at a constant velocity (1), who were absent from the posttest (A), or who gave no
response (N). Rows are levels of problem performance on the pretest; columns are levels
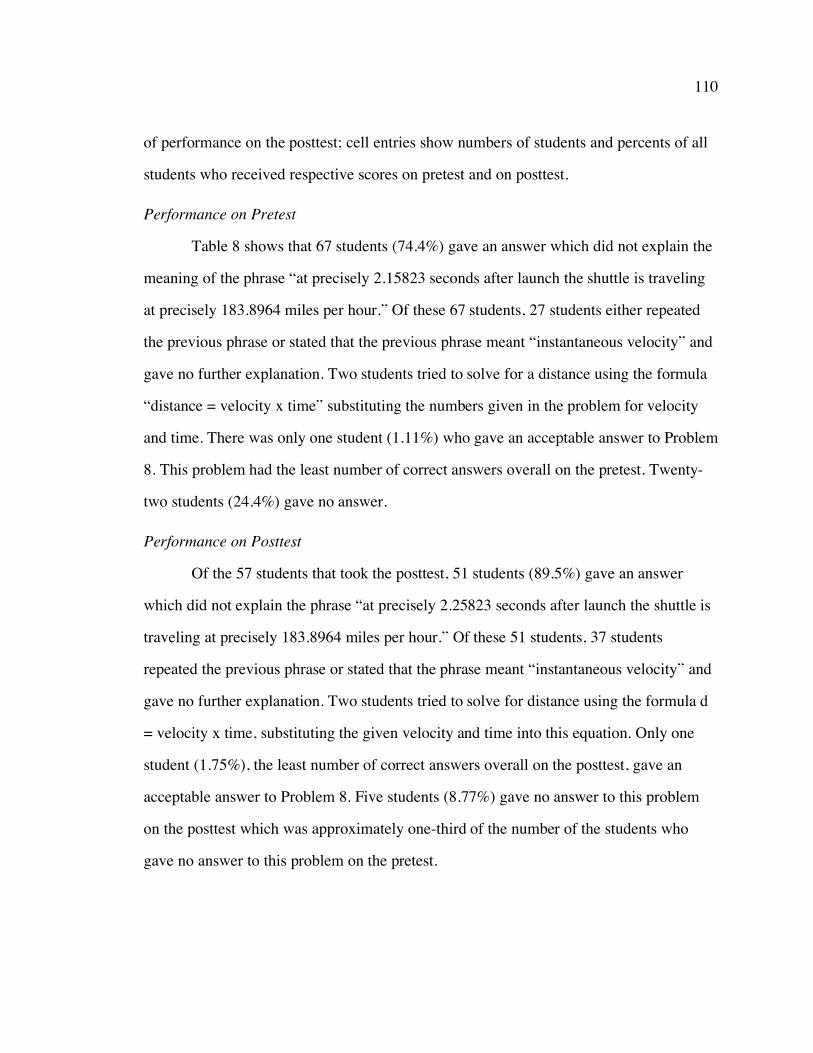
110
of performance on the posttest; cell entries show numbers of students and percents of all
students who received respective scores on pretest and on posttest.
Performance on Pretest
Table 8 shows that 67 students (74.4%) gave an answer which did not explain the
meaning of the phrase “at precisely 2.15823 seconds after launch the shuttle is traveling
at precisely 183.8964 miles per hour.” Of these 67 students, 27 students either repeated
the previous phrase or stated that the previous phrase meant “instantaneous velocity” and
gave no further explanation. Two students tried to solve for a distance using the formula
“distance = velocity x time” substituting the numbers given in the problem for velocity
and time. There was only one student (1.11%) who gave an acceptable answer to Problem
8. This problem had the least number of correct answers overall on the pretest. Twenty-
two students (24.4%) gave no answer.
Performance on Posttest
Of the 57 students that took the posttest, 51 students (89.5%) gave an answer
which did not explain the phrase “at precisely 2.25823 seconds after launch the shuttle is
traveling at precisely 183.8964 miles per hour.” Of these 51 students, 37 students
repeated the previous phrase or stated that the phrase meant “instantaneous velocity” and
gave no further explanation. Two students tried to solve for distance using the formula d
= velocity x time, substituting the given velocity and time into this equation. Only one
student (1.75%), the least number of correct answers overall on the posttest, gave an
acceptable answer to Problem 8. Five students (8.77%) gave no answer to this problem
on the posttest which was approximately one-third of the number of the students who
gave no answer to this problem on the pretest.

111
Comparison of Pretest and Posttest Performance
Cells (0,0), (1,1) and (N,N) of Table 8 show that 43 students, of the 57 students
who took both tests, were consistent from pretest to posttest. Of the 41 students who gave
an unacceptable answer on the pretest, cell (0,1) shows that one student gave an
acceptable answer on the posttest, and cell (0,N) shows that three students gave no
answer. One student gave an acceptable answer on the pretest; this student gave an
unacceptable answer on the posttest (saying only “instantaneous velocity” on the
posttest). Of the 22 students who gave no answer on the pretest, cell (N,0) shows that
nine students gave an unacceptable answer on the posttest and cell (N,1) shows that none
of these students gave an acceptable answer on the posttest.
Table C8 Rows are levels ofColumns are levels ofNo Selector
C8PC8
N
cni
d=rt
instv
stpac
total
N
00
00
00
11.75
00
11.75
cni
11.75
1322.8
00
23.51
00
1628.1
d=rt
00
11.75
11.75
00
00
23.51
instv
58.77
610.5
11.75
2442.1
11.75
3764.9
stpac
00
00
00
00
11.75
11.75
total
610.5
2035.1
23.51
2747.4
23.51
57100
table contents:CountPercent of Table Total
N No answer.
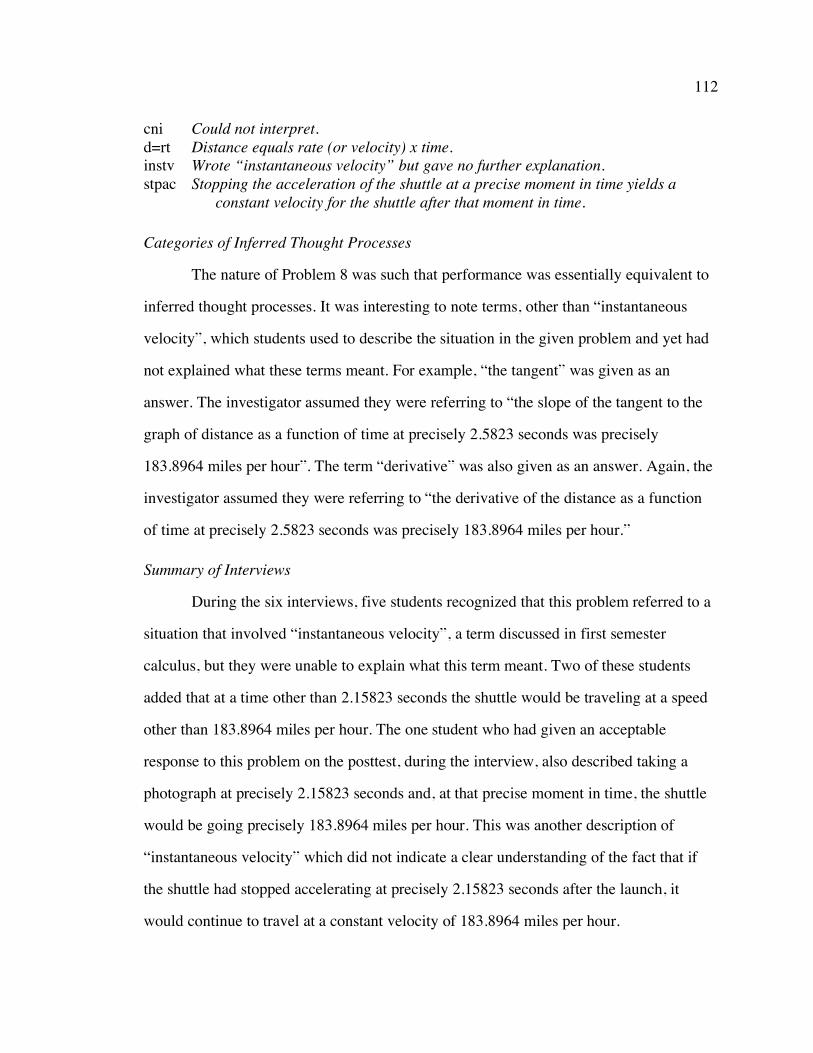
112
cni Could not interpret. d=rt Distance equals rate (or velocity) x time. instv Wrote “instantaneous velocity” but gave no further explanation. stpac Stopping the acceleration of the shuttle at a precise moment in time yields a
constant velocity for the shuttle after that moment in time.
Categories of Inferred Thought Processes
The nature of Problem 8 was such that performance was essentially equivalent to
inferred thought processes. It was interesting to note terms, other than “instantaneous
velocity”, which students used to describe the situation in the given problem and yet had
not explained what these terms meant. For example, “the tangent” was given as an
answer. The investigator assumed they were referring to “the slope of the tangent to the
graph of distance as a function of time at precisely 2.5823 seconds was precisely
183.8964 miles per hour”. The term “derivative” was also given as an answer. Again, the
investigator assumed they were referring to “the derivative of the distance as a function
of time at precisely 2.5823 seconds was precisely 183.8964 miles per hour.”
Summary of Interviews
During the six interviews, five students recognized that this problem referred to a
situation that involved “instantaneous velocity”, a term discussed in first semester
calculus, but they were unable to explain what this term meant. Two of these students
added that at a time other than 2.15823 seconds the shuttle would be traveling at a speed
other than 183.8964 miles per hour. The one student who had given an acceptable
response to this problem on the posttest, during the interview, also described taking a
photograph at precisely 2.15823 seconds and, at that precise moment in time, the shuttle
would be going precisely 183.8964 miles per hour. This was another description of
“instantaneous velocity” which did not indicate a clear understanding of the fact that if
the shuttle had stopped accelerating at precisely 2.15823 seconds after the launch, it
would continue to travel at a constant velocity of 183.8964 miles per hour.

113
Problem 9
Assume that two planes, A and B, are flying away from San Diego and that their
distances from the San Diego airport are continually monitored. The planes’ distances
from San Diego are shown by the graph given below for a 10 second period of their trip.
Plane A
Plane B
Compare the planes’ speeds 1.5 seconds after the beginning of this period of time.
Intent of Problem 9
The intent of Problem 9 was similar to Problem 7, except this problem was
designed to determine if students, given the graphs of the distances traveled as a function
of time for two planes, could compare the planes’ speeds at a particular moment in time.
This problem extended problem 7 because in Problem 7 one velocity was greater than the
other throughout the entire time interval; thus, the students could solve Problem 7 without
the concept of instantaneous velocity. In order to solve Problem 9, an understanding of
instantaneous velocity was essential.
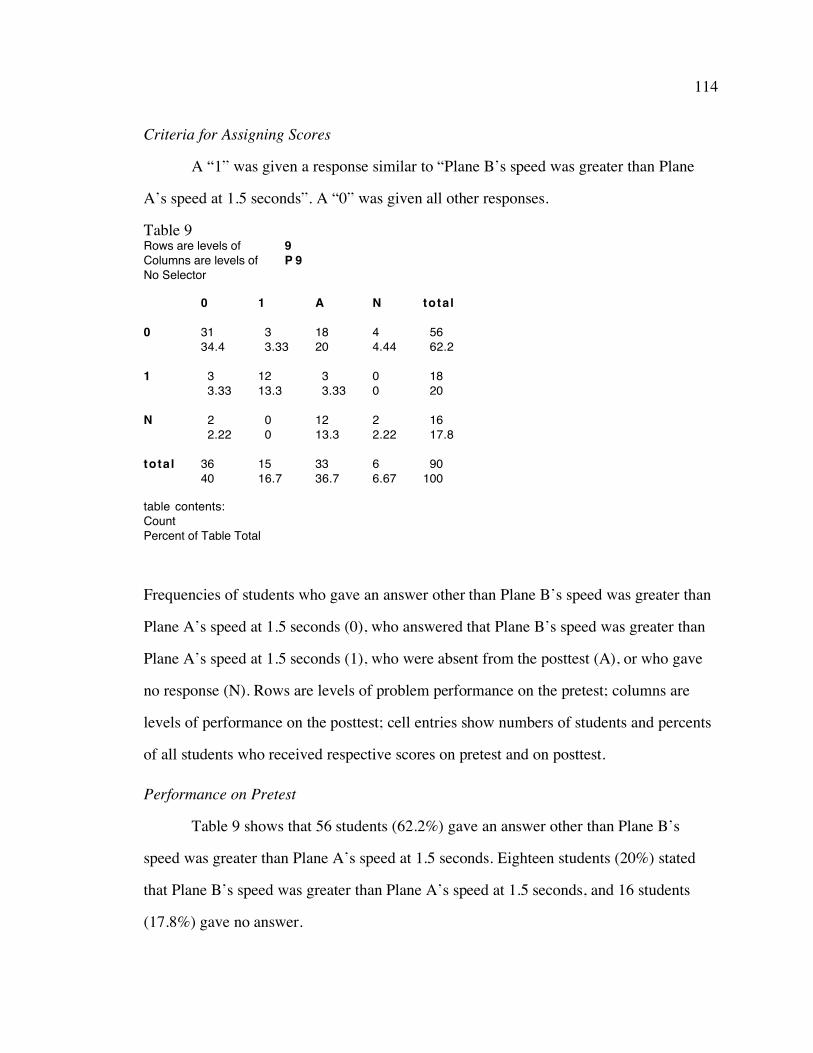
114
Criteria for Assigning Scores
A “1” was given a response similar to “Plane B’s speed was greater than Plane
A’s speed at 1.5 seconds”. A “0” was given all other responses.
Table 9 Rows are levels ofColumns are levels ofNo Selector
9P 9
0
1
N
total
0
3134.4
33.33
22.22
3640
1
33.33
1213.3
00
1516.7
A
1820
33.33
1213.3
3336.7
N
44.44
00
22.22
66.67
total
5662.2
1820
1617.8
90100
table contents:CountPercent of Table Total
Frequencies of students who gave an answer other than Plane B’s speed was greater than
Plane A’s speed at 1.5 seconds (0), who answered that Plane B’s speed was greater than
Plane A’s speed at 1.5 seconds (1), who were absent from the posttest (A), or who gave
no response (N). Rows are levels of problem performance on the pretest; columns are
levels of performance on the posttest; cell entries show numbers of students and percents
of all students who received respective scores on pretest and on posttest.
Performance on Pretest
Table 9 shows that 56 students (62.2%) gave an answer other than Plane B’s
speed was greater than Plane A’s speed at 1.5 seconds. Eighteen students (20%) stated
that Plane B’s speed was greater than Plane A’s speed at 1.5 seconds, and 16 students
(17.8%) gave no answer.
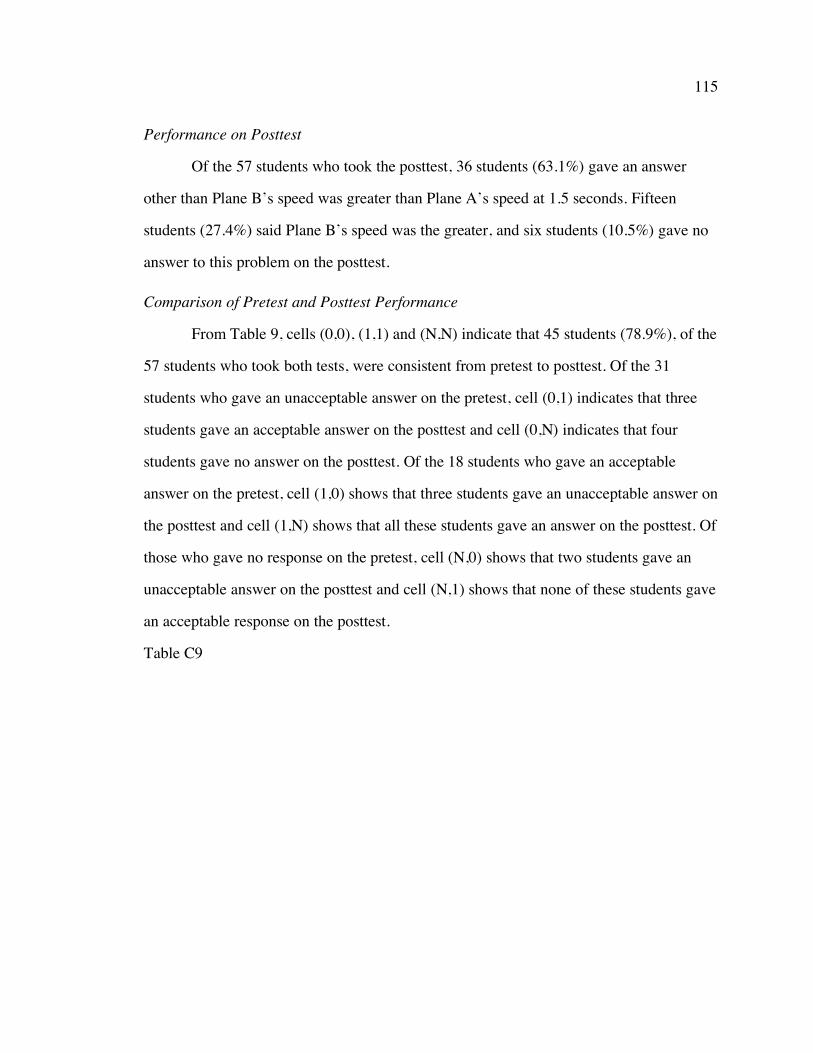
115
Performance on Posttest
Of the 57 students who took the posttest, 36 students (63.1%) gave an answer
other than Plane B’s speed was greater than Plane A’s speed at 1.5 seconds. Fifteen
students (27.4%) said Plane B’s speed was the greater, and six students (10.5%) gave no
answer to this problem on the posttest.
Comparison of Pretest and Posttest Performance
From Table 9, cells (0,0), (1,1) and (N,N) indicate that 45 students (78.9%), of the
57 students who took both tests, were consistent from pretest to posttest. Of the 31
students who gave an unacceptable answer on the pretest, cell (0,1) indicates that three
students gave an acceptable answer on the posttest and cell (0,N) indicates that four
students gave no answer on the posttest. Of the 18 students who gave an acceptable
answer on the pretest, cell (1,0) shows that three students gave an unacceptable answer on
the posttest and cell (1,N) shows that all these students gave an answer on the posttest. Of
those who gave no response on the pretest, cell (N,0) shows that two students gave an
unacceptable answer on the posttest and cell (N,1) shows that none of these students gave
an acceptable response on the posttest.
Table C9

116
Rows are levels ofColumns are levels ofNo Selector
C9PC9
BgrAv
N
averv
cni
jstd
jstgr
total
BgrAv
1424.6
00
35.26
00
00
11.75
1831.6
N
00
00
35.26
00
00
00
35.26
averv
23.51
11.75
1526.3
00
11.75
23.51
2136.8
cni
00
00
11.75
58.77
11.75
00
712.3
jstd
00
00
23.51
00
00
23.51
47.02
jstgr
11.75
00
23.51
00
00
11.75
47.02
total
1729.8
11.75
2645.6
58.77
23.51
610.5
57100
table contents:CountPercent of Table Total
BgrAv Plane B’s velocity was greater than Plane A’s velocity at 1.5 seconds. N No answer. averv Compared the planes average velocities during the interval 0 to 1.5 seconds. cni Could not interpret. jstd Compared only the distances traveled by each plane at 1.5 seconds. jstgr Compared the graphs and ignored the axes. They concluded that Plane A’s speed
was greater than Plane B’s speed at 1.5 seconds since its graph was “higher”.
Categories of Inferred Thought Processes
Table C9 shows that responses fell into six categories based on students’ thought
processes. Of the 57 students who took both tests, 17 students on the pretest and 18
students on the posttest gave the correct response. These students gave several different
reasons for their response, based on their conception of the information in the given
graph. Several students focused only on the graph which represented Plane A’s distance
as a function of time. They indicated that the increase in distance for Plane A during a
small interval of time which included 1.5 seconds was close to zero. They were then able

117
to conclude that Plane A’s speed was close to zero, hence, Plane B’s speed was greater.
Several other students compared the graphs of both planes during a interval of time which
included 1.5 seconds. They concluded that “Plane B is traveling faster than Plane A
because Plane B is covering a greater distance in the same time as Plane A”. Other
students, on both tests also, compared the slopes of the tangents of the graphs at 1.5
seconds. They concluded that since the slope of the tangent for Plane B was greater than
the slope of the tangent for Plane A at 1.5 seconds, Plane B’s speed was greater than
Plane A’s speed at this moment in time.
Of the 57 students that took both tests, five students on the pretest and seven
students on the posttest gave an answer which the investigator could not interpret. For
example, several students gave an answer similar to “How can I, there is no mention of
speed in the graph.” Other students drew a vertical line at 1.5 seconds and stated that the
planes were traveling the same speed at this moment in time.
Six students on the pretest and four on the posttest appeared to only focus on the
graphs and concluded that, since the graph for Plane A was “higher” than the graph for
Plane B, Plane A’s speed was greater at 1.5 seconds. Several of these students stated that
Plane A’s altitude was greater than Plane B’s since Plane A’s graph was higher. Twenty-
six students on the pretest and 21 students on the posttest calculated the average speed of
the planes from 0 to 1.5 seconds. From their calculations, they concluded that Plane A’s
speed was greater than Plane B’s speed at 1.5 seconds. Two students on the pretest and
four students on the posttest did not give an answer regarding the speeds of the planes but
only discussed the fact that Plane A had traveled further than Plane B during the time
interval from 0 to 1.5 seconds.

118
Summary of Interviews
During the six interviews, two students, after they were asked to determine which
plane was traveling faster at precisely 1.5 seconds, calculated the average speed of both
planes during the time interval from 0 to 1.5 seconds and concluded that Plane A had the
higher speed. When they were asked why they calculated the average speed of the planes
they replied that “we wanted speed which is distance over time”. They appeared not to
understand the distinction between the concept of average velocity and instantaneous
velocity in this problem.
Another student was asked if she had seen problems similar to this problem in
Math 150 and she replied “not like this”. The investigator asked this question because
during the interviews, many students did not appear to understand the concepts involved
in this problem, that is, they were to compare the instantaneous velocities, not average
velocities, of the two planes. Obviously this student had studied instantaneous rate of
change and average rate of change in developing the concept of the derivative in Math
150 yet, as her reply appeared to indicate, she could not transfer what she had learned to
this problem.
A fourth student was asked what the slope of the tangent line to each graph at 1.5
seconds represented. She replied that she “had studied this at the very start of Math 150
but its not coming back”. She did not comment on this question any further.
Another student, at first, appeared to ignore the axes of the given graph which
indicated that this graph represented the planes’ distances as a function of time. He
appeared to think the graph represented velocity as a function of time when he stated that
“about 1.5 seconds, Plane A’s velocity remains almost constant but is still greater than
Plane B’s velocity.” He then stated that “You could take the derivative, but I’m looking
at the overall graph.” When asked to explain his last statement, he seemed to indicate that

119
taking the derivative of the given graph left the graph unchanged but changed the axes
from distance as a function of time to velocity as a function of time. He was then told to
compare the distances the planes traveled during a small interval of time which included
1.5 seconds. From this, he was able to give the correct answer and explanation; Plane B’s
speed was greater than Plane A’s speed at 1.5 seconds since Plane B traveled a greater
distance than Plane A during this small interval of time.
During the interview with the sixth student, he compared the slopes of the slopes
of the tangents of the graphs at 1.5 seconds which he stated represented the speeds of the
planes at 1.5 seconds and concluded that Plane B’s speed was greater than Plane A’s
speed at that moment in time.
Problem 10a
Water flowed into a tank at a constant rate with respect to time. The water’s volume was
measured (in gallons) after flowing for 5 seconds and again after flowing for 9 seconds.
This information is given in a graph, below.
(a) How much water was in the tank when water began flowing into it?
Intent of Problem 10a
The intent of Problem 10a was to determine if students, given the volumes of
water in a tank at two moments in time, could use the fact that water was flowing in at a

120
constant rate in order to calculate the water’s volume at another moment in time (in this
case at t = 0 seconds). In this type of problem, students often assume that the initial
volume of water in the tank is zero since most textbook problems encourage this
assumption. This problem explores their ability to solve a problem having an initial
volume that is not zero.
Criteria for Assigning Scores
A “1” was assigned only to an answer equal to 7.5 gallons, the volume of water in
the tank when water began flowing into the tank. A “0” was assigned to all other answers,
even though the student may have demonstrated a correct thought process in solving
Problem 10a. As will be discussed, although a student may have possessed a correct
thought process he may not have been able to arrive at the correct answer or any answer
at all.
Table 10a Rows are levels ofColumns are levels ofNo Selector
10aP10a
0
1
N
total
0
2527.8
44.44
55.56
3437.8
1
11.11
1112.2
11.11
1314.4
A
1516.7
1112.2
77.78
3336.7
N
66.67
33.33
11.11
1011.1
total
4752.2
2932.2
1415.6
90100
table contents:CountPercent of Table Total
Frequencies of students who gave an answer other than 7.5 gallons (0), who gave the
answer 7.5 gallons (1), who were absent from the posttest (A), or who gave no response

121
(N). Rows are levels of problem performance on the pretest; columns are levels of
performance on the posttest; cell entries show numbers of students and percents of all
students who received respective scores on pretest and on posttest.
Performance on Pretest
Table 10a shows that 47 students (52.2%) gave an answer other than 7.5 gallons,
29 students (32.2%) gave the answer 7.5 gallons and 14 students (15.6%) gave no answer
to Problem 10a on the pretest.
Performance on Posttest
Of the 57 students that took the posttest, 34 students (59.6%) gave an answer
other than 7.5 gallons, 13 students (22.8%) gave the answer 7.5 gallons and 10 students
(17.5%) gave no answer to Problem 10a on the posttest.
Comparison of Pretest and Posttest Performance
Examining cells (0,0), (1,1) and (N,N) of Table 10a, we see that, of the 57
students who took both tests, 37 students were consistent from pretest to posttest. Of the
32 students who gave an answer other than 7.5 gallons on the pretest, cell (0,1) indicates
that one student gave the answer 7.5 gallons on the posttest and cell (0,N) indicates that
six students gave no answer on the posttest. Of the 18 students who gave the answer 7.5
gallons on the pretest, cell (1,0) indicates that four students gave an answer other than 7.5
gallons on the posttest and cell (1,N) indicates that three students gave no answer on the
posttest. Of the 14 students who gave no answer on the pretest, cell (N,0) indicates that
five students gave an answer other than 7.5 gallons on the posttest and cell (N,1)
indicates that one student gave the answer 7.5 gallons on the posttest.
Table C10a

122
Rows are levels ofColumns are levels ofNo Selector
C10aPC10a
N
cni
nwk
st ln
zero
total
N
00
11.75
11.75
23.51
00
47.02
cni
35.26
23.51
23.51
47.02
00
1119.3
nwk
00
23.51
23.51
35.26
35.26
1017.5
st ln
11.75
00
11.75
1424.6
35.26
1933.3
zero
11.75
11.75
11.75
00
1017.5
1322.8
total
58.77
610.5
712.3
2340.4
1628.1
57100
table contents:CountPercent of Table Total
N No answer.
cni Could not interpret.
nwk Stated that there was not enough information to answer the question.
stln Drew a straight line through the points and calculated the volume of water at 0
seconds to be 7.5 gallons.
zero Zero gallons. They assumed the tank was empty when water began flowing into
it.
Categories of Inferred Thought Processes
Responses for Problem 10a fell into five categories based on students’ thought
processes. On both pretest and posttest, almost all the students understood that the
problem was asking for the volume of water in the tank when water began flowing into it,
at time t = 0 seconds. Table C10a shows that 23 students on the pretest and 19 students
123
on the posttest calculated the volume correctly but thought about the problem in basically
two different ways. One way was to draw a line through the two points on the graph,
since the water flowed into the tank at a constant rate, find the equation for this line and
determine the y-intercept. The second way that students thought about this problem was
to consider the change in volume as compared to the change in time from the point (5,
15) to the point (9, 21). They determined that the volume increased by 6 gallons when the
time increased by 4 seconds, that is, the rate of change of volume with respect to time
was 1.5 gallons per second. They then worked “backwards” and calculated the volume at
t = 0 seconds. Several of the students, who considered the rate of change of volume with
respect to time, however, were unable to realize that (6 gallons)/(4 seconds) = 1.5
gallons/second. Hence, they were only able to determine that at 1 second there was 9
gallons of water in the tank. They arrived at the point (1, 9) by working “backwards” 4
seconds and 6 gallons from the point (5,15). Perhaps they could not determine the amount
of water in the tank at 0 seconds since they only thought in terms of the fixed increment
“for every 4 second change there is a 6 gallon change in the volume of water in the tank.”
These students had used a correct approach but could not determine the answer. It is
interesting to note that almost all the students who used a correct thought process in
solving this problem worked backwards from the point (5,15) after determining that the
rate of flow was 1.5 gallons/second rather than calculating the y-intercept from the
equation of the line through the two points. Also, a few students, after finding the rate of
flow, 1.5 gallons/second, did not work “backwards” from the point (5,15) but rather
“forwards” from the point with first entry 0 seconds. Perhaps they asked themselves how
much water would be in the tank at time t = 0 seconds if after 5 seconds, during which
time 7.5 gallons = (1.5 gallons/sec)(5 sec) of water was added to the tank, there would be
15 gallons of water in the tank.
124
Sixteen students on the pretest and 13 students on the posttest assumed that the
tank was empty when water began flowing into the tank. Hence, they answered that the
tank had 0 gallons in it when water began flowing into the tank. However, a few students,
although they had drawn a curved line that passed through both points and the origin,
indicating that the tank was empty at the start, calculated the correct answer using one of
the methods discussed above and were included in the straight line category. The
investigator assumed they realized that the line they had drawn was incorrect, drawing
the line through the origin because of their past experiences.
Five students on the pretest and four students on the posttest gave no answer.
Seven students on the pretest and seven students on the posttest stated that there was not
enough information to answer the question. Six students on the pretest and 11 students on
the posttest gave answers other than 7.5 gallons or 0 gallons with no calculations or
explanation, hence, no inferred thought process could be determined for these students.
Summary of Interviews
During the six interviews, two students assumed the tank was empty when water
began flowing into it and answered 0 gallons to Problem 10a. Another student answered
0 gallons to this problem because he interpreted the phrase “water flowed into a tank at a
constant rate with respect to time” meant that, although the volume of water increased as
time increased, at 0 seconds the volume of water in the tank also had to be 0 gallons. That
is, he thought “water flowed into a tank at a constant rate with respect to time” could be
expressed as the proportional relationship g = kt where g represents the gallons of water
in the tank, k is a constant, and t was time.
During the interview with another student, she first drew a line through the points
stating that “it” was constant. She then noticed that at 0 seconds the y-intercept was not 0
gallons, indicating that there was some water in the tank when water began flowing into

125
it. To calculate the original amount of water in the tank at 0 seconds, she first calculated
the rate of flow. She stated that in 4 seconds the volume increased 6 gallons so the rate of
flow was 1.5 gallons/second. She then multiplied 1.5 gallons/second by 5 seconds to
determine that 7.5 gallons of water had been added to the tank during the first 5 seconds.
She noticed that there was 15 gallons in the tank at 5 seconds and stated that “you must
have had 7.5 gallons to begin with.”
Another student derived the equation of the line (using the point-slope form)
through the two given points from which he substituted 0 seconds for the time and
calculated the y-intercept of the line. He understood that this y-intercept represented the
amount of water in the tank at 0 seconds.
Another student had written “9x + k = 21 and 5x + k = 15” in solving this
problem on his pretest. He explained during the interview that k was the initial amount of
water in the tank and x was the rate at which water was flowing into the tank (the rate of
change of volume of water with respect to time). He stated that the rate at which water
flowed into the tank, x, was 3/2 gallons per second and then he solved for k, the initial
amount of water in the tank. On his posttest he had written that the rate was (9-5)/(21-15)
= 4/6 = 2/3 gal/sec but realized his mistake during the interview.
Another student during the interview went “backwards” 4 seconds and 6 gallons
from the point (5,15) and stated that at 1 second there would be 9 gallons in the tank.
However, he could not determine how many gallons were in the tank at 0 seconds,
although he understood that this was the solution to the problem. He never realized that
since the rate of flow was constant, if he were to go “backwards” only 1 second (1/4 of 4
seconds) from the point (1, 9) he would go “backwards” 1.5 gallons (1/6 of 6 gallons) to
the point (0, 7.5). Hence, there would be 7.5 gallons of water in the tank when water
began flowing into it.

126
Problem 10b
Water flowed into a tank at a constant rate with respect to time. The water’s volume was
measured (in gallons) after flowing for 5 seconds and again after flowing for 9 seconds.
This information is given in a graph, below.
(b) At what rate did water flow into the tank?
Intent of Problem 10b
The intent of Problem 10b was to determine if students could solve for the rate of
flow of water into the tank since they may have used a highly calculational approach to
solve Problem 10a. For example, a student could calculate the slope, m, from the two
given points as 3/2. Then this slope and the values (x, y) from one of the given points
could be substituted into the equation y = mx + b to solve for b, the y-intercept, at t = 0
seconds. In Problem 10b the student must understand what these calculated values
represent within the context of this real life situation. Alternatively, students could use a
non-calculational approach by recognizing that water flowed in at a constant rate of 6
gallons every 4 seconds (by focusing on the 4 second interval t = 5 to t = 9 seconds).
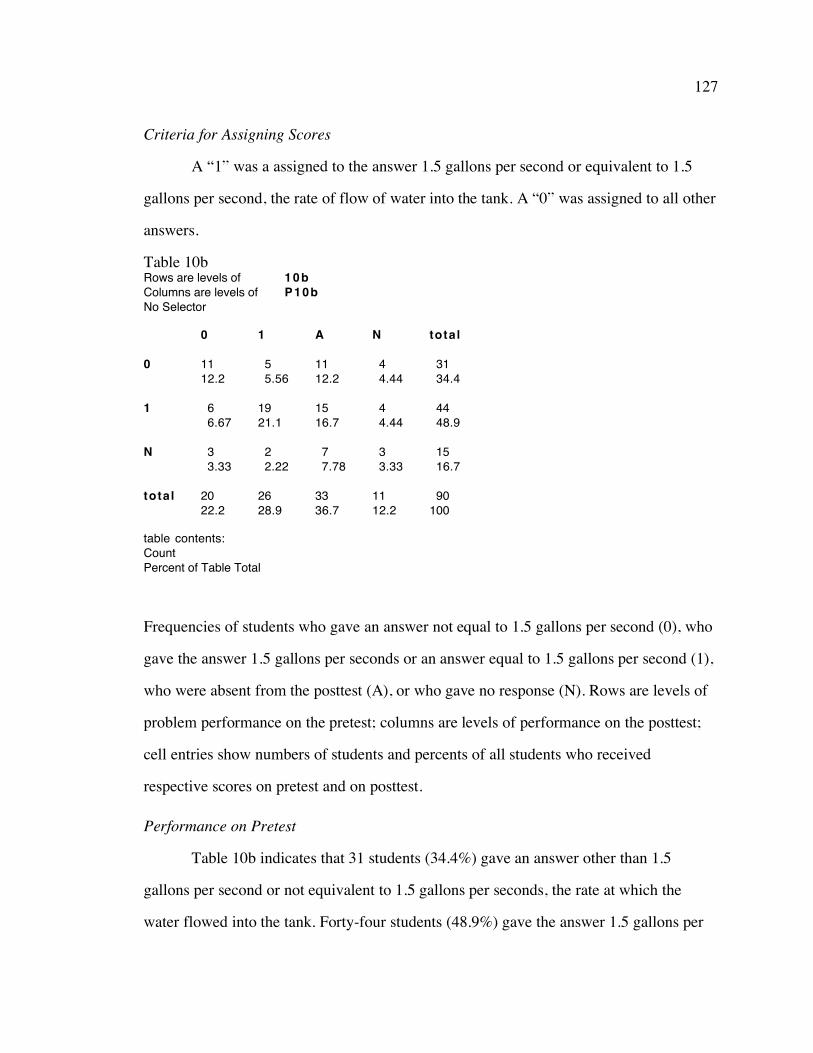
127
Criteria for Assigning Scores
A “1” was a assigned to the answer 1.5 gallons per second or equivalent to 1.5
gallons per second, the rate of flow of water into the tank. A “0” was assigned to all other
answers.
Table 10b Rows are levels ofColumns are levels ofNo Selector
10bP10b
0
1
N
total
0
1112.2
66.67
33.33
2022.2
1
55.56
1921.1
22.22
2628.9
A
1112.2
1516.7
77.78
3336.7
N
44.44
44.44
33.33
1112.2
total
3134.4
4448.9
1516.7
90100
table contents:CountPercent of Table Total
Frequencies of students who gave an answer not equal to 1.5 gallons per second (0), who
gave the answer 1.5 gallons per seconds or an answer equal to 1.5 gallons per second (1),
who were absent from the posttest (A), or who gave no response (N). Rows are levels of
problem performance on the pretest; columns are levels of performance on the posttest;
cell entries show numbers of students and percents of all students who received
respective scores on pretest and on posttest.
Performance on Pretest
Table 10b indicates that 31 students (34.4%) gave an answer other than 1.5
gallons per second or not equivalent to 1.5 gallons per seconds, the rate at which the
water flowed into the tank. Forty-four students (48.9%) gave the answer 1.5 gallons per
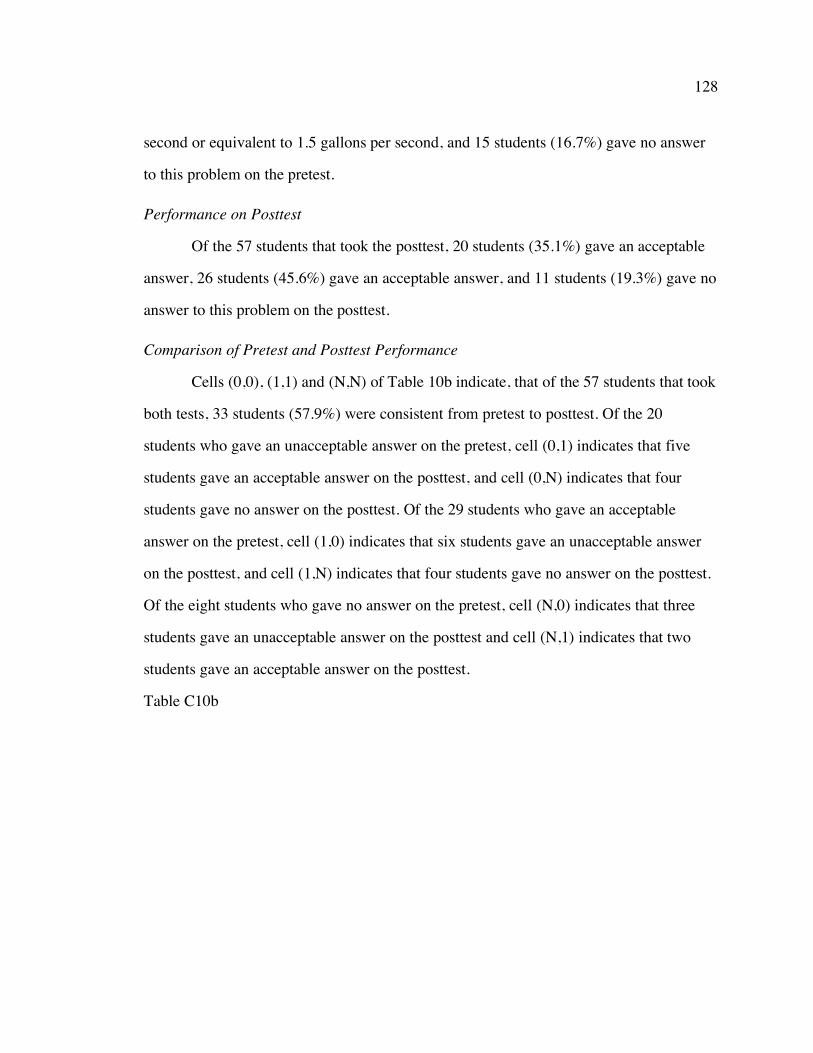
128
second or equivalent to 1.5 gallons per second, and 15 students (16.7%) gave no answer
to this problem on the pretest.
Performance on Posttest
Of the 57 students that took the posttest, 20 students (35.1%) gave an acceptable
answer, 26 students (45.6%) gave an acceptable answer, and 11 students (19.3%) gave no
answer to this problem on the posttest.
Comparison of Pretest and Posttest Performance
Cells (0,0), (1,1) and (N,N) of Table 10b indicate, that of the 57 students that took
both tests, 33 students (57.9%) were consistent from pretest to posttest. Of the 20
students who gave an unacceptable answer on the pretest, cell (0,1) indicates that five
students gave an acceptable answer on the posttest, and cell (0,N) indicates that four
students gave no answer on the posttest. Of the 29 students who gave an acceptable
answer on the pretest, cell (1,0) indicates that six students gave an unacceptable answer
on the posttest, and cell (1,N) indicates that four students gave no answer on the posttest.
Of the eight students who gave no answer on the pretest, cell (N,0) indicates that three
students gave an unacceptable answer on the posttest and cell (N,1) indicates that two
students gave an acceptable answer on the posttest.
Table C10b
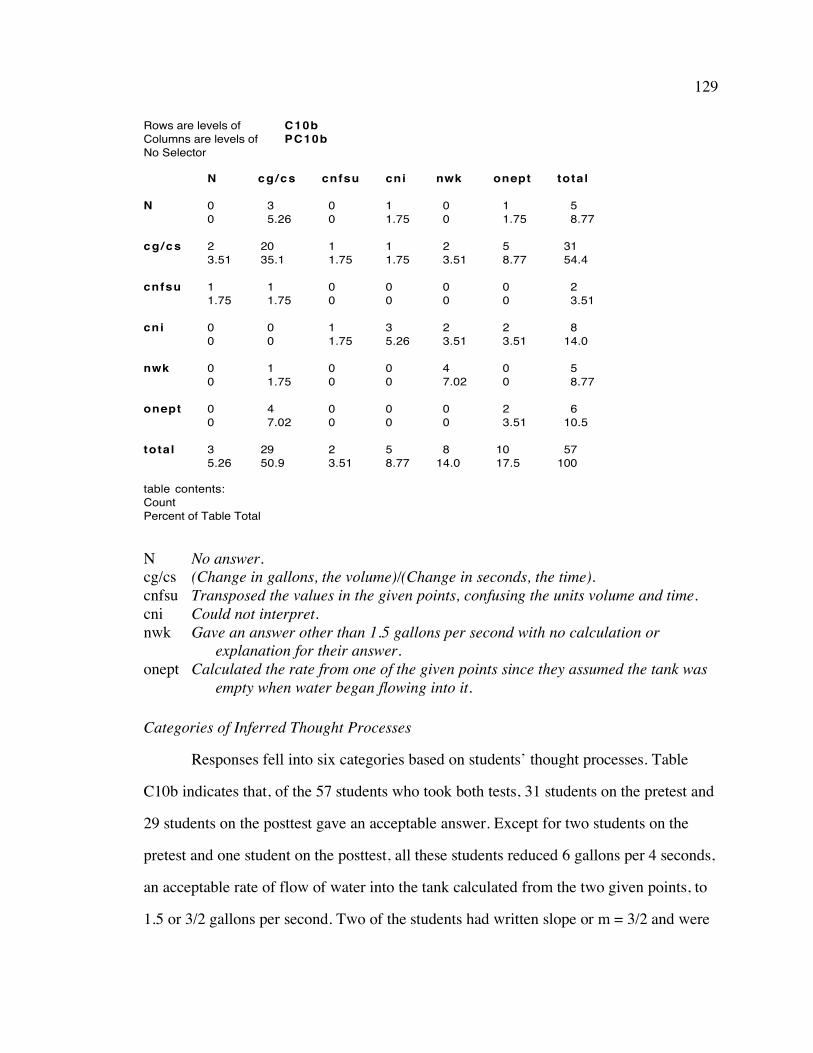
129
Rows are levels ofColumns are levels ofNo Selector
C10bPC10b
N
cg /cs
cnfsu
cni
nwk
onept
total
N
00
23.51
11.75
00
00
00
35.26
cg /cs
35.26
2035.1
11.75
00
11.75
47.02
2950.9
cnfsu
00
11.75
00
11.75
00
00
23.51
cni
11.75
11.75
00
35.26
00
00
58.77
nwk
00
23.51
00
23.51
47.02
00
814.0
onept
11.75
58.77
00
23.51
00
23.51
1017.5
total
58.77
3154.4
23.51
814.0
58.77
610.5
57100
table contents:CountPercent of Table Total
N No answer. cg/cs (Change in gallons, the volume)/(Change in seconds, the time). cnfsu Transposed the values in the given points, confusing the units volume and time. cni Could not interpret. nwk Gave an answer other than 1.5 gallons per second with no calculation or
explanation for their answer. onept Calculated the rate from one of the given points since they assumed the tank was
empty when water began flowing into it.
Categories of Inferred Thought Processes
Responses fell into six categories based on students’ thought processes. Table
C10b indicates that, of the 57 students who took both tests, 31 students on the pretest and
29 students on the posttest gave an acceptable answer. Except for two students on the
pretest and one student on the posttest, all these students reduced 6 gallons per 4 seconds,
an acceptable rate of flow of water into the tank calculated from the two given points, to
1.5 or 3/2 gallons per second. Two of the students had written slope or m = 3/2 and were

130
given credit since it was assumed that they understood the slope represented the rate of
flow, which was the quantity asked for in the problem.
Six students on the pretest and 10 students on the posttest stated that the rate of
flow was 3 gallons per second calculated from the point (5,15) or 7/3 gallons per second
calculated from the point (9,21) and perhaps assumed the tank was empty when water
began flowing into the tank. One of these students stated that the rate of flow was 3
gallons per second for the first 5 seconds then 7/3 gallons per second after the first 5
seconds. Two other students averaged 3 gallons per second and 7/3 gallons per second,
perhaps trying to calculate a constant rate.
Five students on the pretest and three students on the posttest gave no answer.
Eight students on the pretest and five students on the posttest gave an answer with an
explanation which the investigator could not interpret. Five students on the pretest and
eight students on the posttest gave an answer with no calculation or explanation for their
answer, hence, it was difficult to determine their thought processes. Two students on both
tests transposed the values in the given points in their calculations, confusing time and
volume, and stated that the rate of flow of water was 2/3 gallons per second.
Summary of Interviews
During the six interviews, one student, who had used the point-slope form on both
tests to find the y-intercept, had also calculated the slope of the line through the two
given points. He stated that “the slope, 3/2, was the rate of flow, 3 gallons every 2
seconds, since the top number is in gallons and the bottom number is in seconds.” He had
used the units, gallons and seconds, in this problem to help him understand and explain
how the slope of the line through the given points represented the rate of flow of water
into the tank.
131
Another student, rather than trying to understand what the given values
represented within this real life situation, tried a highly calculational approach by trying
to recall some equation which she could use to help her solve this problem. She began by
talking about the slope of the line through the given points but then stated “I’m not sure if
that would give you the rate.” Apparently, this student and several other students can
calculate the slope of the line through the given points as well as the derivative of certain
functions by following certain algorithms, but they do not have a clear understanding of
what these calculations represent.
Another student, during her interview and on both tests, wrote the only equation
she knew which involved rate; “distance = rate x time” which led her to “rate =
distance/time”. She stated that she then substituted “volume” for “distance” in her
equation since volume and time were the given quantities in this problem. She calculated
the difference between the values for the volume and the values for the time, again since
they were given in the problem, and substituted these values into her equation in order to
solve for the rate. This highly calculational approach led to a correct answer, however, it
appeared that she had little understanding of the real life situation as presented in this
problem. She did not discuss the situation as presented in this problem but simply
substituted values into the only equation she knew which involved rate. The remaining
three students, who were interviewed, had discussed the answer to this problem during
their discussion of Problem 10a.
Problem 10c
Water flowed into a tank at a constant rate with respect to time. The water’s volume was
measured (in gallons) after flowing for 5 seconds and again after flowing for 9 seconds.
This information is given in a graph, below.

132
(c) Write a formula which gives the amount of water in the tank after water has flowed
for t seconds.
Intent of Problem 10c
The intent of Problem 10c was to determine if students could combine
information from Problem 10a for the initial amount of water in the tank with information
from Problem 10b for the rate at which water flowed into the tank in order to represent
the volume of water in the tank at any given time. They would need to recognize that the
formula would be a linear equation. Again, students would be required to relate their
calculations to this specific context.
Criteria for Assigning Scores
A “1” was assigned any answer equivalent to v(t) = 7.5 + 1.5t where t represents
time, in seconds, and v(t) is the volume of water in the tank as a function of time, in
gallons. A “0” was assigned to all other answers.
Table 10c
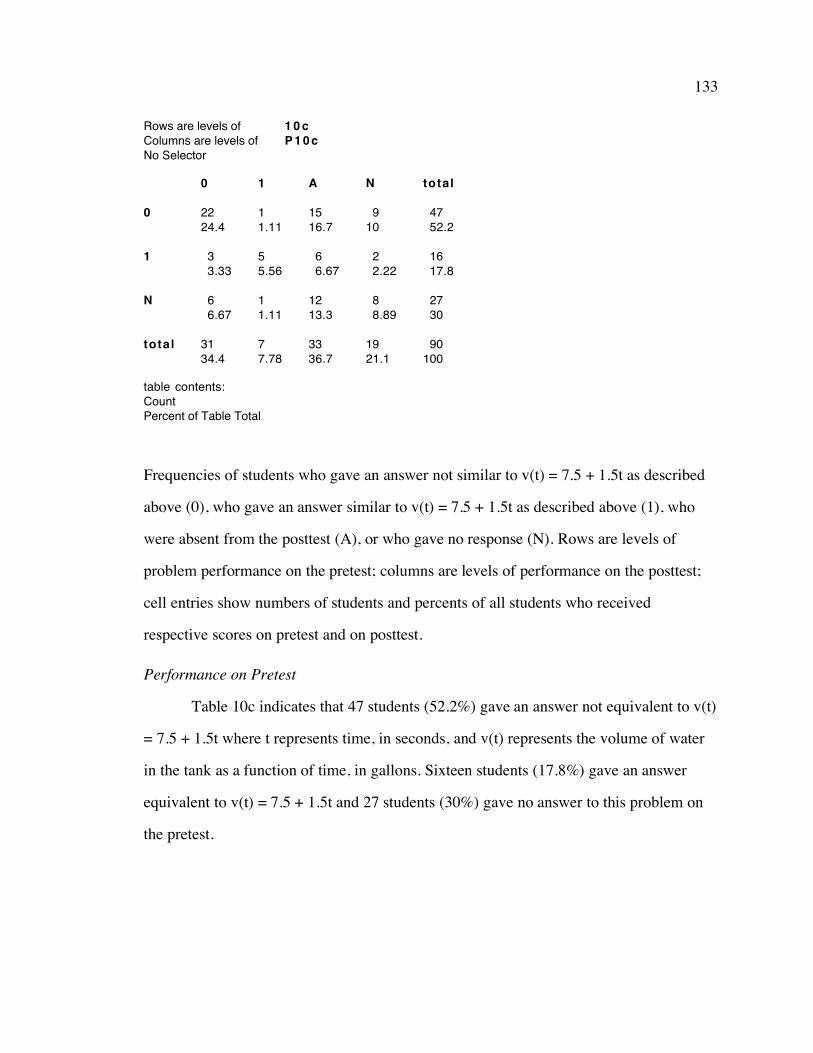
133
Rows are levels ofColumns are levels ofNo Selector
10cP10c
0
1
N
total
0
2224.4
33.33
66.67
3134.4
1
11.11
55.56
11.11
77.78
A
1516.7
66.67
1213.3
3336.7
N
910
22.22
88.89
1921.1
total
4752.2
1617.8
2730
90100
table contents:CountPercent of Table Total
Frequencies of students who gave an answer not similar to v(t) = 7.5 + 1.5t as described
above (0), who gave an answer similar to v(t) = 7.5 + 1.5t as described above (1), who
were absent from the posttest (A), or who gave no response (N). Rows are levels of
problem performance on the pretest; columns are levels of performance on the posttest;
cell entries show numbers of students and percents of all students who received
respective scores on pretest and on posttest.
Performance on Pretest
Table 10c indicates that 47 students (52.2%) gave an answer not equivalent to v(t)
= 7.5 + 1.5t where t represents time, in seconds, and v(t) represents the volume of water
in the tank as a function of time, in gallons. Sixteen students (17.8%) gave an answer
equivalent to v(t) = 7.5 + 1.5t and 27 students (30%) gave no answer to this problem on
the pretest.

134
Performance on Posttest
Of the 57 students who took both tests, Table 10c indicates that 31 students
(54.4%) gave an answer not equivalent to v(t) = 7.5 + 1.5t . Seven students (12.3%) gave
an answer equivalent to v(t) = 7.5 + 1.5t, and 19 students (33.3%) gave no answer to this
problem on the posttest.
Comparison of Pretest and Posttest Performance
Cells (0,0), (1,1) and (N,N) of Table 10c indicate, that of the 57 students that took
both tests, 35 students (61.4%) were consistent from pretest to posttest. Of the 32
students who gave an answer not equivalent to v(t) = 7.5 + 1.5t on the pretest, cell (0,1)
indicates that one student gave an answer equivalent to v(t) = 7.5 + 1.5t on the posttest,
and cell (0,N) indicates that nine students gave no answer on the posttest. Of the 10
students who gave an answer equivalent to v(t) = 7.5 + 1.5t on the pretest, cell (1,0)
indicates that three students gave an incorrect answer on the posttest, and cell (1,N)
indicates that two students gave no answer on the posttest. Of the 15 students who gave
no answer on the pretest, cell (N,0) indicates that six students gave an incorrect answer
on the posttest and cell (N,1) indicates that one student gave an answer equivalent to v(t)
= 7.5 + 1.5t on the posttest.
Table C10c
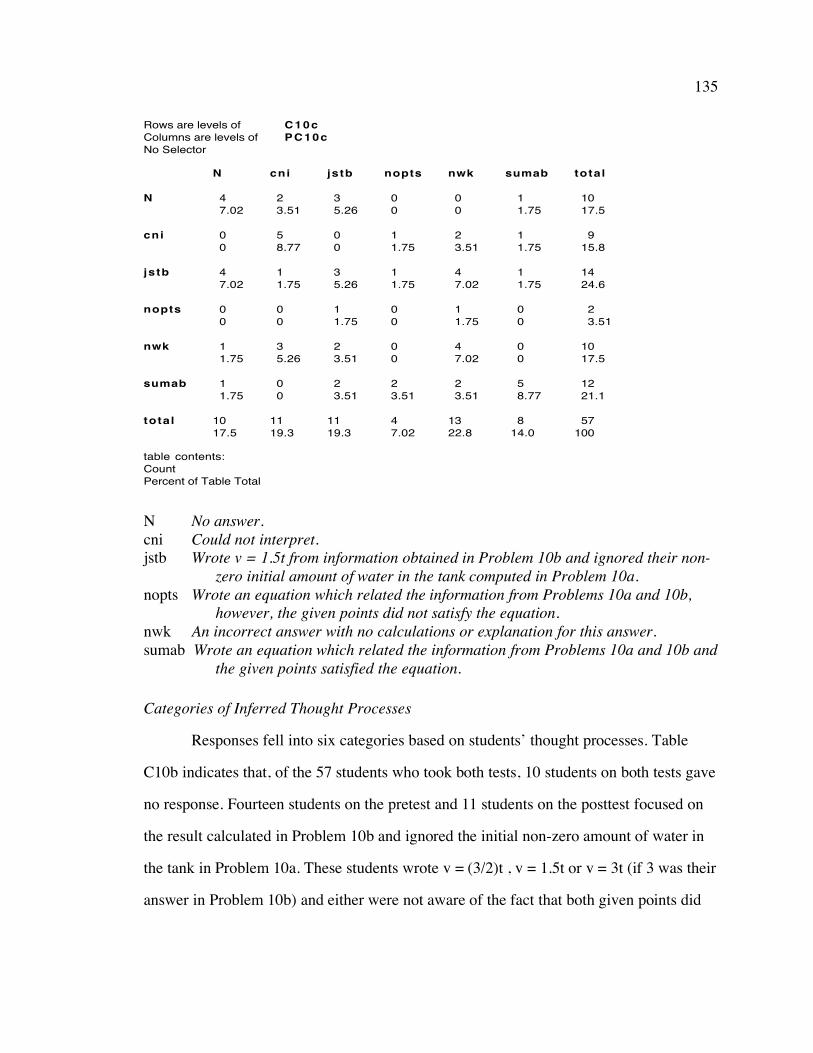
135
Rows are levels ofColumns are levels ofNo Selector
C10cPC10c
N
cni
jstb
nopts
nwk
sumab
total
N
47.02
00
47.02
00
11.75
11.75
1017.5
cni
23.51
58.77
11.75
00
35.26
00
1119.3
jstb
35.26
00
35.26
11.75
23.51
23.51
1119.3
nopts
00
11.75
11.75
00
00
23.51
47.02
nwk
00
23.51
47.02
11.75
47.02
23.51
1322.8
sumab
11.75
11.75
11.75
00
00
58.77
814.0
total
1017.5
915.8
1424.6
23.51
1017.5
1221.1
57100
table contents:CountPercent of Table Total
N No answer. cni Could not interpret. jstb Wrote v = 1.5t from information obtained in Problem 10b and ignored their non-
zero initial amount of water in the tank computed in Problem 10a. nopts Wrote an equation which related the information from Problems 10a and 10b,
however, the given points did not satisfy the equation. nwk An incorrect answer with no calculations or explanation for this answer. sumab Wrote an equation which related the information from Problems 10a and 10b and
the given points satisfied the equation.
Categories of Inferred Thought Processes
Responses fell into six categories based on students’ thought processes. Table
C10b indicates that, of the 57 students who took both tests, 10 students on both tests gave
no response. Fourteen students on the pretest and 11 students on the posttest focused on
the result calculated in Problem 10b and ignored the initial non-zero amount of water in
the tank in Problem 10a. These students wrote v = (3/2)t , v = 1.5t or v = 3t (if 3 was their
answer in Problem 10b) and either were not aware of the fact that both given points did
136
not satisfy their equation or if they were, couldn’t write an equation that would satisfy
both given points. One of these students wrote “volume = mt” and ignored the rate of
flow, 3/2 gallons per second, which he calculated in Problem 10b. Perhaps he did not
understand that the rate of flow found in Problem 10b, 3/2 gallons per second, was the
same as the slope, m, of the line through the points on the graph. Recall the opposite
scenario, during an interview with a student regarding her answer to Problem 10b, when
she stated “I’m not sure if that (the slope m) would give you the rate”. The responses
from these students seem to indicate that there is little connection between the constant
rate of flow of water given in the real life context of the problem and the slope of the line
between the two given points.
Twelve students on the pretest and eight students on the posttest gave a correct
equation which combined the information in Problems 10a and 10b and the given points
satisfied this equation. They appeared to understand that 7.5 gallons, the initial amount of
water in the tank, had to be added to 1.5t, the constant rate at which water flowed into the
tank multiplied by the time t. However, although two students on the pretest and four
students on the posttest understood that the equation for Problem 10c involved combining
information from their responses to Problems 10a and 10b, due to the fact that one or
both of their answers to Problems 10a and 10b were incorrect, the given points did not
satisfy their equation. These students perhaps were also either not aware of the fact that
both given points did not satisfy the equation or if they were, couldn’t write an equation
that would satisfy both given points.
Ten students on the pretest and 13 students on the posttest wrote equations but
gave no explanation for their answer. For example, students wrote “t = rv”, “f(t) = t/t^2”,
“t + st = volume”, “w = v/t”, “3x/2y”, “v(t) = ve^(kt)”, or “v= d/t”. The investigator
assumed that in the last example, “v = d/t”, (usually an abbreviation for velocity =

137
distance/time), the student intended the “v” to represent the volume of water in the tank,
rather than velocity. Three of these students wrote “rate = (change in volume)/(change in
time)” which they may have learned from solving previous problems but this was the
answer to Problem 10b, not the answer to Problem 10c. One other student used a highly
calculational approach, the point slope form, to find the equation of the line through the
two given points, however, his answer to Problem 10b, the rate of flow of water into the
tank, was 5 seconds. Perhaps his understanding of rate was very limited, as seen by his
answer to Problem 10b, although he was able to solve this problem. Only on the posttest
do we see answers involving the derivative. One student wrote “water in tank = dv/dt”
and another student wrote “dx/dt(t^2) + dt/dx(v^3) = 1”.
Summary of Interviews
During the six interviews, one student stated that she was “... not sure what
formula to use”. She proceeded to answer the question using the point-slope form of the
line through the two given points and not in terms of the rate which she had calculated in
Problem 10b or the initial amount of water in the tank calculated in Problem 10a.
Another student, almost immediately upon reading Problem 10c, gave as her
answer “7.5 gallons + 1.5t gal/sec = amount of water after t”. She explained that the sum
of initial amount of water and the rate of flow of water multiplied by the time t gave the
volume of water in the tank at time t. She seemed to have a clear understanding of the
real life situation presented in Problems 10a, 10b, and 10c and was able to then answer
these problems correctly. She may have had a clear understanding of these problems
because they involved a constant rate and the rate was with respect to time, with which
most students are familiar.
Two other students had already answered this problem during their discussion of
Problem 10a. One of these students stated that he had learned to solve these types of

138
problems prior to his enrollment in first semester calculus. The remaining two students
interviewed could not write the equation that gave the amount of water in the tank at time
t either from the information they obtained in solving Problems 10a and 10b nor from
their attempt to use the point-slope form of the line through two given points. The
investigator informed one of these two students that the answer was in the form y = mx
+b, where x represented the time t and y represented the volume of water in the tank at
time t. The student then, using the point slope form of the line and the two given points,
calculated the slope m and the y-intercept b. After stating that the equation was “y = 3/2 x
+ 7.5” he was not able to relate the 3/2 in his equation to the 3/2 calculated in Problem
10b (one was slope, the other was the rate of flow of water into the tank). He was also not
able to relate the 7.5 in his equation to the 7.5 calculated in Problem 10a (one was a y-
intercept, the other was the initial amount of water in the tank). He could not relate his
calculations in Problem 10c to the real life context of the problem, although the question
specifically refers to the real life context of the problem. The other student, who also
could not solve this problem briefly discussed what the derivative meant to him. He
stated that “the derivative is the tangent to a curve at a point which is the instantaneous
velocity at that point”. He did not state that the derivative was the “slope” of the tangent
to a curve at a point nor that the derivative was the instantaneous “rate of change” at a
point (instead saying the derivative was an instantaneous velocity).
Problem 11
A “pitching machine” is a machine that shoots baseballs to simulate a baseball pitcher.
Patrick Henry’s pitching machine shoots baseballs at a speed of 90 ft/sec, and it is set to
shoot balls every 2 seconds. One day the machine was loaded with “gravity resistant”
baseballs - they don’t fall to the ground, they just go in a straight line at 90 ft/sec - firing
one every 2 seconds. The machine shot gravity resistant balls at Jose, the center fielder,
139
while he ran straight at the machine at a speed of 10 ft/sec. He caught each ball fired at
him, and then dropped it as he continued running. Jose’s coach thought that the time
intervals between catches should get smaller as Jose got closer to the machine, since
successive balls had smaller distances to travel. Jose’s father thought that Jose should
catch one ball every 2 seconds, since that is how rapidly the machine fired them. What is
your opinion? Explain.
Intent of Problem 11
The intent of Problem 11 was to determine if students could solve a problem
which involved two constant, opposing rates. One correct method of reasoning would be
to recognize that if Jose was not moving, he would catch a baseball every two seconds
regardless of his distance from the pitching machine. While moving towards the pitching
machine at a constant velocity, the time interval between catches is less than 2 seconds
(as long as he continues to move towards the pitching machine). His running towards the
machine at 10 ft/sec is equivalent to his standing still with the baseball traveling towards
him at 100 ft/sec (instead of 90 ft/sec). Thus, the net effect is that the time interval
between catches is constant, but less than 2 seconds. To correctly solve this problem, the
student needed to think about the effect that the two constant (but opposing) velocities
had on each other.
Criteria for Assigning Scores Performance on Pretest
A “1” was assigned to any answer which suggested that the student was able to
determine that the interval between catches was constant but less than 2 seconds. The
student did not need to calculate the constant time interval between catches, which was (2
sec)(90 ft/sec)/(90 ft/sec + 10 ft/sec) = 1.8 seconds, in order to receive a “1” for his
answer. A “0” was assigned to all other answers.
Table 11
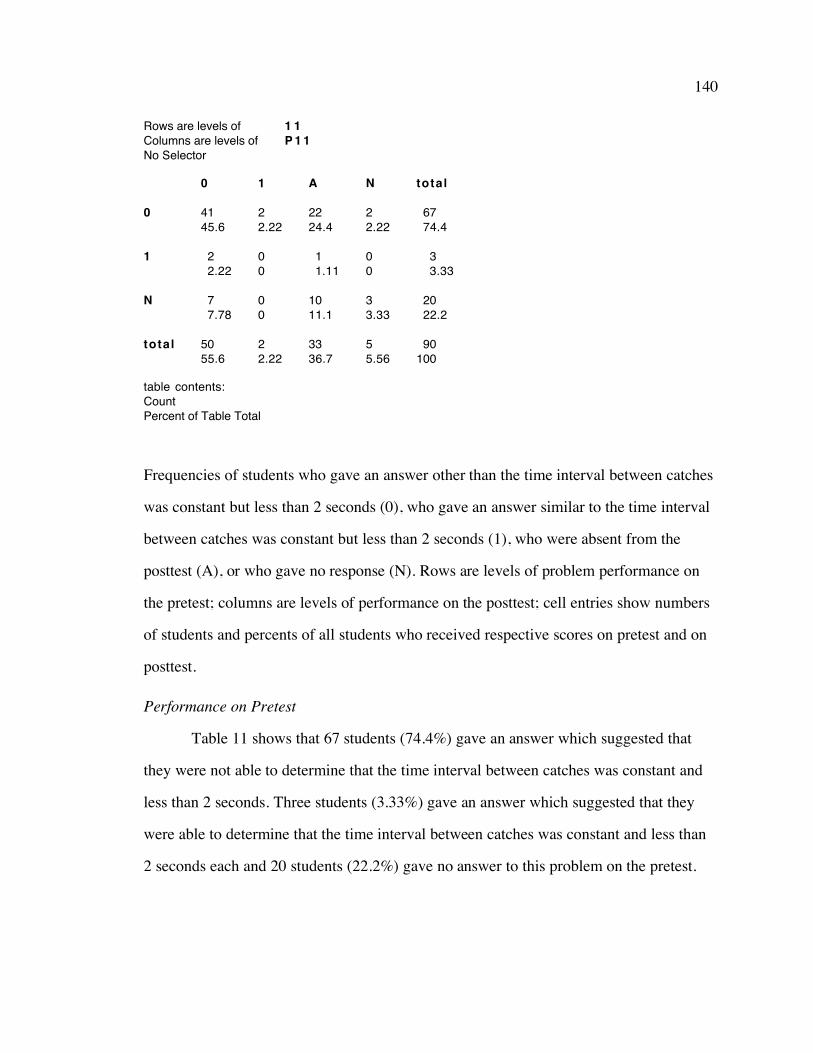
140
Rows are levels ofColumns are levels ofNo Selector
1 1P11
0
1
N
total
0
4145.6
22.22
77.78
5055.6
1
22.22
00
00
22.22
A
2224.4
11.11
1011.1
3336.7
N
22.22
00
33.33
55.56
total
6774.4
33.33
2022.2
90100
table contents:CountPercent of Table Total
Frequencies of students who gave an answer other than the time interval between catches
was constant but less than 2 seconds (0), who gave an answer similar to the time interval
between catches was constant but less than 2 seconds (1), who were absent from the
posttest (A), or who gave no response (N). Rows are levels of problem performance on
the pretest; columns are levels of performance on the posttest; cell entries show numbers
of students and percents of all students who received respective scores on pretest and on
posttest.
Performance on Pretest
Table 11 shows that 67 students (74.4%) gave an answer which suggested that
they were not able to determine that the time interval between catches was constant and
less than 2 seconds. Three students (3.33%) gave an answer which suggested that they
were able to determine that the time interval between catches was constant and less than
2 seconds each and 20 students (22.2%) gave no answer to this problem on the pretest.

141
Performance on Posttest
Of the 57 students who took the posttest, 50 students (87.7%) gave an answer
which suggested that they were not able to determine the time interval between catches
was constant and less than 2 seconds. Two students (3.5%) gave an answer which
suggested that they were able to determine that the time interval between catches was
constant and less than 2 seconds and five students (8.8%) gave no answer to this problem
on the posttest.
Comparison of Pretest and Posttest Performance
Cells (0,0), (1,1) and (N,N) of Table 11 indicate that, of the 57 students who took
both tests, 44 students were consistent from pretest to posttest. Of the 45 students who
gave an answer indicating that the time interval between catches was not constant or not
less than 2 seconds on the pretest, cell (0,1) indicates that two students gave an
acceptable answer on the posttest, and cell (0,N) indicates that two students gave no
answer on the posttest. Of the two students who gave an answer indicating that the time
interval was constant and less than 2 seconds on the pretest, cell (1,0) indicates that both
gave an unacceptable answer on the posttest. Of the 10 students who gave no response to
this problem on the pretest, cell (N,0) indicates that seven students gave an unacceptable
answer on the posttest and cell (N,1) indicates that none gave an acceptable answer to this
problem on the posttest.
Table C11
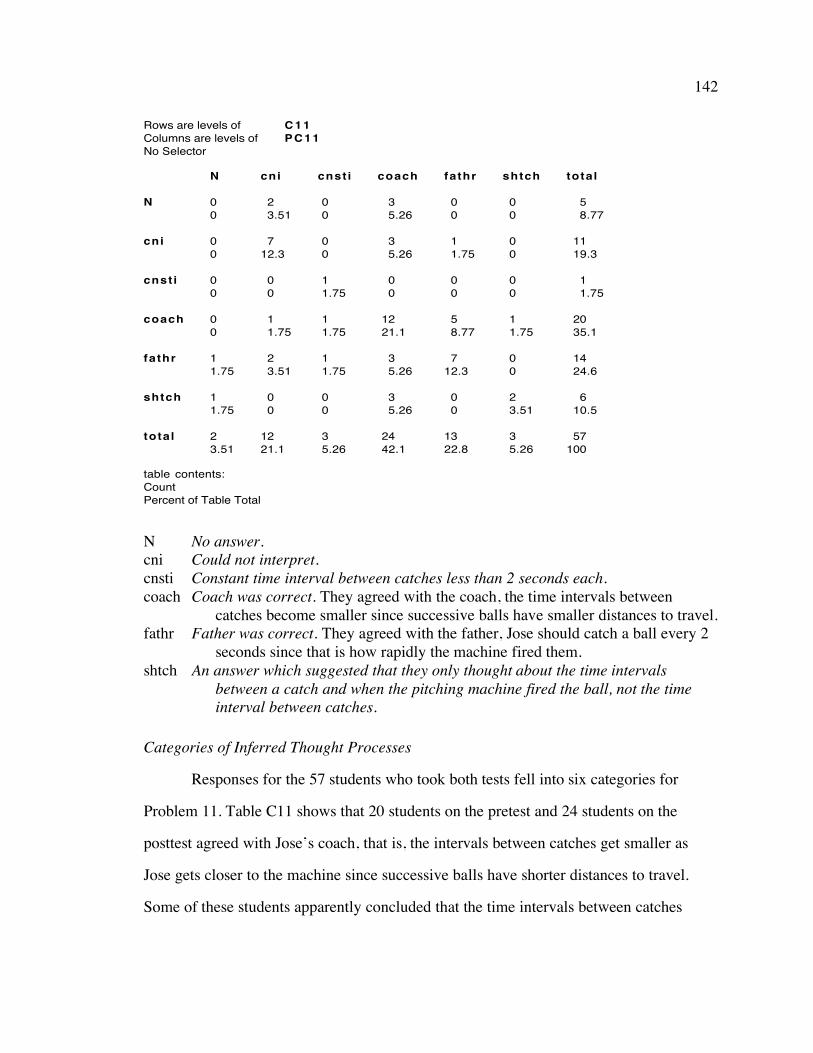
142
Rows are levels ofColumns are levels ofNo Selector
C11PC11
N
cni
cnst i
coach
fathr
shtch
total
N
00
00
00
00
11.75
11.75
23.51
cni
23.51
712.3
00
11.75
23.51
00
1221.1
cnst i
00
00
11.75
11.75
11.75
00
35.26
coach
35.26
35.26
00
1221.1
35.26
35.26
2442.1
fathr
00
11.75
00
58.77
712.3
00
1322.8
shtch
00
00
00
11.75
00
23.51
35.26
total
58.77
1119.3
11.75
2035.1
1424.6
610.5
57100
table contents:CountPercent of Table Total
N No answer. cni Could not interpret. cnsti Constant time interval between catches less than 2 seconds each. coach Coach was correct. They agreed with the coach, the time intervals between
catches become smaller since successive balls have smaller distances to travel. fathr Father was correct. They agreed with the father, Jose should catch a ball every 2
seconds since that is how rapidly the machine fired them. shtch An answer which suggested that they only thought about the time intervals
between a catch and when the pitching machine fired the ball, not the time interval between catches.
Categories of Inferred Thought Processes
Responses for the 57 students who took both tests fell into six categories for
Problem 11. Table C11 shows that 20 students on the pretest and 24 students on the
posttest agreed with Jose’s coach, that is, the intervals between catches get smaller as
Jose gets closer to the machine since successive balls have shorter distances to travel.
Some of these students apparently concluded that the time intervals between catches

143
would get smaller as Jose got closer to the machine since the time intervals between
catches and the firing of the ball from the pitching machine got smaller as Jose had
shorter distances to travel.
Other students thought in terms of a limit. They argued that the time interval
between catches, as Jose approached the pitching machine, decreased but could never be
less than 2 seconds since “If he is standing right in front of the machine he catches them
every 2 sec”. These students were correct in saying that if Jose were standing still,
whether in front of the machine or not, he would catch the ball every 2 seconds.
However, they perhaps thought the decrease in distance between Jose and the machine
affected the time interval between catches or the time intervals between catches and when
the machine fired the balls. As this change in distance approached 0 and finally reached
zero when Jose was standing directly in front of the machine, these students assumed that
the time interval between catches reached its limit when Jose was standing directly in
front of the machine.
Another student thought in terms of this limit when he stated that “Eventually, he
would get so close that it would take a fraction of a second for the ball to reach Jose’s
glove. He would eventually catch a ball every 1.9999... seconds but never reaching 2”.
Fourteen students on the pretest and 13 students on the posttest agreed with Jose’s
father, that is, Jose should catch one ball every 2 seconds since that is how rapidly the
machine fired them. One of these students, on the posttest, added that “since Jose’s speed
is constant he would catch each ball every 2 seconds, but if he were accelerating, he
would catch each ball in less than 2 seconds.” It is interesting how this last statement
relates to the correct statement “if Jose were standing still he would catch each ball every
2 seconds, but if his speed is greater than 0 he would catch each ball in less than 2
seconds.” Another student, on the posttest, added that “the interval is constant at 2 sec
144
since the balls slow down but the distance decreases.” Evidently, to this student the speed
of the ball is directly related to the decrease in distance between Jose and the machine
rather than the time interval between catches.
Six students on the pretest and three students on the posttest gave an answer
which suggested that they only thought about the time interval between a catch and when
the pitching machine fired a ball rather than the time interval between catches. One
student on the pretest and three students on the posttest gave a correct response which
suggested that they thought the time interval between catches was constant and less than
2 seconds. Eleven students on the pretest and 12 students on the posttest gave a response
which did not relate to the question. For example, several students were concerned about
how far Jose was from the pitching machine when Jose began running toward the
machine or stated that “As Jose gets closer to the machine, the balls will seem to come
faster.” One student stated that “both Jose’s coach and father were correct if the distance
was 90 feet.” Five students on the pretest and two students on the posttest gave no
response to this problem. It was interesting to note than none of the students on the tests
or in the interviews tried to calculate the constant time interval between catches.
Summary of Interviews
During the six interviews, one student began by stating that “the closer Jose got to
the machine the faster the ball would be coming to him.” This comment implied that she
was not thinking in terms of summing the two constant rates, which would yield a
constant rate of 100 ft/sec for the ball, but rather that the ball was actually accelerating
toward Jose as he approached the machine. She added that “Right in front of the machine
Jose would catch the ball every 2 seconds but the further away he got from the machine,
it would take longer”. Perhaps she assumed that the time interval between catches was
directly affected by the distance Jose was from the machine. This suggests she was
145
thinking about the amount of time a ball traveled rather than the amount of time between
catches. She concluded that Jose’s coach was correct, the time interval between catches
would be getting smaller as Jose got closer to the machine.
Another student stated that the time interval would get smaller as Jose approached
the machine. When it was pointed out to him that there were two time intervals involved
in this problem, one involving the time interval between catches and the other involving
the time interval between a catch and when the machine fired a ball, he understood these.
However, he still felt very strongly that the time interval between catches was decreasing
since the distance to the machine was decreasing as Jose approached the machine.
Another student stated that if Jose were standing still, the time interval between
catches would be 2 seconds and as he ran at a constant velocity toward the ball “he would
catch them at equal intervals less than 2 seconds, but I don’t know how I could figure this
out using calculus”. This comment indicated that she felt the calculation of the actual
time interval between catches was important, although this was not necessary to answer
the question.
Another student compared this problem to the Doppler effect (involving wave
theory) studied in a physics class in which he was enrolled. He was able to answer this
question correctly based on his understanding of this theory.
Another student stated that “the time interval would get smaller”. He was asked to
explain this answer since it was not clear to which time interval he was referring or if the
time interval between catches was constant but smaller than 2 seconds. He explained that
if Jose stood still he would catch the ball every 2 seconds and as Jose ran toward the
machine at a constant speed, the time interval between catches would be the same but less
than 2 seconds. This was correct, however, he stated that he couldn’t believe the time
146
interval between catches could be less than every two since the machine fired a ball every
2 seconds.
The last student interviewed gave a unique answer to this problem on both tests
and during his interview. He stated that the “interval between catches was increasing as
Jose approached the pitching machine”. He explained that “When Jose is far from the
machine, by the time Jose catches a ball the machine may have shot several balls, so he
would have to catch them quickly. As Jose gets close to the machine, after Jose catches a
ball he has to wait for the machine to shoot another ball.” The investigator then asked
him to explain how often Jose would catch the ball if Jose stood still and he replied
“every 2 seconds”. Then he was asked how often Jose would catch the ball if Jose were
running at a constant speed toward the machine and he replied “since he is meeting the
ball, he would catch them before every 2 seconds and since he is running at a constant
rate, the time interval between catches stays the same”. Hence, this student, who had
given a uniquely incorrect interpretation of the situation in this problem, was able to
understand and solve the problem after a little direction.

147
CHAPTER V
SUMMARY OF RESULTS
Understanding the concept of rate of change is foundational to the understanding
of the derivative, the instantaneous rate of change. This study was intended to investigate
first semester calculus students’ understanding of rate of change and how their
understandings were affected by instruction on the derivative. By examining their
understandings of rate of change at the beginning of the first semester calculus course and
soon after their typical study of the derivative, we can gain insight into the reasons why
some calculus students have difficulty acquiring a conceptual understanding of the
derivative. The investigator designed and administered a written examination in order to
investigate first semester calculus’ students understanding of rate of change. Ninety
college students were given this written examination at the beginning of their first
semester calculus course and then 57 students of the original 90 students were given this
same examination soon after completing their study of the derivative. These written
examinations were followed up by interviews with six students regarding their
understanding of the concepts presented on the examinations.
The written examinations were analyzed from two perspectives: performance and
process. Performance data was determined by scoring students’ answers according to
whether they were correct. Process data was determined by analyzing students’ solution
methods. Performance was scored 0 (not correct), 1 (correct), A (absent for posttest) or N

148
(no response). Solution processes were categorized from students’ responses according to
their methods of reasoning. For example, in Problem 1 which states that “A car traveled 5
miles across town in 15 minutes. Is it reasonable for the teacher to ask how far the car
went in the first 2 minutes?”, a student may have reasoned that the car traveled the 5
miles across town at an average velocity of 20 miles per hour, hence, the teacher’s
question was not reasonable or the student may have reasoned that the car traveled the 5
miles across town at a constant velocity of 20 miles per hour, hence, the teacher’s
question was reasonable. In both performance and process cases, data from the pretest
and posttest were analyzed by constructing contingency tables in order to examine pretest
and posttest differences. A summary of these differences will now follow and possible
reasons for these differences are addressed later in the chapter.
Comparison of Pretest and Posttest Performance
In order to analyze the differences between pretest and posttest performance the
percent increase or decrease of correct responses from pretest to posttest will be
examined. Table 12 shows the percent of correct responses for each problem on the
pretest and posttest based on performance as well as the percent increase and decrease for
each problem. Also included in Table 12 is the average of the percent of correct
responses on the pretest and the average of the percent of correct responses on the
posttest, as well as the percent increase from pretest to posttest of these averages.

149
Table 12 Comparison of Percentage Correct on the Pretest and Posttest based on Performance Problem % Correct % Correct Gain Number on Pretest on Posttest
5a 51% 22% -29% 5e 45% 35% -10% 5b 36% 28% -8% 5c 36% 28% -8% 10a 36% 28% -8% 10c 24% 18% -6% 4b 58% 53% -5% 2 7% 4% -3% 10b 59% 57% -2% 5d 39% 38% -1% 4a 28% 28% 0% 8 2% 2% 0% 11 4% 4% 0% 9 28% 29% 1% 7a 17% 19% 2% 1 30% 33% 3% 6d 12% 19% 7% 7b 25% 34% 9% 3 18% 30% 12% 6a 39% 55% 16% 6b 36% 54% 18% 6c 46% 78% 32%
Problems having little or negative improvement in performance.
The analysis of the performance data revealed that, in certain problems, there was
little difference between the percent of correct answers on the pretest as compared to the
posttest. On all problems except 3 and 6(a-c) there was little or no positive change in
performance. Problem 5(a-e) had a consistent negative change, with 5a showing a large
negative change in performance.
Problem 5 was about average rate of change of a falling object over various
intervals of time, with several parts asking students to either produce or interpret a
difference quotient. The consistent negative change in performance on Problem 5 is
150
particularly surprising, as this problem more than any other resembled standard calculus
content.
Problems having positive improvement in performance.
Only on Problem 3 and Problem 6 was there a noteworthy increase in
performance. Problem 3 involved the ability to reason imagistically and schematically
about the speed of two runners in relation to distance and time. Unfortunately, all but one
of the interviewees answered Problem 3 incorrectly on the posttest, so there is no
information on why 6 people in the total group changed from “distance equals time” to
“time further than distance.”
Problem 6a involved the ability to determine the unit for average rate of change of
volume with respect to height. Problem 6b asked for the average rate of change of
volume with respect to height from given information or from the given graph. Problem
6c asked for the average rate of change of volume with respect to height from a given
graph for a specific interval of the height. Problem 6d asked whether the average rate of
change of volume with respect to height would be affected by the rate of change of
volume with respect to time. Possible reasons for the large increase in correct
performance in Problem 6 are discussed in Chapter 5.
Comparison of Pretest and Posttest Process
The methods of solution for each problem, based on students’ thought processes
rather than correct answers, from pretest to posttest were compared to determine how
their understanding of rate of change was effected by instruction on the derivative. In
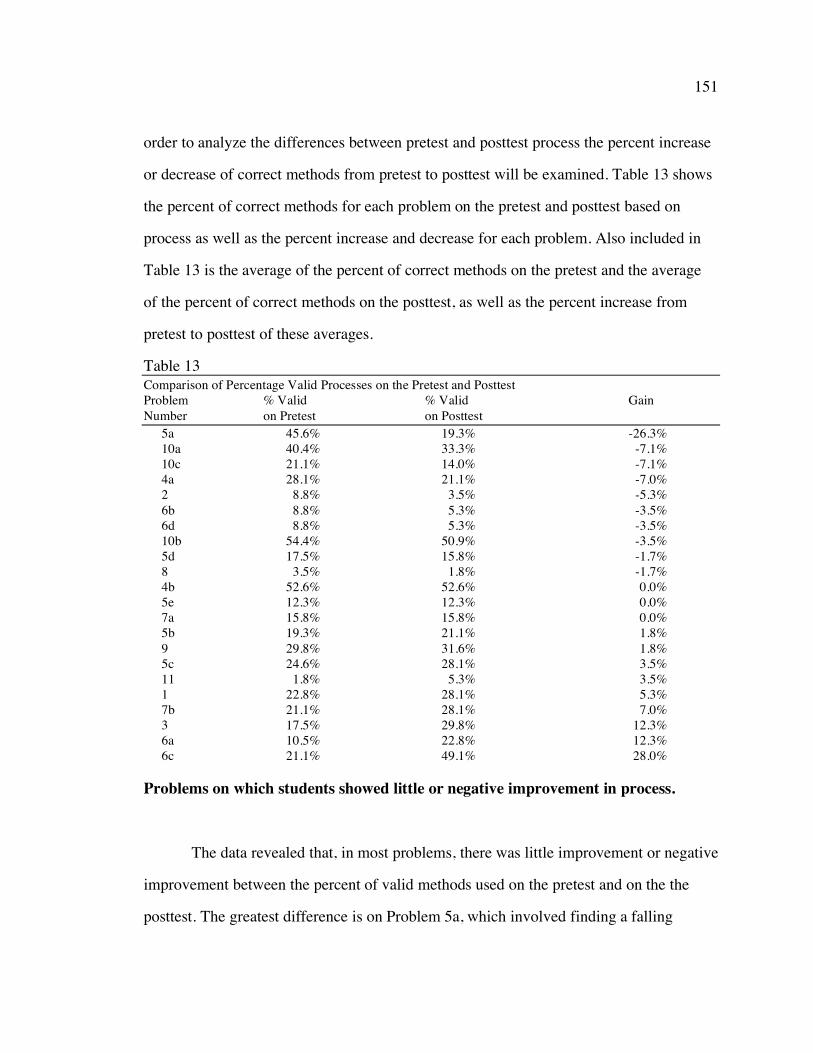
151
order to analyze the differences between pretest and posttest process the percent increase
or decrease of correct methods from pretest to posttest will be examined. Table 13 shows
the percent of correct methods for each problem on the pretest and posttest based on
process as well as the percent increase and decrease for each problem. Also included in
Table 13 is the average of the percent of correct methods on the pretest and the average
of the percent of correct methods on the posttest, as well as the percent increase from
pretest to posttest of these averages.
Table 13 Comparison of Percentage Valid Processes on the Pretest and Posttest Problem % Valid % Valid Gain Number on Pretest on Posttest
5a 45.6% 19.3% -26.3% 10a 40.4% 33.3% -7.1% 10c 21.1% 14.0% -7.1% 4a 28.1% 21.1% -7.0% 2 8.8% 3.5% -5.3% 6b 8.8% 5.3% -3.5% 6d 8.8% 5.3% -3.5% 10b 54.4% 50.9% -3.5% 5d 17.5% 15.8% -1.7% 8 3.5% 1.8% -1.7% 4b 52.6% 52.6% 0.0% 5e 12.3% 12.3% 0.0% 7a 15.8% 15.8% 0.0% 5b 19.3% 21.1% 1.8% 9 29.8% 31.6% 1.8% 5c 24.6% 28.1% 3.5% 11 1.8% 5.3% 3.5% 1 22.8% 28.1% 5.3% 7b 21.1% 28.1% 7.0% 3 17.5% 29.8% 12.3% 6a 10.5% 22.8% 12.3% 6c 21.1% 49.1% 28.0%
Problems on which students showed little or negative improvement in process.
The data revealed that, in most problems, there was little improvement or negative
improvement between the percent of valid methods used on the pretest and on the the
posttest. The greatest difference is on Problem 5a, which involved finding a falling

152
object’s average speed over the duration its fall. The decrease in valid processes used in
Problem 5a seemed to be due largely to inappropriate use of the derivative—using the
derivative to find the velocity at the end of 9 seconds to answer a question about an
average rate of change over a period of 9 seconds. No other problem showed the dramatic
decrease in valid processes; all others except Problem 3, 6a, and 6b showed only
marginal decreases or increases. This common absence of increase or decrease is
noteworthy, and will be discussed more fully in Chapter 5.
Problems that showed improvement in process.
Correctness and validity were essentially the same for Problems 1, 2, 3, 4a, 5b, 6a,
6b, 6c, 8, and 10a, according to the researcher’s scoring criteria, so no information is
gained beyond what was already concluded from the discussion of correctness.
There was a slight increase in the percent of valid solution methods from pretest
to posttest for problems 7b, 3, and 6a, and large increase for problem 6c. Problems 3, 6a
and 6c were discussed previously. The slight increase for Problem 7b does not warrant
discussion.
153
Chapter VI
DISCUSSION
This study was intended to investigate first semester calculus students’
understanding of rate of change and how their understandings were affected by
instruction on the derivative. By examining their understandings of rate of change at
the beginning of the first semester calculus course and soon after their typical study of
the derivative, we can gain insight into the reasons why some calculus students have
difficulty acquiring a conceptual understanding of the derivative. The investigator
designed and administered a written examination in order to investigate first semester
calculus’ students understanding of rate of change. Ninety college students were
given this written examination at the beginning of their first semester calculus course
and then 57 students of the original 90 students were given this same examination
soon after completing their study of the derivative. These written examinations were
followed up by interviews with six students regarding their understanding of the
concepts presented on the examinations.
The written examinations were analyzed from two perspectives: performance
and process. Performance data was determined by scoring students’ answers
according to whether they were correct. Process data was determined by analyzing
students’ solution methods. Performance was scored 0 (not correct), 1 (correct), A
154
(absent for posttest) or N (no response). Solution processes were categorized from
students’ responses according to their methods of reasoning.
In both performance and process, data from the pretest and posttest were
analyzed by constructing contingency tables in order to examine pretest and posttest
differences. A summary of these differences will now follow and possible reasons for
these differences are addressed later in the chapter.
Conclusions
Overall Results
Ninety first semester calculus students who were tested before any instruction
on the derivative had an overall average percent score based on performance of
20.7% and an overall average percent score based on process of 22.1%. After
completing their study of the derivative, 57 remaining students of the 90 original were
given the same test and had an average percent score based on performance of 23.7%
and an average percent score based on process of 22.5%.
Overall, the scores were quite low for both the pretest and posttest and the
percent increases indicate there was little difference between the pretest and posttest
results. This result is rather disturbing. Many problems on the written examination
covered material presented at the eighth and ninth grade level in a modern
curriculum. Moreover, the concepts addressed by these problems are certainly
germane to the concept of the derivative as “instantaneous rate of change.” If students
do not understand average rate of change, it is hard to imagine they have anything but
a superficial understanding of instantaneous rate of change.
155
Also, one might expect a greater percent increase in correct responses from
pretest to posttest than what was found, especially in light of these facts:
• The average pretest score for students who dropped the class was lower than the
average pretest score for those who remained (t = 2.62, p<.10). It was the stronger
students who remained.
• Those students who took the posttest had seen these exact problems on the pretest.
• Several students mentioned during their interview that they had thought about
these problems after the pretest and worked some more on them after the pretest..
Several possible factors may have contributed to students’ poor performance.
The students may not have had enough motivation to function at their highest
abilities. On the first page of the examination it stated that “performance on this set of
questions will not be part of your grade.” Also, the percentage of correct performance
and process may have been low because many students may have left items blank in
order to finish the examinations early. However, the questions which received no
response were coded with an N and not considered wrong answers or wrong
processes on the part of the student. The most compelling reason that students
performed poorly seems to be that they did not understand rate of change deeply
enough to reason appropriately.
As shown in Chapter 4, most problems showed little difference in
performance from pretest to posttest. Performance on problem 5 (average speed of a
falling object) went down; performance on problems 3 (Fred and Frank) and 6
(spherical storage tank) went up substantially. The investigator suspects that the
change in performance on problem 3 was incidental to instruction on the derivative,
and that changes in performance on problems 5 and 6 were due to more directly to
what students’ assimilated from instruction. In problem 5, students tended to use

156
derivatives, but used them nonsensically. In problem 6, evidently more students read
the graph as representing a functional relationship when seeing it on the posttest than
when seeing it on the pretest. Perhaps their cumulative experience with functions and
graphs oriented them to a more interpretive stance the second time. Or, they may
simply have “learned” by taking the test. Also, problem 6c asked for an average rate
of change of volume with respect to height over an interval of on which the graph
looked approximately straight. This may have fit with their notion of rate-as-slope,
which would explain why they improved substantially on problem 6c but did not
improve on any part of problem 5.
It is noteworthy that students did not become “skilled” at any of these
problems. In fact, they scored quite poorly. Even more, they also failed to change
substantially their reasoning about rate-like situations. Whatever was “the content” of
their course, what students assimilated was largely irrelevant to their understanding of
rate of change.
Limitations
Throughout the course of this research several factors that could have widened
the scope of this study were not taken into account. First, the investigator did not
compare and contrast the manner of calculus instruction that occurred between the
pretest and the posttest. Second, the extent of the students’ concept of function was
not measured during the pretest nor during the posttest. As a result, no inference
should be made as to the effect that different styles of calculus instruction might have
on calculus students’ understanding of rate of change.
Different instruction methods could possibly be related to students’
understanding of rate of change. For example, an instructor may supplement abstract
theory involving rate of change with numerous real life examples. Or, an instructor
157
may concentrate on the abstract presentation of the subject matter and give no real life
examples that involve rate of change. In another instance, an instructor may show that
the derivative of f(x) = x2 is f’(x) = 2x by instructing the students to mechanically
move the exponent 2 in front of x, thereby, arriving at 2x. The student then may fall
into the misunderstanding that the definition of derivative is merely a mechanical
operation and he does not make the connection between rate of change and the
derivative.
The concept of a functionis surely related to the understanding of rate of
change. To understand rate of change, one must envision two variables co-varying
systematically, which entails the idea of functional relationship. This study was not
meant to determine the relationship of the students’ understanding of function to their
understanding of rate of change. Several students who were interviewed, even though
the interviewer attempted to draw them out, did not demonstrate an understanding
that “d(t) = 16t2 “ was a function that would completely describe the distance the
object traveled at any given time. Also, students did not appear to understand the fact
that for any given amount of time there is a unique distance value and for any change
in time there is a corresponding change in distance (assuming the rate is not zero). By
relating a change in one variable to a corresponding change in another, the concept of
a function is entailed in a student’s conceptual understanding of rate of change.
As a result, it may be beneficial in the future to research how the factors of
classroom instruction and students’ concept of function relate to students’
understanding of rate of change. However, this investigation only concentrated on the
influence that a course’s treatment of the derivative in the first semester calculus had
on students’ understanding of rate of change.

158
The results of this study suggest that most of the students currently entering
first semester calculus have a weak understanding of rate of change, and this
university’s calculus classes do not improve it. This is an alarming situation, as an
understanding of rate is foundational to the concept of the derivative.
These first semester calculus students had completed their study of the
derivative and showed no significant increase in their understanding of rate of
changeThough it would seem the study of the derivative in first semester calculus
would greatly improve students’ understanding of rate of change, this appears not to
be the case.
Implications
This study has implications for elementary and secondary math education,
teacher education, and for calculus curriculum and pedagogy.
Elementary and Secondary Math Education The concept of rate of change which
enables understanding of the calculus does not come from nowhere, and it cannot be
built when studying the calculus itself. Repeated and early exposure to the concept of
rate of change is needed if students will understand the concept of the derivative
when studying calculus. Teachers at the elementary and secondary level should
understand that proportional reasoning is not acquired all at once and comparing
ratios is an advanced idea .
Knowledge of Piagean stages might help with the timing of the introduction
of rate and proportional concepts. First, it is fundamental that children understand
what is meant by the concept of change or difference in both additive and
multiplicative terms. Next, children should be taught that multiplication is not just an
abbreviated version of repeated addition but also arises as scaling, magnification or

159
growth. Hart (1983) stated that “the main error children commit in solving ratio and
proportion problems is the use of an incorrect addition strategy.”
Riedesel (1967, p. 287) stated that “because rate and ratio are such important
mathematical concepts, and because students have difficulty learning these concepts,
it is essential that [elementary and secondary] teachers place more emphasis on
developing these concepts in students.”
The elementary and secondary mathematics curriculum should help children
construct intuitive knowledge about fraction and ratio equivalence. For example, in a
situation modeled by a/b = c, if a stays the same and b increases then c decreases, or if
both a and b increase, then it cannot be determined whether c increases, decreases, or
stays the same in value. Although this example is generally not included in the
elementary mathematics curriculum, the reasoning developed in this type of question
transfers to other situations including rate of change rather than just directly taught
reasoning abilities. Also, rational number skills once developed, are not being used or
applied to real life situations and the concept of ratio is typically not studied until fifth
grade.” (Reys, Suydam & Lindquist, 1989, p.201) However, Van den Brink and
Streefland (1979) give evidence that children as young as 6 and 7 years old have
intuitive knowledge about ratios and proportions. Young children develop intuitions
and insights into splitting that are either ignored or are inhibited by our current
curriculum. Karplus et al. (1977) have noted that “It is clear that a substantial fraction
of students between 13 and 15 years of age lack the ability to articulate proportional
reasoning and/or control of variables.” (p. 416). Hence, many beginning secondary
school students are not prepared to deal with proportional concepts. Also, their results
showed that 20% of college students were still not able to use proportional reasoning
effectively.

160
Teacher Education
Required changes in elementary and secondary mathematics curriculum and
instruction will not be possible if teachers are not positioned to make these changes.
Post, Harel, Behr, and Lesh (1988) found that a minority of middle school
mathematics teachers understand ratio and rate as well as we wish school students to
understand them. They also found that an even smaller percentage of middle-school
mathematics teachers can construct coherent explanations of their own solutions to
ratio or rate problems, even when those solutions are correct. Is it reasonable to
expect more of middle-school students than their teachers themselves can deliver? It
will be essential to address this problem if we are to expect entering calculus students
to understand rate of change and functional covariation.
Calculus Curriculum and Pedagogy
If college calculus students resemble themselves as high school mathematics
students, then they have a strong expectation that “what matters” in a mathematics
class is “what you are supposed to do.” They await directions as to what symbolic
procedures to memorize, and they filter-out discussions of “why” procuedures work
as they do, since these discussions are immaterial to memorizing the procedures
themselves. Thus, if instructional experiences in class and tasks asked of them by
texts are not different enough from “memorize and apply a procedure,” students will
attempt to understand them as expecting them to memorize and apply procedures.
Put another way, students succeeded in previous courses by memorizing
procedures; if they think they can succeed in calculus by doing the same thing, then
they will pay little attention to discussions or tasks which, from students’ perspective,
do not fit their expectations. Discussions and tasks which are highly symbolic from
the beginning, and fit the mold of “symbol work leads to answer,” will probably be
161
assimilated by students as something to memorize instead of something to understand
and connect with other understandings. We should not expect progress in students’
conceptual understanding when everywhere they turn they find further support for a
non-understanding engagement with tasks and evaluations.
The ideas of first semester calculus emerge through the study of graphs. This
occurs through a transformation from the static mathematics of the function of the
graph where one quantity is calculated when another is known, to the dynamic
mathematics of the function, which considers how one thing changes with another.
The student first learns to draw graphs of functions and then how to find rates of
change. This method of understanding functions or graphs is one of the chief ways in
which mathematics can deal with real life problems. Calculus students should first
learn about rate of change from everyday situations then the more formal language of
the calculus can be introduced.
When Newton discussed the derivative, he did not feel the need to give a
formal definition of a fluxion (a quantities rate of change) but made an appeal to our
familiar intuitions of motion. The famous book Principia Mathematica Philosophiae
Naturalis of 1687 was concerned with velocity, acceleration, tangents and curvatures
which are largely handled now by the methods of calculus but Newton presented
them in the form of geometrical demonstrations with an almost complete lack of
analytical calculations. For a long time English mathematicians clung to the idea of
velocity in dealing with problems involving the derivative which was probably due to
a desire for an intuitively satisfying conceptual background as presented by their great
predecessor Newton whose method of fluxions remained essentially geometrical.
Perhaps this satisfying conceptual background is absent when calculus is presented as
162
a formal theory of functions without reference to concrete examples, diagrams or
geometrical representations.
Apollonius, Oresme, Viete, Descarte, and Fermat also realized that functions
could be depicted graphically, so that any problem having to do with accumulation
could be represented as the determination of an area and that any problem having to
do with rate of change could be represented as the determination of tangency (Boyer,
1957). That is, the initial development of the ideas of the calculus was done by
mathematicians who had a strong understanding that even though they were focusing
explicitly on tangents to curves or areas bounded by curves, they were in fact looking
for general solutions to any problem of accumulation or change that could be
expressed as a function.
Dreyfus states that “visualizing” a function through its graph pictures the
underlying structure. Before a student can achieve high level thinking, he must “first
operate in concrete terms which allows him to visualize what is happening, then use
operational thinking which is carried out in thought”. Students abstract concepts in
their mind through the replacement of concrete phenomena. If students are taught to
make analogies between graphical and real life situations, they will have superior
problem solving skills. In advanced math classes instructors should be aware that
students have difficulty working with the high order thinking of functions, limit and
infinity. Peterson (19XX, p. XX) states that “meaning and understanding should be
emphasized rather than rote learning to facilitate high order thinking. If students do
not apply meaning or understanding to their math, math will become meaningless
symbol manipulation.” We must avoid letting students perform the operations of
differentiation mechanically, without any understanding of what they are doing. It
163
should be our aim to develop the concepts of differentiation so as to give students an
intelligent comprehension of the processes they are using.
Form A
Rates of Change Calculus is about the mathematics of change. This set of questions is intended for us to better understand your understanding of rates of change and representations of them. We hope that by gaining this information we can design school and college mathematics courses to better prepare students for the calculus. This is not a course test! Your performance on this set of questions will not be part of your grade, and your answers will be kept completely confidential. Your answers and your name will be stored separately. We will share total results of students’ performance with calculus instructors, but individual examinations will not be shared. That is, your individual performance will be kept completely confidential. Even though this set of questions will not influence your grade, we hope that you will give your very best effort. Also, please note that each question has a place for you to write notes about anything you find confusing. It will help us tremendously if you will jot a brief note trying to explain any confusions you have. Thank you very much for assisting us in our efforts to improve our mathematics courses.
Your name:
Year: Freshman Sophomore Junior Senior (circle one)
High School Math Courses (circle those that apply):
Algebra I Algebra II Geometry Trigonometry Precalculus
Calculus

Rate of Change Form A Problem 1
Is this problem confusing to you? If so, what is your confusion? (Please use the back
of this sheet if you need additional space.)
A textbook stated: “A car traveled 5 miles across town in 15 minutes.” Is it reasonable for the teacher to ask how far the car went in the first 2 minutes?
(a) Yes. It went ____ miles.
(b) No. Because … (explain)
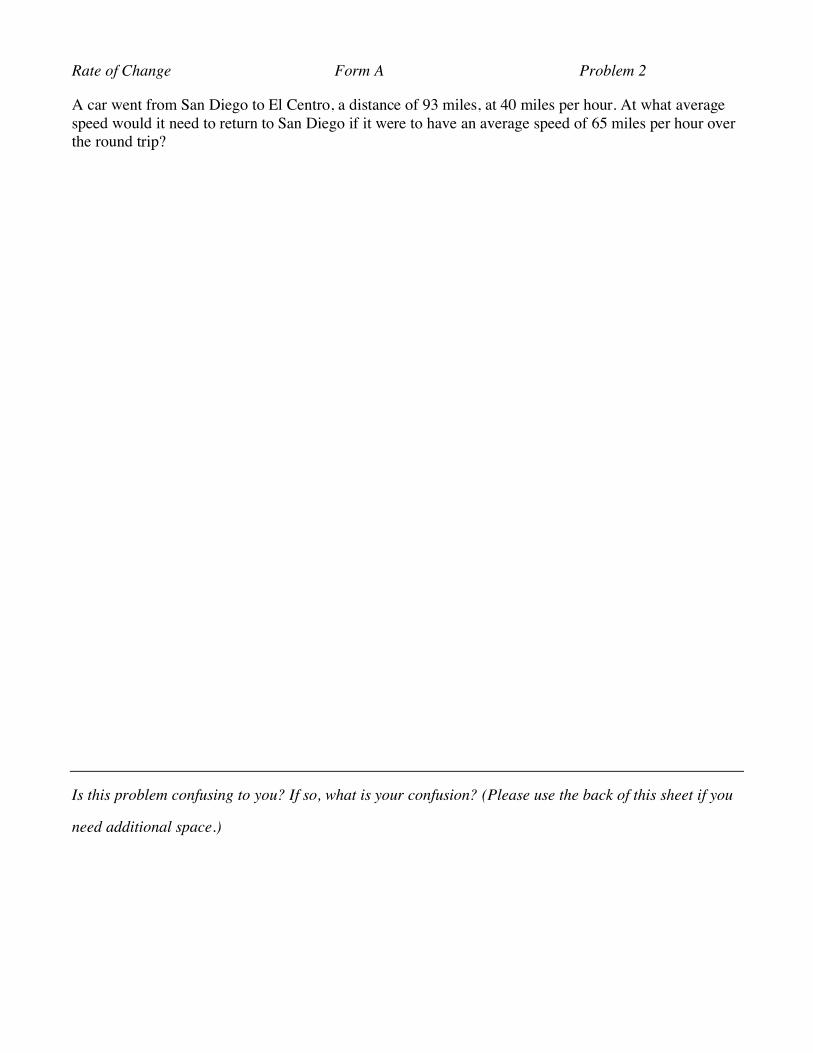
Rate of Change Form A Problem 2
Is this problem confusing to you? If so, what is your confusion? (Please use the back of this sheet if you
need additional space.)
A car went from San Diego to El Centro, a distance of 93 miles, at 40 miles per hour. At what average speed would it need to return to San Diego if it were to have an average speed of 65 miles per hour over the round trip?

Rate of Change Form A Problem3
Is this problem confusing to you? If so, what is your confusion? (Please use the back of this sheet if you
need additional space.)
Fred and Frank are two fitness fanatics. On a run from A to B, Fred runs half the way and walks the other half. Frank runs for half the time and walks for the other half. They both run and walk at the same speed. Who finishes first?

Rate of Change Form A Problem 4
Is any part of this problem confusing to you? If so, what is your confusion? (Please use the back of this
sheet if you need additional space.)
A car’s speed from a standing start increases at the rate of 5 ft/sec/sec over a 25 second interval.
(a) What does 5 ft/sec/sec mean in this situation?
(b) Circle the graph that represents the car’s distance over this 25 second interval.
i
ii
iii
iv None of these represents the car’s distance
(c) Explain your selection in Part (b).
Rate of Change Form A Problem 5
Is any part of this problem confusing to you? If so, what is your confusion? (Please use the back of this
sheet if you need additional space.)
Joe dropped a ball from the top of a building. It took 9 seconds for the ball to hit the ground. The distance the ball fell in t seconds after it was released is given by the function d(t), where d(t) = 16t2, 0 t 9 .
a. What was the ball’s average speed for the time between when it was released and when it hit the ground?
b. Write an expression that represents how far the ball fell during the period between t seconds and t+2 seconds after it was released.
c. What was the ball’s average speed during the period between 12 second and 234 seconds after it was released?
d. Write an expression (a formula) for the ball’s average speed during the period between u and u+h seconds after it was released, where h>0 and u+h 9?
e. Suppose that t and w represent numbers of seconds and d is the function defined above. What does
the expression d(t + w) d(t)
w represent about the falling ball?
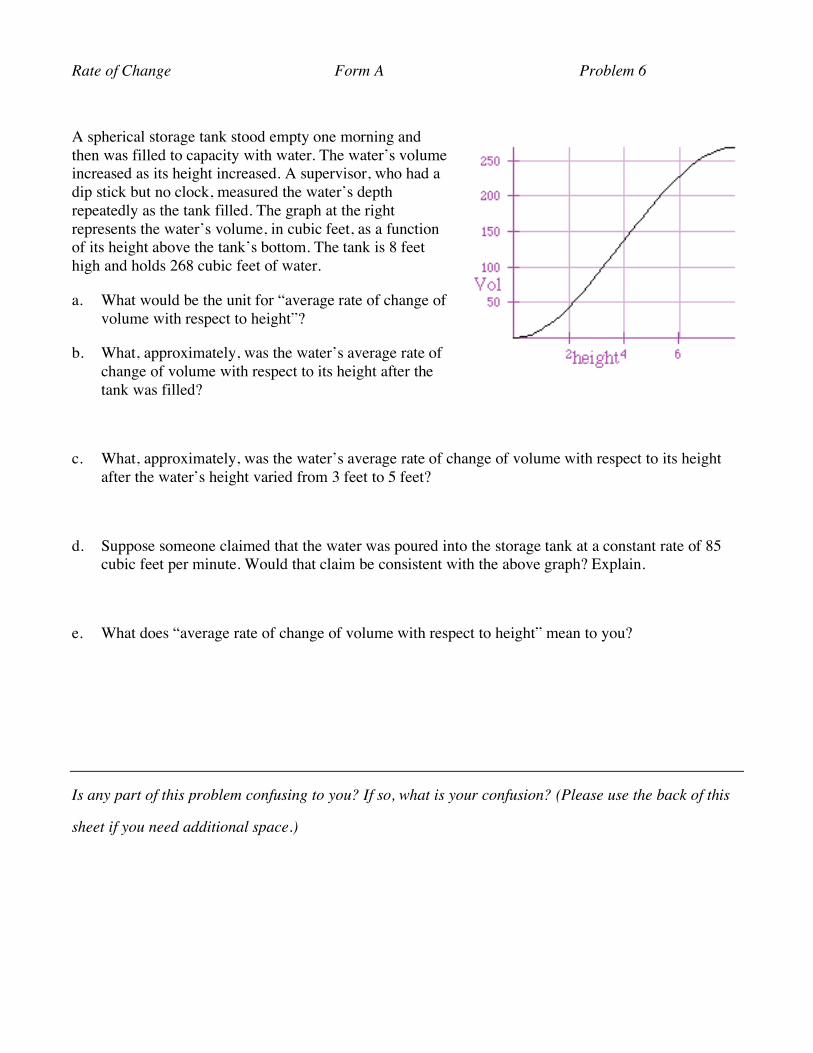
Rate of Change Form A Problem 6
Is any part of this problem confusing to you? If so, what is your confusion? (Please use the back of this
sheet if you need additional space.)
A spherical storage tank stood empty one morning and then was filled to capacity with water. The water’s volume increased as its height increased. A supervisor, who had a dip stick but no clock, measured the water’s depth repeatedly as the tank filled. The graph at the right represents the water’s volume, in cubic feet, as a function of its height above the tank’s bottom. The tank is 8 feet high and holds 268 cubic feet of water.
a. What would be the unit for “average rate of change of volume with respect to height”?
b. What, approximately, was the water’s average rate of change of volume with respect to its height after the tank was filled?
c. What, approximately, was the water’s average rate of change of volume with respect to its height after the water’s height varied from 3 feet to 5 feet?
d. Suppose someone claimed that the water was poured into the storage tank at a constant rate of 85 cubic feet per minute. Would that claim be consistent with the above graph? Explain.
e. What does “average rate of change of volume with respect to height” mean to you?

Rate of Change Form A Problem 7
Is any part of this problem confusing to you? If so, what is your confusion? (Please use the back of this
sheet if you need additional space.)
Two cars, Car A and Car B, started from the same point, at the same time, and traveled in the same direction. Their speeds increased, as shown in the graph (heavy graph is for Car A, light graph is for Car B), so that after 1 minute they were both traveling at 100 mph.
(a) Was the distance between the cars increasing or decreasing 0.8 minutes after they started? Explain
(b) Describe the cars’ relative positions 1 minute after they started. Explain
Rate of Change Form A Problem 8
Is this problem confusing to you? If so, what is your confusion? (Please use the back of this sheet if you
need additional space.)
When the Discovery space shuttle is launched, its speed increases continually until its booster engines separate from the shuttle. During the time it is continually speeding up, the shuttle is never moving at a constant speed. What, then, would it mean to say that at precisely 2.15823 seconds after launch the shuttle is traveling at precisely 183.8964 miles per hour?

Rate of Change Form A Problem 9
Is this problem confusing to you? If so, what is your confusion? (Please use the back of this sheet if you
need additional space.)
Assume that two planes, A and B, are flying away from San Diego and that their distances from the San
Diego airport are continually monitored. The planes’ distances from San Diego are shown by the graph
given below for a 10 second period of their trip.
Plane A
Plane B
Compare the planes’ speeds 1.5 seconds after the beginning of this period of time.

Rate of Change Form A Problem 10
Is any part of this problem confusing to you? If so, what is your confusion? (Please use the back of this
sheet if you need additional space.)
Water flowed into a tank at a constant rate with respect to time. The water’s volume was measured (in
gallons) after flowing for 5 seconds and again after flowing for 9 seconds. This information is given in a
graph, below.
(a) How much water was in the tank when water began flowing into it.?
(b) At what rate did water flow into the tank?
(c) Write a formula which gives the amount of water in the tank after water has flowed for t seconds.

Rate of Change Form A Problem 11
Is this problem confusing to you? If so, what is your confusion? (Please use the back of this sheet if you
need additional space.)
A “pitching machine” is a machine that shoots baseballs to simulate a baseball pitcher. Patrick Henry’s
pitching machine shoots baseballs at a speed of 90 ft/sec, and it is set to shoot balls every 2 seconds.
One day the machine was loaded with “gravity resistant” baseballs—they don’t fall to the ground, they
just go in a straight line at 90 ft/sec—firing one every 2 seconds. The machine shot gravity resistant
balls at José, the center fielder, while he ran straight at the machine at a speed of 10 ft/sec. He caught
each ball fired at him, and then dropped it as he continued running.
José’s coach thought that the time intervals between catches should get smaller as José got closer to the
machine, since successive balls had smaller distances to travel. José’s father thought that José should
catch one ball every 2 seconds, since that is how rapidly the machine fired them.
What is your opinion? Explain.