calgary thriving on growth - wordpress.com · 2014-07-30 · alberta and energy alberta...
TRANSCRIPT

Calgary ThrivingOn grOwTh
Mid year updaTe
2014 Economic outlook & REgional Housing FoREcast

©2014 CREB®. All rights reserved.
The forecasts included in this document are based on information available as of July 2014. Prepared by Ann-Marie Lurie, CREB® chief economist.
300 Manning Road NECalgary, AlbertaT2E 8K4, Canada
Phone: 403-263-0530Fax: 403-218-3688Email: [email protected]
creb.comcrebforecast.comcrebnow.com

COnTenTs
glObal eCOnOMy . . . . . . . . . . . . . . . . . . . . . . . . . . . . . . . . . . . 4 Summary . . . . . . . . . . . . . . . . . . . . . . . . . . . . . . . . . . . . . . . . . . . . . . . . . . . . 4
Eurozone . . . . . . . . . . . . . . . . . . . . . . . . . . . . . . . . . . . . . . . . . . . . . . . . . . . . 4
US Economy . . . . . . . . . . . . . . . . . . . . . . . . . . . . . . . . . . . . . . . . . . . . . . . . . 5
China and Emerging Markets . . . . . . . . . . . . . . . . . . . . . . . . . . . . . . . . . . 5
Canada . . . . . . . . . . . . . . . . . . . . . . . . . . . . . . . . . . . . . . . . . . . . . . . . . . . . . . 6
Alberta and Energy . . . . . . . . . . . . . . . . . . . . . . . . . . . . . . . . . . . . . . . . . . . 7
Calgary eCOnOMy . . . . . . . . . . . . . . . . . . . . . . . . . . . . . . . . . . 9 GDP . . . . . . . . . . . . . . . . . . . . . . . . . . . . . . . . . . . . . . . . . . . . . . . . . . . . . . . . . 9
Employment . . . . . . . . . . . . . . . . . . . . . . . . . . . . . . . . . . . . . . . . . . . . . . . . 10
Net Migration . . . . . . . . . . . . . . . . . . . . . . . . . . . . . . . . . . . . . . . . . . . . . . . . 11
Calgary hOusing MarkeT . . . . . . . . . . . . . . . . . . . . . . . . . 12 Rental . . . . . . . . . . . . . . . . . . . . . . . . . . . . . . . . . . . . . . . . . . . . . . . . . . . . . . 12
New Home . . . . . . . . . . . . . . . . . . . . . . . . . . . . . . . . . . . . . . . . . . . . . . . . . . 12
Resale . . . . . . . . . . . . . . . . . . . . . . . . . . . . . . . . . . . . . . . . . . . . . . . . . . . . . . 14
Single Family . . . . . . . . . . . . . . . . . . . . . . . . . . . . . . . . . . . . . . . . . . . . . . . 16
Condominium . . . . . . . . . . . . . . . . . . . . . . . . . . . . . . . . . . . . . . . . . . . . . . . 18
FOreCasT risk . . . . . . . . . . . . . . . . . . . . . . . . . . . . . . . . . . . . . 21
FOreCasT suMMary . . . . . . . . . . . . . . . . . . . . . . . . . . . . . . . .22
reFerenCes . . . . . . . . . . . . . . . . . . . . . . . . . . . . . . . . . . . . . . . .23
Mid year updaTe
CREB® 2014 EConomiC outlook & REgional maRkEt FoRECast - mid yEaR updatE 3

First-quarter growth fell short of expectations, causing many economists to lower their global forecasts. This was partly due to weaker growth in the U.S., China, Eurozone and other emerging markets. Despite the slow start, stimulus measures announced in the Eurozone and positive momentum in the U.S. Employment sector are expected to give rise to stronger economic activity as we move through 2014 into 2015.
REAL GDP GROWTH
European Union
China
World Canada
United StatesSource: International Monetary Fund,
World Economic Outlook Update, April 2014
-5
-3
-1
1
3
5
7
9
11
13
15
2007 2008 2009 2010 2011 2012 2013E 2014F
glObal eCOnOMysummary
eurozoneFirst-quarter growth results were below expectations for the Eurozone. Combined with a high Euro and low inflation, European central bank took action in June that included lowering the Eurozone’s interest rates and taking measures to support credit growth. While countries such as Germany and the U.K. outperformed expectations, several peripheral countries such as Italy and France struggled. It is expected that the steps taken by the central bank will support some growth in periphery economies’ export sectors. Despite the disappointing start, forecasts still point toward modest growth in 2014. However, substantial growth throughout the region is not expected for several years.
-4
-3
-2
-1
0
1
2
3
France Germany Ireland Italy Portugal Spain UnitedKingdom
EuropeanUnion
%
GDP GROWTH EUROPE
2012 2013(E) 2014(F)Source: International Monetary Fund,
World Economic Outlook Update, April 2014
CREB® 2014 EConomiC outlook & REgional maRkEt FoRECast - mid yEaR updatE4

Much of the global growth expectations this year were predicated on a rebound in the U.S. economy. However, first-quarter results showed the opposite. Experts indicate much of this was due to poor weather, slowing housing market and lower business output as companies cleared out excess inventory from 2013. The housing market was not only affected by poor weather. It also faced the combined impacts of higher lending rates, lending constraints and double-digit price growth. Despite those early challenges, there was also significant positive momentum regarding employment. Nationally, all positions that were lost during the recession have since been recovered.
Moving forward, forecasters expect that, despite the first-quarter setback, momentum is building and economic conditions will gain speed throughout the year. This optimism is based on factors such as accelerating job growth, reversal of regulatory constraints impacting housing, improved household balance sheets, rising business confidence and diminishing fiscal drag. (TD Bank)
The pace of growth is slowing in China, where there is continued need for both financial and economic reforms. The country is currently attempting to increase consumption instead of investment demand, which is expected to benefit over the long term yet it can create short-term uncertainty. The concern has mostly to do with the property market and how current changes will impact the financial system and, ultimately, commodity prices.
Emerging markets growth is also expected to decelerate this year. While geopolitical issues in areas such as Russia, Thailand and Venezuela are impacting their respective economies, other emerging markets are facing restraining growth with tightening fiscal conditions. However, as economic growth picks up speed in advanced economies, this should generate a positive spillover effect in emerging markets by the end of this year and into the next. (Bank of Canada)
us economy
china and emerging markets
Jan ‘07 Jan ‘08 Jan ‘09 Jan ‘10 Jan ‘11 Jan ‘12 Jan ‘13 Jan ‘14124,000,000
126,000,000
128,000,000
130,000,000
132,000,000
134,000,000
136,000,000
138,000,000
140,000,000
-6%
-5%
-4%
-3%
-2%
-1%
0%
1%
2%
3%
US EMPLOYMENT
US Bureau of Labor Statistics,Conference Board of CanadaEmployment Growth Y/Y Employed
CREB® 2014 EConomiC outlook & REgional maRkEt FoRECast - mid yEaR updatE 5

Canada’s economy grew at a slower-than-expected pace in the first quarter, mirroring the weak U.S. economy. As the U.S. economy gains speed and a weaker dollar improves our competitive advantage, Canada is expected to record export gains, resulting in stronger economic growth.
Growth in non-energy exports is tied to the U.S. economic expansion, and will be reflected in industries such as logging and building materials. Unlike energy exports, experts indicate growth in non-energy sectors will be at a slower pace than foreign demand as our industry continues to face some competitive challenges. Faster growth in the energy export market reflects increased use of Canadian heavy oil in U.S. refineries. Further growth in rail transport capacity and higher energy prices should contribute to rising revenues and profits in the resource sector. (Bank of Canada)
While business investment is also expected to improve, it is not expected to generate significant job growth this year. Slack in the labour market and moderating consumer spending will likely not place much upward pressure on inflation. As a result, interest rates are expected to remain low well into 2015.
Q1 ‘01 Q1 ‘02 Q1 ‘03 Q1 ‘04 Q1 ‘05 Q1 ‘06 Q1 ‘07 Q1 ‘08 Q1 ‘09 Q1 ‘10 Q1 ‘11 Q1 ‘12 Q1 ‘13 Q1 ‘14
Canada-US Exchange Rate, Quarterly
CANADIAN EXCHANGE RATE
Source: Conference Board of Canada
0
0.2
0.4
0.6
0.8
1
1.2
glObal eCOnOMycanada
Source: Provincial Economic Forecast, TD Economics July 8, 2014 2014(F)
2.3%
3.5%
1.9%
2.1%
2.0%
1.8%
1.4%
1.6%
.8%
1.4%
2.2%
British Columbia
Alberta
Saskatchewan
Manitoba
Ontario
Quebec
New Brunswick
Nova Scotia
Newfoundland and Labrador
Price Edward Island
Canada
REAL ANNUAL GDP GROWTH
CREB® 2014 EConomiC outlook & REgional maRkEt FoRECast - mid yEaR updatE6

Alberta’s economy continues to be fuelled by oil sands investments and oil production. Heavy-oil upgrading facilities in the U.S. have increased that country’s capacity to take on increasing amounts of Alberta heavier crudes. This defies speculation that increased production in the U.S. energy sector would reduce demand for Canadian oil. In fact, because U.S. energy production focuses on light oil – and unless refineries find a cost advantage to switch – those that still require heavy oil will continue to turn to Canada. While there still exists significant uncertainty regarding pipeline approvals and we face elevated risk by being highly reliant on the U.S. market, oil-by-rail and other alternative transport methods has provided producers with an alternative to get their products to market, and is supporting growth.
The AER estimates oil sands capital expenditures will decrease to $23.7 billion in 2014 from $24.2 billion in 2013. The prediction is based on decisions by some oil sands companies to cut their capital budget spending and delay the development of upcoming projects as a result of increased pressure from lower-cost conventional oil development in Canada and the U.S. At the same time, conventional oil and gas investment expenditures have also recovered. Based on total investment figures, oil and gas investment levels are still far above the levels of capital spending that occurred during the 2006-08 peak.
alberta and energy
ALBERTA CONVENTIONAL OIL AND GAS AND OIL SANDS CAPITAL EXPENDITURE
Source: Canadian Association of Petroleum Producers, AER
0
2003 2005 2007 2009 2011
Actual Forecast
2013 2015 2017 2019 2021 2023
20
40
60
80
Billions Cdn$
OIL SANDS
CONVENTIONAL OIL AND GAS
CREB® 2014 EConomiC outlook & REgional maRkEt FoRECast - mid yEaR updatE 7

Note: oil prices
New crude oil rail and pipeline transportation projects came online in 2013 in central U.S. (Cushing), helping reducing transportation bottlenecks, lowering inventories by nearly half and supporting some recent price growth in WTI prices. According to EIA, this should help support average WTI prices of $98.67 per barrel in 2014, up from its previous estimate that showed a slight decline in 2014 prices. Oil prices are extremely volatile and often influenced by geopolitical risk. Recent political uncertainty is placing upward pressure on prices. If tensions ease and shale oil production rises at greater-than-expected levels, then prices will trend downward.
Note: Natural gas
Several LNG export projects have been proposed on the coast of British Columbia that would help producers reach emerging markets in Asia. With an oversupply in North America, the ability to reach a growing market would provide significant upside to Canada’s natural gas sector. As of early 2014, the National Energy Board has issued export licences for the Kitimat LNG Operating General Partnership , B.C. LNG Export Co-operative LLC and LNG Canada Development Inc.. It had also approved five other projects to export LNG from the B.C. coast to Asia-Pacific markets. While this would support a renewal in Alberta’s natural gas sector, there are still several pending regulatory approvals and investment decisions indicating project development at earliest would commence by late 2015.
While oil sands investment is expected to ease this year, rising production should fuel exports and support 3.5 per cent growth in the province’s economy compared to 3.8 per cent in 2013. This would make Alberta the highest growth province in the country. (TD Economics) Other sectors will also continue to benefit from the energy sector, notably manufacturing as it attempts to meet demand for machinery.
The province has also benefited from strong net migration, employment and wage growth. The spinoff effects have fuelled growth in the consumer sector and housing markets.
alberta and energy continued
200o2001
20022003
20042005
20062007
20082009
2010 2011 2012 20132014F2015F 2017F2016F
ALBERTA POPULATION GROWTH
0
500,000
1,000,000
1,500,000
2,000,000
2,500,000
3,000000
3,500,000
4,000,000
4,500,000
5,000,000
0.0%
0.5%
1.0%
1.5%
2.0%
2.5%
3.0%
3.5%
4.0%
Source: Statistics Canada, Conference Board of Canada adjustment,Conference Board of Canada ForecastPopulation Growth Total Population
-
20
40
60
80
100
120
140
160 US $ / BBL
CRUDE OIL PRICE
Source: Alberta Oil Sands BVM, PEMEX,Statistics Canada
Jan‘05
Jun‘05
Nov‘05
Apr‘06
Sep‘06
Feb‘07
Jul‘07
Dec‘07
May‘08
Oct‘08
Mar‘09
Aug‘09
Jan‘10
Jun‘10
Nov‘10
Apr‘11
Sep‘11
Feb‘12
Jul‘12
Dec‘12
May‘13
Oct‘13
Mar‘14
Brent Crude Oil Price WTI Crude Oil Price Western Canadian Select
CREB® 2014 EConomiC outlook & REgional maRkEt FoRECast - mid yEaR updatE8

Calgary’s economy continues to benefit from growth in the energy sector and spinoff effects. Based on Conference Board of Canada figures, Calgary’s economy grew by 3.7 per cent in 2013 and is forecasted to expand by 3.4 per cent in 2014.
While almost all sectors improved in 2013, growth was mostly boosted by the energy sector as primary and utilities output grew by five per cent. This is the most important sector in Calgary’s economy as it is responsible for more than 30 per cent of the region’s GDP. Growth is expected to continue in all areas in 2014. However, the strongest gains are expected in manufacturing, construction and business services.
Calgary eCOnOMy gdp
CALGARY CMA GDP GROWTH
0
20,000
40,000
60,000
80,000
100,000
120,000
140,000
-6%
-4%
-2%
0%
2%
4%
6%
8%
Milliions ($2002)
Source: Statistics Canada,Conference Board of Canada ForecastAnnual Growth Total GDP
2007 2006 2005 2004 2003 2002 2001 2008 2009 2010 2011 2012 2013 2014F 2015F
INDUSTRY SHARE BY TOTAL GDP
Source: Statistics Canada, Conference Board of Canada Forecast2013
0%
5%
10%
15%
20%
25%
30%
35%
Primary and
Utilities
Constructio
n
Manufacturing
Wholesale and
Retial Trade
Transportatio
n
and Warehousin
g
Informatio
n and
Cultural In
dustries
Finance, Insurance
and Real Estate
Business
Services
Non-commercial
ServicesPerso
nal
Services Public
Administratio
n
CREB® 2014 EConomiC outlook & REgional maRkEt FoRECast - mid yEaR updatE 9

The Calgary area generated more than 48,000 full- and part-time jobs over the past two years; 96 per cent were full-time. Another 18,000 jobs are expected in 2014, a 2.3 per cent gain year-over-year
Business services represent more than 16 per cent of the total employment share within the Calgary CMA, and in 2013 recorded the largest increase in new positions. After the first half of 2014, employment gains have been strongest in the personal services and construction sectors.
employment
-2%
CALGARY CMA EMPLOYMENT GROWTH
500,000
550,000
600,000
650,000
700,000
750,000
800,000
850,000
900,000
0%
2%
4%
6%
8%
10%
2003 2004 2005 2006 2007 2008 2009 2010 2011 2012 2013 2014F
Y/Y % Change Average Annual Employed
Source: Seasonally adjusted data, Statistics Canada,Conference Board of Canada Forecast% Change (Y/Y) Total Employment
3.73%2.89%
2.33%
EMPLOYMENT SHARE BY INDUSTRY CALGARY CMA
Source: Statistics Canada, Conference Board of Canada Forecast2013
Primary and
Utilities
Constructio
n
Manufacturing
Wholesale and
Retial Trade
Transportatio
n
and Warehousin
g
Informatio
n and
Cultural In
dustries
Finance, Insurance
and Real Estate
Business
Services
Non-commercial
ServicesPerso
nal
Services Public
Administratio
n
0%
2%
4%
6%
8%
10%
12%
14%
16%
18%
CREB® 2014 EConomiC outlook & REgional maRkEt FoRECast - mid yEaR updatE10

Employment opportunities in the Calgary region supported a 4.3 per cent population growth in 2013. Most of this growth was in the form of net migration. Based on Conference Board of Canada estimates, a record 45,000 people moved to the census metropolitan area (CMA) in 2013. This follows the previous record set in 2012 with 30,000 net migrants, and was well above typical levels for the Calgary CMA.
As other provincial economies improve, migration levels in the city are expected to ease to just under 18,000 this year. While this is a significant drop compared to last year, it is more comparable to long-term averages. Nonetheless, the influx of people into the census area over the past two years will continue to support housing demand growth for the remainder of 2014.
net migration
CALGARY CMA NET MIGRATION
Source: City of Calgary Census, City of Calgary Forecast
2003200220012000 2004 2005 2006 2007 2008 2009 2010 2011 2012 2013 2014F5,000
10,000
15,000
20,000
25,000
30,000
35,000
40,000
45,000
50,000
CREB® 2014 EConomiC outlook & REgional maRkEt FoRECast - mid yEaR updatE 11

Strong net migration has reduced rental vacancy rates and driven up rental rates. April rental rates in the Calgary CMA increased by five per cent over April 2013, while vacancy levels remained relatively tight at 1.4 per cent, according to the most recent CMHC survey in spring 2014.
Rising rental rates and fewer options have encouraged consumers to consider ownership. As a result, affordable housing products in the resale market have been the most competitive over the past year.
Increased rental construction and improving supply in the condominium sector may reduce some of the pressure on the rental market. However, given the influx of net migrants over the past two years, tight rental market conditions will likely persist into 2015.
Tight market conditions in the resale market combined with rising prices has supported growth in the new home sector over the past two years. Starts in 2013 totalled 12,584 units, a two per cent decline over the previous year as multi-family construction pulled back from near record-setting levels set in 2012. Single-family starts totaled 6,402 units in 2013, a 7.4 per cent increase compared to 2012.
After the first five months of 2014 total starts reached 6,887 units, a 48 per cent increase compared to the same period the year prior. Current gains are related to the surge in the multi-family starts and continued gains in the single-family sector. Despite the increase in overall housing starts, product currently under construction is still below historical highs and inventory levels remain below historical norms.
Calgary hOusing MarkeT rental
new home
Jan‘01
Jan‘02
Jan‘03
Jan‘04
Jan‘05
Jan‘06
Jan‘07
Jan‘08
Jan‘09
Jan‘10
Jan‘11
Jan‘12
Jan‘13
CALGARY CMA NEWLY COMPLETED AND UNOCCUPIED
0
200
400
600
800
1,000
1,200
1,400
1,600
1,800
Single Family Multi Family Source: CMHC
CREB® 2014 EConomiC outlook & REgional maRkEt FoRECast - mid yEaR updatE12

Overall, starts are forecasted to increase by 14.7 per cent by the end 2014 for a total of 14,437 units. Half of those starts are expected to be multi-family product. Based on migration growth and resale market supply, overall excess supply due to new construction in is not expected in 2014.
new home continued
2001 2002 2003 2004 2005 2006 2007 2008 2009 2010 2011 2012 2013 2014F
CALGARY CMA HOUSING STARTS SINGLE FAMILY
7%13%
-
2,000
4,000
6,000
8,000
10,000
12,000
Source: CMHC, Conference Board of Canada Forecast
Y/Y % Change
Y/Y % Change CALGARY CMA HOUSING STARTS MULTI FAMILY
2001 2002 2003 2004 2005 2006 2007 2008 2009 2010 2011 2012 2013 2014F
-10%
63%17%
-
1,000
2,000
3,000
4,000
5,000
6,000
7,000
8,000
Source: CMHC, Conference Board of Canada Forecast
CREB® 2014 EConomiC outlook & REgional maRkEt FoRECast - mid yEaR updatE 13

Sales activity in Calgary’s resale market for the first half of 2014 increased to 13,929 units, a 13.6 per cent increase compared to 2013. While double-digit sales growth is appearing to be the norm, the key difference this year has been higher supply levels. In June, citywide year-over-year inventory levels increased for the first time since February 2011. While market conditions continue to remain tight, this does point to a shift in our market.
Overall sales activity in the Calgary market picked up in the second quarter as there was a corresponding increase in new listings. In fact, second-quarter listings increased above long-term trends, and outpaced sales growth for the first time since 2011.
The rise in new listings relative to the sales growth helped support small gains in inventory levels. While never dropping to historical lows, the increase relative to sales activity should help push the market into more balanced conditions as we move throughout the year.
resale
CALGARY SALES AND LISTING GROWTH
-60%
-40%
-20%
0%
20%
40%
60%
80%
12 per. mov. avg. (new listings growth y/y) 12 per. mov. avg. (sales growth y/y)
Jan‘01
Jan‘02
Jan‘03
Jan‘04
Jan‘05
Jan‘06
Jan‘07
Jan‘08
Jan‘09
Jan‘10
Jan‘11
Jan‘12
Jan‘13
Jan‘14
Source: CREB®
Jun ‘04 Jun ‘05 Jun ‘06 Jun ‘07 Jun ‘08 Jun ‘09 Jun ‘10 Jun ‘11 Jun ‘12 Jun ‘13 Jun ‘14
CALGARY MONTHLY COMPARISON ESTIMATED ACTIVE LISTINGS
0
1,000
2,000
3,000
4,000
5,000
6,000
7,000
8,000
9,000
10,000
Source: CREB®Single family estimated inventory Apartment estimated inventory Townhouse estimated inventory
CREB® 2014 EConomiC outlook & REgional maRkEt FoRECast - mid yEaR updatE14

The rise in new listings was partly due to increases in prices. Unadjusted benchmark prices recovered to pre-peak levels in October 2013, the first time in nearly six years. For some consumers, this provided equity gains and encouraged them to take advantage of current rising prices to either upsize or downsize their home. Total benchmark prices in Calgary averaged $443,500 by the end of June, a 10 per cent increase over the previous year.
While rising listings were expected to ease some market pressure, record migration levels created a more prolonged period of stronger-than-expected housing demand, delaying a more balanced market and fostering continued price growth.
While indicators such as the sales-price-to-list-price ratio, days on market and sales-to-new listings ratio all trended toward tighter market conditions, none of them tightened to levels recorded during the last boom, supporting our analysis that the housing market today continues to remain different then the 2006-07 period. Moreover, recent movements in these figures point to a trend of easing tightness.
resale continued
CALGARY MONTHS OF SUPPLY AND PRICE CHANGES
Source: CREB®
Jan‘01
Jan‘02
Jan‘03
Jan‘04
Jan‘05
Jan‘06
Jan‘07
Jan‘08
Jan‘09
Jan‘10
Jan‘11
Jan‘12
Jan‘13
Jan‘14
Months of supply trend (12 mo.) Benchmark y/y price change
-20%
-10%
0%
10%
20%
30%
40%
50%
60%
70%
0
1
2
3
4
5
6
CREB® 2014 EConomiC outlook & REgional maRkEt FoRECast - mid yEaR updatE 15
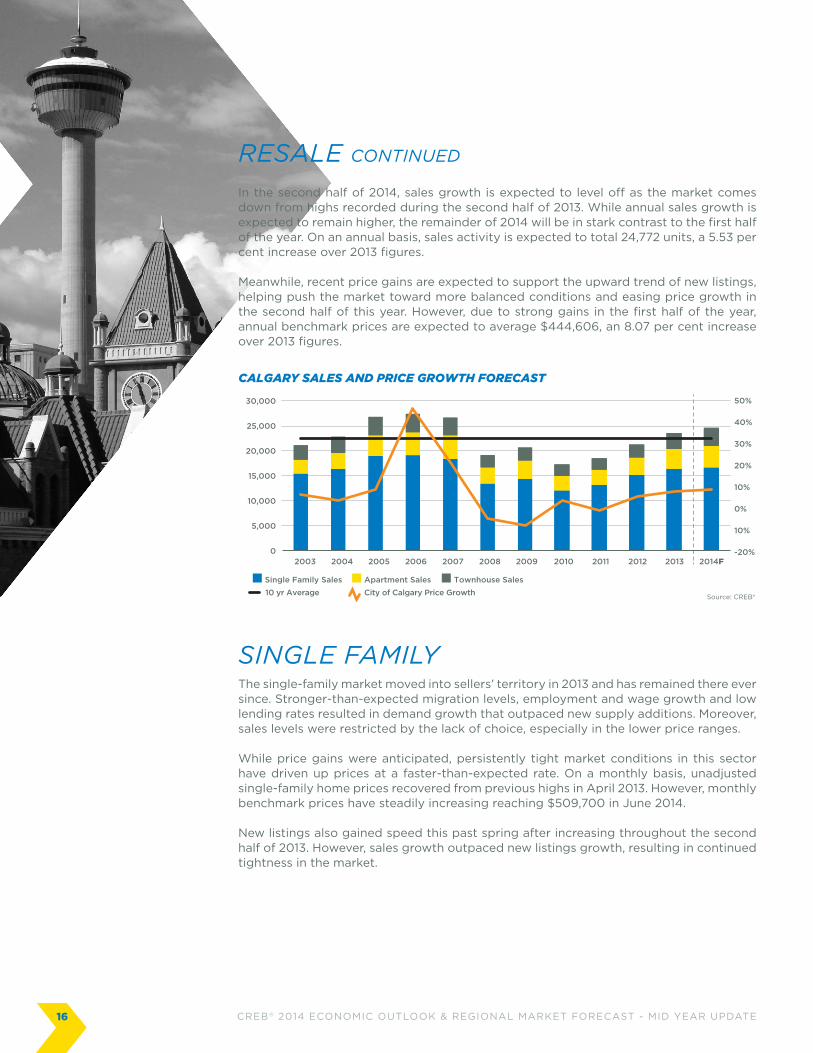
In the second half of 2014, sales growth is expected to level off as the market comes down from highs recorded during the second half of 2013. While annual sales growth is expected to remain higher, the remainder of 2014 will be in stark contrast to the first half of the year. On an annual basis, sales activity is expected to total 24,772 units, a 5.53 per cent increase over 2013 figures.
Meanwhile, recent price gains are expected to support the upward trend of new listings, helping push the market toward more balanced conditions and easing price growth in the second half of this year. However, due to strong gains in the first half of the year, annual benchmark prices are expected to average $444,606, an 8.07 per cent increase over 2013 figures.
The single-family market moved into sellers’ territory in 2013 and has remained there ever since. Stronger-than-expected migration levels, employment and wage growth and low lending rates resulted in demand growth that outpaced new supply additions. Moreover, sales levels were restricted by the lack of choice, especially in the lower price ranges.
While price gains were anticipated, persistently tight market conditions in this sector have driven up prices at a faster-than-expected rate. On a monthly basis, unadjusted single-family home prices recovered from previous highs in April 2013. However, monthly benchmark prices have steadily increasing reaching $509,700 in June 2014.
New listings also gained speed this past spring after increasing throughout the second half of 2013. However, sales growth outpaced new listings growth, resulting in continued tightness in the market.
resale continued
single family
CALGARY SALES AND PRICE GROWTH FORECAST
Source: CREB®
-20%
10%
0%
10%
20%
30%
40%
50%
Single Family Sales
City of Calgary Price Growth10 yr Average
Apartment Sales Townhouse Sales
0
5,000
10,000
15,000
20,000
25,000
30,000
2003 2004 2005 2006 2007 2008 2009 2010 2011 2012 2013 2014F
CREB® 2014 EConomiC outlook & REgional maRkEt FoRECast - mid yEaR updatE16

While new listings in the resale market improved, the gains largely occurred in higher price ranges. Listings are expected to continue to rise in this sector, while availability in the lower price ranges will likely decline. As a result, the single-family market may demonstrate different behaviours depending on the price range.
Moving forward, buyers looking for more affordable product are expected to shift their attention to the condominium market and surrounding areas due to fewer choices in Calgary’s lower-priced single-family market. Overall, single-family sales in the city are expected to increase by 3.9 per cent in 2014 to 16,928 units.
Price gains, albeit slower in the second half of the year, will continue to support a rise in new listings and help move Calgary’s single-family housing market toward more balanced conditions by the end of 2014 and into 2015. Overall, single-family prices are expected to increase by 7.89 per cent for an annual average benchmark price of $494,154 in 2014.
single family continued
CALGARY PRICE AND LISTINGS GROWTH SINGLE FAMILY
Source: CREB®
-60%
-40%
-20%
0%
20%
40%
60%
80%
Jan‘01
Jan‘02
Jan‘03
Jan‘04
Jan‘05
Jan‘06
Jan‘07
Jan‘08
Jan‘09
Jan‘10
Jan‘11
Jan‘12
Jan‘13
Jan‘14
New listings y/y change Benchmark price growth
CALGARY YTD NEW LISTINGS BY PRICE RANGE SINGLE FAMILY
Source: CREB®Year to date
0
500
1,000
1,500
2,000
2,500
3,000
3,500
4,000
4,500
<$200,000 $200,000 - $299,999
$300,000 - $399,999
$400,000 - $499,999
$500,000 - $599,999
$600,000 - $699,999
$700,000 - $999,999
$1,000,000+
YTD June 2011 YTD June 2012 YTD June 2013 YTD June 2014
Note:
One factor to consider is the supply coming from the new home sector. While single-family starts improved during the first half of 2014 and are forecast to continue throughout the year, the levels continued to be well below pre-recession averages. This is in contrast to multi-family starts, which were not only comparable to pre-recession construction, but accounted for nearly half of total starts in Calgary from January to June. Longer term, this will continue to impact the share of single-family sales relative to the entire market. Single-family sales and new listings in the first half of 2014 represented 67 per cent of new home activity in the city, down from 70 per cent in 2013.
CREB® 2014 EConomiC outlook & REgional maRkEt FoRECast - mid yEaR updatE 17

single family continued
2003 2004 2005 2006 2007 2008 2009 2010 2011 2012 2013 2014F
CALGARY SALES AND PRICE GROWTH FORECAST SINGLE FAMILY
-10%
0%
10%
20%
30%
40%
50%
0
2,000
4,000
6,000
8000
10,000
12,000
14,000
16,000
18,000
20,000
Source: CREB®Single family sales Price growth10 yr average
Tight rental markets and declining supplies in the lower-priced single-family market boosted demand for condominium product during the first half of 2014. Condominium apartment sales totalled 2,494 units, a 23 per cent increase over the same time last year. The sector’s strength was not limited to the apartment-style units, either. After the first half of the year, condominium townhouse sales increased by 20 per cent for a total of 2,009 sales.
New listings for condominium apartments had been declining for the better part of the past three years, which helped reduce the excess inventory and support price gains in the sector. However, market conditions did not move into sellers’ territory until the later part of 2013, at which time price growth increased. While price gains have been higher than expected so far this year, it is important to note that it wasn’t until June 2014 that unadjusted monthly benchmark prices for condominium apartments recovered from previous highs.
condominium
YTD ‘04 YTD ‘05 YTD ‘06 YTD ‘07 YTD ‘08 YTD ‘09 YTD ‘10 YTD ‘11 YTD ‘12 YTD ‘13 YTD ‘14
CALGARY YTD COMPARISON SALES YTD-JUN
Source: CREB®
0
500
1,000
1,500
2,000
2,500
3,000
3,500
Apartment Townhouse
CREB® 2014 EConomiC outlook & REgional maRkEt FoRECast - mid yEaR updatE18

condominium continued
Jan‘01
Jan‘02
Jan‘03
Jan‘04
Jan‘05
Jan‘06
Jan‘07
Jan‘08
Jan‘09
Jan‘10
Jan‘11
Jan‘12
Jan‘13
Jan‘14
CALGARY BENCHMARK PRICE AND GROWTH APARTMENT
0
50,000
100,000
150,000
200,000
250,000
300,000
350,000
-30%
-20%
-10%
0%
10%
20%
30%
40%
50%
60%
70%
80%
Benchmark price growth Benchmark price Source: CREB®
So far in 2014, new listings in the condominium market have improved, and even exceeded, sales growth, pushing up inventory levels and creating more balanced conditions. While price gains continue to be relatively strong, this should ease price growth moving into the second half of 2014.
-60%
-40%
-20%
0%
20%
40%
60%
80%
100%
120%
CALGARY ANNUAL SALES AND LISTING GROWTH APARTMENT
Source: CREB®12 per. mov. avg. (new listings growth y/y) 12 per. mov. avg. (sales growth y/y)
Jan‘01
Jan‘02
Jan‘03
Jan‘04
Jan‘05
Jan‘06
Jan‘07
Jan‘08
Jan‘09
Jan‘10
Jan‘11
Jan‘12
Jan‘13
Jan‘14
Demand for condominium apartment product is expected to remain strong for the remainder of the year as tight rental market conditions, combined with low mortgage rates, encourage ownership in this typically more affordable sector. Sales are expected to total 4,406 units in 2014, a 10 per cent increase over the previous year.
While sales activity is expected to remain relatively strong, so too will new listings, helping further push the market into balanced territory. This should limit some of the pressure on price appreciation. Overall, average annual condominium apartment benchmark prices are expected to increase by 8.8 per cent to $289,789 in 2014.
CREB® 2014 EConomiC outlook & REgional maRkEt FoRECast - mid yEaR updatE 19

The condominium townhouse sector has also benefited from rising demand. The recent rise in listings has helped improve inventory levels. However, unlike the apartment sector, the townhouse market continues to remain relatively tighter. Furthermore, despite steady gains in prices, monthly unadjusted benchmark prices continue to remain just below peak levels.
Moving forward, new listings are expected to rise, helping ease market tightness. However, strong demand will likely create persistently tight conditions until later in the year, resulting in further price gains in this market. Overall, the annual average benchmark price is expected to total $318,267 in 2014, an eight per cent increase over the previous year.
condominium continued
According to a City of Calgary assessment, 1,939 properties required an adjustment to their assessments due to the flood, representing less than 0.4 per cent of the residential properties in Calgary. The small share would not influence citywide aggregate figures. Yet there can be some impact at a community level as these properties come back onto the market. Many questions remain unanswered regarding the long-term impacts in flood-affected areas. Much of this will continue to depend on risk-mitigation measures and time without another incident.
Last year’s flood prompted a pullback in demand in impacted areas. However, demand is returning. This shouldn’t come as a surprise as many of these communities are in close proximity to downtown. Calgary has also been fortunate to benefit from strong migration, creating tight supply and a rising property market.
What is not clear is the flood’s impact on home values. Many of the inner city homes were sold as a redevelopment opportunity, which could provide significant uplift to many ageing properties. However, there is not enough information to clearly indicate what, if any, value depreciation is applied after remediation.
note: flood update
2011 2012 2013 2014F
CALGARY CONDOMINIUM PRICE COMPARISON
$239,817
$244,992
$266,350 $289,789
$269,892
$277,167
$294,692
$318,267
$0
$50,000
$100,000
$150,000
$200,000
$250,000
$300,000
$350,000
$400,000
$450,000
$500,000
-4%
-2%
0%
2%
4%
6%
8%
10%
Source: CREB®Apartment price growthApartment benchmark price
Townhouse price growthTownhouse benchmark price
CREB® 2014 EConomiC outlook & REgional maRkEt FoRECast - mid yEaR updatE20

As CREB® continues to work to improve the integrity and quality of its data, it will be making adjustments to better reflect the type of product being measured. This will include a shift toward measuring detached, attached, and apartment-style product. All historical data will be adjusted based on the new classifications.
In addition, CREB® will also be improving its regional data by reporting on areas where its membership is focused. This will result in more reliable trends in surrounding areas.
One final change is CREB® will be adding the Calgary CMA classification as defined by Statistics Canada. This will allow analysts to better compare economic indicators to CREB® resale market data.
Economic risk continues to be tied to weaker-than-expected growth in developing economies and a sharper-than-anticipated slowdown in China. This could impact the financial market, place downward pressure on commodity prices and impact exports and overall growth expectations.
Alberta continues to have risk regarding market access for energy products. While the use of rail had aided in relieving some bottlenecks, long-term growth will be dependent on market access and price volatility for commodities.
With no pressure on near-term lending rates, concerns about affordability due to rising prices will be cushioned by rising incomes. However, a setback in the economic climate, particularly in the energy sector, could have a larger-than-expected impact on demand.
Much of the housing risk continues to lie with supply levels, which have improved. Yet if the pace of growth does not meet demand then price gains could continue at higher-than-expected rates.
Concern also lies with a possible disconnect between consumer demand and available supply. This could result in some pockets of the market being oversupplied and others being undersupplied, impacting aggregate price gains.
note: data changes coming in 2015
FOreCasT risk
CREB® 2014 EConomiC outlook & REgional maRkEt FoRECast - mid yEaR updatE 21

FOreCasT suMMary
Economic indicators 2011 2012 2013 2014 (F) Forecaster
calgary GdP Growth 5.38% 3.94% 3.71% 3.41% Conference Board of Canada
calgary cma net migration 10,861 31,996 45,168 17,540 Conference Board of Canada
calgary Employment Growth 2.96% 3.73% 2.89% 2.33% Conference Board of Canada
average residential mortgage Lending rate 5 year 4.57% 4.24% 4.17% 4.49% Conference Board
of Canada
Housing starts: single Family 5,084 5,961 6,402 7,205 Conference Board of Canada
Housing starts: multiple Family 4,208 6,880 6,182 7,232 Conference Board of Canada
apartment rental rates** 1,084 1,150 1,224 1,290 CMHC
apartment Vacancy rates** 2.0% 1.30% 1.0% 1.20% CMHC
Wti Price 94.87 94.11 97.91 98.67 U.S. Energy Information Administration
Henry Hub Price 3.99 2.75 3.73 4.91 U.S. Energy Information Administration
**Figures based on October Survey, 2013 represent actual figures
mLs® rEsaLE markEt 2011 2012 2013 2014 (F) Forecaster
city of calgary
Sales 18,494 21,202 23,475 24,722 (5.5% ) CREB®
Price Growth -1.23% 5.43% 7.87% 8.07% (444,606*) CREB®
New Listings 34,068 31,844 32,153 34,839 (8.4%) CREB®
city of calgary single Family
Sales 13,118 15,105 16,294 16,928 (3.9%) CREB®
Price Growth -0.68% 6.65% 7.84% 7.9% (494,154*) CREB®
city of calgary condominium apartment
Sales 3,139 3,500 4,005 4,406 (10.0%) CREB®
Price Growth -2.48% 2.16% 8.72% 8.8% (289,789) CREB®
city of calgary condominium townhouse
Sales 2,237 2,598 3,176 3,438 (8.25%) CREB®
Price Growth -2.63% 2.70% 6.32% 8.0% (318,267*) CREB®
*Benchmark Price
CREB® 2014 EConomiC outlook & REgional maRkEt FoRECast - mid yEaR updatE22

reFerenCesAlberta Energy Regulator - Alberta’s Energy Reserves and Supply / Demand Outlook, ST98 – 2014
Baytex Energy Corp – Q2 2014 Heavy Oil Pricing Update – July, 2014
Bank of Canada – Monetary Policy Report – July 2014
CAPP – Crude Oil Forecast, Markets & Transportation – June 2014
CMHC – Housing Market Outlook - spring 2014
CMHC – Rental Market Report, Alberta Highlights – spring 2014
Government of Alberta – Economic Outlook: Fiscal Plan 2014-17
International Monetary Fund – World Economic Outlook: Recovery Strengthens, Remains Uneven – April 2014
RBC – Research - Economic and Financial Market Outlook, June 2014
RBC – Research - Provincial Outlook – June 2014
RBC Economics – Research: Housing Trends and Affordability May 2014
TD Economics - Quarterly Economic Forecast – Canadian Economic Outlook, June 23
TD Economics - Canadian Quarterly Regional Housing Report, July 3, 2014
TD Economics – Canadian Provincial Economic Forecast, July 8, 2014
The Conference Board of Canada – Calgary: Metropolitan Outlook 1, Spring 2014
U.S. Energy Information Administration (EIA) - Short-term energy outlook, July 8, 2014
CREB® 2014 EConomiC outlook & REgional maRkEt FoRECast - mid yEaR updatE 23

CREB® is a professional body of more than 5,000 licensed brokers and registered associates, representing 277 member offices. CREB® is dedicated to enhancing the value, integrity and expertise of its REALTOR® members.
We are committed to equipping our members with the right tools, services and education to achieve professional excellence — and, in turn, enabling REALTORS® to offer the best possible service to their clients.
Our REALTORS® are committed to a high standard of professional conduct, ongoing education, and a strict Code of Ethics and standards of business practice. Using the services of a professional REALTOR® can help consumers take full advantage of real estate opportunities while reducing their risks when buying or selling real estate.
CREB® operates and maintains the Multiple Listing Service (MLS®) System for Calgary and the surrounding area. Through the MLS® System, members and, in turn, their clients have immediate access to the latest information on properties listed for sale. Through the MLS® System, REALTORS® can provide the buying and selling public with the broadest possible market exposure and the most complete and up-to-date market information.
Copyright ©2014 CREB®. All rights reserved. CREB® grants reasonable rights of use of this publication’s content solely for personal, corporate or public policy research, and educational purposes. This permission consists of the right to use the content for general reference purposes in written analyses and in the reporting of results, conclusions and forecasts, including the citation of limited amounts of supporting data extracted from this publication. Reasonable and limited rights of use are also permitted in commercial publications subject to the above criteria, and CREB®’s right to request that such use be discontinued for any reason.
Any use of the publication’s content must include the source of the information, including statistical data, acknowledged as follows: CREB® 2014 Economic Outlook and Calgary Regional Housing Market Forecast.
300 Manning Road NECalgary, AlbertaT2E 8K4, Canada
Phone: 403-263-0530Fax: 403-218-3688Email: [email protected]
creb.comcrebforecast.comcrebnow.com