calibration of a flood model using the mike flood ... · calibration of a flood model using the...
TRANSCRIPT
Calibration of a flood model using the MIKE FLOOD modelling package employing the direct rainfall
technique
M.S. Alam1
1Department of Water, PO Box K822, Perth, WA 6842, Australia Email: [email protected]
Abstract: The MIKE FLOOD modelling package (2012 release) was used to develop and calibrate a hydraulic flood model for the Punrak catchment (located approximately 56 km south of Perth, Western Australia). The model was developed in a coupling environment where 1-D MIKE 11 channel flows interact with the 2-D MIKE 21 overland flows. The interactions take place via a series of well-defined lateral linked cells and standard linked cells. The lateral linked cells run along both banks of the channels/drains. Standard linked cells are located next to the upstream ends of the channels/drains and both ends of a culvert. Rainfall is applied on each computational cell and the runoff is routed within the hydraulic model. In this study, the developed model was calibrated to the 1996 winter event at two gauged locations of the model domain, one at the centre (Hopelands Rd gauging station) and the other at the outlet (Yangedi Swamp gauging station) of the catchment. The predicted results in terms of peak discharge, peak flood level, time to peak and volumes were compared with the observed data. There was fair agreement between predicted and observed results. The peak flood level and total storage volume at the outlet of the catchment were underpredicted by 0.5% and 1.2%, respectively, whereas, the peak discharge was overpredicted by 2.4%. The model results were obtained based on a 10 m grid resolution. A finer grid resolution would have improved the modelling results. It was not considered in this study as this would increase the computational cost significantly. This would also affect the project budget and time-frame. This paper explores the application of the direct rainfall technique, a comprehensive model setup of the MIKE FLOOD model for the study area and detailed comparisons of the calibration results.
Keywords: MIKE 11, MIKE 21, channel flow, overland flow, direct rainfall technique
21st International Congress on Modelling and Simulation, Gold Coast, Australia, 29 Nov to 4 Dec 2015 www.mssanz.org.au/modsim2015
2123

M.S. Alam, Calibration of a flood model using the MIKE FLOOD modelling package…
1. INTRODUCTION
There are numerous methods and techniques available in developing flood models. The rainfall on the grid or the direct rainfall method (DRM) is one of them, which has increased in popularity in recent years. The DRM demands extensive computation in solving shallow water equations at each cell of the model domain and this can be met due to the recent advances in computing power and software technology. The rainfall is applied on the 2D modelling grid and the flows are then routed through the catchment using hydrodynamic equations. The model topography, roughness and loss mechanisms control the routing. The DRM appears attractive to modellers, as it replaces the requirement of developing a hydrologic model within the model domain which in turn reduces project budgets and durations. Curious readers are referred to the 2D modelling guidelines prepared by Engineers Australia (2012) to explore the DRM. Extensive case studies have also been undertaken over the past decade by Hall (2015), Rehman (2011), Clark et al (2008) and Rehman et al (2007). The method selection for developing a hydraulic flood model mainly depends on the study objectives, project time-frames and budget constraints. In this study, the direct rainfall technique was employed using the MIKE FLOOD software package in developing a flood model for the Punrak catchment. This technique has already attracted huge industry attention and does not demand for developing a separate hydrology model within the model domain. This is why this technique is employed in carrying out a flood study for the Punrak catchment. The scope of this paper is very limited compared to the scope of the project for the flood study of the Punrak catchment. This paper only explores application of the direct rainfall technique and a comprehensive model setup of the MIKE FLOOD model for the Punrak catchment, and the modeling results comparisons for the calibration event.
2. STUDY AREA
The Punrak catchment is approximately 56 km south of Perth and covers an area of 68 km2 (Figure 1). The surface elevation varies from around 65 m AHD in the east to 10 m AHD in the west. The Dirk Brook, Karnet Brook, Myara Brook, Karnet Drain, Punrak Sub B and Punrak Drain are the major watercourses in the catchment. The Punrak Drain is the study area’s main waterway and receives most of the catchment runoff through other major drains and channels, and discharges into Lake Amarillo located to the west of the study area. Stock grazing, turf farming, piggeries and horticulture are the major land uses. The catchment is located on the Swan Coastal Plain and characterized by sandy soil and flat terrain. The major watercourses in the study area are not deep or wide enough to
convey flood water all the way down without overtopping. The watertable
within this study area tends to be located within 5 m of the surface. In winter it is within 1 to 2 m due to the direct rainfall recharge that occurs via sandy sediments (Marillier et al., 2012).
3. MIKE 11 and MIKE 21 MODEL DEVELOPMENT
3.1 Model Structure
The hydraulic model for the Punrak catchment was constructed using the MIKE FLOOD modelling package (2012 release) developed by DHI. MIKE FLOOD is a modelling platform where one-dimensional flow is
Figure 1. Punrak catchment model domain showing major watercourses, outlets and stream gauges.
2124

M.S. Alam, Calibration of a flood model using the MIKE FLOOD modelling package…
simulated with MIKE 11 and two-dimensional overland flows using MIKE 21. In this study, the Punrak catchment’s MIKE 11 model was coupled with the MIKE 21 overland flow model in the MIKE FLOOD modelling platform. Coupling was maintained in order to transfer water between the channels and the overland of the model domain. The transfer occurs via a series of MIKE 21 lateral linked cells running along the channels/drains banks and MIKE 21 standard linked cells assigned at the upstream ends of the internal watercourses or assigned at both ends of culverts. For the MIKE 21 lateral linked cells, a weir formula is applied to transport water from the overland to a watercourse or vice versa. The height of the river bank is considered as the height of the weir. It should be mentioned that an approximate elevation difference of 0.20 m was maintained between a linked cell and its corresponding river cross section bank marker to avoid numerical instabilities. In this study, the Myara Brook, Dirk Brook, Karnet Drain, Punrak Sub B and Punrak Drain were modelled using MIKE 11. The Karnet Brook was not included in the MIKE 11 model as the 1 m DEM shows that the channel is not well defined all through and the conveyance is not significant compared to the other channels and drains in the catchment. Inclusion of the Karnet Brook in the MIKE 11 would also force to include a series of lateral linked cells along both banks. This would have been an added complexity to the model setup only to capture an insignificant amount of flow in the watercourse. The overland flow driven by rainfall, infiltration and roughness on a grid was estimated in MIKE 21. Culverts in the model domain were modelled in MIKE 11and were linked to the overland via standard links at both ends of the culvert channel. A culvert channel is a channel which is designed to convey discharge from the upstream end of a culvert to the downstream end. Two cross sections are required, one for each end of a culvert. A culvert channel is usually twice the length of the culvert. Series of lateral linked cells along the channel banks were developed in the MIKE FLOOD coupling environment. The channel inflows and outflows were allowed to happen through those lateral linked cells. For internal channels, inflows were allowed at the upstream ends through standard linked cells. The standard linked cells are MIKE 21 cells which are linked to the end of a MIKE 11 branch. The water levels are firstly computed in MIKE 21 at the linked cells and are assigned to the associated upstream end of a MIKE 11 branch. It should be mentioned that both standard and lateral links are explicit and the local Courant number cannot exceed 2. If the local Courant number is higher than 2 the model blows up.
3.2 MIKE 21 model
3.2.1 Model setup
The MIKE 21 flow model was built to simulate the 2-D overland flow in the study area .The bathymetry of the model domain was developed using a 10 m rectangular grid. Four outlet boundary conditions are considered in the model domain. The main outlet boundary condition was set at the outlet of the Punrak Drain. One was set to the north and the other two were set to the south (see Figure 1). A virtual ramp was developed at each outlet boundary to allow smooth exit of the water out of the model domain. Only wet cells in the 10 m grid were considered for the runoff computation. The model considered a drying and flooding/wetting depth of 2.5 mm and 5 mm, respectively. A time step of 1.5 seconds was used for simulations. A global flux based eddy viscosity of 1.33 m2/s was considered in simulations.
3.2.2 Model topography
The topography for the model domain was developed from the Swan Coastal Plain 1 m LiDAR dataset. The 1 m dataset was clipped to the study area and transformed into a 10 m resolution DEM. This coarse DEM was used to define the MIKE 21 model bathymetry. The resampling to a coarse grid from the finer one was done in order to reduce the computational cost. The cells representing the model boundary or outside the model domain were converted into land cells. Land cells are the cells where the flow generation process is totally avoided as no rainfall, infiltration or resistance to the flow is applied on the cells. In the MIKE FLOOD modelling environment, the river network is laid on the model bathymetry in order to facilitate interactions between 1-D river flows and 2-D overland flows. The cells on which the river network was laid were converted into land cells to rule out dual conveyance. Elevations of the cells representing Punrak Road were modified based on the 1 m LiDAR dataset. The Karnet Drain and Punrak Drain run along Punrak Road which acts as a levee. Accurate elevations were required for Punrak Road in order to ensure that if overtopping happens to the western side of the drains across Punrak Road, it is due to the levee failure, not misrepresentation of the road levels on a coarse grid model. The elevations of the lateral linked cells, which were built along river banks, were also modified based on the MIKE 11 channel bank profiles which were created from a 1 m resolution DEM using MIKE 11 GIS tool. Culverts in the model domain were modelled in MIKE 11. For each culvert, a culvert channel was made in MIKE 11 and the culvert was laid in the middle of the culvert channel. Each culvert channel has one channel cross section at each end and they were linked to MIKE 21 bathymetry cells in order to receive inflow from the one end and supply outflow to the other end.
2125
M.S. Alam, Calibration of a flood model using the MIKE FLOOD modelling package…
The elevations of the standard linked cells were edited based on the bed elevation of the end cross sections of the culvert channels. The upstream ends of the Karnet Drain and Punrak Sub B were linked to the floodplain in MIKE FLOOD modelling environment using standard linked cells. The elevations of those cells were modified based on the bed elevations of the upstream end cross sections of the waterways. The outflow boundary conditions were adopted at four locations in the catchment by introducing downward ramps at the edge of the boundaries to allow smooth exit of water out the model domain. This was done by modifying the elevations of cells which are parts of the ramps.
3.2.3 Rainfall
The main input to the hydraulic model for the Punrak catchment is the time varying spatially distributed rainfall map. The rainfall data was sourced from the Hopelands Road pluviometer located around the centre of the catchment (Figure 1). No rainfall was considered on the land cells and MIKE 21 standard/lateral linked cells to avoid numerical instabilities of the flow routing scheme. Each grid cell of the model domain is effectively a catchment as runoff was calculated at cell level based on the provided surface area (cell size), rainfall depth (from rainfall map), infiltration (from infiltration map), roughness (from roughness map) and the slopes between neighbouring cells.
3.2.4 Infiltration
The infiltration map was produced based on the soil types and inundation from groundwater. The soil map from the Department of Agriculture and Food, and the inundation maps from the Lower Serpentine MIKE SHE model (Marillier et al., 2012) and the Murray MIKE SHE model (Hall et al., 2010) were used to develop this map. A very simplified version of the infiltration map was produced, assuming only three types of infiltration rates in the study area. One is for sand (70 mm/day), another for clay (5 mm/day) and the other a zero infiltration rate for the groundwater inundated areas.
3.2.5 Roughness
A roughness map was developed based on land use. The roughness is classified into three categories: roads and urban, drain and vegetation. As the whole catchment is mostly covered by pastures, for simplicity, only one type of vegetation was considered. A Manning’s M of 40 for roads, 25 for cleared land (covered by dense long grass) and 20 for channels/drains were assigned to the model roughness map. Those values were chosen based on Chow (1959).
3.2.6 Inflows
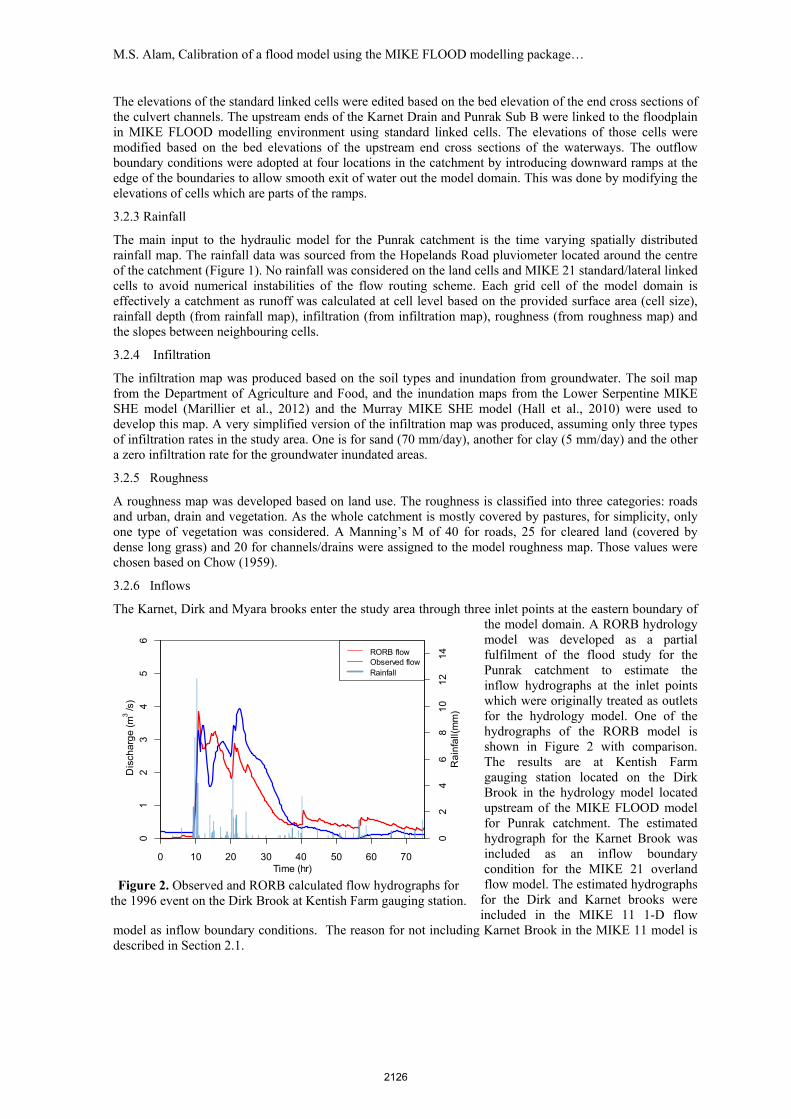
The Karnet, Dirk and Myara brooks enter the study area through three inlet points at the eastern boundary of the model domain. A RORB hydrology model was developed as a partial fulfilment of the flood study for the Punrak catchment to estimate the inflow hydrographs at the inlet points which were originally treated as outlets for the hydrology model. One of the hydrographs of the RORB model is shown in Figure 2 with comparison. The results are at Kentish Farm gauging station located on the Dirk Brook in the hydrology model located upstream of the MIKE FLOOD model for Punrak catchment. The estimated hydrograph for the Karnet Brook was included as an inflow boundary condition for the MIKE 21 overland flow model. The estimated hydrographs
for the Dirk and Karnet brooks were included in the MIKE 11 1-D flow
model as inflow boundary conditions. The reason for not including Karnet Brook in the MIKE 11 model is described in Section 2.1.
0 10 20 30 40 50 60 70
01
23
45
6
02
46
81
01
21
4
Time (hr)
Dis
cha
rge
(m
3 /s)
Ra
infa
ll(m
m)
RORB flowObserved flowRainfall
Figure 2. Observed and RORB calculated flow hydrographs for the 1996 event on the Dirk Brook at Kentish Farm gauging station.
2126
M.S. Alam, Calibration of a flood model using the MIKE FLOOD modelling package…
3.2.7 Overland flow boundary conditions
An overland flow open boundary condition was assigned at the western end of the Punrak Drain, and two in the southern end and one in the northern end of the model domain (marked as outlets in Figure 1). A trench was made at the site of each overland flow open boundary condition. This stops backwater influence from the outflow boundaries by ensuring flood water is spilled out of the model boundary area through the trenches.
3.2.8 Initial conditions
The 10 m resolution DEM was not considered as the initial water level condition in the MIKE 21 model. The reason is that the DEM represents the cell elevation only and does not consider the empty depression storages and wetted conditions in the floodplain. If the depression storages were not filled as an initial condition for a winter storm event, this leads to overestimating depression storages. This is why the MIKE FLOOD model for the Punrak catchment was run for a 72-hour duration simulation period with a 6-hour 20 mm initial rainfall. The empty depression storages were filled with rain water and the floodplain became wet after the model run. The water depth results from the run were converted into an initial water surface elevation map. This map was then used as an initial condition for the actual calibration event run.
3.3 MIKE 11 model
A MIKE 11 model comprises of four data editors, a network editor, a cross sections editor, a boundary file editor and a hydraulic parameter file editor. In this study, the river network was developed using the Myara and Dirk brooks, Punrak Sub B, Karnet and Punrak drains. This network is composed of numerous river segments which are connected via nodes. The nodal points in the network are classified into two categories: a) h-points and, b) q-points. Both ends of a river are marked as h-points and every alternate point is assigned as an h-point. Every q-point is allocated between two h-points. Saint Venant equations are considered at each nodal point. The water level is calculated at h-points by solving the momentum equation and the flow is calculated at q-points by solving the continuity equation. MIKE11 GIS software was used to develop cross sections geometry. Each cross section was examined manually for geometric and conveyance errors and corrections introduced if necessary. Interpolated cross sections were developed at 10 m intervals to ensure the availability of one cross section for each lateral linked cell in the 10 m grid for the model topography. An initial water level for the actual run of the MIKE 11 model was obtained from the MIKE 11 results file produced by the MIKE FLOOD model run with a 6-hour 20 mm initial rain for a 72-hour simulation duration. An inflow boundary condition was implemented at the upstream end of the Dirk Brook and Myara Brook. The upstream end of the Karnet Drain and Punrak Sub B was linked to the MIKE 21 overland flow model with standard link cells. A constant water level boundary condition was applied to the standard links to avoid drying up the cells. Culverts which were found restricting in a 100-year ARI design flood event were included in the model. A total of 13 culverts were included in the model, six of them are under the Hopelands Rd, four of them are under the Westcott Rd and the rest of them are located under the Henderson Rd. Each culvert was coupled with the MIKE 21 overland flow via a standard link at each end.
4. MODEL CALIBRATION
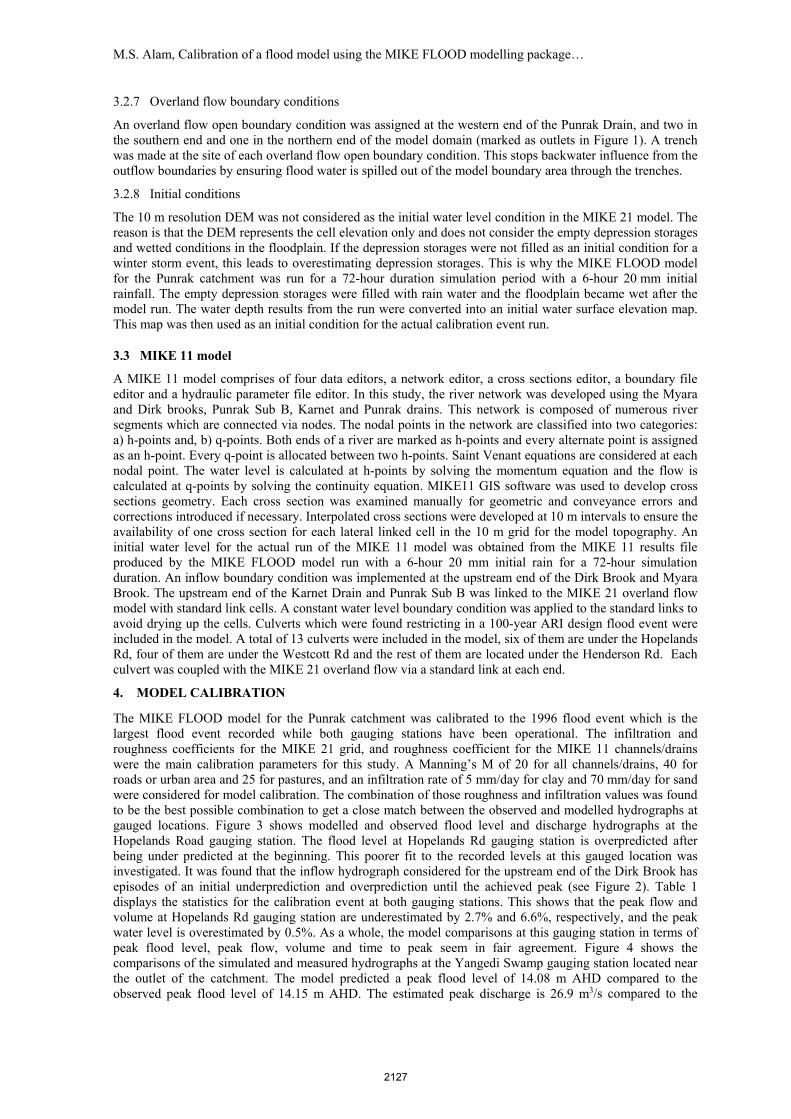
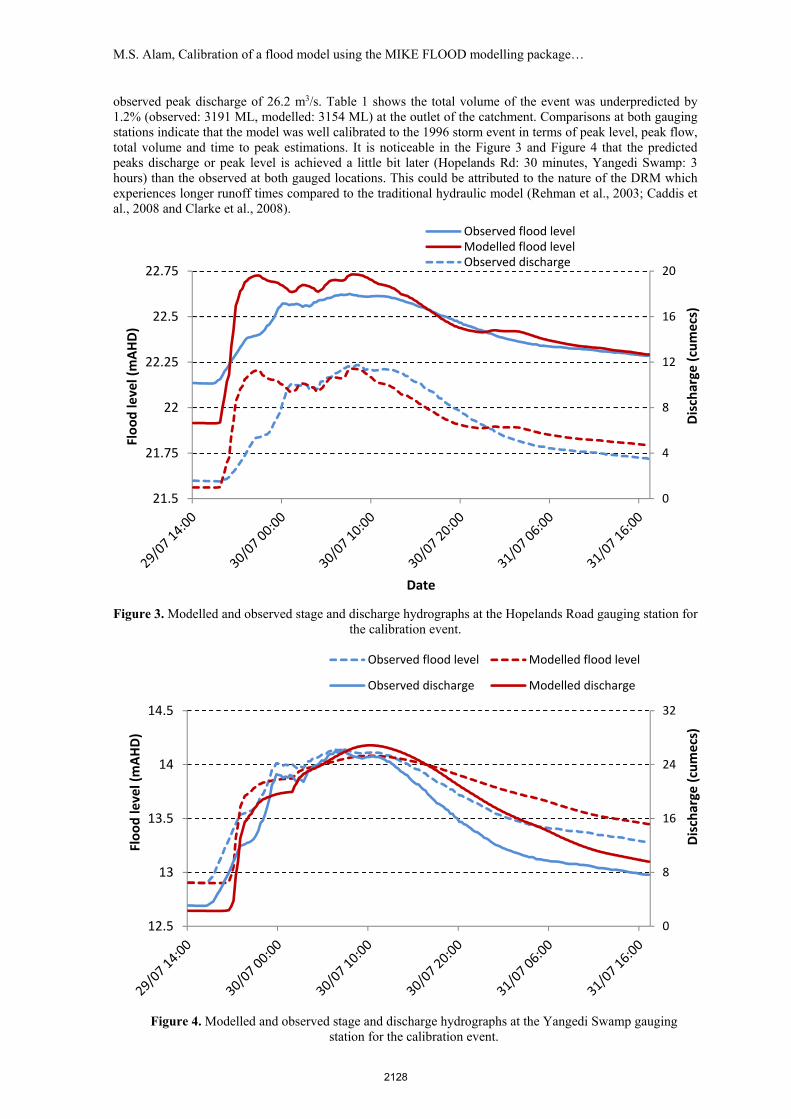
The MIKE FLOOD model for the Punrak catchment was calibrated to the 1996 flood event which is the largest flood event recorded while both gauging stations have been operational. The infiltration and roughness coefficients for the MIKE 21 grid, and roughness coefficient for the MIKE 11 channels/drains were the main calibration parameters for this study. A Manning’s M of 20 for all channels/drains, 40 for roads or urban area and 25 for pastures, and an infiltration rate of 5 mm/day for clay and 70 mm/day for sand were considered for model calibration. The combination of those roughness and infiltration values was found to be the best possible combination to get a close match between the observed and modelled hydrographs at gauged locations. Figure 3 shows modelled and observed flood level and discharge hydrographs at the Hopelands Road gauging station. The flood level at Hopelands Rd gauging station is overpredicted after being under predicted at the beginning. This poorer fit to the recorded levels at this gauged location was investigated. It was found that the inflow hydrograph considered for the upstream end of the Dirk Brook has episodes of an initial underprediction and overprediction until the achieved peak (see Figure 2). Table 1 displays the statistics for the calibration event at both gauging stations. This shows that the peak flow and volume at Hopelands Rd gauging station are underestimated by 2.7% and 6.6%, respectively, and the peak water level is overestimated by 0.5%. As a whole, the model comparisons at this gauging station in terms of peak flood level, peak flow, volume and time to peak seem in fair agreement. Figure 4 shows the comparisons of the simulated and measured hydrographs at the Yangedi Swamp gauging station located near the outlet of the catchment. The model predicted a peak flood level of 14.08 m AHD compared to the observed peak flood level of 14.15 m AHD. The estimated peak discharge is 26.9 m3/s compared to the
2127
M.S. Alam, Calibration of a flood model using the MIKE FLOOD modelling package…
0
8
16
24
32
12.5
13
13.5
14
14.5Di
scha
rge
(cum
ecs)
Floo
d le
vel (
mAH
D)
Observed flood level Modelled flood level
Observed discharge Modelled discharge
Figure 4. Modelled and observed stage and discharge hydrographs at the Yangedi Swamp gauging station for the calibration event.
observed peak discharge of 26.2 m3/s. Table 1 shows the total volume of the event was underpredicted by 1.2% (observed: 3191 ML, modelled: 3154 ML) at the outlet of the catchment. Comparisons at both gauging stations indicate that the model was well calibrated to the 1996 storm event in terms of peak level, peak flow, total volume and time to peak estimations. It is noticeable in the Figure 3 and Figure 4 that the predicted peaks discharge or peak level is achieved a little bit later (Hopelands Rd: 30 minutes, Yangedi Swamp: 3 hours) than the observed at both gauged locations. This could be attributed to the nature of the DRM which experiences longer runoff times compared to the traditional hydraulic model (Rehman et al., 2003; Caddis et al., 2008 and Clarke et al., 2008).
Figure 3. Modelled and observed stage and discharge hydrographs at the Hopelands Road gauging station for the calibration event.
0
4
8
12
16
20
21.5
21.75
22
22.25
22.5
22.75
Disc
harg
e (c
umec
s)
Floo
d le
vel (
mAH
D)
Date
Observed flood levelModelled flood levelObserved discharge
2128

M.S. Alam, Calibration of a flood model using the MIKE FLOOD modelling package…
Table 1. Calibration statistics and errors for the MIKE FLOOD model of the Punrak catchment.
Location Series Peak water level (mAHD)
Peak discharge (cumecs)
Volume (ML) Time to peak (hrs)
Hopelands Road Observed 22.62 11.7 1433 18.25
(614 028) Modelled 22.73 11.4 1339 17.75
Difference 0.5% -2.7% -6.6%
Yangedi Swamp Observed 14.15 26.2 3191 17.25
(614 094) Modelled 14.08 26.9 3154 20.25
Difference -0.5% 2.4% -1.2%
5. CONCLUSIONS
The main purpose of this study was to develop and calibrate a hydraulic flood model employing the direct rainfall technique for the Punrak catchment. MIKE FLOOD software package (2012 release) was used to develop the flood model. There was fair agreement between the predicted and observed data in terms of peak flood levels, peak flow, total volume and time to peak estimations. The direct rainfall technique employed in this study is a relatively new approach and very easy to apply in its most simplistic form compared to the traditional modelling techniques. No separate hydrology model within the catchment domain is required and it can provide a result relatively quickly. However, the results may contain major errors if a model is developed without proper guidance and quality assurance. The model setup has a strong influence on the modelling results too. The grid resolution and hydraulic controls (such as culverts and bridges) used in the DRM model influences the results (Clark et al, 2008; Engineers Australia, 2012). In this study, a 10 m grid resolution and 13 culverts underneath the major roads were used to calibrate the model. The culverts which were found restricting for a 100-year ARI design event were included in the model. However, the inclusion of all other non-restricting culverts in the catchment and consideration of a finer grid resolution could have improved the modelling results. On the other hand, these would have also increased the computational cost and the modelling complexity. These were avoided in the planning stage of the project as the existing model setup was considered as a reasonable compromise between the accuracy and computational cost.
REFERENCES
Chow, V.T. (1959). Open-channel hydraulics, McGraw-Hill, New York. Clark, K. M., Ball, J. E. and M.K. Babister (2008). Can fixed grid 2D hydraulic models be used as hydrologic models?, Proceedings of the 31st Hydrology and Water Resources Symposium, 14-17 April, Adelaide, Australia. Engineers Australia, 2012. Two dimensional modelling in urban and rural floodplains, Stage 1 & 2 Report, Australian Rainfall and Runoff Revision Projects, Project 15, P15/S1/009, November. Hall, J., P. Kretschmer, B. Quinton, and B. Marillier (2010). Murray hydrological studies: surface water,
groundwater and environmental water — Model construction and calibration report, Water Science Technical Series, Report no. 25, Department of Water, Western Australia.
Hall, J. (2015). Direct rainfall flood modelling: The good, the bed and the ugly, Australian Journal of Water Resources, Vol. 19, No. 1, pp. 74-85, http://dx.doi.org/10.7158/W14-016.2015.19.1.
Marillier, B., J. Hall, and J. Kretschmer (2012). Lower Serpentine hydrological studies – model construction and calibration report, Water Science Technical Series, report no. 46, Department of Water, Western Australia.
Rehman, H., Thomson, R. and E. Watterson (2007). Hydrology in urban areas−‘rainfall on the grid’ versus traditional methodologies, Proceedings of the 47th NSW Floodplain Management Authorities Conference, Gunnedah.
Rehman, H. (2011). Rainfall-on-grid modelling – a decade of practice, Proceedings of the 33rd Hydrology and Water Resources Symposium, Brisbane, Australia.
2129