california airtoxics hot spots information … · "hot spots" information and assessment...
TRANSCRIPT

CALIFORNIA AIR TOXICS"HOT SPOTS"
INFORMATION AND ASSESSMENTACT (AB2588)
2006 Air Toxics "Hot Spots"Program Report
forSan Diego County
August 2007
SAN DIEGO COUNTYAIR POLLUTION CONTROL DISTRICT
10124 Old Grove RoadSan Diego, CA 92131

2006 Air Toxics "Hot Spots" Program Reportfor San Diego County
TABLE OF CONTENTS
PAGE
INTRODUCTION 1BACKGROUND 1PROGRAM DESCRIPTION AND STATUS 3
Table I - Estimated Toxic Air Contaminant Emissions - All Sources 3Table 2 - Air Resources Board Estimated Toxic Air Contaminant Emissions -
Non-Industrial Sources 7Facility Prioritization 8
Table 3 - Prioritization Categories 8Health Risk Assessments 8
Table 4 - Health Risk Assessment Results 9Public Notification and Risk Reduction 11
Table 5 - Public Notification and Risk Mitigation Levels IITable 6 - Facilities Conducting Biennial Public Notification 12Table 7 - Facilities Implementing a Risk Reduction Plan 13
Recent and Expected Changes to the Program 13QUALITY OF THE EMISSIONS INVENTORY DATA 13AIR TOXIC CONTROL MEASURES 14
Table 8 - Recent and Proposed Airborne Toxic Control Measures and NationalEmissions Standards for Hazardous Air Pollutants Applicable inSan Diego County IS
TOXIC AIR CONTAMINANTS AMBIENT MONITORING 16Figure 1 - Toxic Air Contaminant Incremental Cancer Risk 17
CONCLUSIONS 17
."... . ~ •

SDAPCD Air Toxics "Hot Spots" Program - 2006 Report
INTRODUCTION
The California Air Toxics "Hot Spots" Information and Assessment Act (AB2588) was enactedby the Legislature in 1987 to address public concern over the release of toxic air contaminantsinto the atmosphere. The law requires facilities emitting toxic substances to provide local airpollution control districts with information to identify sources of toxic air contaminants, assessair toxic problems, locate resulting "hot spots," notify persons that may be exposed to significantrisks, and develop effective strategies to reduce potential risks to the public.
A requirement of the Air Toxics "Hot Spots" Information and Assessment Act (Section 44363 ofthe Health and Safety Code) is for local air pollution control districts to provide the public withan annual progress report on the program. This report fulfills that requirement by providinginformation about emission inventories, approved health risk assessments (HRA), publicnotification procedures, and steps undertaken to reduce public health risks. State and local healthofficials may use the report to establish priorities for developing and implementing air toxiccontrol measures to protect public health.
This report summarizes the AB2588 program elements, the current status of the program in SanDiego County, stationary and mobile emission estimates, results of local HRAs, current status ofpublic notifications, and conclusions drawn from the program to date. Stationary source emissionestimates, by facility, are also available on the Air Pollution Control District's (District) website(http://www.sdapcd.org) by selecting the Air Toxics button and then selecting EmissionInventory. In addition, stationary source emissions inventories are available upon request forthose without Internet access.
Although toxic air contaminant emissions from stationary sources in San Diego County havebeen reduced by approximately 82% since 1989, large amounts of toxic compounds are stillemitted into the air from a wide variety of sources including motor vehicles, industrial facilities,household products, area sources, and natural processes. Prioritizing and reducing theseemissions further will require a continued, cooperative effort by the public, industry,environmental groups, Air Resources Board (ARB), and the District.
BACKGROUND
The District is the implementing agency for approximately 1,500 San Diego facilities required tocomply with the Air Toxics "Hot Spots" Act. The law requires facilities to submit informationthat is used to achieve the objectives of the program. For larger industrial facilities, thisinformation includes:
• Emission Inventory Reports - Facilities must submit the information needed by theDistrict to prepare a toxic emissions inventory report. The District then prioritizes eachfacility to determine if an HRA is necessary based upon the amount and toxicity of thereported emissions.
• Health Risk Assessments - Facilities required to submit HRAs must determine the level ofpublic exposure to emitted compounds and potential adverse public health impacts. The
-1-

SDAPCD Air Toxics "Hot Spots" Program - 2006 Report
State Office of Environmental Health Hazard Assessment (OEHHA) assists the District inreviewing each HRA.
• Public Notification - If an adverse health impact exceeding public notification levels(specified in District Rule 1210) is identified, the facility must provide notice to all exposedpersons regarding the results of the HRA.
• Risk Reduction Audits and Plans - Facilities with emiSSIOns that pose a potentiallysignificant public health risk must submit a risk reduction audit and plan to the District.This plan must demonstrate how th facility will reduce health risks below significantlevels. The facility must implement the plan as approved by the District.
The Air Toxics "Hot Spots" program has been implemented in phases. Facilities are required toupdate their toxic inventories at least every four years depending on program status for eachfacility. The District has developed toxic emission inventory reporting procedures that streamlinethis process while meeting the requirements of the ARB Emissions Inventory Criteria andGuidelines regulation. For example, facilities are no longer required to perform emissioncalculations. Instead, the District provides customized inventory forms based upon site-specificequipment information and calculates facility emissions based on process information suppliedby the facility operator. Additionally, the District has merged the Toxic Emission Reports withthe Criteria Pollutant Emission Reports to eliminate duplicate data requests.
The District has also designed the local program to allow many small businesses to meetinventory requirements more cost-effectively by completing industry-specific reporting forms.The District has standardized and automated many computational and record keeping tasks. Incollaboration with the ARB, OEHHA, and other air agencies, generic HRAs have been developedfor gas stations, dry cleaners, and auto body shops to assess industry-wide impacts. Theseprogram enhancements save businesses time and money.
The District is required to review and approve the data submitted by facilities, compile aninventory of emissions, and publish an annual program report on the region's toxic aircontaminant emissions, risk assessment results, and control measures effectiveness. These reportsare used by health officials to develop strategies for protecting the public health.
Toxic air contaminant emissions should not necessarily be equated with a significant health risk(cancer or non-cancer) to any individual or the public. The quantity and toxicity of thecompounds being emitted and the level of public exposure must be known before drawingconclusions about health risks. This report presents data on emissions from several hundredfacilities. In some cases, data on public exposure is still being developed, updated, or reviewed.HRAs have been completed for 66 facilities.
However, exposure to the toxic compounds in question, in sufficient quantities, can cause healthproblems ranging from relatively mild temporary conditions such as minor eye or throatinitation, shortness of breath, or headaches; to permanent and serious conditions such as cancer,birth defects, or damage to lungs, nerves, the liver, the heart, or other organs.
The District has evaluated at least four toxic emission inventories for most facilities in San DiegoCounty. An estimate of cunent toxic air contaminant emissions (for calendar years 2002- 2005)
-2-
SDAPCD Air Toxics "Hot Spots" Program - 2006 Report
from all sources, industrial and non-industrial, is presented in Table 1 of this report. Detailedsite-specific emission results are provided on the District's website.
PROGRAM DESCRIPTION AND STATUS
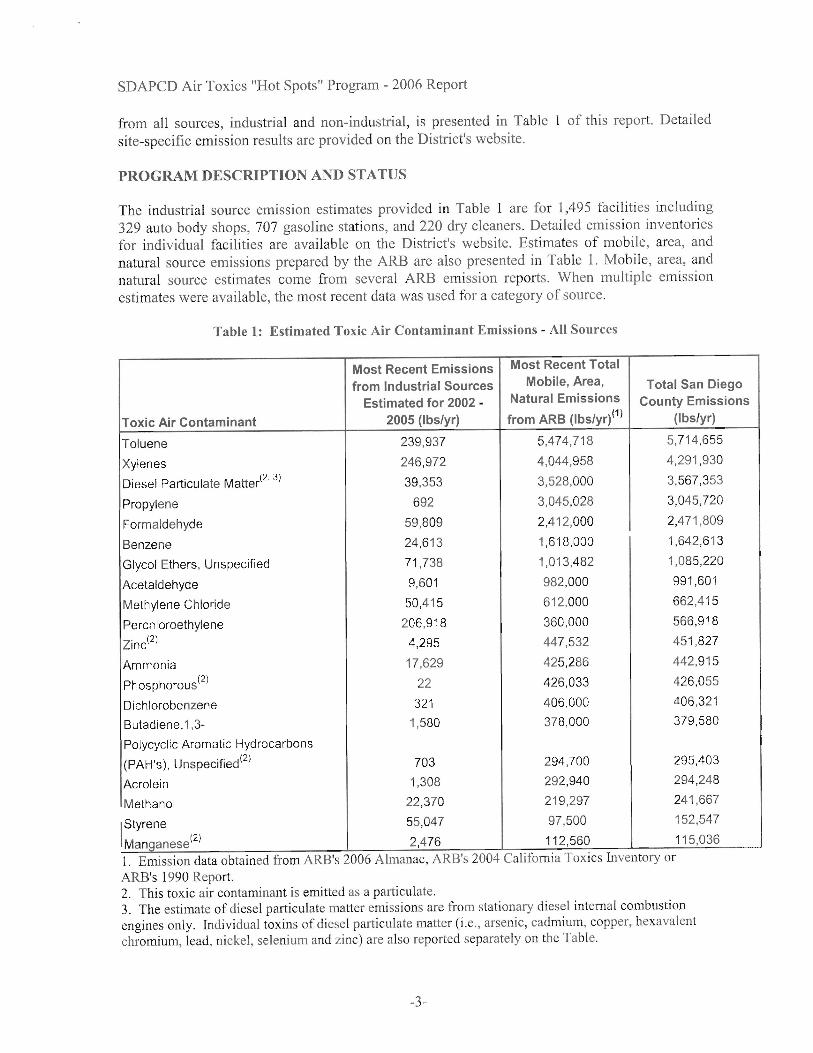
The industrial source emission estimates provided in Table I are for 1,495 facilities including329 auto body shops, 707 gasoline stations, and 220 dry cleaners. Detailed emission inventoriesfor individual facilities are available on the District's website. Estimates of mobile, area, andnatural source emissions prepared by the ARB are also presented in Table I. Mobile, area, andnatural source estimates come from several ARB emission reports. When multiple emissionestimates were available, the most recent data was used for a category of source.
Table 1: Estimated Toxic Air Contaminant Emissions - All Sources
Most Recent Emissions Most Recent Total
from Industrial Sources Mobile, Area, Total San DiegoEstimated for 2002 - Natural Emissions County Emissions
Toxic Air Contaminant 2005 (Ibs/yr) from ARB (lbs/yr)(1) (Ibs/yr)
Toluene 239,937 5,474,718 5,714,655
Xylenes 246,972 4,044,958 4,291,930
Diesel Particulate Matter(2, 3) 39,353 3,528,000 3,567,353
Propylene 692 3,045,028 3,045,720
Formaldehyde 59,809 2,412,000 2,471,809
Benzene 24,613 1,618,000 1,642,613
Glycol Ethers, Unspecified 71,738 1,013,482 1,085,220
Acetaldehyde 9,601 982,000 991,601
Methylene Chloride 50,415 612,000 662,415
Perchloroethylene 206,918 360,000 566,918Zinc(2) 4,295 447,532 451,827
Ammonia 17,629 425,286 442,915
Phosphorous(2) 22 426,033 426,055
Dichlorobenzene 321 406,000 406,321
Butadiene,1,3- 1,580 378,000 379,580
Polycyclic Aromatic Hydrocarbons
(PAH's), Unspecified(2) 703 294,700 295,403
Acrolein 1,308 292,940 294,248
Methanol 22,370 219,297 241,667
Styrene 55,047 97,500 152,547
Manganese(2) 2,476 112,560 115,0361. ErrusslOn data obtamed from ARB's 2006 Almanac, ARB's 2004 California Toxlcs Inventory orARB's 1990 Report.2. This toxic air contaminant is emitted as a particulate.3. The estimate of diesel particulate matter emissions are from stationary diesel internal combustionengines only. Individual toxins of diesel particulate matter (i.e., arsenic, cadmium, copper, hexavalentchromium, lead, nickel, selenium and zinc) are also reported separately on the Table.
-3-
SDAPCD Air Taxies "Hot Spots" Program - 2006 Report
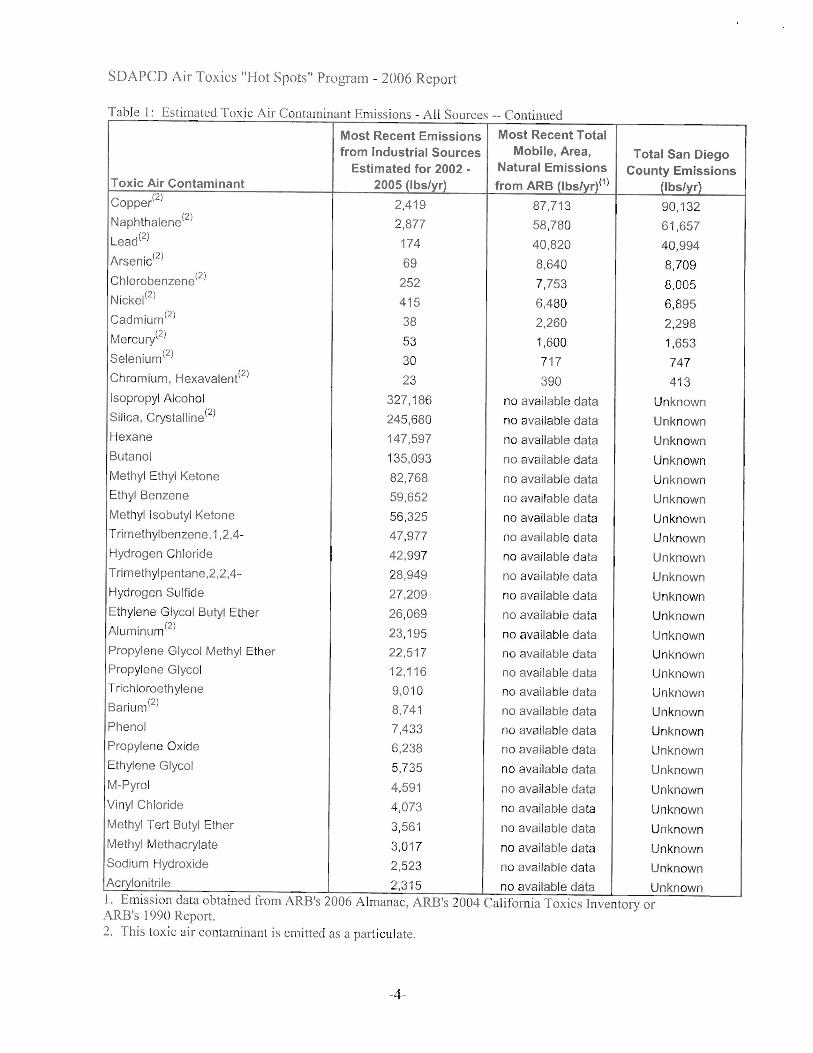
Table I' Estimated Toxic Air Contaminant Emissions - All Sources -- Continued
Most Recent Emissions Most Recent Total
from Industrial Sources Mobile, Area, Total San DiegoEstimated for 2002 - Natural Emissions County Emissions
Toxic Air Contaminant 2005 (Ibs/yr) from ARB (lbs/yr)(1) (Ibs/yr)Copper(2) 2,419 87,713 90,132Naphthalene(2) 2,877 58,780 61,657Lead(2) 174 40,820 40,994Arsenic(2) 69 8,640 8,709
Chlorobenzene(2) 252 7,753 8,005Nickel(2) 415 6,480 6,895Cadmium(2) 38 2,260 2,298Mercury(2) 53 1,600 1,653Selenium(2) 30 717 747
Chromium, Hexavalent(2) 23 390 413
Isopropyl Alcohol 327,186 no available data UnknownSilica, Crystalline(2) 245,680 no available data Unknown
Hexane 147,597 no available data Unknown
Butanol 135,093 no available data Unknown
Methyl Ethyl Ketone 82,768 no available data Unknown
Ethyl Benzene 59,652 no available data Unknown
Methyl Isobutyl Ketone 56,325 no available data Unknown
Trimethylbenzene,1,2,4- 47,977 no available data Unknown
Hydrogen Chloride 42,997 no available data Unknown
Trimethylpentane,2,2,4- 28,949 no available data Unknown
Hydrogen Sulfide 27,209 no available data Unknown
Ethylene Glycol Butyl Ether 26,069 no available data UnknownAluminum(2) 23,195 no available data Unknown
Propylene Glycol Methyl Ether 22,517 no available data Unknown
Propylene Glycol 12,116 no available data Unknown
Trichloroethylene 9,010 no available data UnknownBarium(2) 8,741 no available data Unknown
Phenol 7,433 no available data Unknown
Propylene Oxide 6,238 no available data Unknown
Ethylene Glycol 5,735 no available data Unknown
M-Pyrol 4,591 no available data Unknown
Vinyl Chloride 4,073 no available data Unknown
Methyl Tert Butyl Ether 3,561 no available data Unknown
Methyl Methacrylate 3,017 no available data Unknown
Sodium Hydroxide 2,523 no available data Unknown
Acrylonitrile 2,315 no available data UnknownI. EmlsslOn data obtaIned from ARB's 2006 Almanac, ARB's 2004 CalIfornIa Toxlcs Inventory orARB's 1990 Report.2. This toxic air contaminant is emitted as a particulate.
-4-

SOAPeD Air Toxies "Hot Spots" Program - 2006 Report
Table 1· Estimated Toxic Air Contaminant Emissions - All Sources -- Continued
Most Recent Emissions Most Recent Total
from Industrial Sources Mobile, Area, Total San DiegoEstimated for 2002 - 2005 Natural Emissions County Emissions
Toxic Air Contaminant (Ibs/yr) from ARB (lbs/yr)(1) (Ibs/yr)
Ethylene Dichloride 2,135 no available data Unknown
Hydrogen Fluoride 2,078 no available data Unknown
Chlorofluorocarbons 1,825 no available data Unknown
Dioxane,1,4- 1,595 no available data Unknown
Nitric Acid 1,580 no available data Unknown
Trichloroethane,1,1,1- 1,089 no available data Unknown
Chloroform 975 no available data Unknown
Ethylene Glycol Ethyl Ether Acetate 924 no available data Unknown
Chlorine 858 no available data Unknown
Carbon Disulfide 763 no available data Unknown
Quinone 478 no available data Unknown
Ethylene Glycol Methyl Ether Acetate 266 no available data Unknown
Carbonyl Sulfide 261 no available data Unknown
Propylene Chlorohydrin 251 no available data Unknown
Chromium, Non-Hexavalent 243 no available data Unknown
Carbon Tetrachloride 177 no available data Unknown
Vinylidene Chloride 167 no available data Unknown
Ethylene Glycol Ethyl Ether 157 no available data Unknown
Methylene Diphenyl Isocyanate 152 no available data Unknown
Ethylene Glycol Methyl Ether 78 no available data Unknown
Dibutyl Phthalate 77 no available data Unknown
Thallium (2) 62 no available data Unknown
Silver (2) 57 no available data Unknown
Toluene Diisocyanate,2,4- 52 no available data Unknown
Vinyl Acetate 44 no available data Unknown
Sulfuric Acid 27 no available data Unknown
Toluene Diisocyanate,2,6- 26 no available data Unknown
Benzyl Chloride 15 no available data Unknown
Cobalt (2) 12 no available data Unknown
Ethylene Oxide 4 no available data Unknown
Isocyanates, Unspecified 4 no available data Unknown
Cyanide 4 no available data Unknown
Beryllium 3 no available data Unknown
Benzo[b)Fluoranthene 1 no available data Unknown
Benzo[a]pyrene 1 no available data Unknown
Indeno(1,2,3-cd)Pyrene > 1 no available data Unknown
1. ErrusslOn data obtamed from ARB's 2006 Almanac, ARB's 2004 CalIfornIa TOXlcs Inventory orARB's 1990 Report.2. This toxic air contaminant is emitted as a particulate.
-5-

SDAPCD Air Toxics "Hot Spots" Program - 2006 Report
Table I: Estimated Toxic Air Contaminant Emissions - All Sources -- Continued
Most Recent Emissions Most Recent Total
from Industrial Sources Mobile, Area, Total San DiegoEstimated for 2002 - Natural Emissions County Emissions
Toxic Air Contaminant 2005 (Ibs/yr) from ARB (lbs/yr)(1) (Ibs/yr)
Benzo[a]Anthracene > 1 no available data Unknown
Benzo[k]Fluoranthene > 1 no available data Unknown
Dibenz[a,h]Anthracene > 1 no available data Unknown
TOTALS 2,421,155 26,405,187 28,826,342(4)
I. EmISSIOn data obtamed from ARB's 2006 Almanac, ARB's 2004 Cahfomla Toxlcs Inventory orARB's 1990 Report.2. This toxic air contaminant is emitted as a particulate.3. The estimate of diesel particulate matter emissions are from stationary diesel internal combustionengines only. Individual toxins of diesel particulate matter (i.e., arsenic, cadmium, copper, hexavalentchromium, lead, nickel, selenium and zinc) are also reported separately on the Table.4. Total of most recent available estimates for industrial, mobile, area and natural sources.
Overall local emissions of toxic air contaminants from industrial sources have decreased byapproximately 82% since 1989. The most significant reductions include a variety of solvents andheavy metals. Emission increases are primarily the result of increased usage of reformulatedpaints, solvents, and gasoline. Emission estimates for some compounds have increased althoughthe actual emission levels may not have changed. This is due to changes in combustion-relatedemission factors and newly listed toxic air contaminants not included in initial inventories.
County-wide emissions for non-industrial sources (mobile, area, and natural sources) arepresented in Table I. Emissions for the mobile, area, and natural source subcategories arepresented in Table 2. Mobile sources include on-road vehicles, off-road vehicles, trains, mobileequipment, and utility equipment. Area sources include residential and commercial non-pointsources such as fuel combu tion, entrained road dust, waste burning, solvent use, pesticideapplication, and construction and demolition. Natural sources include wildfires and windblowndust from agricultural operations and unpaved areas.
In 1990, ARB prepared a toxic emissions inventory report for non-industrial sources in SanDiego County. More recent emissions for some toxic air contaminants were obtained fromARB's 2006 Almanac and 2004 California Toxics Inventory for non-industrial sources. The mostrecent data available for each toxic air contaminant were included in this report. Data obtainedfrom ARB's 2006 Almanac may be found athttp://www.arb.ca.gov/aqd/almanac/almanac06/pdf/chap506.pdf. The District will report updatedmobile, area, and natural source emissions when made available by ARB.
-6-

SDAPCD Air Toxies "Hot Spots" Program - 2006 Report
Table 2: ARB Estimated Toxic Air Contaminant Emissions Non-Industrial Sources
Toxic Air ContaminantsToluene (1)
Xylenes (1)
Diesel Particulate Matter (2)
Propylene (1)
Formaldehyde (2)
Benzene (2)
Glycol Ethers & Acetates (1)
Acetaldehyde (2)
Methylene Chloride (2)
Zinc (1)
Phosphorous (1)
Ammonia (1)
Dichlorobenzene (2)
1,3-Butadiene (2)
Perchloroethylene (2)
Methanol (1)
Styrene (3)
Acrolein (3)
Copper (1)
PAH, Unspecified (3)
Naphthalene (1)
Chlorobenzene (1)
Manganese (3)
Lead (3)
Arsenic (3)
Selenium (1)
Chromium Hexavalent (2)
Nickel (3)
Cadmium (3)
Mercury (3)
TOTALS
Mobile SourceEmissions
(Ibs/yr)
4,954,347
3,415,658
3,528,000
2,361,534
2,300,000
1,610,000
892,000
174,533
729
19,692
374,000
92,860
166,720
542
187,580
4,858
5,511
2,520
7,160
6,720
24
380
2,340
820
80
20,108,608
Area SourceEmissions
(Ibs/yr)
520,371
629,300
89,261
112,000
8,000
1,013,482
90,000
612,000
271,226
422,185
35,914
406,000
4,000
360,000
219,297
4,640
42,200
86,739
86,900
53,922
2,242
110,040
33,660
1,920
611
< 20
4,140
1,440
1,520
5,223,010
Natural SourceEmissions
(Ibs/yr)
594,233
1,773
3,119
369,680
84,020
432
20,220
82
1,073,559
Total NonIndustrial
SourceEmissions
(Ibs/yr)
5,474,718
4,044,958
3,528,000
3,045,028
2,412,000
1,618,000
1,013,482
982,000
612,000
447,532
426,033
425,286
406,000
378,000
360,000
219,297
97,500
292,940
87,713
294,700
58,780
7,753
112,560
40,820
8,640
717
400
6,480
2,260
1,600
26,405,197
1. Emission data obtained from ARB's 1990 Report.
2. Emission data obtained from ARB's 2006 Almanac.
3. Emission data obtained from ARB's 2004 California Toxics Inventory.
-7-

SDAPCD Air Toxics "Hot Spots" Program - 2006 Report
Facility Prioritization
The purpose of facility prioritization is to identify facilities that emit toxic air contaminants inamounts that warrant a detailed evaluation of potential public health risks through preparation ofa site-specific HRA. Prioritization procedures consider the magnitude of toxic air contaminantemissions from facilities and the toxicity of those emissions, but do not consider the dilutioncharacteristics of a specific facility's exhaust stacks or the expected health risks posed by theemissions. Requiring a facility to prepare a risk assessment does not mean the facility poses asignificant risk to public health.
Facilities are placed into three categories: Category A for facilities that are required to prepareand submit an HRA; Category B for facilities that may be required to conduct an HRA at a futuredate; and Category C for facilities that are not required to conduct an HRA. Ranges ofprioritization scores for each category are shown in Table 3.
Table 3: Prioritization Categories
Prioritization CategoryA B C
Facility Score forScore:::: 100 I :s Score < 100 Score < 1carcinogenic compounds
Facility Score forScore:::: 10 1 :s Score < 10 Score < 1non-carcinogenic compounds
Facilities are reprioritized based on their most recently approved toxic emissions inventoryreport. Prioritization procedures can be found on the District's website atH\"\ '. da(>l.;d.org toxic pr ~ pri r.pdf.
In 2007, the District will invite several potentially affected facilities to meet to discuss theirprioritization scores and HRA requirements. The goal of the meetings will be to ensure that anHRA is warranted and to provide basic HRA information to the facilities.
Health Risk Assessments
An HRA is a study of the possible public health risks that may be posed by emissions of toxiccompounds. Each facility that has been placed in Category A must prepare and submit an HRA tothe District.
Thc assessment incorporates conservative pollutant dispersion estimates, human exposureassumptions, and health effects information to ensure that the final risk assessments are notunderestimated. Accordingly, the results of a risk assessment may overstate actual health risksbut are useful in comparing the relative risks of sources and pollutants and setting priorities formitigation. For example, a risk assessment typically will estimate the increased cancer risk for ahypothetical individual who would remain at the one location with the greatest potential forexposure to toxic air contaminant emissions from the facility for 24 hours a day, 365 days peryear, over 70 years.
-8-
SDAPCD Air Toxics "Hot Spots" Program - 2006 Report
While the HRA procedures are generally considered to be conservative, some factors that maytend to underestimate impacts are difficult to evaluate. For example, an HRA is based onemission estimates for the indicated inventory year. These emissions are assumed to occur for 70years to obtain a "lifetime" cancer risk. Years other than the inventory year, in particular for yearsbefore this program, may have higher (or lower) emissions. Additionally, the cumulative effect ofemissions from other nearby mobile, area, and stationary sources and the potential for complexmixhlres of toxic air contaminants to create an additional health problem by their combinedreaction to each other cannot be estimated. Also, some facility emission estimates are based onaverage factors for individual types of equipment and actual emissions may be higher or lower.Finally, the HRA results only include potential impacts from compounds with OEHHA-approvedhealth values. Compounds without OEHHA-approved health values are not included.
ARB lists more than 700 compounds to be assessed under the Air Toxics "Hot Spots" program.The list includes potentially carcinogenic substances as well as compounds that may cause healthproblems such as respiratory irritation or central nervous system depression. The toxicity variesfrom compounds that pose concern if more than a few grams are emitted per day, to those thatmay pose no significant health risks if many pounds are emitted per day. OEHHA reviews andupdates the toxicity of the listed compounds. This updated information is then distributed to allgroups involved in the program for use in identifYing faciliti s required to prepare riskassessments and in preparing the assessments.
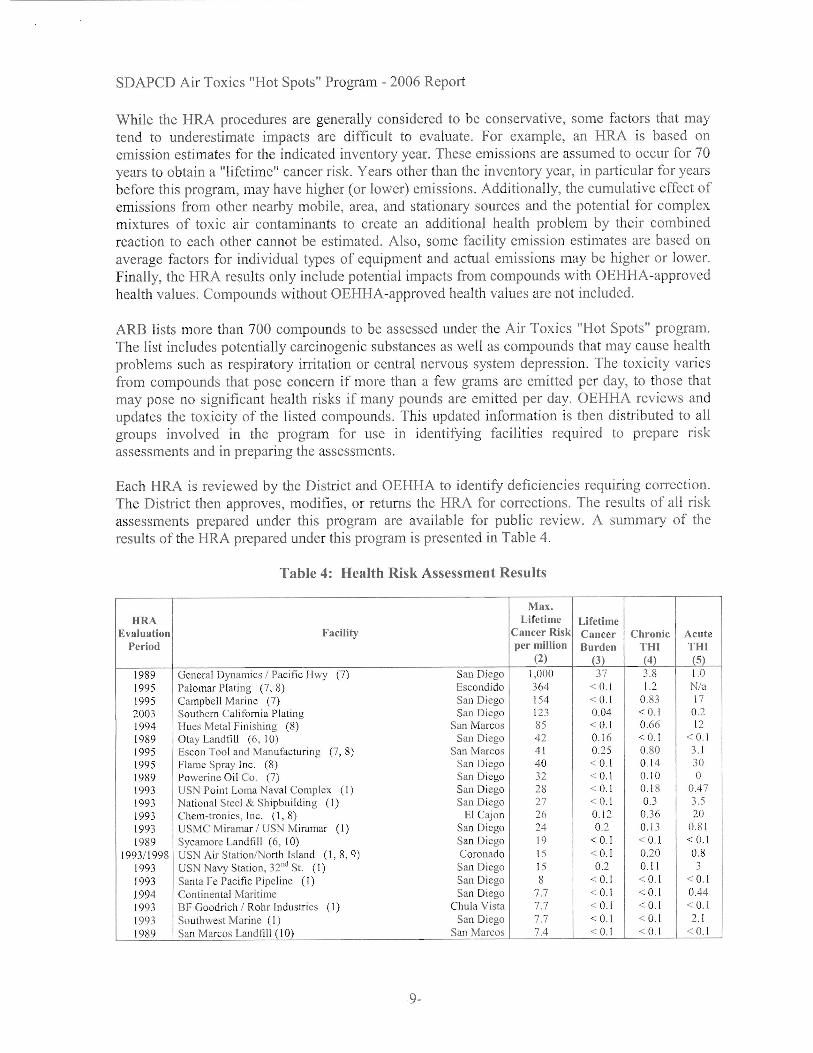
Each HRA is reviewed by the District and OEHHA to identifY deficiencies requiring correction.The District then approves, modifies, or returns the HRA for corrections. The results of all riskassessments prepared under this program are available for public review. A summary of theresults of the HRA prepared under this program is presented in Table 4.
Table 4: Health Risk Assessment Results
Max.HRA Lifetime Lifetime
Evaluation Facility Cancer Risk Cancer Chronic AcutePeriod per million Burden Till THI
(2) (3) (4) (5)
1989 General Dynamics 1Pacific Hwy (7) San Diego 1,000 37 3.8 1.01995 Palomar Plating (7,8) Escondido 364 < 0.1 1.2 N/a1995 Campbell Marine (7) San Diego 154 < 0.1 0.83 172003 Southern California Plating San Diego 123 0.04 < 0.1 0.21994 I rues Mctal Finishing (8) San Marcos 85 < 0.1 0.66 121989 Otay Landfill (6, 10) San Diego 42 0.16 < 0.1 < 0.11995 Escon Tool and Manufacturing (7,8) San Marcos 41 0.25 0.80 3.11995 Flame Spray Inc. (8) San Diego 40 <0.1 014 301989 Powerine Oil Co. (7) San Diego 32 <0.1 0.10 01993 USN Point Loma Naval Complex (I ) San Diego 28 <0.1 0.18 0.471993 National Steel & Shipbuilding (I) San Diego 27 < 0.1 0.3 3.51993 Chem-tronics, Inc. (I, 8) EI Cajon 26 0.12 0.36 201993 USMC Miramar 1USN Miramar (I) San Diego 24 0.2 0.13 0.811989 Sycamore Landfill (6, 10) San Diego 19 < 0.1 < 0.1 < 0.1
1993/1998 USN Air Station!North Island (1,8,9) Coronado 15 <0.1 0.20 081993 USN Navy Station, 3200 St. (I) San Diego 15 0.2 0.[ I 31993 Santa Fe Pacific Pipeline (I) San Diego 8 < 0.1 <0.1 <0.11994 Continental Maritime San Diego 7.7 < 0.1 < 0.1 0.441993 SF Goodrich 1Rohr lndustries (I) Chula Vista 7.7 < 0.1 < 0.1 <0.11993 Southwest Marine (I) San Diego 7.7 <0.1 < 0.1 2.11989 San Marcos Landfill (10) San Marcos 7.4 < 0.1 < 0.1 < 0.1
-9-

SOAPeD Air Taxies "Hot Spots" Program - 2006 Report
Table 4' Health Risk Assessment (HRA) Results - Continued
J. IndIcates thIS facIlIty updated a 1989 health fisk assessment m accordance WIth Dlstnct Rule J21 O.2. This column reports the maximum lifetime excess cancer risk estimate reported by the facility or corrected by theDistrict. The maximum estimated risk generally is possible at only one location. All other locations show lower risks.This estimate assumes that a person resides at the location of maximum impact 24 hours per day, 365 days per year, for70 years of exposure or a person works at the location of maximum impact 8 hours per day, 245 days per year, for 40years of exposure. Actual cancer risk will likely be less.3. Excess cancer burden is an estimate of the increased number of cancer cases in a population (i.e. all census tractswithin or partially within the one in one million isopleth) as a result of exposure to emitted substances. Actual cancerburden will likely be less.4. Chronic total health hazard index (THI) is the sum of the ratios of the average annual exposure level of eachcompound to the compound's reference exposure level (REL). Actual chronic THI will likely be less.
Max.BRA Lifetime Lifetime
Evaluation Facility Cancer Risk Cancer Chronic AcutePeriod per million Burden THI THI
(2) (3) (4) (5)1993 Solar Turbines / Ruffin Rd (I) San Diego 7.3 < 0.1 <0.1 2.11989 S.D. City PI. Lorna Waste Water Treatment. Plant San Diego 7.3 < 0.1 0.30 l.l1989 General Dynamics / Kearny Villa Rd (7) San Diego 6.5 0.53 0.05 0.31993 Solar Turbines / Pacific Hwy (I) San Diego 6.1 < 0.1 <0.1 3.32004 Space & Naval Warfare Systems (1 I) San Diego 6.1 <0.1 < 0.1 0.81989 Kelco/Div. Merck & Co. Inc. San Diego 6.0 0.10 OAO 0.21993 Superior Ready Mix / Canyon Rock (I) San Diego 5.6 < 0.1 <0.1 OA71993 USN Amphibious Base (1,8) Coronado 5.3 < 0.1 <0.1 1.31993 Signet Armorlite (1,8) San Marcos 4.6 < 0.1 <0.1 0.471994 Senior Flexonics, Ketema Division (8) El Cajon 4.5 < 0.1 0.02 4.241989 Sony San Diego 4.5 < 0.1 0.09 0.11993 Hanson AggregateslNelson & Sloan/7 lh & Main (I) Chula Vista 4.2 < 0.1 < 0.1 < 0.11989 Vulcan / CALMAT Co. / Hwy 76 Pala 4.2 < 0.1 0.10 < 0.11989 ARCO San Diego 4.0 < 0.1 <0.1 01993 Hanson Aggregates / Sim J. Harris (1) San Diego 3.9 < 0.1 <0.1 < 0.11989 Palomar Airport Landfill (10) Carlsbad 3.9 < 0.1 < 0.1 < 0.11993 Hanson AggregatesIJ·i.G. Fenton/East County Mtls (I) EI Cajon 3.7 < 0.1 <0.1 0.11989 Bonsall Landfill (10) Vista 3.7 <0.1 <0.1 <0.11993 Wyroc (I) Vista 3.6 <0.1 <0.1 0.131989 Equillon Enterprises / Shell Oil Co / Mission Rd San Diego 3.3 < 0.1 <0.1 01989 Vulcan / CALMAT Co. / Friars Rd San Diego 3.3 < 0.1 0.14 0.31993 Hanson Aggregates / Nelson & Sloan / Tri Way (I) Lakeside 3.1 < 0.1 < 0.1 0.11989 Knight & Carver Inc. / Hancock St (7) San Diego 2.8 <0.1 < 0.1 0.51993 Hanson Aggregates / H.G. Fenton / Carrol Cyn. (I) San Diego 2.6 < O.! < 0.1 < 0.11989 Southern California Edison Co. San Onofre 2.2 < 0.1 < 0.1 < 0.11993 Ilanson AggregateslNelson & Sloan/Birch Quarry (I) Chula Vista 2.1 <0.1 < 0.1 0.11989 Duke Energy / SDG&E / South Bay Plant Chula Vista 2.1 <0.1 < 0.1 0.342003 Neptllne Socicty (I I) EI Cajon 2 <0.1 0.7 0.91993 Frazee Paint (I) San Diego 1.8 <0.1 0.5 0.51989 UCSD Campus San Diego 1.8 <0.1 < 0.1 0.41989 USMC Base/Camp Pendleton Pendleton 1.7 < 0.1 0.14 0.641993 Asphalt Inc. (I) Lakeside 1.3 <0.1 < 0.\ <0.11989 Vulcan / CALMAT Co. / Black Mountain Rd San Diego l.3 <0.1 0.20 0.41994 Ogden Power Pacific Chula Vista 1.0 < 0.1 0.92 0.211989 Cabrillo Power / SDG&E / Encina Plant Carlsbad 0.9 < 0.1 < 0.1 0.11989 Cabrillo Power / SDG&E / 32nd St. Naval Station (7) San Diego 0.8 < 0.1 < 0.1 < 0.11989 Texaco Refining & Marketing, Inc. San Diego 0.8 <0.1 < 0.1 01993 Teledyne Ryan Aeronautical (1,7) San Diego 0.79 < 0.1 < 0.1 0.121993 Hanson Aggregates / South Coast Materials (I) Carlsbad 0.7 < 0.1 < 0.1 < 0.11989 Chevron USA Inc. San Diego 0.60 < 0.1 < 0.1 01993 Deutsch Co. (I) Oceanside 0.4 < 0.1 < 0.1 <0.11989 Cabrillo Power / SDG&E / Naval Training Center (7) San Diego 02 <0.1 < 0.1 < 0.11999 Chromalloy San Diego E1 Cajon 0.165 <0.1 <0.1 <0.11989 San Diego State University San Diego 01 < 0.1 < 0.1 0.51989 Cabrillo PowerlSDG&E ComoanylUSN North Island (7) Coronado 0.05 <0.1 < 0.1 <0.1. .
-10-

SDAPCD Air Toxics "Hot Spots" Program - 2006 Report
Table 4: Health Risk Assessment (HRA) Results footnotes - Continued5. Acute total health hazard index (THI) is the sum of the ratios of the maximum one-hour exposure level of eachcompound to the compound's reference exposure level (REL). Actual acute THI will likely be less.6. Health risk assessment results are points of maximum impact. Cancer risk was < JOin one million, chronic THIwas < 1 and acute THI was <I at all residential, occupational, and commercial locations.7. This facility has ceased operations.8. This facility successfully implemented a risk reduction program (see Table 7).9. The cancer and chronic HRA results are based on 1993 HRA. The acute result is based on an updated 1998 acuteHRA.10. This facility has installed landfill gas collection and control systems after the HRA evaluation period.I I. HRA results are from District in-house risk evaluation.
Public Notification and Risk Reduction
Once a health risk assessment has been approved, the Air Toxics "Hot Spots" program requiresfacilities with risks over specified levels to provide public notice to all exposed persons. Inaddition, facilities with significant risks are required to reduce risks below the significant risklevels within five years. The California Health and Safety Code does not define "significant risk."The District, in consultation with interested parties, established public notification and significantrisk levels (as well as public notification and risk reduction procedures) in District Rule 1210.These levels are presented in Table 5.
Table 5: Public Notification and Significant Risk Levels
PublicSignificant Risk
NotificationLevel Level
Maximum Incremental Cancer Risk 10 100Cancer Burden 1.0 1.0Total Acute Noncancer 1.0* 1.0*Health Hazard IndexTotal Chronic Noncancer 1.0* 1.0*Health Hazard Index* A value greater than 1.0 but less than 5.0 would not trigger public notification or risk
reduction requirements if the Air Pollution Control Officer determines, after consultation withOEHHA, that adverse public health effects are unlikely to occur at the levels of exposureestimated in the approved public health risk assessment.
In establishing public notification procedures, the District considered input from the CaliforniaAir Pollution Control Officers Association's Air Toxics "Hot Spots" Program Public NotificationGuidelines (October 1992), ARB guidance, other regulatory precedents, public workshops, and alocal public notification committee consisting of representatives from the District, local industryand industry groups, academic institutions, and environmental organizations. The procedures aregenerally consistent with procedures adopted by other California air districts. J
Facilities required to perform public notification must distribute notices to each household andbusiness that may be exposed to potential risks exceeding the District's public notification level.Notifications must be issued biennially until the facility demonstrates to the District that it hasreduced the potential health risk below th notification thresholds.
1 The South Coast Air Quality Management District has revised its cancer risk mitigation threshold to 25 in one million.
-11-

SOAPeD Air Toxics "Hot Spots" Program - 2006 Report
As of June 2007, 16 facilities with estimated risks above public notification levels were requiredto inform the public of their HRA results. Based on the response from the public, seven facilitieswere required to hold public meetings to provide further information regarding their emissionsand their HRA results.
Public notification is required biennially based on the most recent approved HRA until it isdemonstrated that potential health risks have been reduced below public notification levels.Table 6 lists the facilities currently required to conduct biennial public notification.
Table 6: Facilities Conducting Biennial Public Notification
HRA Most RecentEvaluation Facility Notification
Period Date1993 USN Point Lorna Naval Complex San Diego 20051993 National Steel & Shipbuilding San Diego 20051993 USMC Miramar / USN Miramar San Diego 20051993 USN Navy Station, 32nd St. San Diego 20051998 USN Air Station / North Island* Coronado 20052003 Southern California Plating San Diego 2006
* USN AIr StatIOn North Island successfully Implemented a rIsk reduction plan for acute risk. Theacute HRA result is bascd on an updated 1998 acute HRA. USN Air Station North Island is requiredto conduct public notifications for potcntial cancer risk from a gas station. The cancer and chronicHRA results are based on 1993 HRA.
Under Rule 12 10, facilities with potentially significant public health risks must reduce thoserisks below significant risk levels within five years of the approval of a risk reduction plan. Ofthe 66 approved BRAs under the "Hot Spots" program, eight currently active facilities hadestimated risks above the significant risk mitigation levels. These facilities, shown in Table 7,each prepared and implemented a risk reduction plan within five years. All but one facility (USNAir Station, North Island) successfully reduced their toxic emissions below public notificationlevels. The USN Air Station has reduced their acute risks substantially but must continuebiennial public notification because of residual cancer risks.
Table 7: Facilities Implementing a Risk Reduction Plan
HRAEvaluation Facility
Period1993 Chem-tronics, Inc. EI Cajon
1995 Flame Spray Inc* San Diego
1994 Hucs Metal Finishing San Marcos1994 Senior Flexonics, Ketema Aerospace and Electronics Division EI Cajon1993 Signet Armorlite San Marcos
1993/ 1998 USN Air Station / North Island** Coronado1993 USN Amphibious Base Coronado2003 Southern California Plating San Diego
* Flame Spray has a facility-wide usage / emISSion Itmlts mcorporated mto all theIr metal spraymg permIts which willkeep total cancer risk to be less than lOin a million, total chronic health hazard index less than I and total acutehealth hazard index less than I. All District permitted thermal spraying operations are controlled by HEPA filters.
** USN Air Station North Island successfully implemented a risk reduction plan for acute risk. The acute HRA resultis based on an updated [998 acute HRA. USN Air Station North [sland is required to conduct public notificationsfor potential cancer risk. The cancer and chronic HRA results are based on 1993 HRA.
-12-
SDAPCD Air Toxics "Hot Spots" Program - 2006 Report
Recent And Expected Changes To The Program
Changes to the Air Toxics "Hot Spots" Act in 1992 required that OEHHA develop riskassessment guidelines for the Air Toxics "Hot Spots" Program, including a "likelihood of risks"approach to risk assessment. OEHHA has developed and published a series of TechnicalSupport Documents for the determination of: (1) Acute Toxicity Exposure Levels, (2) CancerPotency Factors, (3) Chronic Toxicity Exposure Levels, (4) Exposure Assessment andStochastic Analysis, and (5) The Air Toxics Hot Spots Program Guidance Manual forPreparation of Health Risk Assessments. To supplement OEHHA's guidelines, ARB providedRecommended Interim Risk Management Policy for Inhalation-Based Residential Cancer Risk.
The revised OEHHA guidelines which were adopted in 2003 introduced numerous changes tothe risk assessment process including incorporating new compounds and health values,preparing tiered analyses, performing stochastic risk analysis, evaluating alternate exposurescenarios, and significant changes to inhalation pathway calculations. These changes makepreparation of HRAs using current tools impractical. ARB developed a computer program thatwill enable the District to incorporate the numerous changes resulting from adoption of the newguidelines. The program, called HARP (Hotspots Analysis Reporting Program), includesemissions inventory, air dispersion modeling, risk assessment, and graphic display modules. TheDistrict reviewed a preliminary version of the software and reported its findings to ARB inMay 2002. ARB released a working version of the software on December 31, 2003, and severaladditional revisions in 2004, 2005, and 2006. District staff is currently involved in providingcorrections and improvements on the most recent version of the HARP software. The Districtintends to assist affected facilities with HRA requirements.
ARB staff are currently preparing revisions to the Emissions Inventory Criteria and GuidelinesReport regulation. These revisions are necessary to address currently exempt diesel engines inthe "Hot Spots" Program. The regulation will also be revised to reflect changes in riskassessment methodology. These changes to the regulation are planned to be considered byARB's Board in late 2007.
QUALITY OF THE EMISSIONS INVENTORY DATA
The District's website contains approved emissions estimates for each facility inventoried. Theseemissions were determined using several different techniques, depending on the specificprocesses being evaluated.
Uniform and comprehensive toxic air contaminant guidelines do not exist for many types ofprocesses. In these cases, emissions are estimated by conducting source tests, reviewing previousevaluations of similar operations, comparing materials used, or applying engineering judgment.Accordingly, the quality of emission estimates varies and a direct comparison of relativeemissions between facilities may be inappropriate.
In the early stages of the program, hundreds of California facilities undertook similar inventoryefforts concurrently, placing a tremendous demand on consultants and source testing firms. Atthe time, few people had extensive experience inventorying and testing air toxics. For somecompounds and processes, test methods had not yet been developed and alternative techniquesfor estimation had to be used. Where source testing was used, results were sometimes
-13-

SDAPCD Air Toxics "Hot Spots" Program - 2006 Report
inconsistent between facilities or between several tests of the same exhaust stack. Some testresults conflicted with known process information, e.g., stack emissions of trace metals versusfuel composition data.
Some of these problems were related to the initial program startup and have been minimized asexperience has been gained. Other problems are inherent to measuring very small quantities oftrace compounds and applying emissions results from tests conducted over relatively few hoursto a whole year of operation. Also, where the District had reason to suspect actual emissions of atoxic air contaminant reported as non-detectable, the District used the ARB-recommendedpractice of estimating the emission based on one-half the detection limit. Accordingly,consideration should be given to these issues when comparing emission estimates and anyinferred health risks. The accuracy of the reported values can vary widely and current emissionestimates may differ greatly from previously reported values.
AIR TOXICS CONTROL MEASURES
The objectives of the Air Toxics "Hot Spots" program are to develop a complete inventory oftoxic air contaminant emission sources in California, to assess the potential public health risksassociated with those emissions, and to require facilities with significant risks to reduce theserisks to levels below the significant risk level. At the same time, existing and new programs atthe local, state, and federal levels also reduce air toxics emissions.
At the state level, ARB continues to implement an ongoing program to identify toxic aircontaminants, assess their public health risks, and develop air toxics control measures to reducetoxic cmissions from specific source categories statewide. Under this program known asAB 1807, or the Tanner program, ARB in cooperation with OEHHA develops priorities foridentification of toxic compounds, investigates and documents the adverse health risks posed bysuch compounds, identifies statewide sources of emissions, evaluates public health risks andavailable control technologies, and approves statewide emission control measures. Local airdistricts then must implement the State-approved emission reduction measures.
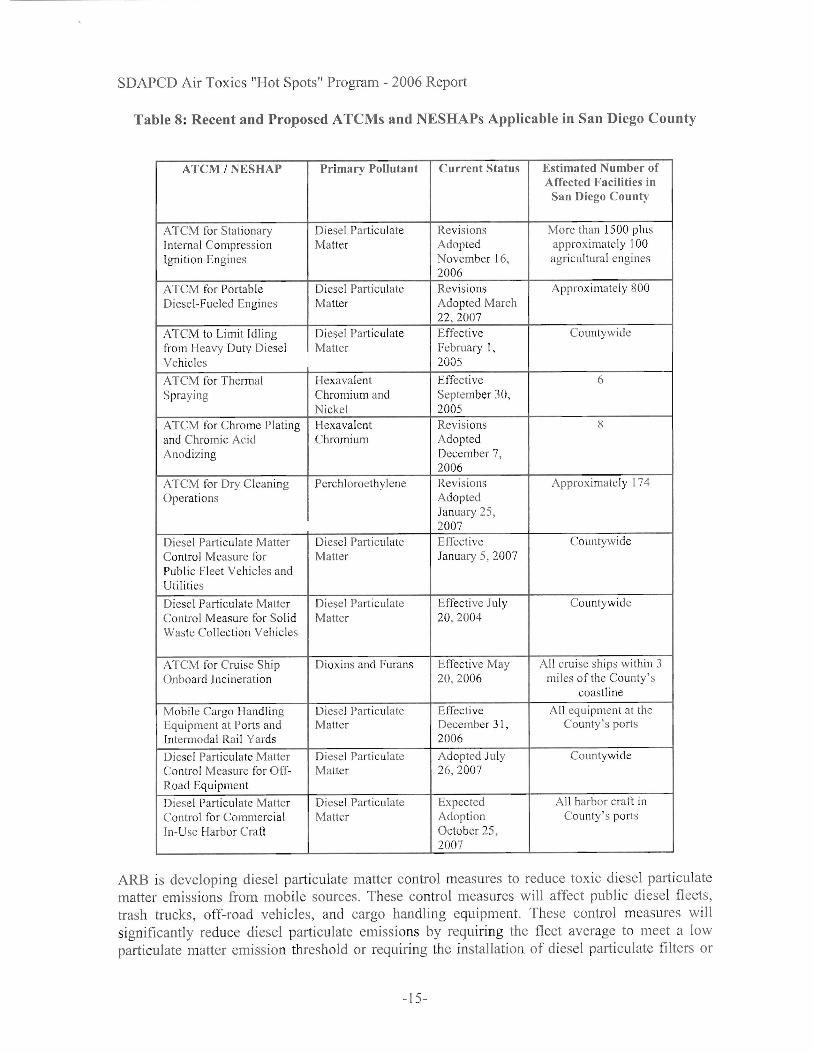
At the federal level, the ]990 Clean Air Act Amendments greatly expanded the EnvironmentalProtection Agency (EPA) program to develop nationwide control measures for air toxics. TheClean Air Act now lists ] 88 substances as hazardous air pollutants and requires EPA to developcontrol measures for significant sources of these pollutants. Many of these substances areincluded in the emissions being inventoried under the Air Toxics "Hot Spots" program. Inaddition, State and local permitting agencies are implementing National Emissions Standards forHazardous Air Pollutants (NESHAPs) for many large and small sources of hazardous airpollutants. Under revised State law, ncwly adopted federal NESHAPs regulations become StateAirborne Toxic Control Measures (ATCMs) automatically unless the State elects to adopt aseparate regulation. Table 8 presents recent and proposed State ATCMs and federal NESHAPs.
-14-
SDAPCD Air Toxics "Hot Spots" Program - 2006 Report
Table 8: Recent and Proposed ATCMs and NESHAPs Applicable in San Diego County
ATCM / NESHAP Primary Pollutant Current Status Estimated Number ofAffected Facilities in
San Diego County
ATCM for Stationary Diesel Particulate Revisions More than 1500 plusInternal Compression Matter Adopted approximately 100Ignition Engines November 16, agricultural engines
2006ATCM for Portable Diesel Particulate Revisions Approximately 800Diesel-Fueled Engines Matter Adopted March
22,2007ATCM to Limit Idling Diesel Particulate Effective Countywidefrom Heavy Duty Diesel Matter February I,Vehicles 2005
ATCM for Thermal Hexavalent Effective 6Spraying Chromium and September 30,
Nickel 2005ATCM for Chrome Plating Hexavalent Revisions 8and Chromic Acid Chromium AdoptedAnodizing December 7,
2006ATCM for Dry Cleaning Perchloroethylene Revisions Approximately 174Operations Adopted
January 25,2007
Diesel Particulate Matter Diesel Particulate Effective CountywideControl Measure for Matter January 5, 2007Public Fleet Vehicles andUtilities
Diesel Particulate Maller Diesel Particulate Effective July CountywideControl Measure for Solid Matter 20,2004Waste Collection Vehicles
ATCM for Cruise Ship Dioxins and Furans Effective May All cruise ships within 3Onboard lncineration 20,2006 miles of the County's
coastline
Mobile Cargo Handling Diesel Particulate Effective All equipment at theEquipment at Ports and Matter December 3 1, County's portsIntermodal Rail Yards 2006
Diesel Particulate Matter Diesel Particulate Adopted July CountywideControl Measure for Off- Matter 26,2007Road Equipment
Diesel Particulate Matter Diesel Particulate Expected All harbor craft inControl for Commercial Matter Adoption County's portsIn-Use Harbor Craft October 25,
2007
ARB is developing diesel particulate matter control measures to reduce toxic diesel particulatematter emissions from mobile sources. These control measures will affect public diesel fleets,trash trucks, off-road vehicles, and cargo handling equipment. These control measures willsignificantly reduce diesel particulate emissions by requiring the fleet average to meet a lowparticulate matter emission threshold or requiring the installation of diesel particulate filters or
-15-
SDAPCD Air Toxics "Hot Spots" Program - 2006 Report
diesel oxidation catalysts as best available control technology. Diesel particulate filters and dieseloxidation catalysts reduce particulate emissions by 30% to 85%. Because diesel particulatematter represents such a high percentage of ambient background risk from toxic air contaminants(see the following section) these control measures are expected to have significant air qualitybenefit.
TOXIC AIR CONTAMINANTS AMBIENT MONITORING
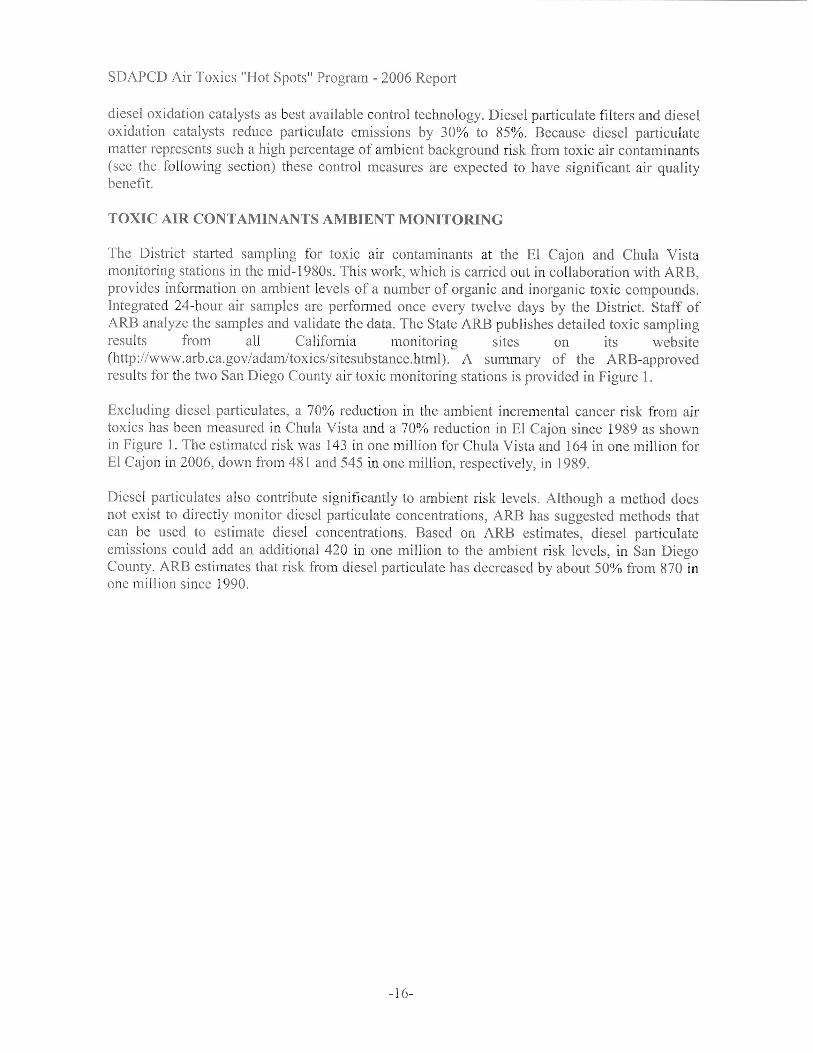
The District started sampling for toxic air contaminants at the EI Cajon and Chula Vistamonitoring stations in the mid-1980s. This work, which is carried out in collaboration with ARB,provides information on ambient levels of a number of organic and inorganic toxic compounds.Integrated 24-hour air samples are performed once every twelve days by the District. Staff ofARB analyze the samples and validate the data. The State ARB publishes detailed toxic samplingresults from all California monitoring sites on its website(http://www.arb.ca.gov/adam/toxics/sitesubstance.html). A summary of the ARB-approvedresults for the two San Diego County air toxic monitoring stations is provided in Figure 1.
Excluding diesel particulates, a 70% reduction in the ambient incremental cancer risk from airtoxics has been measured in Chula Vista and a 70% reduction in El Cajon since 1989 as shownin Figure 1. The estimated risk was 143 in one million for Chula Vista and 164 in one million forEI Cajon in 2006, down from 481 and 545 in one million, respectively, in 1989.
Diesel particulates also contribute significantly to ambient risk levels. Although a method doesnot exist to directly monitor diesel particulate concentrations, ARB has suggested methods thatcan be used to estimate diesel concentrations. Based on ARB estimates, diesel particulateemissions could add an additional 420 in one million to the ambient risk levels, in San DiegoCounty. ARB estimates that risk from diesel particulate has decreased by about 50% from 870 inone million since 1990.
-16-

SDAPCD Air Toxics "Hot Spots" Program - 2006 Report
Figure 1 - Toxic Air Contaminant Incremental Cancer Risk(excluding diesel particulate matter from engines)
600.------
500
400
c.2
'E..CI>a.:; 300III
~..CI>UC~
U
200
100
--+- Chula Vista ---- EI Cajon
0.1------
1989 1990 1991 1992 1993 1994 1995 1996 1997 1998 1999 2000 2001 2002 2003 2004 2005 2006
Year
CONCLUSIONS
Industrial facilities still emit large quantities of toxic air contaminants although emissions fromindustrial sources have been reduced by approximately 82% since 1989. Based on the most recentestimates, those sites inventoried emit more than 2.4 million pounds of toxic air contaminantsannually (down from approximately 5 million pounds in 1998). Motor vehicles and area andnatural sources are also key contributors of toxic air contaminants, emitting more than 26 millionpounds. Tables I and 2 provide the current inventories of toxic pollutants for stationary, mobile,area, and natural sources. The majority of local facilities are in compliance with current Districtemission standards, which now focus on both criteria air pollutants (e.g., volatile organiccompounds, oxides of nitrogen, particulate matter) and toxic air contaminants. Estimatedemissions of toxic air contaminants from industrial sources have decreased by approximately 10million pounds since 1989.
Current and future air quality programs at the local, state, and federal levels will further reducetoxic air contaminants emissions. Measures to reduce vehicle trips and miles traveled will reducetoxic emissions which result from the burning of gasoline. Measures to reduce emissions of
-17-

SDAPCD Air Toxics "Hot Spots" Program - 2006 Report
volatile organic compounds as ozone precursors will also decrease emissions of toxic volatileorganic compounds.
State air toxics control measures are reducing emissions of diesel particulate matter from engines,perchloroethylene from dry cleaning operations, hexavalent chromium from electroplatingoperations, hexavalent chromium and nickel from metal deposition operations, and toxic metalsfrom metal melting operations. Federal emission control programs have produced dramaticemission reductions of chlorofluorocarbons (CFC) and methyl chloroform. The District alsorequires best available control technology for many new and modified sources of toxic aircontaminants.
Approximately 10.2 million pounds of industrial emission reductions have been quantified in SanDiego County between 1989 and 2005. Ongoing implementation of the toxic air contaminantcontrol program Air Taxies "Hot Spots" Program Report will continue to reduce local publichealth risks associated with emissions of toxic air contaminants. Those efforts will improveinformation on levels of exposure and risk as well as identifying compounds, processes, andfacilities that are potentially causing significant risks.
***********
-18-