california department of transportation, fleet replacement
TRANSCRIPT
California Department of Transportation Fleet Replacement Model
Performance Audit
Report No. 21-2660-071 October 2021
Team Members
Cheryl L. McCormick, CPA, Chief
Rebecca G. McAllister, CPA, Assistant Chief Marilyn Standing Horse, CPA, Manager David Jacob Shockey, CPA, Supervisor
An Truong, Lead Mark-Anthony Lacy
Austin Lange Linda Nguyen Fujii
Final reports are available on our website at www.dof.ca.gov.
You can contact our office at:
California Department of Finance
Office of State Audits and Evaluations 915 L Street, 6th Floor
Sacramento, CA 95814 (916) 322-2985

Transmitted via e-mail
October 15, 2021
Robert S. Myers, Chief Division of Equipment California Department of Transportation 3400 R Street Sacramento, CA 95816
Final Report—California Department of Transportation, Fleet Replacement Model Performance Audit
The California Department of Finance, Office of State Audits and Evaluations, has completed its performance audit of the California Department of Transportation’s (Caltrans) fleet replacement model.
The enclosed report is for your information and use. The draft report was issued September 7, 2021, and Caltrans’s response to the draft report required further analysis. As a result of our analysis, changes were made to the Background section to provide further clarification. This report will be placed on our website.
A detailed Corrective Action Plan (CAP) addressing the findings and recommendations is due from Caltrans within 60 days from receipt of this letter. The CAP should include milestones and target dates to correct all deficiencies. The CAP should be sent to: [email protected]. After the initial CAP is submitted, it should be updated every six months thereafter, until all planned actions have been implemented. Finance may perform a desk review or separate audit to ensure corrective actions were completed as reported. If a separate audit is deemed appropriate, Caltrans will incur additional costs. The appropriate individual or mailbox Caltrans has designated will receive reminders when the updates are due to Finance.
If you have any questions regarding this report, please contact Marilyn Standing Horse, Manager, or David Shockey, Supervisor, at (916) 322-2985.
Sincerely,
Cheryl L. McCormick, CPA Chief, Office of State Audits and Evaluations
cc: On the following page
Original signed by:

cc: Cory Binns, Deputy Director, Maintenance and Operations, California Department of Transportation
J. Kris Teague, Deputy Division Chief, Engineering and Production, Division of Equipment, California Department of Transportation
Michael S. Mayor, Deputy Division Chief, Budgets and Administration, Division of Equipment, California Department of Transportation
Jason D. Cook, Deputy Division Chief, Maintenance and Repair North, Division of Equipment, California Department of Transportation
David W. Roth, Deputy Division Chief, Maintenance and Repair South, Division of Equipment, California Department of Transportation
Jessica Krause, Chief, Office of Resource and Development, Division of Equipment, California Department of Transportation
Jeremy Matsuo, Chief, Office of Fleet Management, Division of Equipment, California Department of Transportation
Ron Frank, Chief, Office of Specifications, Division of Equipment, California Department of Transportation
Jeremy Johnson, Chief, Office of Project Management, Division of Equipment, California Department of Transportation

TABLE OF CONTENTS
EXECUTIVE SUMMARY ................................................................................................................... 1
BACKGROUND, SCOPE, AND METHODOLOGY ........................................................................ 2
BACKGROUND .......................................................................................................................... 2
SCOPE ......................................................................................................................................... 7
METHODOLOGY ........................................................................................................................ 7
RESULTS ........................................................................................................................................... 9
CONCLUSION ............................................................................................................................ 9
FINDINGS AND RECOMMENDATIONS ................................................................................... 20
Finding 1: Model Replacement Backlog Includes Errors Impacting Reporting .......... 20
Recommendations ............................................................................................................. 22
Finding 2: Model Replacement Costs Are Not Supported ............................................ 23
Recommendations ............................................................................................................. 23
Finding 3: Fleet Inflation Rate Calculation Needs Improvement ................................. 23
Recommendations ............................................................................................................. 25
APPENDIX A ................................................................................................................................. 26
APPENDIX B .................................................................................................................................. 27
APPENDIX C ................................................................................................................................. 29
RESPONSE ..................................................................................................................................... 30
EVALUATION OF RESPONSE ....................................................................................................... 34

1
EXECUTIVE SUMMARY At the request of the California Department of Transportation (Caltrans), the California Department of Finance, Office of State Audits and Evaluations, conducted a performance audit of Caltrans’s fleet replacement model (Model) as of February 11, 2021. The audit objective was to assess the current status of Caltrans’s Model by performing the following:
• Provide an overview of Caltrans’s Model.
• Determine if Model inputs and outputs are accurate, supported, and in compliance with applicable laws, regulations, guidelines, and policies.
• Determine if the Model aligns with fleet replacement practices of comparable government entities.
The Model details the status of Caltrans’s 11,614 unit fleet, including 8,202 units eligible for replacement at a cost of approximately $881.2 million, as of February 2021. Caltrans faces significant challenges accurately calculating and predicting its fleet replacement needs. Recent changes in inflation and regulations related to zero-emission vehicles further challenge Caltrans’s ability to accurately predict future replacement costs using the Model. Based on the procedures performed and evidence gathered, Caltrans’s Model complies with applicable laws, regulations, policies, and guidelines, and aligns with fleet replacement practices of comparable government entities. However, we identified instances where the Model inputs and outputs were not always accurate or supported. Opportunities exist for Caltrans to strengthen its fleet estimation process to ensure Model inputs and outputs are accurate and supported. Specifically, we identified the following areas in which Caltrans’s Model needs improvement:
• Model backlog includes errors impacting reporting.
• Model replacement costs are not supported.
• Fleet inflation rate calculation needs improvement.
Implementation of the recommendations to improve its Model will assist Caltrans in accurately estimating its fleet replacement needs.
2
BACKGROUND, SCOPE,
AND METHODOLOGY BACKGROUND The California Department of Transportation (Caltrans) manages more than 50,000 miles of California's highway and freeway lanes, provides inter-city rail services, permits more than 400 public-use airports and special-use hospital heliports, and works with local agencies to achieve its mission. Caltrans implements its mission of providing a safe and reliable transportation network that serves all people and respects the environment, with six primary programs: Aeronautics, Highway Transportation, Mass Transportation, Transportation Planning, Administration, and the Equipment Service Center.1 Equipment Service Center Program The Equipment Service Center Program provides mobile fleet equipment and services to other Caltrans programs through purchasing fleet equipment and related components; receiving, servicing, and equipping new units; managing the fleet; repairing and maintaining the fleet, including payments for fuel and insurance, and; disposing of end-of-life fleet assets.2 The Division of Equipment (DOE) is responsible for managing the Equipment Service Center Program. Division of Equipment DOE purchases, fabricates, maintains, and repairs fleet equipment for Caltrans. DOE is comprised of approximately 730 professionals, including more than 400 heavy equipment mechanics in 12 districts around the state who maintain and repair equipment, and headquarters staff located in Sacramento. A fleet of approximately 12,000 units supports Caltrans staff who perform essential delivery of capital projects; incident response; traffic operations; snow removal operations; inspection of 25,200 state and local bridges; maintenance of 350,000 acres of right-of-way; and the preservation and operation of the state transportation system.3 DOE utilizes AssetWorks, a fleet management software system, to track and monitor its fleet inventory. To generate fleet related reports, DOE uses a Microsoft Access database, the Fleet Sustainability Database (FSD), to extract relevant data from AssetWorks. Further detail on the FSD and AssetWorks systems are described in the Results section of this report.
1 Excerpts obtained from https://dot.ca.gov/about-caltrans. 2 Excerpts obtained from http://www.ebudget.ca.gov/2020-21/pdf/Enacted/GovernorsBudget/2500.pdf. 3 Excerpts obtained from https://dot.ca.gov/programs/equipment.

3
Fleet Replacement To assist in maintaining its fleet of approximately 12,000 units, DOE developed a fleet replacement model (Model) to assess Caltrans’s overall fleet replacement needs and assist in decision making on equipment purchases. The Model is a collection of systems, processes, and outputs critical for fleet replacement calculations. The Model details the current status of Caltrans’s fleet, including equipment eligible for replacement, and annual funds required to ensure the health of the fleet. The Model currently projects a significant fleet replacement backlog, determined as the total number of units eligible for replacement and their estimated cost. A detailed description of the Model is included in the Results section of this report. Fleet Replacement Funding The Equipment Service Center Program receives funding from two major sources: the State Highway Account (SHA) and the Road Maintenance and Rehabilitation Account (RMRA). Both the SHA and RMRA allocate funds to the New Equipment Fund (NEF), which DOE uses to purchase new or replace existing fleet. State Highway Account The SHA is used for the deposit of all money from any source for expenditure for highway purposes including major and minor construction, maintenance, right-of-way acquisition, improvements and equipment, services, investigations, surveys, experiments, and reports. The SHA’s major revenue sources are:4
• Tax revenues cleared through the Highway Users Tax Account from the Motor Vehicle Fuel Account, and directly from the Motor Vehicle Account.
• Transfers from the Natural Disaster Assistance Fund and appropriations from state agencies.
• Rental and sale of excess property.
• Contributions from federal and local governments.
• Outdoor advertising licenses, permit fees, and fines.
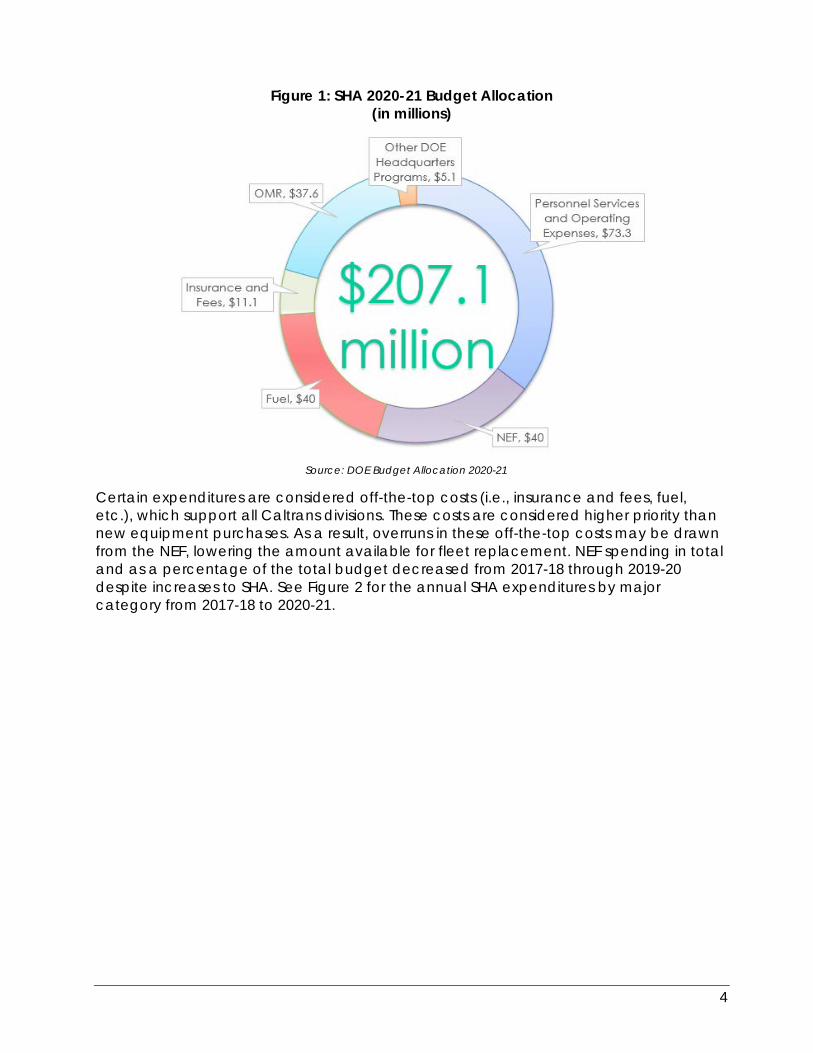
For fiscal year 2020-21, the SHA received total budget authority of $207.1 million. DOE allocates funding for personnel services and operating expenses, fuel, insurance and fees, NEF, the Office of Maintenance and Repair (OMR), and other DOE headquarters programs. DOE allocates approximately $40 million of SHA funds to the NEF each year. DOE’s allocation of the SHA is described in Figure 1.
4 Excerpts obtained from https://www.dof.ca.gov/budget/Manual_State_Funds/find_a_fund/documents/0042.pdf.
4
Figure 1: SHA 2020-21 Budget Allocation (in millions)
Source: DOE Budget Allocation 2020-21
Certain expenditures are considered off-the-top costs (i.e., insurance and fees, fuel, etc.), which support all Caltrans divisions. These costs are considered higher priority than new equipment purchases. As a result, overruns in these off-the-top costs may be drawn from the NEF, lowering the amount available for fleet replacement. NEF spending in total and as a percentage of the total budget decreased from 2017-18 through 2019-20 despite increases to SHA. See Figure 2 for the annual SHA expenditures by major category from 2017-18 to 2020-21.

5
Figure 2: Annual SHA Expenditures by Category (in millions)
Source: DOE Expenditure and Allocation Reports
From 2017-18 through 2020-21, NEF has expended an average of $38.1 million per year on equipment purchases funded by the SHA. Road Maintenance and Rehabilitation Account The Road Repair and Accountability Act of 2017 (SB1) was signed into law on April 28, 2017, and invests an additional $54 billion over 10 years to fix roads, freeways, and bridges in communities across California, and focuses on improving transit and safety. These funds are split equally between state and local investments. SB1 created the RMRA for deposit of funds intended to address the projected funding deficit required to adequately maintain the state’s existing transportation network and prevent growth of the fleet replacement backlog. Of the $54 billion in RMRA funding, $15.6 million was allocated for Caltrans fleet purchases in 2019-20 and $17.1 million in 2020-21.5 SB1 will permanently increase the size of Caltrans’s fleet to meet the increased workload. Equipment purchased with RMRA are separately tracked within DOE’s fleet management software, AssetWorks. Currently, fleet replacement decisions are not made based on funding source, but replacement need. All vehicles purchased with SHA and RMRA funds will be used to address the same workload. Therefore, RMRA funding has resulted in a temporary increase in Caltrans’s fleet and available funding for 2019-20 and 2020-21. See Figure 3 for the SHA and RMRA fleet replacement funding.
5 Excerpts obtained from https://dot.ca.gov/programs/sb1.

6
Figure 3: 2020-21 Budgeted Annual Fleet Replacement Funding (in millions)
Source: DOE Budget Allocation 2020-21
With the addition of RMRA funding in 2019-20, NEF expenditures increased to an average of $54.7 million over the last two fiscal years. See Figure 4 for total Equipment Service Center Program expenditures by fiscal year from 2017-18 to 2020-21, including both SHA and RMRA funding sources.
Figure 4: Equipment Service Center Program Expenditures by Fiscal Year (in millions)
* Includes RMRA funding Source: Governor’s Budget, Fund Condition Statements; DOE Expenditure and Allocation Reports
7
SCOPE At the request of Caltrans, the California Department of Finance, Office of State Audits and Evaluations, conducted a performance audit of Caltrans’s Model. Our audit objective was to assess the current status of the Model by performing the following:
• Provide an overview of Caltrans’s Model.
• Determine if Model inputs and outputs are accurate, supported, and in compliance with applicable laws, regulations, guidelines, and policies.
• Determine if the Model aligns with fleet replacement practices of comparable government entities.
Our audit was limited to the areas noted above and did not include an analysis of the reasonableness of Caltrans’s fleet size nor the efficiency and effectiveness of operations. Our audit did not include testing of individual equipment purchases for compliance with applicable state and federal laws, regulations, and other relevant criteria. For the purposes of this audit, the Model is considered to be the collection of systems, processes, and outputs critical for fleet replacement calculations. Caltrans management is responsible for the establishment of oversight, evaluations, and accountability measures related to its Model. In performing our audit, we considered internal controls significant to the audit objective. See Appendix C for a list of significant internal control components and underlying principles. METHODOLOGY To plan the audit, we interviewed key DOE personnel and reviewed DOE’s written policies and procedures, applicable State Administrative Manual (SAM) sections, legislation, and budget information included in the Governor’s Budget for 2016-17 through 2021-22 to gain an understanding of components of the Equipment Service Center Program relevant to fleet replacement and processes significant to the Model as of February 11, 2021. We conducted a risk assessment, including evaluating whether Caltrans’s key internal controls significant to our audit objective were properly designed, implemented, and operating effectively. Internal controls evaluated focused on Caltrans’s quality control processes to ensure data inputs into key systems and databases, and outputs generated are accurate and complete. Our assessment included conducting interviews with Caltrans personnel, performing remote observations of key processes, and reviewing supporting fleet data and documentation, such as inspection forms, vehicle work orders, meter reads, usage reports, cost spreadsheets, and applicable policies and procedures. Deficiencies in internal controls identified during our audit and determined to be significant within the context of our audit objective are included in the Results section of this report. We assessed the reliability of data of relevant aspects of the AssetWorks fleet management system, the FSD, Fleet Optimization Utilization Reports (FOUR reports), and in-service cost and inflation spreadsheets. Specifically, we reviewed existing information, performed data testing and recalculations, traced a selection of data to source documentation, and reviewed selected system controls to test for accuracy and
8
completeness. We identified reporting and calculation errors in FSD, and calculation errors in the FOUR reports, and in-service cost and inflation rate excel spreadsheets. Details of these errors are included in the Results section of this report. However, these issues did not impact our ability to perform audit testing, and we determined the data assessed were sufficiently reliable to address the audit objective. Based on the results of our planning, we developed specific methods for gathering evidence to address the audit objective. Our methods are detailed in the Table of Methodologies in Appendix B. Except as discussed in the following paragraph, we conducted this performance audit in accordance with generally accepted government auditing standards. Those standards require that we plan and perform the audit to obtain sufficient, appropriate evidence to provide a reasonable basis for our findings and conclusions based on our audit objective. We believe that the evidence obtained provides a reasonable basis for our findings and conclusions based on our audit objective. Finance and Caltrans are both part of the State of California’s Executive Branch. As required by various statutes within the California Government Code, Finance performs certain management and accounting functions. Under generally accepted government auditing standards, performance of these activities creates an organizational impairment with respect to independence. However, Finance has developed and implemented sufficient safeguards to mitigate the organizational impairment so reliance can be placed on the work performed.
9
RESULTS CONCLUSION Caltrans faces significant challenges accurately calculating and predicting its fleet replacement needs. Recent changes in inflation and regulations related to zero-emission vehicles further challenge Caltrans’s ability to accurately predict future replacement costs using the Model. Based on the procedures performed and evidence gathered, Caltrans’s Model complies with applicable laws, regulations, policies, and guidelines, and aligns with fleet replacement practices of comparable government entities. However, we identified instances where the Model inputs and outputs were not always accurate or supported. Specifically, we identified the following three areas in which Caltrans’s Model needs improvement:
1. Model replacement backlog includes errors impacting reporting.
2. Model replacement costs are not supported.
3. Fleet inflation rate calculation needs improvement.
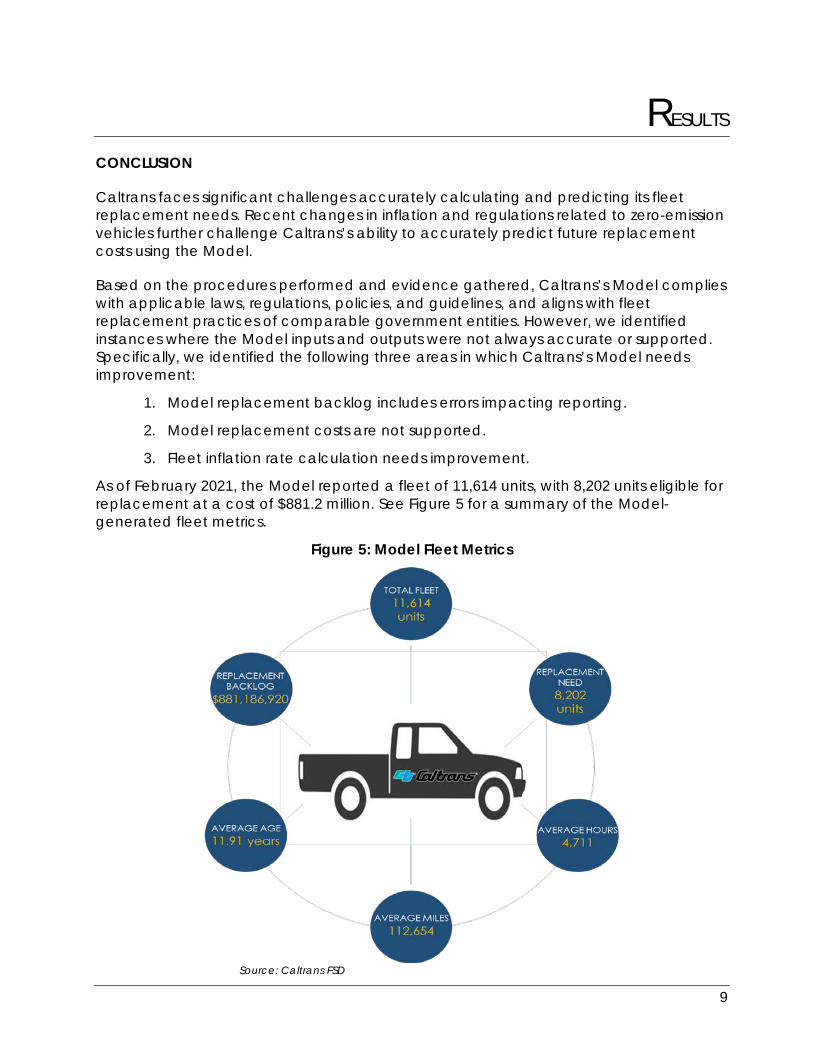
As of February 2021, the Model reported a fleet of 11,614 units, with 8,202 units eligible for replacement at a cost of $881.2 million. See Figure 5 for a summary of the Model-generated fleet metrics.
Figure 5: Model Fleet Metrics
Source: Caltrans FSD
10
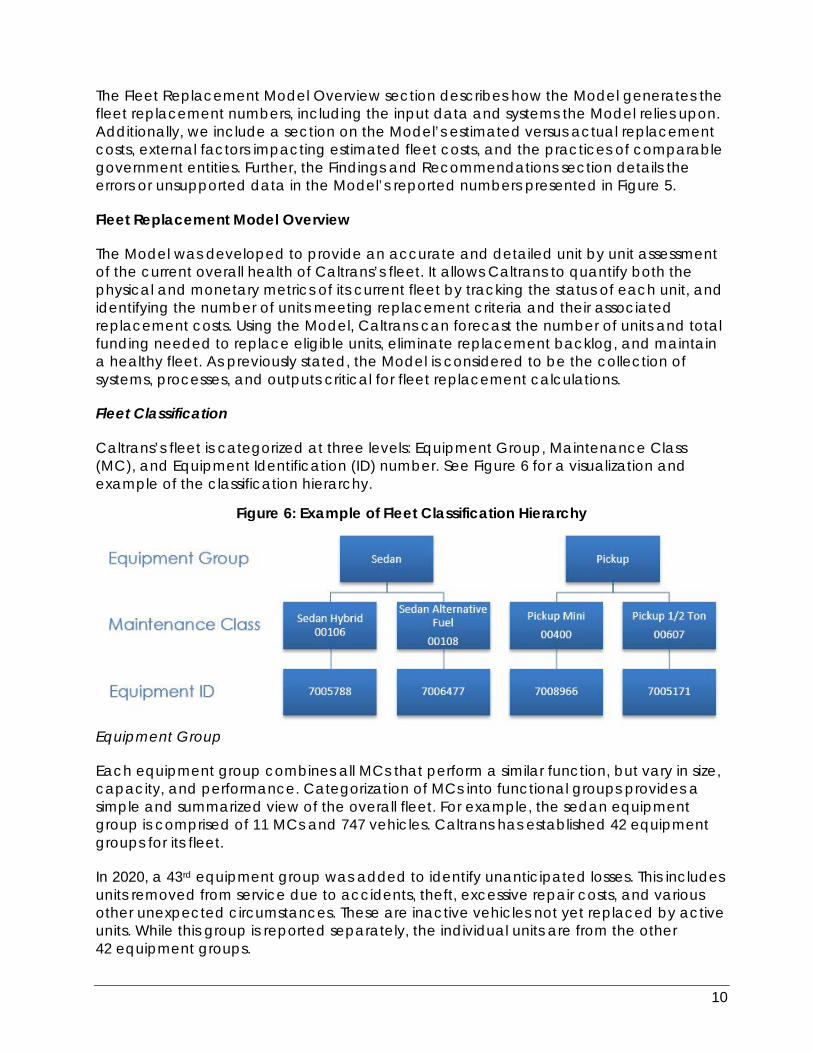
The Fleet Replacement Model Overview section describes how the Model generates the fleet replacement numbers, including the input data and systems the Model relies upon. Additionally, we include a section on the Model’s estimated versus actual replacement costs, external factors impacting estimated fleet costs, and the practices of comparable government entities. Further, the Findings and Recommendations section details the errors or unsupported data in the Model’s reported numbers presented in Figure 5. Fleet Replacement Model Overview The Model was developed to provide an accurate and detailed unit by unit assessment of the current overall health of Caltrans’s fleet. It allows Caltrans to quantify both the physical and monetary metrics of its current fleet by tracking the status of each unit, and identifying the number of units meeting replacement criteria and their associated replacement costs. Using the Model, Caltrans can forecast the number of units and total funding needed to replace eligible units, eliminate replacement backlog, and maintain a healthy fleet. As previously stated, the Model is considered to be the collection of systems, processes, and outputs critical for fleet replacement calculations. Fleet Classification Caltrans’s fleet is categorized at three levels: Equipment Group, Maintenance Class (MC), and Equipment Identification (ID) number. See Figure 6 for a visualization and example of the classification hierarchy.
Figure 6: Example of Fleet Classification Hierarchy
Equipment Group Each equipment group combines all MCs that perform a similar function, but vary in size, capacity, and performance. Categorization of MCs into functional groups provides a simple and summarized view of the overall fleet. For example, the sedan equipment group is comprised of 11 MCs and 747 vehicles. Caltrans has established 42 equipment groups for its fleet. In 2020, a 43rd equipment group was added to identify unanticipated losses. This includes units removed from service due to accidents, theft, excessive repair costs, and various other unexpected circumstances. These are inactive vehicles not yet replaced by active units. While this group is reported separately, the individual units are from the other 42 equipment groups.
11
Maintenance Class Each MC is represented by a five-digit number and groups units whose size, capacity, performance, and function are similar and often identical. Caltrans has established 584 MCs for its fleet. Equipment ID Each unit in the MC has a unique seven-digit identifier. As of February 2021, Caltrans’s Model reported 11,614 individual units. Model Process To generate Caltrans’s fleet totals, equipment eligible for replacement, fleet replacement backlog, and other key information, fleet data go through a six-step process as follows:
1. Data entry in AssetWorks
2. Filtering of applicable equipment
3. Comparison to established replacement criteria
4. Input and calculation of replacement costs
5. Application of inflation rate
6. Reporting of fleet and replacement costs
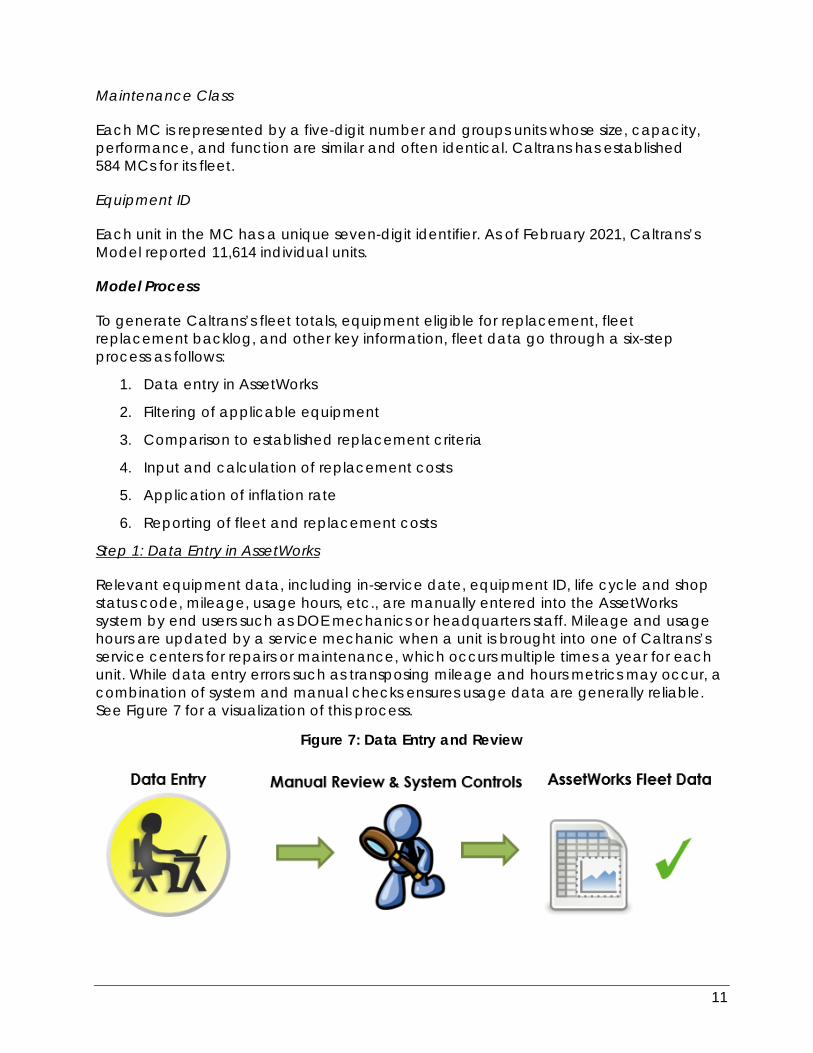
Step 1: Data Entry in AssetWorks Relevant equipment data, including in-service date, equipment ID, life cycle and shop status code, mileage, usage hours, etc., are manually entered into the AssetWorks system by end users such as DOE mechanics or headquarters staff. Mileage and usage hours are updated by a service mechanic when a unit is brought into one of Caltrans’s service centers for repairs or maintenance, which occurs multiple times a year for each unit. While data entry errors such as transposing mileage and hours metrics may occur, a combination of system and manual checks ensures usage data are generally reliable. See Figure 7 for a visualization of this process.
Figure 7: Data Entry and Review
12
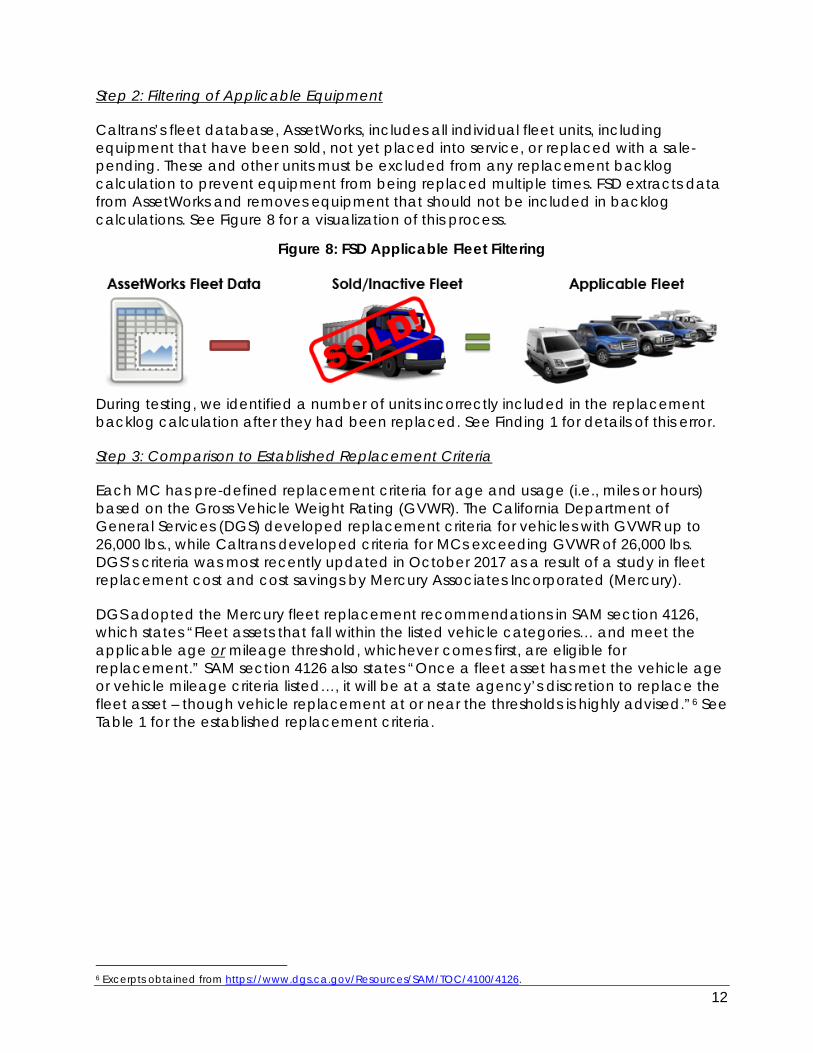
Step 2: Filtering of Applicable Equipment Caltrans’s fleet database, AssetWorks, includes all individual fleet units, including equipment that have been sold, not yet placed into service, or replaced with a sale-pending. These and other units must be excluded from any replacement backlog calculation to prevent equipment from being replaced multiple times. FSD extracts data from AssetWorks and removes equipment that should not be included in backlog calculations. See Figure 8 for a visualization of this process.
Figure 8: FSD Applicable Fleet Filtering
During testing, we identified a number of units incorrectly included in the replacement backlog calculation after they had been replaced. See Finding 1 for details of this error. Step 3: Comparison to Established Replacement Criteria Each MC has pre-defined replacement criteria for age and usage (i.e., miles or hours) based on the Gross Vehicle Weight Rating (GVWR). The California Department of General Services (DGS) developed replacement criteria for vehicles with GVWR up to 26,000 lbs., while Caltrans developed criteria for MCs exceeding GVWR of 26,000 lbs. DGS’s criteria was most recently updated in October 2017 as a result of a study in fleet replacement cost and cost savings by Mercury Associates Incorporated (Mercury). DGS adopted the Mercury fleet replacement recommendations in SAM section 4126, which states “Fleet assets that fall within the listed vehicle categories… and meet the applicable age or mileage threshold, whichever comes first, are eligible for replacement.” SAM section 4126 also states “Once a fleet asset has met the vehicle age or vehicle mileage criteria listed…, it will be at a state agency’s discretion to replace the fleet asset – though vehicle replacement at or near the thresholds is highly advised.”6 See Table 1 for the established replacement criteria.
6 Excerpts obtained from https://www.dgs.ca.gov/Resources/SAM/TOC/4100/4126.
13
Table 1: Equipment Replacement Criteria
Capacity Equipment Type Age
(years) Usage Source up to 8,500 lbs. GVWR Sedans 6 65,000 miles DGS up to 8,500 lbs. GVWR Mini Vans 8 80,000 miles DGS up to 8,500 lbs. GVWR Cargo Vans and Pickups 5 65,000 miles DGS up to 8,500 lbs. GVWR Sport Utility Vehicles (SUV) 7 85,000 miles DGS 8,501 to 16,000 lbs. GVWR Trucks, Vans, and SUVs 6 70,000 miles DGS 16,001 to 26,000 lbs. GWVR Trucks, Vans, and SUVs 11 115,000 miles DGS 26,001 to 35,000 lbs. GVWR Plow Dump Trucks (4 cubic yards) 11 175,000 miles Caltrans 35,001 to 64,000 lbs. GVWR Plow Dump Trucks (10 cubic yards) 11 175,000 miles Caltrans varies Large Loaders and Graders 15 5,500 hours Caltrans varies Snow Blowers 11 5,500 hours Caltrans 4 cubic yards Sweepers 5 4,000 hours Caltrans
Source: State Administrative Manual section 4120; Caltrans FSD
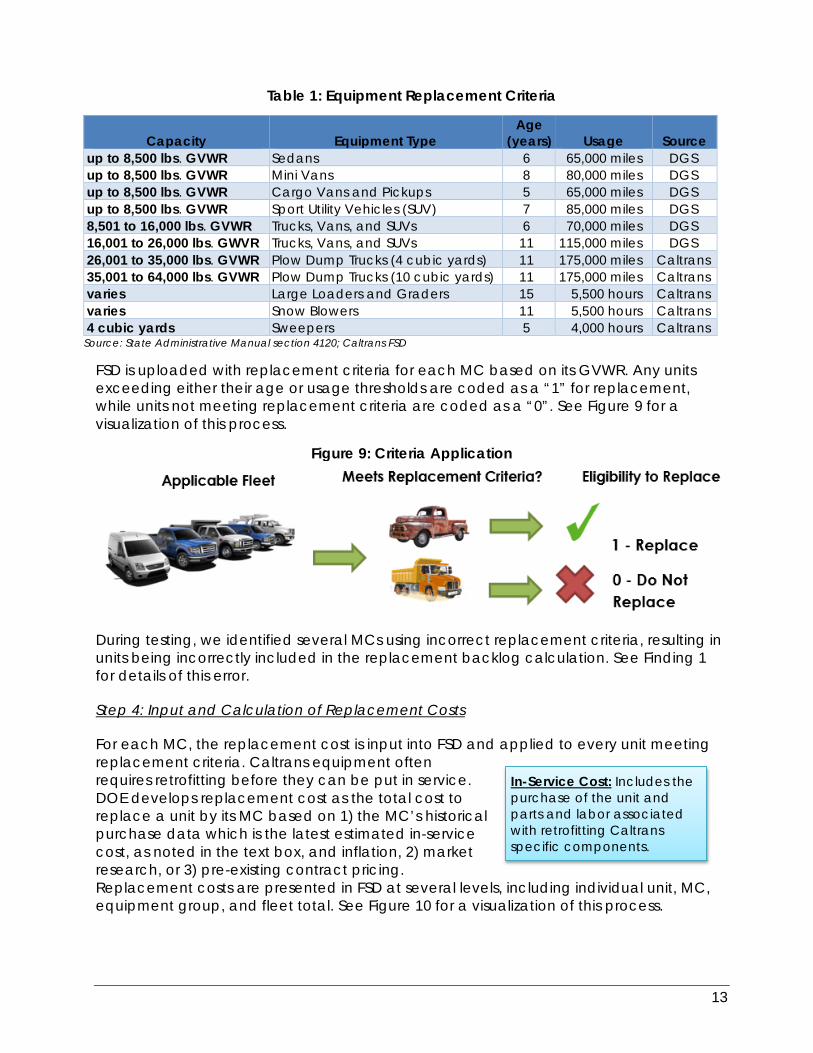
FSD is uploaded with replacement criteria for each MC based on its GVWR. Any units exceeding either their age or usage thresholds are coded as a “1” for replacement, while units not meeting replacement criteria are coded as a “0”. See Figure 9 for a visualization of this process.
Figure 9: Criteria Application
During testing, we identified several MCs using incorrect replacement criteria, resulting in units being incorrectly included in the replacement backlog calculation. See Finding 1 for details of this error. Step 4: Input and Calculation of Replacement Costs For each MC, the replacement cost is input into FSD and applied to every unit meeting replacement criteria. Caltrans equipment often requires retrofitting before they can be put in service. DOE develops replacement cost as the total cost to replace a unit by its MC based on 1) the MC’s historical purchase data which is the latest estimated in-service cost, as noted in the text box, and inflation, 2) market research, or 3) pre-existing contract pricing. Replacement costs are presented in FSD at several levels, including individual unit, MC, equipment group, and fleet total. See Figure 10 for a visualization of this process.
In-Service Cost: Includes the purchase of the unit and parts and labor associated with retrofitting Caltrans specific components.
14
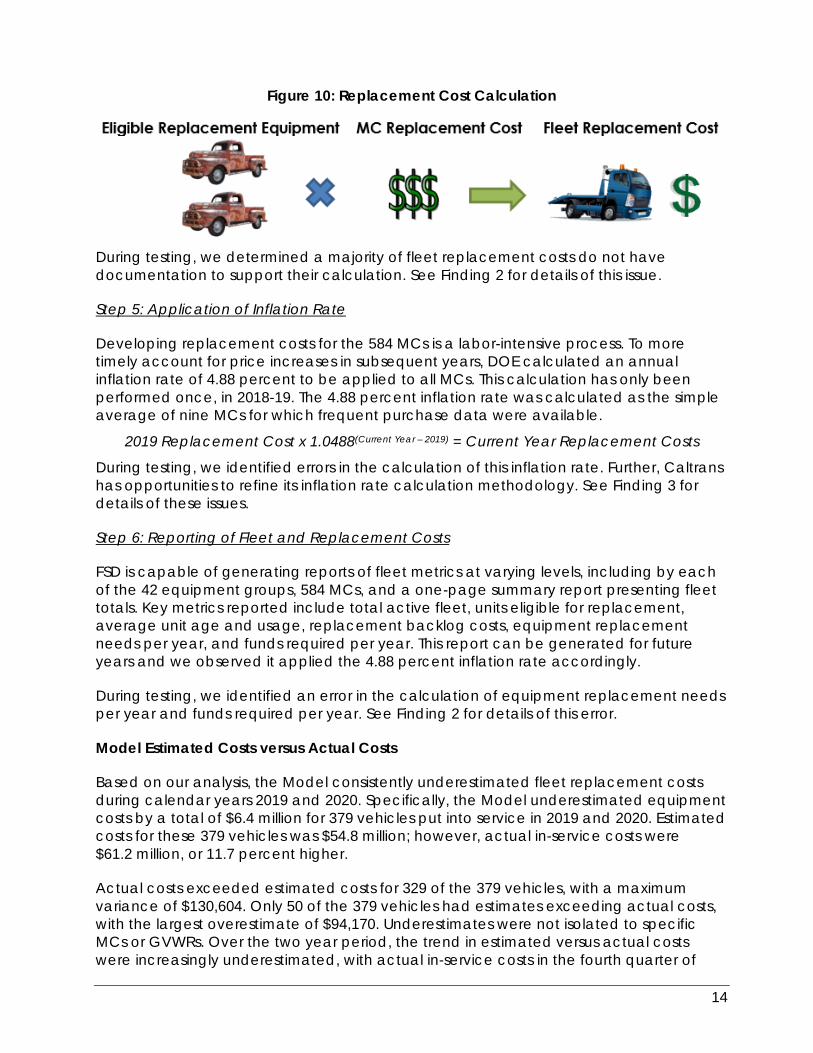
Figure 10: Replacement Cost Calculation
During testing, we determined a majority of fleet replacement costs do not have documentation to support their calculation. See Finding 2 for details of this issue. Step 5: Application of Inflation Rate Developing replacement costs for the 584 MCs is a labor-intensive process. To more timely account for price increases in subsequent years, DOE calculated an annual inflation rate of 4.88 percent to be applied to all MCs. This calculation has only been performed once, in 2018-19. The 4.88 percent inflation rate was calculated as the simple average of nine MCs for which frequent purchase data were available.
2019 Replacement Cost x 1.0488(Current Year – 2019) = Current Year Replacement Costs
During testing, we identified errors in the calculation of this inflation rate. Further, Caltrans has opportunities to refine its inflation rate calculation methodology. See Finding 3 for details of these issues. Step 6: Reporting of Fleet and Replacement Costs FSD is capable of generating reports of fleet metrics at varying levels, including by each of the 42 equipment groups, 584 MCs, and a one-page summary report presenting fleet totals. Key metrics reported include total active fleet, units eligible for replacement, average unit age and usage, replacement backlog costs, equipment replacement needs per year, and funds required per year. This report can be generated for future years and we observed it applied the 4.88 percent inflation rate accordingly. During testing, we identified an error in the calculation of equipment replacement needs per year and funds required per year. See Finding 2 for details of this error. Model Estimated Costs versus Actual Costs Based on our analysis, the Model consistently underestimated fleet replacement costs during calendar years 2019 and 2020. Specifically, the Model underestimated equipment costs by a total of $6.4 million for 379 vehicles put into service in 2019 and 2020. Estimated costs for these 379 vehicles was $54.8 million; however, actual in-service costs were $61.2 million, or 11.7 percent higher. Actual costs exceeded estimated costs for 329 of the 379 vehicles, with a maximum variance of $130,604. Only 50 of the 379 vehicles had estimates exceeding actual costs, with the largest overestimate of $94,170. Underestimates were not isolated to specific MCs or GVWRs. Over the two year period, the trend in estimated versus actual costs were increasingly underestimated, with actual in-service costs in the fourth quarter of
15
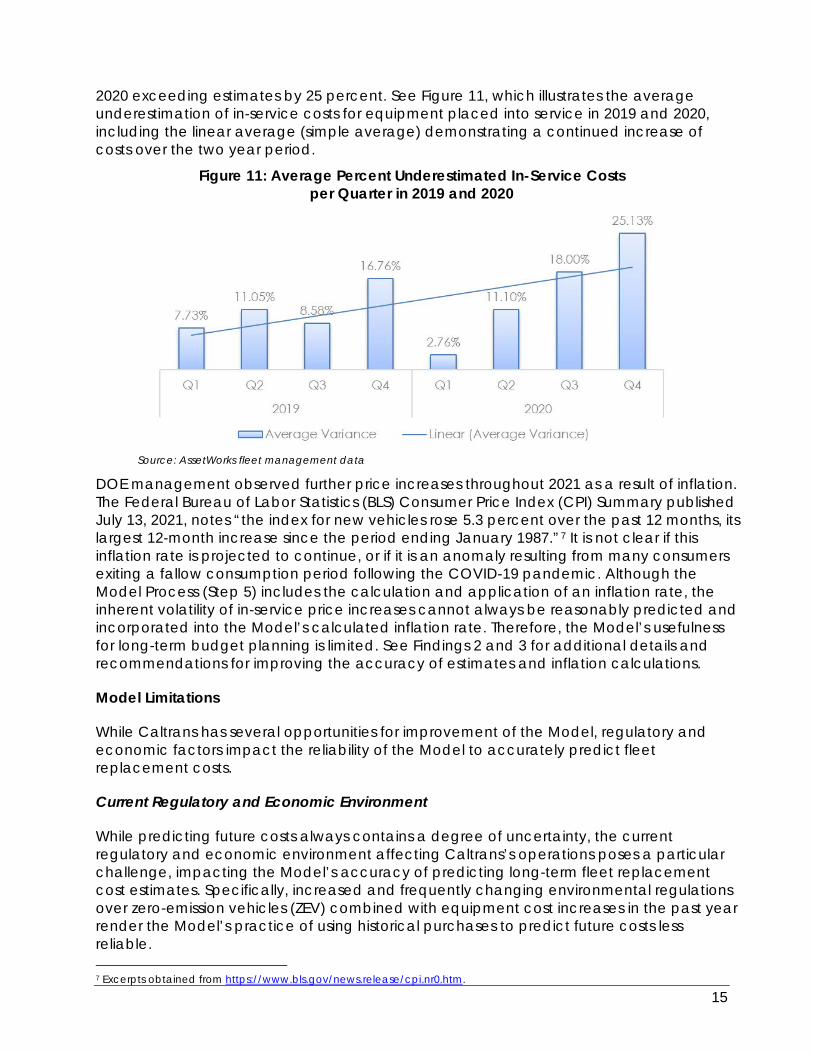
2020 exceeding estimates by 25 percent. See Figure 11, which illustrates the average underestimation of in-service costs for equipment placed into service in 2019 and 2020, including the linear average (simple average) demonstrating a continued increase of costs over the two year period.
Figure 11: Average Percent Underestimated In-Service Costs per Quarter in 2019 and 2020
Source: AssetWorks fleet management data
DOE management observed further price increases throughout 2021 as a result of inflation. The Federal Bureau of Labor Statistics (BLS) Consumer Price Index (CPI) Summary published July 13, 2021, notes “the index for new vehicles rose 5.3 percent over the past 12 months, its largest 12-month increase since the period ending January 1987.”7 It is not clear if this inflation rate is projected to continue, or if it is an anomaly resulting from many consumers exiting a fallow consumption period following the COVID-19 pandemic. Although the Model Process (Step 5) includes the calculation and application of an inflation rate, the inherent volatility of in-service price increases cannot always be reasonably predicted and incorporated into the Model’s calculated inflation rate. Therefore, the Model’s usefulness for long-term budget planning is limited. See Findings 2 and 3 for additional details and recommendations for improving the accuracy of estimates and inflation calculations. Model Limitations While Caltrans has several opportunities for improvement of the Model, regulatory and economic factors impact the reliability of the Model to accurately predict fleet replacement costs. Current Regulatory and Economic Environment While predicting future costs always contains a degree of uncertainty, the current regulatory and economic environment affecting Caltrans’s operations poses a particular challenge, impacting the Model’s accuracy of predicting long-term fleet replacement cost estimates. Specifically, increased and frequently changing environmental regulations over zero-emission vehicles (ZEV) combined with equipment cost increases in the past year render the Model’s practice of using historical purchases to predict future costs less reliable. 7 Excerpts obtained from https://www.bls.gov/news.release/cpi.nr0.htm.
16
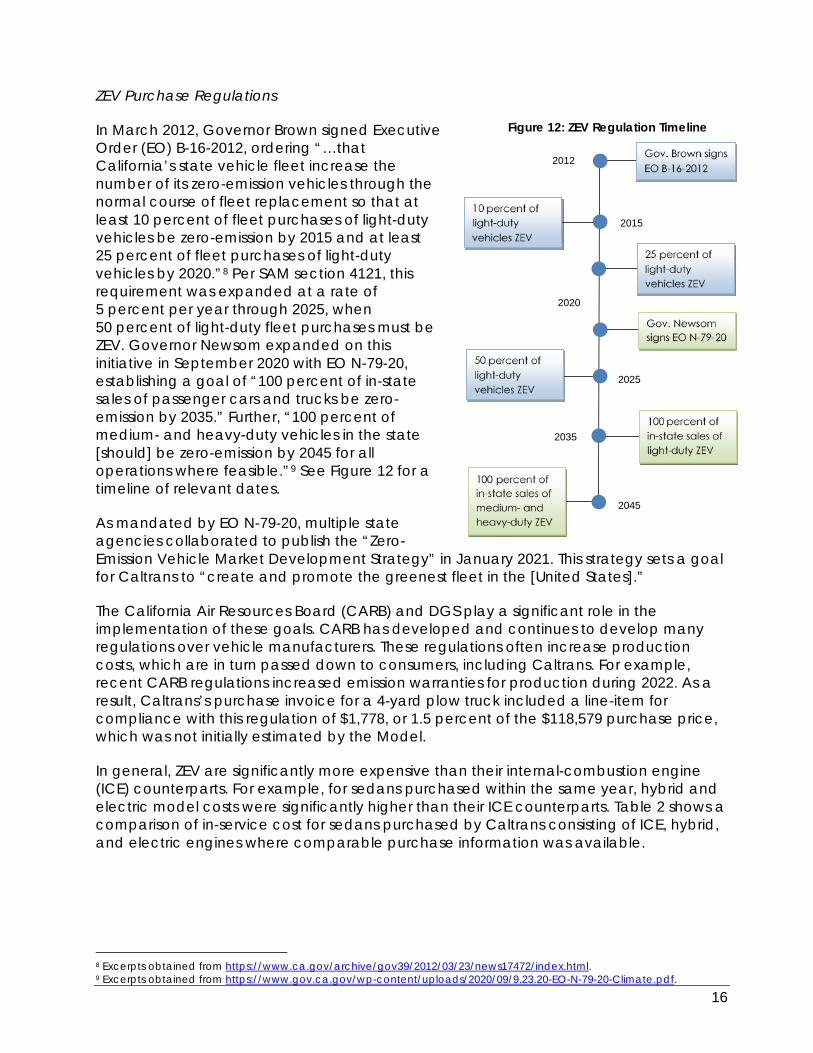
ZEV Purchase Regulations In March 2012, Governor Brown signed Executive Order (EO) B-16-2012, ordering “…that California’s state vehicle fleet increase the number of its zero-emission vehicles through the normal course of fleet replacement so that at least 10 percent of fleet purchases of light-duty vehicles be zero-emission by 2015 and at least 25 percent of fleet purchases of light-duty vehicles by 2020.”8 Per SAM section 4121, this requirement was expanded at a rate of 5 percent per year through 2025, when 50 percent of light-duty fleet purchases must be ZEV. Governor Newsom expanded on this initiative in September 2020 with EO N-79-20, establishing a goal of “100 percent of in-state sales of passenger cars and trucks be zero-emission by 2035.” Further, “100 percent of medium- and heavy-duty vehicles in the state [should] be zero-emission by 2045 for all operations where feasible.”9 See Figure 12 for a timeline of relevant dates. As mandated by EO N-79-20, multiple state agencies collaborated to publish the “Zero-Emission Vehicle Market Development Strategy” in January 2021. This strategy sets a goal for Caltrans to “create and promote the greenest fleet in the [United States].” The California Air Resources Board (CARB) and DGS play a significant role in the implementation of these goals. CARB has developed and continues to develop many regulations over vehicle manufacturers. These regulations often increase production costs, which are in turn passed down to consumers, including Caltrans. For example, recent CARB regulations increased emission warranties for production during 2022. As a result, Caltrans’s purchase invoice for a 4-yard plow truck included a line-item for compliance with this regulation of $1,778, or 1.5 percent of the $118,579 purchase price, which was not initially estimated by the Model. In general, ZEV are significantly more expensive than their internal-combustion engine (ICE) counterparts. For example, for sedans purchased within the same year, hybrid and electric model costs were significantly higher than their ICE counterparts. Table 2 shows a comparison of in-service cost for sedans purchased by Caltrans consisting of ICE, hybrid, and electric engines where comparable purchase information was available.
8 Excerpts obtained from https://www.ca.gov/archive/gov39/2012/03/23/news17472/index.html. 9 Excerpts obtained from https://www.gov.ca.gov/wp-content/uploads/2020/09/9.23.20-EO-N-79-20-Climate.pdf.
2012
2015
2020
2025
Figure 12: ZEV Regulation Timeline
2045
2035
17
Table 2: ICE, Hybrid, and Electric Sedan Replacement Cost Comparison
Sedans (2014 and 2015) ICE Hybrid Electric
In-service cost per sedan $ 20,610 $ 31,347 $ 33,624 In-service cost for sedan group (747 vehicles) $ 15,395,670 $ 23,416,209 $ 25,117,128
Source: AssetWorks fleet management data
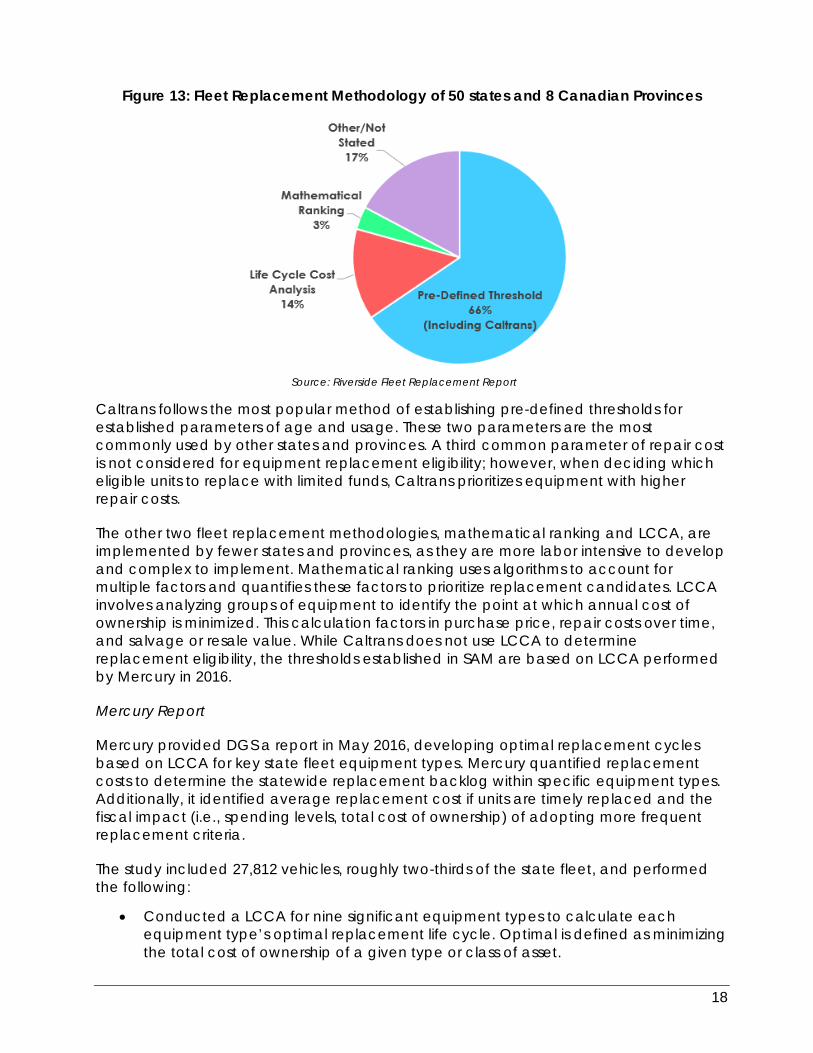
When ICE vehicles are replaced by ZEV, historical costs cannot be relied upon for estimating future prices. Additionally, for many MCs, low- or zero-emission alternatives have not been developed and manufacturers are unable to provide cost estimates, hindering Caltrans’s ability to use market research to project future replacement costs. Fleet Purchasing and DGS Approval Beginning in 2012-13, state departments are required to submit an annual electronic Fleet Acquisition Plan (FAP) to DGS’s Office of Fleet and Asset Management (OFAM), per SAM section 4120. OFAM reviews the FAP to ensure purchases are aligned with department needs and state guidelines. For example, SAM section 4121.7, enacted December 2019, prohibits state agencies from purchasing ICE sedans. SAM section 4121.9 states, “As of July 1, 2020, state agencies are required to prioritize purchasing of ZEV and Hybrid-Electric Alternative Fuel Vehicles, in designated medium- and heavy-duty vehicle categories where programmatically feasible”, such as vans and trucks.10 If a submitted FAP does not comply with relevant SAM sections, it can be returned to a department for revisions prior to approval. An approved FAP is required prior to Caltrans purchasing new fleet equipment. Comparable Government Entities and Best Practices Caltrans fleet replacement practices and Model generally align with those of comparable state Departments of Transportation (DOT). Our analysis included reviewing the Mercury report commissioned by DGS as well as a University of California Riverside (Riverside) report that performed life-cycle cost analyses (LCCA) on several equipment types within Caltrans’s fleet, and interviewing DOT management from other Western states. Riverside Report The Riverside report was prepared for DOE in April 2017 and examined the fleet replacement methodology of the DOTs for all 50 states and 8 Canadian provinces. The Riverside report categorizes fleet replacement models as a pre-defined-threshold method, LCCA method, or mathematical ranking method. See Figure 13 for the DOT adoption rates of these methods.
10 Excerpts obtained from https://www.dgs.ca.gov/Resources/SAM/TOC/4100/4121-9.
18
Figure 13: Fleet Replacement Methodology of 50 states and 8 Canadian Provinces
Source: Riverside Fleet Replacement Report
Caltrans follows the most popular method of establishing pre-defined thresholds for established parameters of age and usage. These two parameters are the most commonly used by other states and provinces. A third common parameter of repair cost is not considered for equipment replacement eligibility; however, when deciding which eligible units to replace with limited funds, Caltrans prioritizes equipment with higher repair costs. The other two fleet replacement methodologies, mathematical ranking and LCCA, are implemented by fewer states and provinces, as they are more labor intensive to develop and complex to implement. Mathematical ranking uses algorithms to account for multiple factors and quantifies these factors to prioritize replacement candidates. LCCA involves analyzing groups of equipment to identify the point at which annual cost of ownership is minimized. This calculation factors in purchase price, repair costs over time, and salvage or resale value. While Caltrans does not use LCCA to determine replacement eligibility, the thresholds established in SAM are based on LCCA performed by Mercury in 2016. Mercury Report Mercury provided DGS a report in May 2016, developing optimal replacement cycles based on LCCA for key state fleet equipment types. Mercury quantified replacement costs to determine the statewide replacement backlog within specific equipment types. Additionally, it identified average replacement cost if units are timely replaced and the fiscal impact (i.e., spending levels, total cost of ownership) of adopting more frequent replacement criteria. The study included 27,812 vehicles, roughly two-thirds of the state fleet, and performed the following:
• Conducted a LCCA for nine significant equipment types to calculate each equipment type’s optimal replacement life cycle. Optimal is defined as minimizing the total cost of ownership of a given type or class of asset.

19
• Developed multiple scenarios for long-term replacement plans that detail replacement costs on an annual basis.
• Compared projections in costs and savings if the state maintained its current criteria versus adopted Mercury’s proposed criteria.
As previously noted, Mercury’s recommendations were adopted by DGS through SAM section 4126. Mercury’s analysis estimated that implementing these more aggressive fleet replacement thresholds would result in savings for the state of “$14 million per year through a combination of lower repair and fuel costs, and much higher revenues when the vehicles are sold at the end of their shorter life cycles.” A critical element of this approach is applying salvage value of vehicles toward the purchase of future vehicles. Currently, Caltrans’s fleet is an average age of 11.9 years, significantly greater than most MCs’ replacement eligibility. With increased age, salvage values decrease. If Caltrans were to begin replacing equipment within the periods established in SAM, there would be an initial period where average cost of ownership would increase as older units were replaced with newer equipment. The salvage value of these older units would do little to offset new equipment purchases, and savings would likely not be recognized until newer equipment just passing replacement criteria are sold. Comparable Government Entities In addition to reviewing the Riverside and Mercury reports, we interviewed DOT management from Arizona, Nevada, Oregon, and Washington. Caltrans’s fleet replacement methodologies are consistent with these other state DOTs, utilizing age and usage as the top replacement parameters. Other state DOTs also observed that they face similar challenges with funding shortages, replacement backlogs, and increasing replacement costs. When compared with replacement criteria utilized by other states, Caltrans uses lower thresholds for fleet replacement eligibility than comparable states. For example, Caltrans sets replacement criteria for sweepers at five years or 4,000 hours. Other states contacted have replacement criteria for sweepers at 10-12 years or 5,000 – 6,000 hours. However, other state DOTs stated they either did not know how their thresholds were established or that they were not based on any sort of LCCA, and their replacement thresholds should probably be reduced. One of Caltrans’s strategic goals is to strengthen its stewardship and drive efficiency by being good stewards and managers of California’s transportation system, as noted in the text box.11 While Caltrans’s Model is comparable to other governmental entities, and consistent with SAM 4126 guidelines, the findings and recommendations identified below are intended to help Caltrans refine its fleet replacement practices to support its strategic priorities and minimize the risk of inaccuracies within its Model.
11 Excerpts obtained from
https://dot.ca.gov/-/media/dot-media/programs/risk-strategic-management/documents/sp-2020-16p-web-a11y.pdf.
Caltrans Strategic Goal: Strengthen stewardship and drive efficiency.
• Standardize and modernize equipment, facilities, technology, and supporting work practices.
• Enhance asset management and decision support tools.
• Develop and implement a methodology to allocate resources to support strategic priorities.
20
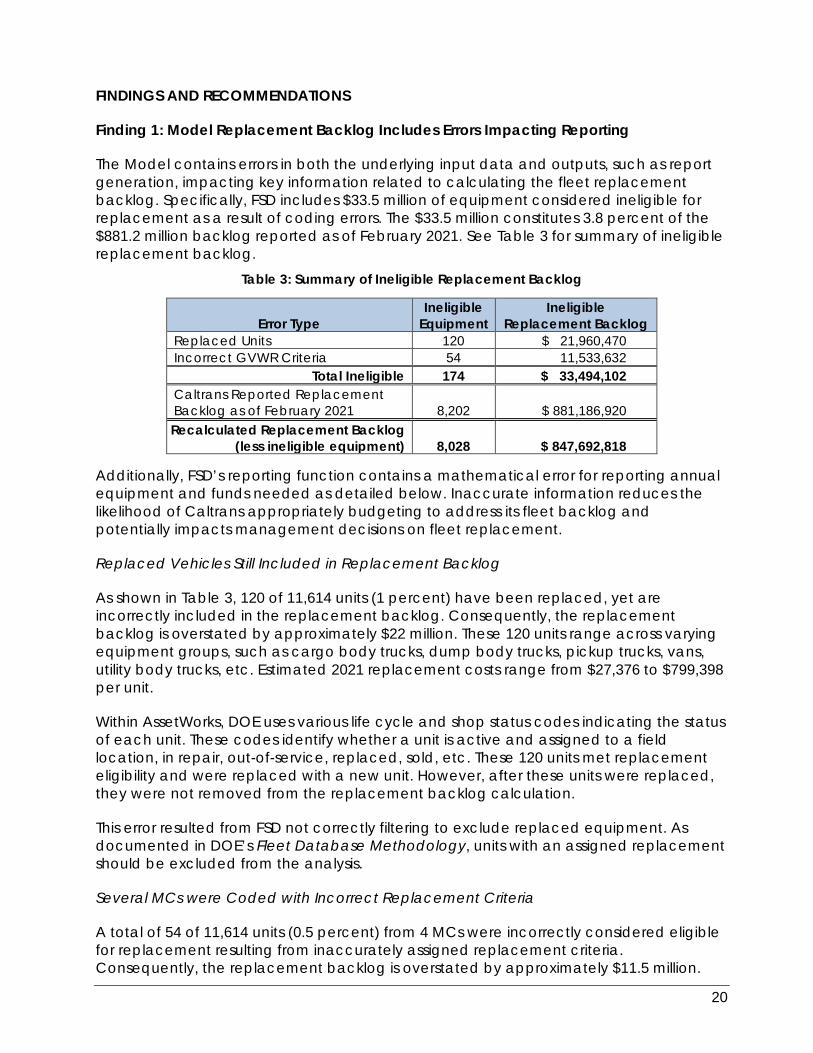
FINDINGS AND RECOMMENDATIONS Finding 1: Model Replacement Backlog Includes Errors Impacting Reporting The Model contains errors in both the underlying input data and outputs, such as report generation, impacting key information related to calculating the fleet replacement backlog. Specifically, FSD includes $33.5 million of equipment considered ineligible for replacement as a result of coding errors. The $33.5 million constitutes 3.8 percent of the $881.2 million backlog reported as of February 2021. See Table 3 for summary of ineligible replacement backlog.
Table 3: Summary of Ineligible Replacement Backlog
Error Type Ineligible
Equipment Ineligible
Replacement Backlog Replaced Units 120 $ 21,960,470 Incorrect GVWR Criteria 54 11,533,632
Total Ineligible 174 $ 33,494,102 Caltrans Reported Replacement Backlog as of February 2021 8,202 $ 881,186,920 Recalculated Replacement Backlog
(less ineligible equipment) 8,028 $ 847,692,818
Additionally, FSD’s reporting function contains a mathematical error for reporting annual equipment and funds needed as detailed below. Inaccurate information reduces the likelihood of Caltrans appropriately budgeting to address its fleet backlog and potentially impacts management decisions on fleet replacement. Replaced Vehicles Still Included in Replacement Backlog As shown in Table 3, 120 of 11,614 units (1 percent) have been replaced, yet are incorrectly included in the replacement backlog. Consequently, the replacement backlog is overstated by approximately $22 million. These 120 units range across varying equipment groups, such as cargo body trucks, dump body trucks, pickup trucks, vans, utility body trucks, etc. Estimated 2021 replacement costs range from $27,376 to $799,398 per unit. Within AssetWorks, DOE uses various life cycle and shop status codes indicating the status of each unit. These codes identify whether a unit is active and assigned to a field location, in repair, out-of-service, replaced, sold, etc. These 120 units met replacement eligibility and were replaced with a new unit. However, after these units were replaced, they were not removed from the replacement backlog calculation. This error resulted from FSD not correctly filtering to exclude replaced equipment. As documented in DOE’s Fleet Database Methodology, units with an assigned replacement should be excluded from the analysis. Several MCs were Coded with Incorrect Replacement Criteria A total of 54 of 11,614 units (0.5 percent) from 4 MCs were incorrectly considered eligible for replacement resulting from inaccurately assigned replacement criteria. Consequently, the replacement backlog is overstated by approximately $11.5 million.
21
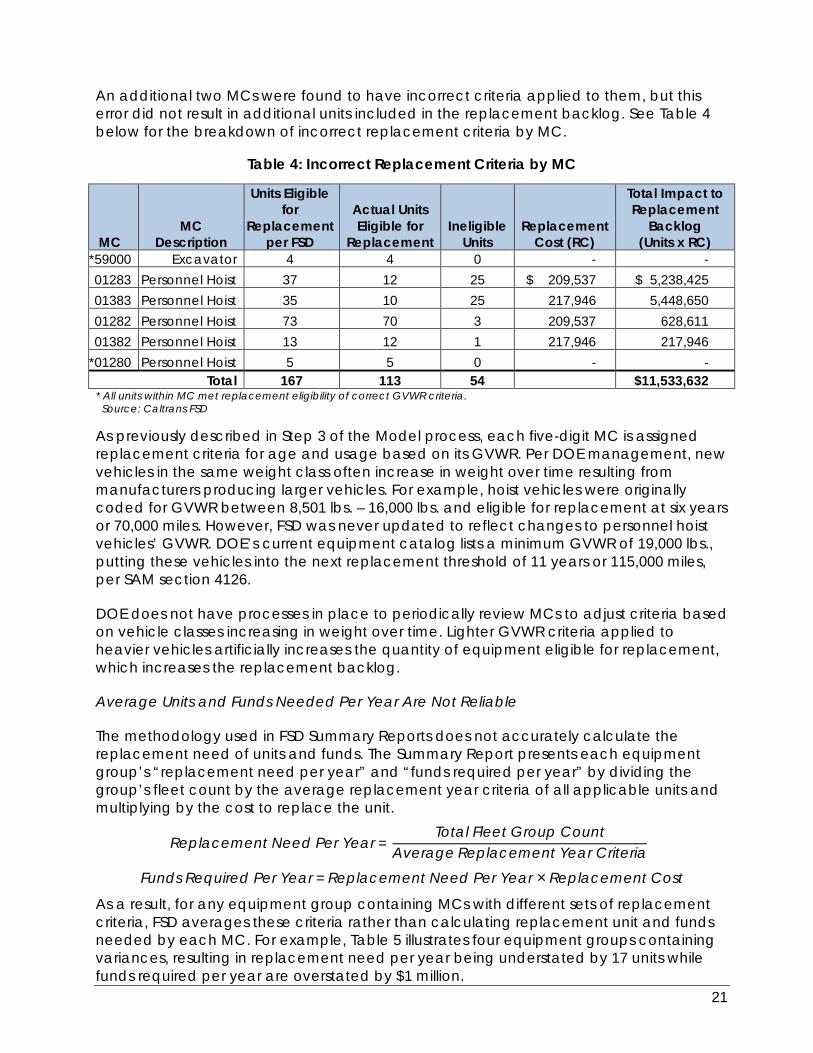
An additional two MCs were found to have incorrect criteria applied to them, but this error did not result in additional units included in the replacement backlog. See Table 4 below for the breakdown of incorrect replacement criteria by MC.
Table 4: Incorrect Replacement Criteria by MC
MC MC
Description
Units Eligible for
Replacement per FSD
Actual Units Eligible for
Replacement Ineligible
Units Replacement
Cost (RC)
Total Impact to Replacement
Backlog (Units x RC)
*59000 Excavator 4 4 0 - - 01283 Personnel Hoist 37 12 25 $ 209,537 $ 5,238,425 01383 Personnel Hoist 35 10 25 217,946 5,448,650 01282 Personnel Hoist 73 70 3 209,537 628,611 01382 Personnel Hoist 13 12 1 217,946 217,946
*01280 Personnel Hoist 5 5 0 - - Total 167 113 54 $11,533,632
* All units within MC met replacement eligibility of correct GVWR criteria. Source: Caltrans FSD
As previously described in Step 3 of the Model process, each five-digit MC is assigned replacement criteria for age and usage based on its GVWR. Per DOE management, new vehicles in the same weight class often increase in weight over time resulting from manufacturers producing larger vehicles. For example, hoist vehicles were originally coded for GVWR between 8,501 lbs. – 16,000 lbs. and eligible for replacement at six years or 70,000 miles. However, FSD was never updated to reflect changes to personnel hoist vehicles’ GVWR. DOE’s current equipment catalog lists a minimum GVWR of 19,000 lbs., putting these vehicles into the next replacement threshold of 11 years or 115,000 miles, per SAM section 4126. DOE does not have processes in place to periodically review MCs to adjust criteria based on vehicle classes increasing in weight over time. Lighter GVWR criteria applied to heavier vehicles artificially increases the quantity of equipment eligible for replacement, which increases the replacement backlog. Average Units and Funds Needed Per Year Are Not Reliable The methodology used in FSD Summary Reports does not accurately calculate the replacement need of units and funds. The Summary Report presents each equipment group’s “replacement need per year” and “funds required per year” by dividing the group’s fleet count by the average replacement year criteria of all applicable units and multiplying by the cost to replace the unit.
Replacement Need Per Year = Total Fleet Group Count
Average Replacement Year Criteria
Funds Required Per Year = Replacement Need Per Year × Replacement Cost
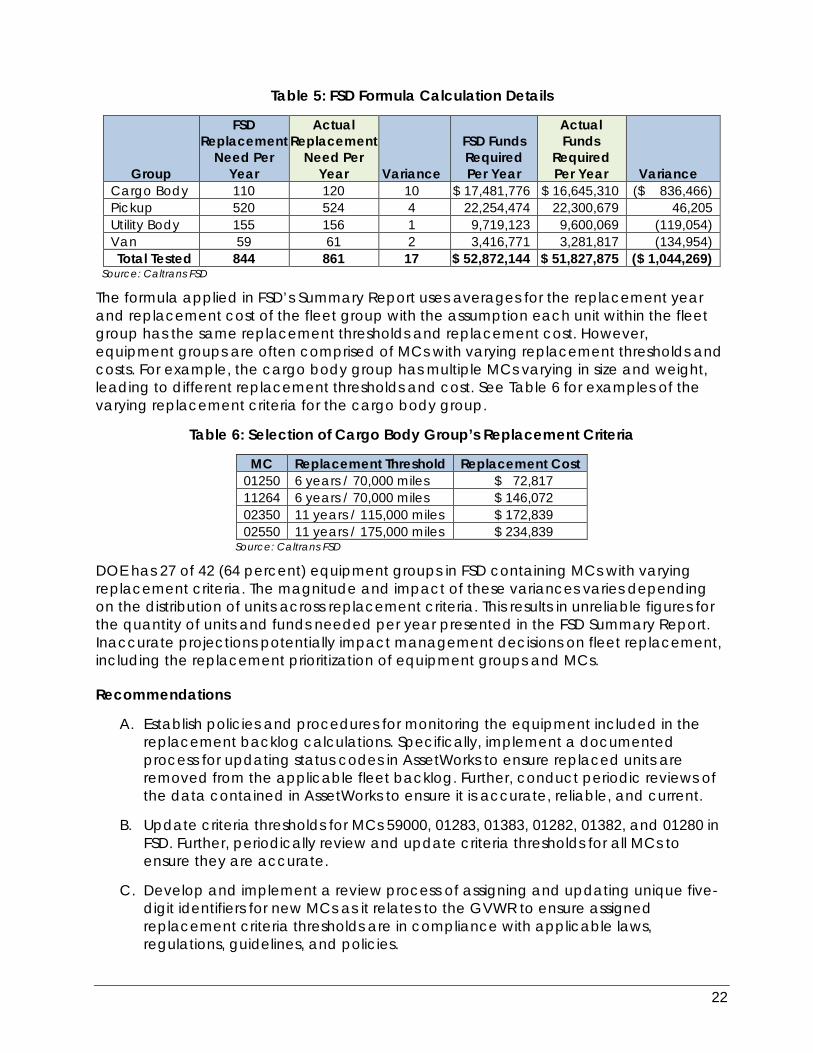
As a result, for any equipment group containing MCs with different sets of replacement criteria, FSD averages these criteria rather than calculating replacement unit and funds needed by each MC. For example, Table 5 illustrates four equipment groups containing variances, resulting in replacement need per year being understated by 17 units while funds required per year are overstated by $1 million.
22
Table 5: FSD Formula Calculation Details
Group
FSD Replacement
Need Per Year
Actual Replacement
Need Per Year Variance
FSD Funds Required Per Year
Actual Funds
Required Per Year Variance
Cargo Body 110 120 10 $ 17,481,776 $ 16,645,310 ($ 836,466) Pickup 520 524 4 22,254,474 22,300,679 46,205 Utility Body 155 156 1 9,719,123 9,600,069 (119,054) Van 59 61 2 3,416,771 3,281,817 (134,954) Total Tested 844 861 17 $ 52,872,144 $ 51,827,875 ($ 1,044,269)
Source: Caltrans FSD
The formula applied in FSD’s Summary Report uses averages for the replacement year and replacement cost of the fleet group with the assumption each unit within the fleet group has the same replacement thresholds and replacement cost. However, equipment groups are often comprised of MCs with varying replacement thresholds and costs. For example, the cargo body group has multiple MCs varying in size and weight, leading to different replacement thresholds and cost. See Table 6 for examples of the varying replacement criteria for the cargo body group.
Table 6: Selection of Cargo Body Group’s Replacement Criteria
MC Replacement Threshold Replacement Cost 01250 6 years / 70,000 miles $ 72,817 11264 6 years / 70,000 miles $ 146,072 02350 11 years / 115,000 miles $ 172,839 02550 11 years / 175,000 miles $ 234,839
Source: Caltrans FSD
DOE has 27 of 42 (64 percent) equipment groups in FSD containing MCs with varying replacement criteria. The magnitude and impact of these variances varies depending on the distribution of units across replacement criteria. This results in unreliable figures for the quantity of units and funds needed per year presented in the FSD Summary Report. Inaccurate projections potentially impact management decisions on fleet replacement, including the replacement prioritization of equipment groups and MCs. Recommendations
A. Establish policies and procedures for monitoring the equipment included in the replacement backlog calculations. Specifically, implement a documented process for updating status codes in AssetWorks to ensure replaced units are removed from the applicable fleet backlog. Further, conduct periodic reviews of the data contained in AssetWorks to ensure it is accurate, reliable, and current.
B. Update criteria thresholds for MCs 59000, 01283, 01383, 01282, 01382, and 01280 in FSD. Further, periodically review and update criteria thresholds for all MCs to ensure they are accurate.
C. Develop and implement a review process of assigning and updating unique five-digit identifiers for new MCs as it relates to the GVWR to ensure assigned replacement criteria thresholds are in compliance with applicable laws, regulations, guidelines, and policies.
23
D. Develop and implement a review process of the assigned replacement criteria thresholds input in FSD to ensure equipment identified for replacement are accurate and update as needed.
E. Review and update FSD’s formulas to increase the accuracy of projections of the equipment replacement need per year and funds requested per year.
Finding 2: Model Replacement Costs Are Not Supported Model replacement costs for a significant number of MCs cannot be supported. DOE develops replacement cost as total cost to replace a unit for each MC based on either historical purchase data (i.e., the latest estimated in-service cost and inflation), pre-existing contracts, or market research. Though DOE last developed replacement costs in 2018-19 for each MC, DOE does not maintain documentation to identify which MCs are based on which methodology. DOE management estimates approximately three quarters of replacement costs are based on historical data, with the remaining MCs based on market research or pre-existing contracts. For MCs based on historical data, current replacement cost should be supported by recent purchases, including in-service costs and applied inflation. However, 33 of 47 MCs tested (70 percent) were not supported by purchase data. DOE does not have policies in place to maintain documentation to support Model replacement costs. Per DOE, any market research estimates were emailed to staff and were not retained as the system automatically deletes emails within 120 days. Without documentation, the accuracy of these estimated replacement costs could not be verified. Although estimated replacement costs are unsupported, actual replacement costs exceeded Model estimates by approximately 11.7 percent in 2019 and 2020, with actual in-service costs exceeding estimates in the fourth quarter of 2020 by 25 percent. Government Code section 13402 states “Agency heads are responsible for the establishment and maintenance of a system or systems of internal control,” which includes documented processes for developing and maintaining documents supporting key processes. Recommendations
A. Develop and implement a process to maintain documentation supporting estimated replacement costs.
B. Develop and implement a review process, including performing a trend analysis, of estimated replacement costs to ensure amounts are not significantly or continually underestimated.
Finding 3: Fleet Inflation Rate Calculation Needs Improvement The fleet inflation rate is not designed to effectively calculate inflation based on technically developed standards. Specifically, the inflation rate does not consider weighting MCs costs, updating underlying data timely, or selecting a large population for calculating inflation. Additionally, the inflation period is calculated incorrectly for a majority of the MCs included in the fleet sample. The inflation rate affects the price calculation of every unit’s replacement value and the total fleet replacement backlog.
24
These issues increase the likelihood the inflation rate does not reflect the true inflation of fleet costs, impacting DOE’s budgeting and decision making for fleet replacement. Calculation Does Not Consider All Available Variables DOE’s current methodology is not properly designed to consider all relevant factors to achieve the overall goal of calculating the inflation of the fleet replacement costs and replacement backlog. The fleet inflation rate was last calculated using a simple average of 9 select equipment types from 11 MCs, listed in Table 7. The fleet inflation rate calculation does not consider the number of units or total cost for each MC. For example, MC 36301 (diesel grader) contains 149 units totaling $43.2 million in total fleet replacement costs, while MC 05360 (paint striper) contains only 16 units totaling $11.6 million. Using DOE’s methodology, the inflation rates for each MC are given equal weight even though the replacement cost for MC 36301 is nearly four times that of MC 05360. Additionally, DOE does not have a consistent methodology for selecting representative MCs for calculating inflation. The MCs chosen for calculating inflation represent 10 percent of equipment and 18 percent of fleet costs. Per DOE management, these MCs were chosen due to their frequent purchases across multiple years. Though these MCs represent a large share of total equipment and costs, opportunities exist to increase the population selected. Specifically, there are many other MCs that similarly fit these criteria but were not selected. For example, MC 41846 (loader) has purchases in 14 of the previous 20 years and has an outsized share of the fleet with 190 units and fleet cost of $29.4 million. DOE’s first and only calculation of inflation was performed in 2018-19 and has not been updated as of July 2021. Price increases in MCs resulting from regulatory or economic factors can be sudden and significant. For example, MC 36301 (diesel grader) had actual in-service costs of $311,681 in 2019, exceeding the estimated costs by $17,389. Recalculating inflation more frequently helps ensure price increases are identified and captured timely, increasing the reliability of the Model. DOE management stated the limited MC selection and frequency of inflation calculation is due to lack of documented policies and procedures, limited staff resources, and a large time commitment to perform this analysis. DOE does not use the available Microsoft Excel functions to facilitate this process, e.g., expanding sample size, re-performing calculations, and introducing weighting through formulas. Technically developed standards support the practices of weighting items, frequent updates, and large sample sizes when calculating inflation. For example, BLS is responsible for calculating the CPI, a measurement of inflation across many industries and overall inflation in the United States. The CPI is the most widely used measure of inflation in the United States. These technically developed standards are all utilized by BLS when calculating the CPI.12
12 Excerpts obtained from https://www.bls.gov/opub/hom/pdf/cpi-20180214.pdf.
25
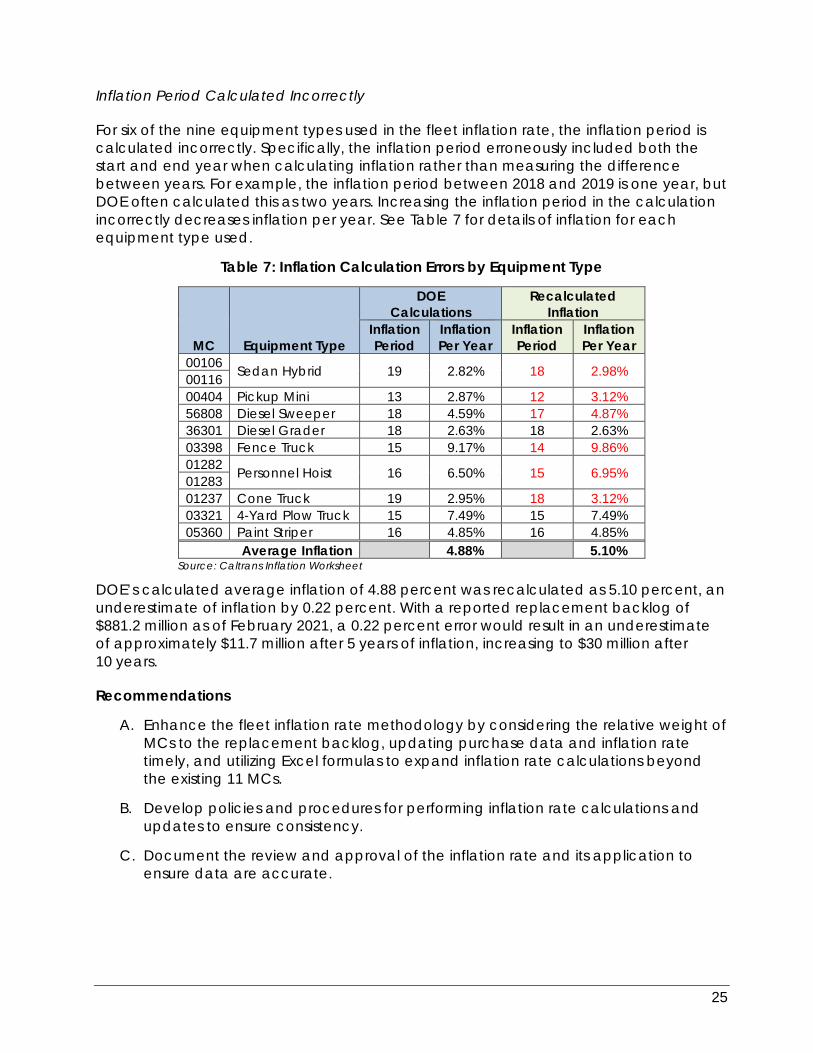
Inflation Period Calculated Incorrectly For six of the nine equipment types used in the fleet inflation rate, the inflation period is calculated incorrectly. Specifically, the inflation period erroneously included both the start and end year when calculating inflation rather than measuring the difference between years. For example, the inflation period between 2018 and 2019 is one year, but DOE often calculated this as two years. Increasing the inflation period in the calculation incorrectly decreases inflation per year. See Table 7 for details of inflation for each equipment type used.
Table 7: Inflation Calculation Errors by Equipment Type
MC Equipment Type
DOE Calculations
Recalculated Inflation
Inflation Period
Inflation Per Year
Inflation Period
Inflation Per Year
00106 Sedan Hybrid 19 2.82% 18 2.98% 00116 00404 Pickup Mini 13 2.87% 12 3.12% 56808 Diesel Sweeper 18 4.59% 17 4.87% 36301 Diesel Grader 18 2.63% 18 2.63% 03398 Fence Truck 15 9.17% 14 9.86% 01282 Personnel Hoist 16 6.50% 15 6.95% 01283 01237 Cone Truck 19 2.95% 18 3.12% 03321 4-Yard Plow Truck 15 7.49% 15 7.49% 05360 Paint Striper 16 4.85% 16 4.85%
Average Inflation 4.88% 5.10% Source: Caltrans Inflation Worksheet
DOE’s calculated average inflation of 4.88 percent was recalculated as 5.10 percent, an underestimate of inflation by 0.22 percent. With a reported replacement backlog of $881.2 million as of February 2021, a 0.22 percent error would result in an underestimate of approximately $11.7 million after 5 years of inflation, increasing to $30 million after 10 years. Recommendations
A. Enhance the fleet inflation rate methodology by considering the relative weight of MCs to the replacement backlog, updating purchase data and inflation rate timely, and utilizing Excel formulas to expand inflation rate calculations beyond the existing 11 MCs.
B. Develop policies and procedures for performing inflation rate calculations and updates to ensure consistency.
C. Document the review and approval of the inflation rate and its application to ensure data are accurate.

26
APPENDIX A
Acronyms
• BLS – Federal Bureau of Labor Statistics • Caltrans – California Department of Transportation • CARB – California Air Resources Board • CPI – Consumer Price Index • DGS – California Department of General Services • DOE – Division of Equipment • DOT – Departments of Transportation • EO – Executive Order • FAP – Fleet Acquisition Plan • FOUR – Fleet Optimization Utilization Reports • FSD – Fleet Sustainability Database • GVWR – Gross Vehicle Weight Rating • ICE – Internal Combustion Engine • ID – Equipment Identification • LCCA – Life-Cycle Cost Analysis • MC – Maintenance Class • Mercury – Mercury Associates Incorporated • Model – Caltrans’s Fleet Replacement Model • NEF – New Equipment Fund • OFAM – Office of Fleet and Asset Management • OMR – Office of Maintenance and Repair • Riverside – University of California Riverside • RMRA – Road Maintenance and Rehabilitation Account • SAM – State Administrative Manual • SB1 - Road Repair and Accountability Act of 2017 • SHA – State Highway Account • SUV – Sport Utility Vehicle • ZEV – Zero-Emission Vehicle
27
APPENDIX B
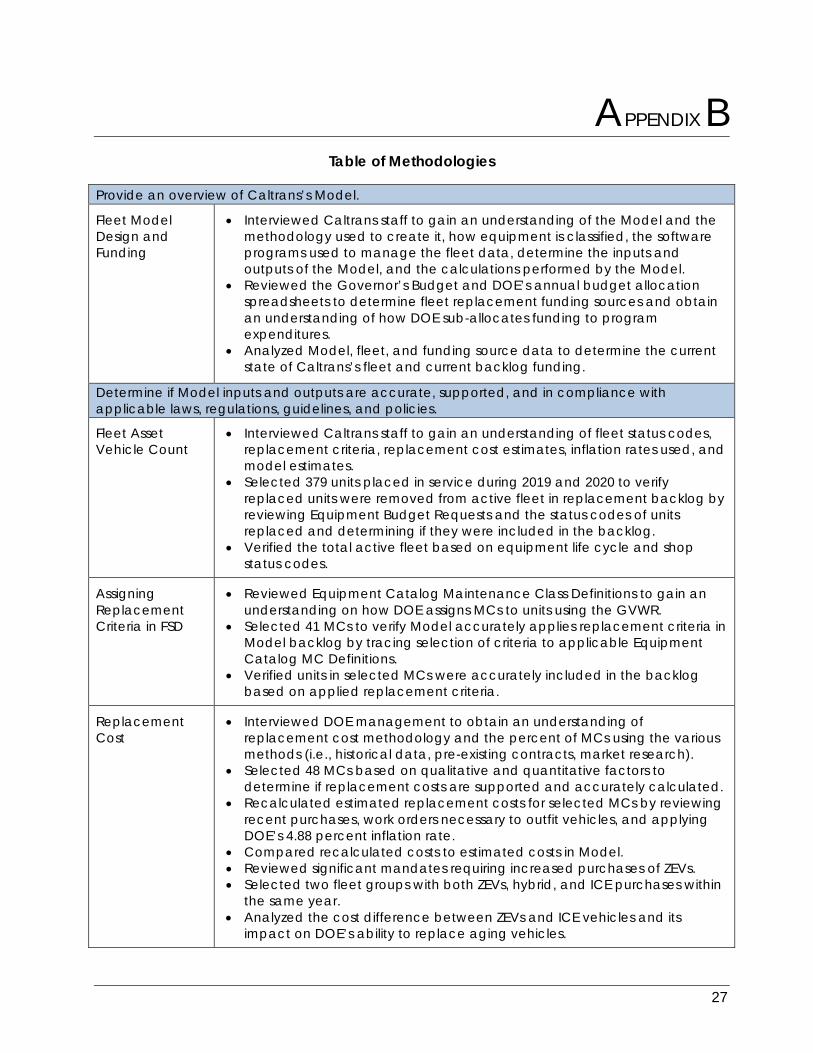
Table of Methodologies Provide an overview of Caltrans’s Model.
Fleet Model Design and Funding
• Interviewed Caltrans staff to gain an understanding of the Model and the methodology used to create it, how equipment is classified, the software programs used to manage the fleet data, determine the inputs and outputs of the Model, and the calculations performed by the Model.
• Reviewed the Governor’s Budget and DOE’s annual budget allocation spreadsheets to determine fleet replacement funding sources and obtain an understanding of how DOE sub-allocates funding to program expenditures.
• Analyzed Model, fleet, and funding source data to determine the current state of Caltrans’s fleet and current backlog funding.
Determine if Model inputs and outputs are accurate, supported, and in compliance with applicable laws, regulations, guidelines, and policies.
Fleet Asset Vehicle Count
• Interviewed Caltrans staff to gain an understanding of fleet status codes, replacement criteria, replacement cost estimates, inflation rates used, and model estimates.
• Selected 379 units placed in service during 2019 and 2020 to verify replaced units were removed from active fleet in replacement backlog by reviewing Equipment Budget Requests and the status codes of units replaced and determining if they were included in the backlog.
• Verified the total active fleet based on equipment life cycle and shop status codes.
Assigning Replacement Criteria in FSD
• Reviewed Equipment Catalog Maintenance Class Definitions to gain an understanding on how DOE assigns MCs to units using the GVWR.
• Selected 41 MCs to verify Model accurately applies replacement criteria in Model backlog by tracing selection of criteria to applicable Equipment Catalog MC Definitions.
• Verified units in selected MCs were accurately included in the backlog based on applied replacement criteria.
Replacement Cost
• Interviewed DOE management to obtain an understanding of replacement cost methodology and the percent of MCs using the various methods (i.e., historical data, pre-existing contracts, market research).
• Selected 48 MCs based on qualitative and quantitative factors to determine if replacement costs are supported and accurately calculated.
• Recalculated estimated replacement costs for selected MCs by reviewing recent purchases, work orders necessary to outfit vehicles, and applying DOE’s 4.88 percent inflation rate.
• Compared recalculated costs to estimated costs in Model. • Reviewed significant mandates requiring increased purchases of ZEVs. • Selected two fleet groups with both ZEVs, hybrid, and ICE purchases within
the same year. • Analyzed the cost difference between ZEVs and ICE vehicles and its
impact on DOE’s ability to replace aging vehicles.

28
Determine if Model inputs and outputs are accurate, supported, and in compliance with applicable laws, regulations, guidelines, and policies.
Inflation Rate
• Reviewed the inflation rate methodology used by DOE. • Recalculated DOE’s 4.88 percent inflation rate to determine if rate is
accurate. • Traced amounts in inflation calculation to recent purchases and in-service
costs. • Verified average inflation rate using Caltrans’s stated methodology by
using historical costs and recent costs for 11 selected MCs and an additional 39 MCs selected based on quantitative significance.
• Calculated weighted average inflation rate and compared to Caltrans’s calculated inflation rate.
• Analyzed inflation’s impact on DOE’s ability to replace equipment at existing funding levels.
Model Estimates
• Compared calculated in-service costs for the 379 units placed in service in 2019 and 2020 for which in-service cost data was available with Model estimated costs to determine if estimated costs from the Model were predictive of actual costs.
• Charted variances of actual and estimated in-service costs by quarter and performed trend line analysis to determine estimate accuracy over a two year period.
Determine if the Model aligns with fleet replacement practices of comparable government entities.
Fleet Replacement Best Practices
• Identified government entities with fleet operations comparable to Caltrans.
• Evaluated and characterized the fleet replacement practices of comparable government entities.
• Compared and contrasted the practices of Caltrans and other government entities.
• Identified potential alternatives and/or improvements to Caltrans’s fleet replacement practices.
29
APPENDIX C
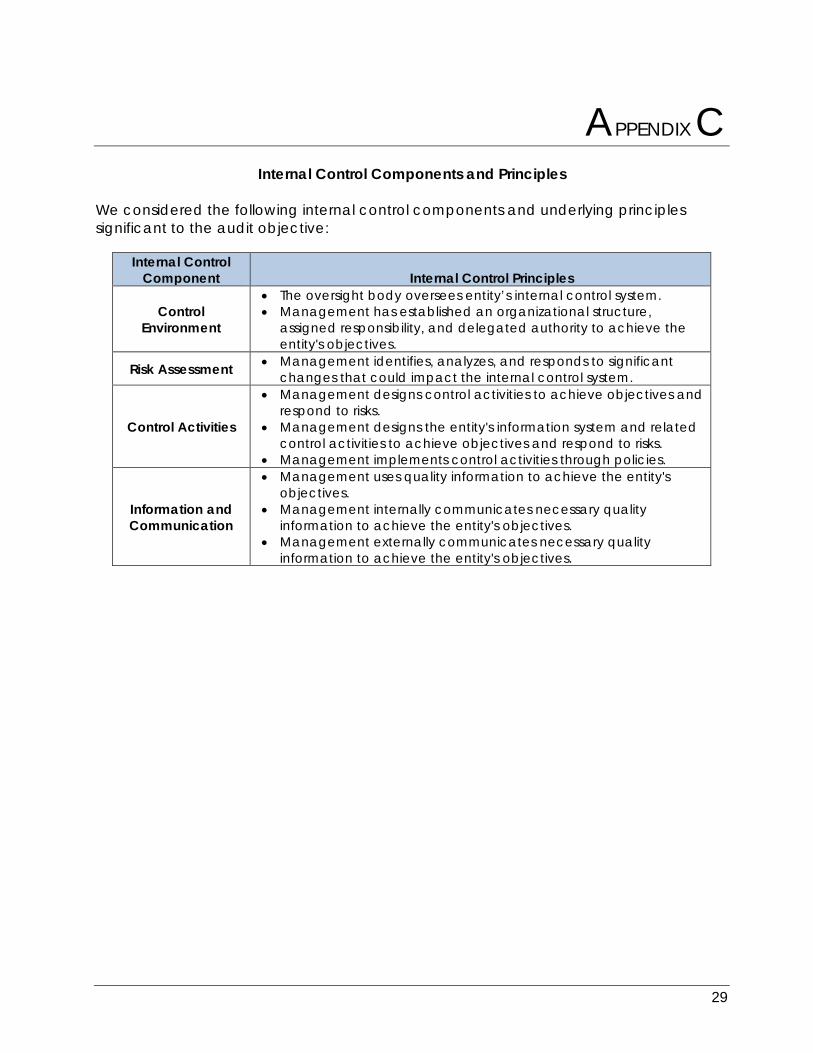
Internal Control Components and Principles We considered the following internal control components and underlying principles significant to the audit objective:
Internal Control Component Internal Control Principles
Control Environment
• The oversight body oversees entity’s internal control system. • Management has established an organizational structure,
assigned responsibility, and delegated authority to achieve the entity's objectives.
Risk Assessment • Management identifies, analyzes, and responds to significant changes that could impact the internal control system.
Control Activities
• Management designs control activities to achieve objectives and respond to risks.
• Management designs the entity's information system and related control activities to achieve objectives and respond to risks.
• Management implements control activities through policies.
Information and Communication
• Management uses quality information to achieve the entity's objectives.
• Management internally communicates necessary quality information to achieve the entity's objectives.
• Management externally communicates necessary quality information to achieve the entity's objectives.
30
RESPONSE
“Provide a safe and reliable transportation network that serves all people and respects the environment”
DIVISION OF EQUIPMENT P.O. BOX 160048, MS–3 | SACRAMENTO, CA 95816 (916) 227-9600 | TTY 711 www.dot.ca.gov September 21, 2021 Ms. Cheryl L. McCormick, CPA Chief, Office of State Audits and Evaluations California Department of Finance 915 L Street, 6th Floor Sacramento, CA 95814 Dear Ms. McCormick: I wish to thank the Department of Finance (DOF), Office of State Audits and Evaluations for your time and effort conducting a thorough investigation into the Caltrans fleet replacement model. The investigation has revealed opportunities for improvements to the tool but has essentially confirmed that the replacement backlog exceeds $840 million. Caltrans agrees with the findings contained in the report and has already begun implementing the recommendations on the three findings. The opportunity to improve the Fleet Sustainability Database (FSD) will certainly make fleet replacement selections more accurate. Caltrans embraces constant improvement to our processes.
Regarding page five of the Confidential Draft Report California Department of Transportation Fleet Replacement Model Performance Audit (Report No: 21-2660-071), specifically the section titled Road Maintenance and Rehabilitation Account:
The Road Repair and Accountability Act of 2017 (SB1) was signed into law on April 28, 2017, and invests an additional $54 billion over 10 years ($5.4 billion per year) to fix roads, freeways, and bridges in communities across California, and focuses on improving transit and safety. These funds are split equally between state and local investments. SB1 created the RMRA for deposit of funds intended to address the projected funding deficit required to adequately maintain the state’s existing transportation network and prevent growth of the fleet replacement backlog. Of the $5.4 billion per year in RMRA funding, approximately $17 million is allocated for Caltrans fleet purchases. Caltrans was allocated RMRA funds beginning in 2019-20.
SB1 will permanently increase the size of Caltrans’s fleet to meet the increased workload. Equipment purchased with RMRA are separately tracked within DOE’s fleet management software, AssetWorks. Currently, fleet replacement decisions are not made based on funding source, but replacement need. All vehicles
Ms. McCormick, Chief, Office of State Audits and Evaluations September 21, 2021 Page 2
“Provide a safe and reliable transportation network that serves all people and respects the environment”
purchased with SHA and RMRA funds will be used to address the same workload. Therefore, RMRA funding has resulted in an overall increase in Caltrans’s fleet and available funding. See Figure 3 for the SHA and RMRA fleet replacement funding.
With the addition of RMRA funding in 2019-20, NEF expenditures increased to an average of $54.7 million over the last two fiscal years. See Figure 4 for total Equipment Service Center Program expenditures by fiscal year from 2017-18 to 2020-21, including both SHA and RMRA funding sources.
The Division of Equipment would like to clarify that the $17 million DOF refers to above is a two-year, limited funding (FY 19/20 and 20/21), used to procure 168 new equipment units. This additional limited $34 million does not address any of the equipment backlog, nor is it a permanent increase to the $40 million annual NEF (New Equipment Fund).
Should you have any additional questions, please contact me via email at <[email protected]>, or by phone at (916) 801-3847.
Sincerely,
ROBERT S. MYERS Chief, Division of Equipment
c: On the following page.
original signed by
Ms. McCormick, Chief, Office of State Audits and Evaluations September 21, 2021 Page 3
“Provide a safe and reliable transportation network that serves all people and respects the environment”
c: Cory Binns, Deputy Director, Maintenance and Operations, California Department of Transportation
J. Kris Teague, Deputy Division Chief, Engineering and Production, Division of Equipment, California Department of Transportation
Michael S. Mayor, Deputy Division Chief, Budgets and Administration, Division of Equipment, California Department of Transportation
Jason D. Cook, Deputy Division Chief, Maintenance and Repair North, Division of Equipment, California Department of Transportation
David W. Roth, Deputy Division Chief, Maintenance and Repair South, Division of Equipment, California Department of Transportation
Jessica Krause, Chief, Office of Resource and Development, Division of Equipment, California Department of Transportation
Jeremy Matsuo, Chief, Office of Fleet Management, Division of Equipment, California Department of Transportation
Ron Frank, Chief, Office of Specifications, Division of Equipment, California Department of Transportation
Jeremy Johnson, Chief, Office of Project Management, Division of Equipment, California Department of Transportation
34
EVALUATION OF RESPONSE Caltrans’s response to the draft audit report has been reviewed and incorporated into the final report. Caltrans agreed with our findings and recommendations and we appreciate its willingness to implement corrective actions. In evaluating Caltrans’s response, Caltrans included a correction to the draft report language. After analysis of the additional information provided, the Background section of the report was modified to more clearly reflect SB1 funding amounts and its status.