california food processing - mergers & acquisitions · packaging & equipment suppliers, ......
TRANSCRIPT
California Food Processing: A Powerhouse of Value 2010
CALIFORNIA FOOD PROCESSING:
A POWERHOUSE OF VALUE
California Food Processing: A Powerhouse of Value 2010
The California League of Food Processors (CLFP) primarily is
committed to furthering the interests of the food processing industry before the California State Legislature and regulatory
agencies. It also is a key representative for the California food industry at the Federal level. CLFP's purpose is to foster a
favorable environment for the growth and vigor of the industry within the state. In so doing, California processors can
continue to provide consumers safe and wholesome foods produced in an environmentally sound and responsible manner.
Current membership includes the most powerful US food industry brand names and the largest producers of private label
and institutional food products.
For further information, please visit the CLFP website at www.clfp.com
The McLean Group (TMG) is a national, middle market investment bank providing mergers and acquisitions (M&A),
capital formation, market intelligence, business valuation, and exit planning services to middle market businesses.
Headquartered in Washington, DC's technology, communications and government contracting corridor, TMG is among the
largest independent middle market investment banks in the country. The McLean Group has more than 30 offices
nationwide, (including four offices in California) as well as Canada, China and France serving domestic and international
clients with a broad resume of successfully consummated investment banking transactions.
For more information, visit The McLean Group website at www.mcleanllc.com
Ed Yates Chief Executive Officer
California League of Food Processors
1755 Creekside Oaks Drive, S250
Sacramento, CA 95833
Phone: 916-640-8150
Neil Paschall Managing Director
The McLean Group LLC
6806 Fallsbrook Court S1
Granite Bay, CA 95746
Phone: 916-929-0900
Spencer Paschall Investment Banking Analyst
The McLean Group LLC
6806 Fallsbrook Court S1
Granite Bay, CA 95746
Phone: 916-517-6901

California Food Processing: A Powerhouse of Value 2010
Table of Contents Introduction ............................................................................................................................................................. 1
I. Mergers and Acquisitions in the US ............................................................................................................... 1
A. Food Industry M&A .................................................................................................................................... 1
B. Food Processing M&A ................................................................................................................................ 2
C. Fruit & Vegetable Processor M&A ............................................................................................................. 3
D. Food Industry M&A Trends and Impact ..................................................................................................... 4
E. Guideline Public Company Comparables ................................................................................................... 5
F. US Food Industry M&A Conclusion .......................................................................................................... 7
II. California Fruit & Vegetable Food Processing .............................................................................................. 7
III. California Food/Fruit & Vegetable Values .................................................................................................... 9
IV. California Fruit & Vegetable Manufacturing Process Flow ........................................................................ 11
V. California Fruit & Vegetable Manufacturing Employment ........................................................................ 13
VI. California Commodities Production and Value ........................................................................................... 14
VII. California Agricultural Exports ................................................................................................................... 16
VIII. Conclusion ................................................................................................................................................... 17
IX. References ................................................................................................................................................... 18

California Food Processing: A Powerhouse of Value 2010
Introduction
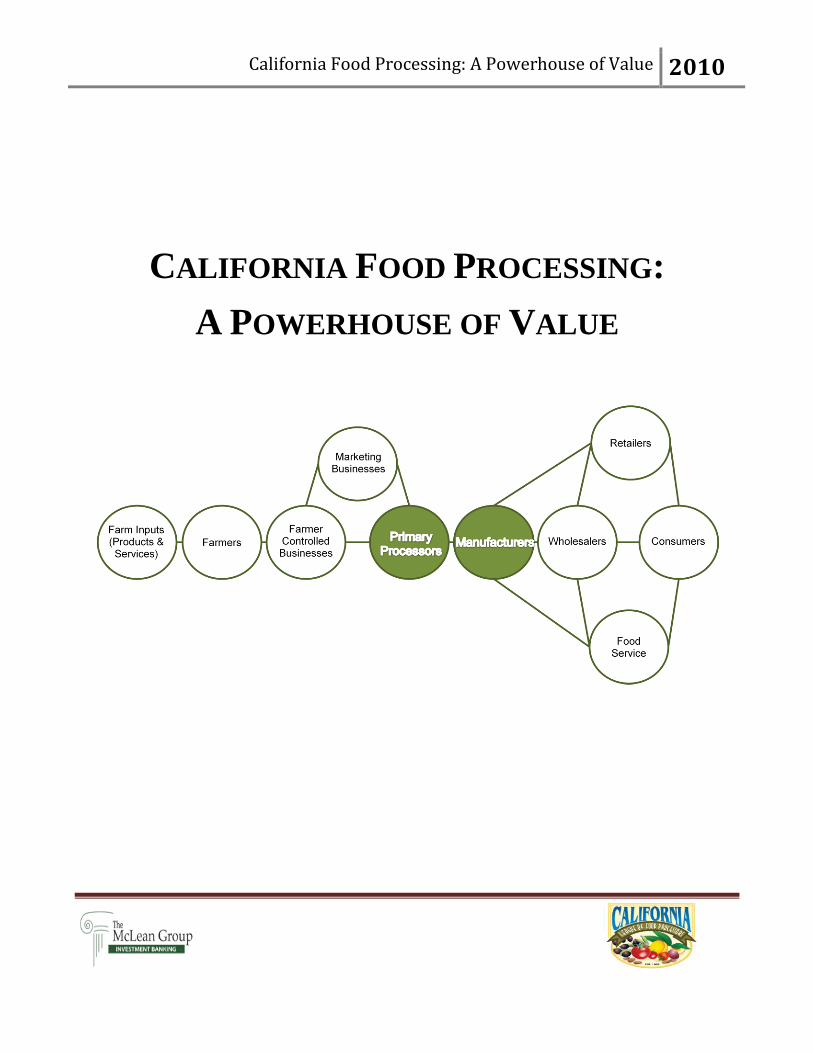
This report will address California‟s fruit and vegetable food processing industry, a Food Industry subsector that
historically has driven towards greater and greater efficiency while continuously increasing the economic value
realized over the past decade and reducing the relative labor component required. Increased per capita
productivity reflects significant investments in machinery, technology and proactive coordination with growers.
M&A activity has generated increased efficiencies as well. The US Department of Agriculture recently
conducted a study of M&A activity‟s effect on efficiency and the creation of synergies in food manufacturing
companies and concluded:
“This study used plant-level data consisting of all plants surveyed in the
Census of Manufacturers to examine whether mergers and acquisitions in
food manufacturing were efficient and, if so, whether the resulting combinations
yielded synergies. We evaluated labor productivity, a measure of efficiency,
before and after M&As over two merger periods and found that
acquired plants were highly productive before their mergers and became
more productive afterward. These results lead us to conclude that since
labor productivity grew, M&As were efficient, and, since acquired plants
had high labor productivity before their mergers, M&As yielded synergies.”17
We will profile the Fruit & Vegetable Food Processing subsector in California as a component of the larger food
sector and as a component of the total Food Processing industry in California, and we begin with a look at
Mergers & Acquisitions within the entire US Food Industry sector.
I. Mergers and Acquisitions in the US
A. Food Industry M&A
Closed US Food Industry M&A activity declined 43.9% from 378 transactions in 2008 to 214 transactions in
2009.16
In the wake of the 2008 recession, a severe constriction in available capital significantly impacted M&A
activity as private equity groups (PEGs) moved to the sidelines and strategic players became the dominant force
in those M&A transactions that did close. In 2007, PEGs accounted for 96 out of 413 closed M&A transactions.
In 2008 and 2009, respectively, PEGs accounted for 48 out of 378 transactions and 38 of 214 deals.
From 1997 to 2008, the US Food Industry as a whole generated an average of 508 M&A transactions annually
(the 813 M&A closed in 1998 and 323 deals completed in 2005 reflected M&A activities‟ peak and trough for
the period).19

California Food Processing: A Powerhouse of Value 2010
2
B. Food Processing M&A
Closed Food Processing Industry M&A transactions accounted for 50 of 214 Food Industry deals in 2009 or
23.4%.16
private equity groups accounted for 16.8% of closed M&A transactions while retailers accounted for
13.6% and restaurants & foodservice generated 12.6%. Food Processing subsector M&A closed deals averaged
144 annually from 1997 to 2008, with 230 deals completed in 1998 (peak) and 94 deals closed in 2005
(trough).19
0
100
200
300
400
500
600
700
800
Food & Food Processing Acquisitions Completed
Total Food Business Industry
Food Processing Sub-Sector
Closed US Food Industry M&A in the
US declined 43.9% from 378 in 2008 to
214 in 2009.16
From 1997 to 2008, M&A transactions
in the US Food Industry averaged 508
annually, with a high of 813 deals in
1998.19
Source: The Food Institute

California Food Processing: A Powerhouse of Value 2010
3
C. Fruit & Vegetable Processor M&A
Fruit & Vegetable Processors accounted for 8% of the Food Processing M&A transactions completed in 2009,
with 4 deals out of the 50.16
Multi-Product Food Processors generated 12 of those 50 deals, or 24%, followed by
Dairy with 7 deals (14%) and Brewers, Distillers and Wineries with 6 deals (12%).
Food Processors, 23.4%
Private Equity Groups,
16.8%
Packaging & Equipment
Suppliers, 3.7%
Raw Product & Ingredient
Suppliers, 5.6%
Restaurants &
Foodservice, 12.6%
Retailers, 13.6%
Soft Drink Bottlers &
Manufacturers, 7.5%
Wholesalers &
Distributors, 7.5%
Unclassified, 2.3%
Consultants/Other
Services, 4.2% Diversified Firms, 1.9%
Food Processing Industry M&A 2009 (214 Deals)
Multi-Product, 24.0%
Meat, 6.0%
Poultry, 4.0%
Fruit & Vegetable, 8.0%
Dairy, 14.0%Confectioners, 6.0%
Bakers, 8.0%
Other Processors, 8.0%
Brewers, Distillers,
Wineries, 12.0%
Snack Food, 4.0%Seafood, 6.0%
Food Processing M&A 2009 (50 Deals)
Source: The Food Institute
Source: The Food Institute

California Food Processing: A Powerhouse of Value 2010
4
In 2009, Fruit & Vegetable Processors closed the fewest M&A deals of the entire decade. Only one California
Fruit & Vegetable processor was involved in one of the 4 M&A deals completed in the Fruit & Vegetable
Processor sub-sector in 2009. Driscoll‟s Strawberry Associates of Watsonville, CA increased its investment and
shareholdings of Driscoll‟s of Santiago, Chile. From 1999 to 2008, M&A activity in the Fruit & Vegetable
sector averaged 18 deals annually, with 33 deals closed in 2001 (peak) and 7 deals closed in 2005 and 2006
(trough).19
D. Food Industry M&A Trends and Impact
Despite the decline in Food Industry M&A activity in the past 10 years, a consolidation trend has arisen in the
industry. The US organic food processing sector‟s rapid growth and high profit margins have caught the
attention of most of the largest food processing and branding companies. The 2002 implementation of the US
national organic standard replaced a patchwork of differing state and regional organic standards, thus facilitating
increased involvement by larger firms. The largest US Food Industry companies employ two methods of entry
to the organic market: horizontal integration (buying and merging organic processors) or concentric
diversification (internal introductions of organic brands). By 2007, one half of the North American food
processing industry‟s 30 largest firms had acquired organic brands within the past decade. 18
0
50
100
150
200
250
Food Business M&A
Food Processing
Fruit & Vegetable Processors
Source: The Food Institute

California Food Processing: A Powerhouse of Value 2010
5
Food Manufacturing
Company
Number of Organic
Companies Acquired
(1997-2007)
Cargill 22
Heinz 20
Kellogg 4
Dean 4
JM Smucker 3
Swift & Co. 3
Danone 2
General Mills 2
ConAgra 2
Kraft 2
M&M Mars 1
Cadbury 1
Hershey Foods 1
Nestle 1
Coca-Cola 1
Pepsi 1
Food Industry and, in particular, Food Processing subsector M&A have a significant impact on the production
and market of their products. When larger firms with massive multi-national production and distribution chains
begin acquiring food processing companies that produce such specialized products as organic foods, they
maximize the availability of such foods market-wide by introducing the specialized food to national and global
markets where people otherwise would have had little access to them. Buyouts of organic or specialty brands by
transnational corporations also tend to lower prices of the specialized products while increasing the amount of
farmland converted to organic or specialized production.
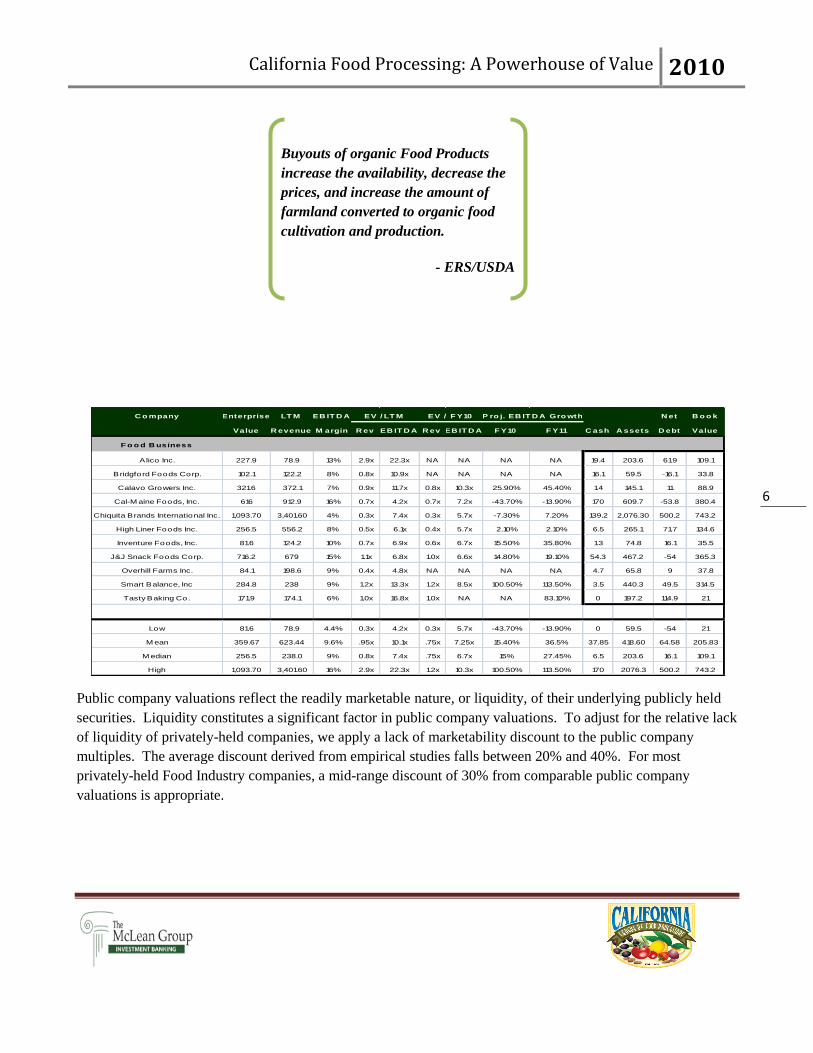
E. Public Company Comparables
Evaluating a private business based on valuations of similar public companies can provide useful market
multiples that in turn are used to generate a market value of a private business. We chose the following public
companies that were representative of the broad range of businesses operating in the Food Industry to establish
our comparables. These public companies also have a comparable size to the middle market in which our firm
specializes. The following chart presents select Food Industry public companies‟ size, leverage, liquidity,
profitability and growth to establish Revenue and EBITDA multiples that can be used to calculate potential
ranges of value for private Food Industry firms.
Source: Organic Food Processing Studies
California Food Processing: A Powerhouse of Value 2010
6
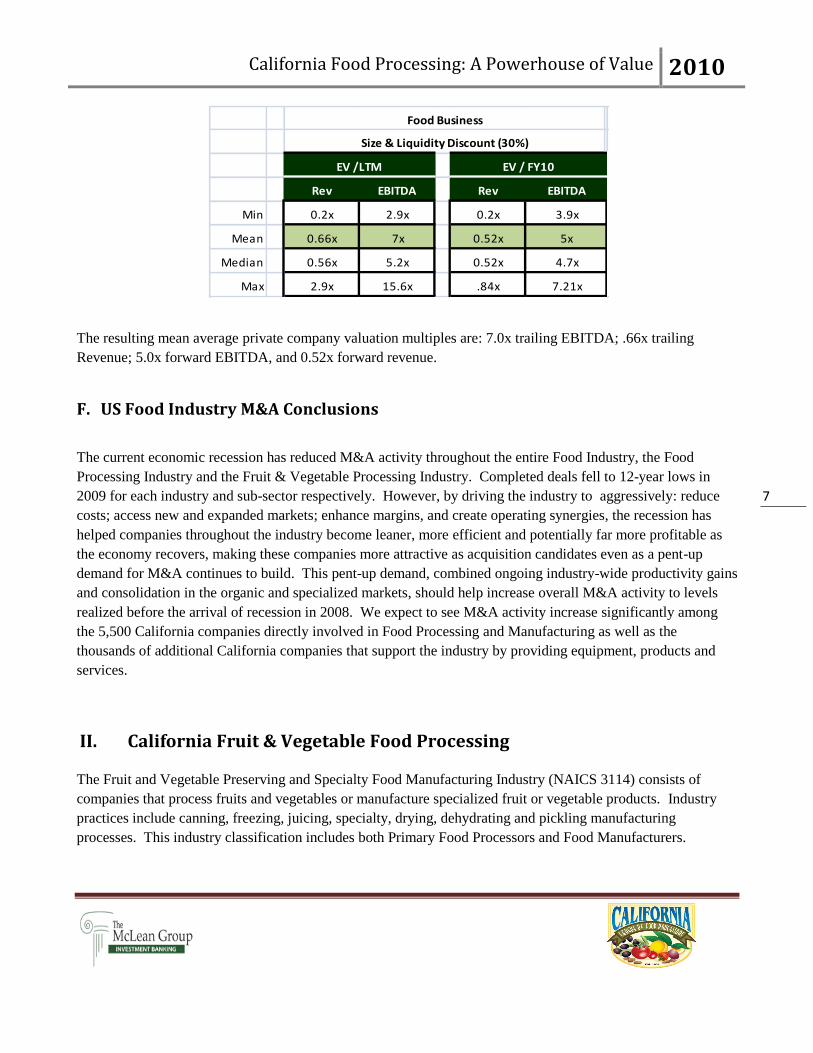
Public company valuations reflect the readily marketable nature, or liquidity, of their underlying publicly held
securities. Liquidity constitutes a significant factor in public company valuations. To adjust for the relative lack
of liquidity of privately-held companies, we apply a lack of marketability discount to the public company
multiples. The average discount derived from empirical studies falls between 20% and 40%. For most
privately-held Food Industry companies, a mid-range discount of 30% from comparable public company
valuations is appropriate.
C o mpany Enterprise LT M EB IT D A N et B o o k
Value R evenue M argin R ev EB IT D A R ev EB IT D A F Y10 F Y11 D ebt Value
F o o d B usiness
Alico Inc. 227.9 78.9 13% 2.9x 22.3x NA NA NA NA 19.4 203.6 61.9 109.1
Bridgford Foods Corp. 102.1 122.2 8% 0.8x 10.9x NA NA NA NA 16.1 59.5 -16.1 33.8
Calavo Growers Inc. 321.6 372.1 7% 0.9x 11.7x 0.8x 10.3x 25.90% 45.40% 1.4 145.1 11 88.9
Cal-M aine Foods, Inc. 616 912.9 16% 0.7x 4.2x 0.7x 7.2x -43.70% -13.90% 170 609.7 -53.8 380.4
Chiquita Brands International Inc. 1,093.70 3,401.60 4% 0.3x 7.4x 0.3x 5.7x -7.30% 7.20% 139.2 2,076.30 500.2 743.2
High Liner Foods Inc. 256.5 556.2 8% 0.5x 6.1x 0.4x 5.7x 2.10% 2.10% 6.5 265.1 71.7 134.6
Inventure Foods, Inc. 81.6 124.2 10% 0.7x 6.9x 0.6x 6.7x 15.50% 35.80% 1.3 74.8 16.1 35.5
J&J Snack Foods Corp. 716.2 679 15% 1.1x 6.8x 1.0x 6.6x 14.80% 19.10% 54.3 467.2 -54 365.3
Overhill Farms Inc. 84.1 198.6 9% 0.4x 4.8x NA NA NA NA 4.7 65.8 9 37.8
Smart Balance, Inc 284.8 238 9% 1.2x 13.3x 1.2x 8.5x 100.50% 113.50% 3.5 440.3 49.5 314.5
Tasty Baking Co. 171.9 174.1 6% 1.0x 16.8x 1.0x NA NA 83.10% 0 197.2 114.9 21
Low 81.6 78.9 4.4% 0.3x 4.2x 0.3x 5.7x -43.70% -13.90% 0 59.5 -54 21
M ean 359.67 623.44 9.6% .95x 10.1x .75x 7.25x 15.40% 36.5% 37.85 418.60 64.58 205.83
M edian 256.5 238.0 9% 0.8x 7.4x .75x 6.7x 15% 27.45% 6.5 203.6 16.1 109.1
High 1,093.70 3,401.60 16% 2.9x 22.3x 1.2x 10.3x 100.50% 113.50% 170 2076.3 500.2 743.2
EV / LT M EV / F Y10 P ro j. EB IT D A Gro wth
C ash A ssets
Buyouts of organic Food Products
increase the availability, decrease the
prices, and increase the amount of
farmland converted to organic food
cultivation and production.
- ERS/USDA
California Food Processing: A Powerhouse of Value 2010
7
The resulting mean average private company valuation multiples are: 7.0x trailing EBITDA; .66x trailing
Revenue; 5.0x forward EBITDA, and 0.52x forward revenue.
F. US Food Industry M&A Conclusions
The current economic recession has reduced M&A activity throughout the entire Food Industry, the Food
Processing Industry and the Fruit & Vegetable Processing Industry. Completed deals fell to 12-year lows in
2009 for each industry and sub-sector respectively. However, by driving the industry to aggressively: reduce
costs; access new and expanded markets; enhance margins, and create operating synergies, the recession has
helped companies throughout the industry become leaner, more efficient and potentially far more profitable as
the economy recovers, making these companies more attractive as acquisition candidates even as a pent-up
demand for M&A continues to build. This pent-up demand, combined ongoing industry-wide productivity gains
and consolidation in the organic and specialized markets, should help increase overall M&A activity to levels
realized before the arrival of recession in 2008. We expect to see M&A activity increase significantly among
the 5,500 California companies directly involved in Food Processing and Manufacturing as well as the
thousands of additional California companies that support the industry by providing equipment, products and
services.
II. California Fruit & Vegetable Food Processing
The Fruit and Vegetable Preserving and Specialty Food Manufacturing Industry (NAICS 3114) consists of
companies that process fruits and vegetables or manufacture specialized fruit or vegetable products. Industry
practices include canning, freezing, juicing, specialty, drying, dehydrating and pickling manufacturing
processes. This industry classification includes both Primary Food Processors and Food Manufacturers.
Rev EBITDA Rev
Min 0.2x 2.9x 0.2x
Mean 0.66x 7x 0.52x
Median 0.56x 5.2x 0.52x
Max 2.9x 15.6x .84x
5x
4.7x
7.21x
Food Business
Size & Liquidity Discount (30%)
EV /LTM EV / FY10
EBITDA
3.9x
California Food Processing: A Powerhouse of Value 2010
8
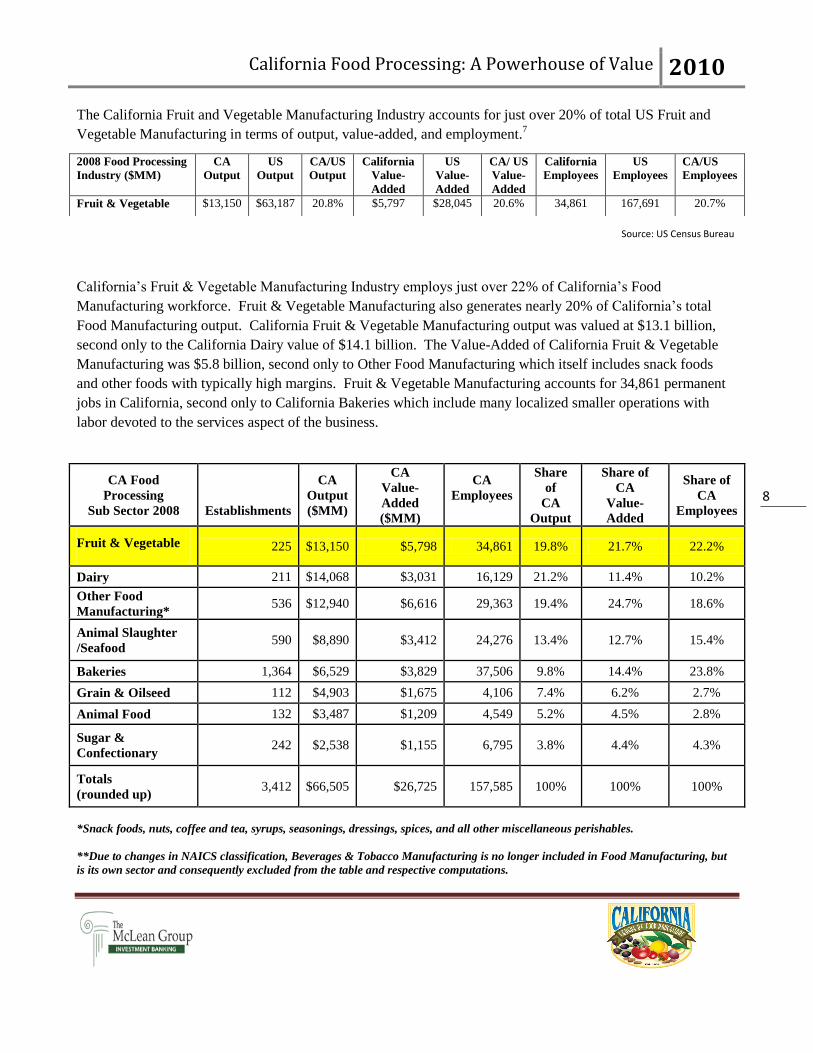
The California Fruit and Vegetable Manufacturing Industry accounts for just over 20% of total US Fruit and
Vegetable Manufacturing in terms of output, value-added, and employment.7
California‟s Fruit & Vegetable Manufacturing Industry employs just over 22% of California‟s Food
Manufacturing workforce. Fruit & Vegetable Manufacturing also generates nearly 20% of California‟s total
Food Manufacturing output. California Fruit & Vegetable Manufacturing output was valued at $13.1 billion,
second only to the California Dairy value of $14.1 billion. The Value-Added of California Fruit & Vegetable
Manufacturing was $5.8 billion, second only to Other Food Manufacturing which itself includes snack foods
and other foods with typically high margins. Fruit & Vegetable Manufacturing accounts for 34,861 permanent
jobs in California, second only to California Bakeries which include many localized smaller operations with
labor devoted to the services aspect of the business.
CA Food
Processing
Sub Sector 2008
Establishments
CA
Output
($MM)
CA
Value-
Added
($MM)
CA
Employees
Share
of
CA
Output
Share of
CA
Value-
Added
Share of
CA
Employees
Fruit & Vegetable
225 $13,150 $5,798 34,861 19.8% 21.7% 22.2%
Dairy 211 $14,068 $3,031 16,129 21.2% 11.4% 10.2%
Other Food
Manufacturing* 536 $12,940 $6,616 29,363 19.4% 24.7% 18.6%
Animal Slaughter
/Seafood 590 $8,890 $3,412 24,276 13.4% 12.7% 15.4%
Bakeries 1,364 $6,529 $3,829 37,506 9.8% 14.4% 23.8%
Grain & Oilseed 112 $4,903 $1,675 4,106 7.4% 6.2% 2.7%
Animal Food 132 $3,487 $1,209 4,549 5.2% 4.5% 2.8%
Sugar &
Confectionary 242 $2,538 $1,155 6,795 3.8% 4.4% 4.3%
Totals
(rounded up) 3,412 $66,505 $26,725 157,585 100% 100% 100%
*Snack foods, nuts, coffee and tea, syrups, seasonings, dressings, spices, and all other miscellaneous perishables.
**Due to changes in NAICS classification, Beverages & Tobacco Manufacturing is no longer included in Food Manufacturing, but
is its own sector and consequently excluded from the table and respective computations.
2008 Food Processing
Industry ($MM)
CA
Output
US
Output
CA/US
Output
California
Value-
Added
US
Value-
Added
CA/ US
Value-
Added
California
Employees
US
Employees
CA/US
Employees
Fruit & Vegetable $13,150 $63,187 20.8% $5,797 $28,045 20.6% 34,861 167,691 20.7%
Source: US Census Bureau

California Food Processing: A Powerhouse of Value 2010
9
III. California Food/Fruit & Vegetable Values
From 1997 through 2004, the annual total value produced by the California Fruit and Vegetable Manufacturing
industry remained relatively flat from 1997 to 2004 compared to the 11-year growth trend of 40.3 % (1997-
2008), moving from $9.3 billion to $9.7 billion respectively. However, an increase in international demand
coupled with favorable California farming conditions, increased manufacturing output capacity, and higher final
product prices have pushed the yearly Total Value upwards since 2004, to $13.1 billion in 2008.7
Value-Added is the difference between the manufacturer‟s total processing costs (inputs, labor, machinery,
energy) and the total value of their finished products. Value-Added for California Fruit & Vegetable
manufacturers followed the slow growth of total value from 1997 to 2004, moving from $4.4 billion to $4.6
billion respectively. Value-Added also followed the increased upward trend of Total Value from 2004 up until
2008, when skyrocketing energy and commodity (raw food) costs caused the Value-Added to decrease while
Total Value continued to increase.7
0
2
4
6
8
10
12
14
Va
lue
($
B)
California Fruit & Vegetable Manufacturing
Total Value Value-Added
Source: US Census Bureau

California Food Processing: A Powerhouse of Value 2010
10
By comparison, the Total Value of all California Food Manufacturing (NAICS 311) has been growing at a more
accelerated pace for the past eleven years. From 1997 to 2008, the Total Value of California Food
Manufacturing had a growth rate of 68.2% with an average annual growth rate of 6.2%, growing from $39.5
billion in 1997 to $66.5 billion in 2008.7 However, the growth rate from 2003 to 2008 increased to 7.8% per
year. While international demand has helped increase the growth rate recently, most of the increase is due to the
higher prices received for Food Manufacturing products.
The Total Value-Added of all California Food Manufacturing has increased steadily over the past eleven years
with minor but consistent growth. The Value-Added of all Food Manufacturing in California grew from $16.6
billion in 1997 to $ 26.7 billion in 2008, a 60.6 % increase.7
Rising energy and raw food commodity input costs
have outpaced the increase in demand and the value of the products produced, especially from 2006 to 2008.
15
25
35
45
55
65
75
Va
lue
($B
)
California Food Manufacturing
Total Value Value-Added
Source: US Census Bureau
Total Value for California Fruit
and Vegetable Manufacturing has
grown 40.3 % from 1997 to 2008
while Total Value for California
Food Manufacturing grew 68.2 %.
- Annual Survey of
Manufacturers
Increasing energy costs, which have a
compounding effect, have eroded
Value Added in Food Manufacturing,
especially for California Fruit &
Vegetable Processors.
-Bureau of Economic
Analysis

California Food Processing: A Powerhouse of Value 2010
11
Energy costs have increased across the board for the Food Industry. Natural gas, electricity, and fuel have
directly affected the processors and manufacturers as well as the growers; which in turn increases the costs of
raw food inputs for processors and manufacturers. Increased energy costs also raise the price of other products
like glass and plastic containers and transportation, which adds to the compounding effect and further erodes the
Value-Added for Food Processors and Manufacturers. Population increases have offset the decline in domestic
per capita demand for processed fruits and vegetables, creating a kind of stagnant demand. The increase in
Value has come entirely from increasing the prices of the Food Products. In an effort to combat this level
demand, Food Manufacturing Companies have invented new ways to add value to their final products in an
effort to stay competitive while increasing margins for the whole industry.
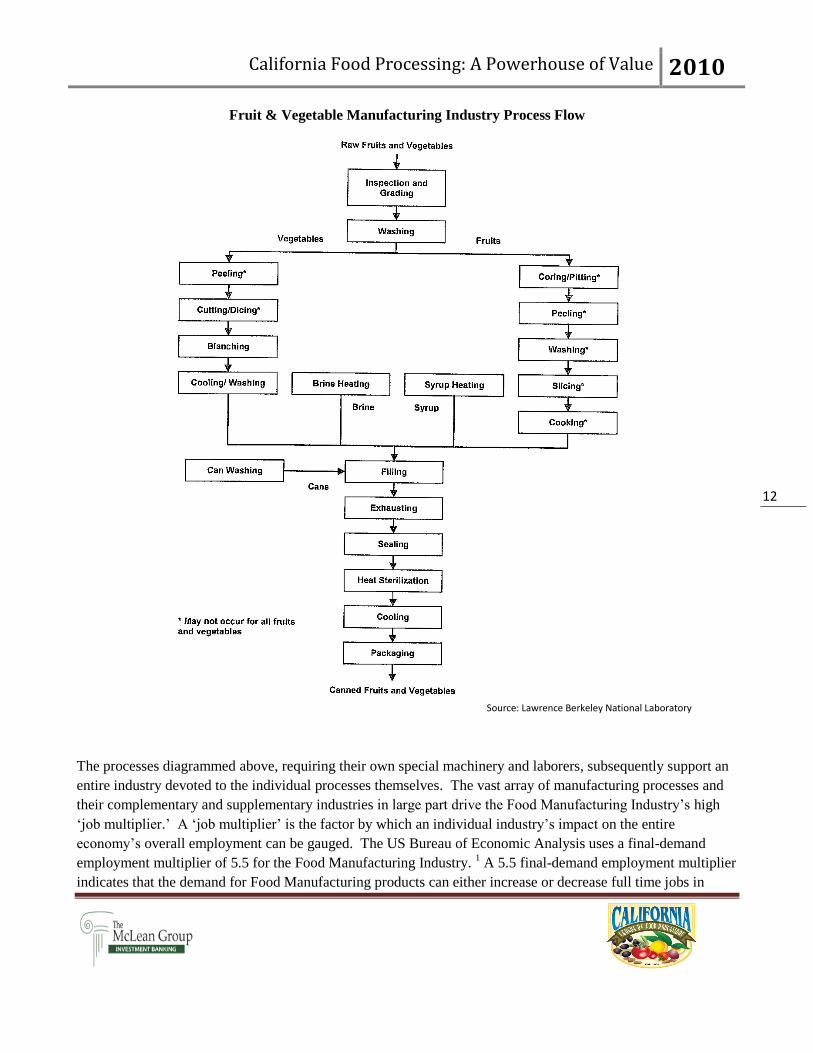
IV. California Fruit & Vegetable Manufacturing Process Flow
The diagram provided on the following page represents the general process flow employed by the Fruit &
Vegetable Manufacturing Industry. While the diagram is not necessarily comprehensive and does not include
all of the processes employed in the processing of all Fruit & Vegetable products manufactured, the diagram is
representative in its presentation of the major process flow steps required to produce most Fruit & Vegetable
Manufacturing products. The process flow diagram highlights various intricacies of the transformation of raw
fruits and vegetables into the various products brought to market by the industry. The diagram provided focuses
on canning as the end result because the Fruit & Vegetable Manufacturing industry‟s canning sub-sector
(NAICS 311421) is the industry‟s largest economic contributor by a significant margin, accounting for nearly
half of total industry value.12
California Food Processing: A Powerhouse of Value 2010
12
Fruit & Vegetable Manufacturing Industry Process Flow
The processes diagrammed above, requiring their own special machinery and laborers, subsequently support an
entire industry devoted to the individual processes themselves. The vast array of manufacturing processes and
their complementary and supplementary industries in large part drive the Food Manufacturing Industry‟s high
„job multiplier.‟ A „job multiplier‟ is the factor by which an individual industry‟s impact on the entire
economy‟s overall employment can be gauged. The US Bureau of Economic Analysis uses a final-demand
employment multiplier of 5.5 for the Food Manufacturing Industry. 1 A 5.5 final-demand employment multiplier
indicates that the demand for Food Manufacturing products can either increase or decrease full time jobs in
Source: Lawrence Berkeley National Laboratory

California Food Processing: A Powerhouse of Value 2010
13
California and US regional economies by 5.5 for every incremental $1 million change in output demand. By
way of comparison, the farming and agricultural industry, construction industry and motor vehicles and
equipment industry respectively boast job multipliers of 2.1, 2.3 and 1.8. 13
V. California Fruit & Vegetable Manufacturing Employment
California‟s permanent Fruit & Vegetable Processing subsector manufacturing jobs have declined over the
course of the last 11 years. Increases in Fruit & Vegetable manufacturing output have reflected employees‟
greater per capita productivity and increased mechanization of production capacity arising from significant
investments in harvesting and processing technologies combined with increased coordination with growers.
Efficiencies arising from increased automation have generated steady declines in California Fruit and Vegetable
Processing employment by decreasing the need for manufacturing plant floor employees.5
At the same time, the value of California Fruit & Vegetable Manufacturing output has grown steadily. Fruit &
Vegetable Processors and Manufacturing companies have incorporated cutting edge innovations into their
businesses to diversify Fruit & Vegetable food product offerings beyond traditional offerings while creating
alternative packaging methods for the food products. These methods have helped increase jobs in the respective
supporting industries, as estimated by the BEA final-demand employment multiplier, which helps soften the
coinciding decrease of California Fruit & Vegetable Manufacturing employees.6
28,000
30,000
32,000
34,000
36,000
38,000
40,000
42,000
All
Em
plo
yee
s
CA Fruit & Vegetable Manufacturing Employment
CA Fruit & Vegetable
Manufacturing Employment
Source: US Census Bureau

California Food Processing: A Powerhouse of Value 2010
14
VI. California Commodities Production and Value
California is the nation‟s sole producer (99% or more) of 12 specialty crops, including clingstone peaches, figs,
persimmons, raisins, artichokes, dried plums, olives and pomegranates.4 These specialty crops tend to have
relatively small production volumes in tonnage. California also produces 96% of total US tomato production or
approximately 32% of global tomato production.3 California‟s agricultural abundance includes 400 different
commodities, with the top 10 exceeding $1 billion in value for 2007. Fruit and Vegetable cultivation account
for 9 of the 20 most valuable agricultural commodities produced in California.
It is especially important that Fruit & Vegetable Manufacturing companies locate their operations in close
proximity to geographic regions where their raw food inputs are cultivated. This facilitates easier negotiations
of the growing contracts between growers and processors while also promoting the flow of information sharing
between growers and processors during the season (thereby affording processors better response time in the
event any production adjustments must be made. Fruits and vegetables can be allowed to fully vine ripen before
being harvested when transportation time and distance is small enough to mitigate spoilage. This maximizes the
freshness, quality, and nutritional value of those fruits and vegetables that comprise processed end products and
makes Fruit & Vegetable Manufacturing products more healthy, appetizing and desirable to consumers.
Source: US Census Bureau
8.5
9.5
10.5
11.5
12.5
13.5
To
tal
Ou
tpu
t ($
B)
California Fruit & Vegetable Output
California Fruit &
Vegetable Output

California Food Processing: A Powerhouse of Value 2010
15
Total Processed Production
Food
Commodity
California
Production
(tons)
U.S.
Production
(tons)
Tomatoes
11,822,000
12,305,800
All Peaches
560,000
580,310
Pears
147,500
297,979
Apricots
51,620
53,770
Spinach
67,400
103,692
California Top Commodities (2007 $MM)
1. Milk & Cream $7,328.0
2. Grapes $3,078.0
3. Nursery $3,066.0
4. Lettuce $2,178.0
5. Almonds $2,127.0
6. Cattle & Calves $1,784.0
7. Hay $1,435.0
8. Strawberries $1,339.0
9. Tomatoes $1,242.0
10. Floriculture $1,003.0
12. Chickens $713.0
13. Broccoli $669.0
14. Cotton $599.0
15. Rice $583.0
16. Pistachios $562.0
17. Oranges $518.0
18. Lemons $513.0
19. Carrots $495.0
20. Celery $401.0
Source: CA Dept of Food and Agriculture
California produces about half of
all US-grown fruits, nuts and
vegetables. In 2008, California
produced 16.5 million tons of
processed foods cultivated on
approximately 1.5 million acres of
farmland.
-USDA
Source: CA Dept of Food and Agriculture
California Food Processing: A Powerhouse of Value 2010
16
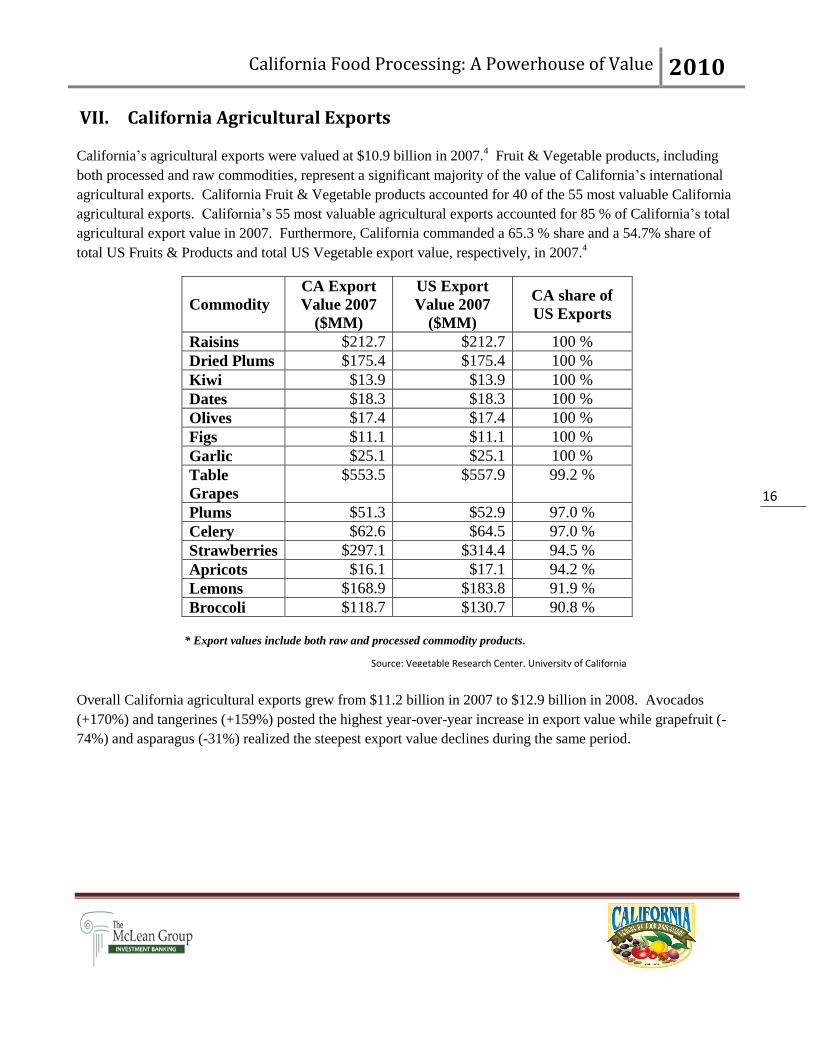
VII. California Agricultural Exports
California‟s agricultural exports were valued at $10.9 billion in 2007.4 Fruit & Vegetable products, including
both processed and raw commodities, represent a significant majority of the value of California‟s international
agricultural exports. California Fruit & Vegetable products accounted for 40 of the 55 most valuable California
agricultural exports. California‟s 55 most valuable agricultural exports accounted for 85 % of California‟s total
agricultural export value in 2007. Furthermore, California commanded a 65.3 % share and a 54.7% share of
total US Fruits & Products and total US Vegetable export value, respectively, in 2007.4
* Export values include both raw and processed commodity products.
Overall California agricultural exports grew from $11.2 billion in 2007 to $12.9 billion in 2008. Avocados
(+170%) and tangerines (+159%) posted the highest year-over-year increase in export value while grapefruit (-
74%) and asparagus (-31%) realized the steepest export value declines during the same period.
Commodity
CA Export
Value 2007
($MM)
US Export
Value 2007
($MM)
CA share of
US Exports
Raisins $212.7 $212.7 100 %
Dried Plums $175.4 $175.4 100 %
Kiwi $13.9 $13.9 100 %
Dates $18.3 $18.3 100 %
Olives $17.4 $17.4 100 %
Figs $11.1 $11.1 100 %
Garlic $25.1 $25.1 100 %
Table
Grapes
$553.5 $557.9 99.2 %
Plums $51.3 $52.9 97.0 %
Celery $62.6 $64.5 97.0 %
Strawberries $297.1 $314.4 94.5 %
Apricots $16.1 $17.1 94.2 %
Lemons $168.9 $183.8 91.9 %
Broccoli $118.7 $130.7 90.8 %
Source: Vegetable Research Center, University of California

California Food Processing: A Powerhouse of Value 2010
17
Food Commodity
2007 Export
Value
($MM)
2008 Export
Value
($MM)
% Change
2007-2008
Avocados $4 $10 +170%
Tangerines/Mandarins $11 $29 +159%
Processed Tomatoes $300 $489 +63%
Oranges $260 $422 +62%
Grape Juice $32 $48 +50%
Fresh Tomatoes $74 $70 -5%
Kiwi $14 $13 -7%
Onions $51 $47 -9%
Asparagus $16 11 -31%
Grapefruit $79 $21 -74%
VIII. Conclusion
Although the Total Value of both California Food Manufacturing and California Fruit & Vegetable Processing
have been increasing steadily, the current economic recession reduced 2009 M&A in both sectors. As the
economy recovers, pent-up M&A demand and consolidation trends involving specialty products should cause
M&A activity to revert to the mean in terms of number of deals. Increasing energy costs impacting the Industry,
compounded by the increasing energy costs experienced by suppliers, have leveled off Value-Added
calculations during a period of stagnant demand and increasing revenues. This in turn has forced Food and Fruit
& Vegetable Processing companies to pursue innovative means to remain marketable while reducing production
costs.
As the Fruit & Vegetable Manufacturing sector realizes the fullest benefits from implementation of machinery
and technology, the decline in the sector‟s permanent personnel employment levels should begin to level off.
The increasing skill requirements arising from broader usage of more efficient technological production
methods likely will create new permanent positions. Innovations in processing, packaging, and product
diversification similarly should increase jobs in these respective areas while possibly increasing future demand
for Fruit & Vegetable products. Increasing demand itself may generate higher prices though production
efficiencies may counter-balance upward price pressures.
Source: CA Dept of Food and Agriculture
California Food Processing: A Powerhouse of Value 2010
18
As US and international markets continue to benefit from the proficiency of California Food Manufacturers,
California businesses will remain highly attractive to US and international Food Manufacturing and Fruit &
Vegetable Manufacturing companies. Given fairly low barriers to entry, favorable growing seasons and
renowned and diverse commodity production, we believe the number of California-based Food Manufacturing
establishments should increase during the coming decade. California Food Manufacturing and Fruit &
Vegetable Processors will remain attractive due to efficiencies implemented in response to the challenging
business climate experienced in recent years. California‟s share of total US and world production for raw food
commodities and processed food products will remain equally significant. The demand for California raw food
commodities and processed food products likely will increase as the population continues to grow and
increasingly health conscious consumers choose to eat healthier foods.
IX. References
1. Bureau of Labor Statistics, US Dept of Labor, Career Guide to Industries 2010, Food Manufacturing
2. The US Food Marketing System: Recent Developments, 97-06, Economic Research Service, USDA
3. Almanac of Tomato Products 2009, The Food Institute
4. California Department of Food and Agriculture, California Agricultural Production Statistics 2009-2010
5. The California Energy Commission, Energy in Agriculture Program
6. Labor Market Information, California Employment Development Department
7. Annual Survey of Manufacturers (ASM), US Census Bureau, 1997-2008
8. 2007 Economic Census, US Census Bureau
9. 2002 Economic Census, US Census Bureau
10. 1997 Economic Census, US Census Bureau
11. The Almanac of Canning, Freezing, Preserving Industries, The Food Institute
12. Energy Efficiency for the Fruit & Vegetable Processing Industry, Lawrence Berkeley National
Laboratory
13. The Bureau of Economic Analysis, US Department of Commerce
14. National Agricultural Statistics Service, Unites States Department of Agriculture
15. Processing Vegetable Production in California, Vegetable Research/Information Center, University of
California
16. Food Industry Mergers & Acquisitions 2009, The Food Institute
17. Food Industry M&A Leads to Higher Labor Productivity, October 06, ERS/USDA
18. Consolidation in the North American Organic Food Processing Sector 97-07, Agriculture Studies at
Michigan State University
California produced 65.3% of
total US Fruit exports and
57.4% of total US Vegetable
exports in 2007.
California Food Processing: A Powerhouse of Value 2010
19
19. Food Industry Mergers & Acquisitions 1997-2008, The Food Institute
20. Capital IQ
©COPYRIGHT 2010 California League of Food Processors and The McLean Group LLC.
Reproduction of the 2010 Food Processing: A California Fruit & Vegetable Profile in any form is
prohibited except with the prior written permission of both California League of Food Processors
(CLFP) and The McLean Group (TMG). CLFP and TMG do not guarantee the accuracy, adequacy,
completeness, or availability of any information and are not responsible for any errors or omissions or
for the results obtained from the use of such information. CLFP and TMG GIVE NO EXPRESS OR
IMPLIED WARRANTIES, INCLUDING, BUT NOT LIMITED TO, ANY WARRANTIES OF
MERCHANTABILITY OR FITNESS FOR A PARTICULAR PURPOSE OR USE. In no event shall
CLFP or TMG be liable for any indirect, special, or consequential damages in connection with any use
of the 2010 Food Processing: A California Fruit & Vegetable Profile.
The McLean Group has exercised reasonable professional care and diligence in the collection,
processing, and reporting of this information. However, the data used is from third-party sources and
TMG has not independently verified, validated, or audited the data. TMG makes no representations or
warranties with respect to the accuracy of the information, nor whether it is suitable for the purposes to
which it is put by users.