california’s experience: air quality successes and challenges bart croes, p.e. chief, air quality...
Post on 19-Dec-2015
216 views
TRANSCRIPT
California’s Experience:Air Quality Successes
and Challenges
Bart Croes, P.E.Chief, Air Quality Data Branch
California Air Resources Board(CARB)
April 11, 2000
Air Resources Board
California Environmental Protection Agency


0
2
4
6
8
10
12
Mic
rogra
ms/
Cubic
Mete
r
0
0.1
0.2
0.3
0.4
0.5
0.6
Part
s Per
Million
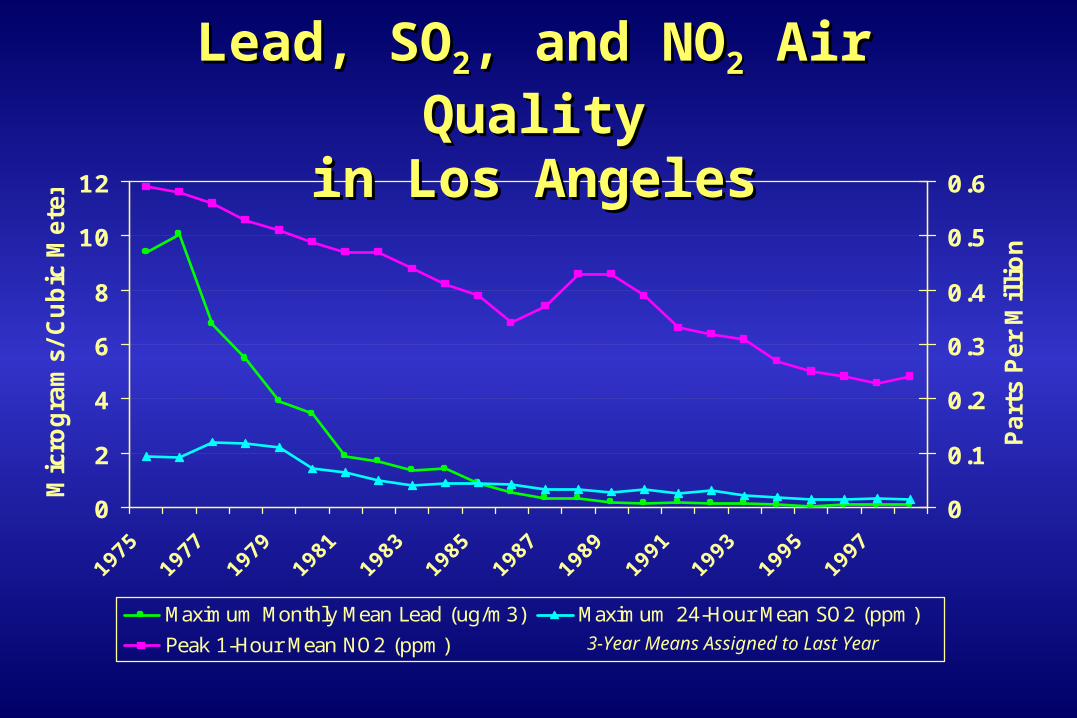
Maximum Monthly Mean Lead (ug/m3) Maximum 24-Hour Mean SO2 (ppm)
Peak 1-Hour Mean NO2 (ppm)
Lead, SOLead, SO22, and NO, and NO22 Air Air QualityQuality
in Los Angelesin Los Angeles
3-Year Means Assigned to Last Year

(PM(PM1010=1988-98, Air Toxics=1991-96, GSP=1980-96)=1988-98, Air Toxics=1991-96, GSP=1980-96)
Change in Air Quality and Change in Air Quality and GrowthGrowth
1980 to 19981980 to 1998
-50 -47 -30
+41 +81 +75
-60
-40
-20
0
20
40
60
80
Perc
ent
Change
Ozone (1-Hour)
PM10(Annual)
Air Toxics(Cancer Risk)
Population Vehicle MilesTraveled
Gross State Product (1996 $)

Los Angeles - NOx Emission TrendsLos Angeles - NOx Emission Trends
0
400
800
1200
1600
1985 1990 1995 2000 2005 2010
Em
issi
on
s (t
on
s p
er d
ay)
Industrial Cars Diesel Trucks Non-Road Mobile
Emissions Goal
Emissions Today

Los Angeles - ROG Emission Los Angeles - ROG Emission TrendsTrends
0
400
800
1200
1600
2000
1985 1990 1995 2000 2005 2010
Em
issi
on
s (t
on
s p
er d
ay)
Industrial Cars Diesel Trucks Non-Road Mobile
Emissions Today
Emissions Goal

CARB Mobile Source and Fuels CARB Mobile Source and Fuels Regulations and ProgramsRegulations and Programs
• New engine emission standards New engine emission standards
• In-use durability requirementsIn-use durability requirements
• Retrofit existing enginesRetrofit existing engines
• Cleaner fuels: gasoline, diesel, natural Cleaner fuels: gasoline, diesel, natural gasgas
• Promote national and international Promote national and international standards for trucks, ships, and aircraftstandards for trucks, ships, and aircraft
• New technologies for the futureNew technologies for the future
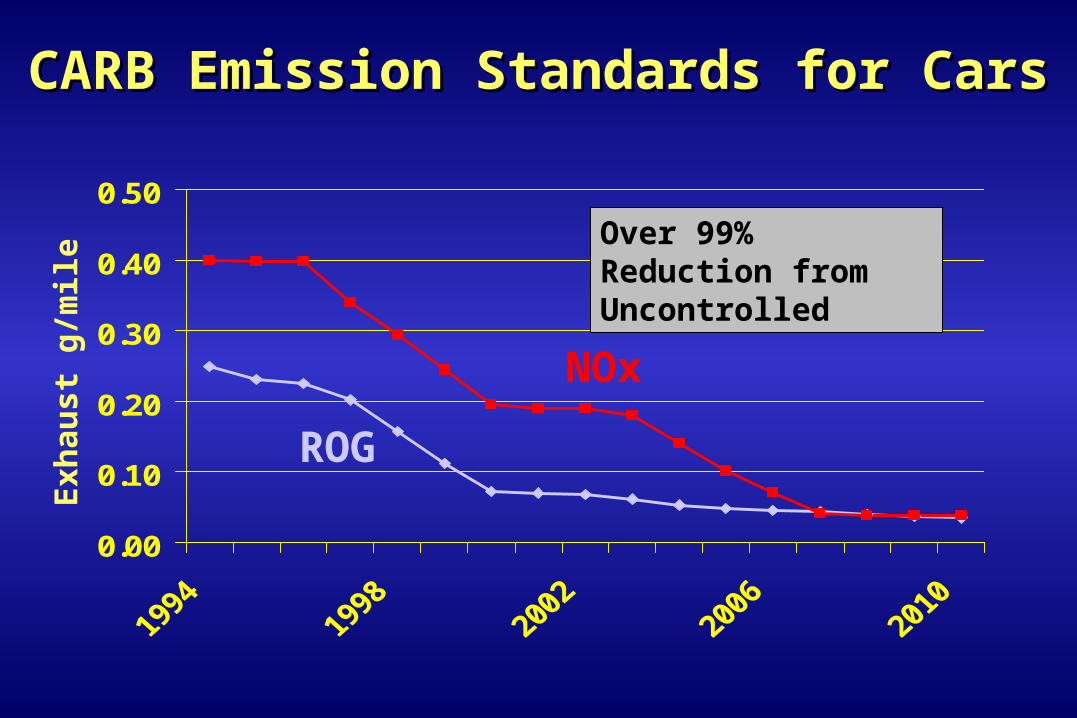
CARB Emission Standards for CarsCARB Emission Standards for Cars
0.00
0.10
0.20
0.30
0.40
0.50
ROG
NOx
Exh
aust
g/m
ile
Over 99% Reduction from Uncontrolled

Battery Electric VehiclesBattery Electric Vehicles

California Fuel Cell California Fuel Cell PartnershipPartnership

CARB NOx Emission Standards for On-Road Trucks
0
2
4
6
8
10
12 g/hp-hr
1990
1991
1998
2004
1985
Possible Future Standards• NOx aftertreatment-based• 75-90% reduction •2007 goal

CARB PM Emission StandardsFor On-Road Trucks
0
0.1
0.2
0.3
0.4
0.5
0.6
0.7 g/hp-hr
1988
1991
1994truck
bus
Possible Future Standards• PM trap-based• ~90% Reduction •2007 goal
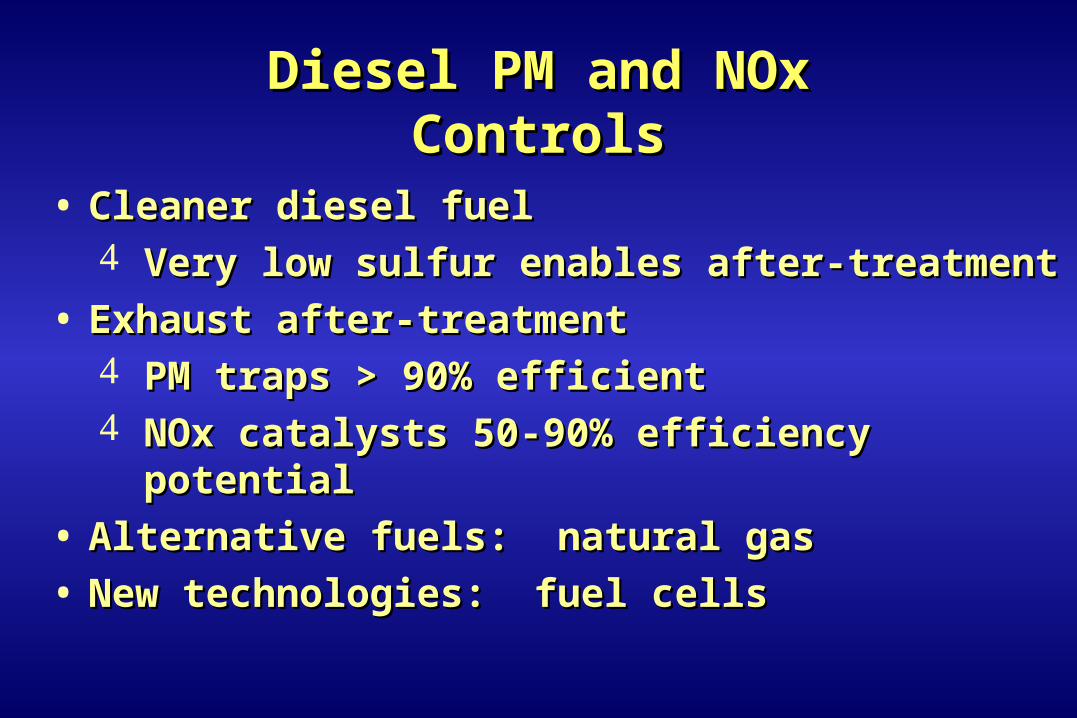
Diesel PM and NOx Diesel PM and NOx ControlsControls
• Cleaner diesel fuelCleaner diesel fuel Very low sulfur enables after-treatment Very low sulfur enables after-treatment
• Exhaust after-treatmentExhaust after-treatment PM traps > 90% efficientPM traps > 90% efficient NOx catalysts 50-90% efficiency NOx catalysts 50-90% efficiency
potentialpotential
• Alternative fuels: natural gasAlternative fuels: natural gas
• New technologies: fuel cellsNew technologies: fuel cells

Cleaner Alternative-Fuel Cleaner Alternative-Fuel TrucksTrucks
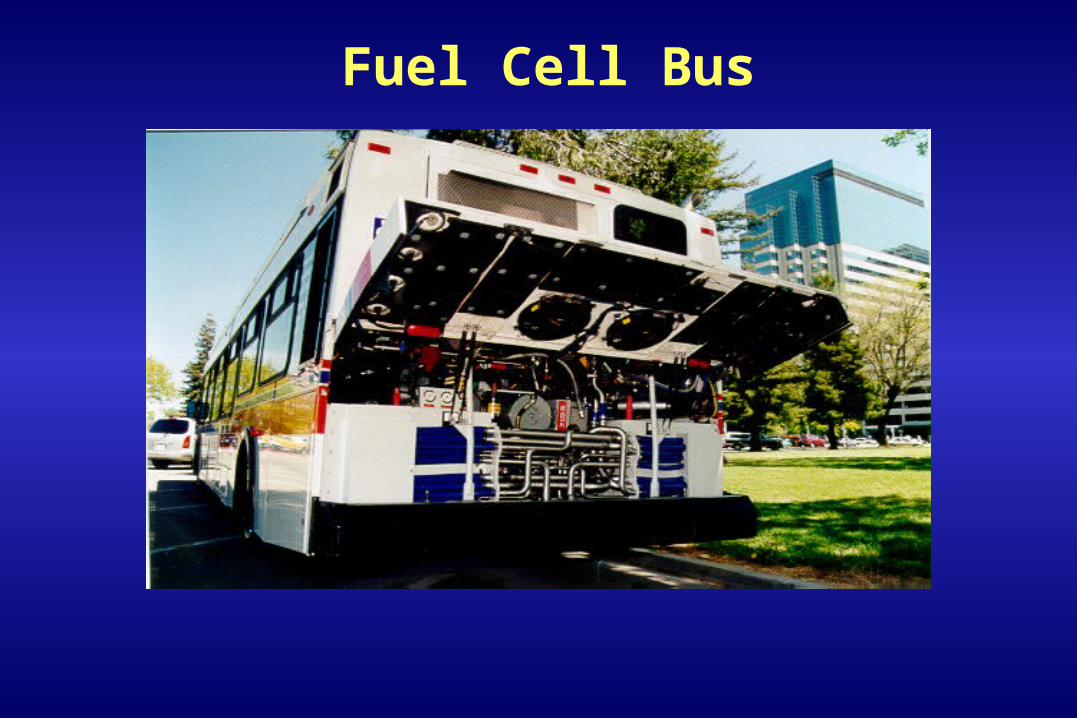
Fuel Cell Bus
CARB Cleaner Fuels ProgramCARB Cleaner Fuels Program
• 1992: Eliminated lead from 1992: Eliminated lead from gasoline, limited vapor pressure, gasoline, limited vapor pressure, required oxygenates in winter to required oxygenates in winter to reduce carbon monoxidereduce carbon monoxide
• 1996: Introduced “cleaner-burning 1996: Introduced “cleaner-burning gasoline” to achieve maximum gasoline” to achieve maximum reductions in ozone and toxicsreductions in ozone and toxics
• 1999: Phase out MTBE by 2002, 1999: Phase out MTBE by 2002, reduce sulfur and benzene furtherreduce sulfur and benzene further
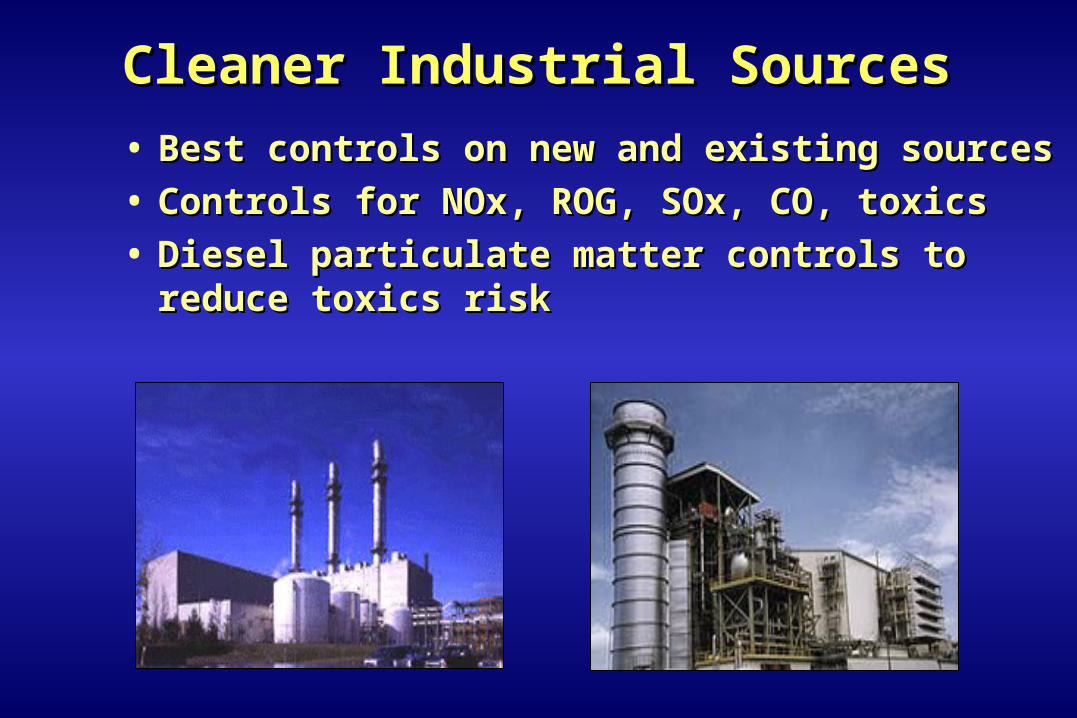
Cleaner Industrial SourcesCleaner Industrial Sources
• Best controls on new and existing Best controls on new and existing sourcessources
• Controls for NOx, ROG, SOx, CO, toxicsControls for NOx, ROG, SOx, CO, toxics
• Diesel particulate matter controls to Diesel particulate matter controls to reduce toxics risk reduce toxics risk

Our Goal Is Clean Air Our Goal Is Clean Air EverydayEveryday

#
#
#
##
#
#
#
#
#
#
#
#
#
#
#
#
#
#
#
#
###
#
#
#
#
#
###
#
#
#
#
#
#
#
#
#
#
#
#
#
### ###### #
###
#
#
#
#
#
#
#
#
#
#
# #
#
#
#
#
#
#
#
#
##
#
#
##
#
#
#
#
#
#
#
#
#
##
#
#
#
#
#
##
#
#
#
#
#
##
#
##
#
#
##
###
###
#
#
##
###
##
###
#
#
#
##
# #
##
##
#
#
#
#
####
#
#
#
#
#
#
##
#
#
#
##
#
##
#
# #
#
#
#
#
#
###
#
#
#
#
#
#
#
#
#
###
#
#
## ###
#
##
#
#
#
#
#
#
#
#
#
#
#
#
#
#
#
# #
#
#
#
#
##
#
#
#
###
#
######
#
#
#
#
##
#
#
#
#
#
#
#
#
##
###
#
#
#
#
#
#
###
#
##
##
#
#
#
##
#
##
#
#
###
#
#
#
#
#
#
#
###
#
#
##
#
## #
#
#
ÊÚ
ÊÚ
ÊÚ
ÊÚ
ÊÚ
ÊÚ
ÊÚ
ÊÚ
ÊÚ
ÊÚ
ÊÚ
ÊÚ
ÊÚÊÚ
ÊÚ
ÊÚ
ÊÚ
ÊÚ
ÊÚÊÚ
ÊÚ
CaliforniaCaliforniaAir Air
MonitoringMonitoringSitesSites

California ROG Emissions With California ROG Emissions With Existing ProgramsExisting Programs
StationarySource
36%
OtherMobile
2%
1990 2010
Gasoline50%
Diesel12%
StationarySource
61%
Other Mobile9%
Gasoline17%
Diesel14%
3630 TPD3630 TPD 2390 TPD2390 TPD
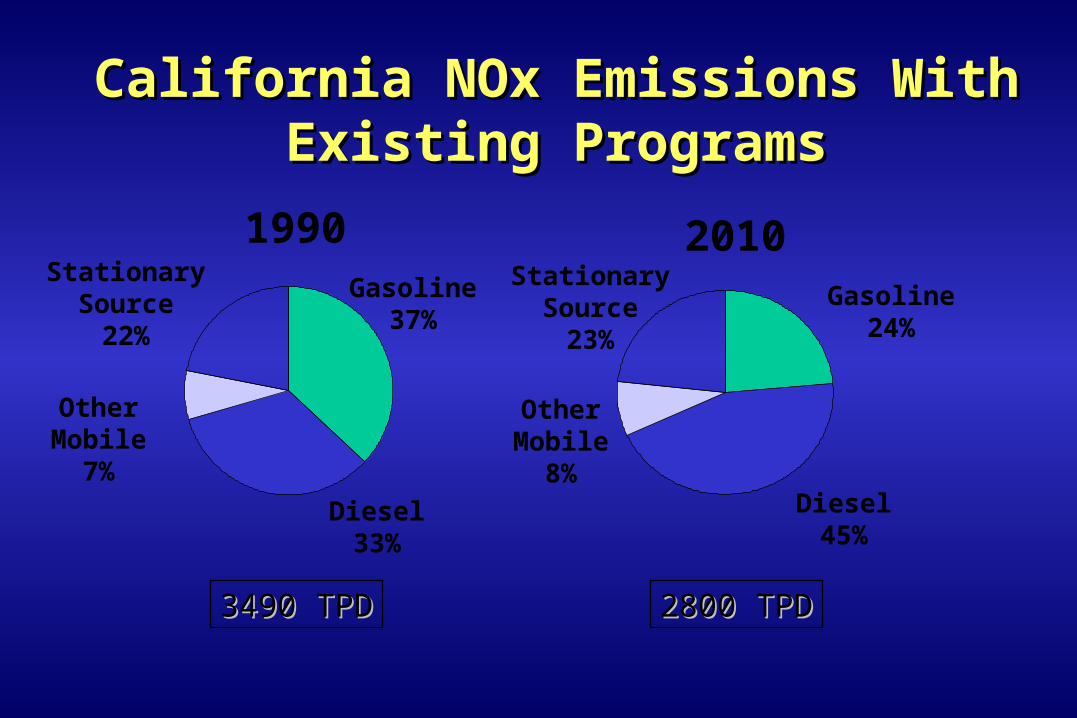
California NOx Emissions With California NOx Emissions With Existing ProgramsExisting Programs
StationarySource
22%
OtherMobile
7%
1990 2010Gasoline
37%
Diesel33%
StationarySource
23%
OtherMobile
8%
Gasoline24%
Diesel45%
3490 TPD3490 TPD 2800 TPD2800 TPD
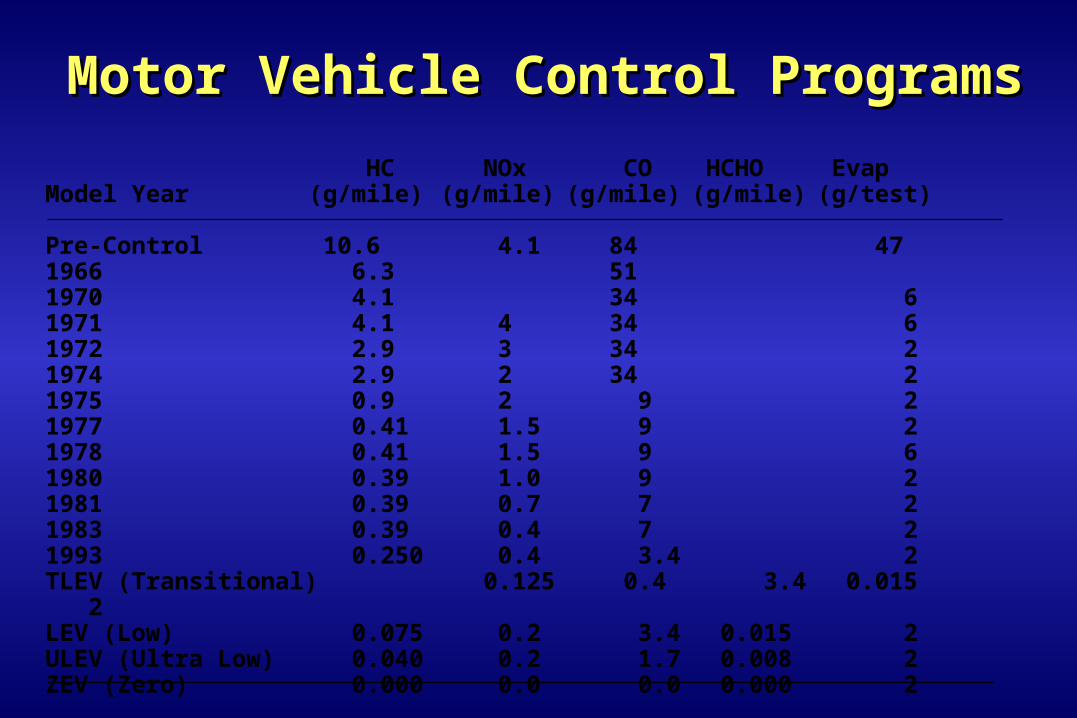
Motor Vehicle Control ProgramsMotor Vehicle Control Programs
HC NOx CO HCHO EvapModel Year (g/mile) (g/mile) (g/mile) (g/mile) (g/test)
Pre-Control 10.6 4.1 84 471966 6.3 511970 4.1 34 61971 4.1 4 34 61972 2.9 3 34 21974 2.9 2 34 21975 0.9 2 9 21977 0.41 1.5 9 21978 0.41 1.5 9 61980 0.39 1.0 9 21981 0.39 0.7 7 21983 0.39 0.4 7 21993 0.250 0.4 3.4 2TLEV (Transitional) 0.125 0.4 3.4 0.015 2LEV (Low) 0.075 0.2 3.4 0.015 2ULEV (Ultra Low) 0.040 0.2 1.7 0.008 2ZEV (Zero) 0.000 0.0 0.0 0.000 2

Motor Vehicle Fuel ProgramsMotor Vehicle Fuel Programs YearAdopted Gasoline Diesel Alternative Fuels
1971 Reid Vapor PressureBromine Number
1975 SulfurManganese/Phosphorus
1976 Lead 1981 Sulfur (SoCAB) 1982 Lead 1988 Sulfur/Arom. HC 1990 Phase 1 Reformulated 1991 Wintertime Oxygenated
Phase 2 Reformulated 1992 Commercial and
Certification Spec. 1994 Phase 2 Predictive Model

Status of California Air Status of California Air QualityQuality
• Attainment (or Close)Attainment (or Close) LeadLead SulfatesSulfates NONO22, carbon monoxide, carbon monoxide
• NonattainmentNonattainment PM (30% reduction PM (30% reduction
achieved)achieved) Ozone (50% reduction)Ozone (50% reduction) Toxics (40-70% reduction)Toxics (40-70% reduction)

Peak 8-Hour CO, Population, andPeak 8-Hour CO, Population, andVehicle Miles Traveled (VMT)Vehicle Miles Traveled (VMT)
- 26%
+39% +78%
-30
-10
10
30
50
70
Perc
ent
Chan
ge 1
980-
1997
Peak 8-Hr CO Population VMT

Peak Ozone, Population, andPeak Ozone, Population, andVehicle Miles Traveled (VMT)Vehicle Miles Traveled (VMT)
- 49%
+39% +78%
-50
-30
-10
10
30
50
70
Perc
ent
Chan
ge 1
980-
1997
Peak Ozone Population VMT
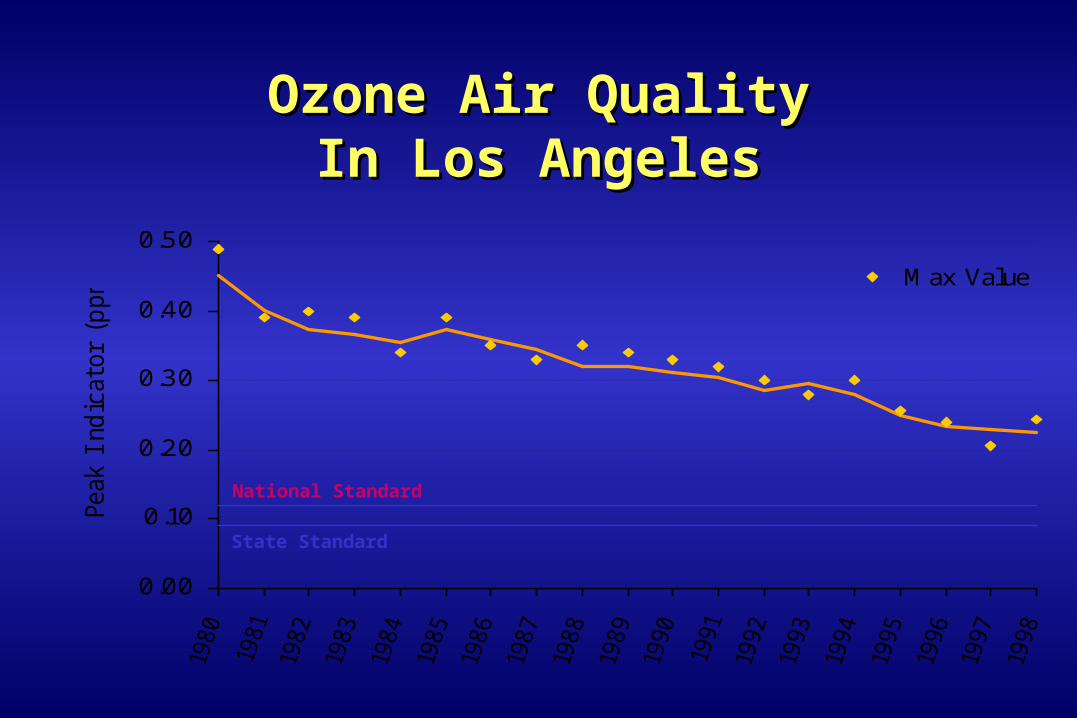
Ozone Air QualityOzone Air QualityIn Los AngelesIn Los Angeles
0.00
0.10
0.20
0.30
0.40
0.50
Peak
Ind
icat
or (
ppm
) Max Value
NationalStandard
State Standard
National Standard

Ozone Exceedance DaysOzone Exceedance DaysIn Los AngelesIn Los Angeles
0
50
100
150
200
250
300
Day
s A
bov
e 1
Hou
r S
tand
ards
State Exceedances
National Exceedances

Ozone Episode DaysOzone Episode DaysIn Los AngelesIn Los Angeles
0
50
100
150
200
250
Stage 2
Stage 1

Ozone ExposureOzone ExposureIn Los AngelesIn Los Angeles
0
5
10
15
ppm
-hrs
Abov
e S
tate
Sta
ndar
d
Year 2000 Goal

Days Above 24-Hr PM10 Standard Days Above 24-Hr PM10 Standard In San FranciscoIn San Francisco
0
25
50
75
100
125
150
Cal
cula
ted D
ays
Abov
e S
tand
ard

Annual Geometric Mean PM10Annual Geometric Mean PM10In San FranciscoIn San Francisco
0
10
20
30
40
50
Ann
ual G
eom
etri
c M
ean
(ug/
m3)
State Standard