california’s public safety realignment: correctional ... · pdf file1 author information...
TRANSCRIPT

CEBC Working Papers are designed to share Center findings and to solicit informal peer review but have not been formally peer reviewed. Unless otherwise indicated, working papers can be quoted and cited without permission of the author, provided the source is clearly referred to as a working paper.
WORKING PAPER
California’s Public Safety Realignment:Correctional Policy Based on Stakes Rather than RiskJulie GerlingerSusan Turner, Ph.D.
Center for Evidence-Based CorrectionsUniversity of California, Irvine
September 2013Revised December 2013

i
CONTENTS
AUTHOR INFORMATION ........................................................................................................................................1ABSTRACT ....................................................................................................................................................................1 Research Summary ................................................................................................................................................1 Policy Implications ................................................................................................................................................1INTRODUCTION.........................................................................................................................................................1 Reduced State Prison Populations as a National Trend ...................................................................................2 California’s Effort to Reduce Its Prison Population ..........................................................................................3 California Realignment.........................................................................................................................................3DATA AND METHOD ................................................................................................................................................4 Study Group Assignment: Proxy-State Parole and Proxy-PRCS ....................................................................4 Measuring Recidivism ...........................................................................................................................................5 Analytic Strategy ....................................................................................................................................................7RESULTS 7 Returns to Prison ..................................................................................................................................................8 New Admissions and Parole Violations with New Terms ...............................................................................8DIFFERENCES BY COUNTY ....................................................................................................................................9DISCUSSION/CONCLUSION ..................................................................................................................................13 Limitations ............................................................................................................................................................ 14POLICY IMPLICATIONS .........................................................................................................................................14 Realignment Experience to Date ....................................................................................................................... 14 A Mixed Message of Philosophies .....................................................................................................................15 Concluding Thoughts ..........................................................................................................................................15REFERENCES..............................................................................................................................................................15
FIGURES
Figure 1. Status of Offenders Returned to Prison within Three Years ...................................................................8
TABLES
Table 1. Study Operationalization: State Parole Group Approximation ...............................................................5Table 2. Descriptive Statistics: Proxy PRCS and Parole Groups .............................................................................6Table 3. Three-Year Recidivism Rates by Proxy Supervision Groups and Current Offense (N=97,133) ..........7Table 4. Return Offense for Violations with New Terms and New Admissions by Proxy-PRCS
and Proxy-State Parole (N=16,511) ......................................................................................................................9Table 5. CSRA Risk Levels by County and Proxy-Parole and Proxy-PRCS ........................................................10

1
AUTHOR INFORMATION
Julie Gerlinger is a doctoral student in the Department of Criminology, Law and Society at the University of California, Irvine. Her research interests include juvenile justice, diversion programs, school victimization, and the disproportionality of school discipline.
Susan Turner is a Professor in the Department of Criminology, Law and Society at the University of California, Irvine. She also serves as Director of the Center for Evidence-Based Corrections, and is an appointee of the President of the University of California to the California Rehabilitation Oversight Board (C-ROB). Dr. Turner’s areas of expertise include the design and implementation of randomized field experiments and research collaborations with state and local justice agencies.
ABSTRACT
Research Summary
This study uses a California Department of Corrections and Rehabilitation 2005-2006 recidivism dataset to simulate recidi-vism patterns of newly realigned state and local supervision groups in California (based on California’s “Public Safety Realign-ment” initiative). The distinction between high- and low-stakes (offense based) offenders is analyzed through arrest and con-viction rates, as well as returns-to-prison. We find that corrections policies based on stakes, as opposed to risk, may produce adverse results regarding public safety.
Policy Implications
The findings from this study suggest that policy makers should consider risk to recidivate before making large changes to sentencing or supervision policies. Most low-stakes offenders are not at low risk to reoffend, and the types of offenses for which released offenders recidivate are not predictable based on current offense. Thus, risk assessment using criminal histories may be necessary to protect the public and produce better recidivism results.
INTRODUCTION
After nearly 40 years of mass incarceration in the United States, many states are facing the economic reality that corrections costs need to be cut. In fiscal year 2011—the latest year for which data are available—corrections spending represented 3.1 percent of total state spending and 7.5 percent of general fund spending (National Association of State Budget Officers, 2012). In 2010, the prison population actually decreased for the first time since 1972, as the number of releases outpaced the number of prison admissions (Guerino, Harrison, and Sabol, 2012). Despite this promising recent trend, many states are grappling with ways to reduce their use of incarceration, both as a way to reduce costs as well as to promote more effective ways of sanc-tioning offenders. During the past several years, states have utilized a variety of methods to bring about prison reductions. States have expanded good time and earned time programs to reduce prison sentences, scaled back the scope of mandatory drug sentences, and reduced probation revocations and returns to prison. States have also shuttered prison facilities, improved access to rehabilitation programs, and expanded offenses eligible for non-prison sentences (Mauer, 2011; Porter, 2010, 2011, 2012; Subramanian and Tublitz, 2012). Some of the most common options focus on the policy levers related to initial sentenc-ing, inmate release and response to supervision violations (Davies and La Vigne, 2011).
In light of recent large state budget deficits, many scholars point to fiscal concerns as the driving force behind the prison popu-lation decline. However, financial pressures alone do not explain the shift. The integration of evidenced-based policies, reentry initiatives, sentencing policy changes, and a general move towards being “smart on crime” are also credited for the declining prison populations (Greene and Mauer, 2010; Mauer, 2011; Porter, 2010; The Pew Center on the States, 2010). Aside from the budgetary crisis, some explanations for the recent criminal justice reforms include the following: changes to the violent crime rate, the failure of the war on drugs, and the recognition that a significant portion of those populating the prisons are nonvio-lent offenders (Cole, 2011). It is also possible that the public majority has reached its limit of tolerating incarceration, or that Americans are more sympathetic towards those behind bars (Cole, 2011), considering the amount of research dedicated to uncovering the collateral consequences of incarceration and how it affects the families and communities of those imprisoned (Hagan and Dinovitzer, 1999; Lynch and Sabol, 2006). As states move toward alternative approaches, it is important to gauge their impact on public safety.
Using California’s recent reform – “Public Safety Realignment” – as a large-scale case study of deincarceration, this paper investigates what we might expect to observe when criminal justice responsibility is shifted from the state level to local juris-dictions for large numbers of “lower level” offenders, based essentially on the severity of their current offense rather than the offender’s risk-to-recidivate. Under Public Safety Realignment, lower level offenders are those convicted of non-violent, non-serious, and non-sexual felonies. For this paper, we consider these offenders as “low-stakes.” They are the types of offenders – primarily drug and property felons – who do not immediately raise public concerns about recidivism or placement on alterna-tives to incarceration (see for example Galeste, Fradella, and Vogel, 2012; Levenson, Brannon, Fortney, and Baker, 2007;

2
Roberts and Stalans, 2004). Because Realignment was enacted so recently, no long-term recidivism data are available yet. We can, however, estimate the potential impact with available data from the California Department of Corrections and Rehabili-tation (CDCR). Our study creates two proxy realignment offender groups and uses a three-year historical recidivism file to estimate potential public safety risk of those who will remain under state supervision, contrasted with those released to local county control. Our study is not meant to predict recidivism rates for offenders under state versus local supervision, which may reflect both differences in offender characteristics as well as supervision strategies (i.e., parole versus probation strategies). Rather, we are estimating the inherent risk of lower-level offenders being released to local supervision under realignment and what this may portend for the counties as they receive thousands of new offenders to supervise.
This study is motivated by four questions about California’s realignment that have yet to be answered:
n What are the risk-to-recidivate levels and prior records of lower-stakes offenders targeted for post-prison supervision (PRCS) by the counties? How do these compare with offenders who will remain under state supervision?
n What pressures are lower-stakes offenders likely to place on the local correctional system? In other words, do their histories indicate a pattern of supervision violations and returns to custody?
n What public safety risks do the lower-stakes offenders potentially pose in terms of post prison recidivism?
n What are the implications for state correctional policy based on these findings?
We use data from the CDCR on a cohort of prisoners released from 2005-06 to create two proxy supervision groups: proxy-state parolees and proxy-PRCS offenders. Because we are using an historical dataset, we are able to analyze recidivism rates for three years following each offender’s release from prison. We explore which types of offenders are being released to the coun-ties when criminal justice policies are based on stakes and current offense rather than criminal history and risk to recidivate. We find that stakes is inversely related to risk, suggesting the counties may now be supervising many of the state’s most likely-to-recidivate offenders. We also find that more than one in five of these would-be locally supervised offenders had served prison sentences for prior serious or violent offenses. Finally, we discover that many of these “low-stakes” offenders had, in their past, been returned to prison for high-stakes crimes (e.g., serious or violent offenses), suggesting they may not be as “low-level” as the political discourse on realignment suggests.
As the mass incarceration era recedes, the time is ripe to evaluate some of the major policy shifts that are already underway and assess which have promising, long-lasting results. California’s realignment offers the largest effort to date to curtail the detrimental effects of mass incarceration.
Reduced State Prison Populations as a National Trend
From 2006 to 2010, the overall number of prisoners and correctional expenditures in the United States increased. However, a closer examination of 2009 to 2010 reveals a shift (Subramanian and Tublitz, 2012). In 2009, for the first time in 38 years, the imprisonment rate took a downward turn (The Pew Center on the States, 2010). The overall prison population declined, but there was a tremendous amount of variation among the states. Twenty-six states managed to decrease their prison popula-tions, some substantially, but several states experienced significant increases (The Pew Center on the States, 2010). Although it is still early to predict whether or not this decline will last, important changes in sentencing and corrections policy hint at a new direction for criminal justice policy in America.
Several states have successfully implemented policies that have reduced both prison population and spending (Subrama-nian and Tublitz, 2012). In 2010, the Bureau of Justice Assistance launched the Justice Reinvestment Initiative (JRI) to help states develop evidence-based programs and policies that will cut costs and improve public safety (The Urban Institute, 2013). Some of the most common JRI policy provisions and reforms include risk assessment instruments, graduated sanc-tions for supervision violations, the reclassification of offenses (and consequent sentences), and an increased use of prob-lem-solving courts to handle arrestees with substance use and mental health problems. Other state sentencing reforms focus on a number of areas of both short- and long-term impact, including drug treatment and diversion, community supervision, and prison release policies as well as responses to supervision violations (King, 2009; Davies and La Vigne, 2011). For example, Michigan and Rhode Island increased the use of community corrections while still achieving an overall reduction in correctional costs and reducing the prison population (Subramanian and Tublitz, 2012). The success of Michi-gan is based on a series of reforms taken a decade earlier: repealing mandatory minimums for drug offenders; implement-ing a comprehensive reentry program; and changing the structure of parole hearings. Michigan reduced its prison popula-tion by 12 percent between 2006 and 2009 (Greene and Mauer, 2010). Kansas, New Jersey, and New York also had notable reductions during that time due to a combination of sentencing reforms, alternatives to prison for drug offenders, reducing time served in prison, using risk assessment tools to aid parole releases, and reducing parole revocations. New York show-cases the success of these reforms with a remarkable 20 percent reduction in its prison population, resulting mostly from scaling back the Rockefeller Drug Laws that were adopted in 1973 (Mauer, 2011). By 2012, Texas reduced their prison

3
population by 5,000 as they devoted more resources to drug treatment and changes to parole violations, rather than build new prisons (Goode, 2013).
Some states have sought to reduce prison churning through supervision reforms. In an effort to improve community supervi-sion in Hawaii, the Hawaii’s Opportunity Probation with Enforcement (HOPE) program was launched in 2004 to reduce probation violations by drug offenders and others at high risk of recidivism (Hawaii State Judiciary, n.d.). Swiftness and cer-tainty of punishment are prioritized over severity, which typically results in several days in jail for each violation of probation. A central premise of this approach is to focus resources on those most in need of substance abuse treatment and those most likely to recidivate. Because of the incredible success of HOPE in Hawaii – a 92 percent reduction in missed probation appoint-ments and a 96 percent decline in positive drug tests after three and a half years– the Washington State Department of Cor-rections fully implemented this high-intensity supervision model in 2012. By the end of the first year, 14,500 of their highest-risk probationers and parolees were enrolled in the program (Warner, Aylward, and Mullins, 2012).
Some states have shifted offenders to local jurisdiction responsibility in an effort to cut down on state prison spending and improve public safety (Davies and La Vigne, 2011). The hope is that increased investment in community supervision will help cut costs while reducing prison populations. Evidence-based community programs and policies have been shown to be less expensive and more effective at reducing recidivism compared to incarceration as long as individual criminogenic risks and needs are addressed (Andrews, 2006; Andrews et al., 1990; Crime and Justice Institute at Community Resources for Justice, 2009). Risk assessment helps identify those most at risk for reoffending, improves the placement of offenders into appropriate programs and services, improves the utilization of resources, and enhances public safety (Andrews, Bonta, and Wormith, 2006; Latessa and Lovins, 2010; Latessa, 2004). The field has recognized the importance of incorporating risk assessment in offender supervision and programming for quite some time (DeMichele, 2007; Clawson, Bogue, and Joplin, 2005).
California’s Effort to Reduce Its Prison Population
Although many state efforts are impressive in their own right, none has matched the sheer magnitude of changes taking place in California. The first major effort to reduce the incarcerated population and prison costs in the past 15 years was California’s Proposition 36, which took effect in July 2001. This program successfully diverted over 30,000 non-violent offenders from entering prison through drug treatment (King, 2009). In years five and six of the program, nearly seven out of every ten referred offenders entered treatment. Over 30 percent of offenders who entered treatment under Prop 36 completed the pro-gram and were discharged from probation or parole (Urada et al., 2008). In more recent years, the state has enacted a number of reforms and policies to reduce its prison population further, including the use of out-of-state prison placements, enhanced credit earning, summary parole, the use of a parole-violation decision making instrument, and incentives to counties for keep-ing probation failures in the local community. None of these prior efforts, however, had significant expected or actual impacts on the prison population close to those projected for realignment (Turner, Braithwaite, Kearney, and Haerle, 2012; Adminis-trative Office of the Courts, 2013; CDCR, 2009).
However, the situation changed dramatically in 2011. As part of California’s effort to comply with a Three-Judge Court order to reduce its prison population (described in greater detail below), the state enacted legislation known as “California’s Public Safety Realignment.” Under realignment, thousands of offenders historically sentenced to prison as well as those supervised after prison by the state are now the counties’ responsibility. As Petersilia and Snyder (2013) note, “This is the biggest penal experiment in modern history” (p. 268). However, because no state funding was set aside for an evaluation, and counties were not legally obligated to keep track of or evaluate their locally sentenced and supervised populations, most of how this policy has affected the counties remains unknown (Misczynski, 2012; Petersilia and Snyder, 2013).
California Realignment
Over the last two decades, the California Department of Corrections and Rehabilitation (CDCR) has faced serious charges for providing inmates with constitutionally inadequate medical (Plata v. Schwarzenegger, 2009) and mental (Coleman v. Schwar-zenegger, 2009) health care. Several experts, supported by reports of the federal court-appointed Receiver and Special Master, concluded that the problems were rooted in prison overcrowding. A Three-Judge Court ordered California to reduce the prison population to 137.5 percent of design capacity in August 2009. The U.S. Supreme Court upheld the order on May 23, 2011, giving CDCR two years to meet this requirement.
This historic legislation took effect October 1, 2011. Assembly Bills 109 and 117 (California’s “Public Safety Realignment” ini-tiative) make several fundamental changes to sentencing and community supervision in California. With realignment, cer-tain sentenced felons remain under state control while others are handled locally. In essence, high-stakes offenders – those with a current or prior conviction for a serious, violent or sex felonies – continue to go to state prison, while low-stakes offend-ers – those who have not committed an offense perceived to threaten public safety – stay locally. Realignment also transfers responsibility for post-prison supervision for lower-stakes offenders to the counties, keeping higher “stakes” offenders under

4
state parole supervision. Eligibility for PRCS is based on current offense; those who have committed serious or violent offenses previously are still eligible for local supervision after release from prison. The legislation also addressed the problem of parole violators “churning” back to prison by requiring virtually all parole violators to be sanctioned locally, as opposed to being sent back to prison for what was previously very short (four-month average) prison stays (Grattet, Petersilia, and Lin, 2008).
In negotiating realignment with the counties, the state affirmed that local supervision of offenders would produce better results (Grattet, 2013). County responsibility is supposed to maintain public safety, if not reduce crime rates further. Only offenders expected to be low-stakes—again, those who were not currently serving a sentence for a serious or violent offense—would be released to local county probation supervision after release from prison. What is striking about the legislation is the virtual absence of “risk” based criteria in decisions made about local versus state responsibility, despite the fact that CDCR has officially incorporated risk assessment in other decision-making and prison programming policies (California Department of Corrections and Rehabilitation, 2007; Turner, Hess, and Jannetta, 2009). The only consideration of risk to recidivate in the legislation is for sex offenders—a group generally considered high-stakes by legislators, the media, and the public—for supervision after prison,1 despite research findings that officially-reported recidivism rates among sex offenders are lower than those of non-sex offenders and non-serious or violent criminals (California Department of Corrections, 2010). Post Release Community Supervision is also a policy based on current offense rather than criminal history, which presupposes criminal specializing even though research on criminal offending patterns shows that most offenders do not specialize or cre-ate a “criminal career” in a particular type of crime (Delisi, 2003; Piquero, 2000; L. M. J. Simon, 1997). Post Release Commu-nity Supervision assumes “stakes” based on a single incarceration event (the most recent) and ignores previous offending behaviors and recidivism rates.
DATA AND METHOD
The CDCR provided the data used in the current study. The dataset contains criminal information for the entire released state prisoner cohort in 2005-06. It includes variables for primary offense, reason for return to custody for current offense, number of prior stays in prison, number of prison stays for the current case, whether or not the offender is a current or prior serious or violent offender, sex offender registration, and mental health code status. The California Static Risk Assessment (CSRA) score is also included. The CSRA was developed to predict post-release recidivism based on static risk factors derived from existing data sources at CDCR and the California Department of Justice (Turner, Hess, and Jannetta, 2009). It assesses the offender’s risk to recidivate primarily using criminal history and places offenders in one of the following categories: high violent risk, high property risk, high drug risk, moderate risk, and low risk. The CDCR dataset also records recidivism within the first three years after release by the number of days before arrest, conviction, and whether or not the offender was returned to custody.
Females were not included in our study because the variables required to determine sex offender risk and mentally disordered status were not available for this subgroup. Excluding females (10.5 percent of the entire sample), the sample size for analysis is 97,133 male releasees.
Study Group Assignment: Proxy-State Parole and Proxy-PRCS
As of this writing, long-term recidivism rates for realigned offenders does not exist. Therefore, we analyze potential public safety risks using an historical dataset of released California prisoners. We want to make clear that our analysis is not measur-ing post-realignment parole versus PRCS recidivism rates, nor are we attempting to analyze changes to sentencing under realignment. We are estimating public safety risk of offenders that counties are now receiving after release from prison. Assignment to proxy groups mirrored the definition of offenders who would be placed on parole or PRCS under realignment legislation. For the purposes of this study, an offender was considered to be in the proxy-state parole group if he was a current serious/violent offender, a high-risk sex offender (HRSO), or an offender with mental health history who met certain condi-tions (see Table 1). A “serious felony” is any offense as defined by California Penal Code Section 1192.7(c). A “violent felony,” which is not mutually exclusive, is any offense as defined by PC Section 667.5(c). Some of the offenses considered serious or violent include murder or attempted murder, voluntary manslaughter, rape, lewd acts with a child, any felony that causes great bodily harm, assault with a deadly weapon, arson, mayhem, kidnapping, etc. PC Section 290 to 290.023, known as the “Sex Offender Registration Act,” lists the sex offenses for which certain offenders are required to register with the local police or sheriff’s department. A high-risk sex offender (HRSO) is a sex offender who is required to register pursuant to PC Section 290 and has been determined by a risk assessment tool to pose a higher risk to commit a new sex offense in the community. CDCR utilizes the Static-99R tool for males. There was no variable for HRSO status, but these offenders were approximated using sex offender registration and CSRA scores. Mentally ill offenders were determined by mental health codes, institution levels, and types of conviction offense.
1 Risk to recidivate is not considered for any offender group at sentencing. Under realignment legislation, all persons who have been convicted of committing a California Penal Code Section 290 registerable offense are prison eligible. Thus, all PC 290 sex offenders are considered high-stakes during sentencing.

5
In the AB 109 legislation, several other criteria were specified. For example, third-strikers and those released from life sen-tences were to be placed on state parole. In the 2005-06 recidivism data, there were no third strikers eligible for parole. Although the dataset did not have an indicator variable for a life sentence, the crime committed is very likely to be considered a serious or violent crime. Thus, “lifers” are absorbed into the proxy-state parole group by the other criteria (e.g. sex offender, serious/violent offender). All remaining offenders were considered proxy-PRCS offenders. Our categorization resulted in 22,848 offenders in the proxy-state parole group and 74,285 offenders in the proxy-PRCS group.
Table 1. Study Operationalization: State Parole Group Approximation
AB 109 Definitions Proxy-State Parole
Offenders with life terms, including those with third strikes
1) Life sentences likely captured in serious and violent offenses
2) First group of third strikers not eligible for release until 2019
Current serious or violent offenders Current serious or violent offenses
High risk sex offenders 1) Registered sex offenders + CSRA score in “high violent” category
2) Primary sex offense + sex flag registration on or before June 30, 2006 + CSRA score in “high violent” categorya
Mentally disordered offenders 1) Mental health code of “Department of Mental Health” or “Crisis Bed”b
2) Mental health code of “Enhanced Outpatient Program” + institution level of III or IVc
3) Mental health code of “Enhanced Outpatient Program” + Penal Code 2962 specified crimed
a June 30, 2006 marked the end of fiscal year 2005-06.b The Department of Mental Health and Crisis Bed treat severely mentally ill inmates who are housed in a secure mental health hospital or acute psychiatric/medical unit. c Enhanced Outpatient Program inmates are provided mental health services that are generally given to more stable inmates. The institution level is used to gauge the inmate’s security classification and estimate MDO status.d Penal Code 2962 defines MDO status. Offenses that could be measured with this dataset include: murder, attempted murder, and assault with a deadly weapon.
Measuring Recidivism
There is no universally accepted measure of “recidivism,” and different measures capture different aspects of offender and system behavior. As noted in Ball (2012), arrest rates can “serve as a proxy for how aggressive and/or effective law enforcement is in a particular locale at the front-end” (p. 12); therefore, arrest rates can serve as an indicator for how busy the counties’ law enforcement might be. A “raw” arrest—one not necessarily followed by a conviction—does not indicate guilty behavior, but it does give a closer estimate of the offense date if a crime was in fact committed (Maltz, 1984). Hence, there are advantages to the different measures of recidivism. We use multiple indicators of recidivism as measured by whether or not the offender was arrested, convicted, or returned to custody within three years after release from prison. The return status (e.g., as a parole violator or new admission) and type of offense for which an offender was returned to prison/custody are also examined. We note that, under realignment, the vast majority of offenders will not be returned to prison for violations. The types of the offenses are examined for which offenders were returned to prison in our (pre-realignment) dataset primarily to understand the nature of offender criminal behaviors we might expect to see.
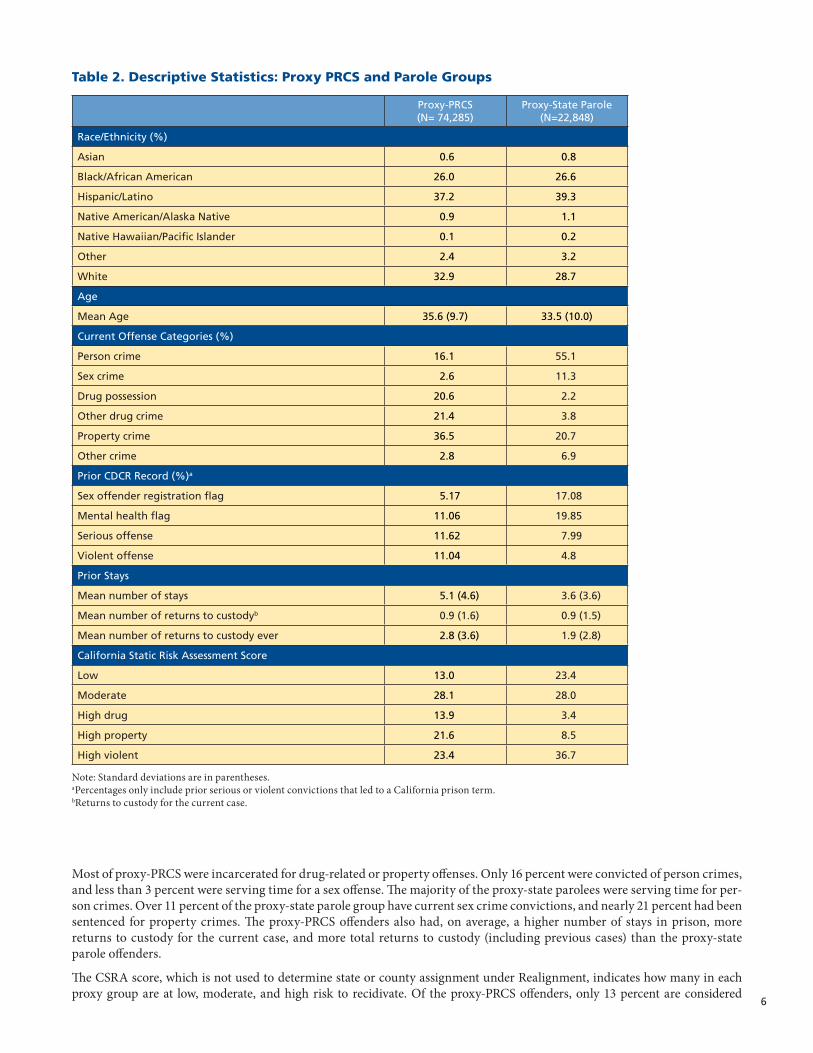
Table 2 presents the background characteristics of the proxy-parole and proxy-PRCS offenders. The racial and age makeup of each group are comparable. As expected, the current offense for the groups are different – the overwhelming majority of the proxy-state parole offenders are current serious or violent offenders, reflecting realignment major classification based on offense.
6
Table 2. Descriptive Statistics: Proxy PRCS and Parole Groups
Proxy-PRCS (N= 74,285)
Proxy-State Parole (N=22,848)
Race/Ethnicity (%)
Asian 0.6 0.8
Black/African American 26.0 26.6
Hispanic/Latino 37.2 39.3
Native American/Alaska Native 0.9 1.1
Native Hawaiian/Pacific Islander 0.1 0.2
Other 2.4 3.2
White 32.9 28.7
Age
Mean Age 35.6 (9.7) 33.5 (10.0)
Current Offense Categories (%)
Person crime 16.1 55.1
Sex crime 2.6 11.3
Drug possession 20.6 2.2
Other drug crime 21.4 3.8
Property crime 36.5 20.7
Other crime 2.8 6.9
Prior CDCR Record (%)a
Sex offender registration flag 5.17 17.08
Mental health flag 11.06 19.85
Serious offense 11.62 7.99
Violent offense 11.04 4.8
Prior Stays
Mean number of stays 5.1 (4.6) 3.6 (3.6)
Mean number of returns to custodyb 0.9 (1.6) 0.9 (1.5)
Mean number of returns to custody ever 2.8 (3.6) 1.9 (2.8)
California Static Risk Assessment Score
Low 13.0 23.4
Moderate 28.1 28.0
High drug 13.9 3.4
High property 21.6 8.5
High violent 23.4 36.7
Note: Standard deviations are in parentheses.aPercentages only include prior serious or violent convictions that led to a California prison term. bReturns to custody for the current case.
Most of proxy-PRCS were incarcerated for drug-related or property offenses. Only 16 percent were convicted of person crimes, and less than 3 percent were serving time for a sex offense. The majority of the proxy-state parolees were serving time for per-son crimes. Over 11 percent of the proxy-state parole group have current sex crime convictions, and nearly 21 percent had been sentenced for property crimes. The proxy-PRCS offenders also had, on average, a higher number of stays in prison, more returns to custody for the current case, and more total returns to custody (including previous cases) than the proxy-state parole offenders.
The CSRA score, which is not used to determine state or county assignment under Realignment, indicates how many in each proxy group are at low, moderate, and high risk to recidivate. Of the proxy-PRCS offenders, only 13 percent are considered

7
low-risk, and 28 percent are moderate-risk offenders. This leaves the remaining offenders (59 percent) in the high risk to recidivate category, and approximately 23 percent of these high-risk offenders are considered “high violent” by the CSRA instrument. Among the proxy-state parolees, over half are in the low- and moderate-risk groups, and nearly 37 percent are considered high-risk violent offenders. Overall, the proxy-PRCS group has a higher percentage of offenders considered high-risk than the proxy-state parole group.
Although the proxy-PRCS offenders, by definition, are not high-stakes sex offenders, high-stakes mentally disordered offenders, or current serious or violent offenders, there are some lower-stakes sex and mental health offenders in the proxy-PRCS group (5.17 percent and 11.06 percent, respectively). Among the proxy-PRCS offenders, over 11 percent have prior seri-ous offenses that resulted in a prison term, and roughly 11 percent have prior violent offenses. The “priors” only include serious or violent offenses that led to a commitment with CDCR; out-of-state offenses and offenses that resulted in probation or jail are not included. Therefore, there are likely more offenders in the “low-stakes” population that have committed a serious or violent crime. The percentage of proxy-PRCS offenders with prior serious or violent offenses is actually higher than proxy-state parolees with priors. The vast majority (87.2 percent) of those remaining under state supervision do not have prior serious or violent CDCR records. Only 4.8 percent of the proxy-state parolees have a prior violent offense on their CDCR record.
Analytic Strategy
We first review recidivism rates for the two proxy supervision groups by current offense. Next, recidivism analyses display the arrest, conviction, and returns to custody within the three-year follow-up period. We analyze the status of reincarcerated offenders to see if the groups were returning to prison for new crimes or parole violations. Finally, we perform a closer inspec-tion of return status by comparing the types of offenses committed after release.
RESULTS
Table 3 presents recidivism rates – as measured by arrest, conviction, and returns to prison – for three years following release. Each proxy group is broken down into six mutually exclusive current offense groups: person crimes, sex crimes, drug posses-sion only crimes, other drug crimes (including manufacturing and sales thereof), property crimes, and other crimes (i.e. escape, driving under the influence, arson, possession of weapon, and other offenses).
The overwhelming majority of both proxy groups were arrested within three years after release, with rates of 79.7% for proxy-PRCS and 71.4% for proxy-state parole. The offense group with the highest arrest and conviction rates in both proxy supervi-sion groups are those serving time for drug possession, though proxy-PRCS property offenders are a close second. Property offenders have the highest return to prison rate for proxy-PRCS, followed by those charged with drug possession. Over 71% of proxy-PRCS sentenced for person crimes are returned to prison within three years. Those sentenced for drug possession again have the highest rate among the proxy-state parole group. The proxy-PRCS group recidivated at a higher rate within almost every type of offense group, including the subgroup of person and sex offenders, and for all three types of recidivism. Only proxy-state parolees serving sentences for drug offenses returned to prison at a higher rate than the proxy-PRCS offenders (78% compared to 74% for drug possession only offenders, and 59% compared to 58% for other drug offenses), though the dif-ferences are relatively marginal.
Table 3. Three-Year Recidivism Rates by Proxy Supervision Groups and Current Offense (N=97,133)
Arrest Conviction Return to Prison
PRCS Parole PRCS Parole PRCS Parole
Current Offensea
Person 9,464 (80.3%) 8,813 (71.6%) 5,790 (49.1%) 4,823 (39.2%) 8,531 (71.2%) 8,049 (63.9%)
Sex 1,353 (71.5%) 1,360 (53.9%) 647 (34.2%) 596 (23.6%) 1,283 (67.8%) 1,386 (53.6%)
Drug Possession 12,514 (84.3%) 419 (83.6%) 8,486 (57.2%) 276 (55.1%) 11,328 (73.9%) 399 (78.2%)
Other Drug 10,805 (70.0%) 576 (68.3%) 6,872 (44.5%) 327 (38.8%) 9,169 (57.6%) 511 (59.2%)
Property 21,943 (83.2%) 3,606 (78.0%) 14,941 (56.6%) 2,134 (46.1%) 20,120 (74.3%) 3,347 (70.7%)
Other 2,033 (78.8%) 1,173 (76.7%) 977 (48.2%) 651 (42.6%) 1,443 (69.5%) 1,078 (68.8%)
Total 57,681 (79.7%) 15,947(71.4%) 37,713 (52.1%) 8,807 (39.4%) 51,874 (69.8%) 14,770 (64.6%)
aThe offense for which the inmate was originally incarcerated.

8
Returns to Prison
Prior to realignment, the majority of parolees returned to CDCR were not returned to prison via the courts as a result of a new criminal conviction, but through the parole violation process (Grattet et al., 2008). The latter uses a lower standard of proof – “preponderance of the evidence” as opposed to “beyond a reasonable doubt” – and handles both technical violations of parole conditions, such as not reporting to a parole agent, as well as new criminal behavior. Because parole in California is considered an extension of the felon’s sentence and not a reward for good behavior, the state parole board may legally revoke their parole and return them to prison (Grattet et al., 2008). This “back-end sentencing” contributed heavily to California’s high parole revocation rate in the past.
Figure 1 displays a more detailed analysis of returns to prison. Parole violators are those who have been returned to prison by the parole board without receiving a new court imposed sentence. Parole violators with new court convictions, on the other hand, are parolees returned to prison with a new criminal conviction through the court process.
Figure 1. Status of Offenders Returned to Prison within Three Years
Parole Violator
Parole Violator with New Court Conviction
New Court Conviction
0% 40%20% 80%60%10% 30% 50% 70%
Proxy-State Parole Proxy-PRCS
72.5%
64.6%
22.5%
29.8%
5.1%
5.6%
Most offenders were returned for parole violations without new terms. However approximately one-quarter of proxy-state parolees were convicted in court of a new criminal offense either after they discharged from parole as a “new admission,” or while on parole as a parole violator with a new term. Roughly 35% of proxy-PRCS returned for a new offense. More specifically, only about 5% of the proxy-PRCS and proxy-state parole groups returned to prison as new admissions.2 Parole violators with new terms were more common: one in five proxy-PRCS offenders returned for a parole violation with a new court conviction, and over one in four proxy-state parolees returned under this status. This is expected given that virtually all parolees are placed on a three-year parole supervision. Most offenders were returned for parole violations without new terms for both proxy supervision groups, though historically, the violations that merit a return-to-custody (RTC) are also criminal in nature (Grattet et al., 2008). In general, the proxy-PRCS offenders have similar percentages of the three returns statuses compared to the proxy-state parole group, though the proxy-state parolees are returned to custody without being charged with a new crime slightly more often than the proxy-PRCS group (who are returned more with new charges).3
New Admissions and Parole Violations with New Terms
We next examine the types of offenses for which offenders were returned to prison. Table 4 displays only those who were returned to prison with a new term (N=16,511). The returned offense categories are the same as the six primary (current) offense categories (see “Offense Categories” in Table 2), and the new crime return statuses include new admissions (discharged parolees with new court convictions) and parole violations with new court convictions.
2 This finding is as expected since the regular parole term in California is three years, and this study uses three-year follow-up data.3 All chi-square tests of group assignment are significant.

9
Table 4. Return Offense for Violations with New Terms and New Admissions by Proxy-PRCS and Proxy-State Parole (N=16,511)
Return Offense
Person Sex Drug Poss. Other Drug Property Other
New Court Conviction
Proxy-PRCS 392 (14.8%) 55 (2.1%) 493 (18.6%) 454 (17.1%) 913 (34.4%) 347 (13.1%)
Proxy-Parole 178 (25.4%) 51 (7.3%) 113 (16.1%) 75 (10.7%) 192 (27.4%) 92 (13.1%)
PV with New Conviction
Proxy-PRCS 1,752 (12.6%) 244 (1.8%) 2,936 (21.9%) 2,194 (15.8%) 5,054 (36.5%) 1,677 (12.1%)
Proxy-Parole 639 (21.1%) 142 (4.7%) 549 (18.2%) 326 (10.8%) 868 (28.7%) 498 (16.5%)
Note: Return offense is the offense for which the released offender has been returned to custody. Percentages are based on the number of offenders in each proxy group that returned to prison for a new offense. This table does not include those returned for a parole violation.
Of those discharged from parole and returned for a new crime, a higher percentage of the proxy-state parole offenders were returned for person or sex crimes. Proxy-parolees were less likely to return to prison for drug-related or property crimes once discharged, and both groups were equally likely to return for other crimes. Released offenders who returned to prison as parole violators with new terms displayed a similar pattern; among those returned with a new court conviction, proxy-PRCS were more likely to return for drug-related offenses and property crimes, and proxy-state parolees were more likely to return for new person, sex, and other crimes. In this case, the high-stakes offenders returned to prison for new crimes were returning with high-stakes crimes more often than the low-stakes offenders (though not overall, as noted in Figure 1) – suggesting some crime specialization. However, person and sex crimes only make up approximately one-fourth of the new crimes that the proxy-state parolees are returned to prison for. The majority of high-stakes offenders who are returned to prison for a new court conviction are returned for a lower-stakes crime (i.e. drug, property, or other). Proxy-PRCS offenders are also mostly returned to prison with new convic-tions for drug-related and property crimes, although 17% are returned for either a person or sex crime after discharge, and over 14 % of those returned to prison are returned for these high-stakes offenses while on parole.
Differences By County
County differences in realignment have been front and center in policy discussions. Initial funding decisions were based largely on a county’s historical average daily state prison population of persons convicted of non-serious, non-violent, non-sex offenses, in addition to county population and success with probation population outcomes. Funding was not based on the level of offender risk counties anticipated receiving, although risk potentially impacts required resources for programs and supervision needed under realignment. As a supplementary analysis, we examined the level of estimated risk of “proxy PRCS” and “proxy-parole” offenders counties would expect under realignment. Table 5 presents the percent of low, moderate, high-drug, high-property, and high-violent risk offenders, based on CSRA scores (described earlier).
Overall, parole will supervise a higher portion of high risk violent offenders than local counties. Almost thirty-seven percent of “proxy-parole” offenders statewide are classified as high risk violent offenders compared with 23.4 percent of “proxy-PRCS” offenders. However, Table 5 shows disparities across counties in terms of the risk level of offenders. Ten counties have more than thirty percent of “proxy-PRCS” classified as “high-violent”- the category of offenders potentially most problematic for supervision. Surprisingly, most of these are smaller counties: Kern, Madera, Mendocino, Mono, Riverside, San Joaquin, San Luis Obispo, Sonoma, Sutter and Yuba. Seven counties have fewer than 20 percent high risk violent “proxy-PRCS” offenders. These include Los Angeles, Lake, Orange, Sacramento, San Diego, San Francisco and San Mateo counties – which include the three largest counties in the state.

10
Table 5. CSRA Risk Levels by County and Proxy-Parole and Proxy-PRCS
County Supervision Type Number PercentCSRA
Low Medium High Drug High Prop High Viol
Alameda All 4,711 100.0%
PRCS-Proxy 3,582 76.0% 10.9% 27.6% 17.7% 22.1% 21.8%
Parole-Proxy 1,129 24.0% 28.8% 26.8% 5.5% 8.6% 30.4%
Butte All 832 100.0%
PRCS-Proxy 645 77.5% 19.4% 29.9% 11.1% 17.9% 21.8%
Parole-Proxy 187 22.5% 20.7% 30.7% 1.7% 7.8% 39.1%
Contra Costa All 1,426 100.0%
PRCS-Proxy 1,065 74.7% 9.5% 18.6% 14.3% 29.1% 28.5%
Parole-Proxy 361 25.3% 18.1% 30.9% 2.6% 10.5% 38.0%
Central Small Counties
All 284 100.0%
PRCS-Proxy 221 77.8% 17.9% 27.4% 8.5% 14.2% 32.1%
Parole-Proxy 63 22.2% 34.9% 27.0% 0.0% 6.4% 31.8%
Directly Discharged All 1,369 100.0%
PRCS-Proxy 912 66.6% 8.0% 20.2% 18.6% 17.5% 35.8%
Parole-Proxy 457 33.4% 13.2% 22.2% 3.9% 8.6% 52.2%
El Dorado All 240 100.0%
PRCS-Proxy 176 73.3% 17.3% 26.0% 8.1% 23.7% 24.9%
Parole-Proxy 64 26.7% 36.5% 15.9% 3.2% 3.2% 41.3%
Fresno All 3,833 100.0%
PRCS-Proxy 2,913 76.0% 12.1% 28.8% 9.3% 20.4% 29.3%
Parole-Proxy 920 24.0% 17.8% 28.0% 2.6% 7.4% 44.3%
Humboldt All 538 100.0%
PRCS-Proxy 438 81.4% 16.6% 30.8% 7.7% 18.9% 26.1%
Parole-Proxy 100 18.6% 23.0% 25.0% 1.0% 9.0% 42.0%
Imperial All 328 100.0%
PRCS-Proxy 252 76.8% 11.0% 24.4% 8.9% 31.3% 24.4%
Parole-Proxy 76 23.2% 12.2% 27.0% 2.7% 24.3% 33.8%
Kern All 3,414 100.0%
PRCS-Proxy 2,747 80.5% 9.6% 25.3% 17.0% 17.9% 30.1%
Parole-Proxy 667 19.5% 16.6% 27.7% 3.2% 7.4% 45.0%
Kings All 640 100.0%
PRCS-Proxy 470 73.4% 12.1% 33.6% 7.4% 16.9% 30.1%
Parole-Proxy 170 26.6% 18.3% 19.5% 1.8% 6.5% 53.9%
Los Angeles All 25,257 100.0%
PRCS-Proxy 19,302 76.4% 14.8% 32.5% 12.8% 21.3% 18.6%
Parole-Proxy 5,955 23.6% 27.6% 33.0% 3.1% 7.8% 28.5%
Lake All 231 100.0%
PRCS-Proxy 163 70.6% 28.2% 34.4% 6.1% 11.7% 19.6%
Parole-Proxy 68 29.4% 24.6% 24.6% 0.0% 10.8% 40.0%
(continued on next page)

11
Table 5 (Cont’d). CSRA Risk Levels by County and Proxy-Parole and Proxy-PRCS
County Supervision Type Number PercentCSRA
Low Medium High Drug High Prop High Viol
Madera All 501 100.0%
PRCS-Proxy 393 78.4% 14.4% 25.3% 10.2% 15.4% 34.7%
Parole-Proxy 108 21.6% 20.0% 24.8% 2.9% 6.7% 45.7%
Mendocino All 262 100.0%
PRCS-Proxy 202 77.1% 14.9% 28.9% 8.0% 15.9% 32.3%
Parole-Proxy 60 22.9% 24.1% 13.8% 6.9% 8.6% 46.6%
Merced All 683 100.0%
PRCS-Proxy 502 73.5% 12.2% 25.4% 14.2% 18.9% 29.3%
Parole-Proxy 181 26.5% 17.8% 22.2% 2.8% 9.4% 47.8%
Mono All 963 100.0%
PRCS-Proxy 744 77.3% 9.1% 22.8% 11.0% 24.1% 33.1%
Parole-Proxy 219 22.7% 22.5% 22.0% 3.4% 7.7% 44.5%
Napa All 138 100.0%
PRCS-Proxy 109 79.0% 13.1% 29.9% 16.8% 17.8% 22.4%
Parole-Proxy 29 21.0% 25.0% 28.6% 3.6% 0.0% 42.9%
Northern Small Counties
All 530 100.0%
PRCS-Proxy 411 77.5% 20.3% 27.8% 9.0% 16.3% 26.6%
Parole-Proxy 119 22.5% 26.7% 17.2% 4.3% 8.6% 43.1%
Orange All 7,139 100.0%
PRCS-Proxy 5,671 79.4% 15.0% 31.1% 15.2% 21.6% 17.2%
Parole-Proxy 1,468 20.6% 24.9% 31.6% 3.4% 7.9% 32.2%
Placer All 450 100.0%
PRCS-Proxy 334 74.2% 17.0% 31.2% 9.1% 19.4% 23.3%
Parole-Proxy 116 25.8% 28.7% 26.1% 6.1% 8.7% 30.4%
Riverside All 5,858 100.0%
PRCS-Proxy 4,550 77.7% 10.5% 21.6% 15.2% 21.2% 31.4%
Parole-Proxy 1,308 22.3% 19.2% 25.1% 3.7% 7.5% 44.6%
Sacramento All 5,184 100.0%
PRCS-Proxy 3,896 75.2% 15.5% 28.5% 14.9% 21.1% 19.9%
Parole-Proxy 1,288 24.8% 27.4% 27.6% 2.6% 8.8% 33.7%
Santa Barbara All 718 100.0%
PRCS-Proxy 588 81.9% 12.5% 29.0% 12.7% 21.5% 24.3%
Parole-Proxy 130 18.1% 20.3% 27.3% 3.9% 9.4% 39.1%
San Bernardino All 7,872 100.0%
PRCS-Proxy 6,108 77.6% 11.5% 27.5% 12.4% 23.7% 25.0%
Parole-Proxy 1,764 22.4% 18.5% 27.8% 3.1% 10.5% 40.1%
Santa Clara All 3,117 100.0%
PRCS-Proxy 2,424 77.8% 12.0% 25.4% 18.3% 18.7% 25.6%
Parole-Proxy 693 22.2% 23.6% 22.6% 4.2% 6.2% 43.4%
(continued on next page)

12
Table 5 (Cont’d). CSRA Risk Levels by County and Proxy-Parole and Proxy-PRCS
County Supervision Type Number PercentCSRA
Low Medium High Drug High Prop High Viol
Santa Cruz All 348 100.0%
PRCS-Proxy 257 73.9% 17.5% 17.5% 15.5% 22.3% 27.1%
Parole-Proxy 91 26.1% 22.2% 23.3% 6.7% 4.4% 43.3%
San Diego All 6,379 100.0%
PRCS-Proxy 4,799 75.2% 12.7% 29.9% 15.2% 22.8% 19.3%
Parole-Proxy 1,580 24.8% 22.1% 28.7% 4.8% 10.1% 34.3%
San Francisco All 1,453 100.0%
PRCS-Proxy 1,043 71.8% 9.1% 26.6% 19.8% 25.2% 19.3%
Parole-Proxy 410 28.2% 24.1% 27.2% 4.8% 8.6% 35.3%
Shasta All 881 100.0%
PRCS-Proxy 665 75.5% 17.3% 30.8% 9.1% 17.0% 25.8%
Parole-Proxy 216 24.5% 27.4% 25.9% 2.4% 5.7% 38.7%
Siskiyou All 103 100.0%
PRCS-Proxy 71 68.9% 33.3% 26.1% 4.4% 10.1% 26.1%
Parole-Proxy 32 31.1% 29.0% 12.9% 0.0% 6.5% 51.6%
San Joaquin All 2,253 100.0%
PRCS-Proxy 1,734 77.0% 7.4% 17.2% 15.9% 25.0% 34.5%
Parole-Proxy 519 23.0% 17.2% 21.4% 3.4% 11.5% 46.5%
San Luis Obispo All 706 100.0%
PRCS-Proxy 391 55.4% 16.9% 19.5% 14.1% 16.7% 32.8%
Parole-Proxy 315 44.6% 30.8% 18.0% 2.6% 6.9% 41.6%
San Mateo All 956 100.0%
PRCS-Proxy 734 76.8% 12.6% 25.9% 16.7% 25.5% 19.3%
Parole-Proxy 222 23.2% 22.8% 26.0% 3.7% 7.8% 39.7%
Solano All 1,333 100.0%
PRCS-Proxy 995 74.6% 9.0% 23.1% 16.6% 21.3% 30.0%
Parole-Proxy 338 25.4% 17.9% 23.1% 2.4% 9.7% 46.8%
Sonoma All 715 100.0%
PRCS-Proxy 550 76.9% 11.6% 19.8% 10.8% 24.1% 33.6%
Parole-Proxy 165 23.1% 17.5% 21.3% 3.8% 10.6% 46.9%
Stanislaus All 1,356 100.0%
PRCS-Proxy 1,056 77.9% 7.4% 21.6% 13.1% 28.9% 29.0%
Parole-Proxy 300 22.1% 18.4% 23.6% 2.7% 15.0% 40.3%
Sutter All 377 100.0%
PRCS-Proxy 298 79.0% 13.9% 26.8% 11.2% 16.7% 31.4%
Parole-Proxy 79 21.0% 19.2% 14.1% 1.3% 10.3% 55.1%
Tehama All 243 100.0%
PRCS-Proxy 200 82.3% 16.9% 29.7% 10.8% 17.4% 25.1%
Parole-Proxy 43 17.7% 23.3% 25.6% 4.7% 2.3% 44.2%
(continued on next page)

13
Table 5 (Cont’d). CSRA Risk Levels by County and Proxy-Parole and Proxy-PRCS
County Supervision Type Number PercentCSRA
Low Medium High Drug High Prop High Viol
Tulare All 1,253 100.0%
PRCS-Proxy 933 74.5% 10.7% 30.5% 9.3% 24.0% 25.5%
Parole-Proxy 320 25.5% 22.5% 29.2% 3.2% 8.6% 36.5%
Ventura All 1,314 100.0%
PRCS-Proxy 986 75.0% 12.1% 28.2% 13.9% 24.8% 21.0%
Parole-Proxy 328 25.0% 24.9% 26.2% 2.5% 10.4% 36.0%
Yolo All 577 100.0%
PRCS-Proxy 466 80.8% 15.6% 24.4% 13.6% 20.2% 26.2%
Parole-Proxy 111 19.2% 15.1% 19.8% 7.6% 3.8% 53.8%
Yuba All 368 100.0%
PRCS-Proxy 289 78.5% 10.4% 19.8% 11.2% 23.0% 35.6%
Parole-Proxy 79 21.5% 16.0% 13.3% 0.0% 5.3% 65.3%
Total All 97,133 100.0%
PRCS-Proxy 74,285 76.5% 12.95 28.14 13.88 21.6 23.44
Parole-Proxy 22,848 23.5% 23.4% 28.0% 3.4% 8.5% 36.7%
DISCUSSION/CONCLUSION
Based on the findings of this study, the locally supervised PRCS offenders may not be as “low-stakes” as the political discourse regarding realignment would suggest. Eighty percent of the proxy-PRCS offenders – those offenders who under realignment are now being supervised by the counties – had been arrested within three years after release; 52 percent had been convicted; and 70 percent had been returned to prison. California’s realignment essentially based post-prison supervision on current offense. The resulting proxy groups are very similar in some respects (i.e. demographics, return to prison statuses) but diverged in terms of criminal histories, current offense, and various measures of recidivism. As we suspected of the lower-stakes group, our analyses suggest that the proxy-PRCS offenders are likely those who contributed heavily in the past to the prison churning problem in California. The proxy-PRCS offenders had more previous stays in prison and returns to custody than the proxy-state parole offenders, and a higher percentage of them had prior serious or violent offenses on their CDCR records compared to the proxy-state parolees. They also had more offenders scoring in one of the high-risk categories of the CSRA. Over 23 percent of proxy-PRCS offenders were scored as “high violent” by the CSRA, which may at first appear surprising, but less so after one considers that more than one in five proxy-PRCS offenders had a serious or violent prior conviction. It is, however, a disconcerting finding with respect to public safety. Our findings appear to be born out in early observations of realignment. A recent CDCR report showed higher percentages of high-risk offenders in PRCS than on parole during the first year of Realignment (California Department of Corrections, 2013). Many probation departments have been concerned that the realignment population would be higher risk and higher needs than originally anticipated (Abarbanel, McCray, McCann Newhall, and Snyder, 2013).
Under realignment, offenders (other than those with life terms) may only be returned to prison if their crimes are eligible for a prison sentence. Therefore, if these revocations are not due to new, serious crimes committed by released offenders, the coun-ties will now be responsible for sanctioning the lower-level arrests as well as supervision violations. This is especially true for the proxy-PRCS offenders, who (historically) recidivated at a higher arrest, conviction, and return to prison rates than the proxy-parolees. The proxy-PRCS group was also returned to prison more often with a new court conviction, mostly for lower-level drug or property crimes, although 17 percent returned for either a new person or sex crime conviction. The majority of both proxy supervision groups returned to prison for parole violations without new terms, which means most offenders recidi-vated with technical violations or low-level offenses that were processed by the parole board. While returning offenders to prison for low-level crimes or supervision violations used to be a viable option for the counties, most violations must now be managed by the counties. Our findings suggest counties will be dealing with large volumes of lower-level supervision viola-tions as a result of realignment.
The fact that the counties are receiving some of the most criminally active offenders in the state puts pressure on county jails under realignment. This will inevitably result in more overcrowding issues. In fact, local jails are already facing overcrowding

14
issues as a direct result of realignment (Lofstrom and Raphael, 2013). At the end of 2012, the jail population was reported to be 11 percent higher than the previous year (Chief Probation Officers of California, 2012). To avoid jail overcrowding, observers have recommended counties would benefit from using evidence-based alternatives to incarceration at every stage of the sys-tem, reserving jail beds only for offenders posing the highest risk to the public (Hopper, Evans, and Soltani, 2011). The counties are now responsible for handling tens of thousands of new offenders, and there are simply not enough jail cells to contain all of these offenders.4 Our findings suggest large numbers of locally supervised offenders will be arrested and possibly reincar-cerated at the local level. Therefore, prioritizing alternatives to jail which focus on social services and treatment may prove to be more cost effective solutions (Boganowski, 2011; Pearson and Lipton, 1999; Petersand Murrin, 2000; Zweig, Yahner, and Redcross, 2010). This is particularly salient for locally supervised offenders who can now access these services closer to where they live and where progress in treatment may be interrupted by shorter periods of incapacitation.5 Social services have been proven to reduce recidivism, but they have to be accessible to the offenders in order for them to work (Hipp, Petersilia, and Turner, 2010). Each county has discretionary control over sentencing and supervision, but they have been strongly urged in the legislation, and by interest groups, to approach this reform as an opportunity to adopt more alternatives to jail (e.g., home detection, day reporting centers, community service, and restorative justice programs), incorporate evidence-based programs, and help lead the country towards the end of the mass incarceration era. Many counties outlined early plans for these alterna-tives, however, it is not yet known whether counties are actually using realignment as an opportunity to “do something differ-ent.” An ongoing study by RAND will examine this issue in 12 California counties.
Limitations
The proxy supervision groups were created to reflect definitions in realignment legislation as closely as possible, but there were some areas in which this was not possible due to the limitations of the data. Females were excluded from the analysis because information on sex offender risk level was not available for women. Realignment affects both male and female offenders, and female offender recidivism would have been an important contribution to the study as female offenders make up 10 percent of the released prisoner population. Although the male sex offender stakes levels were estimated using the CSRA tool, there was not a perfect correlation with the Static 99 tool, which is used to determine PRCS eligibility by CDCR. It is likely that there are some discrepancies between the Static-99-determined high-risk sex offenders and our definition using the CSRA risk tool.6 Offense classifications were also too general in the dataset to determine definitively whether or not offenders were mentally disordered offenders (MDO). Our proxy group was established using mental health status, institution level, and the few offense types in the dataset that matched the PC 2962 offenses, but the MDO classification could only be approximated. The offenders who were not identified by this approximation as MDOs, however, are few in numbers, and thus, not likely to affect our results. Finally, our study is relevant to one population under realignment – those offenders returning from prison to the community. Current data are not available to study offenders sentenced to serve felonies locally versus state prison – an important area of future study.
POLICY IMPLICATIONS
Realignment Experience to Date
Although still early, it appears that realignment’s aims to significantly reduce California’s prison population and lower state prison costs have not been entirely met. The three-judge court ordered California to reduce its prison population from approximately 150,000 (188 percent) inmates to 110,000 (137.5 percent) in August 2009, but the current population (as of June 2013) remains at 119,000 (Grattet, 2013). The financial aspect of realignment, however, has been largely successful for the state. A recent performance audit of CDCR reports an expected savings of $1 billion in fiscal year 2012-13 (Department of Finance, Office of State Audits and Evaluations, 2013). The Governor’s revised budget for 2013-14 includes $9.2 billion for state corrections (Graves, 2013), a 2 percent increase from the year before, but a 5 percent decrease from the year prior to realignment. While the population targets have not been met by the CDCR, there has been a considerable reduction in cor-rections spending.
A report issued in March 2012 by the ACLU of California also provided less than promising results among the counties. After reviewing 53 available county realignment implementation plans, the ACLU reported that there has been a considerable increase in spending on county jails, and the jails were filled with a large number of people who present no real threat to the public (Hopper et al., 2011). Moreover, the promise to adopt alternatives to incarceration and to use evidence-based practices is yet to be demonstrated. The decreased reliance on state prisons provides California with significant savings, but not all 58
4 The Chief Probation Officers of California (CPOC) reported in July 2012 that local probation departments were supervising 23,000 offenders who used to be under state parole jurisdiction. There were also an additional 15,000 offenders serving their sentences in local jails.5 Pursuant to Penal Code 3455(d) offenders who violate their conditions of post-release community supervision may not be confined in the county jail for longer than 180 days. Periods of flash incarceration for up to 10 days are encouraged as one method of punishment for violations of post-release supervision (Penal Code 3454(b)).6 CDCR does not currently have the ability to “flag” offenders who might have been eligible for PRCS prior to realignment.

15
counties are contributing to this trend equally. Nineteen out of the 28 counties that showed larger than average declines were the same counties that already had lower than average commitments to state prison rates, and seven counties actually increased (Males, 2012).
What has been realized post-realignment were some of the primary concerns of this legislation: an overall increase in every category of reported crime (Mueller, 2013), and many maxed out local county jails potentially leading to the same problem that the state faced: constitutionally inadequate health care (Quentin Hall, et al. v. Margarget Mims, et al., 2011, Quinton Gray, et al. v. County of Riverside, 2013). While the former is not clearly a result of the recent policy, and crime trends are not consistent across counties in the state, the latter is undoubtedly due to changes imposed by realignment. Additionally, the costs of realignment have exceeded what some counties had anticipated. “Several counties have observed that realigned prisoners have more medical and mental health needs than other jail inmates, and that it is costing more than expected. But we have not seen any quantitative documentation or evaluation of these costs” (Misczynski, 2012, p. 20). We are still lacking substantive data to either confirm or reject claims that these are realignment-actuated issues.
A Mixed Message of Philosophies
Changes to community supervision over the last 30 years have demonstrated shifting currents with respect to rehabilitative versus punitive models as well the role of the individual offender in corrections policy. Feeley and Simon (1992) describe a recent paradigm shift as “the new penology,” in which aggregated risk assessment, rather than reintegrating individuals back into the community, has become a central focus of the field. This systemic transformation coincides with the increased use of monitoring and surveillance techniques that emphasize efficiency (e.g. electronic monitoring and GIS) (Feeley and Simon, 1992; Rhine, 2012), drug testing, and intensive supervision programs (Rhine, 2012). According to this paradigm, parole agents dedicate the majority of their time to detecting and catching violations and sanctioning noncompliance (Rhine, 2012) – a reflection of the shift towards the era of what Jonathan Simon (1993) calls “managerial parole.”
Ironically, California eschewed a risk-management approach in its selection of offenders to be “realigned.” As noted earlier, the concept of risk is virtually absent in deciding who will remain under state supervision and who will be assigned to local county supervision. Instead, a “just desserts” model (Von Hirsch, 1976; Barton, 2004) seems more descriptive –one in which the nature of the crime trumps risk assessment. At the same time, realignment emphasizes the opportunity for counties to change the current “get tough” discourse that we have seen over the last couple of decades in favor of a rehabilitation-focused reentry model. While the three-judge court did not specify how California was to reduce their prison population, community-based alternatives were emphasized as the most viable options. Many counties have incorporated risk and needs assessment, and invested in evidence-based techniques to increase offenders’ chances of more successful reentry (Chief Probation Officers of California, 2012). The failure to incorporate risk in offender realignment selection coupled with an emphasis on using risk principles in county supervision may seem contradictory. However, it may reflect the political sensitivities associated with a policy that can be seen as “giving a break” to certain offenders leaving prison. Serious and violent, as well as sex offenders, still receive “harsher” treatment under realignment (i.e., they are not eligible for local sentencing or supervision), regardless of their risk-to-recidivate.
Concluding Thoughts
Mass incarceration is a result of a myriad of policies over the past 40 years, yet states are appearing to head in a new direc-tion: one that is away from mass incarceration and perhaps back towards rehabilitation and reintegration. As the country begins to show signs of movement, it is important to thoroughly review the processes already underway in some of the leading states. California has scaled back prison sentencing and parole in an effort to meet a court order, but these changes may have long-term effects on the way California addresses crime. If other states model their approaches after California’s realignment initiative, they may substantially reduce their prison populations—but at a cost. A policy that realigns offend-ers based on current offense may inadvertently make counties responsible for some of the highest risk offenders in the state. If counties are not properly prepared for such a transition, they may be overwhelmed by the duties of supervising thousands of new, and very active, offenders. Counties have been encouraged to integrate alternatives to incarceration into every stage of the process and concentrate local resources on the highest risk offenders to avoid some of the same problems that devel-oped in the state prisons. Other states may follow California in its monumental effort to reduce prison overcrowding by realigning certain offenders to local jurisdictions, but they are strongly advised that policies based on offenses only – or “stakes” may be riskier than anticipated.
REFERENCES
Abarbanel, Sara, Angela McCray, Kathryn McCann Newhall, and Jessica Snyder. 2013. Realigning the Revolving Door: An Analysis of California Counties’ AB 109 2011-2012 Implementation Plans. Stanford, CA: Stanford Criminal Justice Center.

16
Administrative Office of the Courts. 2013. Report on the California Community Corrections Performance Incentives Acts of 2009. San Francisco, CA: Administrative Office of the Courts.
Andrews, Donald A., James Bonta, and J. Stephen Wormith. 2006. The recent past and near future of risk and/or need assessment. Crime and Delinquency, 52(1), 7–27. doi:10.1177/0011128705281756
Andrews, Donald A. 2006. Enhancing Adherence to Risk-Need-Responsivity: Making Quality a Matter of Policy. Criminology and Public Policy, 5(3), 595–602.
Andrews, Donald A., Ivan Zinger, Robert D. Hoge, James Bonta, Paul Gendreau, and Francis T. Cullen. 1990. Does correctional treatment work? A clini-cally relevant and psychologically informed meta-analysis. Criminology, 28(3), 369–404.
Ball, W. David. 2012. Tough on crime (on the state’s dime): How violent crime does not drive California counties’ incarceration rates - and why it should. Georgia State University Law Review. Retrieved from http://papers.ssrn.com/sol3/papers.cfm?abstract_id=1871427
Barton, Alana. 2004. Just Deserts Theory. Encyclopedia of Prisons and Correctional Facilities. Ed. . Thousand Oaks, CA: SAGE, 504-07.
Boganowski, Cynthia A. 2011. Douglas County’s Mental Health Diversion Program. American Jails, 25(4), 9–14.
California Department of Corrections and Rehabilitation. 2007. A Roadmap for Effective Offender Programming in California. Sacramento, CA: Expert Panel on Adult Offender and Recidivism Reduction Programming.
California Department of Corrections and Rehabilitation. 2010. Adult Institutions Outcome Evaluation Report. Sacramento, CA: CDCR Office of Research, Adult Research Branch.
California Department of Corrections and Rehabilitation. 2013. Realignment Report: A One-year Examination of Offenders Released from State Prison in the First Six Months of Public Safety Realignment. Sacramento, CA: CDCR Office of Research.
Chief Probation Officers of California. 2012. Mandatory Supervision: The Benefits of Evidence Based Supervision under Public Safety Realignment. Sacra-mento, CA: Chief Probation Officers of California.
Clawson, Elyse, Brad Bogue, and Lore Joplin. 2005. Implementing Evidence-based practices in Corrections: Using an Integrated Model. Boston, MA: Crime and Justice Institute.
Cole, David. 2011. Turning the corner on mass incarceration. Ohio St. J. Crim. L., 9, 27.
Coleman v. Schwarzenegger. , No. 2:90-CV-0520 LKK JFM (Eastern District of California October 21, 2009).
Crime and Justice Institute at Community Resources for Justice. 2009. Implementing Evidence-Based Policy and Practice in Community Corrections Sec-ond Edition. Washington, D.C.: National Institute of Corrections.
Davies, Elizabeth, and Nancy G. La Vigne. 2011. Impact and Influence: The Role of Local Jurisdictions in Managing Prison Population Size. Washington, DC: Urban Institute, Justice Policy Center. Retrieved from http://tpcprod.urban.org/UploadedPDF/412437-Role-of-Local-Jurisdictions.pdf
Defendants’ Response to Three-Judge Court’s October 21, 2009 Order, Coleman v. Schwarzenegger, No. 2:90-cv-00520-LKK-JFM (E.D. Cal. Nov. 12, 2009); Plata v. Schwarzenegger, No. 3:01-cv-01351-TEH (N.D. Cal. Nov. 12, 2009), ECF No. 2:90-cv-00520, Document No. 3726.
DeMichele, Matthew T. 2007. Probation and Parole’s Growing Caseloads and Workload Allocation: Strategies for Managerial Decision Making. Lexington, KY: American Probation and Parole Association.
Delisi, Matt. 2003. The imprisoned nonviolent drug offender: Specialized martyr or versatile career criminal? American Journal of Criminal Justice, 27(2), 167–182.
Department of Finance, Office of State Audits and Evaluations. 2013. Performance Audit: California Department of Corrections and Rehabilitation, “The Future of California Corrections,” Blueprint Fiscal Benchmarks, July 1 ,2012 through June 30, 2013 (No. 135225055).
Feeley, Malcolm M., and Jonathan Simon. 1992. The new penology: Notes on the emerging strategy of corrections and its implications. Criminology, 30(4), 449–474.
Galeste, Marcus A., Henry F. Fradella, and Brenda Vogel. 2012. “Sex Offender Myths in Print Media: Separating Fact from Fiction in U.S. Newspapers.” Western Criminology Review 13(2):4-24.
Goode, Erica.U.S. (2013, July 25). Prison Populations Decline, Reflecting New Approach to Crime, The New York Times, Retrieved September 2, 2013 from:http://www.nytimes.com/2013/07/26/us/us-prison-populations-decline-reflecting-new-approach-to-crime.html?pagewanted=alland_r=0
Grattet, Ryken. 2013, July 22. Realignment in California: The Story So Far. The Crime Report. Retrieved from http://www.thecrimereport.org/archive/2013-07-realignment-in-california-the-story-so-far
Grattet, Ryken, Joan Petersilia, and Jeffrey Lin. 2008. Parole Violations and Revocations in California. Washington, D.C.: National Institute of Justice.
Graves, Scott. 2013. A Mixed Picture: State Corrections Spending After the 2011 Realignment. Sacramento, CA: California Budget Project. Retrieved from http://www.cbp.org/pdfs/2013/130625_A_Mixed_Picture_Corrections.pdf
Greene, Judith and Marc Mauer. 2010. Downscaling Prisons: Lessons from Four States. Washington, D.C.: The Sentencing Project.
Guerino, Paul, Paige Harrison, and William Sabol. 2012. Prisoners in 2010. Washington, D.C.: Bureau of Justice Statistics, U.S. Department of Justice. Retrieved from http://www.bjs.gov/content/pub/pdf/p10.pdf
Hagan, John and Ronit Dinovitzer. 1999. Collateral consequences of imprisonment for children, communities, and prisoners. In Michael Tonry and Joan Petersilia (Eds.), Prisons, crime and justice, (p.125-147). Chicago: University ofChicago Press.
Hawaii State Judiciary. (n.d.). HOPE Probation. Retrieved from http://www.courts.state.hi.us/special_projects/hope/about_hope_probation.html
Hipp, John R., Joan Petersilia, and Susan Turner. 2010. Parolee recidivism in California: The effect of neighborhood context and social service agency char-

17
acteristics. Criminology, 48(4), 947–979. doi:10.1111/j.1745-9125.2010.00209.x
Hopper, Allen, Kelli Evans, and Abdi Soltani. 2011. Community Safety, Community Solutions. Implementing AB 109: Enhancing Public Safety, Saving Money and Wisely Allocating Limited Jail Space. San Francisco, CA: ACLU of California.
King, Ryan S. 2009. A change of course: Developments in state sentencing policy and their implications for the federal system. Federal Sentencing Reporter, 22(1), 48–52. doi:10.1525/fsr.2009.22.1.48
Latessa, Edward J. 2004. Best practices of classification and assessment. Journal of Community Corrections, 12(2), 4–6, 27–30.
Latessa, Edward J. and Brian Lovins. 2010. The role of offender risk assessment: A policy maker guide. Victims and Offenders, 5(3), 203–219. doi:10.1080/15564886.2010.485900
Levenson, Jill S., Yolanda N. Brannon, Timothy Fortney, and Juanita Baker. 2007. Public perceptions about sex offenders and community protection poli-cies. Analyses of Social Issues and Public Policy, 7(1):1-25.
Lofstrom, Magnus and Steven Raphael. 2013. Impact of Realignment on County Jail Populations. San Francisco, CA: Public Policy Institute of California.
Lynch, James P. and William J. Sabol. 2006. Assessing the effects of mass incarceration on informal social control in communities. Criminology and Public Policy, 3: 267–294. doi: 10.1111/j.1745-9133.2004.tb00042.x
Males, Mike. 2012. Update: Eight months into realignment: Dramatic reductions in California’s prisoners. San Francisco, CA: Center on Juvenile and Crimi-nal Justice. Retrieved from http://www.cdcr.ca.gov/Reports/docs/ExternalReports/Realignment_update_June_19_2012.pdf
Maltz, Michael D. 1984. Recidivism. Orlando, FL: Academic Press.
Mauer, Marc. 2011. Sentencing Reform: Amid Mass Incarceration - Guarded Optimism. Criminal Justice, 26(1).
Misczynski, Dean. 2012. Corrections Realignment: One Year Later. Public Policy Institute of California. Available at www. ppic. org/content/pubs/report/R_812DMR. pdf. Retrieved from http://www.ppic.org/content/pubs/report/R_812DMR.pdf
Mueller, Robert S. 2013. Preliminary Annual Uniform Crime Report. Washington, D.C.: Federal Bureau of Investigation, United States Department of Justice.
National Association of State Budget Officers. 2012. State Expenditure Report: Examining Fiscal 2010-2012 State Spending. Washington, D.C. Retrieved from http://www.nasbo.org/sites/default/files/State%20Expenditure%20Report_1.pdf
Pearson, Frank S. and Douglas S. Lipton. 1999. A meta-analytic review of the effectiveness of corrections-based treatments for drug abuse. The Prison Jour-nal, 79(4), 384–410. doi:10.1177/0032885599079004003
Peters, Roger H. and Mary R. Murrin. 2000. Effectiveness of treatment-based drug courts in reducing criminal recidivism. Criminal Justice and Behavior, 27(1), 72–96. doi:10.1177/0093854800027001005
Petersilia, Joan and Jessica Greenlick Snyder. 2013. Looking past the hype: 10 questions everyone should ask about California’s prison realignment. Califor-nia Journal of Politics and Policy, 5(2). doi:10.1515/cjpp-2013-0011
Piquero, Alex. 2000. Frequency, specialization, and violence in offending careers. Journal of Research in Crime and Delinquency, 37, 392–418.
Plata v. Schwarzenegger. , No. 3:01-cv-01351-TEH (United States District Courts for the Eastern District and the Northern District of California August 4, 2009).
Porter, Nicole D. 2010. The State of Sentencing 2009. Retrieved from http://ww.w.sentencingproject.org/doc/publications/s_ssr2009Update.pdf
Porter, Nicole D. 2011. The State of Sentencing 2010: Developments in Policy and Practice. Washington, D.C.: The Sentencing Project.
Porter, Nicole D. 2012. The State of Sentencing 2011: Developments in Policy and Practice. Washington, D.C.: The Sentencing Project.
Quentin Hall, et al. v. Margarget Mims, et al. (United States District Court for the Eastern District of California December 13, 2011).
Quinton Gray, et al. v. County of Riverside (United States District Court for the Central District of California March 8, 2013).
Roberts, Julian and Stalans, Loretta. 2004. Restorative sentences: Exploring the views of the public. Social Justice Research, 17(3):315-334.
Rhine, Edward E. 2012. The present status and future prospects of parole boards and parole supervision. In Joan Petersilia and Kevin R. Reitz (Eds.), The Oxford Handbook of Sentencing and Corrections (pp. 628–656). New York: Oxford University Press.
Simon, Jonathan. 1993. Poor discipline: parole and the social control of the underclass, 1890-1990. Chicago: University of Chicago.
Simon, Leonore M. J. 1997. Do criminal offenders specialize in crime types? Applied and Preventive Psychology, 6, 35–53.
Subramanian, Ram and Rebecca Tublitz. 2012. Realigning Justice Resources: A Review of Population and Spending Shifts in Prison and Community Correc-tions. New York, NY: Vera Institute of Justice.
The Pew Center on the States. 2010. Prison Count 2010: State Population Declines for the First Time in 38 Years. Washington, D.C.
The Urban Institute. 2013. The Justice Reinvestment Initiative: Experiences from the States. Washington, D.C.
Turner, Susan, James Hess, and Jesse Jannetta. 2009. Development of the California Static Risk Assessment Instrument (CSRA) (Working Paper). University of California, Irvine: Center for Evidence-Based Corrections.
Turner, Susan F., Helen Braithwaite, Lauren Kearney, and Darin Hearle. 2012. Evaluation of the California Parole Violation Decision-Making Instrument (PVDMI). Journal of Crime and Justice, 35(2), 269-295
Urada, Darren, Angela Hawken, Bradley T. Conner, Elizabeth Evans, Douglas Anglin… Annie Poe. 2008. Evaluation of Proposition 36: The Substance Abuse and. UCLA Integrated Substance Abuse Programs.

18
Von Hirsch, Andrew. 1976. Doing justice: The choice of punishments. New York: Hill and Wang.
Von Hirsch, Andrew. 1986. Past or future crimes: Deservedness and dangerousness in the sentencing of criminals. New Brunswick, NJ: Rutgers University Press.
Warner, Bernard, Anmarie Aylward, and Sandy Mullins. 2012. Community Corrections Practices: 2012 Report to the Legislature. Tumwater, WA: Washing-ton Department of Corrections.
Zweig, Janine, Jennifer Yahner, and Cindy Redcross. 2010. Recidivism effects of the Center for Employment Opportunities (CEO) Program vary by former prisoners’ risk of reoffending acknowledgments (pp. 1–16). New York: MDRC.