calipatria solar farm tia - granicus
TRANSCRIPT
Calipatria Solar Farm TIA
Prepared for: 70SM 8ME, LLC 71SM 8ME, LLC
c/o 8minutenergy Renewables LLC
Prepared by:
Fehr & Peers
March 25, 2011
IE10-0037
TABLE OF CONTENTS
Executive Summary .................................................................................................................................................. i Project Trip Estimates .......................................................................................................................................... i Intersection and Roadway Segment Impacts ....................................................................................................... i Site Access Impacts ............................................................................................................................................. ii Sight Distance Impacts ......................................................................................................................................... ii
1. Introduction ........................................................................................................................................................ 1
2. Existing Conditions ........................................................................................................................................... 3 Existing Roadway Network .................................................................................................................................. 3 Level of Service Methods .................................................................................................................................... 4 Existing Intersection Levels of Service ................................................................................................................ 5 Existing Signal Warrant Analysis ......................................................................................................................... 6 Existing Roadway Segment Level of Service ...................................................................................................... 6 Field Observations ............................................................................................................................................... 6
3. Analysis Parameters ......................................................................................................................................... 8 Project Description............................................................................................................................................... 8 Project Study Area ............................................................................................................................................... 8 Project Traffic Estimates ...................................................................................................................................... 8 Project Impact Criteria ....................................................................................................................................... 10
4. Existing Plus Construction Impact Analysis ................................................................................................ 12 Construction Traffic ........................................................................................................................................... 12 Construction Phase Intersection Levels of Service ........................................................................................... 12 Project Signal Warrant Analysis ........................................................................................................................ 13 Roadway Segment Levels of Service ................................................................................................................ 13 Intersection and Roadway Segment Impacts .................................................................................................... 13 Proposed Site Access ....................................................................................................................................... 14 Sight Distance Impacts ...................................................................................................................................... 14
5. Project Opening Year (2012) Impact Analysis .............................................................................................. 15 Background Growth ........................................................................................................................................... 15 Opening Year Roadway Improvements ............................................................................................................ 15 Project Traffic ..................................................................................................................................................... 15 Opening Year Intersection Levels of Service .................................................................................................... 15 Opening Year Signal Warrant Analysis ............................................................................................................. 15 Roadway Segment Levels of Service ................................................................................................................ 16 Intersection and Roadway Segment Impacts .................................................................................................... 17 Proposed Site Access ....................................................................................................................................... 17 Sight Distance Impacts ...................................................................................................................................... 17
6. Year 2030 Cumulative Conditions.................................................................................................................. 18 Year 2030 Cumulative Volumes ........................................................................................................................ 18 Cumulative Year Roadway Improvements ........................................................................................................ 18 Project Traffic ..................................................................................................................................................... 18 Year 2030 Cumulative Intersection Levels of Service ....................................................................................... 18 Cumulative Year Signal Warrant Analysis ......................................................................................................... 18 Roadway Segment Levels of Service ................................................................................................................ 19 Intersection and Roadway Segment Impacts .................................................................................................... 20 Proposed Site Access ....................................................................................................................................... 20 Sight Distance Impacts ...................................................................................................................................... 20
APPENDICES
Appendix A: Existing Traffic Counts
Appendix B: Related Project Trip Assignment
Appendix c: Intersection Level of Service Calculations
LIST OF TABLES
Table 1 Signalized Intersection Level of Service Definitions Using Average Control Vehicular Delay ........ 4
Table 2 Unsignalized Intersection Level of Service Definitions .................................................................... 5
Table 3 Existing Intersection Levels of Service ............................................................................................ 5
Table 4 Existing Roadway Segment Levels of Service ................................................................................ 6
Table 5 Sight Distance at Area intersections ................................................................................................ 7
Table 6 Project Trip Generation Rates and Estimates ............................................................................... 10
Table 7 Existing and Construction Intersection Levels of Service .............................................................. 12
Table 8 Existing and Construction Roadway Segment Levels of Service .................................................. 13
Table 9 Opening Year Intersection Levels of Service ................................................................................. 16
Table 10 Opening Year Roadway Segment Levels of Service ................................................................... 16
Table 11 Cumulative Year (2030) Intersection Levels of Service ............................................................... 19
Table 12 Cumulative Year (2030) Roadway Segment Levels of Service ................................................... 19
Calipatria Solar Farm TIA March 2011
i
EXECUTIVE SUMMARY
This report presents the results of the transportation impact analysis (TIA) for the proposed Calipatria Solar Farm 1 and Calipatria Solar Farm 2 projects located in Imperial County near the City of Calipatria, California. The proposed project is composed of two adjacent solar farms. The entire project site would be bounded by Peterson Road to the north, Young Road to the south, and Blair Road to the east. Lindsey Road would separate the two projects, with Solar Farm 1 located south of Lindsey Road and Solar Farm 2 located north of Lindsey Road. Vehicles would take access to the site from Blair Road, with a project driveway for Solar Farm 1 at its intersection with Wilkinson Road and Solar Farm 2 at its intersection with Montgomery Road.
The impacts of the proposed project to the surrounding transportation system were evaluated following the guidelines of the County of Imperial. The operations of four key intersections and three roadway segments were evaluated with level of service calculations for Existing, Opening Year (2012) and Cumulative Year (2035) conditions, with and without Construction or Project traffic.
PROJECT TRIP ESTIMATES
Each solar farm is estimated to generate 5 new AM and 5 new PM peak-hour trips and 20 daily trips during the operation Operations & Maintenance phase. Project construction for each solar farm is estimated to generate 54 new AM and 54 new PM peak-hour passenger car equivalency (PCE) trips, and 174 daily PCE trips. Because the two projects will be constructed concurrently and will operate concurrently, trip generation estimates for each project were compounded to account for both projects.
INTERSECTION AND ROADWAY SEGMENT IMPACTS
Construction Conditions
The project would not have any significant impacts at study intersections or along roadway facilities with the addition of construction traffic. Additionally, no study intersections meet signal warrants under this condition.
Project Conditions
The project would not have any significant impacts at study intersections or along roadway facilities with the addition of project traffic. Additionally, no study intersections meet signal warrants under this condition. The unsignalized intersection of Blair Road/SR-115 will operate at LOS C with and without the addition of project traffic. This does not create an impact, but the County requires reporting intersections that operate below LOS B for monitoring purposes.
Year 2035 Cumulative With Project Conditions
The project would not have any significant impacts at study intersections or along roadway facilities with the addition of project traffic under this condition. Additionally, no study intersections meet signal warrants. The unsignalized intersection of Blair Road/SR-115 will operate at LOS C with and without the addition of project traffic. This does not create an impact, but the County requires reporting intersections that operate below LOS B for monitoring purposes.
Calipatria Solar Farm TIA March 2011
ii
SITE ACCESS IMPACTS
The project driveway will be located on Montgomery Road, which is 24’ wide. The roadway width and condition is sufficient to accommodate project traffic. Therefore, the project impact is less than significant.
SIGHT DISTANCE IMPACTS
There are no foreseeable sight distance impacts associated with this project.
Calipatria Solar Farm TIA March 2011
1
1. INTRODUCTION
This report presents the results of the transportation impact analysis (TIA) for two proposed solar farms located in Imperial County, near Calipatria, California. Combined, the proposed projects would be bounded by Peterson Road to the north, Lindsey Road to the south, and Blair Road to the east. Montgomery Road would separate the two projects, with Calipatria Solar Farm 1 located south of Lindsey Road and Calipatria Solar Farm 2 located north of Lindsey Road.
The analysis was conducted to identify potential effects of the proposed project on the surrounding transportation system and to recommend appropriate improvements to mitigate any significant impacts.
Transportation impacts were estimated following the Imperial County Traffic Study and Report Policy guidelines (2007). Our analysis included four intersections and three roadway segments:
Intersections
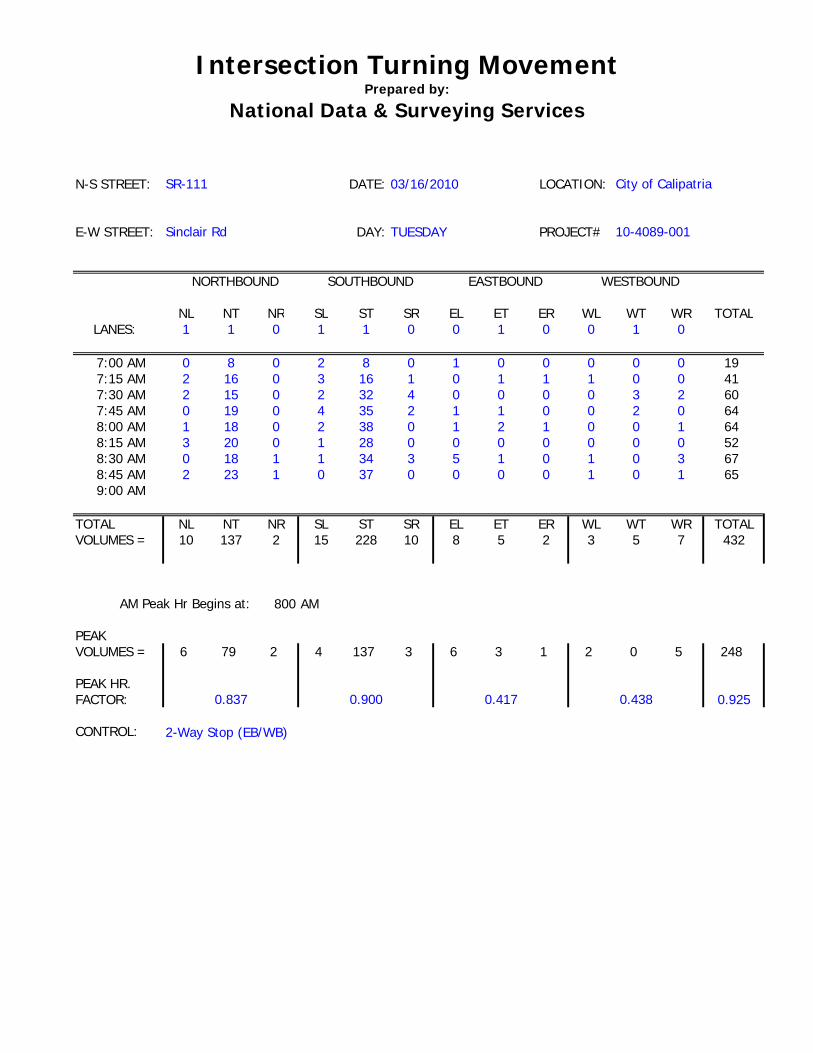
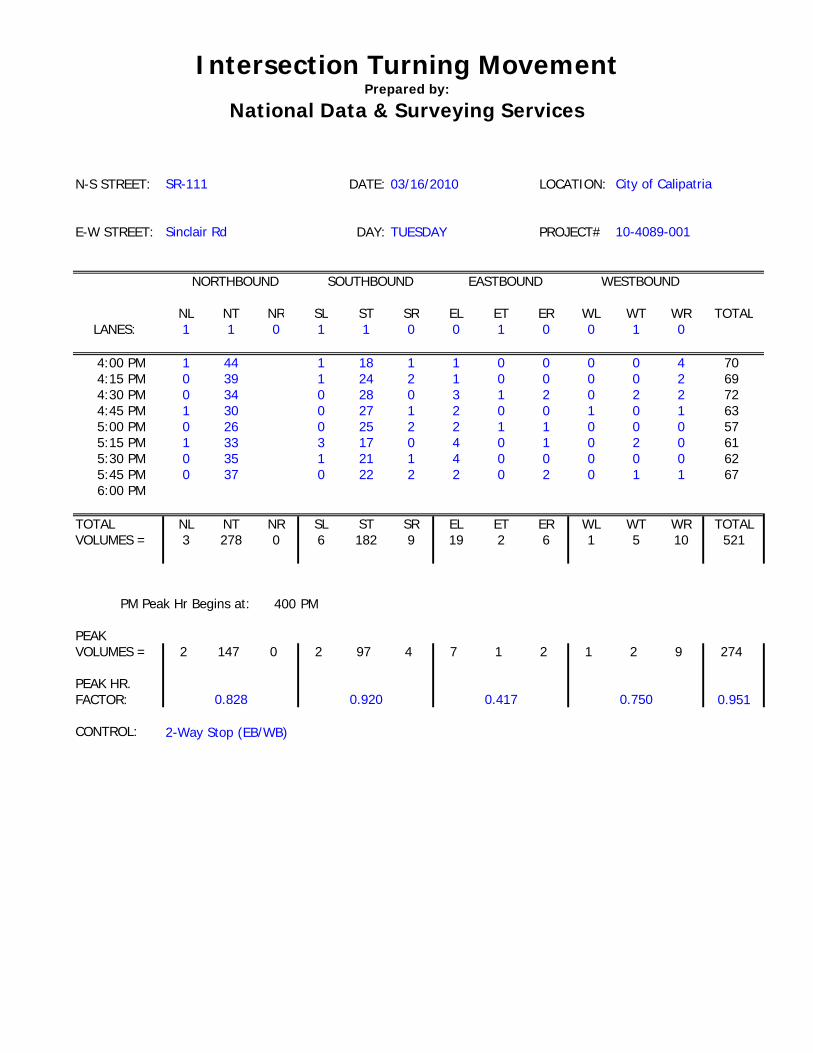
1. SR-111/Sinclair Road
2. Blair Road/Sinclair Road
3. Blair Road/Peterson Road
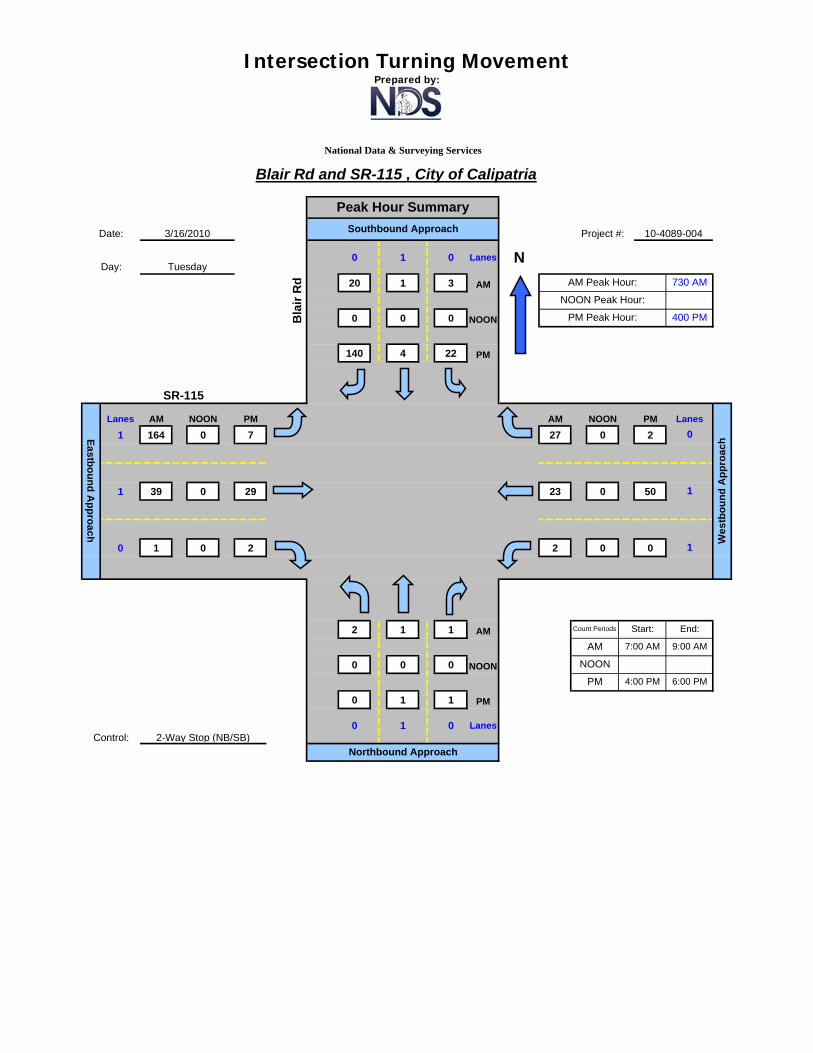
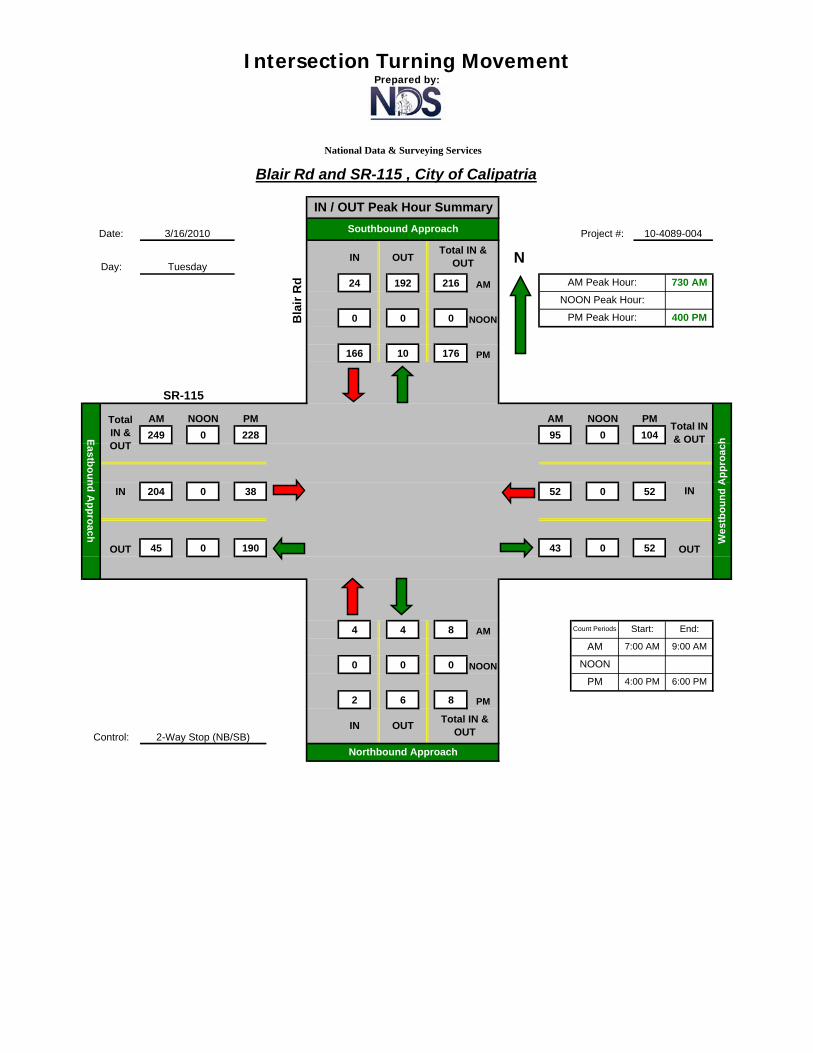
4. Blair Road/SR-115
Roadway Segments
1. SR-111 north of Sinclair Road
2. SR-115 west of Blair Road
3. SR-115 east of Blair Road
The operations of the study intersections were evaluated during the weekday morning (7:00 to 9:00 AM) and afternoon (4:00 to 6:00 PM) peak hours, and study roadway segments during the full day, for the following six scenarios:
Scenario 1: Existing Conditions – Existing volumes obtained from turning movement counts representing the peak one-hour vehicle flow.
Scenario 2: Existing plus Construction Conditions – Existing traffic volumes plus new traffic generated by the construction of the proposed project.
Scenario 3: Opening Year Conditions (2012) – Existing traffic volumes with 2% annual growth rate applied to study facilities.
Scenario 4: Opening Year plus Project Conditions – Opening year traffic volumes plus the net new traffic generated by the proposed project.
Scenario 5: Cumulative Year Conditions (2030) – Existing traffic volumes with 2% annual growth rate plus related project traffic applied to study facilities.
Scenario 6: Cumulative Year plus Project Conditions (2030) – Cumulative year traffic volumes plus the net new traffic generated by the proposed project.
Calipatria Solar Farm TIA March 2011
2
Site access and sight distance were also reviewed for potential issues.
The remainder of this report is divided into five chapters. The existing transportation system serving the site and the current operating conditions of the study intersections and roadway segments are described in Chapter 2. Chapter 3 describes analysis parameters and project trip generation, distribution, and assignment. Chapter 4 describes Existing plus Construction Traffic conditions. Chapter 5 describes Opening Year (2012) Conditions, which includes background growth along study roadway facilities. Year 2035 cumulative scenarios with and without the proposed project are discussed in Chapter 6.
Calipatria Solar Farm TIA March 2011
3
2. EXISTING CONDITIONS
This chapter describes the existing conditions of the roadway facilities, traffic volumes, and intersection operations within the study area. This chapter also includes a discussion of the method used to quantify intersection operations and the corresponding results.
EXISTING ROADWAY NETWORK
Regional access to the project site is by SR-111 and SR-115. Local access is provided to the site by Blair Road and Sinclair Road. The project driveways will be located along Montgomery Road and Wilkinson Road. This section describes the existing roadway network.
State Route 111 (SR-111) is a north-south, regional highway that extends from the US/Mexico Border through the Coachella Valley to Palm Springs. It is classified by the Imperial County General Plan as a State Highway/Expressway. In the project area, SR-111 is a two-lane roadway with a 48’ paved roadway, including a 14’ northbound travel lane, 13’ southbound travel lane, and 13’ turn lane. Shoulder widths are approximately 4’ on either side of the roadway, with an additional 5’ soft shoulder. Access to the roadway is available through side-street stop controlled intersections.
State Route 115 (SR-115) is primarily a northerly regional highway between Holtville and Calipatria. It is classified by the Imperial County General Plan as a State Highway/Expressway. Near the project site, SR-115 travels in the east-west direction and is a two-lane roadway. In the project vicinity, SR-115 has a 48’ paved roadway, including a 15’ westbound travel lane, 13’ eastbound travel lane, and 12’ turn lane. Shoulder widths are approximately 4’ on either side of the roadway, with an additional 5’ soft shoulder. Access to the roadway is available through side-street stop controlled intersections.
Sinclair Road is a two-lane east-west roadway extending eastbound from the Salton Sea to East Highline Canal Road. The Imperial County General Plan classifies Sinclair Road as a minor collector road near the project site. Within the project vicinity, Sinclair Road has 12’ travel lanes and 2’ shoulders in each direction, and 5’ soft shoulders on either side of the roadway. Sinclair Road is stop-controlled at its intersections with other roadways within the project study area.
Blair Road is a two lane north-south roadway extending between the cities of Calipatria and Niland. It is classified by the Imperial County General Plan as a major collector roadway, and provides access to the Calipatria State Prison, located adjacent to the project site. In the project vicinity north of SR-115 , Blair Road has a 32’ paved roadway, with 12’ travel lanes in each direction, 4’ paved shoulders and 5’ soft shoulders. South of SR-115, Blair Road is unpaved, with a crushed-rock roadway approximately 48 feet wide.
Peterson Road is a local east-west roadway extending from Brandt Road eastbound to East Highline Canal Road. At its intersection with Blair Road, Peterson Road has 12’ travel lanes and no shoulder in each direction; shortly beyond the intersection, Peterson Road is unpaved and runs alongside an agricultural canal. Vehicular traffic along Peterson Road is generally limited to agricultural vehicles.
Montgomery Road is a local east-west roadway extending from Brandt Road eastbound to Haley Road. Montgomery Road is approximately 24’ wide and is unpaved. There are signs denoting no through traffic approximately 100’ west of its intersection with Blair Road.
Wilkinson Road is a local east-west roadway extending Brandt Road eastbound to East Highline Canal Road. Wilkinson Road is approximately 24’ wide and is unpaved.
Lindsey Road is a local east-west roadway extending Brandt Road eastbound to East Highline Canal Road. Lindsey Road is approximately 24’ wide and is unpaved.
Calipatria Solar Farm TIA March 2011
4
LEVEL OF SERVICE METHODS
The operations of roadway facilities are described with the term level of service (LOS). LOS is a qualitative description of traffic flow based on such factors as speed, travel time, delay, and freedom to maneuver. Six levels are defined from LOS A, with the least congested operating conditions, to LOS F, with the most congested operating conditions. LOS E represents “at-capacity” operations. Operations are designated as LOS F when volumes exceed capacity, resulting in stop-and-go conditions. The Imperial County General Plan Circulation and Scenic Highways Element (2008) states a minimum acceptable operating level of service C for all street segment links and intersections.
Signalized Intersections
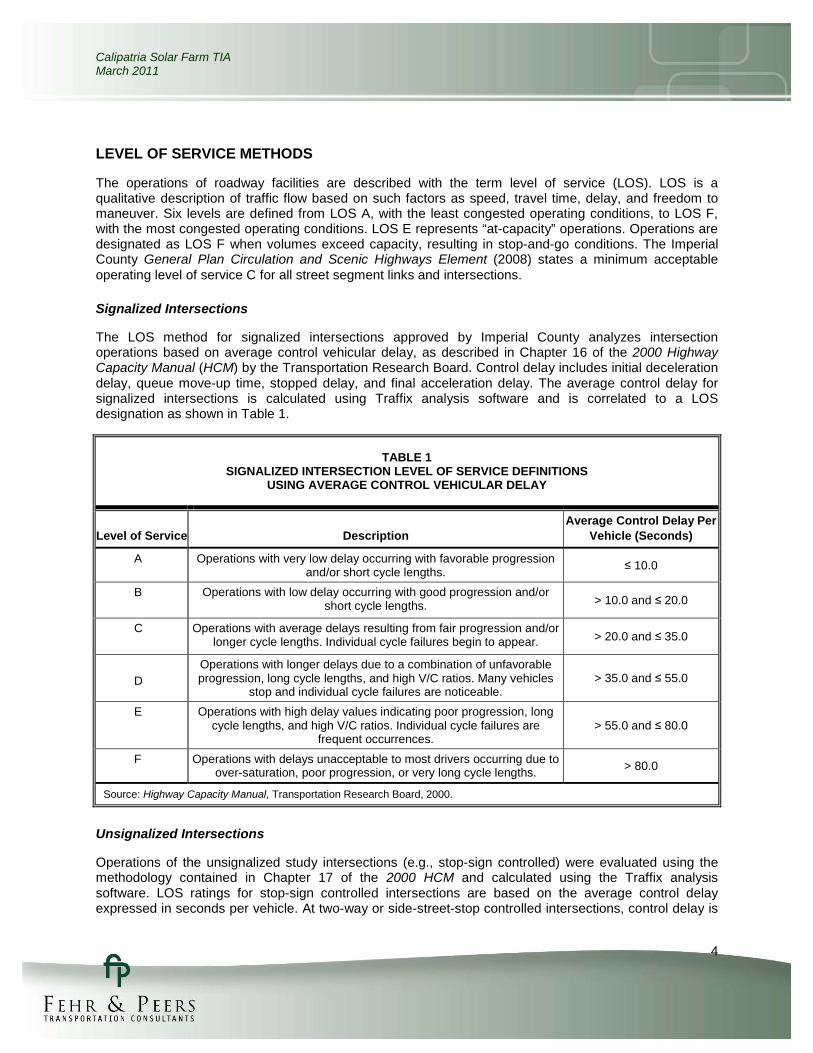
The LOS method for signalized intersections approved by Imperial County analyzes intersection operations based on average control vehicular delay, as described in Chapter 16 of the 2000 Highway Capacity Manual (HCM) by the Transportation Research Board. Control delay includes initial deceleration delay, queue move-up time, stopped delay, and final acceleration delay. The average control delay for signalized intersections is calculated using Traffix analysis software and is correlated to a LOS designation as shown in Table 1.
TABLE 1 SIGNALIZED INTERSECTION LEVEL OF SERVICE DEFINITIONS
USING AVERAGE CONTROL VEHICULAR DELAY
Level of Service Description Average Control Delay Per
Vehicle (Seconds)
A Operations with very low delay occurring with favorable progression and/or short cycle lengths.
≤ 10.0
B
Operations with low delay occurring with good progression and/or short cycle lengths. > 10.0 and ≤ 20.0
C
Operations with average delays resulting from fair progression and/or longer cycle lengths. Individual cycle failures begin to appear. > 20.0 and ≤ 35.0
D
Operations with longer delays due to a combination of unfavorable progression, long cycle lengths, and high V/C ratios. Many vehicles
stop and individual cycle failures are noticeable. > 35.0 and ≤ 55.0
E
Operations with high delay values indicating poor progression, long cycle lengths, and high V/C ratios. Individual cycle failures are
frequent occurrences. > 55.0 and ≤ 80.0
F Operations with delays unacceptable to most drivers occurring due to over-saturation, poor progression, or very long cycle lengths.
> 80.0
Source: Highway Capacity Manual, Transportation Research Board, 2000.
Unsignalized Intersections
Operations of the unsignalized study intersections (e.g., stop-sign controlled) were evaluated using the methodology contained in Chapter 17 of the 2000 HCM and calculated using the Traffix analysis software. LOS ratings for stop-sign controlled intersections are based on the average control delay expressed in seconds per vehicle. At two-way or side-street-stop controlled intersections, control delay is
Calipatria Solar Farm TIA March 2011
5
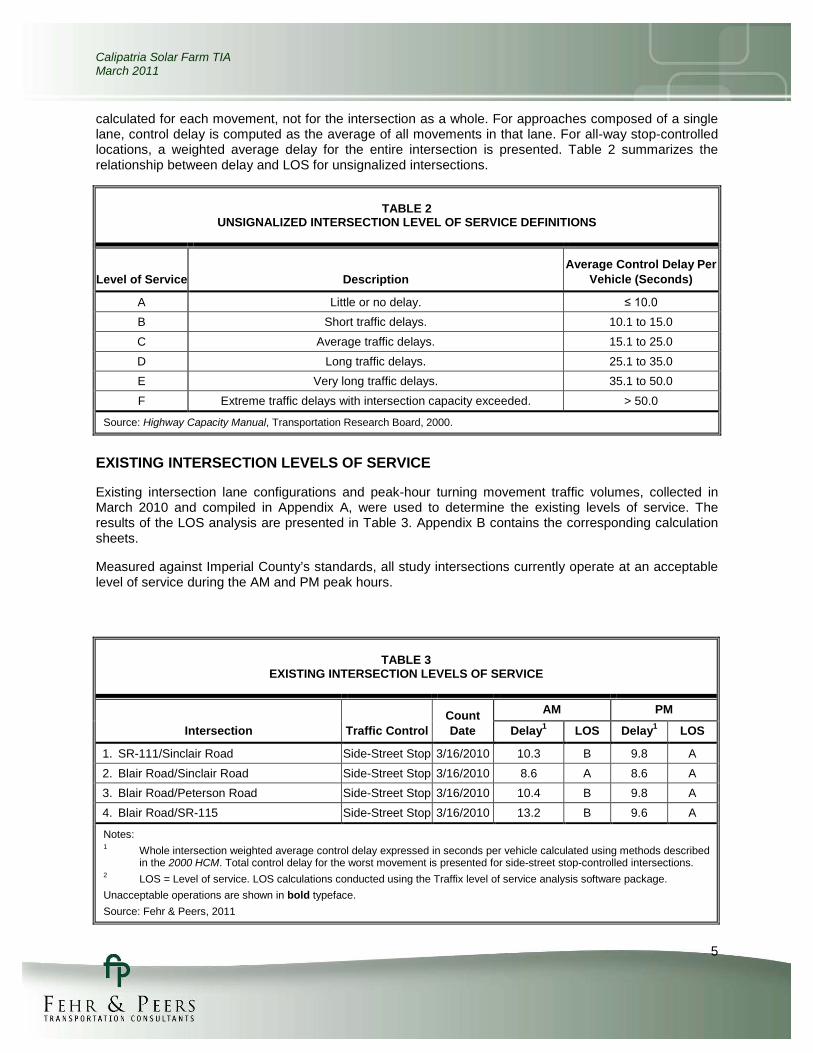
calculated for each movement, not for the intersection as a whole. For approaches composed of a single lane, control delay is computed as the average of all movements in that lane. For all-way stop-controlled locations, a weighted average delay for the entire intersection is presented. Table 2 summarizes the relationship between delay and LOS for unsignalized intersections.
TABLE 2 UNSIGNALIZED INTERSECTION LEVEL OF SERVICE DEFINITIONS
Level of Service Description Average Control Delay Per
Vehicle (Seconds)
A Little or no delay. ≤ 10.0
B Short traffic delays. 10.1 to 15.0
C Average traffic delays. 15.1 to 25.0
D Long traffic delays. 25.1 to 35.0
E Very long traffic delays. 35.1 to 50.0
F Extreme traffic delays with intersection capacity exceeded. > 50.0
Source: Highway Capacity Manual, Transportation Research Board, 2000.
EXISTING INTERSECTION LEVELS OF SERVICE
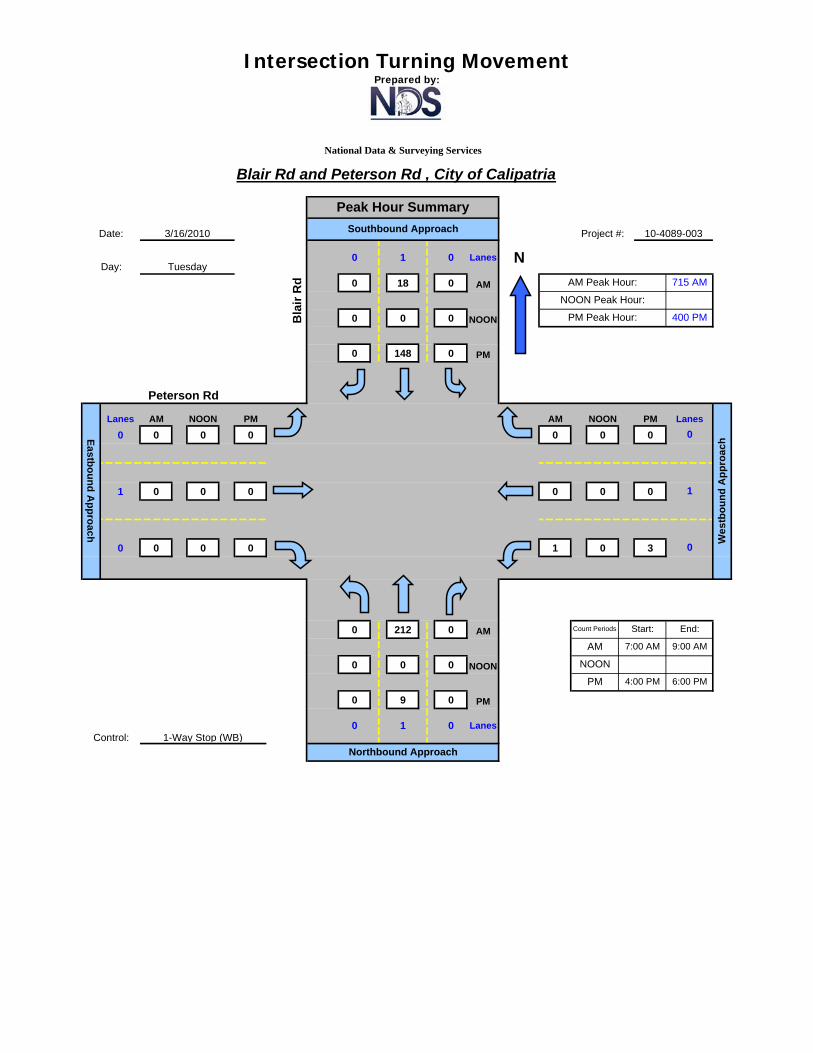
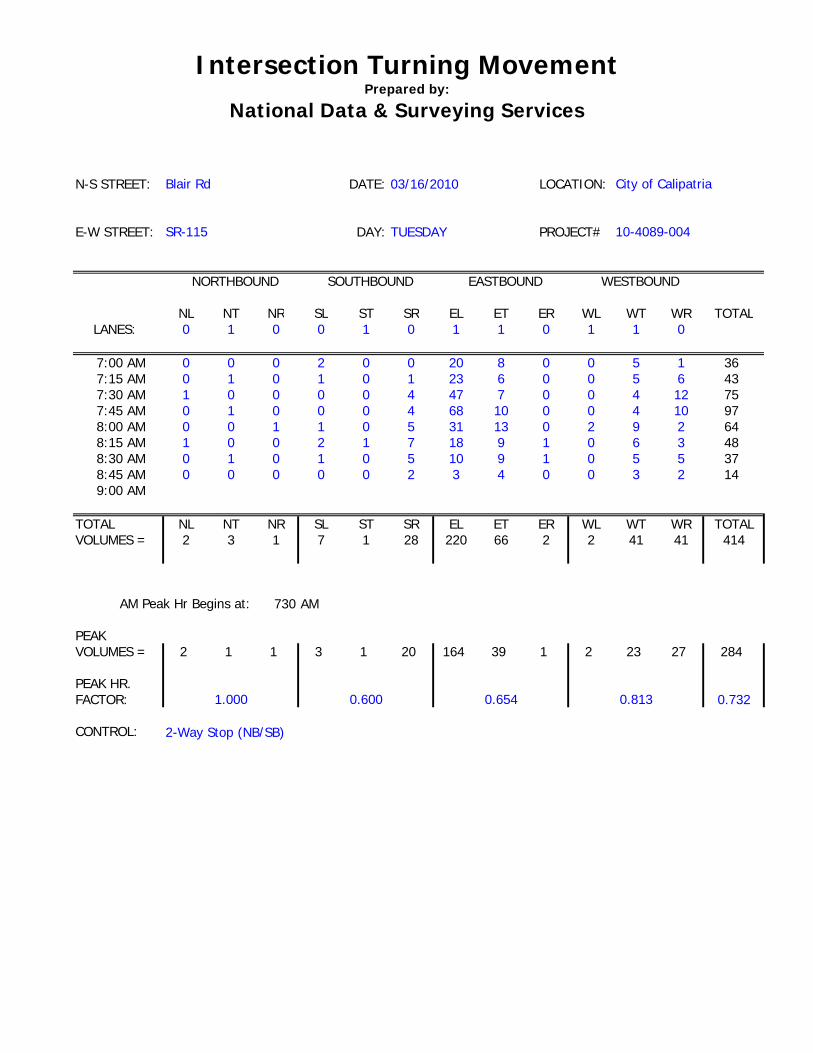
Existing intersection lane configurations and peak-hour turning movement traffic volumes, collected in March 2010 and compiled in Appendix A, were used to determine the existing levels of service. The results of the LOS analysis are presented in Table 3. Appendix B contains the corresponding calculation sheets.
Measured against Imperial County’s standards, all study intersections currently operate at an acceptable level of service during the AM and PM peak hours.
TABLE 3 EXISTING INTERSECTION LEVELS OF SERVICE
Intersection Traffic Control Count Date
AM PM
Delay1 LOS Delay1 LOS
1. SR-111/Sinclair Road Side-Street Stop 3/16/2010 10.3 B 9.8 A
2. Blair Road/Sinclair Road Side-Street Stop 3/16/2010 8.6 A 8.6 A
3. Blair Road/Peterson Road Side-Street Stop 3/16/2010 10.4 B 9.8 A
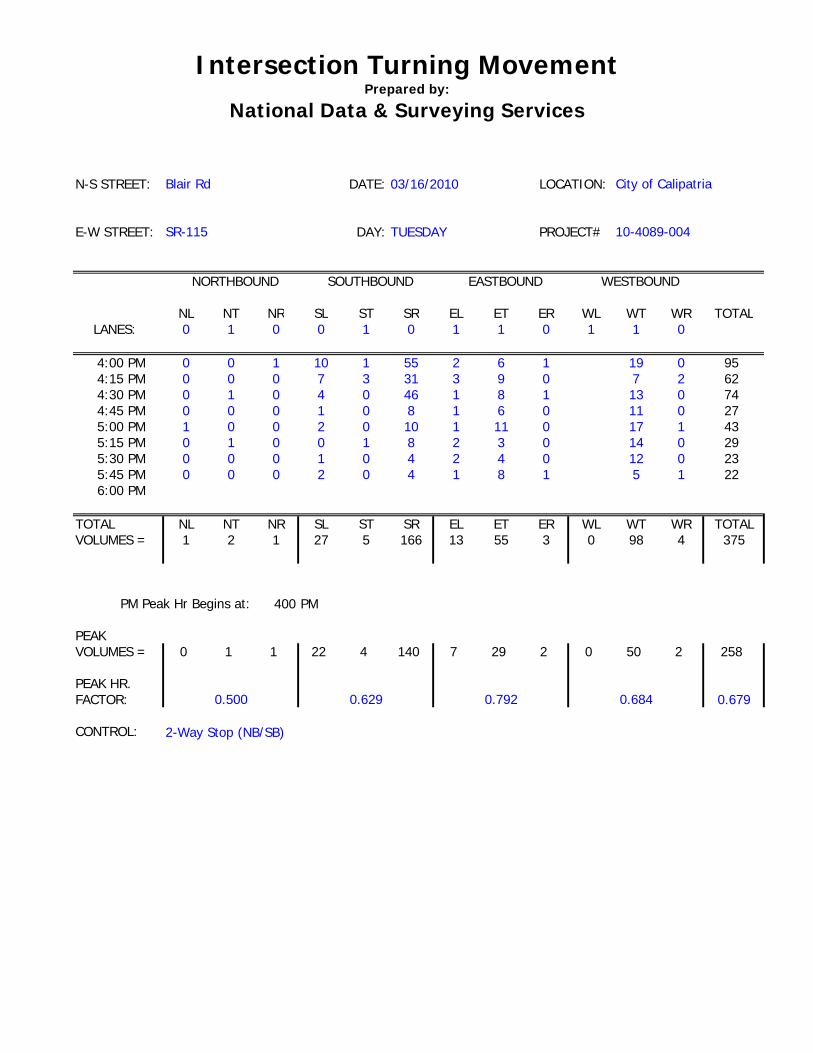
4. Blair Road/SR-115 Side-Street Stop 3/16/2010 13.2 B 9.6 A
Notes: 1 Whole intersection weighted average control delay expressed in seconds per vehicle calculated using methods described
in the 2000 HCM. Total control delay for the worst movement is presented for side-street stop-controlled intersections. 2 LOS = Level of service. LOS calculations conducted using the Traffix level of service analysis software package.
Unacceptable operations are shown in bold typeface.
Source: Fehr & Peers, 2011
Calipatria Solar Farm TIA March 2011
6
EXISTING SIGNAL WARRANT ANALYSIS
The peak-hour signal warrant from the Manual on Uniform Traffic Control Devices (MUTCD) was evaluated for the four unsignalized study intersections to determine if a traffic signal is warranted. The result of the peak-hour warrant analysis indicated that none of the intersections satisfy the minimum volume thresholds. In general, an unsignalized intersection with one lane in each direction would need a minimum of 400 peak hour trips in both the north-south and east-west directions. The peak-hour traffic that we collected for study intersections is below 400 peak hour trips in any direction.
EXISTING ROADWAY SEGMENT LEVEL OF SERVICE
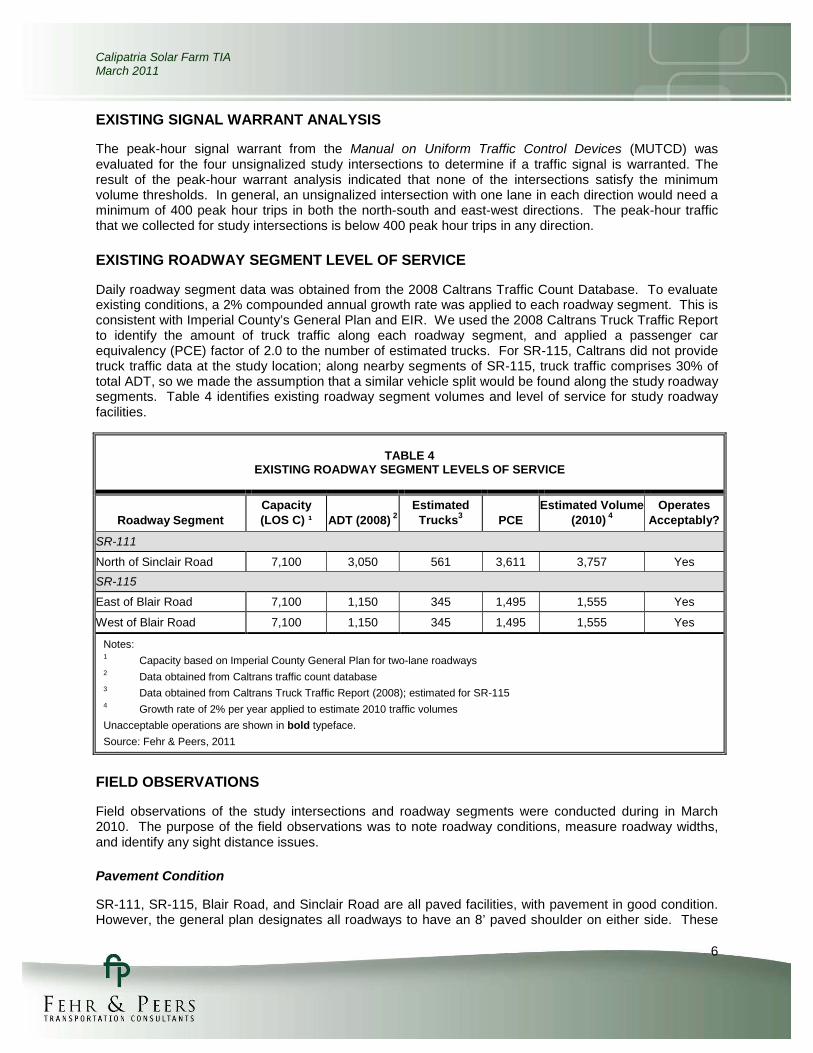
Daily roadway segment data was obtained from the 2008 Caltrans Traffic Count Database. To evaluate existing conditions, a 2% compounded annual growth rate was applied to each roadway segment. This is consistent with Imperial County’s General Plan and EIR. We used the 2008 Caltrans Truck Traffic Report to identify the amount of truck traffic along each roadway segment, and applied a passenger car equivalency (PCE) factor of 2.0 to the number of estimated trucks. For SR-115, Caltrans did not provide truck traffic data at the study location; along nearby segments of SR-115, truck traffic comprises 30% of total ADT, so we made the assumption that a similar vehicle split would be found along the study roadway segments. Table 4 identifies existing roadway segment volumes and level of service for study roadway facilities.
TABLE 4 EXISTING ROADWAY SEGMENT LEVELS OF SERVICE
Roadway Segment Capacity (LOS C) ¹ ADT (2008) 2
Estimated Trucks3 PCE
Estimated Volume (2010) 4
Operates Acceptably?
SR-111
North of Sinclair Road 7,100 3,050 561 3,611 3,757 Yes
SR-115
East of Blair Road 7,100 1,150 345 1,495 1,555 Yes
West of Blair Road 7,100 1,150 345 1,495 1,555 Yes
Notes: 1 Capacity based on Imperial County General Plan for two-lane roadways 2 Data obtained from Caltrans traffic count database 3 Data obtained from Caltrans Truck Traffic Report (2008); estimated for SR-115 4 Growth rate of 2% per year applied to estimate 2010 traffic volumes
Unacceptable operations are shown in bold typeface.
Source: Fehr & Peers, 2011
FIELD OBSERVATIONS
Field observations of the study intersections and roadway segments were conducted during in March 2010. The purpose of the field observations was to note roadway conditions, measure roadway widths, and identify any sight distance issues.
Pavement Condition
SR-111, SR-115, Blair Road, and Sinclair Road are all paved facilities, with pavement in good condition. However, the general plan designates all roadways to have an 8’ paved shoulder on either side. These
Calipatria Solar Farm TIA March 2011
7
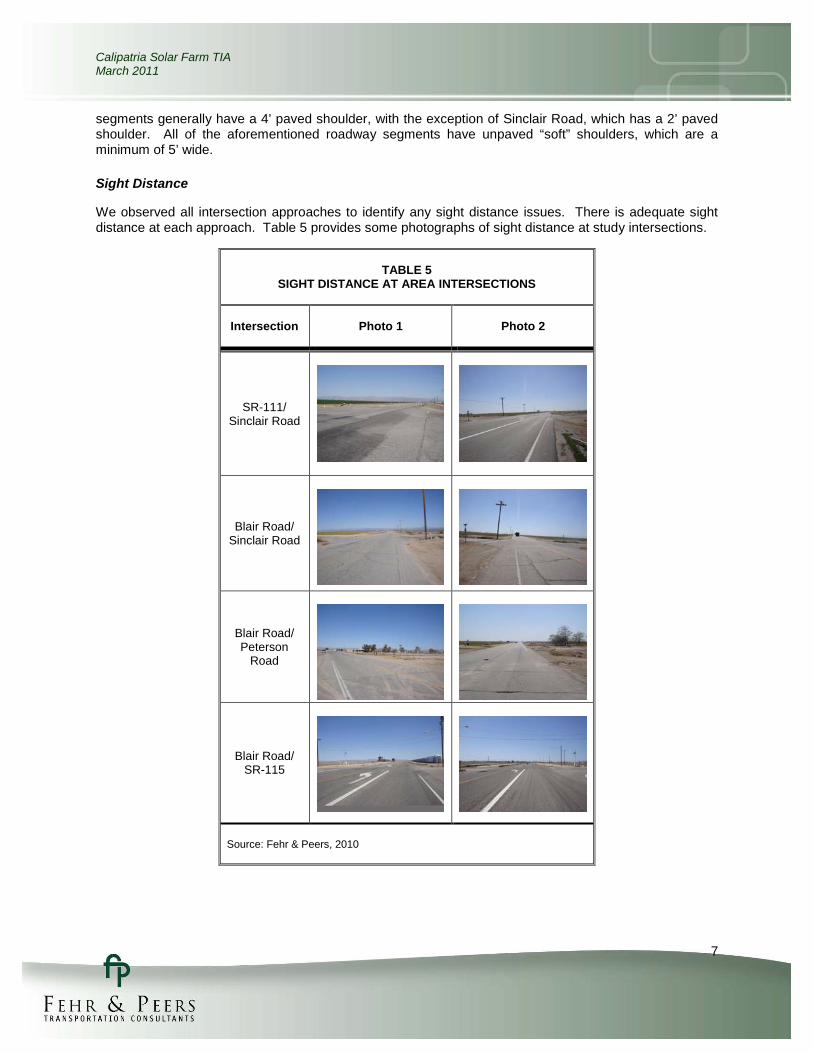
segments generally have a 4’ paved shoulder, with the exception of Sinclair Road, which has a 2’ paved shoulder. All of the aforementioned roadway segments have unpaved “soft” shoulders, which are a minimum of 5’ wide.
Sight Distance
We observed all intersection approaches to identify any sight distance issues. There is adequate sight distance at each approach. Table 5 provides some photographs of sight distance at study intersections.
TABLE 5 SIGHT DISTANCE AT AREA INTERSECTIONS
Intersection Photo 1 Photo 2
SR-111/ Sinclair Road
Blair Road/ Sinclair Road
Blair Road/ Peterson
Road
Blair Road/ SR-115
Source: Fehr & Peers, 2010
Calipatria Solar Farm TIA March 2011
8
3. ANALYSIS PARAMETERS
This chapter outlines the geographic scope of the traffic impact analysis, including the study intersections and roadways, trip generation methodologies, and significance criteria employed in the study.
PROJECT DESCRIPTION
The Calipatria Solar Farms 1 and 2, combined, would be bounded by Peterson Road to the north, Young Road to the south, and Blair Road to the east. Vehicles would take access to the site along Blair Road, where there would be project driveways at its intersections with Montgomery Road and Wilkinson Road. Lindsey Road would serve as a divider between Solar Farm 1 to the south and Solar Farm 2 to the north. Carrick Road, an abandoned north-south roadway, could also be used for project circulation. The Calipatria State Prison, one of the City’s major employers, is located adjacent to the project, near the intersection of Blair Road and Peterson Road.
The project assessment occurs in two phases: Construction and Operations & Maintenance (O&M). The construction phase would begin in 2011 and take less than a year. During this phase, personnel vehicles and delivery trucks carrying construction material would make visits to the site from 8:00am-5:00pm. The project would open in 2011 and would be staffed by a security guard 24 hours per day and four employees during regular business hours, who would maintain the solar panels.
PROJECT STUDY AREA
The project study area is bounded by Sinclair Road to the north, SR-115 to the south, Blair Road to the east, and SR-111 to the west. Roadway segments north of the SR-111/Sinclair Road and east of the Blair Road/SR-115 intersection are also included in the study area. The following intersections are included in the traffic impact analysis:
• SR-111/Sinclair Road
• Blair Road/Sinclair Road
• Blair Road/Peterson Road
• Blair Road/SR-115
The following roadway segments were also evaluated in this analysis:
• SR-111 north of Sinclair Road
• SR-115 west of Blair Road
• SR-115 east of Blair Road
PROJECT TRAFFIC ESTIMATES
The amount of traffic added to the roadway system by the proposed development is estimated using a three-step process: (1) trip generation, (2) trip distribution, and (3) trip assignment. The first step estimates the amount of added traffic to the roadway network. The second step estimates the direction of travel to and from the project site. The trips are assigned to specific street segments and intersection turning movements during the third step. The results of the process for the proposed project are described in the following sections.
Calipatria Solar Farm TIA March 2011
9
Trip Generation
Project impacts were assessed for two phases: Construction and Operations & Maintenance (O&M). The construction phase is planned to take place in 2011 and the project opening year is slated for 2012.
We received employment and trip generation estimates from 8minutenergy in March 2010. For the Construction phase, 8minutenergy supplied the number of personal vehicles and trucks that would be arriving or leaving the site at a given hour. We applied a PCE of 2.0 to all truck trips traveling to and from the project site.
For the O&M phase, 8minutenergy supplied the following personnel information for each project site:
• 3 on-site staff members performing O&M tasks during normal business hours
• 1 security guard during normal business hours
• 1 security guard during 2nd shift
• 1 security guard during 3rd shift
We anticipated that each day-shift staff member would have 4 daily trip ends – one to their respective project site at the start of the shift, one from that site at the end of the trip, and an additional discretionary trip to and from the site for deliveries or a lunch break. We assumed that all staff working the regular shift would arrive on site during the same peak hour, and leave during the same peak hour. The only staff members who would be working outside of regular business hours are the security personnel covering the second and third shift. Because the sites would remain unmanned in their absence, we assumed that these two employees would have two trip ends - one at the start of the shift and one at the end of the shift. The second shift security guard would arrive at the site during the PM peak hour, and the third shift security guard would leave the site during the AM peak hour.
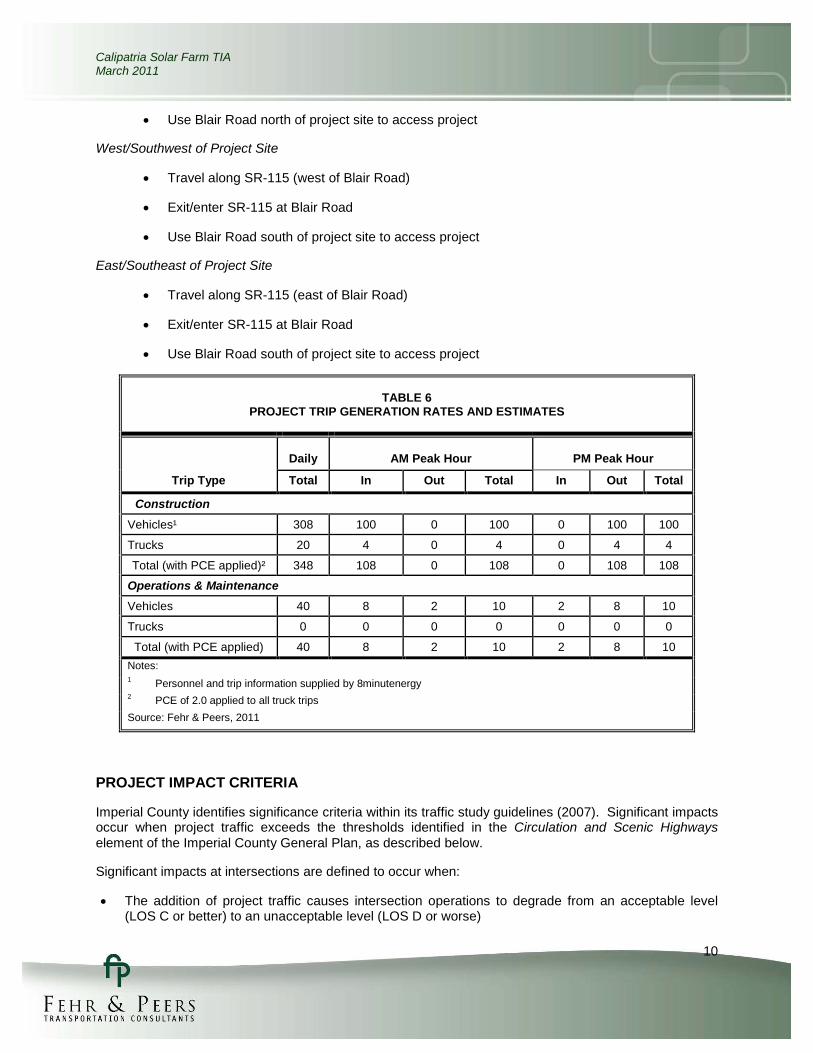
The two projects will be located adjacent to one another with one access point, so trip generation estimates reflect the total project trips for the combined projects. Table 6 identifies the trip generation for the construction and O&M phases.
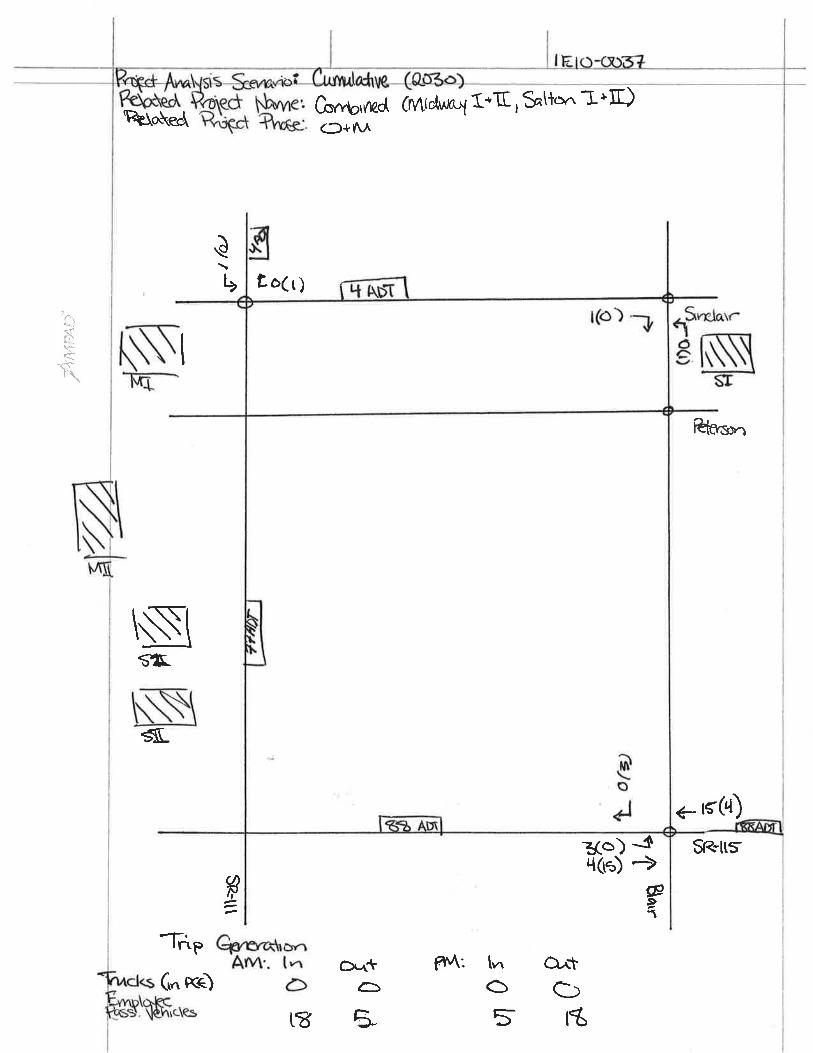
Trip Distribution
Trip distribution estimates were developed for both the Construction and O&M phases. Because both projects would be taking access from the same driveway, we assumed the same trip generation for each project. Construction estimates were based on the potential locations of suppliers and construction personnel. In the construction phase, 100% of trips would originate or be destined for areas north of the project sites using SR-111. Distribution estimates for the O&M phase were developed based on existing travel patterns in the area. During this phase, 70% of trips would originate or be destined to areas south or southwest, 10% east or southeast, and 20% north of the project sites.
Trip Assignment
Trips generated by the projects were assigned to the roadway system based on the directions of approach and departure discussed above. We assumed the following travel paths for trips, which would all access the site from the Blair Road/Montgomery Road intersection:
North of Project Site
• Travel along SR-111
• Exit/enter SR-111 at Sinclair Road
Calipatria Solar Farm TIA March 2011
10
• Use Blair Road north of project site to access project
West/Southwest of Project Site
• Travel along SR-115 (west of Blair Road)
• Exit/enter SR-115 at Blair Road
• Use Blair Road south of project site to access project
East/Southeast of Project Site
• Travel along SR-115 (east of Blair Road)
• Exit/enter SR-115 at Blair Road
• Use Blair Road south of project site to access project
TABLE 6 PROJECT TRIP GENERATION RATES AND ESTIMATES
Trip Type
Daily AM Peak Hour PM Peak Hour
Total In Out Total In Out Total
Construction Vehicles¹ 308 100 0 100 0 100 100
Trucks 20 4 0 4 0 4 4
Total (with PCE applied)² 348 108 0 108 0 108 108
Operations & Maintenance
Vehicles 40 8 2 10 2 8 10
Trucks 0 0 0 0 0 0 0
Total (with PCE applied) 40 8 2 10 2 8 10
Notes: 1 Personnel and trip information supplied by 8minutenergy 2 PCE of 2.0 applied to all truck trips
Source: Fehr & Peers, 2011
PROJECT IMPACT CRITERIA
Imperial County identifies significance criteria within its traffic study guidelines (2007). Significant impacts occur when project traffic exceeds the thresholds identified in the Circulation and Scenic Highways element of the Imperial County General Plan, as described below.
Significant impacts at intersections are defined to occur when:
• The addition of project traffic causes intersection operations to degrade from an acceptable level (LOS C or better) to an unacceptable level (LOS D or worse)
Calipatria Solar Farm TIA March 2011
11
• Project traffic is added to an intersection operating below LOS C
• If an intersection degrades from LOS B or better to LOS C, the project must note this for monitoring purposes
• Additionally, signal warrant analyses must be performed for all unsignalized intersections
Significant impacts at roadway segments are defined to occur when:
• The addition of project traffic causes roadway segment operations to degrade from an acceptable level (LOS C or better) to an unacceptable level (LOS D or worse)
• Project traffic is added to a roadway segment already operating below LOS C
Significant impacts at project access points occur when:
• Project designs for on-site circulation, access, and parking areas fail to meet industry standard design guidelines (consistent with CEQA guidelines)
• Project access creates sight-distance issues that may affect adjacent roadways
Calipatria Solar Farm TIA March 2011
12
4. EXISTING PLUS CONSTRUCTION IMPACT ANALYSIS
This chapter presents the impacts of the proposed projects during the Construction phase on the surrounding roadway system. The Construction phase would occur in 2011, and is therefore being assessed against Existing conditions. Existing plus Construction conditions were evaluated during the weekday AM and PM peak periods at intersections and for daily conditions along roadway segments.
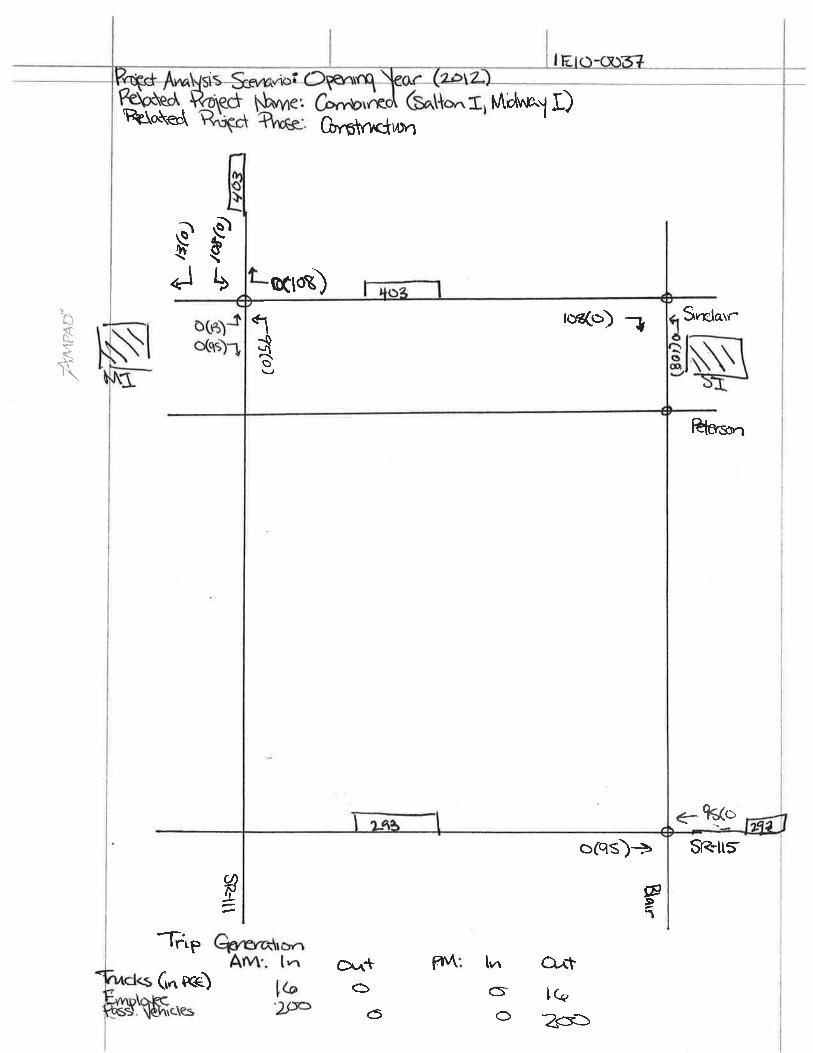
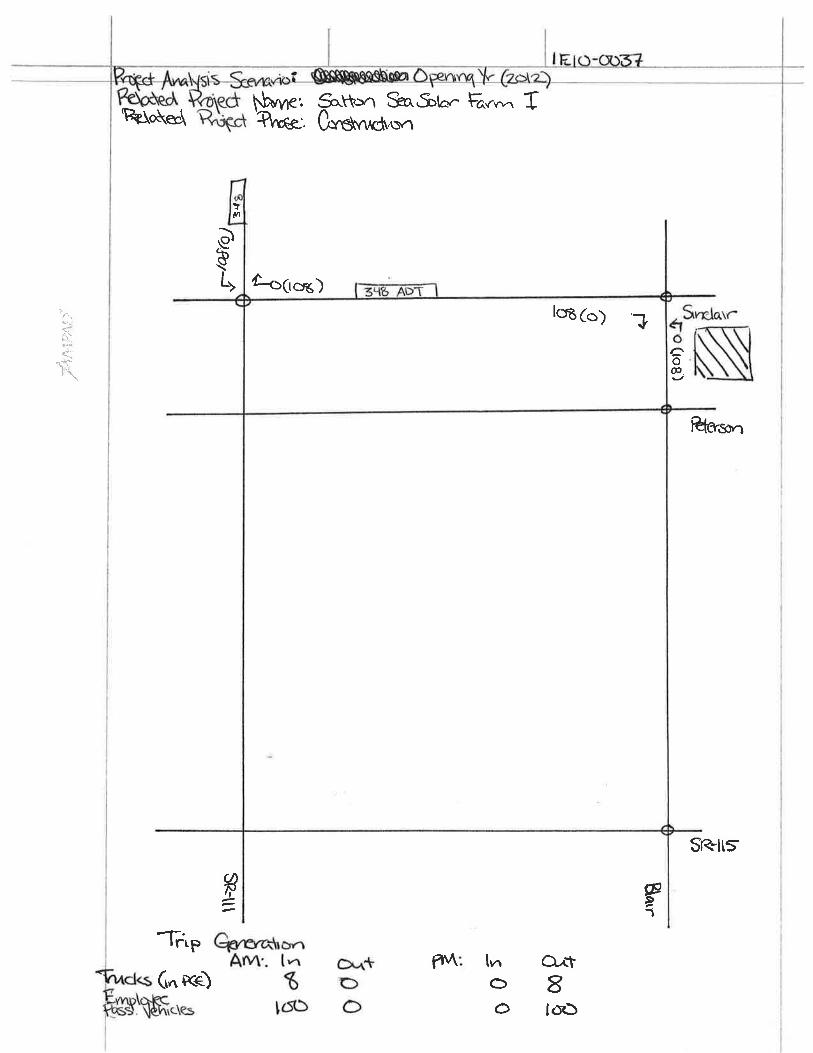
CONSTRUCTION TRAFFIC
Construction trip generation, distribution, and assignment were described in Chapter 3. As noted in this chapter, there would be 108 passenger car equivalents (PCE) traveling to the site during the AM peak hour and 108 PCE traveling from the site during the PM peak hour for the combined projects. Over the course of the day, there would be a total of 348 PCE trip ends. All construction trips would be coming from or going to sites north of the project sites, and would travel along SR-111 north of Sinclair Road.
CONSTRUCTION PHASE INTERSECTION LEVELS OF SERVICE
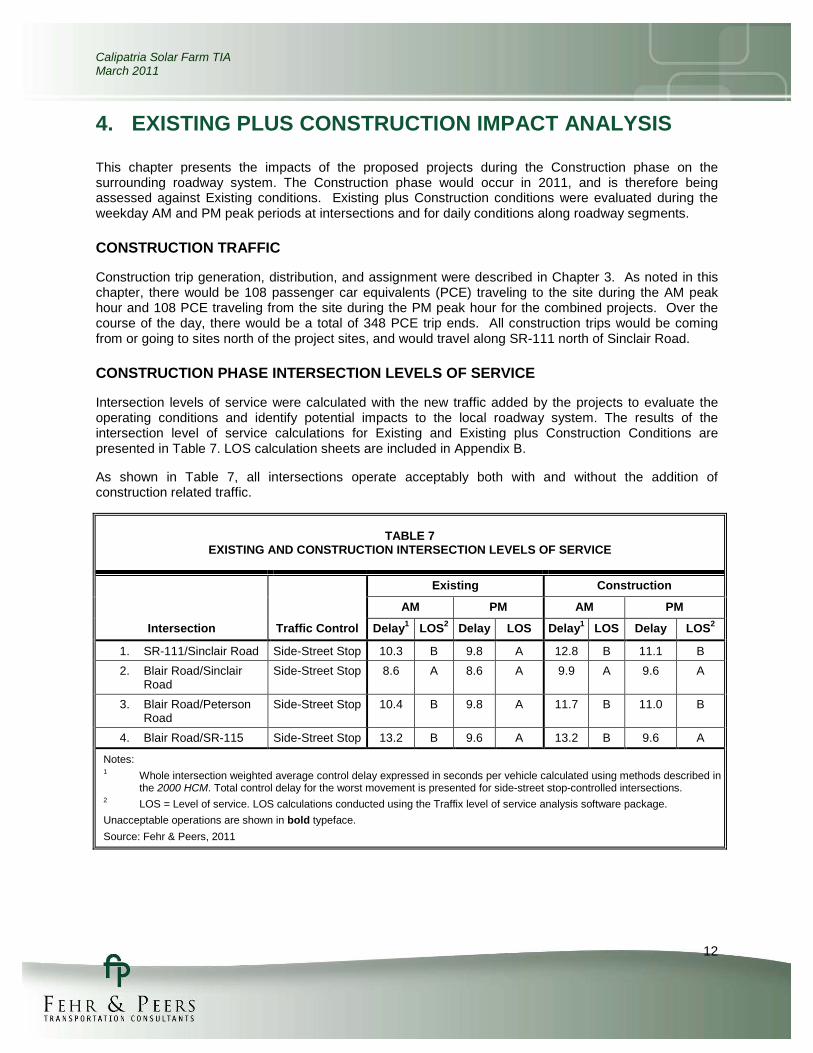
Intersection levels of service were calculated with the new traffic added by the projects to evaluate the operating conditions and identify potential impacts to the local roadway system. The results of the intersection level of service calculations for Existing and Existing plus Construction Conditions are presented in Table 7. LOS calculation sheets are included in Appendix B.
As shown in Table 7, all intersections operate acceptably both with and without the addition of construction related traffic.
TABLE 7 EXISTING AND CONSTRUCTION INTERSECTION LEVELS OF SERVICE
Intersection Traffic Control
Existing Construction
AM PM AM PM
Delay1 LOS2 Delay LOS Delay1 LOS Delay LOS2
1. SR-111/Sinclair Road Side-Street Stop 10.3 B 9.8 A 12.8 B 11.1 B
2. Blair Road/Sinclair Road
Side-Street Stop 8.6 A 8.6 A 9.9 A 9.6 A
3. Blair Road/Peterson Road
Side-Street Stop 10.4 B 9.8 A 11.7 B 11.0 B
4. Blair Road/SR-115 Side-Street Stop 13.2 B 9.6 A 13.2 B 9.6 A
Notes: 1 Whole intersection weighted average control delay expressed in seconds per vehicle calculated using methods described in
the 2000 HCM. Total control delay for the worst movement is presented for side-street stop-controlled intersections. 2 LOS = Level of service. LOS calculations conducted using the Traffix level of service analysis software package.
Unacceptable operations are shown in bold typeface.
Source: Fehr & Peers, 2011
Calipatria Solar Farm TIA March 2011
13
PROJECT SIGNAL WARRANT ANALYSIS
The peak-hour signal warrant from the Manual on Uniform Traffic Control Devices (MUTCD) was evaluated for the four unsignalized study intersections to determine if a traffic signal would be warranted under Construction Conditions. The result of the peak-hour warrant analysis indicated that both intersections do not satisfy the minimum volume thresholds.
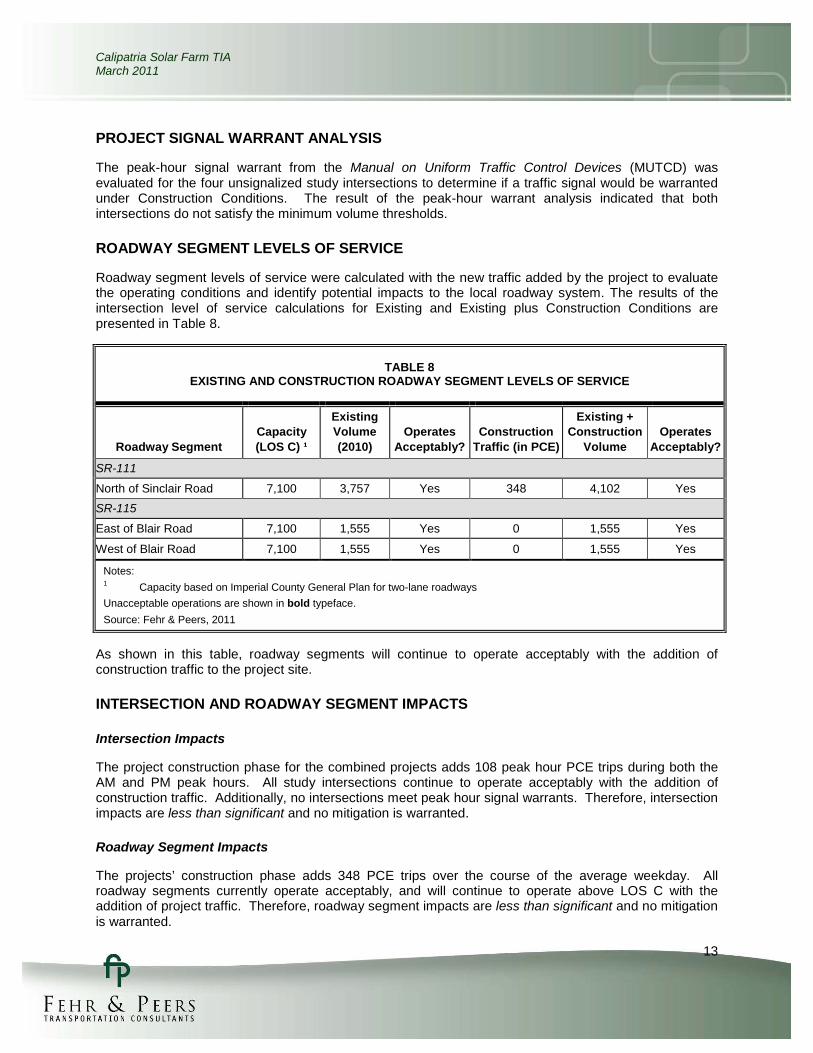
ROADWAY SEGMENT LEVELS OF SERVICE
Roadway segment levels of service were calculated with the new traffic added by the project to evaluate the operating conditions and identify potential impacts to the local roadway system. The results of the intersection level of service calculations for Existing and Existing plus Construction Conditions are presented in Table 8.
TABLE 8 EXISTING AND CONSTRUCTION ROADWAY SEGMENT LEVELS OF SERVICE
Roadway Segment Capacity (LOS C) ¹
Existing Volume (2010)
Operates Acceptably?
Construction Traffic (in PCE)
Existing + Construction
Volume Operates
Acceptably?
SR-111
North of Sinclair Road 7,100 3,757 Yes 348 4,102 Yes
SR-115
East of Blair Road 7,100 1,555 Yes 0 1,555 Yes
West of Blair Road 7,100 1,555 Yes 0 1,555 Yes
Notes: 1 Capacity based on Imperial County General Plan for two-lane roadways
Unacceptable operations are shown in bold typeface.
Source: Fehr & Peers, 2011
As shown in this table, roadway segments will continue to operate acceptably with the addition of construction traffic to the project site.
INTERSECTION AND ROADWAY SEGMENT IMPACTS
Intersection Impacts
The project construction phase for the combined projects adds 108 peak hour PCE trips during both the AM and PM peak hours. All study intersections continue to operate acceptably with the addition of construction traffic. Additionally, no intersections meet peak hour signal warrants. Therefore, intersection impacts are less than significant and no mitigation is warranted.
Roadway Segment Impacts
The projects’ construction phase adds 348 PCE trips over the course of the average weekday. All roadway segments currently operate acceptably, and will continue to operate above LOS C with the addition of project traffic. Therefore, roadway segment impacts are less than significant and no mitigation is warranted.
Calipatria Solar Farm TIA March 2011
14
PROPOSED SITE ACCESS
As proposed, a project driveway would be located at the intersection of Montgomery Road and Blair Road. This access point would serve both solar farms. Carrick Road, an abandoned roadway which runs north-south, divides each solar farm into an east and west portion. Currently, neither Montgomery Road nor Carrick Road is paved. Additionally, there is a sign marking no through access along Montgomery Road, and portions of Carrick Road are restricted to vehicles.
The width of the unpaved roads is approximately 24’. This is wide enough to allow vehicular travel in both directions. The project’s impacts to site access are therefore less than significant and no mitigation is warranted.
SIGHT DISTANCE IMPACTS
The project is composed of two proposed solar farms, with no tall structures that would block sight distance for those traveling proximate to the project site. Currently, no sight distance issues exist near the project sites or at any project study facilities. Therefore, sight distance impacts associated with the projects are less than significant and no mitigation is warranted.
Calipatria Solar Farm TIA March 2011
15
5. PROJECT OPENING YEAR (2012) IMPACT ANALYSIS
This chapter discusses traffic conditions during the Project Opening Year (2011) with and without the proposed projects. During the opening year, project traffic would consist of Operations & Maintenance (O&M) staff and site security guards. Opening Year conditions reflect anticipated traffic operations after background growth.
BACKGROUND GROWTH
A compounded annual growth rate of 2% was applied to all traffic count volumes at study intersections and along roadway segments. This is consistent with the Imperial County’s Circulation & Scenic Highways Element for roadways below 25,000 ADT. Additionally, there are currently four solar farms that are planned to be under construction in 2012. We applied the traffic generated by these projects to the study facilities.
OPENING YEAR ROADWAY IMPROVEMENTS
No roadway improvements were included under Opening Year (2012).
PROJECT TRAFFIC
Project trip generation, distribution, and assignment were described in Chapter 3. As noted in this chapter, there would be 10 project trip ends during the AM peak hour (8 in, 2 out) and 10 project trip ends traveling from the site during the PM peak hour (2 in, 8 out). Over the course of the day, there would be a total of 40 project trip ends. 70% of trips would eventually travel along SR-115 west of the site, 10% along SR-115 east of the site, and 20% along SR-111 north of the site.
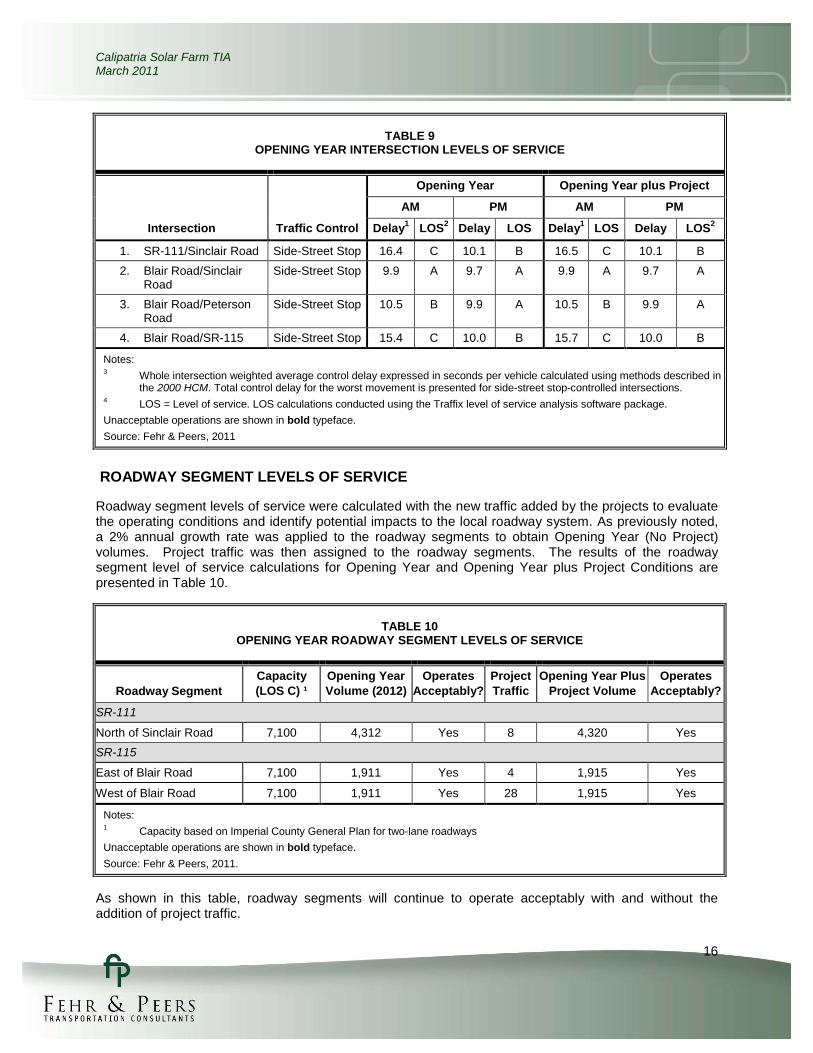
OPENING YEAR INTERSECTION LEVELS OF SERVICE
Intersection operations were evaluated with level of service calculations under Opening Year (2012) and Opening Year (2012) with Project Conditions. Results are summarized in Table 9.
As shown in Table 9, all intersections continue to operate acceptably with the addition of projects’ traffic.
OPENING YEAR SIGNAL WARRANT ANALYSIS
The peak-hour signal warrant from the Manual on Uniform Traffic Control Devices (MUTCD) was evaluated for all study intersections to determine if the installation of a traffic signal is warranted. The result of the peak-hour warrant analysis indicated that none of the intersections warrant a traffic signal under Opening Year or Opening Year with Project scenarios, since these scenarios do not meet minimum traffic volumes for a signal to be necessary.
Calipatria Solar Farm TIA March 2011
16
ROADWAY SEGMENT LEVELS OF SERVICE
Roadway segment levels of service were calculated with the new traffic added by the projects to evaluate the operating conditions and identify potential impacts to the local roadway system. As previously noted, a 2% annual growth rate was applied to the roadway segments to obtain Opening Year (No Project) volumes. Project traffic was then assigned to the roadway segments. The results of the roadway segment level of service calculations for Opening Year and Opening Year plus Project Conditions are presented in Table 10.
TABLE 10 OPENING YEAR ROADWAY SEGMENT LEVELS OF SERVICE
Roadway Segment Capacity (LOS C) ¹
Opening Year Volume (2012)
Operates Acceptably?
Project Traffic
Opening Year Plus Project Volume
Operates Acceptably?
SR-111
North of Sinclair Road 7,100 4,312 Yes 8 4,320 Yes
SR-115
East of Blair Road 7,100 1,911 Yes 4 1,915 Yes
West of Blair Road 7,100 1,911 Yes 28 1,915 Yes
Notes: 1 Capacity based on Imperial County General Plan for two-lane roadways
Unacceptable operations are shown in bold typeface.
Source: Fehr & Peers, 2011.
As shown in this table, roadway segments will continue to operate acceptably with and without the addition of project traffic.
TABLE 9 OPENING YEAR INTERSECTION LEVELS OF SERVICE
Intersection Traffic Control
Opening Year Opening Year plus Project
AM PM AM PM
Delay1 LOS2 Delay LOS Delay1 LOS Delay LOS2
1. SR-111/Sinclair Road Side-Street Stop 16.4 C 10.1 B 16.5 C 10.1 B
2. Blair Road/Sinclair Road
Side-Street Stop 9.9 A 9.7 A 9.9 A 9.7 A
3. Blair Road/Peterson Road
Side-Street Stop 10.5 B 9.9 A 10.5 B 9.9 A
4. Blair Road/SR-115 Side-Street Stop 15.4 C 10.0 B 15.7 C 10.0 B
Notes: 3 Whole intersection weighted average control delay expressed in seconds per vehicle calculated using methods described in
the 2000 HCM. Total control delay for the worst movement is presented for side-street stop-controlled intersections. 4 LOS = Level of service. LOS calculations conducted using the Traffix level of service analysis software package.
Unacceptable operations are shown in bold typeface.
Source: Fehr & Peers, 2011
Calipatria Solar Farm TIA March 2011
17
INTERSECTION AND ROADWAY SEGMENT IMPACTS
Intersection Impacts
The projects’ O&M phase adds 10 peak hour trips during both the AM and PM peak hours. However, all study intersections continue to operate acceptably with the addition of project traffic. Additionally, no intersections meet peak hour signal warrants. Therefore, intersection impacts are less than significant and no mitigation measures are warranted.
Roadway Segment Impacts
The projects’ O&M phase adds 40 daily trips. All roadway segments currently operate acceptably, and will continue to operate at LOS C or better with the addition of project traffic. Therefore, roadway segment impacts are less than significant and no mitigation measures are warranted.
PROPOSED SITE ACCESS
As proposed, project driveways would be located at the intersections of Blair Road & Wilkinson Road for Calipatria Solar Farm I and Blair Road & Montgomery Road for Calipatria Solar Farm II. Carrick Road, an abandoned roadway which runs north-south, divides each solar farm into an east and west portion. Currently, Wilkinson Road, Montgomery Road and Carrick Road are unpaved. Additionally, there is a sign marking no through access along Montgomery Road, and portions of Carrick Road are restricted to vehicles.
The width of the unpaved roads is approximately 24’. This is wide enough to allow vehicular travel in both directions. The project’s impacts to site access are therefore less than significant and no mitigation is warranted.
SIGHT DISTANCE IMPACTS
The project is composed of two proposed solar farms, with no tall structures that would block sight distance for those traveling proximate to the project site. Currently, no sight distance issues exist near the project sites or at any project study facilities. Therefore, sight distance impacts associated with the projects are less than significant and no mitigation is warranted.
Calipatria Solar Farm TIA March 2011
18
6. YEAR 2030 CUMULATIVE CONDITIONS
This chapter discusses cumulative traffic conditions both with and without the proposed projects. Year 2035 Cumulative Conditions reflect traffic conditions after the development of all approved, pending, and foreseeable projects in the study area plus regional growth over the next 20 years.
YEAR 2030 CUMULATIVE VOLUMES
The Imperial County General Plan contains traffic forecasts through year 2025, which were projected using the CalexGP+ Model. The County’s traffic study guidelines require a 2030 cumulative year. In absence of County-specified traffic forecasts, we applied a 2% annual growth rate to all study intersections and roadway segments, consistent with the forecasting method used by the CalexGP+ model.
Additionally, we included Operations and Management (O&M) phase traffic from related solar farms near the project site. There are currently four solar farms that are planned to be operating prior to 2030. We applied the traffic generated by these projects to the study facilities.
CUMULATIVE YEAR ROADWAY IMPROVEMENTS
No roadway improvements were included under Year 2030 Cumulative Conditions. The Imperial County General Plan recommends the widening of Blair Road between Peterson and SR-115 from 2-lanes to 4-lanes and Sinclair Road west of SR-111 from 2-lanes to 6-lanes, both by 2050. Since it is unclear whether these improvements would occur prior to year 2030, we maintained a conservative analysis by not including these improvements.
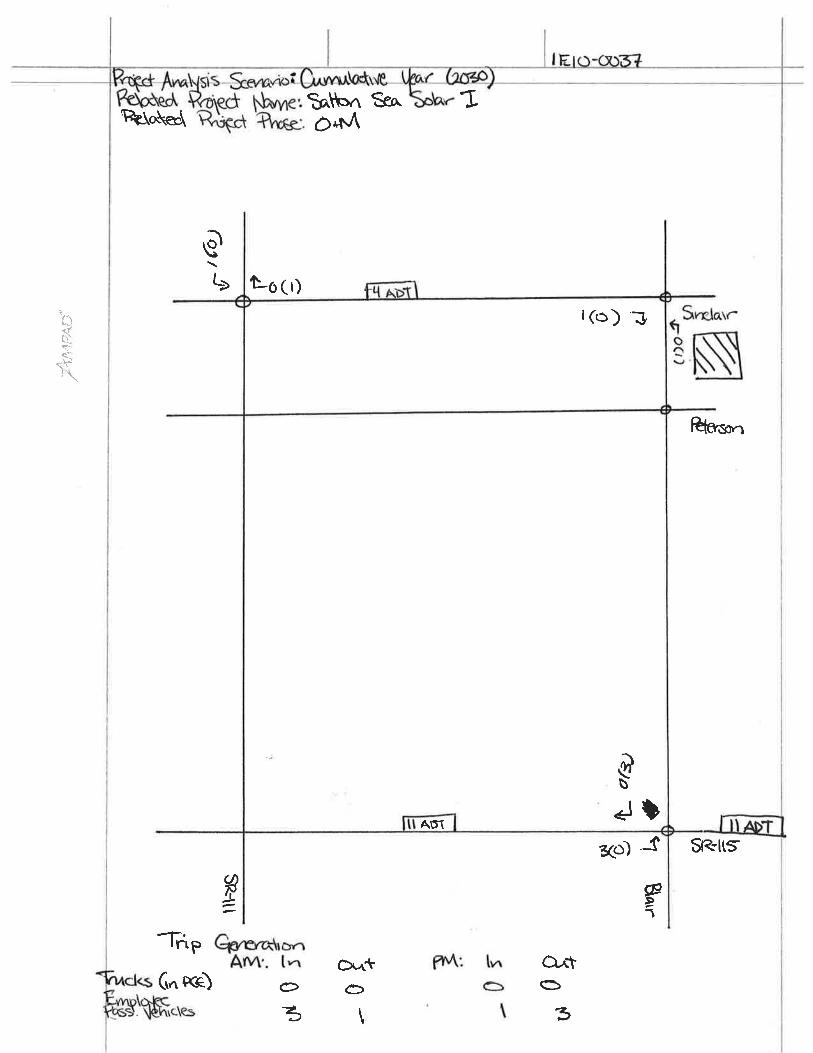
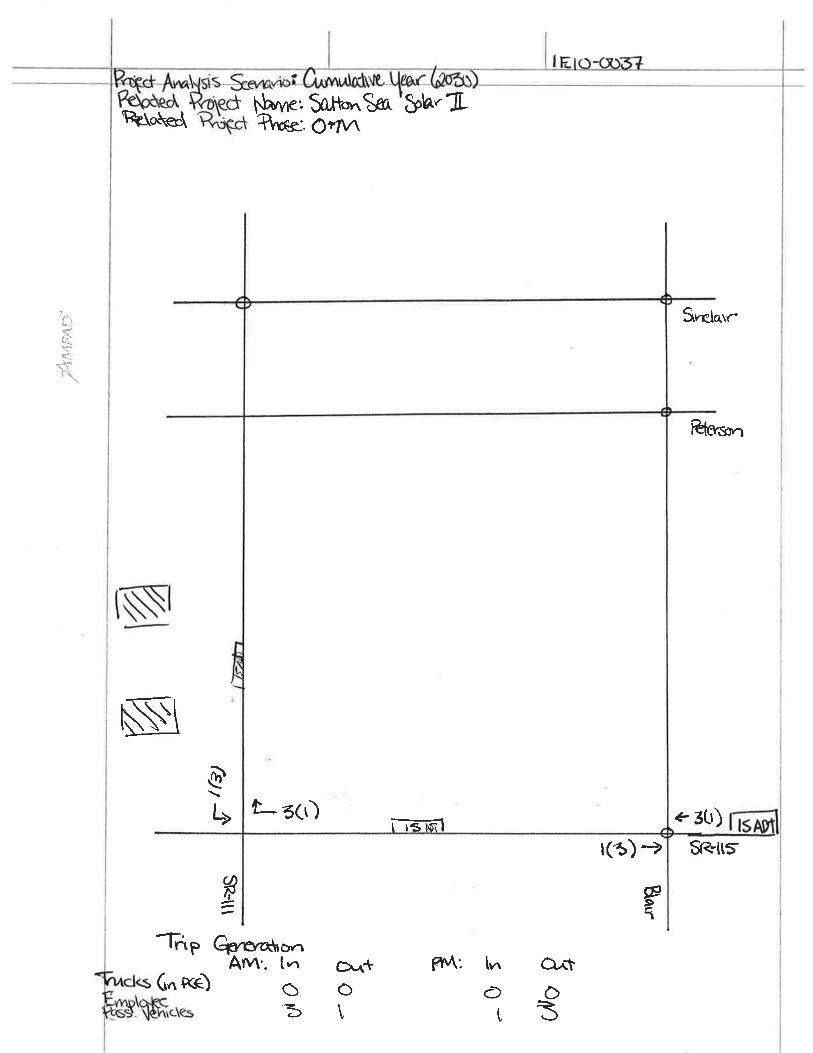
PROJECT TRAFFIC
Project trip generation, distribution, and assignment were described in Chapter 3. As noted in this chapter, there would be 10 project trip ends during the AM peak hour (8 in, 2 out) and 10 project trip ends traveling from the site during the PM peak hour (2 in, 8 out). Over the course of the day, there would be a total of 40 project trip ends. 70% of trips would eventually travel along SR-115 west of the site, 10% along SR-115 east of the site, and 20% along SR-111 north of the site.
YEAR 2030 CUMULATIVE INTERSECTION LEVELS OF SERVICE
Intersection operations were evaluated with level of service calculations under Cumulative Year (2030) and Cumulative Year (2030) with Project Conditions. Results are summarized in Table 11.
As shown in Table 11, all intersections continue to operate acceptably with the addition of project traffic. It should be noted that under Cumulative Conditions, both with and without Project, Blair Road/SR-115 operates at LOS C.
CUMULATIVE YEAR SIGNAL WARRANT ANALYSIS
The peak-hour signal warrant from the Manual on Uniform Traffic Control Devices (MUTCD) was evaluated for all study intersections to determine if the installation of a traffic signal is warranted. The result of the peak-hour warrant analysis indicated that none of the intersections warrant a traffic signal under Cumulative Year or Cumulative Year with Project scenarios, since these scenarios do not meet minimum traffic volumes for a signal to be necessary.
Calipatria Solar Farm TIA March 2011
19
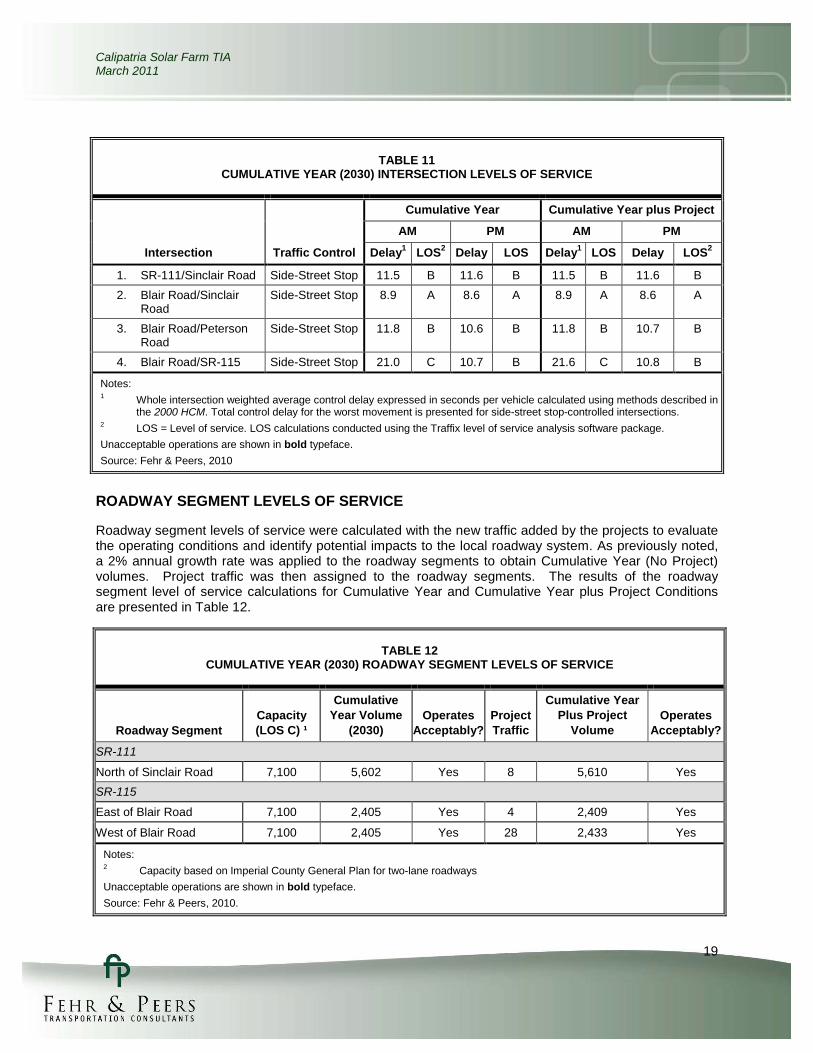
ROADWAY SEGMENT LEVELS OF SERVICE
Roadway segment levels of service were calculated with the new traffic added by the projects to evaluate the operating conditions and identify potential impacts to the local roadway system. As previously noted, a 2% annual growth rate was applied to the roadway segments to obtain Cumulative Year (No Project) volumes. Project traffic was then assigned to the roadway segments. The results of the roadway segment level of service calculations for Cumulative Year and Cumulative Year plus Project Conditions are presented in Table 12.
TABLE 12 CUMULATIVE YEAR (2030) ROADWAY SEGMENT LEVELS OF SERVICE
Roadway Segment Capacity (LOS C) ¹
Cumulative Year Volume
(2030) Operates
Acceptably? Project Traffic
Cumulative Year Plus Project
Volume Operates
Acceptably?
SR-111
North of Sinclair Road 7,100 5,602 Yes 8 5,610 Yes
SR-115
East of Blair Road 7,100 2,405 Yes 4 2,409 Yes
West of Blair Road 7,100 2,405 Yes 28 2,433 Yes
Notes: 2 Capacity based on Imperial County General Plan for two-lane roadways
Unacceptable operations are shown in bold typeface.
Source: Fehr & Peers, 2010.
TABLE 11 CUMULATIVE YEAR (2030) INTERSECTION LEVELS OF SERVICE
Intersection Traffic Control
Cumulative Year Cumulative Year plus Project
AM PM AM PM
Delay1 LOS2 Delay LOS Delay1 LOS Delay LOS2
1. SR-111/Sinclair Road Side-Street Stop 11.5 B 11.6 B 11.5 B 11.6 B
2. Blair Road/Sinclair Road
Side-Street Stop 8.9 A 8.6 A 8.9 A 8.6 A
3. Blair Road/Peterson Road
Side-Street Stop 11.8 B 10.6 B 11.8 B 10.7 B
4. Blair Road/SR-115 Side-Street Stop 21.0 C 10.7 B 21.6 C 10.8 B
Notes: 1 Whole intersection weighted average control delay expressed in seconds per vehicle calculated using methods described in
the 2000 HCM. Total control delay for the worst movement is presented for side-street stop-controlled intersections. 2 LOS = Level of service. LOS calculations conducted using the Traffix level of service analysis software package.
Unacceptable operations are shown in bold typeface.
Source: Fehr & Peers, 2010
Calipatria Solar Farm TIA March 2011
20
As shown in this table, roadway segments will continue to operate acceptably with and without the addition of project traffic.
INTERSECTION AND ROADWAY SEGMENT IMPACTS
Intersection Impacts
The project O&M phase adds 10 peak hour trips during both the AM and PM peak hours. All study intersections continue to operate acceptably with the addition of project traffic under Cumulative (2030) conditions. Additionally, no intersections meet peak hour signal warrants. Therefore, intersection impacts are less than significant and no mitigation is warranted.
Roadway Segment Impacts
The project O&M phase adds 40 daily trips. All roadway segments will continue to operate acceptably under Cumulative (2030) conditions, and will continue to operate above LOS C with the addition of project traffic. Therefore, roadway segment impacts are less than significant and no mitigation is warranted.
PROPOSED SITE ACCESS
As proposed, project driveways would be located at the intersections of Blair Road & Wilkinson Road for Calipatria Solar Farm I and Blair Road & Montgomery Road for Calipatria Solar Farm II. Carrick Road, an abandoned roadway which runs north-south, divides each solar farm into an east and west portion. Currently, Wilkinson Road, Montgomery Road and Carrick Road are unpaved. Additionally, there is a sign marking no through access along Montgomery Road, and portions of Carrick Road are restricted to vehicles.
The width of the unpaved roads is approximately 24’. This is wide enough to allow vehicular travel in both directions. The project’s impacts to site access are therefore less than significant and no mitigation is warranted.
SIGHT DISTANCE IMPACTS
The project is composed of two proposed solar farms, with no tall structures that would block sight distance for those traveling proximate to the project site. Currently, no sight distance issues exist near the project sites or at any project study facilities. Therefore, sight distance impacts associated with the projects are less than significant and no mitigation is warranted.
APPENDIX A: EXISTING TRAFFIC COUNTS
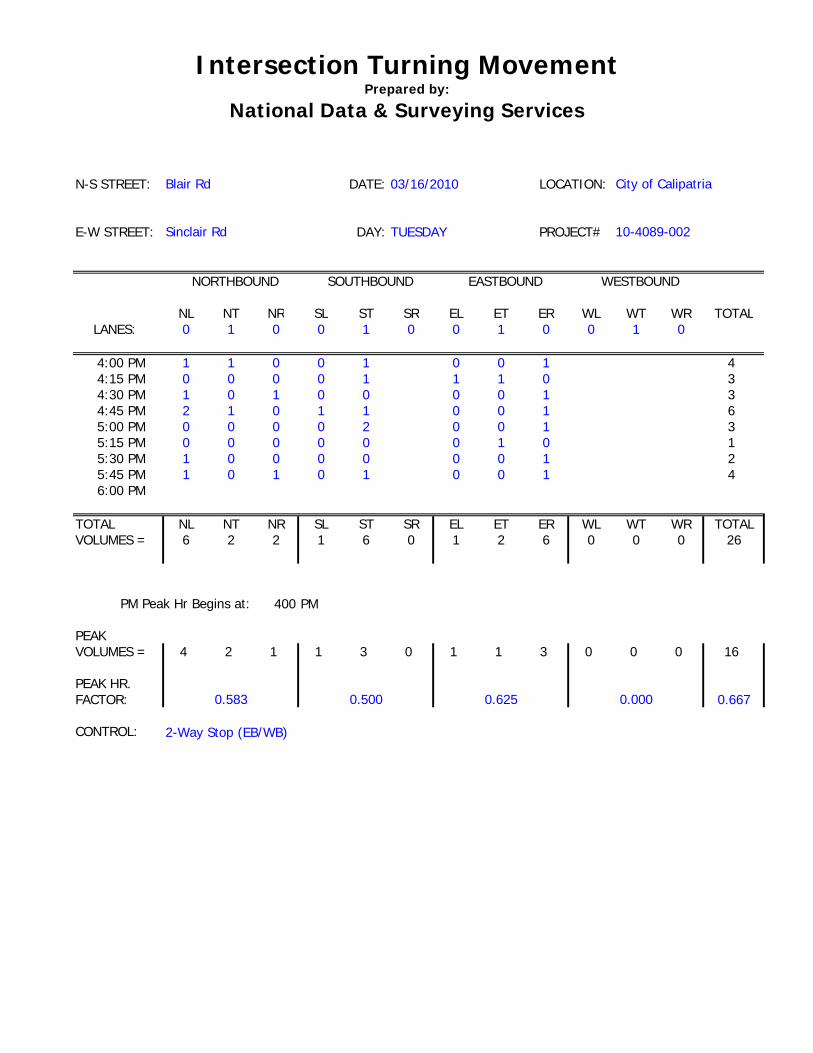
Intersection Turning MovementPrepared by:
National Data & Surveying Services
N-S STREET: DATE: 03/16/2010 LOCATION:
E-W STREET: DAY: TUESDAY PROJECT#
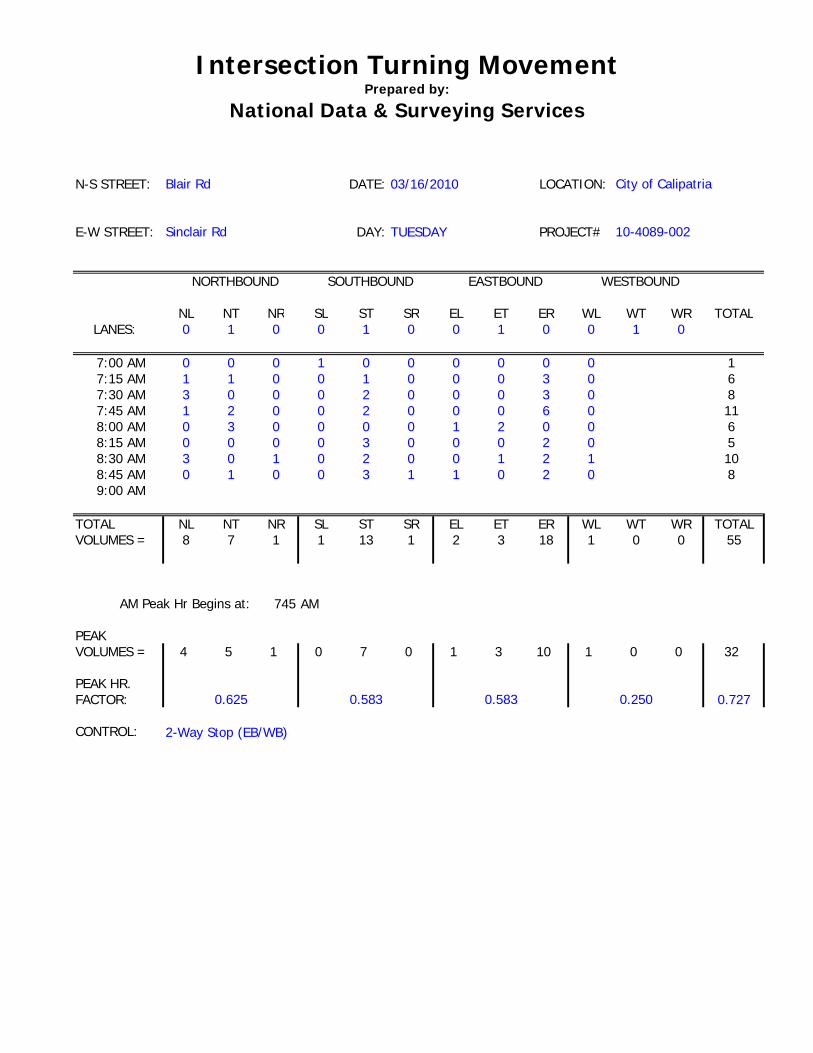
NL NT NR SL ST SR EL ET ER WL WT WR TOTAL
LANES: 0 1 0 0 1 0 0 1 0 0 1 0
7:00 AM 0 0 0 1 0 0 0 0 0 0 17:15 AM 1 1 0 0 1 0 0 0 3 0 67:30 AM 3 0 0 0 2 0 0 0 3 0 87:45 AM 1 2 0 0 2 0 0 0 6 0 118:00 AM 0 3 0 0 0 0 1 2 0 0 68:15 AM 0 0 0 0 3 0 0 0 2 0 58:30 AM 3 0 1 0 2 0 0 1 2 1 108:45 AM 0 1 0 0 3 1 1 0 2 0 89:00 AM
TOTAL NL NT NR SL ST SR EL ET ER WL WT WR TOTALVOLUMES = 8 7 1 1 13 1 2 3 18 1 0 0 55
nb a nb d sb a sb d eb a eb d wb a nb d16 9 15 32 23 5 1 9
745 AM
PEAKVOLUMES = 4 5 1 0 7 0 1 3 10 1 0 0 32
PEAK HR.FACTOR: 0.727
CONTROL:
EASTBOUND
0.625 0.583 0.583
2-Way Stop (EB/WB)
AM Peak Hr Begins at:
City of Calipatria
0.250
WESTBOUND
Blair Rd
Sinclair Rd
NORTHBOUND SOUTHBOUND
10-4089-002
Intersection Turning MovementPrepared by:
National Data & Surveying Services
N-S STREET: DATE: 03/16/2010 LOCATION:
E-W STREET: DAY: TUESDAY PROJECT#
NL NT NR SL ST SR EL ET ER WL WT WR TOTAL
LANES: 0 1 0 0 1 0 0 1 0 0 1 0
4:00 PM 1 1 0 0 1 0 0 1 44:15 PM 0 0 0 0 1 1 1 0 34:30 PM 1 0 1 0 0 0 0 1 34:45 PM 2 1 0 1 1 0 0 1 65:00 PM 0 0 0 0 2 0 0 1 35:15 PM 0 0 0 0 0 0 1 0 15:30 PM 1 0 0 0 0 0 0 1 25:45 PM 1 0 1 0 1 0 0 1 46:00 PM
TOTAL NL NT NR SL ST SR EL ET ER WL WT WR TOTALVOLUMES = 6 2 2 1 6 0 1 2 6 0 0 0 26
nb a nb d sb a sb d eb a eb d wb a nb d10 3 7 12 9 5 0 6
400 PM
PEAKVOLUMES = 4 2 1 1 3 0 1 1 3 0 0 0 16
PEAK HR.FACTOR: 0.667
CONTROL:
10-4089-002
PM Peak Hr Begins at:
City of Calipatria
0.000
WESTBOUND
Blair Rd
Sinclair Rd
NORTHBOUND SOUTHBOUND EASTBOUND
0.583 0.500 0.625
2-Way Stop (EB/WB)

Intersection Turning MovementPrepared by:
National Data & Surveying Services
N-S STREET: DATE: LOCATION:
E-W STREET: DAY: NEED DATE PROJECT#
NL NT NR SL ST SR EL ET ER WL WT WR TOTAL
LANES:
12:00 AM 12:15 AM12:30 AM12:45 AM1:00 AM1:15 AM1:30 AM1:45 AM2:00 AM2:15 AM2:30 AM2:45 AM3:00 AM3:15 AM3:30 AM3:45 AM4:00 AM4:15 AM4:30 AM4:45 AM5:00 AM5:15 AM5:30 AM5:45 AM6:00 AM6:15 AM6:30 AM6:45 AM7:00 AM7:15 AM7:30 AM7:45 AM8:00 AM8:15 AM8:30 AM8:45 AM9:00 AM9:15 AM9:30 AM9:45 AM
10:00 AM10:15 AM10:30 AM10:45 AM11:00 AM11:15 AM11:30 AM11:45 AM12:00 PM12:15 PM12:30 PM12:45 PM1:00 PM1:15 PM1:30 PM1:45 PM2:00 PM2:15 PM2:30 PM2:45 PM3:00 PM3:15 PM3:30 PM3:45 PM4:00 PM4:15 PM4:30 PM4:45 PM5:00 PM5:15 PM5:30 PM5:45 PM6:00 PM6:15 PM6:30 PM6:45 PM7:00 PM7:15 PM7:30 PM7:45 PM8:00 PM8:15 PM8:30 PM8:45 PM9:00 PM9:15 PM9:30 PM9:45 PM
10:00 PM10:15 PM10:30 PM10:45 PM11:00 PM11:15 PM11:30 PM11:45 PM
TOTAL NL NT NR SL ST SR EL ET ER WL WT WR TOTALVOLUMES = 0 0 0 0 0 0 0 0 0 0 0 0 0
nb a nb d sb a sb d eb a eb d wb a nb d0 0 0 0 0 0 0 0
0 AM
PEAKVOLUMES = 0 0 0 0 0 0 0 0 0 0 0 0 0
PEAK HR.FACTOR: 0.000
CONTROL:
NOON Peak Hr Begins at:
0.000
WESTBOUND NORTHBOUND SOUTHBOUND EASTBOUND
0.000 0.000 0.000
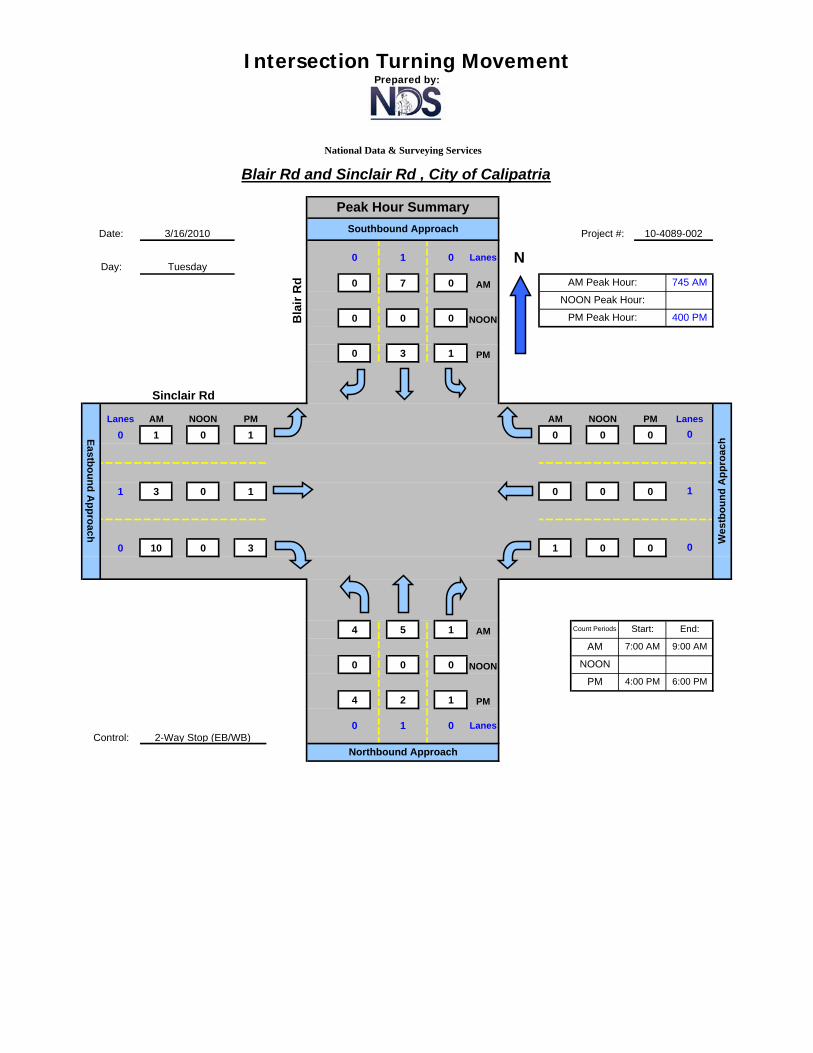
Intersection Turning MovementPrepared by:
National Data & Surveying Services
0 1 0 Lanes N
0 7 0 AM
0 0 0 NOON
0 3 1 PM
Lanes AM NOON PM AM NOON PM
0 1 0 1 0 0 0
1 3 0 1 0 0 0
0 10 0 3 1 0 0
4 5 1 AM
0 0 0 NOON
4 2 1 PM
745 AMAM Peak Hour:
PM Peak Hour:
NOON Peak Hour:
400 PM
End:
9:00 AM7:00 AM
Northbound Approach
0 1 0 Lanes
PM
12:00 AM 12:00 AM
4:00 PM 6:00 PM
AM
NOON
Count Periods Start:
Blair Rd and Sinclair Rd , City of Calipatria
10-4089-002
Ea
stb
ou
nd
Ap
pro
ac
h
Peak Hour Summary
Southbound Approach Project #:3/16/2010Date:
Control: 2-Way Stop (EB/WB)
Bla
ir R
d
Sinclair Rd
TuesdayDay:
We
stb
ou
nd
Ap
pro
ac
h
Lanes
0
1
0

Intersection Turning MovementPrepared by:
National Data & Surveying Services
IN OUT N
7 6 13 AM
0 0 0 NOON
4 3 7 PM
AM NOON PM AM NOON PM
18 0 9 5 0 3
IN 14 0 5 1 0 0
OUT 4 0 4 4 0 3
10 18 28 AM
0 0 0 NOON
7 6 13 PM
Blair Rd and Sinclair Rd , City of Calipatria
Project #: 10-4089-002
745 AM
Total IN & OUT
IN / OUT Peak Hour Summary
AM Peak Hour:
NOON Peak Hour:
400 PM
PM 4:00 PM 6:00 PM
NOON
Total IN & OUT
IN
OUT
End:
PM Peak Hour:
Southbound Approach
Bla
ir R
d
Sinclair Rd
Date:
Day:
3/16/2010
Tuesday
Ea
stb
ou
nd
Ap
pro
ac
hControl:
Total IN & OUT
We
stb
ou
nd
Ap
pro
ac
h
2-Way Stop (EB/WB)
12:00 AM 12:00 AM
AM 7:00 AM 9:00 AM
Count Periods Start:
Northbound Approach
IN OUTTotal IN &
OUT
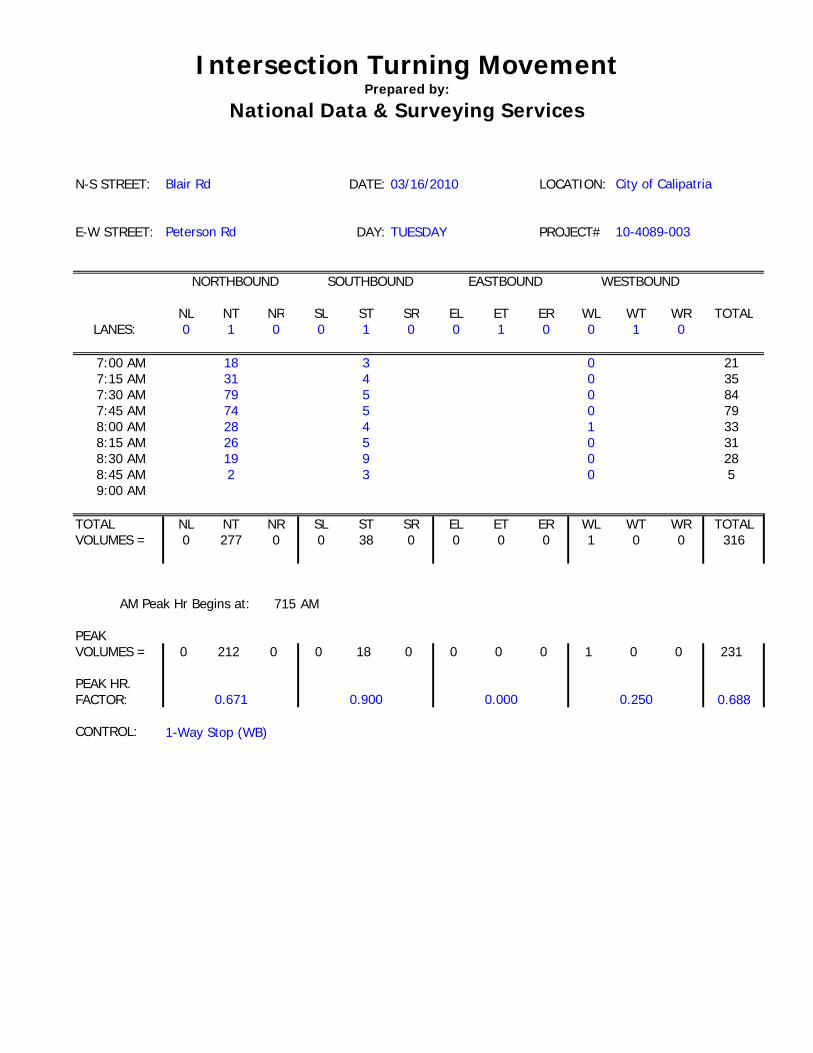
Intersection Turning MovementPrepared by:
National Data & Surveying Services
N-S STREET: DATE: 03/16/2010 LOCATION:
E-W STREET: DAY: TUESDAY PROJECT#
NL NT NR SL ST SR EL ET ER WL WT WR TOTAL
LANES: 0 1 0 0 1 0 0 1 0 0 1 0
7:00 AM 18 3 0 217:15 AM 31 4 0 357:30 AM 79 5 0 847:45 AM 74 5 0 798:00 AM 28 4 1 338:15 AM 26 5 0 318:30 AM 19 9 0 288:45 AM 2 3 0 59:00 AM
TOTAL NL NT NR SL ST SR EL ET ER WL WT WR TOTALVOLUMES = 0 277 0 0 38 0 0 0 0 1 0 0 316
nb a nb d sb a sb d eb a eb d wb a nb d277 277 38 39 0 0 1 0
715 AM
PEAKVOLUMES = 0 212 0 0 18 0 0 0 0 1 0 0 231
PEAK HR.FACTOR: 0.688
CONTROL:
EASTBOUND
0.671 0.900 0.000
1-Way Stop (WB)
AM Peak Hr Begins at:
City of Calipatria
0.250
WESTBOUND
Blair Rd
Peterson Rd
NORTHBOUND SOUTHBOUND
10-4089-003
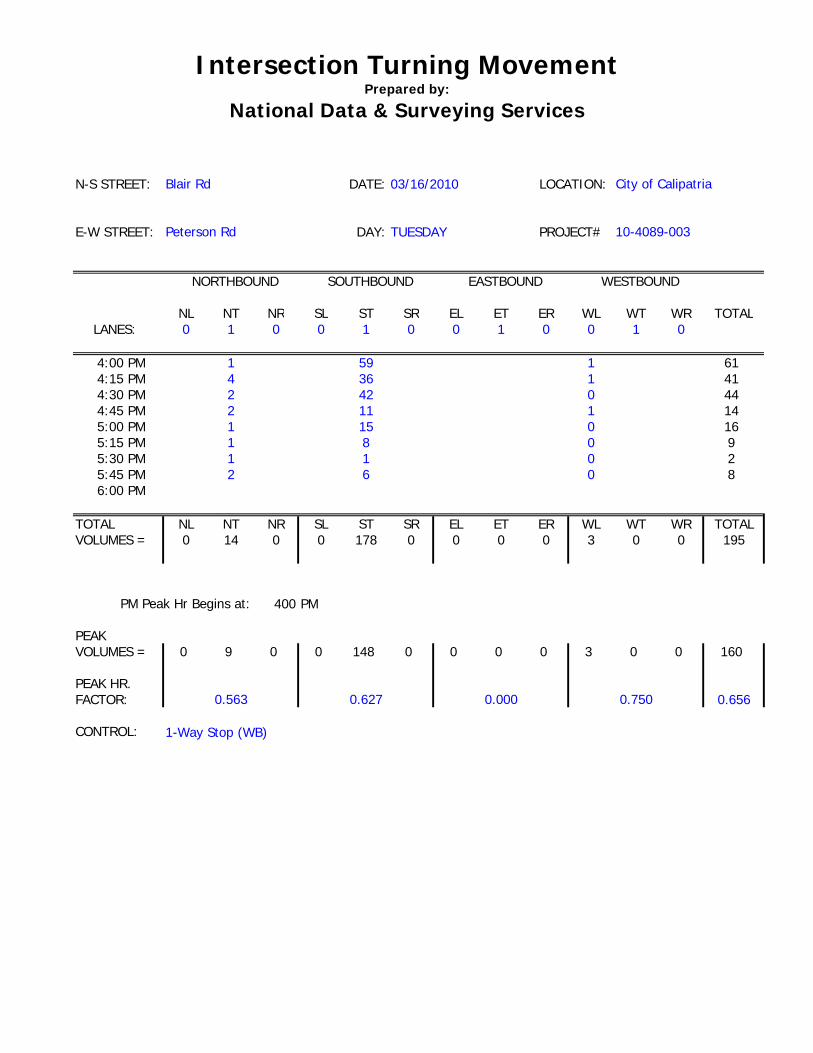
Intersection Turning MovementPrepared by:
National Data & Surveying Services
N-S STREET: DATE: 03/16/2010 LOCATION:
E-W STREET: DAY: TUESDAY PROJECT#
NL NT NR SL ST SR EL ET ER WL WT WR TOTAL
LANES: 0 1 0 0 1 0 0 1 0 0 1 0
4:00 PM 1 59 1 614:15 PM 4 36 1 414:30 PM 2 42 0 444:45 PM 2 11 1 145:00 PM 1 15 0 165:15 PM 1 8 0 95:30 PM 1 1 0 25:45 PM 2 6 0 86:00 PM
TOTAL NL NT NR SL ST SR EL ET ER WL WT WR TOTALVOLUMES = 0 14 0 0 178 0 0 0 0 3 0 0 195
nb a nb d sb a sb d eb a eb d wb a nb d14 14 178 181 0 0 3 0
400 PM
PEAKVOLUMES = 0 9 0 0 148 0 0 0 0 3 0 0 160
PEAK HR.FACTOR: 0.656
CONTROL:
10-4089-003
PM Peak Hr Begins at:
City of Calipatria
0.750
WESTBOUND
Blair Rd
Peterson Rd
NORTHBOUND SOUTHBOUND EASTBOUND
0.563 0.627 0.000
1-Way Stop (WB)
Intersection Turning MovementPrepared by:
National Data & Surveying Services
0 1 0 Lanes N
0 18 0 AM
0 0 0 NOON
0 148 0 PM
Lanes AM NOON PM AM NOON PM
0 0 0 0 0 0 0
1 0 0 0 0 0 0
0 0 0 0 1 0 3
0 212 0 AM
0 0 0 NOON
0 9 0 PM
715 AMAM Peak Hour:
PM Peak Hour:
NOON Peak Hour:
400 PM
End:
9:00 AM7:00 AM
Northbound Approach
0 1 0 Lanes
PM
12:00 AM 12:00 AM
4:00 PM 6:00 PM
AM
NOON
Count Periods Start:
Blair Rd and Peterson Rd , City of Calipatria
10-4089-003
Ea
stb
ou
nd
Ap
pro
ac
h
Peak Hour Summary
Southbound Approach Project #:3/16/2010Date:
Control: 1-Way Stop (WB)
Bla
ir R
d
Peterson Rd
TuesdayDay:
We
stb
ou
nd
Ap
pro
ac
h
Lanes
0
1
0
Intersection Turning MovementPrepared by:
National Data & Surveying Services
IN OUT N
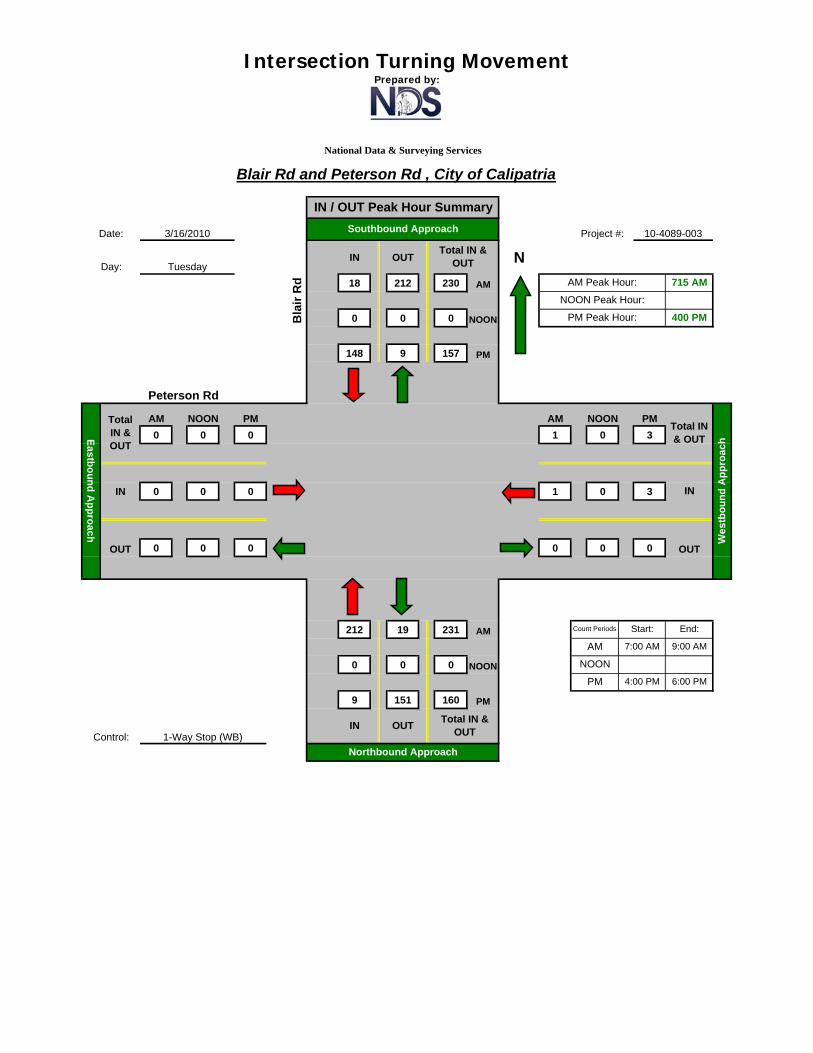
18 212 230 AM
0 0 0 NOON
148 9 157 PM
AM NOON PM AM NOON PM
0 0 0 1 0 3
IN 0 0 0 1 0 3
OUT 0 0 0 0 0 0
212 19 231 AM
0 0 0 NOON
9 151 160 PM
Blair Rd and Peterson Rd , City of Calipatria
Project #: 10-4089-003
715 AM
Total IN & OUT
IN / OUT Peak Hour Summary
AM Peak Hour:
NOON Peak Hour:
400 PM
PM 4:00 PM 6:00 PM
NOON
Total IN & OUT
IN
OUT
End:
PM Peak Hour:
Southbound Approach
Bla
ir R
d
Peterson Rd
Date:
Day:
3/16/2010
Tuesday
Ea
stb
ou
nd
Ap
pro
ac
hControl:
Total IN & OUT
We
stb
ou
nd
Ap
pro
ac
h
1-Way Stop (WB)
12:00 AM 12:00 AM
AM 7:00 AM 9:00 AM
Count Periods Start:
Northbound Approach
IN OUTTotal IN &
OUT
Intersection Turning MovementPrepared by:
National Data & Surveying Services
N-S STREET: DATE: 03/16/2010 LOCATION:
E-W STREET: DAY: TUESDAY PROJECT#
NL NT NR SL ST SR EL ET ER WL WT WR TOTAL
LANES: 0 1 0 0 1 0 1 1 0 1 1 0
7:00 AM 0 0 0 2 0 0 20 8 0 0 5 1 367:15 AM 0 1 0 1 0 1 23 6 0 0 5 6 437:30 AM 1 0 0 0 0 4 47 7 0 0 4 12 757:45 AM 0 1 0 0 0 4 68 10 0 0 4 10 978:00 AM 0 0 1 1 0 5 31 13 0 2 9 2 648:15 AM 1 0 0 2 1 7 18 9 1 0 6 3 488:30 AM 0 1 0 1 0 5 10 9 1 0 5 5 378:45 AM 0 0 0 0 0 2 3 4 0 0 3 2 149:00 AM
TOTAL NL NT NR SL ST SR EL ET ER WL WT WR TOTALVOLUMES = 2 3 1 7 1 28 220 66 2 2 41 41 414
nb a nb d sb a sb d eb a eb d wb a nb d6 264 36 5 288 74 84 71
730 AM
PEAKVOLUMES = 2 1 1 3 1 20 164 39 1 2 23 27 284
PEAK HR.FACTOR: 0.732
CONTROL:
EASTBOUND
1.000 0.600 0.654
2-Way Stop (NB/SB)
AM Peak Hr Begins at:
City of Calipatria
0.813
WESTBOUND
Blair Rd
SR-115
NORTHBOUND SOUTHBOUND
10-4089-004
Intersection Turning MovementPrepared by:
National Data & Surveying Services
N-S STREET: DATE: 03/16/2010 LOCATION:
E-W STREET: DAY: TUESDAY PROJECT#
NL NT NR SL ST SR EL ET ER WL WT WR TOTAL
LANES: 0 1 0 0 1 0 1 1 0 1 1 0
4:00 PM 0 0 1 10 1 55 2 6 1 19 0 954:15 PM 0 0 0 7 3 31 3 9 0 7 2 624:30 PM 0 1 0 4 0 46 1 8 1 13 0 744:45 PM 0 0 0 1 0 8 1 6 0 11 0 275:00 PM 1 0 0 2 0 10 1 11 0 17 1 435:15 PM 0 1 0 0 1 8 2 3 0 14 0 295:30 PM 0 0 0 1 0 4 2 4 0 12 0 235:45 PM 0 0 0 2 0 4 1 8 1 5 1 226:00 PM
TOTAL NL NT NR SL ST SR EL ET ER WL WT WR TOTALVOLUMES = 1 2 1 27 5 166 13 55 3 0 98 4 375
nb a nb d sb a sb d eb a eb d wb a nb d4 19 198 8 71 83 102 265
400 PM
PEAKVOLUMES = 0 1 1 22 4 140 7 29 2 0 50 2 258
PEAK HR.FACTOR: 0.679
CONTROL:
10-4089-004
PM Peak Hr Begins at:
City of Calipatria
0.684
WESTBOUND
Blair Rd
SR-115
NORTHBOUND SOUTHBOUND EASTBOUND
0.500 0.629 0.792
2-Way Stop (NB/SB)
Intersection Turning MovementPrepared by:
National Data & Surveying Services
0 1 0 Lanes N
20 1 3 AM
0 0 0 NOON
140 4 22 PM
Lanes AM NOON PM AM NOON PM
1 164 0 7 27 0 2
1 39 0 29 23 0 50
0 1 0 2 2 0 0
2 1 1 AM
0 0 0 NOON
0 1 1 PM
730 AMAM Peak Hour:
PM Peak Hour:
NOON Peak Hour:
400 PM
End:
9:00 AM7:00 AM
Northbound Approach
0 1 0 Lanes
PM
12:00 AM 12:00 AM
4:00 PM 6:00 PM
AM
NOON
Count Periods Start:
Blair Rd and SR-115 , City of Calipatria
10-4089-004
Ea
stb
ou
nd
Ap
pro
ac
h
Peak Hour Summary
Southbound Approach Project #:3/16/2010Date:
Control: 2-Way Stop (NB/SB)
Bla
ir R
d
SR-115
TuesdayDay:
We
stb
ou
nd
Ap
pro
ac
h
Lanes
0
1
1
Intersection Turning MovementPrepared by:
National Data & Surveying Services
IN OUT N
24 192 216 AM
0 0 0 NOON
166 10 176 PM
AM NOON PM AM NOON PM
249 0 228 95 0 104
IN 204 0 38 52 0 52
OUT 45 0 190 43 0 52
4 4 8 AM
0 0 0 NOON
2 6 8 PM
Blair Rd and SR-115 , City of Calipatria
Project #: 10-4089-004
730 AM
Total IN & OUT
IN / OUT Peak Hour Summary
AM Peak Hour:
NOON Peak Hour:
400 PM
PM 4:00 PM 6:00 PM
NOON
Total IN & OUT
IN
OUT
End:
PM Peak Hour:
Southbound Approach
Bla
ir R
d
SR-115
Date:
Day:
3/16/2010
Tuesday
Ea
stb
ou
nd
Ap
pro
ac
hControl:
Total IN & OUT
We
stb
ou
nd
Ap
pro
ac
h
2-Way Stop (NB/SB)
12:00 AM 12:00 AM
AM 7:00 AM 9:00 AM
Count Periods Start:
Northbound Approach
IN OUTTotal IN &
OUT
Intersection Turning MovementPrepared by:
National Data & Surveying Services
N-S STREET: DATE: 03/16/2010 LOCATION:
E-W STREET: DAY: TUESDAY PROJECT#
NL NT NR SL ST SR EL ET ER WL WT WR TOTAL
LANES: 1 1 0 1 1 0 0 1 0 0 1 0
7:00 AM 0 8 0 2 8 0 1 0 0 0 0 0 197:15 AM 2 16 0 3 16 1 0 1 1 1 0 0 417:30 AM 2 15 0 2 32 4 0 0 0 0 3 2 607:45 AM 0 19 0 4 35 2 1 1 0 0 2 0 648:00 AM 1 18 0 2 38 0 1 2 1 0 0 1 648:15 AM 3 20 0 1 28 0 0 0 0 0 0 0 528:30 AM 0 18 1 1 34 3 5 1 0 1 0 3 678:45 AM 2 23 1 0 37 0 0 0 0 1 0 1 659:00 AM
TOTAL NL NT NR SL ST SR EL ET ER WL WT WR TOTALVOLUMES = 10 137 2 15 228 10 8 5 2 3 5 7 432
nb a nb d sb a sb d eb a eb d wb a nb d149 152 253 233 15 22 15 25
800 AM
PEAKVOLUMES = 6 79 2 4 137 3 6 3 1 2 0 5 248
PEAK HR.FACTOR: 0.925
CONTROL:
EASTBOUND
0.837 0.900 0.417
2-Way Stop (EB/WB)
AM Peak Hr Begins at:
City of Calipatria
0.438
WESTBOUND
SR-111
Sinclair Rd
NORTHBOUND SOUTHBOUND
10-4089-001
Intersection Turning MovementPrepared by:
National Data & Surveying Services
N-S STREET: DATE: 03/16/2010 LOCATION:
E-W STREET: DAY: TUESDAY PROJECT#
NL NT NR SL ST SR EL ET ER WL WT WR TOTAL
LANES: 1 1 0 1 1 0 0 1 0 0 1 0
4:00 PM 1 44 1 18 1 1 0 0 0 0 4 704:15 PM 0 39 1 24 2 1 0 0 0 0 2 694:30 PM 0 34 0 28 0 3 1 2 0 2 2 724:45 PM 1 30 0 27 1 2 0 0 1 0 1 635:00 PM 0 26 0 25 2 2 1 1 0 0 0 575:15 PM 1 33 3 17 0 4 0 1 0 2 0 615:30 PM 0 35 1 21 1 4 0 0 0 0 0 625:45 PM 0 37 0 22 2 2 0 2 0 1 1 676:00 PM
TOTAL NL NT NR SL ST SR EL ET ER WL WT WR TOTALVOLUMES = 3 278 0 6 182 9 19 2 6 1 5 10 521
nb a nb d sb a sb d eb a eb d wb a nb d281 307 197 189 27 8 16 17
400 PM
PEAKVOLUMES = 2 147 0 2 97 4 7 1 2 1 2 9 274
PEAK HR.FACTOR: 0.951
CONTROL:
10-4089-001
PM Peak Hr Begins at:
City of Calipatria
0.750
WESTBOUND
SR-111
Sinclair Rd
NORTHBOUND SOUTHBOUND EASTBOUND
0.828 0.920 0.417
2-Way Stop (EB/WB)
Intersection Turning MovementPrepared by:
National Data & Surveying Services
N-S STREET: DATE: LOCATION:
E-W STREET: DAY: NEED DATE PROJECT#
NL NT NR SL ST SR EL ET ER WL WT WR TOTAL
LANES:
12:00 AM 12:15 AM12:30 AM12:45 AM1:00 AM1:15 AM1:30 AM1:45 AM2:00 AM2:15 AM2:30 AM2:45 AM3:00 AM3:15 AM3:30 AM3:45 AM4:00 AM4:15 AM4:30 AM4:45 AM5:00 AM5:15 AM5:30 AM5:45 AM6:00 AM6:15 AM6:30 AM6:45 AM7:00 AM7:15 AM7:30 AM7:45 AM8:00 AM8:15 AM8:30 AM8:45 AM9:00 AM9:15 AM9:30 AM9:45 AM
10:00 AM10:15 AM10:30 AM10:45 AM11:00 AM11:15 AM11:30 AM11:45 AM12:00 PM12:15 PM12:30 PM12:45 PM1:00 PM1:15 PM1:30 PM1:45 PM2:00 PM2:15 PM2:30 PM2:45 PM3:00 PM3:15 PM3:30 PM3:45 PM4:00 PM4:15 PM4:30 PM4:45 PM5:00 PM5:15 PM5:30 PM5:45 PM6:00 PM6:15 PM6:30 PM6:45 PM7:00 PM7:15 PM7:30 PM7:45 PM8:00 PM8:15 PM8:30 PM8:45 PM9:00 PM9:15 PM9:30 PM9:45 PM
10:00 PM10:15 PM10:30 PM10:45 PM11:00 PM11:15 PM11:30 PM11:45 PM
TOTAL NL NT NR SL ST SR EL ET ER WL WT WR TOTALVOLUMES = 0 0 0 0 0 0 0 0 0 0 0 0 0
nb a nb d sb a sb d eb a eb d wb a nb d0 0 0 0 0 0 0 0
0 AM
PEAKVOLUMES = 0 0 0 0 0 0 0 0 0 0 0 0 0
PEAK HR.FACTOR: 0.000
CONTROL:
NOON Peak Hr Begins at:
0.000
WESTBOUND NORTHBOUND SOUTHBOUND EASTBOUND
0.000 0.000 0.000
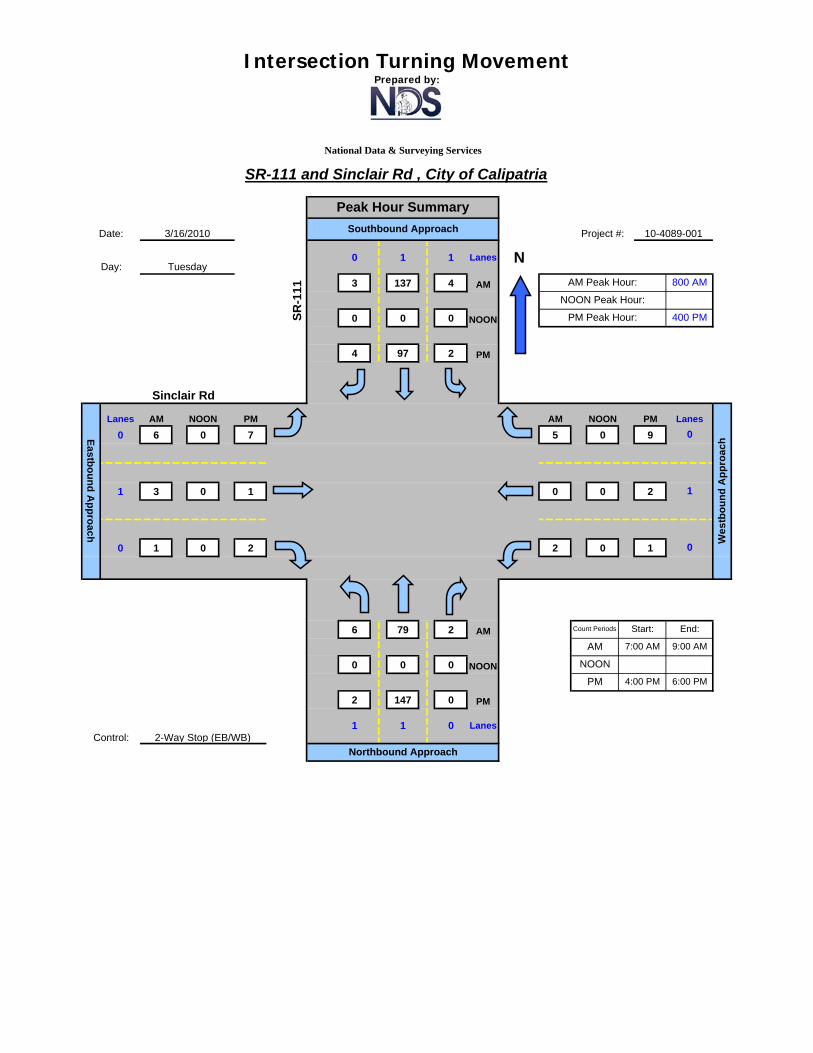
Intersection Turning MovementPrepared by:
National Data & Surveying Services
0 1 1 Lanes N
3 137 4 AM
0 0 0 NOON
4 97 2 PM
Lanes AM NOON PM AM NOON PM
0 6 0 7 5 0 9
1 3 0 1 0 0 2
0 1 0 2 2 0 1
6 79 2 AM
0 0 0 NOON
2 147 0 PM
800 AMAM Peak Hour:
PM Peak Hour:
NOON Peak Hour:
400 PM
End:
9:00 AM7:00 AM
Northbound Approach
1 1 0 Lanes
PM
12:00 AM 12:00 AM
4:00 PM 6:00 PM
AM
NOON
Count Periods Start:
SR-111 and Sinclair Rd , City of Calipatria
10-4089-001
Ea
stb
ou
nd
Ap
pro
ac
h
Peak Hour Summary
Southbound Approach Project #:3/16/2010Date:
Control: 2-Way Stop (EB/WB)
SR
-111
Sinclair Rd
TuesdayDay:
We
stb
ou
nd
Ap
pro
ac
h
Lanes
0
1
0
APPENDIX B: RELATED PROJECT TRIP ASSIGNMENT


APPENDIX C: INTERSECTION LEVEL OF SERVICE CALCULATIONS

COMPARE Wed Mar 24 12:32:55 2010 Page 2-1
Traffix 7.9.0215 Copyright (c) 2008 Dowling Associates, Inc. Licensed to F & P, INLAND EMPIRE
Level Of Service Computation Report 2000 HCM Unsignalized (Future Volume Alternative)
Existing AM
Intersection #1: Sinclair/SR-111 Signal=Uncontrol/Rights=Include
Initial Vol: 3 137 4
Lanes: 0 1 0 0 1
Signal=Stop
Signal=Stop
Initial Vol: Lanes: Rights=Include Vol Cnt Date: 3/16/2010 Rights=Include Lanes: Initial Vol:
6
0
Cycle Time (sec): 100 0
5
0
Loss Time (sec): 0 0
3 1!
Critical V/C: 0.000 1! 0
0
Avg Crit Del (sec/veh): 1.0 0
1 0
Avg Delay (sec/veh): 1.0 0 2
LOS: B
Lanes: 1 0 0 1 0
Initial Vol: 6 79 2
Signal=Uncontrol/Rights=Include
Approach: North Bound South Bound East Bound West Bound
Movement: L - T - R L - T - R L - T - R L - T - R
------------|---------------||---------------||---------------||---------------|
Volume Module: >> Count Date: 16 Mar 2010 << 8am-9am
Base Vol: 6 79 2 4 137 3 6 3 1 2 0 5
Growth Adj: 1.00 1.00 1.00 1.00 1.00 1.00 1.00 1.00 1.00 1.00 1.00 1.00
Initial Bse: 6 79 2 4 137 3 6 3 1 2 0 5
Added Vol: 0 0 0 0 0 0 0 0 0 0 0 0
PasserByVol: 0 0 0 0 0 0 0 0 0 0 0 0
Initial Fut: 6 79 2 4 137 3 6 3 1 2 0 5
User Adj: 1.00 1.00 1.00 1.00 1.00 1.00 1.00 1.00 1.00 1.00 1.00 1.00
PHF Adj: 0.93 0.93 0.93 0.93 0.93 0.93 0.93 0.93 0.93 0.93 0.93 0.93
PHF Volume: 6 85 2 4 148 3 6 3 1 2 0 5
Reduct Vol: 0 0 0 0 0 0 0 0 0 0 0 0
FinalVolume: 6 85 2 4 148 3 6 3 1 2 0 5
------------|---------------||---------------||---------------||---------------|
Critical Gap Module:
Critical Gp: 4.1 xxxx xxxxx 4.1 xxxx xxxxx 7.1 6.5 6.2 7.1 6.5 6.2
FollowUpTim: 2.2 xxxx xxxxx 2.2 xxxx xxxxx 3.5 4.0 3.3 3.5 4.0 3.3
------------|---------------||---------------||---------------||---------------|
Capacity Module:
Cnflict Vol: 151 xxxx xxxxx 88 xxxx xxxxx 261 259 150 260 259 86
Potent Cap.: 1442 xxxx xxxxx 1521 xxxx xxxxx 696 649 902 697 648 978
Move Cap.: 1442 xxxx xxxxx 1521 xxxx xxxxx 689 644 902 690 644 978
Volume/Cap: 0.00 xxxx xxxx 0.00 xxxx xxxx 0.01 0.01 0.00 0.00 0.00 0.01
------------|---------------||---------------||---------------||---------------|
Level Of Service Module:
2Way95thQ: 0.0 xxxx xxxxx 0.0 xxxx xxxxx xxxx xxxx xxxxx xxxx xxxx xxxxx
Control Del: 7.5 xxxx xxxxx 7.4 xxxx xxxxx xxxxx xxxx xxxxx xxxxx xxxx xxxxx
LOS by Move: A * * A * * * * * * * *
Movement: LT - LTR - RT LT - LTR - RT LT - LTR - RT LT - LTR - RT
Shared Cap.: xxxx xxxx xxxxx xxxx xxxx xxxxx xxxx 691 xxxxx xxxx 873 xxxxx
SharedQueue:xxxxx xxxx xxxxx xxxxx xxxx xxxxx xxxxx 0.0 xxxxx xxxxx 0.0 xxxxx
Shrd ConDel:xxxxx xxxx xxxxx xxxxx xxxx xxxxx xxxxx 10.3 xxxxx xxxxx 9.2 xxxxx
Shared LOS: * * * * * * * B * * A *
ApproachDel: xxxxxx xxxxxx 10.3 9.2
ApproachLOS: * * B A
Note: Queue reported is the number of cars per lane.
Peak Hour Delay Signal Warrant Report
********************************************************************************
Intersection #1 Sinclair/SR-111
********************************************************************************
Future Volume Alternative: Peak Hour Warrant NOT Met
------------|---------------||---------------||---------------||---------------|
COMPARE Wed Mar 24 12:32:55 2010 Page 2-2
Traffix 7.9.0215 Copyright (c) 2008 Dowling Associates, Inc. Licensed to F & P, INLAND EMPIRE
Approach: North Bound South Bound East Bound West Bound
Movement: L - T - R L - T - R L - T - R L - T - R
------------|---------------||---------------||---------------||---------------|
Control: Uncontrolled Uncontrolled Stop Sign Stop Sign
Lanes: 1 0 0 1 0 1 0 0 1 0 0 0 1! 0 0 0 0 1! 0 0
Initial Vol: 6 79 2 4 137 3 6 3 1 2 0 5
ApproachDel: xxxxxx xxxxxx 10.3 9.2
------------|---------------||---------------||---------------||---------------|
Approach[eastbound][lanes=1][control=Stop Sign]
Signal Warrant Rule #1: [vehicle-hours=0.0]
FAIL - Vehicle-hours less than 4 for one lane approach.
Signal Warrant Rule #2: [approach volume=10]
FAIL - Approach volume less than 100 for one lane approach.
Signal Warrant Rule #3: [approach count=4][total volume=248]
FAIL - Total volume less than 650 for intersection
with less than four approaches.
--------------------------------------------------------------------------------
Approach[westbound][lanes=1][control=Stop Sign]
Signal Warrant Rule #1: [vehicle-hours=0.0]
FAIL - Vehicle-hours less than 4 for one lane approach.
Signal Warrant Rule #2: [approach volume=7]
FAIL - Approach volume less than 100 for one lane approach.
Signal Warrant Rule #3: [approach count=4][total volume=248]
FAIL - Total volume less than 650 for intersection
with less than four approaches.
--------------------------------------------------------------------------------
SIGNAL WARRANT DISCLAIMER
This peak hour signal warrant analysis should be considered solely as an
"indicator" of the likelihood of an unsignalized intersection warranting
a traffic signal in the future. Intersections that exceed this warrant
are probably more likely to meet one or more of the other volume based
signal warrant (such as the 4-hour or 8-hour warrants).
The peak hour warrant analysis in this report is not intended to replace
a rigorous and complete traffic signal warrant analysis by the responsible
jurisdiction. Consideration of the other signal warrants, which is beyond
the scope of this software, may yield different results.
Peak Hour Volume Signal Warrant Report [Urban]
********************************************************************************
Intersection #1 Sinclair/SR-111
********************************************************************************
Future Volume Alternative: Peak Hour Warrant NOT Met
------------|---------------||---------------||---------------||---------------|
Approach: North Bound South Bound East Bound West Bound
Movement: L - T - R L - T - R L - T - R L - T - R
------------|---------------||---------------||---------------||---------------|
Control: Uncontrolled Uncontrolled Stop Sign Stop Sign
Lanes: 1 0 0 1 0 1 0 0 1 0 0 0 1! 0 0 0 0 1! 0 0
Initial Vol: 6 79 2 4 137 3 6 3 1 2 0 5
------------|---------------||---------------||---------------||---------------|
Major Street Volume: 231
Minor Approach Volume: 10
Minor Approach Volume Threshold: 790
--------------------------------------------------------------------------------
SIGNAL WARRANT DISCLAIMER
This peak hour signal warrant analysis should be considered solely as an
"indicator" of the likelihood of an unsignalized intersection warranting
a traffic signal in the future. Intersections that exceed this warrant
are probably more likely to meet one or more of the other volume based
signal warrant (such as the 4-hour or 8-hour warrants).
The peak hour warrant analysis in this report is not intended to replace
a rigorous and complete traffic signal warrant analysis by the responsible
jurisdiction. Consideration of the other signal warrants, which is beyond
the scope of this software, may yield different results.
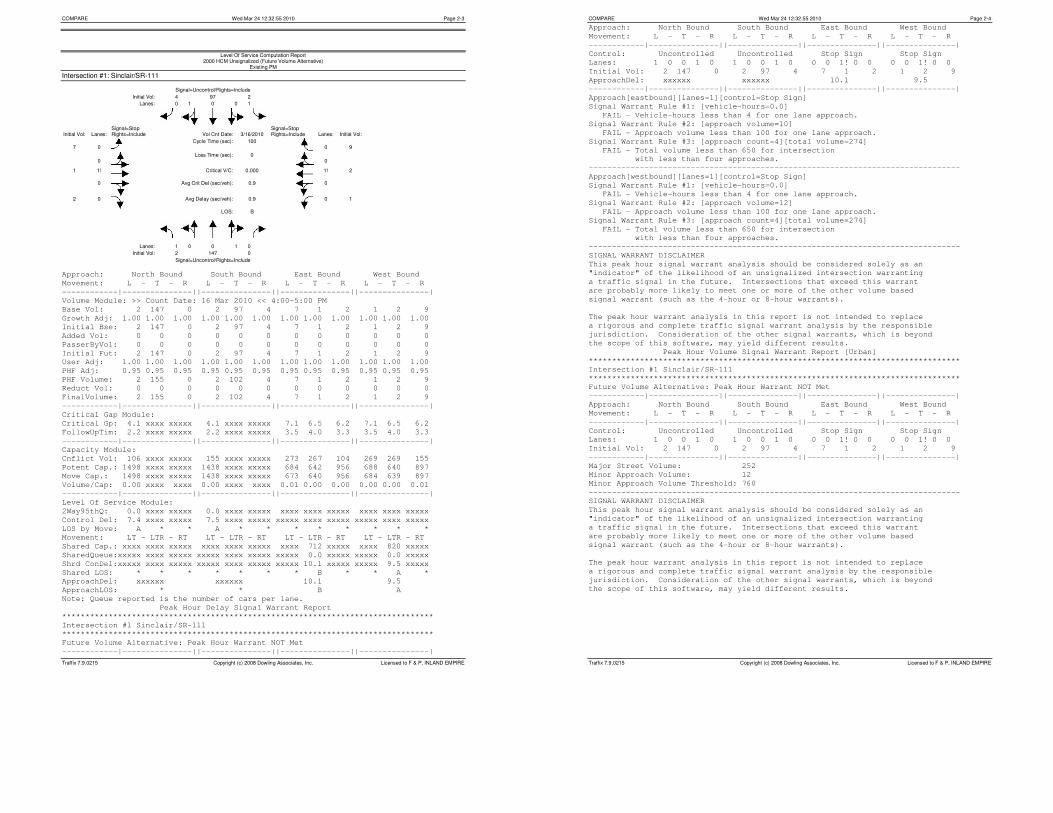
COMPARE Wed Mar 24 12:32:55 2010 Page 2-3
Traffix 7.9.0215 Copyright (c) 2008 Dowling Associates, Inc. Licensed to F & P, INLAND EMPIRE
Level Of Service Computation Report 2000 HCM Unsignalized (Future Volume Alternative)
Existing PM
Intersection #1: Sinclair/SR-111 Signal=Uncontrol/Rights=Include
Initial Vol: 4 97 2
Lanes: 0 1 0 0 1
Signal=Stop
Signal=Stop
Initial Vol: Lanes: Rights=Include Vol Cnt Date: 3/16/2010 Rights=Include Lanes: Initial Vol:
7
0
Cycle Time (sec): 100 0
9
0
Loss Time (sec): 0 0
1 1!
Critical V/C: 0.000 1! 2
0
Avg Crit Del (sec/veh): 0.9 0
2 0
Avg Delay (sec/veh): 0.9 0 1
LOS: B
Lanes: 1 0 0 1 0
Initial Vol: 2 147 0
Signal=Uncontrol/Rights=Include
Approach: North Bound South Bound East Bound West Bound
Movement: L - T - R L - T - R L - T - R L - T - R
------------|---------------||---------------||---------------||---------------|
Volume Module: >> Count Date: 16 Mar 2010 << 4:00-5:00 PM
Base Vol: 2 147 0 2 97 4 7 1 2 1 2 9
Growth Adj: 1.00 1.00 1.00 1.00 1.00 1.00 1.00 1.00 1.00 1.00 1.00 1.00
Initial Bse: 2 147 0 2 97 4 7 1 2 1 2 9
Added Vol: 0 0 0 0 0 0 0 0 0 0 0 0
PasserByVol: 0 0 0 0 0 0 0 0 0 0 0 0
Initial Fut: 2 147 0 2 97 4 7 1 2 1 2 9
User Adj: 1.00 1.00 1.00 1.00 1.00 1.00 1.00 1.00 1.00 1.00 1.00 1.00
PHF Adj: 0.95 0.95 0.95 0.95 0.95 0.95 0.95 0.95 0.95 0.95 0.95 0.95
PHF Volume: 2 155 0 2 102 4 7 1 2 1 2 9
Reduct Vol: 0 0 0 0 0 0 0 0 0 0 0 0
FinalVolume: 2 155 0 2 102 4 7 1 2 1 2 9
------------|---------------||---------------||---------------||---------------|
Critical Gap Module:
Critical Gp: 4.1 xxxx xxxxx 4.1 xxxx xxxxx 7.1 6.5 6.2 7.1 6.5 6.2
FollowUpTim: 2.2 xxxx xxxxx 2.2 xxxx xxxxx 3.5 4.0 3.3 3.5 4.0 3.3
------------|---------------||---------------||---------------||---------------|
Capacity Module:
Cnflict Vol: 106 xxxx xxxxx 155 xxxx xxxxx 273 267 104 269 269 155
Potent Cap.: 1498 xxxx xxxxx 1438 xxxx xxxxx 684 642 956 688 640 897
Move Cap.: 1498 xxxx xxxxx 1438 xxxx xxxxx 673 640 956 684 639 897
Volume/Cap: 0.00 xxxx xxxx 0.00 xxxx xxxx 0.01 0.00 0.00 0.00 0.00 0.01
------------|---------------||---------------||---------------||---------------|
Level Of Service Module:
2Way95thQ: 0.0 xxxx xxxxx 0.0 xxxx xxxxx xxxx xxxx xxxxx xxxx xxxx xxxxx
Control Del: 7.4 xxxx xxxxx 7.5 xxxx xxxxx xxxxx xxxx xxxxx xxxxx xxxx xxxxx
LOS by Move: A * * A * * * * * * * *
Movement: LT - LTR - RT LT - LTR - RT LT - LTR - RT LT - LTR - RT
Shared Cap.: xxxx xxxx xxxxx xxxx xxxx xxxxx xxxx 712 xxxxx xxxx 820 xxxxx
SharedQueue:xxxxx xxxx xxxxx xxxxx xxxx xxxxx xxxxx 0.0 xxxxx xxxxx 0.0 xxxxx
Shrd ConDel:xxxxx xxxx xxxxx xxxxx xxxx xxxxx xxxxx 10.1 xxxxx xxxxx 9.5 xxxxx
Shared LOS: * * * * * * * B * * A *
ApproachDel: xxxxxx xxxxxx 10.1 9.5
ApproachLOS: * * B A
Note: Queue reported is the number of cars per lane.
Peak Hour Delay Signal Warrant Report
********************************************************************************
Intersection #1 Sinclair/SR-111
********************************************************************************
Future Volume Alternative: Peak Hour Warrant NOT Met
------------|---------------||---------------||---------------||---------------|
COMPARE Wed Mar 24 12:32:55 2010 Page 2-4
Traffix 7.9.0215 Copyright (c) 2008 Dowling Associates, Inc. Licensed to F & P, INLAND EMPIRE
Approach: North Bound South Bound East Bound West Bound
Movement: L - T - R L - T - R L - T - R L - T - R
------------|---------------||---------------||---------------||---------------|
Control: Uncontrolled Uncontrolled Stop Sign Stop Sign
Lanes: 1 0 0 1 0 1 0 0 1 0 0 0 1! 0 0 0 0 1! 0 0
Initial Vol: 2 147 0 2 97 4 7 1 2 1 2 9
ApproachDel: xxxxxx xxxxxx 10.1 9.5
------------|---------------||---------------||---------------||---------------|
Approach[eastbound][lanes=1][control=Stop Sign]
Signal Warrant Rule #1: [vehicle-hours=0.0]
FAIL - Vehicle-hours less than 4 for one lane approach.
Signal Warrant Rule #2: [approach volume=10]
FAIL - Approach volume less than 100 for one lane approach.
Signal Warrant Rule #3: [approach count=4][total volume=274]
FAIL - Total volume less than 650 for intersection
with less than four approaches.
--------------------------------------------------------------------------------
Approach[westbound][lanes=1][control=Stop Sign]
Signal Warrant Rule #1: [vehicle-hours=0.0]
FAIL - Vehicle-hours less than 4 for one lane approach.
Signal Warrant Rule #2: [approach volume=12]
FAIL - Approach volume less than 100 for one lane approach.
Signal Warrant Rule #3: [approach count=4][total volume=274]
FAIL - Total volume less than 650 for intersection
with less than four approaches.
--------------------------------------------------------------------------------
SIGNAL WARRANT DISCLAIMER
This peak hour signal warrant analysis should be considered solely as an
"indicator" of the likelihood of an unsignalized intersection warranting
a traffic signal in the future. Intersections that exceed this warrant
are probably more likely to meet one or more of the other volume based
signal warrant (such as the 4-hour or 8-hour warrants).
The peak hour warrant analysis in this report is not intended to replace
a rigorous and complete traffic signal warrant analysis by the responsible
jurisdiction. Consideration of the other signal warrants, which is beyond
the scope of this software, may yield different results.
Peak Hour Volume Signal Warrant Report [Urban]
********************************************************************************
Intersection #1 Sinclair/SR-111
********************************************************************************
Future Volume Alternative: Peak Hour Warrant NOT Met
------------|---------------||---------------||---------------||---------------|
Approach: North Bound South Bound East Bound West Bound
Movement: L - T - R L - T - R L - T - R L - T - R
------------|---------------||---------------||---------------||---------------|
Control: Uncontrolled Uncontrolled Stop Sign Stop Sign
Lanes: 1 0 0 1 0 1 0 0 1 0 0 0 1! 0 0 0 0 1! 0 0
Initial Vol: 2 147 0 2 97 4 7 1 2 1 2 9
------------|---------------||---------------||---------------||---------------|
Major Street Volume: 252
Minor Approach Volume: 12
Minor Approach Volume Threshold: 760
--------------------------------------------------------------------------------
SIGNAL WARRANT DISCLAIMER
This peak hour signal warrant analysis should be considered solely as an
"indicator" of the likelihood of an unsignalized intersection warranting
a traffic signal in the future. Intersections that exceed this warrant
are probably more likely to meet one or more of the other volume based
signal warrant (such as the 4-hour or 8-hour warrants).
The peak hour warrant analysis in this report is not intended to replace
a rigorous and complete traffic signal warrant analysis by the responsible
jurisdiction. Consideration of the other signal warrants, which is beyond
the scope of this software, may yield different results.

COMPARE Wed Mar 24 12:32:55 2010 Page 2-5
Traffix 7.9.0215 Copyright (c) 2008 Dowling Associates, Inc. Licensed to F & P, INLAND EMPIRE
Level Of Service Computation Report 2000 HCM Unsignalized (Future Volume Alternative)
E+C AM
Intersection #1: Sinclair/SR-111 Signal=Uncontrol/Rights=Include
Initial Vol: 3 137 58
Lanes: 0 1 0 0 1
Signal=Stop
Signal=Stop
Initial Vol: Lanes: Rights=Include Vol Cnt Date: 3/16/2010 Rights=Include Lanes: Initial Vol:
6
0
Cycle Time (sec): 100 0
5
0
Loss Time (sec): 0 0
3 1!
Critical V/C: 0.000 1! 0
0
Avg Crit Del (sec/veh): 2.2 0
1 0
Avg Delay (sec/veh): 2.2 0 2
LOS: B
Lanes: 1 0 0 1 0
Initial Vol: 6 79 2
Signal=Uncontrol/Rights=Include
Approach: North Bound South Bound East Bound West Bound
Movement: L - T - R L - T - R L - T - R L - T - R
------------|---------------||---------------||---------------||---------------|
Volume Module: >> Count Date: 16 Mar 2010 << 8am-9am
Base Vol: 6 79 2 4 137 3 6 3 1 2 0 5
Growth Adj: 1.00 1.00 1.00 1.00 1.00 1.00 1.00 1.00 1.00 1.00 1.00 1.00
Initial Bse: 6 79 2 4 137 3 6 3 1 2 0 5
Added Vol: 0 0 0 54 0 0 0 0 0 0 0 0
PasserByVol: 0 0 0 0 0 0 0 0 0 0 0 0
Initial Fut: 6 79 2 58 137 3 6 3 1 2 0 5
User Adj: 1.00 1.00 1.00 1.00 1.00 1.00 1.00 1.00 1.00 1.00 1.00 1.00
PHF Adj: 0.93 0.93 0.93 0.93 0.93 0.93 0.93 0.93 0.93 0.93 0.93 0.93
PHF Volume: 6 85 2 63 148 3 6 3 1 2 0 5
Reduct Vol: 0 0 0 0 0 0 0 0 0 0 0 0
FinalVolume: 6 85 2 63 148 3 6 3 1 2 0 5
------------|---------------||---------------||---------------||---------------|
Critical Gap Module:
Critical Gp: 4.1 xxxx xxxxx 4.1 xxxx xxxxx 7.1 6.5 6.2 7.1 6.5 6.2
FollowUpTim: 2.2 xxxx xxxxx 2.2 xxxx xxxxx 3.5 4.0 3.3 3.5 4.0 3.3
------------|---------------||---------------||---------------||---------------|
Capacity Module:
Cnflict Vol: 151 xxxx xxxxx 88 xxxx xxxxx 377 376 150 377 376 86
Potent Cap.: 1442 xxxx xxxxx 1521 xxxx xxxxx 584 559 902 584 558 978
Move Cap.: 1442 xxxx xxxxx 1521 xxxx xxxxx 560 533 902 561 533 978
Volume/Cap: 0.00 xxxx xxxx 0.04 xxxx xxxx 0.01 0.01 0.00 0.00 0.00 0.01
------------|---------------||---------------||---------------||---------------|
Level Of Service Module:
2Way95thQ: 0.0 xxxx xxxxx 0.1 xxxx xxxxx xxxx xxxx xxxxx xxxx xxxx xxxxx
Control Del: 7.5 xxxx xxxxx 7.5 xxxx xxxxx xxxxx xxxx xxxxx xxxxx xxxx xxxxx
LOS by Move: A * * A * * * * * * * *
Movement: LT - LTR - RT LT - LTR - RT LT - LTR - RT LT - LTR - RT
Shared Cap.: xxxx xxxx xxxxx xxxx xxxx xxxxx xxxx 573 xxxxx xxxx 806 xxxxx
SharedQueue:xxxxx xxxx xxxxx xxxxx xxxx xxxxx xxxxx 0.1 xxxxx xxxxx 0.0 xxxxx
Shrd ConDel:xxxxx xxxx xxxxx xxxxx xxxx xxxxx xxxxx 11.4 xxxxx xxxxx 9.5 xxxxx
Shared LOS: * * * * * * * B * * A *
ApproachDel: xxxxxx xxxxxx 11.4 9.5
ApproachLOS: * * B A
Note: Queue reported is the number of cars per lane.
Peak Hour Delay Signal Warrant Report
********************************************************************************
Intersection #1 Sinclair/SR-111
********************************************************************************
Future Volume Alternative: Peak Hour Warrant NOT Met
------------|---------------||---------------||---------------||---------------|
COMPARE Wed Mar 24 12:32:55 2010 Page 2-6
Traffix 7.9.0215 Copyright (c) 2008 Dowling Associates, Inc. Licensed to F & P, INLAND EMPIRE
Approach: North Bound South Bound East Bound West Bound
Movement: L - T - R L - T - R L - T - R L - T - R
------------|---------------||---------------||---------------||---------------|
Control: Uncontrolled Uncontrolled Stop Sign Stop Sign
Lanes: 1 0 0 1 0 1 0 0 1 0 0 0 1! 0 0 0 0 1! 0 0
Initial Vol: 6 79 2 58 137 3 6 3 1 2 0 5
ApproachDel: xxxxxx xxxxxx 11.4 9.5
------------|---------------||---------------||---------------||---------------|
Approach[eastbound][lanes=1][control=Stop Sign]
Signal Warrant Rule #1: [vehicle-hours=0.0]
FAIL - Vehicle-hours less than 4 for one lane approach.
Signal Warrant Rule #2: [approach volume=10]
FAIL - Approach volume less than 100 for one lane approach.
Signal Warrant Rule #3: [approach count=4][total volume=302]
FAIL - Total volume less than 650 for intersection
with less than four approaches.
--------------------------------------------------------------------------------
Approach[westbound][lanes=1][control=Stop Sign]
Signal Warrant Rule #1: [vehicle-hours=0.0]
FAIL - Vehicle-hours less than 4 for one lane approach.
Signal Warrant Rule #2: [approach volume=7]
FAIL - Approach volume less than 100 for one lane approach.
Signal Warrant Rule #3: [approach count=4][total volume=302]
FAIL - Total volume less than 650 for intersection
with less than four approaches.
--------------------------------------------------------------------------------
SIGNAL WARRANT DISCLAIMER
This peak hour signal warrant analysis should be considered solely as an
"indicator" of the likelihood of an unsignalized intersection warranting
a traffic signal in the future. Intersections that exceed this warrant
are probably more likely to meet one or more of the other volume based
signal warrant (such as the 4-hour or 8-hour warrants).
The peak hour warrant analysis in this report is not intended to replace
a rigorous and complete traffic signal warrant analysis by the responsible
jurisdiction. Consideration of the other signal warrants, which is beyond
the scope of this software, may yield different results.
Peak Hour Volume Signal Warrant Report [Urban]
********************************************************************************
Intersection #1 Sinclair/SR-111
********************************************************************************
Future Volume Alternative: Peak Hour Warrant NOT Met
------------|---------------||---------------||---------------||---------------|
Approach: North Bound South Bound East Bound West Bound
Movement: L - T - R L - T - R L - T - R L - T - R
------------|---------------||---------------||---------------||---------------|
Control: Uncontrolled Uncontrolled Stop Sign Stop Sign
Lanes: 1 0 0 1 0 1 0 0 1 0 0 0 1! 0 0 0 0 1! 0 0
Initial Vol: 6 79 2 58 137 3 6 3 1 2 0 5
------------|---------------||---------------||---------------||---------------|
Major Street Volume: 285
Minor Approach Volume: 10
Minor Approach Volume Threshold: 717
--------------------------------------------------------------------------------
SIGNAL WARRANT DISCLAIMER
This peak hour signal warrant analysis should be considered solely as an
"indicator" of the likelihood of an unsignalized intersection warranting
a traffic signal in the future. Intersections that exceed this warrant
are probably more likely to meet one or more of the other volume based
signal warrant (such as the 4-hour or 8-hour warrants).
The peak hour warrant analysis in this report is not intended to replace
a rigorous and complete traffic signal warrant analysis by the responsible
jurisdiction. Consideration of the other signal warrants, which is beyond
the scope of this software, may yield different results.

COMPARE Wed Mar 24 12:32:55 2010 Page 2-7
Traffix 7.9.0215 Copyright (c) 2008 Dowling Associates, Inc. Licensed to F & P, INLAND EMPIRE
Level Of Service Computation Report 2000 HCM Unsignalized (Future Volume Alternative)
E+C PM
Intersection #1: Sinclair/SR-111 Signal=Uncontrol/Rights=Include
Initial Vol: 4 97 2
Lanes: 0 1 0 0 1
Signal=Stop
Signal=Stop
Initial Vol: Lanes: Rights=Include Vol Cnt Date: 3/16/2010 Rights=Include Lanes: Initial Vol:
7
0
Cycle Time (sec): 100 0
63
0
Loss Time (sec): 0 0
1 1!
Critical V/C: 0.000 1! 2
0
Avg Crit Del (sec/veh): 2.3 0
2 0
Avg Delay (sec/veh): 2.3 0 1
LOS: B
Lanes: 1 0 0 1 0
Initial Vol: 2 147 0
Signal=Uncontrol/Rights=Include
Approach: North Bound South Bound East Bound West Bound
Movement: L - T - R L - T - R L - T - R L - T - R
------------|---------------||---------------||---------------||---------------|
Volume Module: >> Count Date: 16 Mar 2010 << 4:00-5:00 PM
Base Vol: 2 147 0 2 97 4 7 1 2 1 2 9
Growth Adj: 1.00 1.00 1.00 1.00 1.00 1.00 1.00 1.00 1.00 1.00 1.00 1.00
Initial Bse: 2 147 0 2 97 4 7 1 2 1 2 9
Added Vol: 0 0 0 0 0 0 0 0 0 0 0 54
PasserByVol: 0 0 0 0 0 0 0 0 0 0 0 0
Initial Fut: 2 147 0 2 97 4 7 1 2 1 2 63
User Adj: 1.00 1.00 1.00 1.00 1.00 1.00 1.00 1.00 1.00 1.00 1.00 1.00
PHF Adj: 0.95 0.95 0.95 0.95 0.95 0.95 0.95 0.95 0.95 0.95 0.95 0.95
PHF Volume: 2 155 0 2 102 4 7 1 2 1 2 66
Reduct Vol: 0 0 0 0 0 0 0 0 0 0 0 0
FinalVolume: 2 155 0 2 102 4 7 1 2 1 2 66
------------|---------------||---------------||---------------||---------------|
Critical Gap Module:
Critical Gp: 4.1 xxxx xxxxx 4.1 xxxx xxxxx 7.1 6.5 6.2 7.1 6.5 6.2
FollowUpTim: 2.2 xxxx xxxxx 2.2 xxxx xxxxx 3.5 4.0 3.3 3.5 4.0 3.3
------------|---------------||---------------||---------------||---------------|
Capacity Module:
Cnflict Vol: 106 xxxx xxxxx 155 xxxx xxxxx 301 267 104 269 269 155
Potent Cap.: 1498 xxxx xxxxx 1438 xxxx xxxxx 655 642 956 688 640 897
Move Cap.: 1498 xxxx xxxxx 1438 xxxx xxxxx 604 640 956 684 639 897
Volume/Cap: 0.00 xxxx xxxx 0.00 xxxx xxxx 0.01 0.00 0.00 0.00 0.00 0.07
------------|---------------||---------------||---------------||---------------|
Level Of Service Module:
2Way95thQ: 0.0 xxxx xxxxx 0.0 xxxx xxxxx xxxx xxxx xxxxx xxxx xxxx xxxxx
Control Del: 7.4 xxxx xxxxx 7.5 xxxx xxxxx xxxxx xxxx xxxxx xxxxx xxxx xxxxx
LOS by Move: A * * A * * * * * * * *
Movement: LT - LTR - RT LT - LTR - RT LT - LTR - RT LT - LTR - RT
Shared Cap.: xxxx xxxx xxxxx xxxx xxxx xxxxx xxxx 656 xxxxx xxxx 882 xxxxx
SharedQueue:xxxxx xxxx xxxxx xxxxx xxxx xxxxx xxxxx 0.0 xxxxx xxxxx 0.3 xxxxx
Shrd ConDel:xxxxx xxxx xxxxx xxxxx xxxx xxxxx xxxxx 10.6 xxxxx xxxxx 9.4 xxxxx
Shared LOS: * * * * * * * B * * A *
ApproachDel: xxxxxx xxxxxx 10.6 9.4
ApproachLOS: * * B A
Note: Queue reported is the number of cars per lane.
Peak Hour Delay Signal Warrant Report
********************************************************************************
Intersection #1 Sinclair/SR-111
********************************************************************************
Future Volume Alternative: Peak Hour Warrant NOT Met
------------|---------------||---------------||---------------||---------------|
COMPARE Wed Mar 24 12:32:55 2010 Page 2-8
Traffix 7.9.0215 Copyright (c) 2008 Dowling Associates, Inc. Licensed to F & P, INLAND EMPIRE
Approach: North Bound South Bound East Bound West Bound
Movement: L - T - R L - T - R L - T - R L - T - R
------------|---------------||---------------||---------------||---------------|
Control: Uncontrolled Uncontrolled Stop Sign Stop Sign
Lanes: 1 0 0 1 0 1 0 0 1 0 0 0 1! 0 0 0 0 1! 0 0
Initial Vol: 2 147 0 2 97 4 7 1 2 1 2 63
ApproachDel: xxxxxx xxxxxx 10.6 9.4
------------|---------------||---------------||---------------||---------------|
Approach[eastbound][lanes=1][control=Stop Sign]
Signal Warrant Rule #1: [vehicle-hours=0.0]
FAIL - Vehicle-hours less than 4 for one lane approach.
Signal Warrant Rule #2: [approach volume=10]
FAIL - Approach volume less than 100 for one lane approach.
Signal Warrant Rule #3: [approach count=4][total volume=328]
FAIL - Total volume less than 650 for intersection
with less than four approaches.
--------------------------------------------------------------------------------
Approach[westbound][lanes=1][control=Stop Sign]
Signal Warrant Rule #1: [vehicle-hours=0.2]
FAIL - Vehicle-hours less than 4 for one lane approach.
Signal Warrant Rule #2: [approach volume=66]
FAIL - Approach volume less than 100 for one lane approach.
Signal Warrant Rule #3: [approach count=4][total volume=328]
FAIL - Total volume less than 650 for intersection
with less than four approaches.
--------------------------------------------------------------------------------
SIGNAL WARRANT DISCLAIMER
This peak hour signal warrant analysis should be considered solely as an
"indicator" of the likelihood of an unsignalized intersection warranting
a traffic signal in the future. Intersections that exceed this warrant
are probably more likely to meet one or more of the other volume based
signal warrant (such as the 4-hour or 8-hour warrants).
The peak hour warrant analysis in this report is not intended to replace
a rigorous and complete traffic signal warrant analysis by the responsible
jurisdiction. Consideration of the other signal warrants, which is beyond
the scope of this software, may yield different results.
Peak Hour Volume Signal Warrant Report [Urban]
********************************************************************************
Intersection #1 Sinclair/SR-111
********************************************************************************
Future Volume Alternative: Peak Hour Warrant NOT Met
------------|---------------||---------------||---------------||---------------|
Approach: North Bound South Bound East Bound West Bound
Movement: L - T - R L - T - R L - T - R L - T - R
------------|---------------||---------------||---------------||---------------|
Control: Uncontrolled Uncontrolled Stop Sign Stop Sign
Lanes: 1 0 0 1 0 1 0 0 1 0 0 0 1! 0 0 0 0 1! 0 0
Initial Vol: 2 147 0 2 97 4 7 1 2 1 2 63
------------|---------------||---------------||---------------||---------------|
Major Street Volume: 252
Minor Approach Volume: 66
Minor Approach Volume Threshold: 760
--------------------------------------------------------------------------------
SIGNAL WARRANT DISCLAIMER
This peak hour signal warrant analysis should be considered solely as an
"indicator" of the likelihood of an unsignalized intersection warranting
a traffic signal in the future. Intersections that exceed this warrant
are probably more likely to meet one or more of the other volume based
signal warrant (such as the 4-hour or 8-hour warrants).
The peak hour warrant analysis in this report is not intended to replace
a rigorous and complete traffic signal warrant analysis by the responsible
jurisdiction. Consideration of the other signal warrants, which is beyond
the scope of this software, may yield different results.
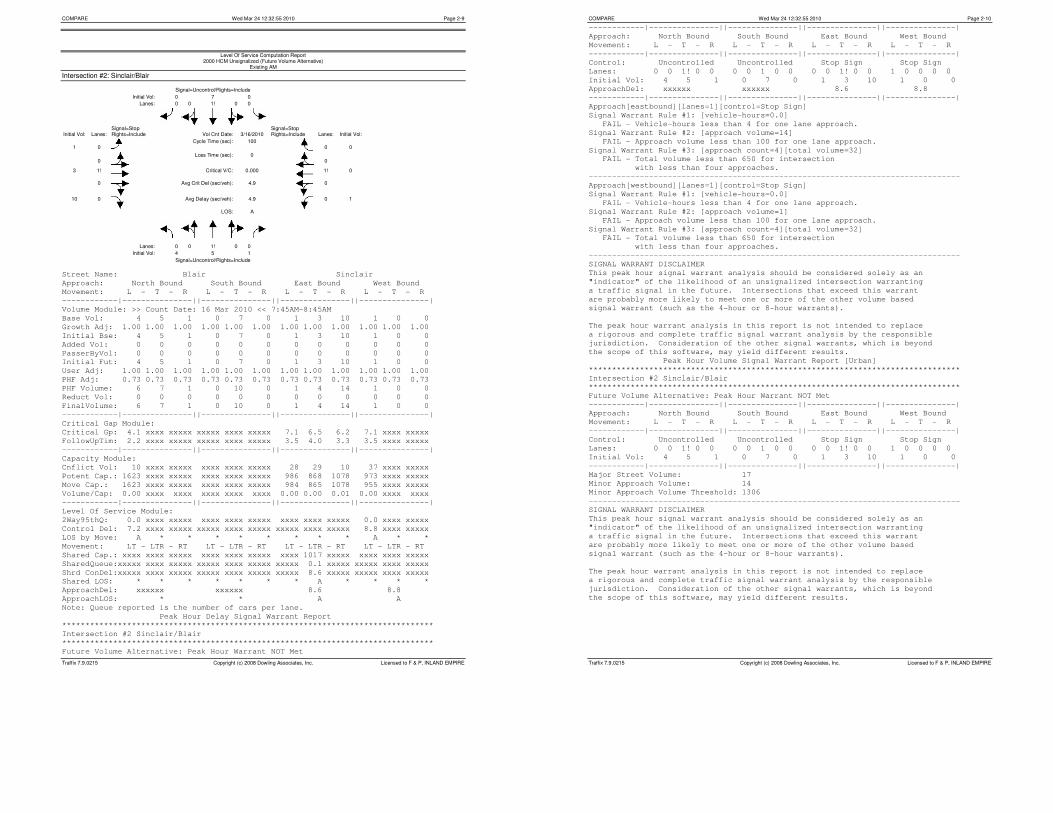
COMPARE Wed Mar 24 12:32:55 2010 Page 2-9
Traffix 7.9.0215 Copyright (c) 2008 Dowling Associates, Inc. Licensed to F & P, INLAND EMPIRE
Level Of Service Computation Report 2000 HCM Unsignalized (Future Volume Alternative)
Existing AM
Intersection #2: Sinclair/Blair Signal=Uncontrol/Rights=Include
Initial Vol: 0 7 0
Lanes: 0 0 1! 0 0
Signal=Stop
Signal=Stop
Initial Vol: Lanes: Rights=Include Vol Cnt Date: 3/16/2010 Rights=Include Lanes: Initial Vol:
1
0
Cycle Time (sec): 100 0
0
0
Loss Time (sec): 0 0
3 1!
Critical V/C: 0.000 1! 0
0
Avg Crit Del (sec/veh): 4.9 0
10 0
Avg Delay (sec/veh): 4.9 0 1
LOS: A
Lanes: 0 0 1! 0 0
Initial Vol: 4 5 1
Signal=Uncontrol/Rights=Include
Street Name: Blair Sinclair
Approach: North Bound South Bound East Bound West Bound
Movement: L - T - R L - T - R L - T - R L - T - R
------------|---------------||---------------||---------------||---------------|
Volume Module: >> Count Date: 16 Mar 2010 << 7:45AM-8:45AM
Base Vol: 4 5 1 0 7 0 1 3 10 1 0 0
Growth Adj: 1.00 1.00 1.00 1.00 1.00 1.00 1.00 1.00 1.00 1.00 1.00 1.00
Initial Bse: 4 5 1 0 7 0 1 3 10 1 0 0
Added Vol: 0 0 0 0 0 0 0 0 0 0 0 0
PasserByVol: 0 0 0 0 0 0 0 0 0 0 0 0
Initial Fut: 4 5 1 0 7 0 1 3 10 1 0 0
User Adj: 1.00 1.00 1.00 1.00 1.00 1.00 1.00 1.00 1.00 1.00 1.00 1.00
PHF Adj: 0.73 0.73 0.73 0.73 0.73 0.73 0.73 0.73 0.73 0.73 0.73 0.73
PHF Volume: 6 7 1 0 10 0 1 4 14 1 0 0
Reduct Vol: 0 0 0 0 0 0 0 0 0 0 0 0
FinalVolume: 6 7 1 0 10 0 1 4 14 1 0 0
------------|---------------||---------------||---------------||---------------|
Critical Gap Module:
Critical Gp: 4.1 xxxx xxxxx xxxxx xxxx xxxxx 7.1 6.5 6.2 7.1 xxxx xxxxx
FollowUpTim: 2.2 xxxx xxxxx xxxxx xxxx xxxxx 3.5 4.0 3.3 3.5 xxxx xxxxx
------------|---------------||---------------||---------------||---------------|
Capacity Module:
Cnflict Vol: 10 xxxx xxxxx xxxx xxxx xxxxx 28 29 10 37 xxxx xxxxx
Potent Cap.: 1623 xxxx xxxxx xxxx xxxx xxxxx 986 868 1078 973 xxxx xxxxx
Move Cap.: 1623 xxxx xxxxx xxxx xxxx xxxxx 984 865 1078 955 xxxx xxxxx
Volume/Cap: 0.00 xxxx xxxx xxxx xxxx xxxx 0.00 0.00 0.01 0.00 xxxx xxxx
------------|---------------||---------------||---------------||---------------|
Level Of Service Module:
2Way95thQ: 0.0 xxxx xxxxx xxxx xxxx xxxxx xxxx xxxx xxxxx 0.0 xxxx xxxxx
Control Del: 7.2 xxxx xxxxx xxxxx xxxx xxxxx xxxxx xxxx xxxxx 8.8 xxxx xxxxx
LOS by Move: A * * * * * * * * A * *
Movement: LT - LTR - RT LT - LTR - RT LT - LTR - RT LT - LTR - RT
Shared Cap.: xxxx xxxx xxxxx xxxx xxxx xxxxx xxxx 1017 xxxxx xxxx xxxx xxxxx
SharedQueue:xxxxx xxxx xxxxx xxxxx xxxx xxxxx xxxxx 0.1 xxxxx xxxxx xxxx xxxxx
Shrd ConDel:xxxxx xxxx xxxxx xxxxx xxxx xxxxx xxxxx 8.6 xxxxx xxxxx xxxx xxxxx
Shared LOS: * * * * * * * A * * * *
ApproachDel: xxxxxx xxxxxx 8.6 8.8
ApproachLOS: * * A A
Note: Queue reported is the number of cars per lane.
Peak Hour Delay Signal Warrant Report
********************************************************************************
Intersection #2 Sinclair/Blair
********************************************************************************
Future Volume Alternative: Peak Hour Warrant NOT Met
COMPARE Wed Mar 24 12:32:55 2010 Page 2-10
Traffix 7.9.0215 Copyright (c) 2008 Dowling Associates, Inc. Licensed to F & P, INLAND EMPIRE
------------|---------------||---------------||---------------||---------------|
Approach: North Bound South Bound East Bound West Bound
Movement: L - T - R L - T - R L - T - R L - T - R
------------|---------------||---------------||---------------||---------------|
Control: Uncontrolled Uncontrolled Stop Sign Stop Sign
Lanes: 0 0 1! 0 0 0 0 1 0 0 0 0 1! 0 0 1 0 0 0 0
Initial Vol: 4 5 1 0 7 0 1 3 10 1 0 0
ApproachDel: xxxxxx xxxxxx 8.6 8.8
------------|---------------||---------------||---------------||---------------|
Approach[eastbound][lanes=1][control=Stop Sign]
Signal Warrant Rule #1: [vehicle-hours=0.0]
FAIL - Vehicle-hours less than 4 for one lane approach.
Signal Warrant Rule #2: [approach volume=14]
FAIL - Approach volume less than 100 for one lane approach.
Signal Warrant Rule #3: [approach count=4][total volume=32]
FAIL - Total volume less than 650 for intersection
with less than four approaches.
--------------------------------------------------------------------------------
Approach[westbound][lanes=1][control=Stop Sign]
Signal Warrant Rule #1: [vehicle-hours=0.0]
FAIL - Vehicle-hours less than 4 for one lane approach.
Signal Warrant Rule #2: [approach volume=1]
FAIL - Approach volume less than 100 for one lane approach.
Signal Warrant Rule #3: [approach count=4][total volume=32]
FAIL - Total volume less than 650 for intersection
with less than four approaches.
--------------------------------------------------------------------------------
SIGNAL WARRANT DISCLAIMER
This peak hour signal warrant analysis should be considered solely as an
"indicator" of the likelihood of an unsignalized intersection warranting
a traffic signal in the future. Intersections that exceed this warrant
are probably more likely to meet one or more of the other volume based
signal warrant (such as the 4-hour or 8-hour warrants).
The peak hour warrant analysis in this report is not intended to replace
a rigorous and complete traffic signal warrant analysis by the responsible
jurisdiction. Consideration of the other signal warrants, which is beyond
the scope of this software, may yield different results.
Peak Hour Volume Signal Warrant Report [Urban]
********************************************************************************
Intersection #2 Sinclair/Blair
********************************************************************************
Future Volume Alternative: Peak Hour Warrant NOT Met
------------|---------------||---------------||---------------||---------------|
Approach: North Bound South Bound East Bound West Bound
Movement: L - T - R L - T - R L - T - R L - T - R
------------|---------------||---------------||---------------||---------------|
Control: Uncontrolled Uncontrolled Stop Sign Stop Sign
Lanes: 0 0 1! 0 0 0 0 1 0 0 0 0 1! 0 0 1 0 0 0 0
Initial Vol: 4 5 1 0 7 0 1 3 10 1 0 0
------------|---------------||---------------||---------------||---------------|
Major Street Volume: 17
Minor Approach Volume: 14
Minor Approach Volume Threshold: 1306
--------------------------------------------------------------------------------
SIGNAL WARRANT DISCLAIMER
This peak hour signal warrant analysis should be considered solely as an
"indicator" of the likelihood of an unsignalized intersection warranting
a traffic signal in the future. Intersections that exceed this warrant
are probably more likely to meet one or more of the other volume based
signal warrant (such as the 4-hour or 8-hour warrants).
The peak hour warrant analysis in this report is not intended to replace
a rigorous and complete traffic signal warrant analysis by the responsible
jurisdiction. Consideration of the other signal warrants, which is beyond
the scope of this software, may yield different results.
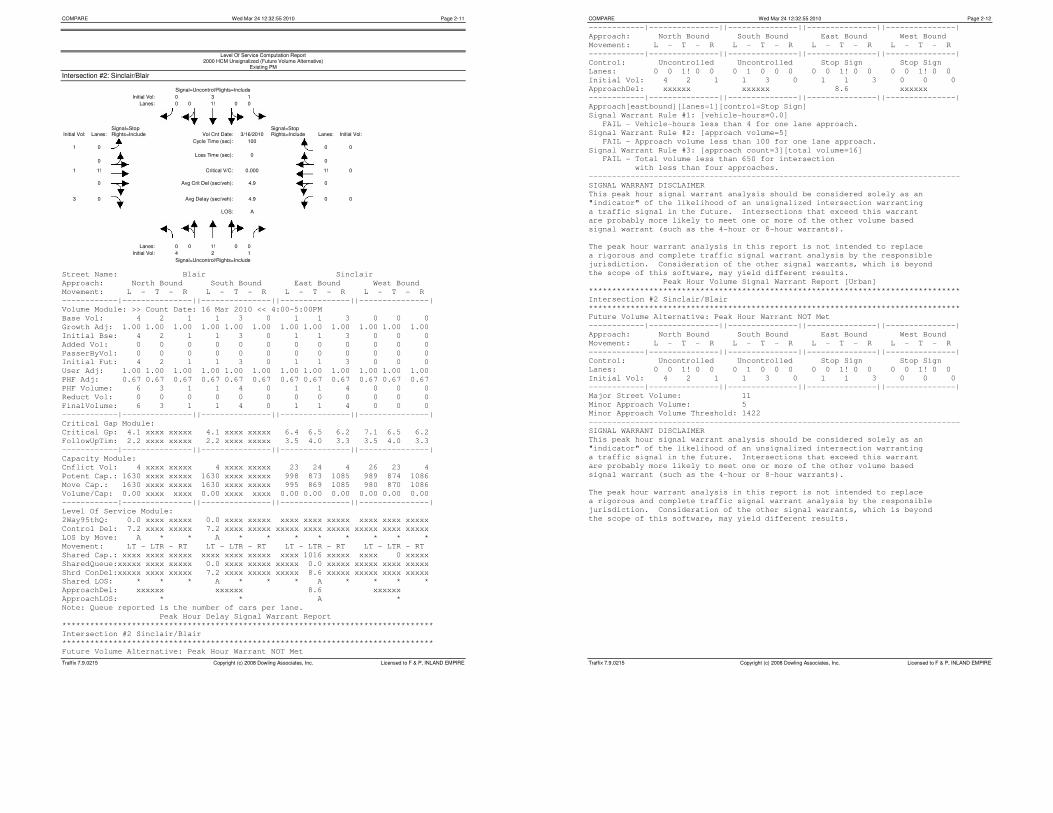
COMPARE Wed Mar 24 12:32:55 2010 Page 2-11
Traffix 7.9.0215 Copyright (c) 2008 Dowling Associates, Inc. Licensed to F & P, INLAND EMPIRE
Level Of Service Computation Report 2000 HCM Unsignalized (Future Volume Alternative)
Existing PM
Intersection #2: Sinclair/Blair Signal=Uncontrol/Rights=Include
Initial Vol: 0 3 1
Lanes: 0 0 1! 0 0
Signal=Stop
Signal=Stop
Initial Vol: Lanes: Rights=Include Vol Cnt Date: 3/16/2010 Rights=Include Lanes: Initial Vol:
1
0
Cycle Time (sec): 100 0
0
0
Loss Time (sec): 0 0
1 1!
Critical V/C: 0.000 1! 0
0
Avg Crit Del (sec/veh): 4.9 0
3 0
Avg Delay (sec/veh): 4.9 0 0
LOS: A
Lanes: 0 0 1! 0 0
Initial Vol: 4 2 1
Signal=Uncontrol/Rights=Include
Street Name: Blair Sinclair
Approach: North Bound South Bound East Bound West Bound
Movement: L - T - R L - T - R L - T - R L - T - R
------------|---------------||---------------||---------------||---------------|
Volume Module: >> Count Date: 16 Mar 2010 << 4:00-5:00PM
Base Vol: 4 2 1 1 3 0 1 1 3 0 0 0
Growth Adj: 1.00 1.00 1.00 1.00 1.00 1.00 1.00 1.00 1.00 1.00 1.00 1.00
Initial Bse: 4 2 1 1 3 0 1 1 3 0 0 0
Added Vol: 0 0 0 0 0 0 0 0 0 0 0 0
PasserByVol: 0 0 0 0 0 0 0 0 0 0 0 0
Initial Fut: 4 2 1 1 3 0 1 1 3 0 0 0
User Adj: 1.00 1.00 1.00 1.00 1.00 1.00 1.00 1.00 1.00 1.00 1.00 1.00
PHF Adj: 0.67 0.67 0.67 0.67 0.67 0.67 0.67 0.67 0.67 0.67 0.67 0.67
PHF Volume: 6 3 1 1 4 0 1 1 4 0 0 0
Reduct Vol: 0 0 0 0 0 0 0 0 0 0 0 0
FinalVolume: 6 3 1 1 4 0 1 1 4 0 0 0
------------|---------------||---------------||---------------||---------------|
Critical Gap Module:
Critical Gp: 4.1 xxxx xxxxx 4.1 xxxx xxxxx 6.4 6.5 6.2 7.1 6.5 6.2
FollowUpTim: 2.2 xxxx xxxxx 2.2 xxxx xxxxx 3.5 4.0 3.3 3.5 4.0 3.3
------------|---------------||---------------||---------------||---------------|
Capacity Module:
Cnflict Vol: 4 xxxx xxxxx 4 xxxx xxxxx 23 24 4 26 23 4
Potent Cap.: 1630 xxxx xxxxx 1630 xxxx xxxxx 998 873 1085 989 874 1086
Move Cap.: 1630 xxxx xxxxx 1630 xxxx xxxxx 995 869 1085 980 870 1086
Volume/Cap: 0.00 xxxx xxxx 0.00 xxxx xxxx 0.00 0.00 0.00 0.00 0.00 0.00
------------|---------------||---------------||---------------||---------------|
Level Of Service Module:
2Way95thQ: 0.0 xxxx xxxxx 0.0 xxxx xxxxx xxxx xxxx xxxxx xxxx xxxx xxxxx
Control Del: 7.2 xxxx xxxxx 7.2 xxxx xxxxx xxxxx xxxx xxxxx xxxxx xxxx xxxxx
LOS by Move: A * * A * * * * * * * *
Movement: LT - LTR - RT LT - LTR - RT LT - LTR - RT LT - LTR - RT
Shared Cap.: xxxx xxxx xxxxx xxxx xxxx xxxxx xxxx 1016 xxxxx xxxx 0 xxxxx
SharedQueue:xxxxx xxxx xxxxx 0.0 xxxx xxxxx xxxxx 0.0 xxxxx xxxxx xxxx xxxxx
Shrd ConDel:xxxxx xxxx xxxxx 7.2 xxxx xxxxx xxxxx 8.6 xxxxx xxxxx xxxx xxxxx
Shared LOS: * * * A * * * A * * * *
ApproachDel: xxxxxx xxxxxx 8.6 xxxxxx
ApproachLOS: * * A *
Note: Queue reported is the number of cars per lane.
Peak Hour Delay Signal Warrant Report
********************************************************************************
Intersection #2 Sinclair/Blair
********************************************************************************
Future Volume Alternative: Peak Hour Warrant NOT Met
COMPARE Wed Mar 24 12:32:55 2010 Page 2-12
Traffix 7.9.0215 Copyright (c) 2008 Dowling Associates, Inc. Licensed to F & P, INLAND EMPIRE
------------|---------------||---------------||---------------||---------------|
Approach: North Bound South Bound East Bound West Bound
Movement: L - T - R L - T - R L - T - R L - T - R
------------|---------------||---------------||---------------||---------------|
Control: Uncontrolled Uncontrolled Stop Sign Stop Sign
Lanes: 0 0 1! 0 0 0 1 0 0 0 0 0 1! 0 0 0 0 1! 0 0
Initial Vol: 4 2 1 1 3 0 1 1 3 0 0 0
ApproachDel: xxxxxx xxxxxx 8.6 xxxxxx
------------|---------------||---------------||---------------||---------------|
Approach[eastbound][lanes=1][control=Stop Sign]
Signal Warrant Rule #1: [vehicle-hours=0.0]
FAIL - Vehicle-hours less than 4 for one lane approach.
Signal Warrant Rule #2: [approach volume=5]
FAIL - Approach volume less than 100 for one lane approach.
Signal Warrant Rule #3: [approach count=3][total volume=16]
FAIL - Total volume less than 650 for intersection
with less than four approaches.
--------------------------------------------------------------------------------
SIGNAL WARRANT DISCLAIMER
This peak hour signal warrant analysis should be considered solely as an
"indicator" of the likelihood of an unsignalized intersection warranting
a traffic signal in the future. Intersections that exceed this warrant
are probably more likely to meet one or more of the other volume based
signal warrant (such as the 4-hour or 8-hour warrants).
The peak hour warrant analysis in this report is not intended to replace
a rigorous and complete traffic signal warrant analysis by the responsible
jurisdiction. Consideration of the other signal warrants, which is beyond
the scope of this software, may yield different results.
Peak Hour Volume Signal Warrant Report [Urban]
********************************************************************************
Intersection #2 Sinclair/Blair
********************************************************************************
Future Volume Alternative: Peak Hour Warrant NOT Met
------------|---------------||---------------||---------------||---------------|
Approach: North Bound South Bound East Bound West Bound
Movement: L - T - R L - T - R L - T - R L - T - R
------------|---------------||---------------||---------------||---------------|
Control: Uncontrolled Uncontrolled Stop Sign Stop Sign
Lanes: 0 0 1! 0 0 0 1 0 0 0 0 0 1! 0 0 0 0 1! 0 0
Initial Vol: 4 2 1 1 3 0 1 1 3 0 0 0
------------|---------------||---------------||---------------||---------------|
Major Street Volume: 11
Minor Approach Volume: 5
Minor Approach Volume Threshold: 1422
--------------------------------------------------------------------------------
SIGNAL WARRANT DISCLAIMER
This peak hour signal warrant analysis should be considered solely as an
"indicator" of the likelihood of an unsignalized intersection warranting
a traffic signal in the future. Intersections that exceed this warrant
are probably more likely to meet one or more of the other volume based
signal warrant (such as the 4-hour or 8-hour warrants).
The peak hour warrant analysis in this report is not intended to replace
a rigorous and complete traffic signal warrant analysis by the responsible
jurisdiction. Consideration of the other signal warrants, which is beyond
the scope of this software, may yield different results.

COMPARE Wed Mar 24 12:32:55 2010 Page 2-13
Traffix 7.9.0215 Copyright (c) 2008 Dowling Associates, Inc. Licensed to F & P, INLAND EMPIRE
Level Of Service Computation Report 2000 HCM Unsignalized (Future Volume Alternative)
E+C AM
Intersection #2: Sinclair/Blair Signal=Uncontrol/Rights=Include
Initial Vol: 0 7 0
Lanes: 0 0 1! 0 0
Signal=Stop
Signal=Stop
Initial Vol: Lanes: Rights=Include Vol Cnt Date: 3/16/2010 Rights=Include Lanes: Initial Vol:
1
0
Cycle Time (sec): 100 0
0
0
Loss Time (sec): 0 0
3 1!
Critical V/C: 0.000 1! 0
0
Avg Crit Del (sec/veh): 7.3 0
64 0
Avg Delay (sec/veh): 7.3 0 1
LOS: A
Lanes: 0 0 1! 0 0
Initial Vol: 4 5 1
Signal=Uncontrol/Rights=Include
Street Name: Blair Sinclair
Approach: North Bound South Bound East Bound West Bound
Movement: L - T - R L - T - R L - T - R L - T - R
------------|---------------||---------------||---------------||---------------|
Volume Module: >> Count Date: 16 Mar 2010 << 7:45AM-8:45AM
Base Vol: 4 5 1 0 7 0 1 3 10 1 0 0
Growth Adj: 1.00 1.00 1.00 1.00 1.00 1.00 1.00 1.00 1.00 1.00 1.00 1.00
Initial Bse: 4 5 1 0 7 0 1 3 10 1 0 0
Added Vol: 0 0 0 0 0 0 0 0 54 0 0 0
PasserByVol: 0 0 0 0 0 0 0 0 0 0 0 0
Initial Fut: 4 5 1 0 7 0 1 3 64 1 0 0
User Adj: 1.00 1.00 1.00 1.00 1.00 1.00 1.00 1.00 1.00 1.00 1.00 1.00
PHF Adj: 0.73 0.73 0.73 0.73 0.73 0.73 0.73 0.73 0.73 0.73 0.73 0.73
PHF Volume: 6 7 1 0 10 0 1 4 88 1 0 0
Reduct Vol: 0 0 0 0 0 0 0 0 0 0 0 0
FinalVolume: 6 7 1 0 10 0 1 4 88 1 0 0
------------|---------------||---------------||---------------||---------------|
Critical Gap Module:
Critical Gp: 4.1 xxxx xxxxx xxxxx xxxx xxxxx 7.1 6.5 6.2 7.1 xxxx xxxxx
FollowUpTim: 2.2 xxxx xxxxx xxxxx xxxx xxxxx 3.5 4.0 3.3 3.5 xxxx xxxxx
------------|---------------||---------------||---------------||---------------|
Capacity Module:
Cnflict Vol: 10 xxxx xxxxx xxxx xxxx xxxxx 28 29 10 74 xxxx xxxxx
Potent Cap.: 1623 xxxx xxxxx xxxx xxxx xxxxx 986 868 1078 921 xxxx xxxxx
Move Cap.: 1623 xxxx xxxxx xxxx xxxx xxxxx 984 865 1078 840 xxxx xxxxx
Volume/Cap: 0.00 xxxx xxxx xxxx xxxx xxxx 0.00 0.00 0.08 0.00 xxxx xxxx
------------|---------------||---------------||---------------||---------------|
Level Of Service Module:
2Way95thQ: 0.0 xxxx xxxxx xxxx xxxx xxxxx xxxx xxxx xxxxx 0.0 xxxx xxxxx
Control Del: 7.2 xxxx xxxxx xxxxx xxxx xxxxx xxxxx xxxx xxxxx 9.3 xxxx xxxxx
LOS by Move: A * * * * * * * * A * *
Movement: LT - LTR - RT LT - LTR - RT LT - LTR - RT LT - LTR - RT
Shared Cap.: xxxx xxxx xxxxx xxxx xxxx xxxxx xxxx 1065 xxxxx xxxx xxxx xxxxx
SharedQueue:xxxxx xxxx xxxxx xxxxx xxxx xxxxx xxxxx 0.3 xxxxx xxxxx xxxx xxxxx
Shrd ConDel:xxxxx xxxx xxxxx xxxxx xxxx xxxxx xxxxx 8.7 xxxxx xxxxx xxxx xxxxx
Shared LOS: * * * * * * * A * * * *
ApproachDel: xxxxxx xxxxxx 8.7 9.3
ApproachLOS: * * A A
Note: Queue reported is the number of cars per lane.
Peak Hour Delay Signal Warrant Report
********************************************************************************
Intersection #2 Sinclair/Blair
********************************************************************************
Future Volume Alternative: Peak Hour Warrant NOT Met
COMPARE Wed Mar 24 12:32:55 2010 Page 2-14
Traffix 7.9.0215 Copyright (c) 2008 Dowling Associates, Inc. Licensed to F & P, INLAND EMPIRE
------------|---------------||---------------||---------------||---------------|
Approach: North Bound South Bound East Bound West Bound
Movement: L - T - R L - T - R L - T - R L - T - R
------------|---------------||---------------||---------------||---------------|
Control: Uncontrolled Uncontrolled Stop Sign Stop Sign
Lanes: 0 0 1! 0 0 0 0 1 0 0 0 0 1! 0 0 1 0 0 0 0
Initial Vol: 4 5 1 0 7 0 1 3 64 1 0 0
ApproachDel: xxxxxx xxxxxx 8.7 9.3
------------|---------------||---------------||---------------||---------------|
Approach[eastbound][lanes=1][control=Stop Sign]
Signal Warrant Rule #1: [vehicle-hours=0.2]
FAIL - Vehicle-hours less than 4 for one lane approach.
Signal Warrant Rule #2: [approach volume=68]
FAIL - Approach volume less than 100 for one lane approach.
Signal Warrant Rule #3: [approach count=4][total volume=86]
FAIL - Total volume less than 650 for intersection
with less than four approaches.
--------------------------------------------------------------------------------
Approach[westbound][lanes=1][control=Stop Sign]
Signal Warrant Rule #1: [vehicle-hours=0.0]
FAIL - Vehicle-hours less than 4 for one lane approach.
Signal Warrant Rule #2: [approach volume=1]
FAIL - Approach volume less than 100 for one lane approach.
Signal Warrant Rule #3: [approach count=4][total volume=86]
FAIL - Total volume less than 650 for intersection
with less than four approaches.
--------------------------------------------------------------------------------
SIGNAL WARRANT DISCLAIMER
This peak hour signal warrant analysis should be considered solely as an
"indicator" of the likelihood of an unsignalized intersection warranting
a traffic signal in the future. Intersections that exceed this warrant
are probably more likely to meet one or more of the other volume based
signal warrant (such as the 4-hour or 8-hour warrants).
The peak hour warrant analysis in this report is not intended to replace
a rigorous and complete traffic signal warrant analysis by the responsible
jurisdiction. Consideration of the other signal warrants, which is beyond
the scope of this software, may yield different results.
Peak Hour Volume Signal Warrant Report [Urban]
********************************************************************************
Intersection #2 Sinclair/Blair
********************************************************************************
Future Volume Alternative: Peak Hour Warrant NOT Met
------------|---------------||---------------||---------------||---------------|
Approach: North Bound South Bound East Bound West Bound
Movement: L - T - R L - T - R L - T - R L - T - R
------------|---------------||---------------||---------------||---------------|
Control: Uncontrolled Uncontrolled Stop Sign Stop Sign
Lanes: 0 0 1! 0 0 0 0 1 0 0 0 0 1! 0 0 1 0 0 0 0
Initial Vol: 4 5 1 0 7 0 1 3 64 1 0 0
------------|---------------||---------------||---------------||---------------|
Major Street Volume: 17
Minor Approach Volume: 68
Minor Approach Volume Threshold: 1306
--------------------------------------------------------------------------------
SIGNAL WARRANT DISCLAIMER
This peak hour signal warrant analysis should be considered solely as an
"indicator" of the likelihood of an unsignalized intersection warranting
a traffic signal in the future. Intersections that exceed this warrant
are probably more likely to meet one or more of the other volume based
signal warrant (such as the 4-hour or 8-hour warrants).
The peak hour warrant analysis in this report is not intended to replace
a rigorous and complete traffic signal warrant analysis by the responsible
jurisdiction. Consideration of the other signal warrants, which is beyond
the scope of this software, may yield different results.

COMPARE Wed Mar 24 12:32:55 2010 Page 2-15
Traffix 7.9.0215 Copyright (c) 2008 Dowling Associates, Inc. Licensed to F & P, INLAND EMPIRE
Level Of Service Computation Report 2000 HCM Unsignalized (Future Volume Alternative)
E+C PM
Intersection #2: Sinclair/Blair Signal=Uncontrol/Rights=Include
Initial Vol: 0 3 1
Lanes: 0 0 1! 0 0
Signal=Stop
Signal=Stop
Initial Vol: Lanes: Rights=Include Vol Cnt Date: 3/16/2010 Rights=Include Lanes: Initial Vol:
1
0
Cycle Time (sec): 100 0
0
0
Loss Time (sec): 0 0
1 1!
Critical V/C: 0.000 1! 0
0
Avg Crit Del (sec/veh): 6.8 0
3 0
Avg Delay (sec/veh): 6.8 0 0
LOS: A
Lanes: 0 0 1! 0 0
Initial Vol: 58 2 1
Signal=Uncontrol/Rights=Include
Street Name: Blair Sinclair
Approach: North Bound South Bound East Bound West Bound
Movement: L - T - R L - T - R L - T - R L - T - R
------------|---------------||---------------||---------------||---------------|
Volume Module: >> Count Date: 16 Mar 2010 << 4:00-5:00PM
Base Vol: 4 2 1 1 3 0 1 1 3 0 0 0
Growth Adj: 1.00 1.00 1.00 1.00 1.00 1.00 1.00 1.00 1.00 1.00 1.00 1.00
Initial Bse: 4 2 1 1 3 0 1 1 3 0 0 0
Added Vol: 54 0 0 0 0 0 0 0 0 0 0 0
PasserByVol: 0 0 0 0 0 0 0 0 0 0 0 0
Initial Fut: 58 2 1 1 3 0 1 1 3 0 0 0
User Adj: 1.00 1.00 1.00 1.00 1.00 1.00 1.00 1.00 1.00 1.00 1.00 1.00
PHF Adj: 0.67 0.67 0.67 0.67 0.67 0.67 0.67 0.67 0.67 0.67 0.67 0.67
PHF Volume: 87 3 1 1 4 0 1 1 4 0 0 0
Reduct Vol: 0 0 0 0 0 0 0 0 0 0 0 0
FinalVolume: 87 3 1 1 4 0 1 1 4 0 0 0
------------|---------------||---------------||---------------||---------------|
Critical Gap Module:
Critical Gp: 4.1 xxxx xxxxx 4.1 xxxx xxxxx 6.4 6.5 6.2 7.1 6.5 6.2
FollowUpTim: 2.2 xxxx xxxxx 2.2 xxxx xxxxx 3.5 4.0 3.3 3.5 4.0 3.3
------------|---------------||---------------||---------------||---------------|
Capacity Module:
Cnflict Vol: 4 xxxx xxxxx 4 xxxx xxxxx 185 186 4 188 185 4
Potent Cap.: 1630 xxxx xxxxx 1630 xxxx xxxxx 809 712 1085 777 713 1086
Move Cap.: 1630 xxxx xxxxx 1630 xxxx xxxxx 774 672 1085 738 672 1086
Volume/Cap: 0.05 xxxx xxxx 0.00 xxxx xxxx 0.00 0.00 0.00 0.00 0.00 0.00
------------|---------------||---------------||---------------||---------------|
Level Of Service Module:
2Way95thQ: 0.2 xxxx xxxxx 0.0 xxxx xxxxx xxxx xxxx xxxxx xxxx xxxx xxxxx
Control Del: 7.3 xxxx xxxxx 7.2 xxxx xxxxx xxxxx xxxx xxxxx xxxxx xxxx xxxxx
LOS by Move: A * * A * * * * * * * *
Movement: LT - LTR - RT LT - LTR - RT LT - LTR - RT LT - LTR - RT
Shared Cap.: xxxx xxxx xxxxx xxxx xxxx xxxxx xxxx 901 xxxxx xxxx 0 xxxxx
SharedQueue:xxxxx xxxx xxxxx 0.0 xxxx xxxxx xxxxx 0.0 xxxxx xxxxx xxxx xxxxx
Shrd ConDel:xxxxx xxxx xxxxx 7.2 xxxx xxxxx xxxxx 9.0 xxxxx xxxxx xxxx xxxxx
Shared LOS: * * * A * * * A * * * *
ApproachDel: xxxxxx xxxxxx 9.0 xxxxxx
ApproachLOS: * * A *
Note: Queue reported is the number of cars per lane.
Peak Hour Delay Signal Warrant Report
********************************************************************************
Intersection #2 Sinclair/Blair
********************************************************************************
Future Volume Alternative: Peak Hour Warrant NOT Met
COMPARE Wed Mar 24 12:32:55 2010 Page 2-16
Traffix 7.9.0215 Copyright (c) 2008 Dowling Associates, Inc. Licensed to F & P, INLAND EMPIRE
------------|---------------||---------------||---------------||---------------|
Approach: North Bound South Bound East Bound West Bound
Movement: L - T - R L - T - R L - T - R L - T - R
------------|---------------||---------------||---------------||---------------|
Control: Uncontrolled Uncontrolled Stop Sign Stop Sign
Lanes: 0 0 1! 0 0 0 1 0 0 0 0 0 1! 0 0 0 0 1! 0 0
Initial Vol: 58 2 1 1 3 0 1 1 3 0 0 0
ApproachDel: xxxxxx xxxxxx 9.0 xxxxxx
------------|---------------||---------------||---------------||---------------|
Approach[eastbound][lanes=1][control=Stop Sign]
Signal Warrant Rule #1: [vehicle-hours=0.0]
FAIL - Vehicle-hours less than 4 for one lane approach.
Signal Warrant Rule #2: [approach volume=5]
FAIL - Approach volume less than 100 for one lane approach.
Signal Warrant Rule #3: [approach count=3][total volume=70]
FAIL - Total volume less than 650 for intersection
with less than four approaches.
--------------------------------------------------------------------------------
SIGNAL WARRANT DISCLAIMER
This peak hour signal warrant analysis should be considered solely as an
"indicator" of the likelihood of an unsignalized intersection warranting
a traffic signal in the future. Intersections that exceed this warrant
are probably more likely to meet one or more of the other volume based
signal warrant (such as the 4-hour or 8-hour warrants).
The peak hour warrant analysis in this report is not intended to replace
a rigorous and complete traffic signal warrant analysis by the responsible
jurisdiction. Consideration of the other signal warrants, which is beyond
the scope of this software, may yield different results.
Peak Hour Volume Signal Warrant Report [Urban]
********************************************************************************
Intersection #2 Sinclair/Blair
********************************************************************************
Future Volume Alternative: Peak Hour Warrant NOT Met
------------|---------------||---------------||---------------||---------------|
Approach: North Bound South Bound East Bound West Bound
Movement: L - T - R L - T - R L - T - R L - T - R
------------|---------------||---------------||---------------||---------------|
Control: Uncontrolled Uncontrolled Stop Sign Stop Sign
Lanes: 0 0 1! 0 0 0 1 0 0 0 0 0 1! 0 0 0 0 1! 0 0
Initial Vol: 58 2 1 1 3 0 1 1 3 0 0 0
------------|---------------||---------------||---------------||---------------|
Major Street Volume: 65
Minor Approach Volume: 5
Minor Approach Volume Threshold: 948
--------------------------------------------------------------------------------
SIGNAL WARRANT DISCLAIMER
This peak hour signal warrant analysis should be considered solely as an
"indicator" of the likelihood of an unsignalized intersection warranting
a traffic signal in the future. Intersections that exceed this warrant
are probably more likely to meet one or more of the other volume based
signal warrant (such as the 4-hour or 8-hour warrants).
The peak hour warrant analysis in this report is not intended to replace
a rigorous and complete traffic signal warrant analysis by the responsible
jurisdiction. Consideration of the other signal warrants, which is beyond
the scope of this software, may yield different results.

COMPARE Wed Mar 24 12:32:55 2010 Page 2-17
Traffix 7.9.0215 Copyright (c) 2008 Dowling Associates, Inc. Licensed to F & P, INLAND EMPIRE
Level Of Service Computation Report 2000 HCM Unsignalized (Future Volume Alternative)
Existing AM
Intersection #3: Peterson/Blair Signal=Uncontrol/Rights=Include
Initial Vol: 0 18 0
Lanes: 0 0 1! 0 0
Signal=Stop
Signal=Stop
Initial Vol: Lanes: Rights=Include Vol Cnt Date: 3/18/2010 Rights=Include Lanes: Initial Vol:
0
0
Cycle Time (sec): 100 0
0
0
Loss Time (sec): 0 0
0 1!
Critical V/C: 0.000 1! 0
0
Avg Crit Del (sec/veh): 0.0 0
0 0
Avg Delay (sec/veh): 0.0 0 1
LOS: B
Lanes: 0 0 1! 0 0
Initial Vol: 0 212 0
Signal=Uncontrol/Rights=Include
Street Name: Blair Peterson
Approach: North Bound South Bound East Bound West Bound
Movement: L - T - R L - T - R L - T - R L - T - R
------------|---------------||---------------||---------------||---------------|
Volume Module: >> Count Date: 18 Mar 2010 << 7:15-8:15AM
Base Vol: 0 212 0 0 18 0 0 0 0 1 0 0
Growth Adj: 1.00 1.00 1.00 1.00 1.00 1.00 1.00 1.00 1.00 1.00 1.00 1.00
Initial Bse: 0 212 0 0 18 0 0 0 0 1 0 0
Added Vol: 0 0 0 0 0 0 0 0 0 0 0 0
PasserByVol: 0 0 0 0 0 0 0 0 0 0 0 0
Initial Fut: 0 212 0 0 18 0 0 0 0 1 0 0
User Adj: 1.00 1.00 1.00 1.00 1.00 1.00 1.00 1.00 1.00 1.00 1.00 1.00
PHF Adj: 0.69 0.69 0.69 0.69 0.69 0.69 0.69 0.69 0.69 0.69 0.69 0.69
PHF Volume: 0 308 0 0 26 0 0 0 0 1 0 0
Reduct Vol: 0 0 0 0 0 0 0 0 0 0 0 0
FinalVolume: 0 308 0 0 26 0 0 0 0 1 0 0
------------|---------------||---------------||---------------||---------------|
Critical Gap Module:
Critical Gp:xxxxx xxxx xxxxx xxxxx xxxx xxxxx 7.1 6.5 6.2 6.4 xxxx xxxxx
FollowUpTim:xxxxx xxxx xxxxx xxxxx xxxx xxxxx 3.5 4.0 3.3 3.5 xxxx xxxxx
------------|---------------||---------------||---------------||---------------|
Capacity Module:
Cnflict Vol: xxxx xxxx xxxxx xxxx xxxx xxxxx 334 334 26 334 xxxx xxxxx
Potent Cap.: xxxx xxxx xxxxx xxxx xxxx xxxxx 623 589 1055 665 xxxx xxxxx
Move Cap.: xxxx xxxx xxxxx xxxx xxxx xxxxx 623 589 1055 665 xxxx xxxxx
Volume/Cap: xxxx xxxx xxxx xxxx xxxx xxxx 0.00 0.00 0.00 0.00 xxxx xxxx
------------|---------------||---------------||---------------||---------------|
Level Of Service Module:
2Way95thQ: xxxx xxxx xxxxx xxxx xxxx xxxxx xxxx xxxx xxxxx 0.0 xxxx xxxxx
Control Del:xxxxx xxxx xxxxx xxxxx xxxx xxxxx xxxxx xxxx xxxxx 10.4 xxxx xxxxx
LOS by Move: * * * * * * * * * B * *
Movement: LT - LTR - RT LT - LTR - RT LT - LTR - RT LT - LTR - RT
Shared Cap.: xxxx xxxx xxxxx xxxx xxxx xxxxx xxxx 0 xxxxx xxxx xxxx xxxxx
SharedQueue:xxxxx xxxx xxxxx xxxxx xxxx xxxxx xxxxx xxxx xxxxx xxxxx xxxx xxxxx
Shrd ConDel:xxxxx xxxx xxxxx xxxxx xxxx xxxxx xxxxx xxxx xxxxx xxxxx xxxx xxxxx
Shared LOS: * * * * * * * * * * * *
ApproachDel: xxxxxx xxxxxx xxxxxx 10.4
ApproachLOS: * * * B
Note: Queue reported is the number of cars per lane.
Peak Hour Delay Signal Warrant Report
********************************************************************************
Intersection #3 Peterson/Blair
********************************************************************************
Future Volume Alternative: Peak Hour Warrant NOT Met
COMPARE Wed Mar 24 12:32:55 2010 Page 2-18
Traffix 7.9.0215 Copyright (c) 2008 Dowling Associates, Inc. Licensed to F & P, INLAND EMPIRE
------------|---------------||---------------||---------------||---------------|
Approach: North Bound South Bound East Bound West Bound
Movement: L - T - R L - T - R L - T - R L - T - R
------------|---------------||---------------||---------------||---------------|
Control: Uncontrolled Uncontrolled Stop Sign Stop Sign
Lanes: 0 0 1 0 0 0 0 1 0 0 0 0 1! 0 0 1 0 0 0 0
Initial Vol: 0 212 0 0 18 0 0 0 0 1 0 0
ApproachDel: xxxxxx xxxxxx xxxxxx 10.4
------------|---------------||---------------||---------------||---------------|
Approach[westbound][lanes=1][control=Stop Sign]
Signal Warrant Rule #1: [vehicle-hours=0.0]
FAIL - Vehicle-hours less than 4 for one lane approach.
Signal Warrant Rule #2: [approach volume=1]
FAIL - Approach volume less than 100 for one lane approach.
Signal Warrant Rule #3: [approach count=3][total volume=231]
FAIL - Total volume less than 650 for intersection
with less than four approaches.
--------------------------------------------------------------------------------
SIGNAL WARRANT DISCLAIMER
This peak hour signal warrant analysis should be considered solely as an
"indicator" of the likelihood of an unsignalized intersection warranting
a traffic signal in the future. Intersections that exceed this warrant
are probably more likely to meet one or more of the other volume based
signal warrant (such as the 4-hour or 8-hour warrants).
The peak hour warrant analysis in this report is not intended to replace
a rigorous and complete traffic signal warrant analysis by the responsible
jurisdiction. Consideration of the other signal warrants, which is beyond
the scope of this software, may yield different results.
Peak Hour Volume Signal Warrant Report [Urban]
********************************************************************************
Intersection #3 Peterson/Blair
********************************************************************************
Future Volume Alternative: Peak Hour Warrant NOT Met
------------|---------------||---------------||---------------||---------------|
Approach: North Bound South Bound East Bound West Bound
Movement: L - T - R L - T - R L - T - R L - T - R
------------|---------------||---------------||---------------||---------------|
Control: Uncontrolled Uncontrolled Stop Sign Stop Sign
Lanes: 0 0 1 0 0 0 0 1 0 0 0 0 1! 0 0 1 0 0 0 0
Initial Vol: 0 212 0 0 18 0 0 0 0 1 0 0
------------|---------------||---------------||---------------||---------------|
Major Street Volume: 230
Minor Approach Volume: 1
Minor Approach Volume Threshold: 611
--------------------------------------------------------------------------------
SIGNAL WARRANT DISCLAIMER
This peak hour signal warrant analysis should be considered solely as an
"indicator" of the likelihood of an unsignalized intersection warranting
a traffic signal in the future. Intersections that exceed this warrant
are probably more likely to meet one or more of the other volume based
signal warrant (such as the 4-hour or 8-hour warrants).
The peak hour warrant analysis in this report is not intended to replace
a rigorous and complete traffic signal warrant analysis by the responsible
jurisdiction. Consideration of the other signal warrants, which is beyond
the scope of this software, may yield different results.

COMPARE Wed Mar 24 12:32:55 2010 Page 2-19
Traffix 7.9.0215 Copyright (c) 2008 Dowling Associates, Inc. Licensed to F & P, INLAND EMPIRE
Level Of Service Computation Report 2000 HCM Unsignalized (Future Volume Alternative)
Existing PM
Intersection #3: Peterson/Blair Signal=Uncontrol/Rights=Include
Initial Vol: 0 148 0
Lanes: 0 0 1! 0 0
Signal=Stop
Signal=Stop
Initial Vol: Lanes: Rights=Include Vol Cnt Date: 3/16/2010 Rights=Include Lanes: Initial Vol:
0
0
Cycle Time (sec): 100 0
0
0
Loss Time (sec): 0 0
0 1!
Critical V/C: 0.000 1! 0
0
Avg Crit Del (sec/veh): 0.2 0
0 0
Avg Delay (sec/veh): 0.2 0 3
LOS: A
Lanes: 0 0 1! 0 0
Initial Vol: 0 9 0
Signal=Uncontrol/Rights=Include
Street Name: Blair Peterson
Approach: North Bound South Bound East Bound West Bound
Movement: L - T - R L - T - R L - T - R L - T - R
------------|---------------||---------------||---------------||---------------|
Volume Module: >> Count Date: 16 Mar 2010 << 4:00-5:00PM
Base Vol: 0 9 0 0 148 0 0 0 0 3 0 0
Growth Adj: 1.00 1.00 1.00 1.00 1.00 1.00 1.00 1.00 1.00 1.00 1.00 1.00
Initial Bse: 0 9 0 0 148 0 0 0 0 3 0 0
Added Vol: 0 0 0 0 0 0 0 0 0 0 0 0
PasserByVol: 0 0 0 0 0 0 0 0 0 0 0 0
Initial Fut: 0 9 0 0 148 0 0 0 0 3 0 0
User Adj: 1.00 1.00 1.00 1.00 1.00 1.00 1.00 1.00 1.00 1.00 1.00 1.00
PHF Adj: 0.66 0.66 0.66 0.66 0.66 0.66 0.66 0.66 0.66 0.66 0.66 0.66
PHF Volume: 0 14 0 0 226 0 0 0 0 5 0 0
Reduct Vol: 0 0 0 0 0 0 0 0 0 0 0 0
FinalVolume: 0 14 0 0 226 0 0 0 0 5 0 0
------------|---------------||---------------||---------------||---------------|
Critical Gap Module:
Critical Gp:xxxxx xxxx xxxxx xxxxx xxxx xxxxx 7.1 6.5 6.2 6.4 xxxx xxxxx
FollowUpTim:xxxxx xxxx xxxxx xxxxx xxxx xxxxx 3.5 4.0 3.3 3.5 xxxx xxxxx
------------|---------------||---------------||---------------||---------------|
Capacity Module:
Cnflict Vol: xxxx xxxx xxxxx xxxx xxxx xxxxx 239 239 226 239 xxxx xxxxx
Potent Cap.: xxxx xxxx xxxxx xxxx xxxx xxxxx 719 665 819 753 xxxx xxxxx
Move Cap.: xxxx xxxx xxxxx xxxx xxxx xxxxx 719 665 819 753 xxxx xxxxx
Volume/Cap: xxxx xxxx xxxx xxxx xxxx xxxx 0.00 0.00 0.00 0.01 xxxx xxxx
------------|---------------||---------------||---------------||---------------|
Level Of Service Module:
2Way95thQ: xxxx xxxx xxxxx xxxx xxxx xxxxx xxxx xxxx xxxxx 0.0 xxxx xxxxx
Control Del:xxxxx xxxx xxxxx xxxxx xxxx xxxxx xxxxx xxxx xxxxx 9.8 xxxx xxxxx
LOS by Move: * * * * * * * * * A * *
Movement: LT - LTR - RT LT - LTR - RT LT - LTR - RT LT - LTR - RT
Shared Cap.: xxxx xxxx xxxxx xxxx xxxx xxxxx xxxx 0 xxxxx xxxx xxxx xxxxx
SharedQueue:xxxxx xxxx xxxxx xxxxx xxxx xxxxx xxxxx xxxx xxxxx xxxxx xxxx xxxxx
Shrd ConDel:xxxxx xxxx xxxxx xxxxx xxxx xxxxx xxxxx xxxx xxxxx xxxxx xxxx xxxxx
Shared LOS: * * * * * * * * * * * *
ApproachDel: xxxxxx xxxxxx xxxxxx 9.8
ApproachLOS: * * * A
Note: Queue reported is the number of cars per lane.
Peak Hour Delay Signal Warrant Report
********************************************************************************
Intersection #3 Peterson/Blair
********************************************************************************
Future Volume Alternative: Peak Hour Warrant NOT Met
COMPARE Wed Mar 24 12:32:55 2010 Page 2-20
Traffix 7.9.0215 Copyright (c) 2008 Dowling Associates, Inc. Licensed to F & P, INLAND EMPIRE
------------|---------------||---------------||---------------||---------------|
Approach: North Bound South Bound East Bound West Bound
Movement: L - T - R L - T - R L - T - R L - T - R
------------|---------------||---------------||---------------||---------------|
Control: Uncontrolled Uncontrolled Stop Sign Stop Sign
Lanes: 0 0 1 0 0 0 0 1 0 0 0 0 1! 0 0 1 0 0 0 0
Initial Vol: 0 9 0 0 148 0 0 0 0 3 0 0
ApproachDel: xxxxxx xxxxxx xxxxxx 9.8
------------|---------------||---------------||---------------||---------------|
Approach[westbound][lanes=1][control=Stop Sign]
Signal Warrant Rule #1: [vehicle-hours=0.0]
FAIL - Vehicle-hours less than 4 for one lane approach.
Signal Warrant Rule #2: [approach volume=3]
FAIL - Approach volume less than 100 for one lane approach.
Signal Warrant Rule #3: [approach count=3][total volume=160]
FAIL - Total volume less than 650 for intersection
with less than four approaches.
--------------------------------------------------------------------------------
SIGNAL WARRANT DISCLAIMER
This peak hour signal warrant analysis should be considered solely as an
"indicator" of the likelihood of an unsignalized intersection warranting
a traffic signal in the future. Intersections that exceed this warrant
are probably more likely to meet one or more of the other volume based
signal warrant (such as the 4-hour or 8-hour warrants).
The peak hour warrant analysis in this report is not intended to replace
a rigorous and complete traffic signal warrant analysis by the responsible
jurisdiction. Consideration of the other signal warrants, which is beyond
the scope of this software, may yield different results.
Peak Hour Volume Signal Warrant Report [Urban]
********************************************************************************
Intersection #3 Peterson/Blair
********************************************************************************
Future Volume Alternative: Peak Hour Warrant NOT Met
------------|---------------||---------------||---------------||---------------|
Approach: North Bound South Bound East Bound West Bound
Movement: L - T - R L - T - R L - T - R L - T - R
------------|---------------||---------------||---------------||---------------|
Control: Uncontrolled Uncontrolled Stop Sign Stop Sign
Lanes: 0 0 1 0 0 0 0 1 0 0 0 0 1! 0 0 1 0 0 0 0
Initial Vol: 0 9 0 0 148 0 0 0 0 3 0 0
------------|---------------||---------------||---------------||---------------|
Major Street Volume: 157
Minor Approach Volume: 3
Minor Approach Volume Threshold: 713
--------------------------------------------------------------------------------
SIGNAL WARRANT DISCLAIMER
This peak hour signal warrant analysis should be considered solely as an
"indicator" of the likelihood of an unsignalized intersection warranting
a traffic signal in the future. Intersections that exceed this warrant
are probably more likely to meet one or more of the other volume based
signal warrant (such as the 4-hour or 8-hour warrants).
The peak hour warrant analysis in this report is not intended to replace
a rigorous and complete traffic signal warrant analysis by the responsible
jurisdiction. Consideration of the other signal warrants, which is beyond
the scope of this software, may yield different results.

COMPARE Wed Mar 24 12:32:55 2010 Page 2-21
Traffix 7.9.0215 Copyright (c) 2008 Dowling Associates, Inc. Licensed to F & P, INLAND EMPIRE
Level Of Service Computation Report 2000 HCM Unsignalized (Future Volume Alternative)
E+C AM
Intersection #3: Peterson/Blair Signal=Uncontrol/Rights=Include
Initial Vol: 0 72 0
Lanes: 0 0 1! 0 0
Signal=Stop
Signal=Stop
Initial Vol: Lanes: Rights=Include Vol Cnt Date: 3/18/2010 Rights=Include Lanes: Initial Vol:
0
0
Cycle Time (sec): 100 0
0
0
Loss Time (sec): 0 0
0 1!
Critical V/C: 0.000 1! 0
0
Avg Crit Del (sec/veh): 0.0 0
0 0
Avg Delay (sec/veh): 0.0 0 1
LOS: B
Lanes: 0 0 1! 0 0
Initial Vol: 0 212 0
Signal=Uncontrol/Rights=Include
Street Name: Blair Peterson
Approach: North Bound South Bound East Bound West Bound
Movement: L - T - R L - T - R L - T - R L - T - R
------------|---------------||---------------||---------------||---------------|
Volume Module: >> Count Date: 18 Mar 2010 << 7:15-8:15AM
Base Vol: 0 212 0 0 18 0 0 0 0 1 0 0
Growth Adj: 1.00 1.00 1.00 1.00 1.00 1.00 1.00 1.00 1.00 1.00 1.00 1.00
Initial Bse: 0 212 0 0 18 0 0 0 0 1 0 0
Added Vol: 0 0 0 0 54 0 0 0 0 0 0 0
PasserByVol: 0 0 0 0 0 0 0 0 0 0 0 0
Initial Fut: 0 212 0 0 72 0 0 0 0 1 0 0
User Adj: 1.00 1.00 1.00 1.00 1.00 1.00 1.00 1.00 1.00 1.00 1.00 1.00
PHF Adj: 0.69 0.69 0.69 0.69 0.69 0.69 0.69 0.69 0.69 0.69 0.69 0.69
PHF Volume: 0 308 0 0 105 0 0 0 0 1 0 0
Reduct Vol: 0 0 0 0 0 0 0 0 0 0 0 0
FinalVolume: 0 308 0 0 105 0 0 0 0 1 0 0
------------|---------------||---------------||---------------||---------------|
Critical Gap Module:
Critical Gp:xxxxx xxxx xxxxx xxxxx xxxx xxxxx 7.1 6.5 6.2 6.4 xxxx xxxxx
FollowUpTim:xxxxx xxxx xxxxx xxxxx xxxx xxxxx 3.5 4.0 3.3 3.5 xxxx xxxxx
------------|---------------||---------------||---------------||---------------|
Capacity Module:
Cnflict Vol: xxxx xxxx xxxxx xxxx xxxx xxxxx 413 413 105 413 xxxx xxxxx
Potent Cap.: xxxx xxxx xxxxx xxxx xxxx xxxxx 553 533 955 599 xxxx xxxxx
Move Cap.: xxxx xxxx xxxxx xxxx xxxx xxxxx 553 533 955 599 xxxx xxxxx
Volume/Cap: xxxx xxxx xxxx xxxx xxxx xxxx 0.00 0.00 0.00 0.00 xxxx xxxx
------------|---------------||---------------||---------------||---------------|
Level Of Service Module:
2Way95thQ: xxxx xxxx xxxxx xxxx xxxx xxxxx xxxx xxxx xxxxx 0.0 xxxx xxxxx
Control Del:xxxxx xxxx xxxxx xxxxx xxxx xxxxx xxxxx xxxx xxxxx 11.0 xxxx xxxxx
LOS by Move: * * * * * * * * * B * *
Movement: LT - LTR - RT LT - LTR - RT LT - LTR - RT LT - LTR - RT
Shared Cap.: xxxx xxxx xxxxx xxxx xxxx xxxxx xxxx 0 xxxxx xxxx xxxx xxxxx
SharedQueue:xxxxx xxxx xxxxx xxxxx xxxx xxxxx xxxxx xxxx xxxxx xxxxx xxxx xxxxx
Shrd ConDel:xxxxx xxxx xxxxx xxxxx xxxx xxxxx xxxxx xxxx xxxxx xxxxx xxxx xxxxx
Shared LOS: * * * * * * * * * * * *
ApproachDel: xxxxxx xxxxxx xxxxxx 11.0
ApproachLOS: * * * B
Note: Queue reported is the number of cars per lane.
Peak Hour Delay Signal Warrant Report
********************************************************************************
Intersection #3 Peterson/Blair
********************************************************************************
Future Volume Alternative: Peak Hour Warrant NOT Met
COMPARE Wed Mar 24 12:32:55 2010 Page 2-22
Traffix 7.9.0215 Copyright (c) 2008 Dowling Associates, Inc. Licensed to F & P, INLAND EMPIRE
------------|---------------||---------------||---------------||---------------|
Approach: North Bound South Bound East Bound West Bound
Movement: L - T - R L - T - R L - T - R L - T - R
------------|---------------||---------------||---------------||---------------|
Control: Uncontrolled Uncontrolled Stop Sign Stop Sign
Lanes: 0 0 1 0 0 0 0 1 0 0 0 0 1! 0 0 1 0 0 0 0
Initial Vol: 0 212 0 0 72 0 0 0 0 1 0 0
ApproachDel: xxxxxx xxxxxx xxxxxx 11.0
------------|---------------||---------------||---------------||---------------|
Approach[westbound][lanes=1][control=Stop Sign]
Signal Warrant Rule #1: [vehicle-hours=0.0]
FAIL - Vehicle-hours less than 4 for one lane approach.
Signal Warrant Rule #2: [approach volume=1]
FAIL - Approach volume less than 100 for one lane approach.
Signal Warrant Rule #3: [approach count=3][total volume=285]
FAIL - Total volume less than 650 for intersection
with less than four approaches.
--------------------------------------------------------------------------------
SIGNAL WARRANT DISCLAIMER
This peak hour signal warrant analysis should be considered solely as an
"indicator" of the likelihood of an unsignalized intersection warranting
a traffic signal in the future. Intersections that exceed this warrant
are probably more likely to meet one or more of the other volume based
signal warrant (such as the 4-hour or 8-hour warrants).
The peak hour warrant analysis in this report is not intended to replace
a rigorous and complete traffic signal warrant analysis by the responsible
jurisdiction. Consideration of the other signal warrants, which is beyond
the scope of this software, may yield different results.
Peak Hour Volume Signal Warrant Report [Urban]
********************************************************************************
Intersection #3 Peterson/Blair
********************************************************************************
Future Volume Alternative: Peak Hour Warrant NOT Met
------------|---------------||---------------||---------------||---------------|
Approach: North Bound South Bound East Bound West Bound
Movement: L - T - R L - T - R L - T - R L - T - R
------------|---------------||---------------||---------------||---------------|
Control: Uncontrolled Uncontrolled Stop Sign Stop Sign
Lanes: 0 0 1 0 0 0 0 1 0 0 0 0 1! 0 0 1 0 0 0 0
Initial Vol: 0 212 0 0 72 0 0 0 0 1 0 0
------------|---------------||---------------||---------------||---------------|
Major Street Volume: 284
Minor Approach Volume: 1
Minor Approach Volume Threshold: 555
--------------------------------------------------------------------------------
SIGNAL WARRANT DISCLAIMER
This peak hour signal warrant analysis should be considered solely as an
"indicator" of the likelihood of an unsignalized intersection warranting
a traffic signal in the future. Intersections that exceed this warrant
are probably more likely to meet one or more of the other volume based
signal warrant (such as the 4-hour or 8-hour warrants).
The peak hour warrant analysis in this report is not intended to replace
a rigorous and complete traffic signal warrant analysis by the responsible
jurisdiction. Consideration of the other signal warrants, which is beyond
the scope of this software, may yield different results.
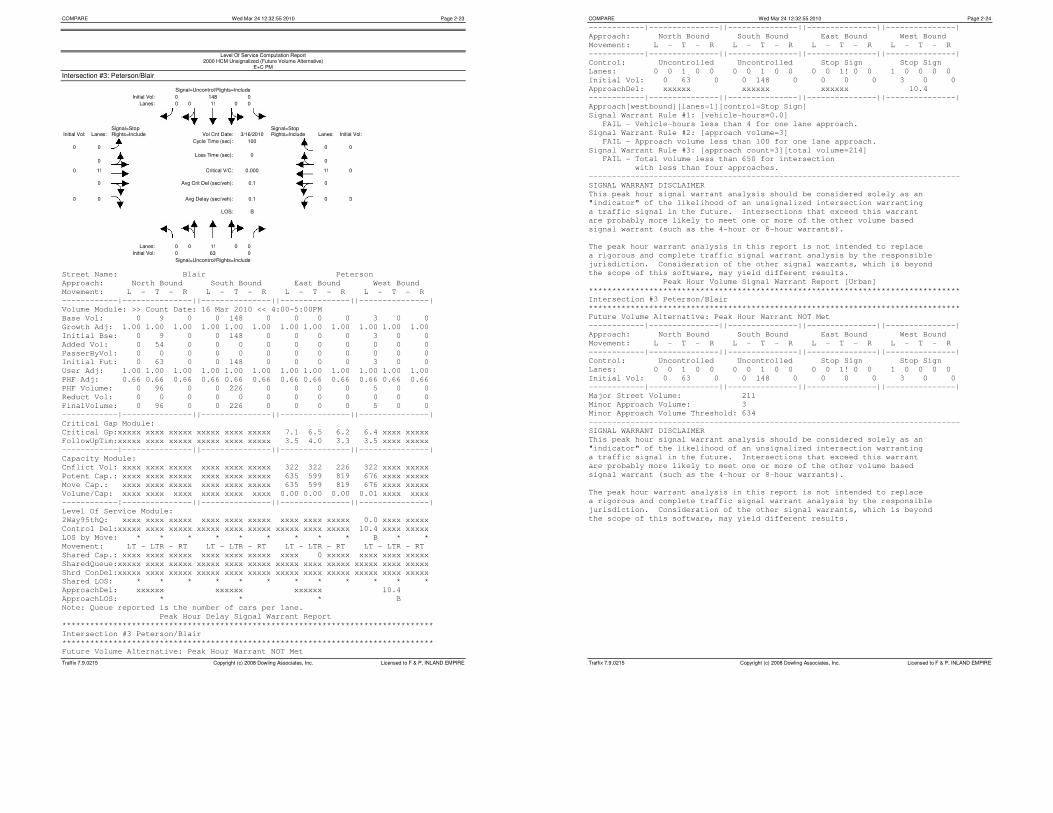
COMPARE Wed Mar 24 12:32:55 2010 Page 2-23
Traffix 7.9.0215 Copyright (c) 2008 Dowling Associates, Inc. Licensed to F & P, INLAND EMPIRE
Level Of Service Computation Report 2000 HCM Unsignalized (Future Volume Alternative)
E+C PM
Intersection #3: Peterson/Blair Signal=Uncontrol/Rights=Include
Initial Vol: 0 148 0
Lanes: 0 0 1! 0 0
Signal=Stop
Signal=Stop
Initial Vol: Lanes: Rights=Include Vol Cnt Date: 3/16/2010 Rights=Include Lanes: Initial Vol:
0
0
Cycle Time (sec): 100 0
0
0
Loss Time (sec): 0 0
0 1!
Critical V/C: 0.000 1! 0
0
Avg Crit Del (sec/veh): 0.1 0
0 0
Avg Delay (sec/veh): 0.1 0 3
LOS: B
Lanes: 0 0 1! 0 0
Initial Vol: 0 63 0
Signal=Uncontrol/Rights=Include
Street Name: Blair Peterson
Approach: North Bound South Bound East Bound West Bound
Movement: L - T - R L - T - R L - T - R L - T - R
------------|---------------||---------------||---------------||---------------|
Volume Module: >> Count Date: 16 Mar 2010 << 4:00-5:00PM
Base Vol: 0 9 0 0 148 0 0 0 0 3 0 0
Growth Adj: 1.00 1.00 1.00 1.00 1.00 1.00 1.00 1.00 1.00 1.00 1.00 1.00
Initial Bse: 0 9 0 0 148 0 0 0 0 3 0 0
Added Vol: 0 54 0 0 0 0 0 0 0 0 0 0
PasserByVol: 0 0 0 0 0 0 0 0 0 0 0 0
Initial Fut: 0 63 0 0 148 0 0 0 0 3 0 0
User Adj: 1.00 1.00 1.00 1.00 1.00 1.00 1.00 1.00 1.00 1.00 1.00 1.00
PHF Adj: 0.66 0.66 0.66 0.66 0.66 0.66 0.66 0.66 0.66 0.66 0.66 0.66
PHF Volume: 0 96 0 0 226 0 0 0 0 5 0 0
Reduct Vol: 0 0 0 0 0 0 0 0 0 0 0 0
FinalVolume: 0 96 0 0 226 0 0 0 0 5 0 0
------------|---------------||---------------||---------------||---------------|
Critical Gap Module:
Critical Gp:xxxxx xxxx xxxxx xxxxx xxxx xxxxx 7.1 6.5 6.2 6.4 xxxx xxxxx
FollowUpTim:xxxxx xxxx xxxxx xxxxx xxxx xxxxx 3.5 4.0 3.3 3.5 xxxx xxxxx
------------|---------------||---------------||---------------||---------------|
Capacity Module:
Cnflict Vol: xxxx xxxx xxxxx xxxx xxxx xxxxx 322 322 226 322 xxxx xxxxx
Potent Cap.: xxxx xxxx xxxxx xxxx xxxx xxxxx 635 599 819 676 xxxx xxxxx
Move Cap.: xxxx xxxx xxxxx xxxx xxxx xxxxx 635 599 819 676 xxxx xxxxx
Volume/Cap: xxxx xxxx xxxx xxxx xxxx xxxx 0.00 0.00 0.00 0.01 xxxx xxxx
------------|---------------||---------------||---------------||---------------|
Level Of Service Module:
2Way95thQ: xxxx xxxx xxxxx xxxx xxxx xxxxx xxxx xxxx xxxxx 0.0 xxxx xxxxx
Control Del:xxxxx xxxx xxxxx xxxxx xxxx xxxxx xxxxx xxxx xxxxx 10.4 xxxx xxxxx
LOS by Move: * * * * * * * * * B * *
Movement: LT - LTR - RT LT - LTR - RT LT - LTR - RT LT - LTR - RT
Shared Cap.: xxxx xxxx xxxxx xxxx xxxx xxxxx xxxx 0 xxxxx xxxx xxxx xxxxx
SharedQueue:xxxxx xxxx xxxxx xxxxx xxxx xxxxx xxxxx xxxx xxxxx xxxxx xxxx xxxxx
Shrd ConDel:xxxxx xxxx xxxxx xxxxx xxxx xxxxx xxxxx xxxx xxxxx xxxxx xxxx xxxxx
Shared LOS: * * * * * * * * * * * *
ApproachDel: xxxxxx xxxxxx xxxxxx 10.4
ApproachLOS: * * * B
Note: Queue reported is the number of cars per lane.
Peak Hour Delay Signal Warrant Report
********************************************************************************
Intersection #3 Peterson/Blair
********************************************************************************
Future Volume Alternative: Peak Hour Warrant NOT Met
COMPARE Wed Mar 24 12:32:55 2010 Page 2-24
Traffix 7.9.0215 Copyright (c) 2008 Dowling Associates, Inc. Licensed to F & P, INLAND EMPIRE
------------|---------------||---------------||---------------||---------------|
Approach: North Bound South Bound East Bound West Bound
Movement: L - T - R L - T - R L - T - R L - T - R
------------|---------------||---------------||---------------||---------------|
Control: Uncontrolled Uncontrolled Stop Sign Stop Sign
Lanes: 0 0 1 0 0 0 0 1 0 0 0 0 1! 0 0 1 0 0 0 0
Initial Vol: 0 63 0 0 148 0 0 0 0 3 0 0
ApproachDel: xxxxxx xxxxxx xxxxxx 10.4
------------|---------------||---------------||---------------||---------------|
Approach[westbound][lanes=1][control=Stop Sign]
Signal Warrant Rule #1: [vehicle-hours=0.0]
FAIL - Vehicle-hours less than 4 for one lane approach.
Signal Warrant Rule #2: [approach volume=3]
FAIL - Approach volume less than 100 for one lane approach.
Signal Warrant Rule #3: [approach count=3][total volume=214]
FAIL - Total volume less than 650 for intersection
with less than four approaches.
--------------------------------------------------------------------------------
SIGNAL WARRANT DISCLAIMER
This peak hour signal warrant analysis should be considered solely as an
"indicator" of the likelihood of an unsignalized intersection warranting
a traffic signal in the future. Intersections that exceed this warrant
are probably more likely to meet one or more of the other volume based
signal warrant (such as the 4-hour or 8-hour warrants).
The peak hour warrant analysis in this report is not intended to replace
a rigorous and complete traffic signal warrant analysis by the responsible
jurisdiction. Consideration of the other signal warrants, which is beyond
the scope of this software, may yield different results.
Peak Hour Volume Signal Warrant Report [Urban]
********************************************************************************
Intersection #3 Peterson/Blair
********************************************************************************
Future Volume Alternative: Peak Hour Warrant NOT Met
------------|---------------||---------------||---------------||---------------|
Approach: North Bound South Bound East Bound West Bound
Movement: L - T - R L - T - R L - T - R L - T - R
------------|---------------||---------------||---------------||---------------|
Control: Uncontrolled Uncontrolled Stop Sign Stop Sign
Lanes: 0 0 1 0 0 0 0 1 0 0 0 0 1! 0 0 1 0 0 0 0
Initial Vol: 0 63 0 0 148 0 0 0 0 3 0 0
------------|---------------||---------------||---------------||---------------|
Major Street Volume: 211
Minor Approach Volume: 3
Minor Approach Volume Threshold: 634
--------------------------------------------------------------------------------
SIGNAL WARRANT DISCLAIMER
This peak hour signal warrant analysis should be considered solely as an
"indicator" of the likelihood of an unsignalized intersection warranting
a traffic signal in the future. Intersections that exceed this warrant
are probably more likely to meet one or more of the other volume based
signal warrant (such as the 4-hour or 8-hour warrants).
The peak hour warrant analysis in this report is not intended to replace
a rigorous and complete traffic signal warrant analysis by the responsible
jurisdiction. Consideration of the other signal warrants, which is beyond
the scope of this software, may yield different results.

COMPARE Wed Mar 24 12:32:55 2010 Page 2-25
Traffix 7.9.0215 Copyright (c) 2008 Dowling Associates, Inc. Licensed to F & P, INLAND EMPIRE
Level Of Service Computation Report 2000 HCM Unsignalized (Future Volume Alternative)
Existing AM
Intersection #4: SR-115/Blair Signal=Stop/Rights=Include
Initial Vol: 20 1 3
Lanes: 1 0 0 1 0
Signal=Uncontrol
Signal=Uncontrol
Initial Vol: Lanes: Rights=Include Vol Cnt Date: 3/16/2010 Rights=Include Lanes: Initial Vol:
164
1
Cycle Time (sec): 100 0
27
0
Loss Time (sec): 0 1
39 0
Critical V/C: 0.000 0 23
1
Avg Crit Del (sec/veh): 5.5 0
1 0
Avg Delay (sec/veh): 5.5 1 2
LOS: B
Lanes: 0 0 1! 0 0
Initial Vol: 2 1 1
Signal=Stop/Rights=Include
Street Name: Blair SR-115
Approach: North Bound South Bound East Bound West Bound
Movement: L - T - R L - T - R L - T - R L - T - R
------------|---------------||---------------||---------------||---------------|
Volume Module: >> Count Date: 16 Mar 2010 << 7:30-8:30AM
Base Vol: 2 1 1 3 1 20 164 39 1 2 23 27
Growth Adj: 1.00 1.00 1.00 1.00 1.00 1.00 1.00 1.00 1.00 1.00 1.00 1.00
Initial Bse: 2 1 1 3 1 20 164 39 1 2 23 27
Added Vol: 0 0 0 0 0 0 0 0 0 0 0 0
PasserByVol: 0 0 0 0 0 0 0 0 0 0 0 0
Initial Fut: 2 1 1 3 1 20 164 39 1 2 23 27
User Adj: 1.00 1.00 1.00 1.00 1.00 1.00 1.00 1.00 1.00 1.00 1.00 1.00
PHF Adj: 0.73 0.73 0.73 0.73 0.73 0.73 0.73 0.73 0.73 0.73 0.73 0.73
PHF Volume: 3 1 1 4 1 27 224 53 1 3 31 37
Reduct Vol: 0 0 0 0 0 0 0 0 0 0 0 0
FinalVolume: 3 1 1 4 1 27 224 53 1 3 31 37
------------|---------------||---------------||---------------||---------------|
Critical Gap Module:
Critical Gp: 7.1 6.5 6.2 7.1 6.5 6.2 4.1 xxxx xxxxx 4.1 xxxx xxxxx
FollowUpTim: 3.5 4.0 3.3 3.5 4.0 3.3 2.2 xxxx xxxxx 2.2 xxxx xxxxx
------------|---------------||---------------||---------------||---------------|
Capacity Module:
Cnflict Vol: 572 576 54 559 558 50 68 xxxx xxxxx 55 xxxx xxxxx
Potent Cap.: 434 431 1019 443 441 1024 1546 xxxx xxxxx 1563 xxxx xxxxx
Move Cap.: 374 368 1019 392 376 1024 1546 xxxx xxxxx 1563 xxxx xxxxx
Volume/Cap: 0.01 0.00 0.00 0.01 0.00 0.03 0.14 xxxx xxxx 0.00 xxxx xxxx
------------|---------------||---------------||---------------||---------------|
Level Of Service Module:
2Way95thQ: xxxx xxxx xxxxx xxxx xxxx 0.1 0.5 xxxx xxxxx 0.0 xxxx xxxxx
Control Del:xxxxx xxxx xxxxx xxxxx xxxx 8.6 7.7 xxxx xxxxx 7.3 xxxx xxxxx
LOS by Move: * * * * * A A * * A * *
Movement: LT - LTR - RT LT - LTR - RT LT - LTR - RT LT - LTR - RT
Shared Cap.: xxxx 442 xxxxx 388 xxxx xxxxx xxxx xxxx xxxxx xxxx xxxx xxxxx
SharedQueue:xxxxx 0.0 xxxxx 0.0 xxxx xxxxx xxxxx xxxx xxxxx xxxxx xxxx xxxxx
Shrd ConDel:xxxxx 13.2 xxxxx 14.4 xxxx xxxxx xxxxx xxxx xxxxx xxxxx xxxx xxxxx
Shared LOS: * B * B * * * * * * * *
ApproachDel: 13.2 9.6 xxxxxx xxxxxx
ApproachLOS: B A * *
Note: Queue reported is the number of cars per lane.
Peak Hour Delay Signal Warrant Report
********************************************************************************
Intersection #4 SR-115/Blair
********************************************************************************
Future Volume Alternative: Peak Hour Warrant NOT Met
COMPARE Wed Mar 24 12:32:55 2010 Page 2-26
Traffix 7.9.0215 Copyright (c) 2008 Dowling Associates, Inc. Licensed to F & P, INLAND EMPIRE
------------|---------------||---------------||---------------||---------------|
Approach: North Bound South Bound East Bound West Bound
Movement: L - T - R L - T - R L - T - R L - T - R
------------|---------------||---------------||---------------||---------------|
Control: Stop Sign Stop Sign Uncontrolled Uncontrolled
Lanes: 0 0 1! 0 0 0 1 0 0 1 1 0 0 1 0 1 0 0 1 0
Initial Vol: 2 1 1 3 1 20 164 39 1 2 23 27
ApproachDel: 13.2 9.6 xxxxxx xxxxxx
------------|---------------||---------------||---------------||---------------|
Approach[northbound][lanes=1][control=Stop Sign]
Signal Warrant Rule #1: [vehicle-hours=0.0]
FAIL - Vehicle-hours less than 4 for one lane approach.
Signal Warrant Rule #2: [approach volume=4]
FAIL - Approach volume less than 100 for one lane approach.
Signal Warrant Rule #3: [approach count=4][total volume=284]
FAIL - Total volume less than 650 for intersection
with less than four approaches.
--------------------------------------------------------------------------------
Approach[southbound][lanes=2][control=Stop Sign]
Signal Warrant Rule #1: [vehicle-hours=0.1]
FAIL - Vehicle-hours less than 5 for two or more lane approach.
Signal Warrant Rule #2: [approach volume=24]
FAIL - Approach volume less than 150 for two or more lane approach.
Signal Warrant Rule #3: [approach count=4][total volume=284]
FAIL - Total volume less than 650 for intersection
with less than four approaches.
--------------------------------------------------------------------------------
SIGNAL WARRANT DISCLAIMER
This peak hour signal warrant analysis should be considered solely as an
"indicator" of the likelihood of an unsignalized intersection warranting
a traffic signal in the future. Intersections that exceed this warrant
are probably more likely to meet one or more of the other volume based
signal warrant (such as the 4-hour or 8-hour warrants).
The peak hour warrant analysis in this report is not intended to replace
a rigorous and complete traffic signal warrant analysis by the responsible
jurisdiction. Consideration of the other signal warrants, which is beyond
the scope of this software, may yield different results.
Peak Hour Volume Signal Warrant Report [Urban]
********************************************************************************
Intersection #4 SR-115/Blair
********************************************************************************
Future Volume Alternative: Peak Hour Warrant NOT Met
------------|---------------||---------------||---------------||---------------|
Approach: North Bound South Bound East Bound West Bound
Movement: L - T - R L - T - R L - T - R L - T - R
------------|---------------||---------------||---------------||---------------|
Control: Stop Sign Stop Sign Uncontrolled Uncontrolled
Lanes: 0 0 1! 0 0 0 1 0 0 1 1 0 0 1 0 1 0 0 1 0
Initial Vol: 2 1 1 3 1 20 164 39 1 2 23 27
------------|---------------||---------------||---------------||---------------|
Major Street Volume: 256
Minor Approach Volume: 24
Minor Approach Volume Threshold: 960
--------------------------------------------------------------------------------
SIGNAL WARRANT DISCLAIMER
This peak hour signal warrant analysis should be considered solely as an
"indicator" of the likelihood of an unsignalized intersection warranting
a traffic signal in the future. Intersections that exceed this warrant
are probably more likely to meet one or more of the other volume based
signal warrant (such as the 4-hour or 8-hour warrants).
The peak hour warrant analysis in this report is not intended to replace
a rigorous and complete traffic signal warrant analysis by the responsible
jurisdiction. Consideration of the other signal warrants, which is beyond
the scope of this software, may yield different results.

COMPARE Wed Mar 24 12:32:55 2010 Page 2-27
Traffix 7.9.0215 Copyright (c) 2008 Dowling Associates, Inc. Licensed to F & P, INLAND EMPIRE
Level Of Service Computation Report 2000 HCM Unsignalized (Future Volume Alternative)
Existing PM
Intersection #4: SR-115/Blair Signal=Stop/Rights=Include
Initial Vol: 140 4 22
Lanes: 1 0 0 1 0
Signal=Uncontrol
Signal=Uncontrol
Initial Vol: Lanes: Rights=Include Vol Cnt Date: 3/16/2010 Rights=Include Lanes: Initial Vol:
7
1
Cycle Time (sec): 100 0
2
0
Loss Time (sec): 0 1
29 0
Critical V/C: 0.000 0 50
1
Avg Crit Del (sec/veh): 6.4 0
2 0
Avg Delay (sec/veh): 6.4 1 0
LOS: A
Lanes: 0 0 1! 0 0
Initial Vol: 0 1 1
Signal=Stop/Rights=Include
Street Name: Blair SR-115
Approach: North Bound South Bound East Bound West Bound
Movement: L - T - R L - T - R L - T - R L - T - R
------------|---------------||---------------||---------------||---------------|
Volume Module: >> Count Date: 16 Mar 2010 << 4:00-5:00PM
Base Vol: 0 1 1 22 4 140 7 29 2 0 50 2
Growth Adj: 1.00 1.00 1.00 1.00 1.00 1.00 1.00 1.00 1.00 1.00 1.00 1.00
Initial Bse: 0 1 1 22 4 140 7 29 2 0 50 2
Added Vol: 0 0 0 0 0 0 0 0 0 0 0 0
PasserByVol: 0 0 0 0 0 0 0 0 0 0 0 0
Initial Fut: 0 1 1 22 4 140 7 29 2 0 50 2
User Adj: 1.00 1.00 1.00 1.00 1.00 1.00 1.00 1.00 1.00 1.00 1.00 1.00
PHF Adj: 0.68 0.68 0.68 0.68 0.68 0.68 0.68 0.68 0.68 0.68 0.68 0.68
PHF Volume: 0 1 1 32 6 206 10 43 3 0 74 3
Reduct Vol: 0 0 0 0 0 0 0 0 0 0 0 0
FinalVolume: 0 1 1 32 6 206 10 43 3 0 74 3
------------|---------------||---------------||---------------||---------------|
Critical Gap Module:
Critical Gp:xxxxx 6.5 6.2 7.1 6.5 6.2 4.1 xxxx xxxxx xxxxx xxxx xxxxx
FollowUpTim:xxxxx 4.0 3.3 3.5 4.0 3.3 2.2 xxxx xxxxx xxxxx xxxx xxxxx
------------|---------------||---------------||---------------||---------------|
Capacity Module:
Cnflict Vol: xxxx 141 44 141 141 75 77 xxxx xxxxx xxxx xxxx xxxxx
Potent Cap.: xxxx 753 1032 833 753 992 1535 xxxx xxxxx xxxx xxxx xxxxx
Move Cap.: xxxx 748 1032 826 748 992 1535 xxxx xxxxx xxxx xxxx xxxxx
Volume/Cap: xxxx 0.00 0.00 0.04 0.01 0.21 0.01 xxxx xxxx xxxx xxxx xxxx
------------|---------------||---------------||---------------||---------------|
Level Of Service Module:
2Way95thQ: xxxx xxxx xxxxx xxxx xxxx 0.8 0.0 xxxx xxxxx xxxx xxxx xxxxx
Control Del:xxxxx xxxx xxxxx xxxxx xxxx 9.6 7.4 xxxx xxxxx xxxxx xxxx xxxxx
LOS by Move: * * * * * A A * * * * *
Movement: LT - LTR - RT LT - LTR - RT LT - LTR - RT LT - LTR - RT
Shared Cap.: xxxx xxxx 867 813 xxxx xxxxx xxxx xxxx xxxxx xxxx xxxx xxxxx
SharedQueue:xxxxx xxxx 0.0 0.1 xxxx xxxxx xxxxx xxxx xxxxx xxxxx xxxx xxxxx
Shrd ConDel:xxxxx xxxx 9.2 9.6 xxxx xxxxx xxxxx xxxx xxxxx xxxxx xxxx xxxxx
Shared LOS: * * A A * * * * * * * *
ApproachDel: 9.2 9.6 xxxxxx xxxxxx
ApproachLOS: A A * *
Note: Queue reported is the number of cars per lane.
Peak Hour Delay Signal Warrant Report
********************************************************************************
Intersection #4 SR-115/Blair
********************************************************************************
Future Volume Alternative: Peak Hour Warrant NOT Met
COMPARE Wed Mar 24 12:32:55 2010 Page 2-28
Traffix 7.9.0215 Copyright (c) 2008 Dowling Associates, Inc. Licensed to F & P, INLAND EMPIRE
------------|---------------||---------------||---------------||---------------|
Approach: North Bound South Bound East Bound West Bound
Movement: L - T - R L - T - R L - T - R L - T - R
------------|---------------||---------------||---------------||---------------|
Control: Stop Sign Stop Sign Uncontrolled Uncontrolled
Lanes: 0 0 0 1 0 0 1 0 0 1 1 0 0 1 0 1 0 0 1 0
Initial Vol: 0 1 1 22 4 140 7 29 2 0 50 2
ApproachDel: 9.2 9.6 xxxxxx xxxxxx
------------|---------------||---------------||---------------||---------------|
Approach[northbound][lanes=1][control=Stop Sign]
Signal Warrant Rule #1: [vehicle-hours=0.0]
FAIL - Vehicle-hours less than 4 for one lane approach.
Signal Warrant Rule #2: [approach volume=2]
FAIL - Approach volume less than 100 for one lane approach.
Signal Warrant Rule #3: [approach count=4][total volume=258]
FAIL - Total volume less than 650 for intersection
with less than four approaches.
--------------------------------------------------------------------------------
Approach[southbound][lanes=2][control=Stop Sign]
Signal Warrant Rule #1: [vehicle-hours=0.4]
FAIL - Vehicle-hours less than 5 for two or more lane approach.
Signal Warrant Rule #2: [approach volume=166]
SUCCEED - Approach volume >= 150 for two or more lane approach.
Signal Warrant Rule #3: [approach count=4][total volume=258]
FAIL - Total volume less than 650 for intersection
with less than four approaches.
--------------------------------------------------------------------------------
SIGNAL WARRANT DISCLAIMER
This peak hour signal warrant analysis should be considered solely as an
"indicator" of the likelihood of an unsignalized intersection warranting
a traffic signal in the future. Intersections that exceed this warrant
are probably more likely to meet one or more of the other volume based
signal warrant (such as the 4-hour or 8-hour warrants).
The peak hour warrant analysis in this report is not intended to replace
a rigorous and complete traffic signal warrant analysis by the responsible
jurisdiction. Consideration of the other signal warrants, which is beyond
the scope of this software, may yield different results.
Peak Hour Volume Signal Warrant Report [Urban]
********************************************************************************
Intersection #4 SR-115/Blair
********************************************************************************
Future Volume Alternative: Peak Hour Warrant NOT Met
------------|---------------||---------------||---------------||---------------|
Approach: North Bound South Bound East Bound West Bound
Movement: L - T - R L - T - R L - T - R L - T - R
------------|---------------||---------------||---------------||---------------|
Control: Stop Sign Stop Sign Uncontrolled Uncontrolled
Lanes: 0 0 0 1 0 0 1 0 0 1 1 0 0 1 0 1 0 0 1 0
Initial Vol: 0 1 1 22 4 140 7 29 2 0 50 2
------------|---------------||---------------||---------------||---------------|
Major Street Volume: 90
Minor Approach Volume: 166
Minor Approach Volume Threshold: 1410
--------------------------------------------------------------------------------
SIGNAL WARRANT DISCLAIMER
This peak hour signal warrant analysis should be considered solely as an
"indicator" of the likelihood of an unsignalized intersection warranting
a traffic signal in the future. Intersections that exceed this warrant
are probably more likely to meet one or more of the other volume based
signal warrant (such as the 4-hour or 8-hour warrants).
The peak hour warrant analysis in this report is not intended to replace
a rigorous and complete traffic signal warrant analysis by the responsible
jurisdiction. Consideration of the other signal warrants, which is beyond
the scope of this software, may yield different results.
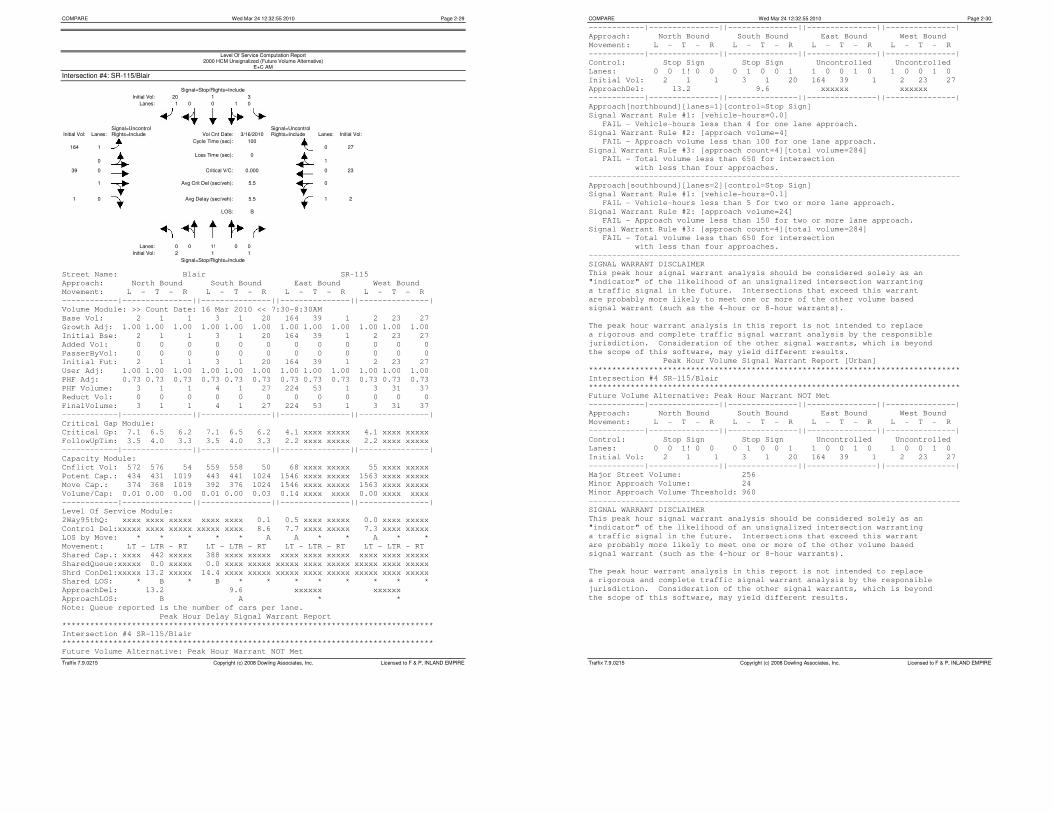
COMPARE Wed Mar 24 12:32:55 2010 Page 2-29
Traffix 7.9.0215 Copyright (c) 2008 Dowling Associates, Inc. Licensed to F & P, INLAND EMPIRE
Level Of Service Computation Report 2000 HCM Unsignalized (Future Volume Alternative)
E+C AM
Intersection #4: SR-115/Blair Signal=Stop/Rights=Include
Initial Vol: 20 1 3
Lanes: 1 0 0 1 0
Signal=Uncontrol
Signal=Uncontrol
Initial Vol: Lanes: Rights=Include Vol Cnt Date: 3/16/2010 Rights=Include Lanes: Initial Vol:
164
1
Cycle Time (sec): 100 0
27
0
Loss Time (sec): 0 1
39 0
Critical V/C: 0.000 0 23
1
Avg Crit Del (sec/veh): 5.5 0
1 0
Avg Delay (sec/veh): 5.5 1 2
LOS: B
Lanes: 0 0 1! 0 0
Initial Vol: 2 1 1
Signal=Stop/Rights=Include
Street Name: Blair SR-115
Approach: North Bound South Bound East Bound West Bound
Movement: L - T - R L - T - R L - T - R L - T - R
------------|---------------||---------------||---------------||---------------|
Volume Module: >> Count Date: 16 Mar 2010 << 7:30-8:30AM
Base Vol: 2 1 1 3 1 20 164 39 1 2 23 27
Growth Adj: 1.00 1.00 1.00 1.00 1.00 1.00 1.00 1.00 1.00 1.00 1.00 1.00
Initial Bse: 2 1 1 3 1 20 164 39 1 2 23 27
Added Vol: 0 0 0 0 0 0 0 0 0 0 0 0
PasserByVol: 0 0 0 0 0 0 0 0 0 0 0 0
Initial Fut: 2 1 1 3 1 20 164 39 1 2 23 27
User Adj: 1.00 1.00 1.00 1.00 1.00 1.00 1.00 1.00 1.00 1.00 1.00 1.00
PHF Adj: 0.73 0.73 0.73 0.73 0.73 0.73 0.73 0.73 0.73 0.73 0.73 0.73
PHF Volume: 3 1 1 4 1 27 224 53 1 3 31 37
Reduct Vol: 0 0 0 0 0 0 0 0 0 0 0 0
FinalVolume: 3 1 1 4 1 27 224 53 1 3 31 37
------------|---------------||---------------||---------------||---------------|
Critical Gap Module:
Critical Gp: 7.1 6.5 6.2 7.1 6.5 6.2 4.1 xxxx xxxxx 4.1 xxxx xxxxx
FollowUpTim: 3.5 4.0 3.3 3.5 4.0 3.3 2.2 xxxx xxxxx 2.2 xxxx xxxxx
------------|---------------||---------------||---------------||---------------|
Capacity Module:
Cnflict Vol: 572 576 54 559 558 50 68 xxxx xxxxx 55 xxxx xxxxx
Potent Cap.: 434 431 1019 443 441 1024 1546 xxxx xxxxx 1563 xxxx xxxxx
Move Cap.: 374 368 1019 392 376 1024 1546 xxxx xxxxx 1563 xxxx xxxxx
Volume/Cap: 0.01 0.00 0.00 0.01 0.00 0.03 0.14 xxxx xxxx 0.00 xxxx xxxx
------------|---------------||---------------||---------------||---------------|
Level Of Service Module:
2Way95thQ: xxxx xxxx xxxxx xxxx xxxx 0.1 0.5 xxxx xxxxx 0.0 xxxx xxxxx
Control Del:xxxxx xxxx xxxxx xxxxx xxxx 8.6 7.7 xxxx xxxxx 7.3 xxxx xxxxx
LOS by Move: * * * * * A A * * A * *
Movement: LT - LTR - RT LT - LTR - RT LT - LTR - RT LT - LTR - RT
Shared Cap.: xxxx 442 xxxxx 388 xxxx xxxxx xxxx xxxx xxxxx xxxx xxxx xxxxx
SharedQueue:xxxxx 0.0 xxxxx 0.0 xxxx xxxxx xxxxx xxxx xxxxx xxxxx xxxx xxxxx
Shrd ConDel:xxxxx 13.2 xxxxx 14.4 xxxx xxxxx xxxxx xxxx xxxxx xxxxx xxxx xxxxx
Shared LOS: * B * B * * * * * * * *
ApproachDel: 13.2 9.6 xxxxxx xxxxxx
ApproachLOS: B A * *
Note: Queue reported is the number of cars per lane.
Peak Hour Delay Signal Warrant Report
********************************************************************************
Intersection #4 SR-115/Blair
********************************************************************************
Future Volume Alternative: Peak Hour Warrant NOT Met
COMPARE Wed Mar 24 12:32:55 2010 Page 2-30
Traffix 7.9.0215 Copyright (c) 2008 Dowling Associates, Inc. Licensed to F & P, INLAND EMPIRE
------------|---------------||---------------||---------------||---------------|
Approach: North Bound South Bound East Bound West Bound
Movement: L - T - R L - T - R L - T - R L - T - R
------------|---------------||---------------||---------------||---------------|
Control: Stop Sign Stop Sign Uncontrolled Uncontrolled
Lanes: 0 0 1! 0 0 0 1 0 0 1 1 0 0 1 0 1 0 0 1 0
Initial Vol: 2 1 1 3 1 20 164 39 1 2 23 27
ApproachDel: 13.2 9.6 xxxxxx xxxxxx
------------|---------------||---------------||---------------||---------------|
Approach[northbound][lanes=1][control=Stop Sign]
Signal Warrant Rule #1: [vehicle-hours=0.0]
FAIL - Vehicle-hours less than 4 for one lane approach.
Signal Warrant Rule #2: [approach volume=4]
FAIL - Approach volume less than 100 for one lane approach.
Signal Warrant Rule #3: [approach count=4][total volume=284]
FAIL - Total volume less than 650 for intersection
with less than four approaches.
--------------------------------------------------------------------------------
Approach[southbound][lanes=2][control=Stop Sign]
Signal Warrant Rule #1: [vehicle-hours=0.1]
FAIL - Vehicle-hours less than 5 for two or more lane approach.
Signal Warrant Rule #2: [approach volume=24]
FAIL - Approach volume less than 150 for two or more lane approach.
Signal Warrant Rule #3: [approach count=4][total volume=284]
FAIL - Total volume less than 650 for intersection
with less than four approaches.
--------------------------------------------------------------------------------
SIGNAL WARRANT DISCLAIMER
This peak hour signal warrant analysis should be considered solely as an
"indicator" of the likelihood of an unsignalized intersection warranting
a traffic signal in the future. Intersections that exceed this warrant
are probably more likely to meet one or more of the other volume based
signal warrant (such as the 4-hour or 8-hour warrants).
The peak hour warrant analysis in this report is not intended to replace
a rigorous and complete traffic signal warrant analysis by the responsible
jurisdiction. Consideration of the other signal warrants, which is beyond
the scope of this software, may yield different results.
Peak Hour Volume Signal Warrant Report [Urban]
********************************************************************************
Intersection #4 SR-115/Blair
********************************************************************************
Future Volume Alternative: Peak Hour Warrant NOT Met
------------|---------------||---------------||---------------||---------------|
Approach: North Bound South Bound East Bound West Bound
Movement: L - T - R L - T - R L - T - R L - T - R
------------|---------------||---------------||---------------||---------------|
Control: Stop Sign Stop Sign Uncontrolled Uncontrolled
Lanes: 0 0 1! 0 0 0 1 0 0 1 1 0 0 1 0 1 0 0 1 0
Initial Vol: 2 1 1 3 1 20 164 39 1 2 23 27
------------|---------------||---------------||---------------||---------------|
Major Street Volume: 256
Minor Approach Volume: 24
Minor Approach Volume Threshold: 960
--------------------------------------------------------------------------------
SIGNAL WARRANT DISCLAIMER
This peak hour signal warrant analysis should be considered solely as an
"indicator" of the likelihood of an unsignalized intersection warranting
a traffic signal in the future. Intersections that exceed this warrant
are probably more likely to meet one or more of the other volume based
signal warrant (such as the 4-hour or 8-hour warrants).
The peak hour warrant analysis in this report is not intended to replace
a rigorous and complete traffic signal warrant analysis by the responsible
jurisdiction. Consideration of the other signal warrants, which is beyond
the scope of this software, may yield different results.
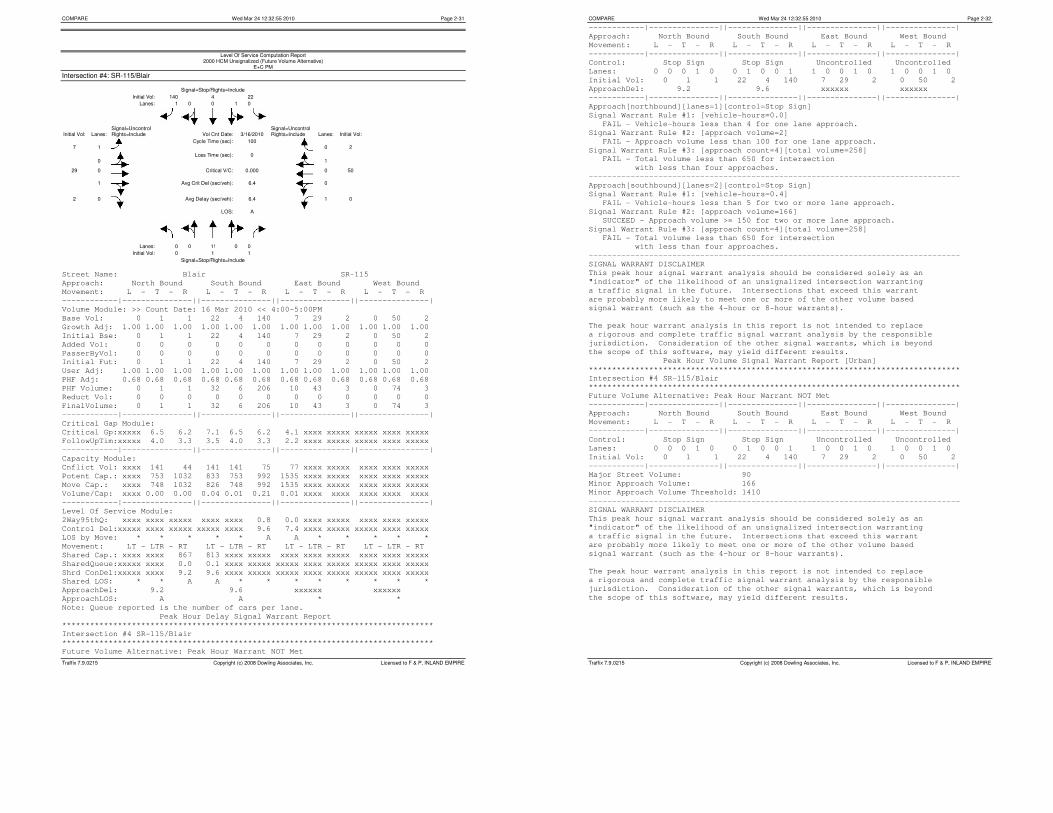
COMPARE Wed Mar 24 12:32:55 2010 Page 2-31
Traffix 7.9.0215 Copyright (c) 2008 Dowling Associates, Inc. Licensed to F & P, INLAND EMPIRE
Level Of Service Computation Report 2000 HCM Unsignalized (Future Volume Alternative)
E+C PM
Intersection #4: SR-115/Blair Signal=Stop/Rights=Include
Initial Vol: 140 4 22
Lanes: 1 0 0 1 0
Signal=Uncontrol
Signal=Uncontrol
Initial Vol: Lanes: Rights=Include Vol Cnt Date: 3/16/2010 Rights=Include Lanes: Initial Vol:
7
1
Cycle Time (sec): 100 0
2
0
Loss Time (sec): 0 1
29 0
Critical V/C: 0.000 0 50
1
Avg Crit Del (sec/veh): 6.4 0
2 0
Avg Delay (sec/veh): 6.4 1 0
LOS: A
Lanes: 0 0 1! 0 0
Initial Vol: 0 1 1
Signal=Stop/Rights=Include
Street Name: Blair SR-115
Approach: North Bound South Bound East Bound West Bound
Movement: L - T - R L - T - R L - T - R L - T - R
------------|---------------||---------------||---------------||---------------|
Volume Module: >> Count Date: 16 Mar 2010 << 4:00-5:00PM
Base Vol: 0 1 1 22 4 140 7 29 2 0 50 2
Growth Adj: 1.00 1.00 1.00 1.00 1.00 1.00 1.00 1.00 1.00 1.00 1.00 1.00
Initial Bse: 0 1 1 22 4 140 7 29 2 0 50 2
Added Vol: 0 0 0 0 0 0 0 0 0 0 0 0
PasserByVol: 0 0 0 0 0 0 0 0 0 0 0 0
Initial Fut: 0 1 1 22 4 140 7 29 2 0 50 2
User Adj: 1.00 1.00 1.00 1.00 1.00 1.00 1.00 1.00 1.00 1.00 1.00 1.00
PHF Adj: 0.68 0.68 0.68 0.68 0.68 0.68 0.68 0.68 0.68 0.68 0.68 0.68
PHF Volume: 0 1 1 32 6 206 10 43 3 0 74 3
Reduct Vol: 0 0 0 0 0 0 0 0 0 0 0 0
FinalVolume: 0 1 1 32 6 206 10 43 3 0 74 3
------------|---------------||---------------||---------------||---------------|
Critical Gap Module:
Critical Gp:xxxxx 6.5 6.2 7.1 6.5 6.2 4.1 xxxx xxxxx xxxxx xxxx xxxxx
FollowUpTim:xxxxx 4.0 3.3 3.5 4.0 3.3 2.2 xxxx xxxxx xxxxx xxxx xxxxx
------------|---------------||---------------||---------------||---------------|
Capacity Module:
Cnflict Vol: xxxx 141 44 141 141 75 77 xxxx xxxxx xxxx xxxx xxxxx
Potent Cap.: xxxx 753 1032 833 753 992 1535 xxxx xxxxx xxxx xxxx xxxxx
Move Cap.: xxxx 748 1032 826 748 992 1535 xxxx xxxxx xxxx xxxx xxxxx
Volume/Cap: xxxx 0.00 0.00 0.04 0.01 0.21 0.01 xxxx xxxx xxxx xxxx xxxx
------------|---------------||---------------||---------------||---------------|
Level Of Service Module:
2Way95thQ: xxxx xxxx xxxxx xxxx xxxx 0.8 0.0 xxxx xxxxx xxxx xxxx xxxxx
Control Del:xxxxx xxxx xxxxx xxxxx xxxx 9.6 7.4 xxxx xxxxx xxxxx xxxx xxxxx
LOS by Move: * * * * * A A * * * * *
Movement: LT - LTR - RT LT - LTR - RT LT - LTR - RT LT - LTR - RT
Shared Cap.: xxxx xxxx 867 813 xxxx xxxxx xxxx xxxx xxxxx xxxx xxxx xxxxx
SharedQueue:xxxxx xxxx 0.0 0.1 xxxx xxxxx xxxxx xxxx xxxxx xxxxx xxxx xxxxx
Shrd ConDel:xxxxx xxxx 9.2 9.6 xxxx xxxxx xxxxx xxxx xxxxx xxxxx xxxx xxxxx
Shared LOS: * * A A * * * * * * * *
ApproachDel: 9.2 9.6 xxxxxx xxxxxx
ApproachLOS: A A * *
Note: Queue reported is the number of cars per lane.
Peak Hour Delay Signal Warrant Report
********************************************************************************
Intersection #4 SR-115/Blair
********************************************************************************
Future Volume Alternative: Peak Hour Warrant NOT Met
COMPARE Wed Mar 24 12:32:55 2010 Page 2-32
Traffix 7.9.0215 Copyright (c) 2008 Dowling Associates, Inc. Licensed to F & P, INLAND EMPIRE
------------|---------------||---------------||---------------||---------------|
Approach: North Bound South Bound East Bound West Bound
Movement: L - T - R L - T - R L - T - R L - T - R
------------|---------------||---------------||---------------||---------------|
Control: Stop Sign Stop Sign Uncontrolled Uncontrolled
Lanes: 0 0 0 1 0 0 1 0 0 1 1 0 0 1 0 1 0 0 1 0
Initial Vol: 0 1 1 22 4 140 7 29 2 0 50 2
ApproachDel: 9.2 9.6 xxxxxx xxxxxx
------------|---------------||---------------||---------------||---------------|
Approach[northbound][lanes=1][control=Stop Sign]
Signal Warrant Rule #1: [vehicle-hours=0.0]
FAIL - Vehicle-hours less than 4 for one lane approach.
Signal Warrant Rule #2: [approach volume=2]
FAIL - Approach volume less than 100 for one lane approach.
Signal Warrant Rule #3: [approach count=4][total volume=258]
FAIL - Total volume less than 650 for intersection
with less than four approaches.
--------------------------------------------------------------------------------
Approach[southbound][lanes=2][control=Stop Sign]
Signal Warrant Rule #1: [vehicle-hours=0.4]
FAIL - Vehicle-hours less than 5 for two or more lane approach.
Signal Warrant Rule #2: [approach volume=166]
SUCCEED - Approach volume >= 150 for two or more lane approach.
Signal Warrant Rule #3: [approach count=4][total volume=258]
FAIL - Total volume less than 650 for intersection
with less than four approaches.
--------------------------------------------------------------------------------
SIGNAL WARRANT DISCLAIMER
This peak hour signal warrant analysis should be considered solely as an
"indicator" of the likelihood of an unsignalized intersection warranting
a traffic signal in the future. Intersections that exceed this warrant
are probably more likely to meet one or more of the other volume based
signal warrant (such as the 4-hour or 8-hour warrants).
The peak hour warrant analysis in this report is not intended to replace
a rigorous and complete traffic signal warrant analysis by the responsible
jurisdiction. Consideration of the other signal warrants, which is beyond
the scope of this software, may yield different results.
Peak Hour Volume Signal Warrant Report [Urban]
********************************************************************************
Intersection #4 SR-115/Blair
********************************************************************************
Future Volume Alternative: Peak Hour Warrant NOT Met
------------|---------------||---------------||---------------||---------------|
Approach: North Bound South Bound East Bound West Bound
Movement: L - T - R L - T - R L - T - R L - T - R
------------|---------------||---------------||---------------||---------------|
Control: Stop Sign Stop Sign Uncontrolled Uncontrolled
Lanes: 0 0 0 1 0 0 1 0 0 1 1 0 0 1 0 1 0 0 1 0
Initial Vol: 0 1 1 22 4 140 7 29 2 0 50 2
------------|---------------||---------------||---------------||---------------|
Major Street Volume: 90
Minor Approach Volume: 166
Minor Approach Volume Threshold: 1410
--------------------------------------------------------------------------------
SIGNAL WARRANT DISCLAIMER
This peak hour signal warrant analysis should be considered solely as an
"indicator" of the likelihood of an unsignalized intersection warranting
a traffic signal in the future. Intersections that exceed this warrant
are probably more likely to meet one or more of the other volume based
signal warrant (such as the 4-hour or 8-hour warrants).
The peak hour warrant analysis in this report is not intended to replace
a rigorous and complete traffic signal warrant analysis by the responsible
jurisdiction. Consideration of the other signal warrants, which is beyond
the scope of this software, may yield different results.
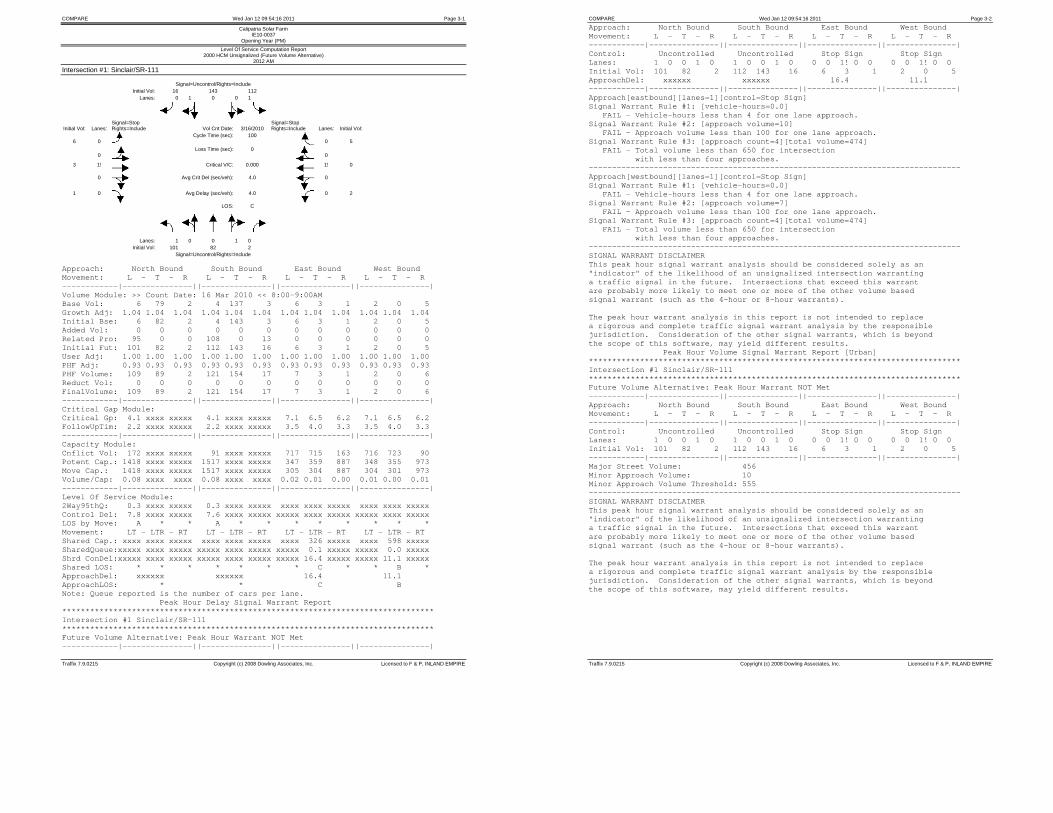
COMPARE Wed Jan 12 09:54:16 2011 Page 3-1
Traffix 7.9.0215 Copyright (c) 2008 Dowling Associates, Inc. Licensed to F & P, INLAND EMPIRE
Calipatria Solar Farm IE10-0037
Opening Year (PM)
Level Of Service Computation Report 2000 HCM Unsignalized (Future Volume Alternative)
2012 AM
Intersection #1: Sinclair/SR-111 Signal=Uncontrol/Rights=Include Initial Vol: 16 143 112 Lanes: 0 1 0 0 1
Signal=Stop
Signal=Stop
Initial Vol: Lanes: Rights=Include Vol Cnt Date: 3/16/2010 Rights=Include Lanes: Initial Vol: 6
0
Cycle Time (sec): 100 0
5
0
Loss Time (sec): 0 0
3 1!
Critical V/C: 0.000 1! 0
0
Avg Crit Del (sec/veh): 4.0 0
1 0
Avg Delay (sec/veh): 4.0 0 2
LOS: C
Lanes: 1 0 0 1 0 Initial Vol: 101 82 2 Signal=Uncontrol/Rights=Include
Approach: North Bound South Bound East Bound West Bound Movement: L - T - R L - T - R L - T - R L - T - R ------------|---------------||---------------||---------------||---------------| Volume Module: >> Count Date: 16 Mar 2010 << 8:00-9:00AM Base Vol: 6 79 2 4 137 3 6 3 1 2 0 5 Growth Adj: 1.04 1.04 1.04 1.04 1.04 1.04 1.04 1.04 1.04 1.04 1.04 1.04 Initial Bse: 6 82 2 4 143 3 6 3 1 2 0 5 Added Vol: 0 0 0 0 0 0 0 0 0 0 0 0 Related Pro: 95 0 0 108 0 13 0 0 0 0 0 0 Initial Fut: 101 82 2 112 143 16 6 3 1 2 0 5 User Adj: 1.00 1.00 1.00 1.00 1.00 1.00 1.00 1.00 1.00 1.00 1.00 1.00 PHF Adj: 0.93 0.93 0.93 0.93 0.93 0.93 0.93 0.93 0.93 0.93 0.93 0.93 PHF Volume: 109 89 2 121 154 17 7 3 1 2 0 6 Reduct Vol: 0 0 0 0 0 0 0 0 0 0 0 0 FinalVolume: 109 89 2 121 154 17 7 3 1 2 0 6 ------------|---------------||---------------||---------------||---------------| Critical Gap Module: Critical Gp: 4.1 xxxx xxxxx 4.1 xxxx xxxxx 7.1 6.5 6.2 7.1 6.5 6.2 FollowUpTim: 2.2 xxxx xxxxx 2.2 xxxx xxxxx 3.5 4.0 3.3 3.5 4.0 3.3 ------------|---------------||---------------||---------------||---------------| Capacity Module: Cnflict Vol: 172 xxxx xxxxx 91 xxxx xxxxx 717 715 163 716 723 90 Potent Cap.: 1418 xxxx xxxxx 1517 xxxx xxxxx 347 359 887 348 355 973 Move Cap.: 1418 xxxx xxxxx 1517 xxxx xxxxx 305 304 887 304 301 973 Volume/Cap: 0.08 xxxx xxxx 0.08 xxxx xxxx 0.02 0.01 0.00 0.01 0.00 0.01 ------------|---------------||---------------||---------------||---------------| Level Of Service Module: 2Way95thQ: 0.3 xxxx xxxxx 0.3 xxxx xxxxx xxxx xxxx xxxxx xxxx xxxx xxxxx Control Del: 7.8 xxxx xxxxx 7.6 xxxx xxxxx xxxxx xxxx xxxxx xxxxx xxxx xxxxx LOS by Move: A * * A * * * * * * * * Movement: LT - LTR - RT LT - LTR - RT LT - LTR - RT LT - LTR - RT Shared Cap.: xxxx xxxx xxxxx xxxx xxxx xxxxx xxxx 326 xxxxx xxxx 598 xxxxx SharedQueue:xxxxx xxxx xxxxx xxxxx xxxx xxxxx xxxxx 0.1 xxxxx xxxxx 0.0 xxxxx Shrd ConDel:xxxxx xxxx xxxxx xxxxx xxxx xxxxx xxxxx 16.4 xxxxx xxxxx 11.1 xxxxx Shared LOS: * * * * * * * C * * B * ApproachDel: xxxxxx xxxxxx 16.4 11.1 ApproachLOS: * * C B Note: Queue reported is the number of cars per lane. Peak Hour Delay Signal Warrant Report ******************************************************************************** Intersection #1 Sinclair/SR-111 ******************************************************************************** Future Volume Alternative: Peak Hour Warrant NOT Met ------------|---------------||---------------||---------------||---------------|
COMPARE Wed Jan 12 09:54:16 2011 Page 3-2
Traffix 7.9.0215 Copyright (c) 2008 Dowling Associates, Inc. Licensed to F & P, INLAND EMPIRE
Approach: North Bound South Bound East Bound West Bound Movement: L - T - R L - T - R L - T - R L - T - R ------------|---------------||---------------||---------------||---------------| Control: Uncontrolled Uncontrolled Stop Sign Stop Sign Lanes: 1 0 0 1 0 1 0 0 1 0 0 0 1! 0 0 0 0 1! 0 0 Initial Vol: 101 82 2 112 143 16 6 3 1 2 0 5 ApproachDel: xxxxxx xxxxxx 16.4 11.1 ------------|---------------||---------------||---------------||---------------| Approach[eastbound][lanes=1][control=Stop Sign] Signal Warrant Rule #1: [vehicle-hours=0.0] FAIL - Vehicle-hours less than 4 for one lane approach. Signal Warrant Rule #2: [approach volume=10] FAIL - Approach volume less than 100 for one lane approach. Signal Warrant Rule #3: [approach count=4][total volume=474] FAIL - Total volume less than 650 for intersection with less than four approaches. -------------------------------------------------------------------------------- Approach[westbound][lanes=1][control=Stop Sign] Signal Warrant Rule #1: [vehicle-hours=0.0] FAIL - Vehicle-hours less than 4 for one lane approach. Signal Warrant Rule #2: [approach volume=7] FAIL - Approach volume less than 100 for one lane approach. Signal Warrant Rule #3: [approach count=4][total volume=474] FAIL - Total volume less than 650 for intersection with less than four approaches. -------------------------------------------------------------------------------- SIGNAL WARRANT DISCLAIMER This peak hour signal warrant analysis should be considered solely as an "indicator" of the likelihood of an unsignalized intersection warranting a traffic signal in the future. Intersections that exceed this warrant are probably more likely to meet one or more of the other volume based signal warrant (such as the 4-hour or 8-hour warrants). The peak hour warrant analysis in this report is not intended to replace a rigorous and complete traffic signal warrant analysis by the responsible jurisdiction. Consideration of the other signal warrants, which is beyond the scope of this software, may yield different results. Peak Hour Volume Signal Warrant Report [Urban] ******************************************************************************** Intersection #1 Sinclair/SR-111 ******************************************************************************** Future Volume Alternative: Peak Hour Warrant NOT Met ------------|---------------||---------------||---------------||---------------| Approach: North Bound South Bound East Bound West Bound Movement: L - T - R L - T - R L - T - R L - T - R ------------|---------------||---------------||---------------||---------------| Control: Uncontrolled Uncontrolled Stop Sign Stop Sign Lanes: 1 0 0 1 0 1 0 0 1 0 0 0 1! 0 0 0 0 1! 0 0 Initial Vol: 101 82 2 112 143 16 6 3 1 2 0 5 ------------|---------------||---------------||---------------||---------------| Major Street Volume: 456 Minor Approach Volume: 10 Minor Approach Volume Threshold: 555 -------------------------------------------------------------------------------- SIGNAL WARRANT DISCLAIMER This peak hour signal warrant analysis should be considered solely as an "indicator" of the likelihood of an unsignalized intersection warranting a traffic signal in the future. Intersections that exceed this warrant are probably more likely to meet one or more of the other volume based signal warrant (such as the 4-hour or 8-hour warrants). The peak hour warrant analysis in this report is not intended to replace a rigorous and complete traffic signal warrant analysis by the responsible jurisdiction. Consideration of the other signal warrants, which is beyond the scope of this software, may yield different results.
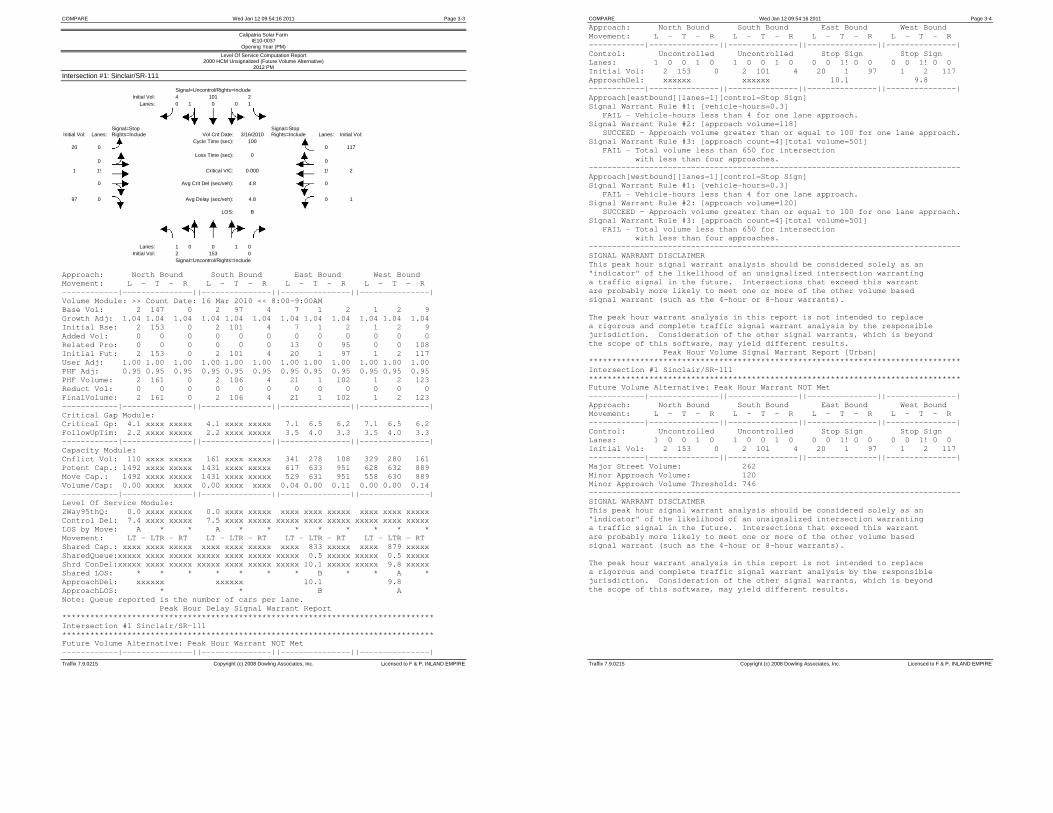
COMPARE Wed Jan 12 09:54:16 2011 Page 3-3
Traffix 7.9.0215 Copyright (c) 2008 Dowling Associates, Inc. Licensed to F & P, INLAND EMPIRE
Calipatria Solar Farm IE10-0037
Opening Year (PM)
Level Of Service Computation Report 2000 HCM Unsignalized (Future Volume Alternative)
2012 PM
Intersection #1: Sinclair/SR-111 Signal=Uncontrol/Rights=Include Initial Vol: 4 101 2 Lanes: 0 1 0 0 1
Signal=Stop
Signal=Stop
Initial Vol: Lanes: Rights=Include Vol Cnt Date: 3/16/2010 Rights=Include Lanes: Initial Vol:
20
0 Cycle Time (sec): 100
0
117
0
Loss Time (sec): 0 0
1 1!
Critical V/C: 0.000 1! 2
0
Avg Crit Del (sec/veh): 4.8 0
97 0 Avg Delay (sec/veh): 4.8 0 1
LOS: B
Lanes: 1 0 0 1 0 Initial Vol: 2 153 0 Signal=Uncontrol/Rights=Include
Approach: North Bound South Bound East Bound West Bound Movement: L - T - R L - T - R L - T - R L - T - R ------------|---------------||---------------||---------------||---------------| Volume Module: >> Count Date: 16 Mar 2010 << 8:00-9:00AM Base Vol: 2 147 0 2 97 4 7 1 2 1 2 9 Growth Adj: 1.04 1.04 1.04 1.04 1.04 1.04 1.04 1.04 1.04 1.04 1.04 1.04 Initial Bse: 2 153 0 2 101 4 7 1 2 1 2 9 Added Vol: 0 0 0 0 0 0 0 0 0 0 0 0 Related Pro: 0 0 0 0 0 0 13 0 95 0 0 108 Initial Fut: 2 153 0 2 101 4 20 1 97 1 2 117 User Adj: 1.00 1.00 1.00 1.00 1.00 1.00 1.00 1.00 1.00 1.00 1.00 1.00 PHF Adj: 0.95 0.95 0.95 0.95 0.95 0.95 0.95 0.95 0.95 0.95 0.95 0.95 PHF Volume: 2 161 0 2 106 4 21 1 102 1 2 123 Reduct Vol: 0 0 0 0 0 0 0 0 0 0 0 0 FinalVolume: 2 161 0 2 106 4 21 1 102 1 2 123 ------------|---------------||---------------||---------------||---------------| Critical Gap Module: Critical Gp: 4.1 xxxx xxxxx 4.1 xxxx xxxxx 7.1 6.5 6.2 7.1 6.5 6.2 FollowUpTim: 2.2 xxxx xxxxx 2.2 xxxx xxxxx 3.5 4.0 3.3 3.5 4.0 3.3 ------------|---------------||---------------||---------------||---------------| Capacity Module: Cnflict Vol: 110 xxxx xxxxx 161 xxxx xxxxx 341 278 108 329 280 161 Potent Cap.: 1492 xxxx xxxxx 1431 xxxx xxxxx 617 633 951 628 632 889 Move Cap.: 1492 xxxx xxxxx 1431 xxxx xxxxx 529 631 951 558 630 889 Volume/Cap: 0.00 xxxx xxxx 0.00 xxxx xxxx 0.04 0.00 0.11 0.00 0.00 0.14 ------------|---------------||---------------||---------------||---------------| Level Of Service Module: 2Way95thQ: 0.0 xxxx xxxxx 0.0 xxxx xxxxx xxxx xxxx xxxxx xxxx xxxx xxxxx Control Del: 7.4 xxxx xxxxx 7.5 xxxx xxxxx xxxxx xxxx xxxxx xxxxx xxxx xxxxx LOS by Move: A * * A * * * * * * * * Movement: LT - LTR - RT LT - LTR - RT LT - LTR - RT LT - LTR - RT Shared Cap.: xxxx xxxx xxxxx xxxx xxxx xxxxx xxxx 833 xxxxx xxxx 879 xxxxx SharedQueue:xxxxx xxxx xxxxx xxxxx xxxx xxxxx xxxxx 0.5 xxxxx xxxxx 0.5 xxxxx Shrd ConDel:xxxxx xxxx xxxxx xxxxx xxxx xxxxx xxxxx 10.1 xxxxx xxxxx 9.8 xxxxx Shared LOS: * * * * * * * B * * A * ApproachDel: xxxxxx xxxxxx 10.1 9.8 ApproachLOS: * * B A Note: Queue reported is the number of cars per lane. Peak Hour Delay Signal Warrant Report ******************************************************************************** Intersection #1 Sinclair/SR-111 ******************************************************************************** Future Volume Alternative: Peak Hour Warrant NOT Met ------------|---------------||---------------||---------------||---------------|
COMPARE Wed Jan 12 09:54:16 2011 Page 3-4
Traffix 7.9.0215 Copyright (c) 2008 Dowling Associates, Inc. Licensed to F & P, INLAND EMPIRE
Approach: North Bound South Bound East Bound West Bound Movement: L - T - R L - T - R L - T - R L - T - R ------------|---------------||---------------||---------------||---------------| Control: Uncontrolled Uncontrolled Stop Sign Stop Sign Lanes: 1 0 0 1 0 1 0 0 1 0 0 0 1! 0 0 0 0 1! 0 0 Initial Vol: 2 153 0 2 101 4 20 1 97 1 2 117 ApproachDel: xxxxxx xxxxxx 10.1 9.8 ------------|---------------||---------------||---------------||---------------| Approach[eastbound][lanes=1][control=Stop Sign] Signal Warrant Rule #1: [vehicle-hours=0.3] FAIL - Vehicle-hours less than 4 for one lane approach. Signal Warrant Rule #2: [approach volume=118] SUCCEED - Approach volume greater than or equal to 100 for one lane approach. Signal Warrant Rule #3: [approach count=4][total volume=501] FAIL - Total volume less than 650 for intersection with less than four approaches. -------------------------------------------------------------------------------- Approach[westbound][lanes=1][control=Stop Sign] Signal Warrant Rule #1: [vehicle-hours=0.3] FAIL - Vehicle-hours less than 4 for one lane approach. Signal Warrant Rule #2: [approach volume=120] SUCCEED - Approach volume greater than or equal to 100 for one lane approach. Signal Warrant Rule #3: [approach count=4][total volume=501] FAIL - Total volume less than 650 for intersection with less than four approaches. -------------------------------------------------------------------------------- SIGNAL WARRANT DISCLAIMER This peak hour signal warrant analysis should be considered solely as an "indicator" of the likelihood of an unsignalized intersection warranting a traffic signal in the future. Intersections that exceed this warrant are probably more likely to meet one or more of the other volume based signal warrant (such as the 4-hour or 8-hour warrants). The peak hour warrant analysis in this report is not intended to replace a rigorous and complete traffic signal warrant analysis by the responsible jurisdiction. Consideration of the other signal warrants, which is beyond the scope of this software, may yield different results. Peak Hour Volume Signal Warrant Report [Urban] ******************************************************************************** Intersection #1 Sinclair/SR-111 ******************************************************************************** Future Volume Alternative: Peak Hour Warrant NOT Met ------------|---------------||---------------||---------------||---------------| Approach: North Bound South Bound East Bound West Bound Movement: L - T - R L - T - R L - T - R L - T - R ------------|---------------||---------------||---------------||---------------| Control: Uncontrolled Uncontrolled Stop Sign Stop Sign Lanes: 1 0 0 1 0 1 0 0 1 0 0 0 1! 0 0 0 0 1! 0 0 Initial Vol: 2 153 0 2 101 4 20 1 97 1 2 117 ------------|---------------||---------------||---------------||---------------| Major Street Volume: 262 Minor Approach Volume: 120 Minor Approach Volume Threshold: 746 -------------------------------------------------------------------------------- SIGNAL WARRANT DISCLAIMER This peak hour signal warrant analysis should be considered solely as an "indicator" of the likelihood of an unsignalized intersection warranting a traffic signal in the future. Intersections that exceed this warrant are probably more likely to meet one or more of the other volume based signal warrant (such as the 4-hour or 8-hour warrants). The peak hour warrant analysis in this report is not intended to replace a rigorous and complete traffic signal warrant analysis by the responsible jurisdiction. Consideration of the other signal warrants, which is beyond the scope of this software, may yield different results.

COMPARE Wed Jan 12 09:54:16 2011 Page 3-5
Traffix 7.9.0215 Copyright (c) 2008 Dowling Associates, Inc. Licensed to F & P, INLAND EMPIRE
Calipatria Solar Farm IE10-0037
Opening Year (PM)
Level Of Service Computation Report 2000 HCM Unsignalized (Future Volume Alternative)
2012 + P AM
Intersection #1: Sinclair/SR-111 Signal=Uncontrol/Rights=Include Initial Vol: 16 143 114 Lanes: 0 1 0 0 1
Signal=Stop
Signal=Stop
Initial Vol: Lanes: Rights=Include Vol Cnt Date: 3/16/2010 Rights=Include Lanes: Initial Vol: 6
0
Cycle Time (sec): 100 0
5
0
Loss Time (sec): 0 0
3 1!
Critical V/C: 0.000 1! 0
0
Avg Crit Del (sec/veh): 4.0 0
1 0 Avg Delay (sec/veh): 4.0 0 2
LOS: C
Lanes: 1 0 0 1 0 Initial Vol: 101 82 2 Signal=Uncontrol/Rights=Include
Approach: North Bound South Bound East Bound West Bound Movement: L - T - R L - T - R L - T - R L - T - R ------------|---------------||---------------||---------------||---------------| Volume Module: >> Count Date: 16 Mar 2010 << 8:00-9:00AM Base Vol: 6 79 2 4 137 3 6 3 1 2 0 5 Growth Adj: 1.04 1.04 1.04 1.04 1.04 1.04 1.04 1.04 1.04 1.04 1.04 1.04 Initial Bse: 6 82 2 4 143 3 6 3 1 2 0 5 Added Vol: 0 0 0 2 0 0 0 0 0 0 0 0 Related Pro: 95 0 0 108 0 13 0 0 0 0 0 0 Initial Fut: 101 82 2 114 143 16 6 3 1 2 0 5 User Adj: 1.00 1.00 1.00 1.00 1.00 1.00 1.00 1.00 1.00 1.00 1.00 1.00 PHF Adj: 0.93 0.93 0.93 0.93 0.93 0.93 0.93 0.93 0.93 0.93 0.93 0.93 PHF Volume: 109 89 2 123 154 17 7 3 1 2 0 6 Reduct Vol: 0 0 0 0 0 0 0 0 0 0 0 0 FinalVolume: 109 89 2 123 154 17 7 3 1 2 0 6 ------------|---------------||---------------||---------------||---------------| Critical Gap Module: Critical Gp: 4.1 xxxx xxxxx 4.1 xxxx xxxxx 7.1 6.5 6.2 7.1 6.5 6.2 FollowUpTim: 2.2 xxxx xxxxx 2.2 xxxx xxxxx 3.5 4.0 3.3 3.5 4.0 3.3 ------------|---------------||---------------||---------------||---------------| Capacity Module: Cnflict Vol: 172 xxxx xxxxx 91 xxxx xxxxx 721 720 163 721 727 90 Potent Cap.: 1418 xxxx xxxxx 1517 xxxx xxxxx 345 356 887 345 353 973 Move Cap.: 1418 xxxx xxxxx 1517 xxxx xxxxx 303 302 887 302 299 973 Volume/Cap: 0.08 xxxx xxxx 0.08 xxxx xxxx 0.02 0.01 0.00 0.01 0.00 0.01 ------------|---------------||---------------||---------------||---------------| Level Of Service Module: 2Way95thQ: 0.3 xxxx xxxxx 0.3 xxxx xxxxx xxxx xxxx xxxxx xxxx xxxx xxxxx Control Del: 7.8 xxxx xxxxx 7.6 xxxx xxxxx xxxxx xxxx xxxxx xxxxx xxxx xxxxx LOS by Move: A * * A * * * * * * * * Movement: LT - LTR - RT LT - LTR - RT LT - LTR - RT LT - LTR - RT Shared Cap.: xxxx xxxx xxxxx xxxx xxxx xxxxx xxxx 324 xxxxx xxxx 595 xxxxx SharedQueue:xxxxx xxxx xxxxx xxxxx xxxx xxxxx xxxxx 0.1 xxxxx xxxxx 0.0 xxxxx Shrd ConDel:xxxxx xxxx xxxxx xxxxx xxxx xxxxx xxxxx 16.5 xxxxx xxxxx 11.1 xxxxx Shared LOS: * * * * * * * C * * B * ApproachDel: xxxxxx xxxxxx 16.5 11.1 ApproachLOS: * * C B Note: Queue reported is the number of cars per lane. Peak Hour Delay Signal Warrant Report ******************************************************************************** Intersection #1 Sinclair/SR-111 ******************************************************************************** Future Volume Alternative: Peak Hour Warrant NOT Met ------------|---------------||---------------||---------------||---------------|
COMPARE Wed Jan 12 09:54:16 2011 Page 3-6
Traffix 7.9.0215 Copyright (c) 2008 Dowling Associates, Inc. Licensed to F & P, INLAND EMPIRE
Approach: North Bound South Bound East Bound West Bound Movement: L - T - R L - T - R L - T - R L - T - R ------------|---------------||---------------||---------------||---------------| Control: Uncontrolled Uncontrolled Stop Sign Stop Sign Lanes: 1 0 0 1 0 1 0 0 1 0 0 0 1! 0 0 0 0 1! 0 0 Initial Vol: 101 82 2 114 143 16 6 3 1 2 0 5 ApproachDel: xxxxxx xxxxxx 16.5 11.1 ------------|---------------||---------------||---------------||---------------| Approach[eastbound][lanes=1][control=Stop Sign] Signal Warrant Rule #1: [vehicle-hours=0.0] FAIL - Vehicle-hours less than 4 for one lane approach. Signal Warrant Rule #2: [approach volume=10] FAIL - Approach volume less than 100 for one lane approach. Signal Warrant Rule #3: [approach count=4][total volume=476] FAIL - Total volume less than 650 for intersection with less than four approaches. -------------------------------------------------------------------------------- Approach[westbound][lanes=1][control=Stop Sign] Signal Warrant Rule #1: [vehicle-hours=0.0] FAIL - Vehicle-hours less than 4 for one lane approach. Signal Warrant Rule #2: [approach volume=7] FAIL - Approach volume less than 100 for one lane approach. Signal Warrant Rule #3: [approach count=4][total volume=476] FAIL - Total volume less than 650 for intersection with less than four approaches. -------------------------------------------------------------------------------- SIGNAL WARRANT DISCLAIMER This peak hour signal warrant analysis should be considered solely as an "indicator" of the likelihood of an unsignalized intersection warranting a traffic signal in the future. Intersections that exceed this warrant are probably more likely to meet one or more of the other volume based signal warrant (such as the 4-hour or 8-hour warrants). The peak hour warrant analysis in this report is not intended to replace a rigorous and complete traffic signal warrant analysis by the responsible jurisdiction. Consideration of the other signal warrants, which is beyond the scope of this software, may yield different results. Peak Hour Volume Signal Warrant Report [Urban] ******************************************************************************** Intersection #1 Sinclair/SR-111 ******************************************************************************** Future Volume Alternative: Peak Hour Warrant NOT Met ------------|---------------||---------------||---------------||---------------| Approach: North Bound South Bound East Bound West Bound Movement: L - T - R L - T - R L - T - R L - T - R ------------|---------------||---------------||---------------||---------------| Control: Uncontrolled Uncontrolled Stop Sign Stop Sign Lanes: 1 0 0 1 0 1 0 0 1 0 0 0 1! 0 0 0 0 1! 0 0 Initial Vol: 101 82 2 114 143 16 6 3 1 2 0 5 ------------|---------------||---------------||---------------||---------------| Major Street Volume: 458 Minor Approach Volume: 10 Minor Approach Volume Threshold: 554 -------------------------------------------------------------------------------- SIGNAL WARRANT DISCLAIMER This peak hour signal warrant analysis should be considered solely as an "indicator" of the likelihood of an unsignalized intersection warranting a traffic signal in the future. Intersections that exceed this warrant are probably more likely to meet one or more of the other volume based signal warrant (such as the 4-hour or 8-hour warrants). The peak hour warrant analysis in this report is not intended to replace a rigorous and complete traffic signal warrant analysis by the responsible jurisdiction. Consideration of the other signal warrants, which is beyond the scope of this software, may yield different results.

COMPARE Wed Jan 12 09:54:16 2011 Page 3-7
Traffix 7.9.0215 Copyright (c) 2008 Dowling Associates, Inc. Licensed to F & P, INLAND EMPIRE
Calipatria Solar Farm IE10-0037
Opening Year (PM)
Level Of Service Computation Report 2000 HCM Unsignalized (Future Volume Alternative)
2012 + P PM
Intersection #1: Sinclair/SR-111 Signal=Uncontrol/Rights=Include Initial Vol: 4 101 2 Lanes: 0 1 0 0 1
Signal=Stop
Signal=Stop
Initial Vol: Lanes: Rights=Include Vol Cnt Date: 3/16/2010 Rights=Include Lanes: Initial Vol:
20
0 Cycle Time (sec): 100
0
119
0
Loss Time (sec): 0 0
1 1!
Critical V/C: 0.000 1! 2
0
Avg Crit Del (sec/veh): 4.8 0
97 0 Avg Delay (sec/veh): 4.8 0 1
LOS: B
Lanes: 1 0 0 1 0 Initial Vol: 2 153 0 Signal=Uncontrol/Rights=Include
Approach: North Bound South Bound East Bound West Bound Movement: L - T - R L - T - R L - T - R L - T - R ------------|---------------||---------------||---------------||---------------| Volume Module: >> Count Date: 16 Mar 2010 << 8:00-9:00AM Base Vol: 2 147 0 2 97 4 7 1 2 1 2 9 Growth Adj: 1.04 1.04 1.04 1.04 1.04 1.04 1.04 1.04 1.04 1.04 1.04 1.04 Initial Bse: 2 153 0 2 101 4 7 1 2 1 2 9 Added Vol: 0 0 0 0 0 0 0 0 0 0 0 2 Related Pro: 0 0 0 0 0 0 13 0 95 0 0 108 Initial Fut: 2 153 0 2 101 4 20 1 97 1 2 119 User Adj: 1.00 1.00 1.00 1.00 1.00 1.00 1.00 1.00 1.00 1.00 1.00 1.00 PHF Adj: 0.95 0.95 0.95 0.95 0.95 0.95 0.95 0.95 0.95 0.95 0.95 0.95 PHF Volume: 2 161 0 2 106 4 21 1 102 1 2 126 Reduct Vol: 0 0 0 0 0 0 0 0 0 0 0 0 FinalVolume: 2 161 0 2 106 4 21 1 102 1 2 126 ------------|---------------||---------------||---------------||---------------| Critical Gap Module: Critical Gp: 4.1 xxxx xxxxx 4.1 xxxx xxxxx 7.1 6.5 6.2 7.1 6.5 6.2 FollowUpTim: 2.2 xxxx xxxxx 2.2 xxxx xxxxx 3.5 4.0 3.3 3.5 4.0 3.3 ------------|---------------||---------------||---------------||---------------| Capacity Module: Cnflict Vol: 110 xxxx xxxxx 161 xxxx xxxxx 342 278 108 329 280 161 Potent Cap.: 1492 xxxx xxxxx 1431 xxxx xxxxx 616 633 951 628 632 889 Move Cap.: 1492 xxxx xxxxx 1431 xxxx xxxxx 527 631 951 558 630 889 Volume/Cap: 0.00 xxxx xxxx 0.00 xxxx xxxx 0.04 0.00 0.11 0.00 0.00 0.14 ------------|---------------||---------------||---------------||---------------| Level Of Service Module: 2Way95thQ: 0.0 xxxx xxxxx 0.0 xxxx xxxxx xxxx xxxx xxxxx xxxx xxxx xxxxx Control Del: 7.4 xxxx xxxxx 7.5 xxxx xxxxx xxxxx xxxx xxxxx xxxxx xxxx xxxxx LOS by Move: A * * A * * * * * * * * Movement: LT - LTR - RT LT - LTR - RT LT - LTR - RT LT - LTR - RT Shared Cap.: xxxx xxxx xxxxx xxxx xxxx xxxxx xxxx 832 xxxxx xxxx 879 xxxxx SharedQueue:xxxxx xxxx xxxxx xxxxx xxxx xxxxx xxxxx 0.5 xxxxx xxxxx 0.5 xxxxx Shrd ConDel:xxxxx xxxx xxxxx xxxxx xxxx xxxxx xxxxx 10.1 xxxxx xxxxx 9.8 xxxxx Shared LOS: * * * * * * * B * * A * ApproachDel: xxxxxx xxxxxx 10.1 9.8 ApproachLOS: * * B A Note: Queue reported is the number of cars per lane. Peak Hour Delay Signal Warrant Report ******************************************************************************** Intersection #1 Sinclair/SR-111 ******************************************************************************** Future Volume Alternative: Peak Hour Warrant NOT Met ------------|---------------||---------------||---------------||---------------|
COMPARE Wed Jan 12 09:54:16 2011 Page 3-8
Traffix 7.9.0215 Copyright (c) 2008 Dowling Associates, Inc. Licensed to F & P, INLAND EMPIRE
Approach: North Bound South Bound East Bound West Bound Movement: L - T - R L - T - R L - T - R L - T - R ------------|---------------||---------------||---------------||---------------| Control: Uncontrolled Uncontrolled Stop Sign Stop Sign Lanes: 1 0 0 1 0 1 0 0 1 0 0 0 1! 0 0 0 0 1! 0 0 Initial Vol: 2 153 0 2 101 4 20 1 97 1 2 119 ApproachDel: xxxxxx xxxxxx 10.1 9.8 ------------|---------------||---------------||---------------||---------------| Approach[eastbound][lanes=1][control=Stop Sign] Signal Warrant Rule #1: [vehicle-hours=0.3] FAIL - Vehicle-hours less than 4 for one lane approach. Signal Warrant Rule #2: [approach volume=118] SUCCEED - Approach volume greater than or equal to 100 for one lane approach. Signal Warrant Rule #3: [approach count=4][total volume=503] FAIL - Total volume less than 650 for intersection with less than four approaches. -------------------------------------------------------------------------------- Approach[westbound][lanes=1][control=Stop Sign] Signal Warrant Rule #1: [vehicle-hours=0.3] FAIL - Vehicle-hours less than 4 for one lane approach. Signal Warrant Rule #2: [approach volume=122] SUCCEED - Approach volume greater than or equal to 100 for one lane approach. Signal Warrant Rule #3: [approach count=4][total volume=503] FAIL - Total volume less than 650 for intersection with less than four approaches. -------------------------------------------------------------------------------- SIGNAL WARRANT DISCLAIMER This peak hour signal warrant analysis should be considered solely as an "indicator" of the likelihood of an unsignalized intersection warranting a traffic signal in the future. Intersections that exceed this warrant are probably more likely to meet one or more of the other volume based signal warrant (such as the 4-hour or 8-hour warrants). The peak hour warrant analysis in this report is not intended to replace a rigorous and complete traffic signal warrant analysis by the responsible jurisdiction. Consideration of the other signal warrants, which is beyond the scope of this software, may yield different results. Peak Hour Volume Signal Warrant Report [Urban] ******************************************************************************** Intersection #1 Sinclair/SR-111 ******************************************************************************** Future Volume Alternative: Peak Hour Warrant NOT Met ------------|---------------||---------------||---------------||---------------| Approach: North Bound South Bound East Bound West Bound Movement: L - T - R L - T - R L - T - R L - T - R ------------|---------------||---------------||---------------||---------------| Control: Uncontrolled Uncontrolled Stop Sign Stop Sign Lanes: 1 0 0 1 0 1 0 0 1 0 0 0 1! 0 0 0 0 1! 0 0 Initial Vol: 2 153 0 2 101 4 20 1 97 1 2 119 ------------|---------------||---------------||---------------||---------------| Major Street Volume: 262 Minor Approach Volume: 122 Minor Approach Volume Threshold: 746 -------------------------------------------------------------------------------- SIGNAL WARRANT DISCLAIMER This peak hour signal warrant analysis should be considered solely as an "indicator" of the likelihood of an unsignalized intersection warranting a traffic signal in the future. Intersections that exceed this warrant are probably more likely to meet one or more of the other volume based signal warrant (such as the 4-hour or 8-hour warrants). The peak hour warrant analysis in this report is not intended to replace a rigorous and complete traffic signal warrant analysis by the responsible jurisdiction. Consideration of the other signal warrants, which is beyond the scope of this software, may yield different results.
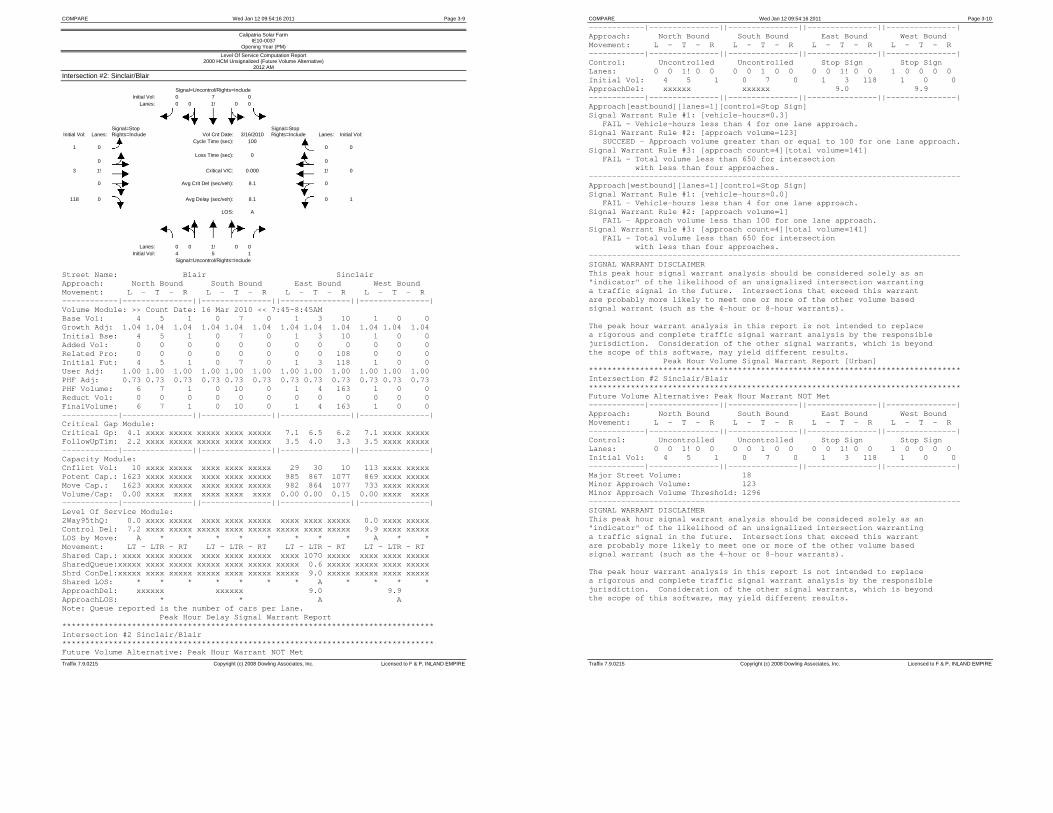
COMPARE Wed Jan 12 09:54:16 2011 Page 3-9
Traffix 7.9.0215 Copyright (c) 2008 Dowling Associates, Inc. Licensed to F & P, INLAND EMPIRE
Calipatria Solar Farm IE10-0037
Opening Year (PM)
Level Of Service Computation Report 2000 HCM Unsignalized (Future Volume Alternative)
2012 AM
Intersection #2: Sinclair/Blair Signal=Uncontrol/Rights=Include Initial Vol: 0 7 0 Lanes: 0 0 1! 0 0
Signal=Stop
Signal=Stop
Initial Vol: Lanes: Rights=Include Vol Cnt Date: 3/16/2010 Rights=Include Lanes: Initial Vol: 1
0
Cycle Time (sec): 100 0
0
0
Loss Time (sec): 0 0
3 1!
Critical V/C: 0.000 1! 0
0
Avg Crit Del (sec/veh): 8.1 0
118 0 Avg Delay (sec/veh): 8.1 0 1
LOS: A
Lanes: 0 0 1! 0 0 Initial Vol: 4 5 1 Signal=Uncontrol/Rights=Include
Street Name: Blair Sinclair Approach: North Bound South Bound East Bound West Bound Movement: L - T - R L - T - R L - T - R L - T - R ------------|---------------||---------------||---------------||---------------| Volume Module: >> Count Date: 16 Mar 2010 << 7:45-8:45AM Base Vol: 4 5 1 0 7 0 1 3 10 1 0 0 Growth Adj: 1.04 1.04 1.04 1.04 1.04 1.04 1.04 1.04 1.04 1.04 1.04 1.04 Initial Bse: 4 5 1 0 7 0 1 3 10 1 0 0 Added Vol: 0 0 0 0 0 0 0 0 0 0 0 0 Related Pro: 0 0 0 0 0 0 0 0 108 0 0 0 Initial Fut: 4 5 1 0 7 0 1 3 118 1 0 0 User Adj: 1.00 1.00 1.00 1.00 1.00 1.00 1.00 1.00 1.00 1.00 1.00 1.00 PHF Adj: 0.73 0.73 0.73 0.73 0.73 0.73 0.73 0.73 0.73 0.73 0.73 0.73 PHF Volume: 6 7 1 0 10 0 1 4 163 1 0 0 Reduct Vol: 0 0 0 0 0 0 0 0 0 0 0 0 FinalVolume: 6 7 1 0 10 0 1 4 163 1 0 0 ------------|---------------||---------------||---------------||---------------| Critical Gap Module: Critical Gp: 4.1 xxxx xxxxx xxxxx xxxx xxxxx 7.1 6.5 6.2 7.1 xxxx xxxxx FollowUpTim: 2.2 xxxx xxxxx xxxxx xxxx xxxxx 3.5 4.0 3.3 3.5 xxxx xxxxx ------------|---------------||---------------||---------------||---------------| Capacity Module: Cnflict Vol: 10 xxxx xxxxx xxxx xxxx xxxxx 29 30 10 113 xxxx xxxxx Potent Cap.: 1623 xxxx xxxxx xxxx xxxx xxxxx 985 867 1077 869 xxxx xxxxx Move Cap.: 1623 xxxx xxxxx xxxx xxxx xxxxx 982 864 1077 733 xxxx xxxxx Volume/Cap: 0.00 xxxx xxxx xxxx xxxx xxxx 0.00 0.00 0.15 0.00 xxxx xxxx ------------|---------------||---------------||---------------||---------------| Level Of Service Module: 2Way95thQ: 0.0 xxxx xxxxx xxxx xxxx xxxxx xxxx xxxx xxxxx 0.0 xxxx xxxxx Control Del: 7.2 xxxx xxxxx xxxxx xxxx xxxxx xxxxx xxxx xxxxx 9.9 xxxx xxxxx LOS by Move: A * * * * * * * * A * * Movement: LT - LTR - RT LT - LTR - RT LT - LTR - RT LT - LTR - RT Shared Cap.: xxxx xxxx xxxxx xxxx xxxx xxxxx xxxx 1070 xxxxx xxxx xxxx xxxxx SharedQueue:xxxxx xxxx xxxxx xxxxx xxxx xxxxx xxxxx 0.6 xxxxx xxxxx xxxx xxxxx Shrd ConDel:xxxxx xxxx xxxxx xxxxx xxxx xxxxx xxxxx 9.0 xxxxx xxxxx xxxx xxxxx Shared LOS: * * * * * * * A * * * * ApproachDel: xxxxxx xxxxxx 9.0 9.9 ApproachLOS: * * A A Note: Queue reported is the number of cars per lane. Peak Hour Delay Signal Warrant Report ******************************************************************************** Intersection #2 Sinclair/Blair ******************************************************************************** Future Volume Alternative: Peak Hour Warrant NOT Met
COMPARE Wed Jan 12 09:54:16 2011 Page 3-10
Traffix 7.9.0215 Copyright (c) 2008 Dowling Associates, Inc. Licensed to F & P, INLAND EMPIRE
------------|---------------||---------------||---------------||---------------| Approach: North Bound South Bound East Bound West Bound Movement: L - T - R L - T - R L - T - R L - T - R ------------|---------------||---------------||---------------||---------------| Control: Uncontrolled Uncontrolled Stop Sign Stop Sign Lanes: 0 0 1! 0 0 0 0 1 0 0 0 0 1! 0 0 1 0 0 0 0 Initial Vol: 4 5 1 0 7 0 1 3 118 1 0 0 ApproachDel: xxxxxx xxxxxx 9.0 9.9 ------------|---------------||---------------||---------------||---------------| Approach[eastbound][lanes=1][control=Stop Sign] Signal Warrant Rule #1: [vehicle-hours=0.3] FAIL - Vehicle-hours less than 4 for one lane approach. Signal Warrant Rule #2: [approach volume=123] SUCCEED - Approach volume greater than or equal to 100 for one lane approach. Signal Warrant Rule #3: [approach count=4][total volume=141] FAIL - Total volume less than 650 for intersection with less than four approaches. -------------------------------------------------------------------------------- Approach[westbound][lanes=1][control=Stop Sign] Signal Warrant Rule #1: [vehicle-hours=0.0] FAIL - Vehicle-hours less than 4 for one lane approach. Signal Warrant Rule #2: [approach volume=1] FAIL - Approach volume less than 100 for one lane approach. Signal Warrant Rule #3: [approach count=4][total volume=141] FAIL - Total volume less than 650 for intersection with less than four approaches. -------------------------------------------------------------------------------- SIGNAL WARRANT DISCLAIMER This peak hour signal warrant analysis should be considered solely as an "indicator" of the likelihood of an unsignalized intersection warranting a traffic signal in the future. Intersections that exceed this warrant are probably more likely to meet one or more of the other volume based signal warrant (such as the 4-hour or 8-hour warrants). The peak hour warrant analysis in this report is not intended to replace a rigorous and complete traffic signal warrant analysis by the responsible jurisdiction. Consideration of the other signal warrants, which is beyond the scope of this software, may yield different results. Peak Hour Volume Signal Warrant Report [Urban] ******************************************************************************** Intersection #2 Sinclair/Blair ******************************************************************************** Future Volume Alternative: Peak Hour Warrant NOT Met ------------|---------------||---------------||---------------||---------------| Approach: North Bound South Bound East Bound West Bound Movement: L - T - R L - T - R L - T - R L - T - R ------------|---------------||---------------||---------------||---------------| Control: Uncontrolled Uncontrolled Stop Sign Stop Sign Lanes: 0 0 1! 0 0 0 0 1 0 0 0 0 1! 0 0 1 0 0 0 0 Initial Vol: 4 5 1 0 7 0 1 3 118 1 0 0 ------------|---------------||---------------||---------------||---------------| Major Street Volume: 18 Minor Approach Volume: 123 Minor Approach Volume Threshold: 1296 -------------------------------------------------------------------------------- SIGNAL WARRANT DISCLAIMER This peak hour signal warrant analysis should be considered solely as an "indicator" of the likelihood of an unsignalized intersection warranting a traffic signal in the future. Intersections that exceed this warrant are probably more likely to meet one or more of the other volume based signal warrant (such as the 4-hour or 8-hour warrants). The peak hour warrant analysis in this report is not intended to replace a rigorous and complete traffic signal warrant analysis by the responsible jurisdiction. Consideration of the other signal warrants, which is beyond the scope of this software, may yield different results.

COMPARE Wed Jan 12 09:54:16 2011 Page 3-11
Traffix 7.9.0215 Copyright (c) 2008 Dowling Associates, Inc. Licensed to F & P, INLAND EMPIRE
Calipatria Solar Farm IE10-0037
Opening Year (PM)
Level Of Service Computation Report 2000 HCM Unsignalized (Future Volume Alternative)
2012 PM
Intersection #2: Sinclair/Blair Signal=Uncontrol/Rights=Include Initial Vol: 0 3 1 Lanes: 0 0 1! 0 0
Signal=Stop
Signal=Stop
Initial Vol: Lanes: Rights=Include Vol Cnt Date: 3/16/2010 Rights=Include Lanes: Initial Vol: 1
0
Cycle Time (sec): 100 0
0
0
Loss Time (sec): 0 0
1 1!
Critical V/C: 0.000 1! 0
0
Avg Crit Del (sec/veh): 7.2 0
3 0 Avg Delay (sec/veh): 7.2 0 0
LOS: A
Lanes: 0 0 1! 0 0 Initial Vol: 112 2 1 Signal=Uncontrol/Rights=Include
Street Name: Blair Sinclair Approach: North Bound South Bound East Bound West Bound Movement: L - T - R L - T - R L - T - R L - T - R ------------|---------------||---------------||---------------||---------------| Volume Module: >> Count Date: 16 Mar 2010 << 4:00-5:00PM Base Vol: 4 2 1 1 3 0 1 1 3 0 0 0 Growth Adj: 1.04 1.04 1.04 1.04 1.04 1.04 1.04 1.04 1.04 1.04 1.04 1.04 Initial Bse: 4 2 1 1 3 0 1 1 3 0 0 0 Added Vol: 0 0 0 0 0 0 0 0 0 0 0 0 Related Pro: 108 0 0 0 0 0 0 0 0 0 0 0 Initial Fut: 112 2 1 1 3 0 1 1 3 0 0 0 User Adj: 1.00 1.00 1.00 1.00 1.00 1.00 1.00 1.00 1.00 1.00 1.00 1.00 PHF Adj: 0.67 0.67 0.67 0.67 0.67 0.67 0.67 0.67 0.67 0.67 0.67 0.67 PHF Volume: 168 3 2 2 5 0 2 2 5 0 0 0 Reduct Vol: 0 0 0 0 0 0 0 0 0 0 0 0 FinalVolume: 168 3 2 2 5 0 2 2 5 0 0 0 ------------|---------------||---------------||---------------||---------------| Critical Gap Module: Critical Gp: 4.1 xxxx xxxxx 4.1 xxxx xxxxx 6.4 6.5 6.2 7.1 6.5 6.2 FollowUpTim: 2.2 xxxx xxxxx 2.2 xxxx xxxxx 3.5 4.0 3.3 3.5 4.0 3.3 ------------|---------------||---------------||---------------||---------------| Capacity Module: Cnflict Vol: 5 xxxx xxxxx 5 xxxx xxxxx 348 349 5 351 348 4 Potent Cap.: 1630 xxxx xxxxx 1630 xxxx xxxxx 653 578 1084 607 579 1086 Move Cap.: 1630 xxxx xxxxx 1630 xxxx xxxxx 596 512 1084 550 513 1086 Volume/Cap: 0.10 xxxx xxxx 0.00 xxxx xxxx 0.00 0.00 0.00 0.00 0.00 0.00 ------------|---------------||---------------||---------------||---------------| Level Of Service Module: 2Way95thQ: 0.3 xxxx xxxxx 0.0 xxxx xxxxx xxxx xxxx xxxxx xxxx xxxx xxxxx Control Del: 7.5 xxxx xxxxx 7.2 xxxx xxxxx xxxxx xxxx xxxxx xxxxx xxxx xxxxx LOS by Move: A * * A * * * * * * * * Movement: LT - LTR - RT LT - LTR - RT LT - LTR - RT LT - LTR - RT Shared Cap.: xxxx xxxx xxxxx xxxx xxxx xxxxx xxxx 781 xxxxx xxxx 0 xxxxx SharedQueue:xxxxx xxxx xxxxx 0.0 xxxx xxxxx xxxxx 0.0 xxxxx xxxxx xxxx xxxxx Shrd ConDel:xxxxx xxxx xxxxx 7.2 xxxx xxxxx xxxxx 9.7 xxxxx xxxxx xxxx xxxxx Shared LOS: * * * A * * * A * * * * ApproachDel: xxxxxx xxxxxx 9.7 xxxxxx ApproachLOS: * * A * Note: Queue reported is the number of cars per lane. Peak Hour Delay Signal Warrant Report ******************************************************************************** Intersection #2 Sinclair/Blair ******************************************************************************** Future Volume Alternative: Peak Hour Warrant NOT Met
COMPARE Wed Jan 12 09:54:16 2011 Page 3-12
Traffix 7.9.0215 Copyright (c) 2008 Dowling Associates, Inc. Licensed to F & P, INLAND EMPIRE
------------|---------------||---------------||---------------||---------------| Approach: North Bound South Bound East Bound West Bound Movement: L - T - R L - T - R L - T - R L - T - R ------------|---------------||---------------||---------------||---------------| Control: Uncontrolled Uncontrolled Stop Sign Stop Sign Lanes: 0 0 1! 0 0 0 1 0 0 0 0 0 1! 0 0 0 0 1! 0 0 Initial Vol: 112 2 1 1 3 0 1 1 3 0 0 0 ApproachDel: xxxxxx xxxxxx 9.7 xxxxxx ------------|---------------||---------------||---------------||---------------| Approach[eastbound][lanes=1][control=Stop Sign] Signal Warrant Rule #1: [vehicle-hours=0.0] FAIL - Vehicle-hours less than 4 for one lane approach. Signal Warrant Rule #2: [approach volume=5] FAIL - Approach volume less than 100 for one lane approach. Signal Warrant Rule #3: [approach count=3][total volume=125] FAIL - Total volume less than 650 for intersection with less than four approaches. -------------------------------------------------------------------------------- SIGNAL WARRANT DISCLAIMER This peak hour signal warrant analysis should be considered solely as an "indicator" of the likelihood of an unsignalized intersection warranting a traffic signal in the future. Intersections that exceed this warrant are probably more likely to meet one or more of the other volume based signal warrant (such as the 4-hour or 8-hour warrants). The peak hour warrant analysis in this report is not intended to replace a rigorous and complete traffic signal warrant analysis by the responsible jurisdiction. Consideration of the other signal warrants, which is beyond the scope of this software, may yield different results. Peak Hour Volume Signal Warrant Report [Urban] ******************************************************************************** Intersection #2 Sinclair/Blair ******************************************************************************** Future Volume Alternative: Peak Hour Warrant NOT Met ------------|---------------||---------------||---------------||---------------| Approach: North Bound South Bound East Bound West Bound Movement: L - T - R L - T - R L - T - R L - T - R ------------|---------------||---------------||---------------||---------------| Control: Uncontrolled Uncontrolled Stop Sign Stop Sign Lanes: 0 0 1! 0 0 0 1 0 0 0 0 0 1! 0 0 0 0 1! 0 0 Initial Vol: 112 2 1 1 3 0 1 1 3 0 0 0 ------------|---------------||---------------||---------------||---------------| Major Street Volume: 119 Minor Approach Volume: 5 Minor Approach Volume Threshold: 786 -------------------------------------------------------------------------------- SIGNAL WARRANT DISCLAIMER This peak hour signal warrant analysis should be considered solely as an "indicator" of the likelihood of an unsignalized intersection warranting a traffic signal in the future. Intersections that exceed this warrant are probably more likely to meet one or more of the other volume based signal warrant (such as the 4-hour or 8-hour warrants). The peak hour warrant analysis in this report is not intended to replace a rigorous and complete traffic signal warrant analysis by the responsible jurisdiction. Consideration of the other signal warrants, which is beyond the scope of this software, may yield different results.
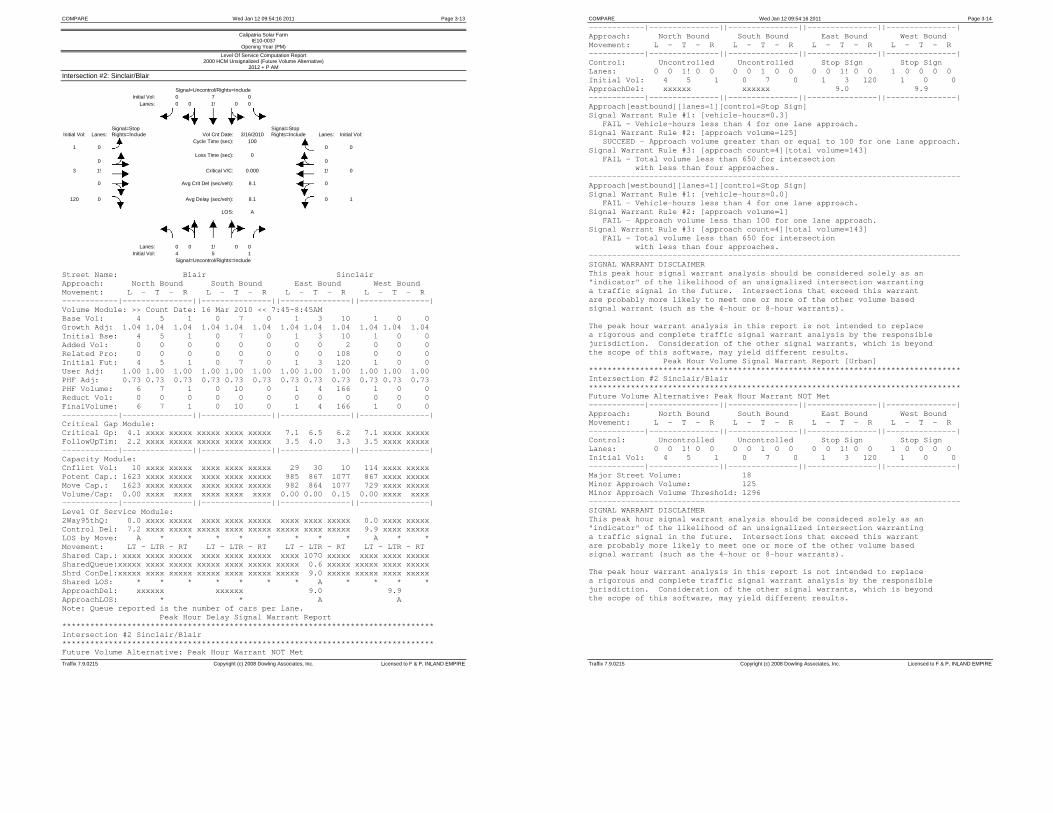
COMPARE Wed Jan 12 09:54:16 2011 Page 3-13
Traffix 7.9.0215 Copyright (c) 2008 Dowling Associates, Inc. Licensed to F & P, INLAND EMPIRE
Calipatria Solar Farm IE10-0037
Opening Year (PM)
Level Of Service Computation Report 2000 HCM Unsignalized (Future Volume Alternative)
2012 + P AM
Intersection #2: Sinclair/Blair Signal=Uncontrol/Rights=Include Initial Vol: 0 7 0 Lanes: 0 0 1! 0 0
Signal=Stop
Signal=Stop
Initial Vol: Lanes: Rights=Include Vol Cnt Date: 3/16/2010 Rights=Include Lanes: Initial Vol: 1
0
Cycle Time (sec): 100 0
0
0
Loss Time (sec): 0 0
3 1!
Critical V/C: 0.000 1! 0
0
Avg Crit Del (sec/veh): 8.1 0
120 0 Avg Delay (sec/veh): 8.1 0 1
LOS: A
Lanes: 0 0 1! 0 0 Initial Vol: 4 5 1 Signal=Uncontrol/Rights=Include
Street Name: Blair Sinclair Approach: North Bound South Bound East Bound West Bound Movement: L - T - R L - T - R L - T - R L - T - R ------------|---------------||---------------||---------------||---------------| Volume Module: >> Count Date: 16 Mar 2010 << 7:45-8:45AM Base Vol: 4 5 1 0 7 0 1 3 10 1 0 0 Growth Adj: 1.04 1.04 1.04 1.04 1.04 1.04 1.04 1.04 1.04 1.04 1.04 1.04 Initial Bse: 4 5 1 0 7 0 1 3 10 1 0 0 Added Vol: 0 0 0 0 0 0 0 0 2 0 0 0 Related Pro: 0 0 0 0 0 0 0 0 108 0 0 0 Initial Fut: 4 5 1 0 7 0 1 3 120 1 0 0 User Adj: 1.00 1.00 1.00 1.00 1.00 1.00 1.00 1.00 1.00 1.00 1.00 1.00 PHF Adj: 0.73 0.73 0.73 0.73 0.73 0.73 0.73 0.73 0.73 0.73 0.73 0.73 PHF Volume: 6 7 1 0 10 0 1 4 166 1 0 0 Reduct Vol: 0 0 0 0 0 0 0 0 0 0 0 0 FinalVolume: 6 7 1 0 10 0 1 4 166 1 0 0 ------------|---------------||---------------||---------------||---------------| Critical Gap Module: Critical Gp: 4.1 xxxx xxxxx xxxxx xxxx xxxxx 7.1 6.5 6.2 7.1 xxxx xxxxx FollowUpTim: 2.2 xxxx xxxxx xxxxx xxxx xxxxx 3.5 4.0 3.3 3.5 xxxx xxxxx ------------|---------------||---------------||---------------||---------------| Capacity Module: Cnflict Vol: 10 xxxx xxxxx xxxx xxxx xxxxx 29 30 10 114 xxxx xxxxx Potent Cap.: 1623 xxxx xxxxx xxxx xxxx xxxxx 985 867 1077 867 xxxx xxxxx Move Cap.: 1623 xxxx xxxxx xxxx xxxx xxxxx 982 864 1077 729 xxxx xxxxx Volume/Cap: 0.00 xxxx xxxx xxxx xxxx xxxx 0.00 0.00 0.15 0.00 xxxx xxxx ------------|---------------||---------------||---------------||---------------| Level Of Service Module: 2Way95thQ: 0.0 xxxx xxxxx xxxx xxxx xxxxx xxxx xxxx xxxxx 0.0 xxxx xxxxx Control Del: 7.2 xxxx xxxxx xxxxx xxxx xxxxx xxxxx xxxx xxxxx 9.9 xxxx xxxxx LOS by Move: A * * * * * * * * A * * Movement: LT - LTR - RT LT - LTR - RT LT - LTR - RT LT - LTR - RT Shared Cap.: xxxx xxxx xxxxx xxxx xxxx xxxxx xxxx 1070 xxxxx xxxx xxxx xxxxx SharedQueue:xxxxx xxxx xxxxx xxxxx xxxx xxxxx xxxxx 0.6 xxxxx xxxxx xxxx xxxxx Shrd ConDel:xxxxx xxxx xxxxx xxxxx xxxx xxxxx xxxxx 9.0 xxxxx xxxxx xxxx xxxxx Shared LOS: * * * * * * * A * * * * ApproachDel: xxxxxx xxxxxx 9.0 9.9 ApproachLOS: * * A A Note: Queue reported is the number of cars per lane. Peak Hour Delay Signal Warrant Report ******************************************************************************** Intersection #2 Sinclair/Blair ******************************************************************************** Future Volume Alternative: Peak Hour Warrant NOT Met
COMPARE Wed Jan 12 09:54:16 2011 Page 3-14
Traffix 7.9.0215 Copyright (c) 2008 Dowling Associates, Inc. Licensed to F & P, INLAND EMPIRE
------------|---------------||---------------||---------------||---------------| Approach: North Bound South Bound East Bound West Bound Movement: L - T - R L - T - R L - T - R L - T - R ------------|---------------||---------------||---------------||---------------| Control: Uncontrolled Uncontrolled Stop Sign Stop Sign Lanes: 0 0 1! 0 0 0 0 1 0 0 0 0 1! 0 0 1 0 0 0 0 Initial Vol: 4 5 1 0 7 0 1 3 120 1 0 0 ApproachDel: xxxxxx xxxxxx 9.0 9.9 ------------|---------------||---------------||---------------||---------------| Approach[eastbound][lanes=1][control=Stop Sign] Signal Warrant Rule #1: [vehicle-hours=0.3] FAIL - Vehicle-hours less than 4 for one lane approach. Signal Warrant Rule #2: [approach volume=125] SUCCEED - Approach volume greater than or equal to 100 for one lane approach. Signal Warrant Rule #3: [approach count=4][total volume=143] FAIL - Total volume less than 650 for intersection with less than four approaches. -------------------------------------------------------------------------------- Approach[westbound][lanes=1][control=Stop Sign] Signal Warrant Rule #1: [vehicle-hours=0.0] FAIL - Vehicle-hours less than 4 for one lane approach. Signal Warrant Rule #2: [approach volume=1] FAIL - Approach volume less than 100 for one lane approach. Signal Warrant Rule #3: [approach count=4][total volume=143] FAIL - Total volume less than 650 for intersection with less than four approaches. -------------------------------------------------------------------------------- SIGNAL WARRANT DISCLAIMER This peak hour signal warrant analysis should be considered solely as an "indicator" of the likelihood of an unsignalized intersection warranting a traffic signal in the future. Intersections that exceed this warrant are probably more likely to meet one or more of the other volume based signal warrant (such as the 4-hour or 8-hour warrants). The peak hour warrant analysis in this report is not intended to replace a rigorous and complete traffic signal warrant analysis by the responsible jurisdiction. Consideration of the other signal warrants, which is beyond the scope of this software, may yield different results. Peak Hour Volume Signal Warrant Report [Urban] ******************************************************************************** Intersection #2 Sinclair/Blair ******************************************************************************** Future Volume Alternative: Peak Hour Warrant NOT Met ------------|---------------||---------------||---------------||---------------| Approach: North Bound South Bound East Bound West Bound Movement: L - T - R L - T - R L - T - R L - T - R ------------|---------------||---------------||---------------||---------------| Control: Uncontrolled Uncontrolled Stop Sign Stop Sign Lanes: 0 0 1! 0 0 0 0 1 0 0 0 0 1! 0 0 1 0 0 0 0 Initial Vol: 4 5 1 0 7 0 1 3 120 1 0 0 ------------|---------------||---------------||---------------||---------------| Major Street Volume: 18 Minor Approach Volume: 125 Minor Approach Volume Threshold: 1296 -------------------------------------------------------------------------------- SIGNAL WARRANT DISCLAIMER This peak hour signal warrant analysis should be considered solely as an "indicator" of the likelihood of an unsignalized intersection warranting a traffic signal in the future. Intersections that exceed this warrant are probably more likely to meet one or more of the other volume based signal warrant (such as the 4-hour or 8-hour warrants). The peak hour warrant analysis in this report is not intended to replace a rigorous and complete traffic signal warrant analysis by the responsible jurisdiction. Consideration of the other signal warrants, which is beyond the scope of this software, may yield different results.

COMPARE Wed Jan 12 09:54:16 2011 Page 3-15
Traffix 7.9.0215 Copyright (c) 2008 Dowling Associates, Inc. Licensed to F & P, INLAND EMPIRE
Calipatria Solar Farm IE10-0037
Opening Year (PM)
Level Of Service Computation Report 2000 HCM Unsignalized (Future Volume Alternative)
2012 + P PM
Intersection #2: Sinclair/Blair Signal=Uncontrol/Rights=Include Initial Vol: 0 3 1 Lanes: 0 0 1! 0 0
Signal=Stop
Signal=Stop
Initial Vol: Lanes: Rights=Include Vol Cnt Date: 3/16/2010 Rights=Include Lanes: Initial Vol: 1
0
Cycle Time (sec): 100 0
0
0
Loss Time (sec): 0 0
1 1!
Critical V/C: 0.000 1! 0
0
Avg Crit Del (sec/veh): 7.2 0
3 0 Avg Delay (sec/veh): 7.2 0 0
LOS: A
Lanes: 0 0 1! 0 0 Initial Vol: 114 2 1 Signal=Uncontrol/Rights=Include
Street Name: Blair Sinclair Approach: North Bound South Bound East Bound West Bound Movement: L - T - R L - T - R L - T - R L - T - R ------------|---------------||---------------||---------------||---------------| Volume Module: >> Count Date: 16 Mar 2010 << 4:00-5:00PM Base Vol: 4 2 1 1 3 0 1 1 3 0 0 0 Growth Adj: 1.04 1.04 1.04 1.04 1.04 1.04 1.04 1.04 1.04 1.04 1.04 1.04 Initial Bse: 4 2 1 1 3 0 1 1 3 0 0 0 Added Vol: 2 0 0 0 0 0 0 0 0 0 0 0 Related Pro: 108 0 0 0 0 0 0 0 0 0 0 0 Initial Fut: 114 2 1 1 3 0 1 1 3 0 0 0 User Adj: 1.00 1.00 1.00 1.00 1.00 1.00 1.00 1.00 1.00 1.00 1.00 1.00 PHF Adj: 0.67 0.67 0.67 0.67 0.67 0.67 0.67 0.67 0.67 0.67 0.67 0.67 PHF Volume: 171 3 2 2 5 0 2 2 5 0 0 0 Reduct Vol: 0 0 0 0 0 0 0 0 0 0 0 0 FinalVolume: 171 3 2 2 5 0 2 2 5 0 0 0 ------------|---------------||---------------||---------------||---------------| Critical Gap Module: Critical Gp: 4.1 xxxx xxxxx 4.1 xxxx xxxxx 6.4 6.5 6.2 7.1 6.5 6.2 FollowUpTim: 2.2 xxxx xxxxx 2.2 xxxx xxxxx 3.5 4.0 3.3 3.5 4.0 3.3 ------------|---------------||---------------||---------------||---------------| Capacity Module: Cnflict Vol: 5 xxxx xxxxx 5 xxxx xxxxx 354 355 5 357 354 4 Potent Cap.: 1630 xxxx xxxxx 1630 xxxx xxxxx 648 574 1084 602 574 1086 Move Cap.: 1630 xxxx xxxxx 1630 xxxx xxxxx 590 507 1084 544 507 1086 Volume/Cap: 0.11 xxxx xxxx 0.00 xxxx xxxx 0.00 0.00 0.00 0.00 0.00 0.00 ------------|---------------||---------------||---------------||---------------| Level Of Service Module: 2Way95thQ: 0.4 xxxx xxxxx 0.0 xxxx xxxxx xxxx xxxx xxxxx xxxx xxxx xxxxx Control Del: 7.5 xxxx xxxxx 7.2 xxxx xxxxx xxxxx xxxx xxxxx xxxxx xxxx xxxxx LOS by Move: A * * A * * * * * * * * Movement: LT - LTR - RT LT - LTR - RT LT - LTR - RT LT - LTR - RT Shared Cap.: xxxx xxxx xxxxx xxxx xxxx xxxxx xxxx 777 xxxxx xxxx 0 xxxxx SharedQueue:xxxxx xxxx xxxxx 0.0 xxxx xxxxx xxxxx 0.0 xxxxx xxxxx xxxx xxxxx Shrd ConDel:xxxxx xxxx xxxxx 7.2 xxxx xxxxx xxxxx 9.7 xxxxx xxxxx xxxx xxxxx Shared LOS: * * * A * * * A * * * * ApproachDel: xxxxxx xxxxxx 9.7 xxxxxx ApproachLOS: * * A * Note: Queue reported is the number of cars per lane. Peak Hour Delay Signal Warrant Report ******************************************************************************** Intersection #2 Sinclair/Blair ******************************************************************************** Future Volume Alternative: Peak Hour Warrant NOT Met
COMPARE Wed Jan 12 09:54:16 2011 Page 3-16
Traffix 7.9.0215 Copyright (c) 2008 Dowling Associates, Inc. Licensed to F & P, INLAND EMPIRE
------------|---------------||---------------||---------------||---------------| Approach: North Bound South Bound East Bound West Bound Movement: L - T - R L - T - R L - T - R L - T - R ------------|---------------||---------------||---------------||---------------| Control: Uncontrolled Uncontrolled Stop Sign Stop Sign Lanes: 0 0 1! 0 0 0 1 0 0 0 0 0 1! 0 0 0 0 1! 0 0 Initial Vol: 114 2 1 1 3 0 1 1 3 0 0 0 ApproachDel: xxxxxx xxxxxx 9.7 xxxxxx ------------|---------------||---------------||---------------||---------------| Approach[eastbound][lanes=1][control=Stop Sign] Signal Warrant Rule #1: [vehicle-hours=0.0] FAIL - Vehicle-hours less than 4 for one lane approach. Signal Warrant Rule #2: [approach volume=5] FAIL - Approach volume less than 100 for one lane approach. Signal Warrant Rule #3: [approach count=3][total volume=127] FAIL - Total volume less than 650 for intersection with less than four approaches. -------------------------------------------------------------------------------- SIGNAL WARRANT DISCLAIMER This peak hour signal warrant analysis should be considered solely as an "indicator" of the likelihood of an unsignalized intersection warranting a traffic signal in the future. Intersections that exceed this warrant are probably more likely to meet one or more of the other volume based signal warrant (such as the 4-hour or 8-hour warrants). The peak hour warrant analysis in this report is not intended to replace a rigorous and complete traffic signal warrant analysis by the responsible jurisdiction. Consideration of the other signal warrants, which is beyond the scope of this software, may yield different results. Peak Hour Volume Signal Warrant Report [Urban] ******************************************************************************** Intersection #2 Sinclair/Blair ******************************************************************************** Future Volume Alternative: Peak Hour Warrant NOT Met ------------|---------------||---------------||---------------||---------------| Approach: North Bound South Bound East Bound West Bound Movement: L - T - R L - T - R L - T - R L - T - R ------------|---------------||---------------||---------------||---------------| Control: Uncontrolled Uncontrolled Stop Sign Stop Sign Lanes: 0 0 1! 0 0 0 1 0 0 0 0 0 1! 0 0 0 0 1! 0 0 Initial Vol: 114 2 1 1 3 0 1 1 3 0 0 0 ------------|---------------||---------------||---------------||---------------| Major Street Volume: 121 Minor Approach Volume: 5 Minor Approach Volume Threshold: 782 -------------------------------------------------------------------------------- SIGNAL WARRANT DISCLAIMER This peak hour signal warrant analysis should be considered solely as an "indicator" of the likelihood of an unsignalized intersection warranting a traffic signal in the future. Intersections that exceed this warrant are probably more likely to meet one or more of the other volume based signal warrant (such as the 4-hour or 8-hour warrants). The peak hour warrant analysis in this report is not intended to replace a rigorous and complete traffic signal warrant analysis by the responsible jurisdiction. Consideration of the other signal warrants, which is beyond the scope of this software, may yield different results.

COMPARE Wed Jan 12 09:54:16 2011 Page 3-17
Traffix 7.9.0215 Copyright (c) 2008 Dowling Associates, Inc. Licensed to F & P, INLAND EMPIRE
Calipatria Solar Farm IE10-0037
Opening Year (PM)
Level Of Service Computation Report 2000 HCM Unsignalized (Future Volume Alternative)
2012 AM
Intersection #3: Peterson/Blair Signal=Uncontrol/Rights=Include Initial Vol: 0 19 0 Lanes: 0 0 1! 0 0
Signal=Stop
Signal=Stop
Initial Vol: Lanes: Rights=Include Vol Cnt Date: 3/16/2010 Rights=Include Lanes: Initial Vol: 0
0
Cycle Time (sec): 100 0
0
0
Loss Time (sec): 0 0
0 1!
Critical V/C: 0.000 1! 0
0
Avg Crit Del (sec/veh): 0.0 0
0 0 Avg Delay (sec/veh): 0.0 0 1
LOS: B
Lanes: 0 0 1! 0 0 Initial Vol: 0 221 0 Signal=Uncontrol/Rights=Include
Street Name: Blair Peterson Approach: North Bound South Bound East Bound West Bound Movement: L - T - R L - T - R L - T - R L - T - R ------------|---------------||---------------||---------------||---------------| Volume Module: >> Count Date: 16 Mar 2010 << 7:15-8:15 AM Base Vol: 0 212 0 0 18 0 0 0 0 1 0 0 Growth Adj: 1.04 1.04 1.04 1.04 1.04 1.04 1.04 1.04 1.04 1.04 1.04 1.04 Initial Bse: 0 221 0 0 19 0 0 0 0 1 0 0 Added Vol: 0 0 0 0 0 0 0 0 0 0 0 0 Related Pro: 0 0 0 0 0 0 0 0 0 0 0 0 Initial Fut: 0 221 0 0 19 0 0 0 0 1 0 0 User Adj: 1.00 1.00 1.00 1.00 1.00 1.00 1.00 1.00 1.00 1.00 1.00 1.00 PHF Adj: 0.69 0.69 0.69 0.69 0.69 0.69 0.69 0.69 0.69 0.69 0.69 0.69 PHF Volume: 0 321 0 0 27 0 0 0 0 2 0 0 Reduct Vol: 0 0 0 0 0 0 0 0 0 0 0 0 FinalVolume: 0 321 0 0 27 0 0 0 0 2 0 0 ------------|---------------||---------------||---------------||---------------| Critical Gap Module: Critical Gp:xxxxx xxxx xxxxx xxxxx xxxx xxxxx 7.1 6.5 6.2 6.4 xxxx xxxxx FollowUpTim:xxxxx xxxx xxxxx xxxxx xxxx xxxxx 3.5 4.0 3.3 3.5 xxxx xxxxx ------------|---------------||---------------||---------------||---------------| Capacity Module: Cnflict Vol: xxxx xxxx xxxxx xxxx xxxx xxxxx 348 348 27 348 xxxx xxxxx Potent Cap.: xxxx xxxx xxxxx xxxx xxxx xxxxx 611 579 1054 653 xxxx xxxxx Move Cap.: xxxx xxxx xxxxx xxxx xxxx xxxxx 611 579 1054 653 xxxx xxxxx Volume/Cap: xxxx xxxx xxxx xxxx xxxx xxxx 0.00 0.00 0.00 0.00 xxxx xxxx ------------|---------------||---------------||---------------||---------------| Level Of Service Module: 2Way95thQ: xxxx xxxx xxxxx xxxx xxxx xxxxx xxxx xxxx xxxxx 0.0 xxxx xxxxx Control Del:xxxxx xxxx xxxxx xxxxx xxxx xxxxx xxxxx xxxx xxxxx 10.5 xxxx xxxxx LOS by Move: * * * * * * * * * B * * Movement: LT - LTR - RT LT - LTR - RT LT - LTR - RT LT - LTR - RT Shared Cap.: xxxx xxxx xxxxx xxxx xxxx xxxxx xxxx 0 xxxxx xxxx xxxx xxxxx SharedQueue:xxxxx xxxx xxxxx xxxxx xxxx xxxxx xxxxx xxxx xxxxx xxxxx xxxx xxxxx Shrd ConDel:xxxxx xxxx xxxxx xxxxx xxxx xxxxx xxxxx xxxx xxxxx xxxxx xxxx xxxxx Shared LOS: * * * * * * * * * * * * ApproachDel: xxxxxx xxxxxx xxxxxx 10.5 ApproachLOS: * * * B Note: Queue reported is the number of cars per lane. Peak Hour Delay Signal Warrant Report ******************************************************************************** Intersection #3 Peterson/Blair ******************************************************************************** Future Volume Alternative: Peak Hour Warrant NOT Met
COMPARE Wed Jan 12 09:54:16 2011 Page 3-18
Traffix 7.9.0215 Copyright (c) 2008 Dowling Associates, Inc. Licensed to F & P, INLAND EMPIRE
------------|---------------||---------------||---------------||---------------| Approach: North Bound South Bound East Bound West Bound Movement: L - T - R L - T - R L - T - R L - T - R ------------|---------------||---------------||---------------||---------------| Control: Uncontrolled Uncontrolled Stop Sign Stop Sign Lanes: 0 0 1 0 0 0 0 1 0 0 0 0 1! 0 0 1 0 0 0 0 Initial Vol: 0 221 0 0 19 0 0 0 0 1 0 0 ApproachDel: xxxxxx xxxxxx xxxxxx 10.5 ------------|---------------||---------------||---------------||---------------| Approach[westbound][lanes=1][control=Stop Sign] Signal Warrant Rule #1: [vehicle-hours=0.0] FAIL - Vehicle-hours less than 4 for one lane approach. Signal Warrant Rule #2: [approach volume=1] FAIL - Approach volume less than 100 for one lane approach. Signal Warrant Rule #3: [approach count=3][total volume=240] FAIL - Total volume less than 650 for intersection with less than four approaches. -------------------------------------------------------------------------------- SIGNAL WARRANT DISCLAIMER This peak hour signal warrant analysis should be considered solely as an "indicator" of the likelihood of an unsignalized intersection warranting a traffic signal in the future. Intersections that exceed this warrant are probably more likely to meet one or more of the other volume based signal warrant (such as the 4-hour or 8-hour warrants). The peak hour warrant analysis in this report is not intended to replace a rigorous and complete traffic signal warrant analysis by the responsible jurisdiction. Consideration of the other signal warrants, which is beyond the scope of this software, may yield different results. Peak Hour Volume Signal Warrant Report [Urban] ******************************************************************************** Intersection #3 Peterson/Blair ******************************************************************************** Future Volume Alternative: Peak Hour Warrant NOT Met ------------|---------------||---------------||---------------||---------------| Approach: North Bound South Bound East Bound West Bound Movement: L - T - R L - T - R L - T - R L - T - R ------------|---------------||---------------||---------------||---------------| Control: Uncontrolled Uncontrolled Stop Sign Stop Sign Lanes: 0 0 1 0 0 0 0 1 0 0 0 0 1! 0 0 1 0 0 0 0 Initial Vol: 0 221 0 0 19 0 0 0 0 1 0 0 ------------|---------------||---------------||---------------||---------------| Major Street Volume: 239 Minor Approach Volume: 1 Minor Approach Volume Threshold: 601 -------------------------------------------------------------------------------- SIGNAL WARRANT DISCLAIMER This peak hour signal warrant analysis should be considered solely as an "indicator" of the likelihood of an unsignalized intersection warranting a traffic signal in the future. Intersections that exceed this warrant are probably more likely to meet one or more of the other volume based signal warrant (such as the 4-hour or 8-hour warrants). The peak hour warrant analysis in this report is not intended to replace a rigorous and complete traffic signal warrant analysis by the responsible jurisdiction. Consideration of the other signal warrants, which is beyond the scope of this software, may yield different results.
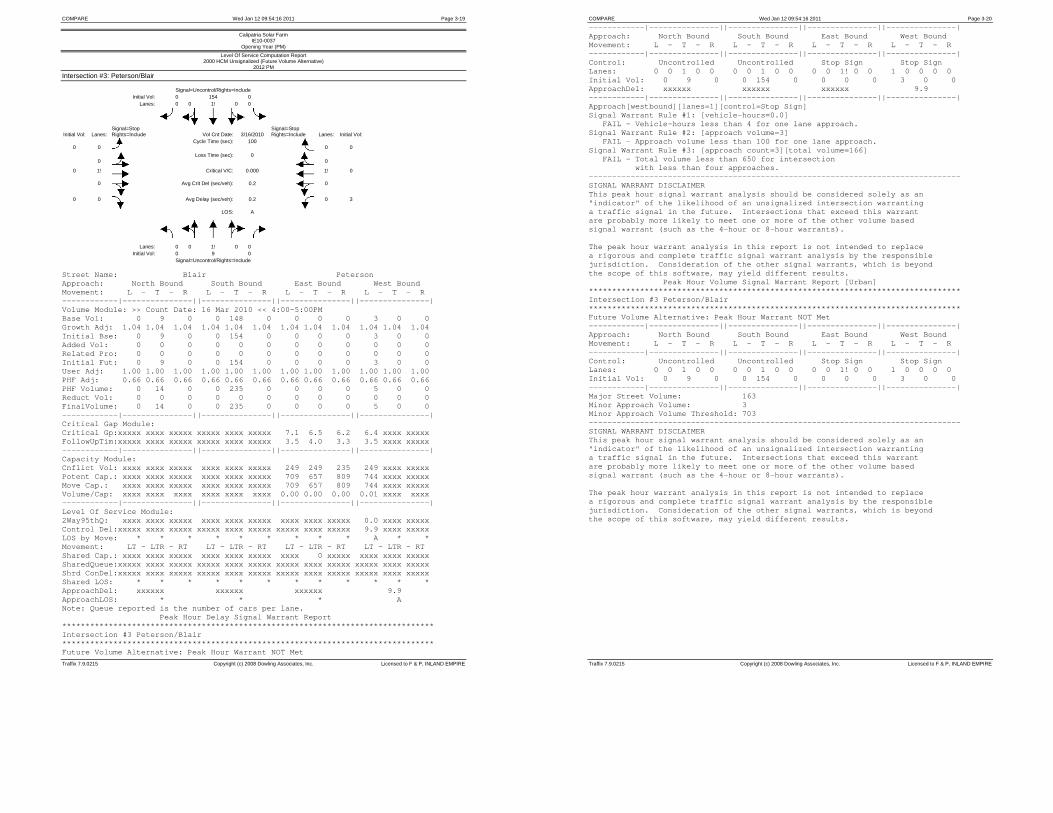
COMPARE Wed Jan 12 09:54:16 2011 Page 3-19
Traffix 7.9.0215 Copyright (c) 2008 Dowling Associates, Inc. Licensed to F & P, INLAND EMPIRE
Calipatria Solar Farm IE10-0037
Opening Year (PM)
Level Of Service Computation Report 2000 HCM Unsignalized (Future Volume Alternative)
2012 PM
Intersection #3: Peterson/Blair Signal=Uncontrol/Rights=Include Initial Vol: 0 154 0 Lanes: 0 0 1! 0 0
Signal=Stop
Signal=Stop
Initial Vol: Lanes: Rights=Include Vol Cnt Date: 3/16/2010 Rights=Include Lanes: Initial Vol: 0
0
Cycle Time (sec): 100 0
0
0
Loss Time (sec): 0 0
0 1!
Critical V/C: 0.000 1! 0
0
Avg Crit Del (sec/veh): 0.2 0
0 0 Avg Delay (sec/veh): 0.2 0 3
LOS: A
Lanes: 0 0 1! 0 0 Initial Vol: 0 9 0 Signal=Uncontrol/Rights=Include
Street Name: Blair Peterson Approach: North Bound South Bound East Bound West Bound Movement: L - T - R L - T - R L - T - R L - T - R ------------|---------------||---------------||---------------||---------------| Volume Module: >> Count Date: 16 Mar 2010 << 4:00-5:00PM Base Vol: 0 9 0 0 148 0 0 0 0 3 0 0 Growth Adj: 1.04 1.04 1.04 1.04 1.04 1.04 1.04 1.04 1.04 1.04 1.04 1.04 Initial Bse: 0 9 0 0 154 0 0 0 0 3 0 0 Added Vol: 0 0 0 0 0 0 0 0 0 0 0 0 Related Pro: 0 0 0 0 0 0 0 0 0 0 0 0 Initial Fut: 0 9 0 0 154 0 0 0 0 3 0 0 User Adj: 1.00 1.00 1.00 1.00 1.00 1.00 1.00 1.00 1.00 1.00 1.00 1.00 PHF Adj: 0.66 0.66 0.66 0.66 0.66 0.66 0.66 0.66 0.66 0.66 0.66 0.66 PHF Volume: 0 14 0 0 235 0 0 0 0 5 0 0 Reduct Vol: 0 0 0 0 0 0 0 0 0 0 0 0 FinalVolume: 0 14 0 0 235 0 0 0 0 5 0 0 ------------|---------------||---------------||---------------||---------------| Critical Gap Module: Critical Gp:xxxxx xxxx xxxxx xxxxx xxxx xxxxx 7.1 6.5 6.2 6.4 xxxx xxxxx FollowUpTim:xxxxx xxxx xxxxx xxxxx xxxx xxxxx 3.5 4.0 3.3 3.5 xxxx xxxxx ------------|---------------||---------------||---------------||---------------| Capacity Module: Cnflict Vol: xxxx xxxx xxxxx xxxx xxxx xxxxx 249 249 235 249 xxxx xxxxx Potent Cap.: xxxx xxxx xxxxx xxxx xxxx xxxxx 709 657 809 744 xxxx xxxxx Move Cap.: xxxx xxxx xxxxx xxxx xxxx xxxxx 709 657 809 744 xxxx xxxxx Volume/Cap: xxxx xxxx xxxx xxxx xxxx xxxx 0.00 0.00 0.00 0.01 xxxx xxxx ------------|---------------||---------------||---------------||---------------| Level Of Service Module: 2Way95thQ: xxxx xxxx xxxxx xxxx xxxx xxxxx xxxx xxxx xxxxx 0.0 xxxx xxxxx Control Del:xxxxx xxxx xxxxx xxxxx xxxx xxxxx xxxxx xxxx xxxxx 9.9 xxxx xxxxx LOS by Move: * * * * * * * * * A * * Movement: LT - LTR - RT LT - LTR - RT LT - LTR - RT LT - LTR - RT Shared Cap.: xxxx xxxx xxxxx xxxx xxxx xxxxx xxxx 0 xxxxx xxxx xxxx xxxxx SharedQueue:xxxxx xxxx xxxxx xxxxx xxxx xxxxx xxxxx xxxx xxxxx xxxxx xxxx xxxxx Shrd ConDel:xxxxx xxxx xxxxx xxxxx xxxx xxxxx xxxxx xxxx xxxxx xxxxx xxxx xxxxx Shared LOS: * * * * * * * * * * * * ApproachDel: xxxxxx xxxxxx xxxxxx 9.9 ApproachLOS: * * * A Note: Queue reported is the number of cars per lane. Peak Hour Delay Signal Warrant Report ******************************************************************************** Intersection #3 Peterson/Blair ******************************************************************************** Future Volume Alternative: Peak Hour Warrant NOT Met
COMPARE Wed Jan 12 09:54:16 2011 Page 3-20
Traffix 7.9.0215 Copyright (c) 2008 Dowling Associates, Inc. Licensed to F & P, INLAND EMPIRE
------------|---------------||---------------||---------------||---------------| Approach: North Bound South Bound East Bound West Bound Movement: L - T - R L - T - R L - T - R L - T - R ------------|---------------||---------------||---------------||---------------| Control: Uncontrolled Uncontrolled Stop Sign Stop Sign Lanes: 0 0 1 0 0 0 0 1 0 0 0 0 1! 0 0 1 0 0 0 0 Initial Vol: 0 9 0 0 154 0 0 0 0 3 0 0 ApproachDel: xxxxxx xxxxxx xxxxxx 9.9 ------------|---------------||---------------||---------------||---------------| Approach[westbound][lanes=1][control=Stop Sign] Signal Warrant Rule #1: [vehicle-hours=0.0] FAIL - Vehicle-hours less than 4 for one lane approach. Signal Warrant Rule #2: [approach volume=3] FAIL - Approach volume less than 100 for one lane approach. Signal Warrant Rule #3: [approach count=3][total volume=166] FAIL - Total volume less than 650 for intersection with less than four approaches. -------------------------------------------------------------------------------- SIGNAL WARRANT DISCLAIMER This peak hour signal warrant analysis should be considered solely as an "indicator" of the likelihood of an unsignalized intersection warranting a traffic signal in the future. Intersections that exceed this warrant are probably more likely to meet one or more of the other volume based signal warrant (such as the 4-hour or 8-hour warrants). The peak hour warrant analysis in this report is not intended to replace a rigorous and complete traffic signal warrant analysis by the responsible jurisdiction. Consideration of the other signal warrants, which is beyond the scope of this software, may yield different results. Peak Hour Volume Signal Warrant Report [Urban] ******************************************************************************** Intersection #3 Peterson/Blair ******************************************************************************** Future Volume Alternative: Peak Hour Warrant NOT Met ------------|---------------||---------------||---------------||---------------| Approach: North Bound South Bound East Bound West Bound Movement: L - T - R L - T - R L - T - R L - T - R ------------|---------------||---------------||---------------||---------------| Control: Uncontrolled Uncontrolled Stop Sign Stop Sign Lanes: 0 0 1 0 0 0 0 1 0 0 0 0 1! 0 0 1 0 0 0 0 Initial Vol: 0 9 0 0 154 0 0 0 0 3 0 0 ------------|---------------||---------------||---------------||---------------| Major Street Volume: 163 Minor Approach Volume: 3 Minor Approach Volume Threshold: 703 -------------------------------------------------------------------------------- SIGNAL WARRANT DISCLAIMER This peak hour signal warrant analysis should be considered solely as an "indicator" of the likelihood of an unsignalized intersection warranting a traffic signal in the future. Intersections that exceed this warrant are probably more likely to meet one or more of the other volume based signal warrant (such as the 4-hour or 8-hour warrants). The peak hour warrant analysis in this report is not intended to replace a rigorous and complete traffic signal warrant analysis by the responsible jurisdiction. Consideration of the other signal warrants, which is beyond the scope of this software, may yield different results.

COMPARE Wed Jan 12 09:54:16 2011 Page 3-21
Traffix 7.9.0215 Copyright (c) 2008 Dowling Associates, Inc. Licensed to F & P, INLAND EMPIRE
Calipatria Solar Farm IE10-0037
Opening Year (PM)
Level Of Service Computation Report 2000 HCM Unsignalized (Future Volume Alternative)
2012 + P AM
Intersection #3: Peterson/Blair Signal=Uncontrol/Rights=Include Initial Vol: 0 21 0 Lanes: 0 0 1! 0 0
Signal=Stop
Signal=Stop
Initial Vol: Lanes: Rights=Include Vol Cnt Date: 3/16/2010 Rights=Include Lanes: Initial Vol: 0
0
Cycle Time (sec): 100 0
0
0
Loss Time (sec): 0 0
0 1!
Critical V/C: 0.000 1! 0
0
Avg Crit Del (sec/veh): 0.0 0
0 0 Avg Delay (sec/veh): 0.0 0 1
LOS: B
Lanes: 0 0 1! 0 0 Initial Vol: 0 221 0 Signal=Uncontrol/Rights=Include
Street Name: Blair Peterson Approach: North Bound South Bound East Bound West Bound Movement: L - T - R L - T - R L - T - R L - T - R ------------|---------------||---------------||---------------||---------------| Volume Module: >> Count Date: 16 Mar 2010 << 7:15-8:15 AM Base Vol: 0 212 0 0 18 0 0 0 0 1 0 0 Growth Adj: 1.04 1.04 1.04 1.04 1.04 1.04 1.04 1.04 1.04 1.04 1.04 1.04 Initial Bse: 0 221 0 0 19 0 0 0 0 1 0 0 Added Vol: 0 0 0 0 2 0 0 0 0 0 0 0 Related Pro: 0 0 0 0 0 0 0 0 0 0 0 0 Initial Fut: 0 221 0 0 21 0 0 0 0 1 0 0 User Adj: 1.00 1.00 1.00 1.00 1.00 1.00 1.00 1.00 1.00 1.00 1.00 1.00 PHF Adj: 0.69 0.69 0.69 0.69 0.69 0.69 0.69 0.69 0.69 0.69 0.69 0.69 PHF Volume: 0 321 0 0 30 0 0 0 0 2 0 0 Reduct Vol: 0 0 0 0 0 0 0 0 0 0 0 0 FinalVolume: 0 321 0 0 30 0 0 0 0 2 0 0 ------------|---------------||---------------||---------------||---------------| Critical Gap Module: Critical Gp:xxxxx xxxx xxxxx xxxxx xxxx xxxxx 7.1 6.5 6.2 6.4 xxxx xxxxx FollowUpTim:xxxxx xxxx xxxxx xxxxx xxxx xxxxx 3.5 4.0 3.3 3.5 xxxx xxxxx ------------|---------------||---------------||---------------||---------------| Capacity Module: Cnflict Vol: xxxx xxxx xxxxx xxxx xxxx xxxxx 351 351 30 351 xxxx xxxxx Potent Cap.: xxxx xxxx xxxxx xxxx xxxx xxxxx 608 577 1050 651 xxxx xxxxx Move Cap.: xxxx xxxx xxxxx xxxx xxxx xxxxx 608 577 1050 651 xxxx xxxxx Volume/Cap: xxxx xxxx xxxx xxxx xxxx xxxx 0.00 0.00 0.00 0.00 xxxx xxxx ------------|---------------||---------------||---------------||---------------| Level Of Service Module: 2Way95thQ: xxxx xxxx xxxxx xxxx xxxx xxxxx xxxx xxxx xxxxx 0.0 xxxx xxxxx Control Del:xxxxx xxxx xxxxx xxxxx xxxx xxxxx xxxxx xxxx xxxxx 10.5 xxxx xxxxx LOS by Move: * * * * * * * * * B * * Movement: LT - LTR - RT LT - LTR - RT LT - LTR - RT LT - LTR - RT Shared Cap.: xxxx xxxx xxxxx xxxx xxxx xxxxx xxxx 0 xxxxx xxxx xxxx xxxxx SharedQueue:xxxxx xxxx xxxxx xxxxx xxxx xxxxx xxxxx xxxx xxxxx xxxxx xxxx xxxxx Shrd ConDel:xxxxx xxxx xxxxx xxxxx xxxx xxxxx xxxxx xxxx xxxxx xxxxx xxxx xxxxx Shared LOS: * * * * * * * * * * * * ApproachDel: xxxxxx xxxxxx xxxxxx 10.5 ApproachLOS: * * * B Note: Queue reported is the number of cars per lane. Peak Hour Delay Signal Warrant Report ******************************************************************************** Intersection #3 Peterson/Blair ******************************************************************************** Future Volume Alternative: Peak Hour Warrant NOT Met
COMPARE Wed Jan 12 09:54:16 2011 Page 3-22
Traffix 7.9.0215 Copyright (c) 2008 Dowling Associates, Inc. Licensed to F & P, INLAND EMPIRE
------------|---------------||---------------||---------------||---------------| Approach: North Bound South Bound East Bound West Bound Movement: L - T - R L - T - R L - T - R L - T - R ------------|---------------||---------------||---------------||---------------| Control: Uncontrolled Uncontrolled Stop Sign Stop Sign Lanes: 0 0 1 0 0 0 0 1 0 0 0 0 1! 0 0 1 0 0 0 0 Initial Vol: 0 221 0 0 21 0 0 0 0 1 0 0 ApproachDel: xxxxxx xxxxxx xxxxxx 10.5 ------------|---------------||---------------||---------------||---------------| Approach[westbound][lanes=1][control=Stop Sign] Signal Warrant Rule #1: [vehicle-hours=0.0] FAIL - Vehicle-hours less than 4 for one lane approach. Signal Warrant Rule #2: [approach volume=1] FAIL - Approach volume less than 100 for one lane approach. Signal Warrant Rule #3: [approach count=3][total volume=242] FAIL - Total volume less than 650 for intersection with less than four approaches. -------------------------------------------------------------------------------- SIGNAL WARRANT DISCLAIMER This peak hour signal warrant analysis should be considered solely as an "indicator" of the likelihood of an unsignalized intersection warranting a traffic signal in the future. Intersections that exceed this warrant are probably more likely to meet one or more of the other volume based signal warrant (such as the 4-hour or 8-hour warrants). The peak hour warrant analysis in this report is not intended to replace a rigorous and complete traffic signal warrant analysis by the responsible jurisdiction. Consideration of the other signal warrants, which is beyond the scope of this software, may yield different results. Peak Hour Volume Signal Warrant Report [Urban] ******************************************************************************** Intersection #3 Peterson/Blair ******************************************************************************** Future Volume Alternative: Peak Hour Warrant NOT Met ------------|---------------||---------------||---------------||---------------| Approach: North Bound South Bound East Bound West Bound Movement: L - T - R L - T - R L - T - R L - T - R ------------|---------------||---------------||---------------||---------------| Control: Uncontrolled Uncontrolled Stop Sign Stop Sign Lanes: 0 0 1 0 0 0 0 1 0 0 0 0 1! 0 0 1 0 0 0 0 Initial Vol: 0 221 0 0 21 0 0 0 0 1 0 0 ------------|---------------||---------------||---------------||---------------| Major Street Volume: 241 Minor Approach Volume: 1 Minor Approach Volume Threshold: 599 -------------------------------------------------------------------------------- SIGNAL WARRANT DISCLAIMER This peak hour signal warrant analysis should be considered solely as an "indicator" of the likelihood of an unsignalized intersection warranting a traffic signal in the future. Intersections that exceed this warrant are probably more likely to meet one or more of the other volume based signal warrant (such as the 4-hour or 8-hour warrants). The peak hour warrant analysis in this report is not intended to replace a rigorous and complete traffic signal warrant analysis by the responsible jurisdiction. Consideration of the other signal warrants, which is beyond the scope of this software, may yield different results.

COMPARE Wed Jan 12 09:54:16 2011 Page 3-23
Traffix 7.9.0215 Copyright (c) 2008 Dowling Associates, Inc. Licensed to F & P, INLAND EMPIRE
Calipatria Solar Farm IE10-0037
Opening Year (PM)
Level Of Service Computation Report 2000 HCM Unsignalized (Future Volume Alternative)
2012 + P PM
Intersection #3: Peterson/Blair Signal=Uncontrol/Rights=Include Initial Vol: 0 154 0 Lanes: 0 0 1! 0 0
Signal=Stop
Signal=Stop
Initial Vol: Lanes: Rights=Include Vol Cnt Date: 3/16/2010 Rights=Include Lanes: Initial Vol: 0
0
Cycle Time (sec): 100 0
0
0
Loss Time (sec): 0 0
0 1!
Critical V/C: 0.000 1! 0
0
Avg Crit Del (sec/veh): 0.2 0
0 0 Avg Delay (sec/veh): 0.2 0 3
LOS: A
Lanes: 0 0 1! 0 0 Initial Vol: 0 11 0 Signal=Uncontrol/Rights=Include
Street Name: Blair Peterson Approach: North Bound South Bound East Bound West Bound Movement: L - T - R L - T - R L - T - R L - T - R ------------|---------------||---------------||---------------||---------------| Volume Module: >> Count Date: 16 Mar 2010 << 4:00-5:00PM Base Vol: 0 9 0 0 148 0 0 0 0 3 0 0 Growth Adj: 1.04 1.04 1.04 1.04 1.04 1.04 1.04 1.04 1.04 1.04 1.04 1.04 Initial Bse: 0 9 0 0 154 0 0 0 0 3 0 0 Added Vol: 0 2 0 0 0 0 0 0 0 0 0 0 Related Pro: 0 0 0 0 0 0 0 0 0 0 0 0 Initial Fut: 0 11 0 0 154 0 0 0 0 3 0 0 User Adj: 1.00 1.00 1.00 1.00 1.00 1.00 1.00 1.00 1.00 1.00 1.00 1.00 PHF Adj: 0.66 0.66 0.66 0.66 0.66 0.66 0.66 0.66 0.66 0.66 0.66 0.66 PHF Volume: 0 17 0 0 235 0 0 0 0 5 0 0 Reduct Vol: 0 0 0 0 0 0 0 0 0 0 0 0 FinalVolume: 0 17 0 0 235 0 0 0 0 5 0 0 ------------|---------------||---------------||---------------||---------------| Critical Gap Module: Critical Gp:xxxxx xxxx xxxxx xxxxx xxxx xxxxx 7.1 6.5 6.2 6.4 xxxx xxxxx FollowUpTim:xxxxx xxxx xxxxx xxxxx xxxx xxxxx 3.5 4.0 3.3 3.5 xxxx xxxxx ------------|---------------||---------------||---------------||---------------| Capacity Module: Cnflict Vol: xxxx xxxx xxxxx xxxx xxxx xxxxx 252 252 235 252 xxxx xxxxx Potent Cap.: xxxx xxxx xxxxx xxxx xxxx xxxxx 705 655 809 741 xxxx xxxxx Move Cap.: xxxx xxxx xxxxx xxxx xxxx xxxxx 705 655 809 741 xxxx xxxxx Volume/Cap: xxxx xxxx xxxx xxxx xxxx xxxx 0.00 0.00 0.00 0.01 xxxx xxxx ------------|---------------||---------------||---------------||---------------| Level Of Service Module: 2Way95thQ: xxxx xxxx xxxxx xxxx xxxx xxxxx xxxx xxxx xxxxx 0.0 xxxx xxxxx Control Del:xxxxx xxxx xxxxx xxxxx xxxx xxxxx xxxxx xxxx xxxxx 9.9 xxxx xxxxx LOS by Move: * * * * * * * * * A * * Movement: LT - LTR - RT LT - LTR - RT LT - LTR - RT LT - LTR - RT Shared Cap.: xxxx xxxx xxxxx xxxx xxxx xxxxx xxxx 0 xxxxx xxxx xxxx xxxxx SharedQueue:xxxxx xxxx xxxxx xxxxx xxxx xxxxx xxxxx xxxx xxxxx xxxxx xxxx xxxxx Shrd ConDel:xxxxx xxxx xxxxx xxxxx xxxx xxxxx xxxxx xxxx xxxxx xxxxx xxxx xxxxx Shared LOS: * * * * * * * * * * * * ApproachDel: xxxxxx xxxxxx xxxxxx 9.9 ApproachLOS: * * * A Note: Queue reported is the number of cars per lane. Peak Hour Delay Signal Warrant Report ******************************************************************************** Intersection #3 Peterson/Blair ******************************************************************************** Future Volume Alternative: Peak Hour Warrant NOT Met
COMPARE Wed Jan 12 09:54:16 2011 Page 3-24
Traffix 7.9.0215 Copyright (c) 2008 Dowling Associates, Inc. Licensed to F & P, INLAND EMPIRE
------------|---------------||---------------||---------------||---------------| Approach: North Bound South Bound East Bound West Bound Movement: L - T - R L - T - R L - T - R L - T - R ------------|---------------||---------------||---------------||---------------| Control: Uncontrolled Uncontrolled Stop Sign Stop Sign Lanes: 0 0 1 0 0 0 0 1 0 0 0 0 1! 0 0 1 0 0 0 0 Initial Vol: 0 11 0 0 154 0 0 0 0 3 0 0 ApproachDel: xxxxxx xxxxxx xxxxxx 9.9 ------------|---------------||---------------||---------------||---------------| Approach[westbound][lanes=1][control=Stop Sign] Signal Warrant Rule #1: [vehicle-hours=0.0] FAIL - Vehicle-hours less than 4 for one lane approach. Signal Warrant Rule #2: [approach volume=3] FAIL - Approach volume less than 100 for one lane approach. Signal Warrant Rule #3: [approach count=3][total volume=168] FAIL - Total volume less than 650 for intersection with less than four approaches. -------------------------------------------------------------------------------- SIGNAL WARRANT DISCLAIMER This peak hour signal warrant analysis should be considered solely as an "indicator" of the likelihood of an unsignalized intersection warranting a traffic signal in the future. Intersections that exceed this warrant are probably more likely to meet one or more of the other volume based signal warrant (such as the 4-hour or 8-hour warrants). The peak hour warrant analysis in this report is not intended to replace a rigorous and complete traffic signal warrant analysis by the responsible jurisdiction. Consideration of the other signal warrants, which is beyond the scope of this software, may yield different results. Peak Hour Volume Signal Warrant Report [Urban] ******************************************************************************** Intersection #3 Peterson/Blair ******************************************************************************** Future Volume Alternative: Peak Hour Warrant NOT Met ------------|---------------||---------------||---------------||---------------| Approach: North Bound South Bound East Bound West Bound Movement: L - T - R L - T - R L - T - R L - T - R ------------|---------------||---------------||---------------||---------------| Control: Uncontrolled Uncontrolled Stop Sign Stop Sign Lanes: 0 0 1 0 0 0 0 1 0 0 0 0 1! 0 0 1 0 0 0 0 Initial Vol: 0 11 0 0 154 0 0 0 0 3 0 0 ------------|---------------||---------------||---------------||---------------| Major Street Volume: 165 Minor Approach Volume: 3 Minor Approach Volume Threshold: 699 -------------------------------------------------------------------------------- SIGNAL WARRANT DISCLAIMER This peak hour signal warrant analysis should be considered solely as an "indicator" of the likelihood of an unsignalized intersection warranting a traffic signal in the future. Intersections that exceed this warrant are probably more likely to meet one or more of the other volume based signal warrant (such as the 4-hour or 8-hour warrants). The peak hour warrant analysis in this report is not intended to replace a rigorous and complete traffic signal warrant analysis by the responsible jurisdiction. Consideration of the other signal warrants, which is beyond the scope of this software, may yield different results.
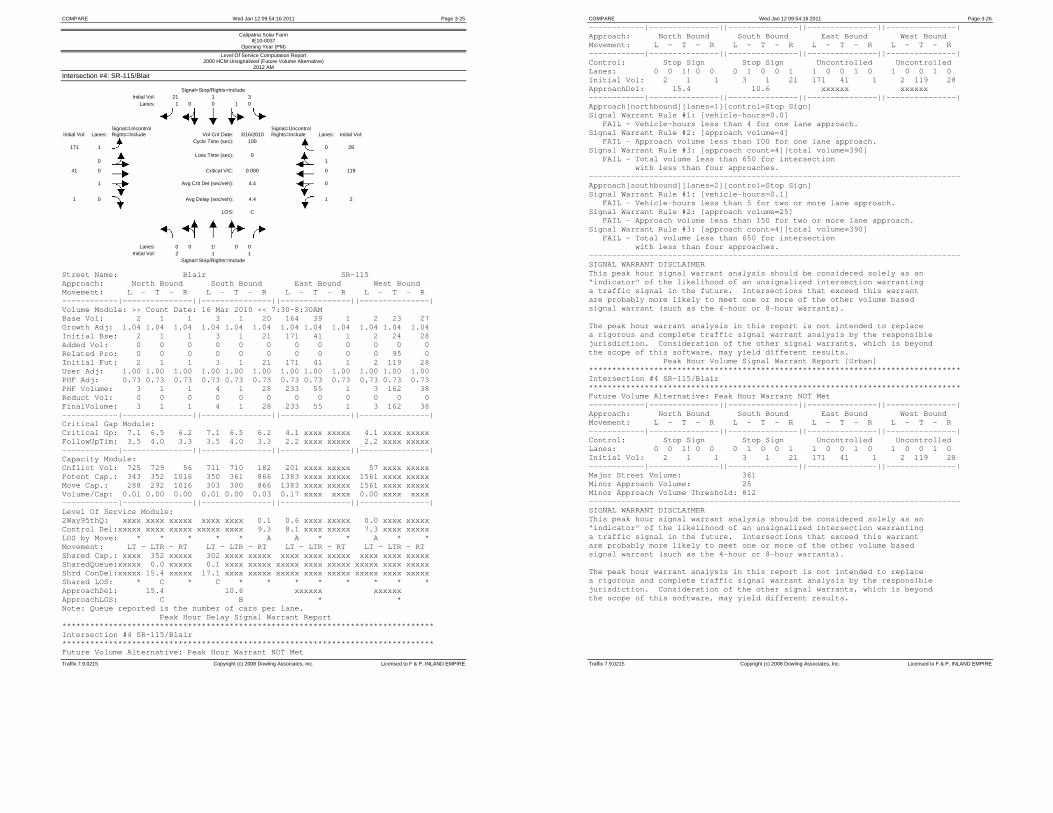
COMPARE Wed Jan 12 09:54:16 2011 Page 3-25
Traffix 7.9.0215 Copyright (c) 2008 Dowling Associates, Inc. Licensed to F & P, INLAND EMPIRE
Calipatria Solar Farm IE10-0037
Opening Year (PM)
Level Of Service Computation Report 2000 HCM Unsignalized (Future Volume Alternative)
2012 AM
Intersection #4: SR-115/Blair Signal=Stop/Rights=Include Initial Vol: 21 1 3 Lanes: 1 0 0 1 0
Signal=Uncontrol
Signal=Uncontrol
Initial Vol: Lanes: Rights=Include Vol Cnt Date: 3/16/2010 Rights=Include Lanes: Initial Vol:
171
1 Cycle Time (sec): 100
0
28
0
Loss Time (sec): 0 1
41 0
Critical V/C: 0.000 0 119
1
Avg Crit Del (sec/veh): 4.4 0
1 0 Avg Delay (sec/veh): 4.4 1 2
LOS: C
Lanes: 0 0 1! 0 0 Initial Vol: 2 1 1 Signal=Stop/Rights=Include
Street Name: Blair SR-115 Approach: North Bound South Bound East Bound West Bound Movement: L - T - R L - T - R L - T - R L - T - R ------------|---------------||---------------||---------------||---------------| Volume Module: >> Count Date: 16 Mar 2010 << 7:30-8:30AM Base Vol: 2 1 1 3 1 20 164 39 1 2 23 27 Growth Adj: 1.04 1.04 1.04 1.04 1.04 1.04 1.04 1.04 1.04 1.04 1.04 1.04 Initial Bse: 2 1 1 3 1 21 171 41 1 2 24 28 Added Vol: 0 0 0 0 0 0 0 0 0 0 0 0 Related Pro: 0 0 0 0 0 0 0 0 0 0 95 0 Initial Fut: 2 1 1 3 1 21 171 41 1 2 119 28 User Adj: 1.00 1.00 1.00 1.00 1.00 1.00 1.00 1.00 1.00 1.00 1.00 1.00 PHF Adj: 0.73 0.73 0.73 0.73 0.73 0.73 0.73 0.73 0.73 0.73 0.73 0.73 PHF Volume: 3 1 1 4 1 28 233 55 1 3 162 38 Reduct Vol: 0 0 0 0 0 0 0 0 0 0 0 0 FinalVolume: 3 1 1 4 1 28 233 55 1 3 162 38 ------------|---------------||---------------||---------------||---------------| Critical Gap Module: Critical Gp: 7.1 6.5 6.2 7.1 6.5 6.2 4.1 xxxx xxxxx 4.1 xxxx xxxxx FollowUpTim: 3.5 4.0 3.3 3.5 4.0 3.3 2.2 xxxx xxxxx 2.2 xxxx xxxxx ------------|---------------||---------------||---------------||---------------| Capacity Module: Cnflict Vol: 725 729 56 711 710 182 201 xxxx xxxxx 57 xxxx xxxxx Potent Cap.: 343 352 1016 350 361 866 1383 xxxx xxxxx 1561 xxxx xxxxx Move Cap.: 288 292 1016 303 300 866 1383 xxxx xxxxx 1561 xxxx xxxxx Volume/Cap: 0.01 0.00 0.00 0.01 0.00 0.03 0.17 xxxx xxxx 0.00 xxxx xxxx ------------|---------------||---------------||---------------||---------------| Level Of Service Module: 2Way95thQ: xxxx xxxx xxxxx xxxx xxxx 0.1 0.6 xxxx xxxxx 0.0 xxxx xxxxx Control Del:xxxxx xxxx xxxxx xxxxx xxxx 9.3 8.1 xxxx xxxxx 7.3 xxxx xxxxx LOS by Move: * * * * * A A * * A * * Movement: LT - LTR - RT LT - LTR - RT LT - LTR - RT LT - LTR - RT Shared Cap.: xxxx 352 xxxxx 302 xxxx xxxxx xxxx xxxx xxxxx xxxx xxxx xxxxx SharedQueue:xxxxx 0.0 xxxxx 0.1 xxxx xxxxx xxxxx xxxx xxxxx xxxxx xxxx xxxxx Shrd ConDel:xxxxx 15.4 xxxxx 17.1 xxxx xxxxx xxxxx xxxx xxxxx xxxxx xxxx xxxxx Shared LOS: * C * C * * * * * * * * ApproachDel: 15.4 10.6 xxxxxx xxxxxx ApproachLOS: C B * * Note: Queue reported is the number of cars per lane. Peak Hour Delay Signal Warrant Report ******************************************************************************** Intersection #4 SR-115/Blair ******************************************************************************** Future Volume Alternative: Peak Hour Warrant NOT Met
COMPARE Wed Jan 12 09:54:16 2011 Page 3-26
Traffix 7.9.0215 Copyright (c) 2008 Dowling Associates, Inc. Licensed to F & P, INLAND EMPIRE
------------|---------------||---------------||---------------||---------------| Approach: North Bound South Bound East Bound West Bound Movement: L - T - R L - T - R L - T - R L - T - R ------------|---------------||---------------||---------------||---------------| Control: Stop Sign Stop Sign Uncontrolled Uncontrolled Lanes: 0 0 1! 0 0 0 1 0 0 1 1 0 0 1 0 1 0 0 1 0 Initial Vol: 2 1 1 3 1 21 171 41 1 2 119 28 ApproachDel: 15.4 10.6 xxxxxx xxxxxx ------------|---------------||---------------||---------------||---------------| Approach[northbound][lanes=1][control=Stop Sign] Signal Warrant Rule #1: [vehicle-hours=0.0] FAIL - Vehicle-hours less than 4 for one lane approach. Signal Warrant Rule #2: [approach volume=4] FAIL - Approach volume less than 100 for one lane approach. Signal Warrant Rule #3: [approach count=4][total volume=390] FAIL - Total volume less than 650 for intersection with less than four approaches. -------------------------------------------------------------------------------- Approach[southbound][lanes=2][control=Stop Sign] Signal Warrant Rule #1: [vehicle-hours=0.1] FAIL - Vehicle-hours less than 5 for two or more lane approach. Signal Warrant Rule #2: [approach volume=25] FAIL - Approach volume less than 150 for two or more lane approach. Signal Warrant Rule #3: [approach count=4][total volume=390] FAIL - Total volume less than 650 for intersection with less than four approaches. -------------------------------------------------------------------------------- SIGNAL WARRANT DISCLAIMER This peak hour signal warrant analysis should be considered solely as an "indicator" of the likelihood of an unsignalized intersection warranting a traffic signal in the future. Intersections that exceed this warrant are probably more likely to meet one or more of the other volume based signal warrant (such as the 4-hour or 8-hour warrants). The peak hour warrant analysis in this report is not intended to replace a rigorous and complete traffic signal warrant analysis by the responsible jurisdiction. Consideration of the other signal warrants, which is beyond the scope of this software, may yield different results. Peak Hour Volume Signal Warrant Report [Urban] ******************************************************************************** Intersection #4 SR-115/Blair ******************************************************************************** Future Volume Alternative: Peak Hour Warrant NOT Met ------------|---------------||---------------||---------------||---------------| Approach: North Bound South Bound East Bound West Bound Movement: L - T - R L - T - R L - T - R L - T - R ------------|---------------||---------------||---------------||---------------| Control: Stop Sign Stop Sign Uncontrolled Uncontrolled Lanes: 0 0 1! 0 0 0 1 0 0 1 1 0 0 1 0 1 0 0 1 0 Initial Vol: 2 1 1 3 1 21 171 41 1 2 119 28 ------------|---------------||---------------||---------------||---------------| Major Street Volume: 361 Minor Approach Volume: 25 Minor Approach Volume Threshold: 812 -------------------------------------------------------------------------------- SIGNAL WARRANT DISCLAIMER This peak hour signal warrant analysis should be considered solely as an "indicator" of the likelihood of an unsignalized intersection warranting a traffic signal in the future. Intersections that exceed this warrant are probably more likely to meet one or more of the other volume based signal warrant (such as the 4-hour or 8-hour warrants). The peak hour warrant analysis in this report is not intended to replace a rigorous and complete traffic signal warrant analysis by the responsible jurisdiction. Consideration of the other signal warrants, which is beyond the scope of this software, may yield different results.

COMPARE Wed Jan 12 09:54:16 2011 Page 3-27
Traffix 7.9.0215 Copyright (c) 2008 Dowling Associates, Inc. Licensed to F & P, INLAND EMPIRE
Calipatria Solar Farm IE10-0037
Opening Year (PM)
Level Of Service Computation Report 2000 HCM Unsignalized (Future Volume Alternative)
2012 PM
Intersection #4: SR-115/Blair Signal=Stop/Rights=Include Initial Vol: 146 4 23 Lanes: 1 0 0 1 0
Signal=Uncontrol
Signal=Uncontrol
Initial Vol: Lanes: Rights=Include Vol Cnt Date: 3/16/2010 Rights=Include Lanes: Initial Vol: 7
1
Cycle Time (sec): 100 0
2
0
Loss Time (sec): 0 1
125 0
Critical V/C: 0.000 0 52
1
Avg Crit Del (sec/veh): 4.9 0
2 0 Avg Delay (sec/veh): 4.9 1 0
LOS: B
Lanes: 0 0 1! 0 0 Initial Vol: 0 1 1 Signal=Stop/Rights=Include
Street Name: Blair SR-115 Approach: North Bound South Bound East Bound West Bound Movement: L - T - R L - T - R L - T - R L - T - R ------------|---------------||---------------||---------------||---------------| Volume Module: >> Count Date: 16 Mar 2010 << 4:00-5:00PM Base Vol: 0 1 1 22 4 140 7 29 2 0 50 2 Growth Adj: 1.04 1.04 1.04 1.04 1.04 1.04 1.04 1.04 1.04 1.04 1.04 1.04 Initial Bse: 0 1 1 23 4 146 7 30 2 0 52 2 Added Vol: 0 0 0 0 0 0 0 0 0 0 0 0 Related Pro: 0 0 0 0 0 0 0 95 0 0 0 0 Initial Fut: 0 1 1 23 4 146 7 125 2 0 52 2 User Adj: 1.00 1.00 1.00 1.00 1.00 1.00 1.00 1.00 1.00 1.00 1.00 1.00 PHF Adj: 0.68 0.68 0.68 0.68 0.68 0.68 0.68 0.68 0.68 0.68 0.68 0.68 PHF Volume: 0 2 2 34 6 215 11 184 3 0 77 3 Reduct Vol: 0 0 0 0 0 0 0 0 0 0 0 0 FinalVolume: 0 2 2 34 6 215 11 184 3 0 77 3 ------------|---------------||---------------||---------------||---------------| Critical Gap Module: Critical Gp:xxxxx 6.5 6.2 7.1 6.5 6.2 4.1 xxxx xxxxx xxxxx xxxx xxxxx FollowUpTim:xxxxx 4.0 3.3 3.5 4.0 3.3 2.2 xxxx xxxxx xxxxx xxxx xxxxx ------------|---------------||---------------||---------------||---------------| Capacity Module: Cnflict Vol: xxxx 287 186 287 287 78 80 xxxx xxxxx xxxx xxxx xxxxx Potent Cap.: xxxx 626 861 669 626 988 1531 xxxx xxxxx xxxx xxxx xxxxx Move Cap.: xxxx 622 861 663 622 988 1531 xxxx xxxxx xxxx xxxx xxxxx Volume/Cap: xxxx 0.00 0.00 0.05 0.01 0.22 0.01 xxxx xxxx xxxx xxxx xxxx ------------|---------------||---------------||---------------||---------------| Level Of Service Module: 2Way95thQ: xxxx xxxx xxxxx xxxx xxxx 0.8 0.0 xxxx xxxxx xxxx xxxx xxxxx Control Del:xxxxx xxxx xxxxx xxxxx xxxx 9.7 7.4 xxxx xxxxx xxxxx xxxx xxxxx LOS by Move: * * * * * A A * * * * * Movement: LT - LTR - RT LT - LTR - RT LT - LTR - RT LT - LTR - RT Shared Cap.: xxxx xxxx 722 656 xxxx xxxxx xxxx xxxx xxxxx xxxx xxxx xxxxx SharedQueue:xxxxx xxxx 0.0 0.2 xxxx xxxxx xxxxx xxxx xxxxx xxxxx xxxx xxxxx Shrd ConDel:xxxxx xxxx 10.0 10.8 xxxx xxxxx xxxxx xxxx xxxxx xxxxx xxxx xxxxx Shared LOS: * * B B * * * * * * * * ApproachDel: 10.0 9.8 xxxxxx xxxxxx ApproachLOS: B A * * Note: Queue reported is the number of cars per lane. Peak Hour Delay Signal Warrant Report ******************************************************************************** Intersection #4 SR-115/Blair ******************************************************************************** Future Volume Alternative: Peak Hour Warrant NOT Met
COMPARE Wed Jan 12 09:54:16 2011 Page 3-28
Traffix 7.9.0215 Copyright (c) 2008 Dowling Associates, Inc. Licensed to F & P, INLAND EMPIRE
------------|---------------||---------------||---------------||---------------| Approach: North Bound South Bound East Bound West Bound Movement: L - T - R L - T - R L - T - R L - T - R ------------|---------------||---------------||---------------||---------------| Control: Stop Sign Stop Sign Uncontrolled Uncontrolled Lanes: 0 0 0 1 0 0 1 0 0 1 1 0 0 1 0 1 0 0 1 0 Initial Vol: 0 1 1 23 4 146 7 125 2 0 52 2 ApproachDel: 10.0 9.8 xxxxxx xxxxxx ------------|---------------||---------------||---------------||---------------| Approach[northbound][lanes=1][control=Stop Sign] Signal Warrant Rule #1: [vehicle-hours=0.0] FAIL - Vehicle-hours less than 4 for one lane approach. Signal Warrant Rule #2: [approach volume=2] FAIL - Approach volume less than 100 for one lane approach. Signal Warrant Rule #3: [approach count=4][total volume=363] FAIL - Total volume less than 650 for intersection with less than four approaches. -------------------------------------------------------------------------------- Approach[southbound][lanes=2][control=Stop Sign] Signal Warrant Rule #1: [vehicle-hours=0.5] FAIL - Vehicle-hours less than 5 for two or more lane approach. Signal Warrant Rule #2: [approach volume=173] SUCCEED - Approach volume >= 150 for two or more lane approach. Signal Warrant Rule #3: [approach count=4][total volume=363] FAIL - Total volume less than 650 for intersection with less than four approaches. -------------------------------------------------------------------------------- SIGNAL WARRANT DISCLAIMER This peak hour signal warrant analysis should be considered solely as an "indicator" of the likelihood of an unsignalized intersection warranting a traffic signal in the future. Intersections that exceed this warrant are probably more likely to meet one or more of the other volume based signal warrant (such as the 4-hour or 8-hour warrants). The peak hour warrant analysis in this report is not intended to replace a rigorous and complete traffic signal warrant analysis by the responsible jurisdiction. Consideration of the other signal warrants, which is beyond the scope of this software, may yield different results. Peak Hour Volume Signal Warrant Report [Urban] ******************************************************************************** Intersection #4 SR-115/Blair ******************************************************************************** Future Volume Alternative: Peak Hour Warrant NOT Met ------------|---------------||---------------||---------------||---------------| Approach: North Bound South Bound East Bound West Bound Movement: L - T - R L - T - R L - T - R L - T - R ------------|---------------||---------------||---------------||---------------| Control: Stop Sign Stop Sign Uncontrolled Uncontrolled Lanes: 0 0 0 1 0 0 1 0 0 1 1 0 0 1 0 1 0 0 1 0 Initial Vol: 0 1 1 23 4 146 7 125 2 0 52 2 ------------|---------------||---------------||---------------||---------------| Major Street Volume: 189 Minor Approach Volume: 173 Minor Approach Volume Threshold: 1091 -------------------------------------------------------------------------------- SIGNAL WARRANT DISCLAIMER This peak hour signal warrant analysis should be considered solely as an "indicator" of the likelihood of an unsignalized intersection warranting a traffic signal in the future. Intersections that exceed this warrant are probably more likely to meet one or more of the other volume based signal warrant (such as the 4-hour or 8-hour warrants). The peak hour warrant analysis in this report is not intended to replace a rigorous and complete traffic signal warrant analysis by the responsible jurisdiction. Consideration of the other signal warrants, which is beyond the scope of this software, may yield different results.
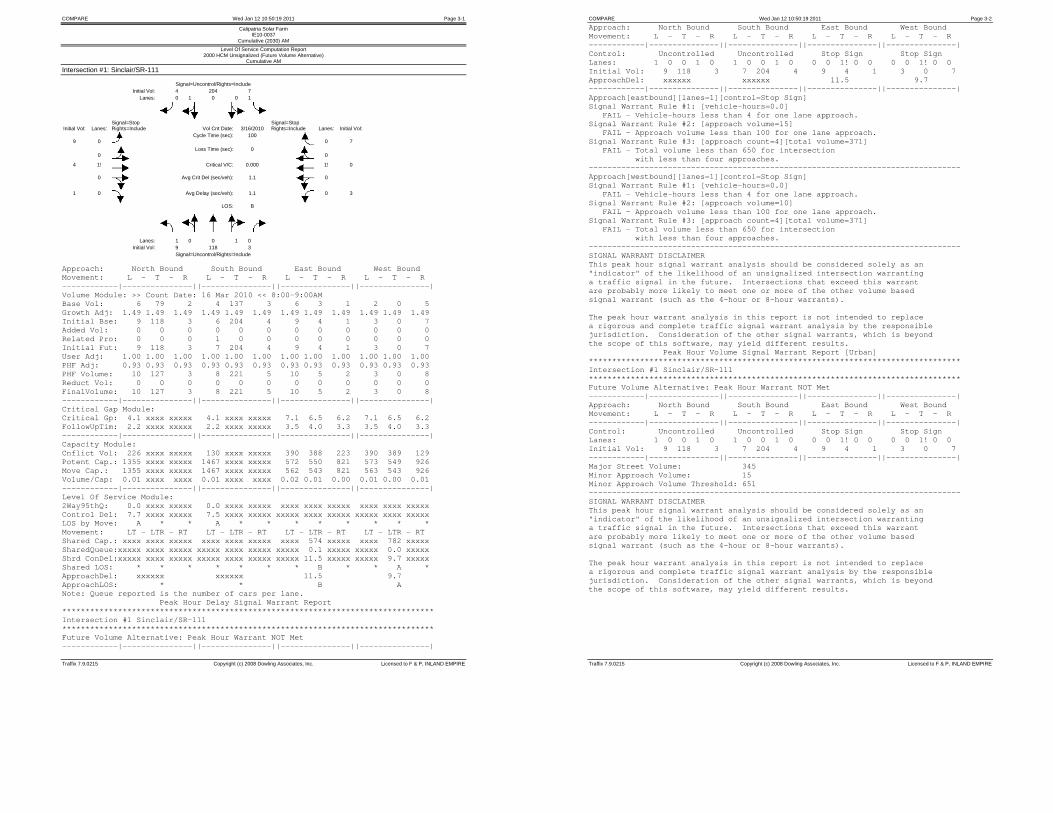
COMPARE Wed Jan 12 10:50:19 2011 Page 3-1
Traffix 7.9.0215 Copyright (c) 2008 Dowling Associates, Inc. Licensed to F & P, INLAND EMPIRE
Calipatria Solar Farm IE10-0037
Cumulative (2030) AM
Level Of Service Computation Report 2000 HCM Unsignalized (Future Volume Alternative)
Cumulative AM
Intersection #1: Sinclair/SR-111 Signal=Uncontrol/Rights=Include Initial Vol: 4 204 7 Lanes: 0 1 0 0 1
Signal=Stop
Signal=Stop
Initial Vol: Lanes: Rights=Include Vol Cnt Date: 3/16/2010 Rights=Include Lanes: Initial Vol: 9
0
Cycle Time (sec): 100 0
7
0
Loss Time (sec): 0 0
4 1!
Critical V/C: 0.000 1! 0
0
Avg Crit Del (sec/veh): 1.1 0
1 0
Avg Delay (sec/veh): 1.1 0 3
LOS: B
Lanes: 1 0 0 1 0 Initial Vol: 9 118 3 Signal=Uncontrol/Rights=Include
Approach: North Bound South Bound East Bound West Bound Movement: L - T - R L - T - R L - T - R L - T - R ------------|---------------||---------------||---------------||---------------| Volume Module: >> Count Date: 16 Mar 2010 << 8:00-9:00AM Base Vol: 6 79 2 4 137 3 6 3 1 2 0 5 Growth Adj: 1.49 1.49 1.49 1.49 1.49 1.49 1.49 1.49 1.49 1.49 1.49 1.49 Initial Bse: 9 118 3 6 204 4 9 4 1 3 0 7 Added Vol: 0 0 0 0 0 0 0 0 0 0 0 0 Related Pro: 0 0 0 1 0 0 0 0 0 0 0 0 Initial Fut: 9 118 3 7 204 4 9 4 1 3 0 7 User Adj: 1.00 1.00 1.00 1.00 1.00 1.00 1.00 1.00 1.00 1.00 1.00 1.00 PHF Adj: 0.93 0.93 0.93 0.93 0.93 0.93 0.93 0.93 0.93 0.93 0.93 0.93 PHF Volume: 10 127 3 8 221 5 10 5 2 3 0 8 Reduct Vol: 0 0 0 0 0 0 0 0 0 0 0 0 FinalVolume: 10 127 3 8 221 5 10 5 2 3 0 8 ------------|---------------||---------------||---------------||---------------| Critical Gap Module: Critical Gp: 4.1 xxxx xxxxx 4.1 xxxx xxxxx 7.1 6.5 6.2 7.1 6.5 6.2 FollowUpTim: 2.2 xxxx xxxxx 2.2 xxxx xxxxx 3.5 4.0 3.3 3.5 4.0 3.3 ------------|---------------||---------------||---------------||---------------| Capacity Module: Cnflict Vol: 226 xxxx xxxxx 130 xxxx xxxxx 390 388 223 390 389 129 Potent Cap.: 1355 xxxx xxxxx 1467 xxxx xxxxx 572 550 821 573 549 926 Move Cap.: 1355 xxxx xxxxx 1467 xxxx xxxxx 562 543 821 563 543 926 Volume/Cap: 0.01 xxxx xxxx 0.01 xxxx xxxx 0.02 0.01 0.00 0.01 0.00 0.01 ------------|---------------||---------------||---------------||---------------| Level Of Service Module: 2Way95thQ: 0.0 xxxx xxxxx 0.0 xxxx xxxxx xxxx xxxx xxxxx xxxx xxxx xxxxx Control Del: 7.7 xxxx xxxxx 7.5 xxxx xxxxx xxxxx xxxx xxxxx xxxxx xxxx xxxxx LOS by Move: A * * A * * * * * * * * Movement: LT - LTR - RT LT - LTR - RT LT - LTR - RT LT - LTR - RT Shared Cap.: xxxx xxxx xxxxx xxxx xxxx xxxxx xxxx 574 xxxxx xxxx 782 xxxxx SharedQueue:xxxxx xxxx xxxxx xxxxx xxxx xxxxx xxxxx 0.1 xxxxx xxxxx 0.0 xxxxx Shrd ConDel:xxxxx xxxx xxxxx xxxxx xxxx xxxxx xxxxx 11.5 xxxxx xxxxx 9.7 xxxxx Shared LOS: * * * * * * * B * * A * ApproachDel: xxxxxx xxxxxx 11.5 9.7 ApproachLOS: * * B A Note: Queue reported is the number of cars per lane. Peak Hour Delay Signal Warrant Report ******************************************************************************** Intersection #1 Sinclair/SR-111 ******************************************************************************** Future Volume Alternative: Peak Hour Warrant NOT Met ------------|---------------||---------------||---------------||---------------|
COMPARE Wed Jan 12 10:50:19 2011 Page 3-2
Traffix 7.9.0215 Copyright (c) 2008 Dowling Associates, Inc. Licensed to F & P, INLAND EMPIRE
Approach: North Bound South Bound East Bound West Bound Movement: L - T - R L - T - R L - T - R L - T - R ------------|---------------||---------------||---------------||---------------| Control: Uncontrolled Uncontrolled Stop Sign Stop Sign Lanes: 1 0 0 1 0 1 0 0 1 0 0 0 1! 0 0 0 0 1! 0 0 Initial Vol: 9 118 3 7 204 4 9 4 1 3 0 7 ApproachDel: xxxxxx xxxxxx 11.5 9.7 ------------|---------------||---------------||---------------||---------------| Approach[eastbound][lanes=1][control=Stop Sign] Signal Warrant Rule #1: [vehicle-hours=0.0] FAIL - Vehicle-hours less than 4 for one lane approach. Signal Warrant Rule #2: [approach volume=15] FAIL - Approach volume less than 100 for one lane approach. Signal Warrant Rule #3: [approach count=4][total volume=371] FAIL - Total volume less than 650 for intersection with less than four approaches. -------------------------------------------------------------------------------- Approach[westbound][lanes=1][control=Stop Sign] Signal Warrant Rule #1: [vehicle-hours=0.0] FAIL - Vehicle-hours less than 4 for one lane approach. Signal Warrant Rule #2: [approach volume=10] FAIL - Approach volume less than 100 for one lane approach. Signal Warrant Rule #3: [approach count=4][total volume=371] FAIL - Total volume less than 650 for intersection with less than four approaches. -------------------------------------------------------------------------------- SIGNAL WARRANT DISCLAIMER This peak hour signal warrant analysis should be considered solely as an "indicator" of the likelihood of an unsignalized intersection warranting a traffic signal in the future. Intersections that exceed this warrant are probably more likely to meet one or more of the other volume based signal warrant (such as the 4-hour or 8-hour warrants). The peak hour warrant analysis in this report is not intended to replace a rigorous and complete traffic signal warrant analysis by the responsible jurisdiction. Consideration of the other signal warrants, which is beyond the scope of this software, may yield different results. Peak Hour Volume Signal Warrant Report [Urban] ******************************************************************************** Intersection #1 Sinclair/SR-111 ******************************************************************************** Future Volume Alternative: Peak Hour Warrant NOT Met ------------|---------------||---------------||---------------||---------------| Approach: North Bound South Bound East Bound West Bound Movement: L - T - R L - T - R L - T - R L - T - R ------------|---------------||---------------||---------------||---------------| Control: Uncontrolled Uncontrolled Stop Sign Stop Sign Lanes: 1 0 0 1 0 1 0 0 1 0 0 0 1! 0 0 0 0 1! 0 0 Initial Vol: 9 118 3 7 204 4 9 4 1 3 0 7 ------------|---------------||---------------||---------------||---------------| Major Street Volume: 345 Minor Approach Volume: 15 Minor Approach Volume Threshold: 651 -------------------------------------------------------------------------------- SIGNAL WARRANT DISCLAIMER This peak hour signal warrant analysis should be considered solely as an "indicator" of the likelihood of an unsignalized intersection warranting a traffic signal in the future. Intersections that exceed this warrant are probably more likely to meet one or more of the other volume based signal warrant (such as the 4-hour or 8-hour warrants). The peak hour warrant analysis in this report is not intended to replace a rigorous and complete traffic signal warrant analysis by the responsible jurisdiction. Consideration of the other signal warrants, which is beyond the scope of this software, may yield different results.

COMPARE Wed Jan 12 10:50:19 2011 Page 3-3
Traffix 7.9.0215 Copyright (c) 2008 Dowling Associates, Inc. Licensed to F & P, INLAND EMPIRE
Calipatria Solar Farm IE10-0037
Cumulative (2030) AM
Level Of Service Computation Report 2000 HCM Unsignalized (Future Volume Alternative)
Cumulative PM
Intersection #1: Sinclair/SR-111 Signal=Uncontrol/Rights=Include Initial Vol: 6 145 3 Lanes: 0 1 0 0 1
Signal=Stop
Signal=Stop
Initial Vol: Lanes: Rights=Include Vol Cnt Date: 3/18/2010 Rights=Include Lanes: Initial Vol: 9
0
Cycle Time (sec): 100 0
14
0
Loss Time (sec): 0 0
4 1!
Critical V/C: 0.000 1! 3
0
Avg Crit Del (sec/veh): 1.0 0
1 0 Avg Delay (sec/veh): 1.0 0 1
LOS: B
Lanes: 1 0 0 1 0 Initial Vol: 3 219 0 Signal=Uncontrol/Rights=Include
Approach: North Bound South Bound East Bound West Bound Movement: L - T - R L - T - R L - T - R L - T - R ------------|---------------||---------------||---------------||---------------| Volume Module: >> Count Date: 18 Mar 2010 << 4:00-5:00 PM Base Vol: 2 147 0 2 97 4 6 3 1 1 2 9 Growth Adj: 1.49 1.49 1.49 1.49 1.49 1.49 1.49 1.49 1.49 1.49 1.49 1.49 Initial Bse: 3 219 0 3 145 6 9 4 1 1 3 13 Added Vol: 0 0 0 0 0 0 0 0 0 0 0 0 Related Pro: 0 0 0 0 0 0 0 0 0 0 0 1 Initial Fut: 3 219 0 3 145 6 9 4 1 1 3 14 User Adj: 1.00 1.00 1.00 1.00 1.00 1.00 1.00 1.00 1.00 1.00 1.00 1.00 PHF Adj: 0.95 0.95 0.95 0.95 0.95 0.95 0.95 0.95 0.95 0.95 0.95 0.95 PHF Volume: 3 230 0 3 152 6 9 5 2 2 3 15 Reduct Vol: 0 0 0 0 0 0 0 0 0 0 0 0 FinalVolume: 3 230 0 3 152 6 9 5 2 2 3 15 ------------|---------------||---------------||---------------||---------------| Critical Gap Module: Critical Gp: 4.1 xxxx xxxxx 4.1 xxxx xxxxx 7.1 6.5 6.2 7.1 6.5 6.2 FollowUpTim: 2.2 xxxx xxxxx 2.2 xxxx xxxxx 3.5 4.0 3.3 3.5 4.0 3.3 ------------|---------------||---------------||---------------||---------------| Capacity Module: Cnflict Vol: 158 xxxx xxxxx 230 xxxx xxxxx 407 398 155 401 401 230 Potent Cap.: 1434 xxxx xxxxx 1349 xxxx xxxxx 558 543 896 563 541 814 Move Cap.: 1434 xxxx xxxxx 1349 xxxx xxxxx 543 540 896 557 538 814 Volume/Cap: 0.00 xxxx xxxx 0.00 xxxx xxxx 0.02 0.01 0.00 0.00 0.01 0.02 ------------|---------------||---------------||---------------||---------------| Level Of Service Module: 2Way95thQ: 0.0 xxxx xxxxx 0.0 xxxx xxxxx xxxx xxxx xxxxx xxxx xxxx xxxxx Control Del: 7.5 xxxx xxxxx 7.7 xxxx xxxxx xxxxx xxxx xxxxx xxxxx xxxx xxxxx LOS by Move: A * * A * * * * * * * * Movement: LT - LTR - RT LT - LTR - RT LT - LTR - RT LT - LTR - RT Shared Cap.: xxxx xxxx xxxxx xxxx xxxx xxxxx xxxx 565 xxxxx xxxx 728 xxxxx SharedQueue:xxxxx xxxx xxxxx xxxxx xxxx xxxxx xxxxx 0.1 xxxxx xxxxx 0.1 xxxxx Shrd ConDel:xxxxx xxxx xxxxx xxxxx xxxx xxxxx xxxxx 11.6 xxxxx xxxxx 10.1 xxxxx Shared LOS: * * * * * * * B * * B * ApproachDel: xxxxxx xxxxxx 11.6 10.1 ApproachLOS: * * B B Note: Queue reported is the number of cars per lane. Peak Hour Delay Signal Warrant Report ******************************************************************************** Intersection #1 Sinclair/SR-111 ******************************************************************************** Future Volume Alternative: Peak Hour Warrant NOT Met ------------|---------------||---------------||---------------||---------------|
COMPARE Wed Jan 12 10:50:19 2011 Page 3-4
Traffix 7.9.0215 Copyright (c) 2008 Dowling Associates, Inc. Licensed to F & P, INLAND EMPIRE
Approach: North Bound South Bound East Bound West Bound Movement: L - T - R L - T - R L - T - R L - T - R ------------|---------------||---------------||---------------||---------------| Control: Uncontrolled Uncontrolled Stop Sign Stop Sign Lanes: 1 0 0 1 0 1 0 0 1 0 0 0 1! 0 0 0 0 1! 0 0 Initial Vol: 3 219 0 3 145 6 9 4 1 1 3 14 ApproachDel: xxxxxx xxxxxx 11.6 10.1 ------------|---------------||---------------||---------------||---------------| Approach[eastbound][lanes=1][control=Stop Sign] Signal Warrant Rule #1: [vehicle-hours=0.0] FAIL - Vehicle-hours less than 4 for one lane approach. Signal Warrant Rule #2: [approach volume=15] FAIL - Approach volume less than 100 for one lane approach. Signal Warrant Rule #3: [approach count=4][total volume=409] FAIL - Total volume less than 650 for intersection with less than four approaches. -------------------------------------------------------------------------------- Approach[westbound][lanes=1][control=Stop Sign] Signal Warrant Rule #1: [vehicle-hours=0.1] FAIL - Vehicle-hours less than 4 for one lane approach. Signal Warrant Rule #2: [approach volume=19] FAIL - Approach volume less than 100 for one lane approach. Signal Warrant Rule #3: [approach count=4][total volume=409] FAIL - Total volume less than 650 for intersection with less than four approaches. -------------------------------------------------------------------------------- SIGNAL WARRANT DISCLAIMER This peak hour signal warrant analysis should be considered solely as an "indicator" of the likelihood of an unsignalized intersection warranting a traffic signal in the future. Intersections that exceed this warrant are probably more likely to meet one or more of the other volume based signal warrant (such as the 4-hour or 8-hour warrants). The peak hour warrant analysis in this report is not intended to replace a rigorous and complete traffic signal warrant analysis by the responsible jurisdiction. Consideration of the other signal warrants, which is beyond the scope of this software, may yield different results. Peak Hour Volume Signal Warrant Report [Urban] ******************************************************************************** Intersection #1 Sinclair/SR-111 ******************************************************************************** Future Volume Alternative: Peak Hour Warrant NOT Met ------------|---------------||---------------||---------------||---------------| Approach: North Bound South Bound East Bound West Bound Movement: L - T - R L - T - R L - T - R L - T - R ------------|---------------||---------------||---------------||---------------| Control: Uncontrolled Uncontrolled Stop Sign Stop Sign Lanes: 1 0 0 1 0 1 0 0 1 0 0 0 1! 0 0 0 0 1! 0 0 Initial Vol: 3 219 0 3 145 6 9 4 1 1 3 14 ------------|---------------||---------------||---------------||---------------| Major Street Volume: 375 Minor Approach Volume: 19 Minor Approach Volume Threshold: 622 -------------------------------------------------------------------------------- SIGNAL WARRANT DISCLAIMER This peak hour signal warrant analysis should be considered solely as an "indicator" of the likelihood of an unsignalized intersection warranting a traffic signal in the future. Intersections that exceed this warrant are probably more likely to meet one or more of the other volume based signal warrant (such as the 4-hour or 8-hour warrants). The peak hour warrant analysis in this report is not intended to replace a rigorous and complete traffic signal warrant analysis by the responsible jurisdiction. Consideration of the other signal warrants, which is beyond the scope of this software, may yield different results.

COMPARE Wed Jan 12 10:50:19 2011 Page 3-5
Traffix 7.9.0215 Copyright (c) 2008 Dowling Associates, Inc. Licensed to F & P, INLAND EMPIRE
Calipatria Solar Farm IE10-0037
Cumulative (2030) AM
Level Of Service Computation Report 2000 HCM Unsignalized (Future Volume Alternative)
C+P AM
Intersection #1: Sinclair/SR-111 Signal=Uncontrol/Rights=Include Initial Vol: 4 204 9 Lanes: 0 1 0 0 1
Signal=Stop
Signal=Stop
Initial Vol: Lanes: Rights=Include Vol Cnt Date: 3/16/2010 Rights=Include Lanes: Initial Vol: 9
0
Cycle Time (sec): 100 0
7
0
Loss Time (sec): 0 0
4 1!
Critical V/C: 0.000 1! 0
0
Avg Crit Del (sec/veh): 1.1 0
1 0 Avg Delay (sec/veh): 1.1 0 3
LOS: B
Lanes: 1 0 0 1 0 Initial Vol: 9 118 3 Signal=Uncontrol/Rights=Include
Approach: North Bound South Bound East Bound West Bound Movement: L - T - R L - T - R L - T - R L - T - R ------------|---------------||---------------||---------------||---------------| Volume Module: >> Count Date: 16 Mar 2010 << 8:00-9:00AM Base Vol: 6 79 2 4 137 3 6 3 1 2 0 5 Growth Adj: 1.49 1.49 1.49 1.49 1.49 1.49 1.49 1.49 1.49 1.49 1.49 1.49 Initial Bse: 9 118 3 6 204 4 9 4 1 3 0 7 Added Vol: 0 0 0 2 0 0 0 0 0 0 0 0 Related Pro: 0 0 0 1 0 0 0 0 0 0 0 0 Initial Fut: 9 118 3 9 204 4 9 4 1 3 0 7 User Adj: 1.00 1.00 1.00 1.00 1.00 1.00 1.00 1.00 1.00 1.00 1.00 1.00 PHF Adj: 0.93 0.93 0.93 0.93 0.93 0.93 0.93 0.93 0.93 0.93 0.93 0.93 PHF Volume: 10 127 3 10 221 5 10 5 2 3 0 8 Reduct Vol: 0 0 0 0 0 0 0 0 0 0 0 0 FinalVolume: 10 127 3 10 221 5 10 5 2 3 0 8 ------------|---------------||---------------||---------------||---------------| Critical Gap Module: Critical Gp: 4.1 xxxx xxxxx 4.1 xxxx xxxxx 7.1 6.5 6.2 7.1 6.5 6.2 FollowUpTim: 2.2 xxxx xxxxx 2.2 xxxx xxxxx 3.5 4.0 3.3 3.5 4.0 3.3 ------------|---------------||---------------||---------------||---------------| Capacity Module: Cnflict Vol: 226 xxxx xxxxx 130 xxxx xxxxx 395 392 223 394 393 129 Potent Cap.: 1355 xxxx xxxxx 1467 xxxx xxxxx 569 547 821 569 546 926 Move Cap.: 1355 xxxx xxxxx 1467 xxxx xxxxx 558 539 821 558 539 926 Volume/Cap: 0.01 xxxx xxxx 0.01 xxxx xxxx 0.02 0.01 0.00 0.01 0.00 0.01 ------------|---------------||---------------||---------------||---------------| Level Of Service Module: 2Way95thQ: 0.0 xxxx xxxxx 0.0 xxxx xxxxx xxxx xxxx xxxxx xxxx xxxx xxxxx Control Del: 7.7 xxxx xxxxx 7.5 xxxx xxxxx xxxxx xxxx xxxxx xxxxx xxxx xxxxx LOS by Move: A * * A * * * * * * * * Movement: LT - LTR - RT LT - LTR - RT LT - LTR - RT LT - LTR - RT Shared Cap.: xxxx xxxx xxxxx xxxx xxxx xxxxx xxxx 570 xxxxx xxxx 780 xxxxx SharedQueue:xxxxx xxxx xxxxx xxxxx xxxx xxxxx xxxxx 0.1 xxxxx xxxxx 0.0 xxxxx Shrd ConDel:xxxxx xxxx xxxxx xxxxx xxxx xxxxx xxxxx 11.5 xxxxx xxxxx 9.7 xxxxx Shared LOS: * * * * * * * B * * A * ApproachDel: xxxxxx xxxxxx 11.5 9.7 ApproachLOS: * * B A Note: Queue reported is the number of cars per lane. Peak Hour Delay Signal Warrant Report ******************************************************************************** Intersection #1 Sinclair/SR-111 ******************************************************************************** Future Volume Alternative: Peak Hour Warrant NOT Met ------------|---------------||---------------||---------------||---------------|
COMPARE Wed Jan 12 10:50:19 2011 Page 3-6
Traffix 7.9.0215 Copyright (c) 2008 Dowling Associates, Inc. Licensed to F & P, INLAND EMPIRE
Approach: North Bound South Bound East Bound West Bound Movement: L - T - R L - T - R L - T - R L - T - R ------------|---------------||---------------||---------------||---------------| Control: Uncontrolled Uncontrolled Stop Sign Stop Sign Lanes: 1 0 0 1 0 1 0 0 1 0 0 0 1! 0 0 0 0 1! 0 0 Initial Vol: 9 118 3 9 204 4 9 4 1 3 0 7 ApproachDel: xxxxxx xxxxxx 11.5 9.7 ------------|---------------||---------------||---------------||---------------| Approach[eastbound][lanes=1][control=Stop Sign] Signal Warrant Rule #1: [vehicle-hours=0.0] FAIL - Vehicle-hours less than 4 for one lane approach. Signal Warrant Rule #2: [approach volume=15] FAIL - Approach volume less than 100 for one lane approach. Signal Warrant Rule #3: [approach count=4][total volume=373] FAIL - Total volume less than 650 for intersection with less than four approaches. -------------------------------------------------------------------------------- Approach[westbound][lanes=1][control=Stop Sign] Signal Warrant Rule #1: [vehicle-hours=0.0] FAIL - Vehicle-hours less than 4 for one lane approach. Signal Warrant Rule #2: [approach volume=10] FAIL - Approach volume less than 100 for one lane approach. Signal Warrant Rule #3: [approach count=4][total volume=373] FAIL - Total volume less than 650 for intersection with less than four approaches. -------------------------------------------------------------------------------- SIGNAL WARRANT DISCLAIMER This peak hour signal warrant analysis should be considered solely as an "indicator" of the likelihood of an unsignalized intersection warranting a traffic signal in the future. Intersections that exceed this warrant are probably more likely to meet one or more of the other volume based signal warrant (such as the 4-hour or 8-hour warrants). The peak hour warrant analysis in this report is not intended to replace a rigorous and complete traffic signal warrant analysis by the responsible jurisdiction. Consideration of the other signal warrants, which is beyond the scope of this software, may yield different results. Peak Hour Volume Signal Warrant Report [Urban] ******************************************************************************** Intersection #1 Sinclair/SR-111 ******************************************************************************** Future Volume Alternative: Peak Hour Warrant NOT Met ------------|---------------||---------------||---------------||---------------| Approach: North Bound South Bound East Bound West Bound Movement: L - T - R L - T - R L - T - R L - T - R ------------|---------------||---------------||---------------||---------------| Control: Uncontrolled Uncontrolled Stop Sign Stop Sign Lanes: 1 0 0 1 0 1 0 0 1 0 0 0 1! 0 0 0 0 1! 0 0 Initial Vol: 9 118 3 9 204 4 9 4 1 3 0 7 ------------|---------------||---------------||---------------||---------------| Major Street Volume: 347 Minor Approach Volume: 15 Minor Approach Volume Threshold: 649 -------------------------------------------------------------------------------- SIGNAL WARRANT DISCLAIMER This peak hour signal warrant analysis should be considered solely as an "indicator" of the likelihood of an unsignalized intersection warranting a traffic signal in the future. Intersections that exceed this warrant are probably more likely to meet one or more of the other volume based signal warrant (such as the 4-hour or 8-hour warrants). The peak hour warrant analysis in this report is not intended to replace a rigorous and complete traffic signal warrant analysis by the responsible jurisdiction. Consideration of the other signal warrants, which is beyond the scope of this software, may yield different results.
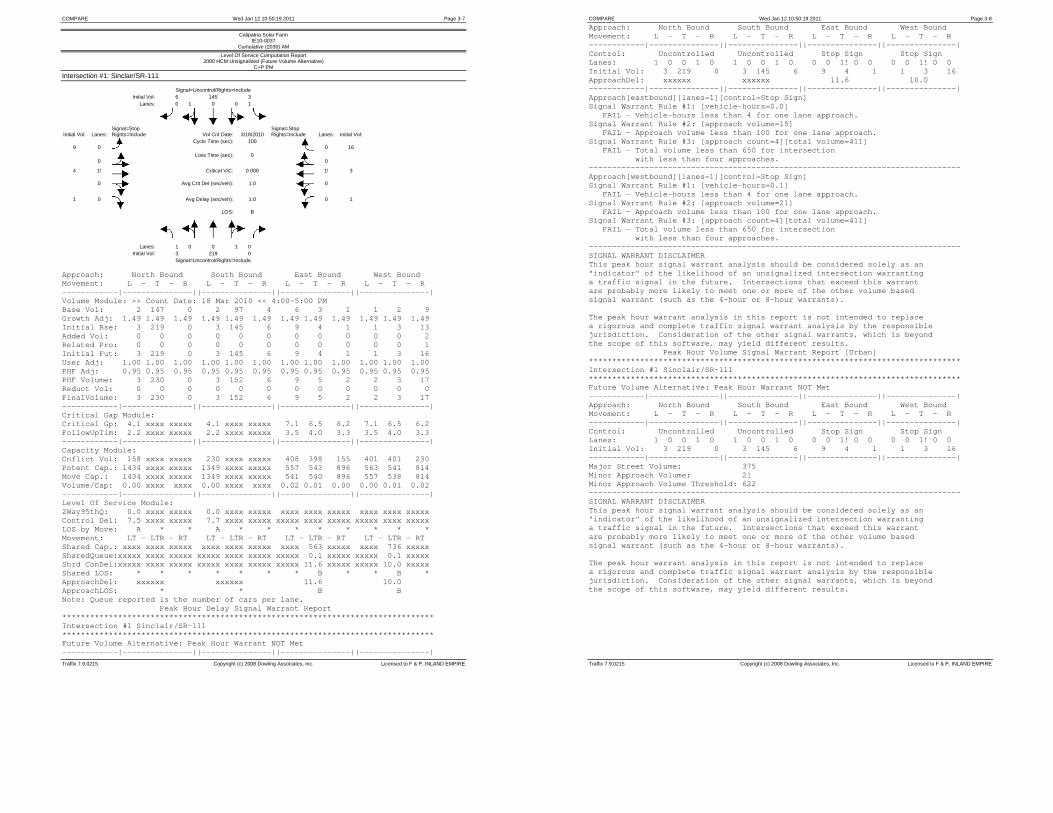
COMPARE Wed Jan 12 10:50:19 2011 Page 3-7
Traffix 7.9.0215 Copyright (c) 2008 Dowling Associates, Inc. Licensed to F & P, INLAND EMPIRE
Calipatria Solar Farm IE10-0037
Cumulative (2030) AM
Level Of Service Computation Report 2000 HCM Unsignalized (Future Volume Alternative)
C+P PM
Intersection #1: Sinclair/SR-111 Signal=Uncontrol/Rights=Include Initial Vol: 6 145 3 Lanes: 0 1 0 0 1
Signal=Stop
Signal=Stop
Initial Vol: Lanes: Rights=Include Vol Cnt Date: 3/18/2010 Rights=Include Lanes: Initial Vol: 9
0
Cycle Time (sec): 100 0
16
0
Loss Time (sec): 0 0
4 1!
Critical V/C: 0.000 1! 3
0
Avg Crit Del (sec/veh): 1.0 0
1 0 Avg Delay (sec/veh): 1.0 0 1
LOS: B
Lanes: 1 0 0 1 0 Initial Vol: 3 219 0 Signal=Uncontrol/Rights=Include
Approach: North Bound South Bound East Bound West Bound Movement: L - T - R L - T - R L - T - R L - T - R ------------|---------------||---------------||---------------||---------------| Volume Module: >> Count Date: 18 Mar 2010 << 4:00-5:00 PM Base Vol: 2 147 0 2 97 4 6 3 1 1 2 9 Growth Adj: 1.49 1.49 1.49 1.49 1.49 1.49 1.49 1.49 1.49 1.49 1.49 1.49 Initial Bse: 3 219 0 3 145 6 9 4 1 1 3 13 Added Vol: 0 0 0 0 0 0 0 0 0 0 0 2 Related Pro: 0 0 0 0 0 0 0 0 0 0 0 1 Initial Fut: 3 219 0 3 145 6 9 4 1 1 3 16 User Adj: 1.00 1.00 1.00 1.00 1.00 1.00 1.00 1.00 1.00 1.00 1.00 1.00 PHF Adj: 0.95 0.95 0.95 0.95 0.95 0.95 0.95 0.95 0.95 0.95 0.95 0.95 PHF Volume: 3 230 0 3 152 6 9 5 2 2 3 17 Reduct Vol: 0 0 0 0 0 0 0 0 0 0 0 0 FinalVolume: 3 230 0 3 152 6 9 5 2 2 3 17 ------------|---------------||---------------||---------------||---------------| Critical Gap Module: Critical Gp: 4.1 xxxx xxxxx 4.1 xxxx xxxxx 7.1 6.5 6.2 7.1 6.5 6.2 FollowUpTim: 2.2 xxxx xxxxx 2.2 xxxx xxxxx 3.5 4.0 3.3 3.5 4.0 3.3 ------------|---------------||---------------||---------------||---------------| Capacity Module: Cnflict Vol: 158 xxxx xxxxx 230 xxxx xxxxx 408 398 155 401 401 230 Potent Cap.: 1434 xxxx xxxxx 1349 xxxx xxxxx 557 543 896 563 541 814 Move Cap.: 1434 xxxx xxxxx 1349 xxxx xxxxx 541 540 896 557 538 814 Volume/Cap: 0.00 xxxx xxxx 0.00 xxxx xxxx 0.02 0.01 0.00 0.00 0.01 0.02 ------------|---------------||---------------||---------------||---------------| Level Of Service Module: 2Way95thQ: 0.0 xxxx xxxxx 0.0 xxxx xxxxx xxxx xxxx xxxxx xxxx xxxx xxxxx Control Del: 7.5 xxxx xxxxx 7.7 xxxx xxxxx xxxxx xxxx xxxxx xxxxx xxxx xxxxx LOS by Move: A * * A * * * * * * * * Movement: LT - LTR - RT LT - LTR - RT LT - LTR - RT LT - LTR - RT Shared Cap.: xxxx xxxx xxxxx xxxx xxxx xxxxx xxxx 563 xxxxx xxxx 736 xxxxx SharedQueue:xxxxx xxxx xxxxx xxxxx xxxx xxxxx xxxxx 0.1 xxxxx xxxxx 0.1 xxxxx Shrd ConDel:xxxxx xxxx xxxxx xxxxx xxxx xxxxx xxxxx 11.6 xxxxx xxxxx 10.0 xxxxx Shared LOS: * * * * * * * B * * B * ApproachDel: xxxxxx xxxxxx 11.6 10.0 ApproachLOS: * * B B Note: Queue reported is the number of cars per lane. Peak Hour Delay Signal Warrant Report ******************************************************************************** Intersection #1 Sinclair/SR-111 ******************************************************************************** Future Volume Alternative: Peak Hour Warrant NOT Met ------------|---------------||---------------||---------------||---------------|
COMPARE Wed Jan 12 10:50:19 2011 Page 3-8
Traffix 7.9.0215 Copyright (c) 2008 Dowling Associates, Inc. Licensed to F & P, INLAND EMPIRE
Approach: North Bound South Bound East Bound West Bound Movement: L - T - R L - T - R L - T - R L - T - R ------------|---------------||---------------||---------------||---------------| Control: Uncontrolled Uncontrolled Stop Sign Stop Sign Lanes: 1 0 0 1 0 1 0 0 1 0 0 0 1! 0 0 0 0 1! 0 0 Initial Vol: 3 219 0 3 145 6 9 4 1 1 3 16 ApproachDel: xxxxxx xxxxxx 11.6 10.0 ------------|---------------||---------------||---------------||---------------| Approach[eastbound][lanes=1][control=Stop Sign] Signal Warrant Rule #1: [vehicle-hours=0.0] FAIL - Vehicle-hours less than 4 for one lane approach. Signal Warrant Rule #2: [approach volume=15] FAIL - Approach volume less than 100 for one lane approach. Signal Warrant Rule #3: [approach count=4][total volume=411] FAIL - Total volume less than 650 for intersection with less than four approaches. -------------------------------------------------------------------------------- Approach[westbound][lanes=1][control=Stop Sign] Signal Warrant Rule #1: [vehicle-hours=0.1] FAIL - Vehicle-hours less than 4 for one lane approach. Signal Warrant Rule #2: [approach volume=21] FAIL - Approach volume less than 100 for one lane approach. Signal Warrant Rule #3: [approach count=4][total volume=411] FAIL - Total volume less than 650 for intersection with less than four approaches. -------------------------------------------------------------------------------- SIGNAL WARRANT DISCLAIMER This peak hour signal warrant analysis should be considered solely as an "indicator" of the likelihood of an unsignalized intersection warranting a traffic signal in the future. Intersections that exceed this warrant are probably more likely to meet one or more of the other volume based signal warrant (such as the 4-hour or 8-hour warrants). The peak hour warrant analysis in this report is not intended to replace a rigorous and complete traffic signal warrant analysis by the responsible jurisdiction. Consideration of the other signal warrants, which is beyond the scope of this software, may yield different results. Peak Hour Volume Signal Warrant Report [Urban] ******************************************************************************** Intersection #1 Sinclair/SR-111 ******************************************************************************** Future Volume Alternative: Peak Hour Warrant NOT Met ------------|---------------||---------------||---------------||---------------| Approach: North Bound South Bound East Bound West Bound Movement: L - T - R L - T - R L - T - R L - T - R ------------|---------------||---------------||---------------||---------------| Control: Uncontrolled Uncontrolled Stop Sign Stop Sign Lanes: 1 0 0 1 0 1 0 0 1 0 0 0 1! 0 0 0 0 1! 0 0 Initial Vol: 3 219 0 3 145 6 9 4 1 1 3 16 ------------|---------------||---------------||---------------||---------------| Major Street Volume: 375 Minor Approach Volume: 21 Minor Approach Volume Threshold: 622 -------------------------------------------------------------------------------- SIGNAL WARRANT DISCLAIMER This peak hour signal warrant analysis should be considered solely as an "indicator" of the likelihood of an unsignalized intersection warranting a traffic signal in the future. Intersections that exceed this warrant are probably more likely to meet one or more of the other volume based signal warrant (such as the 4-hour or 8-hour warrants). The peak hour warrant analysis in this report is not intended to replace a rigorous and complete traffic signal warrant analysis by the responsible jurisdiction. Consideration of the other signal warrants, which is beyond the scope of this software, may yield different results.
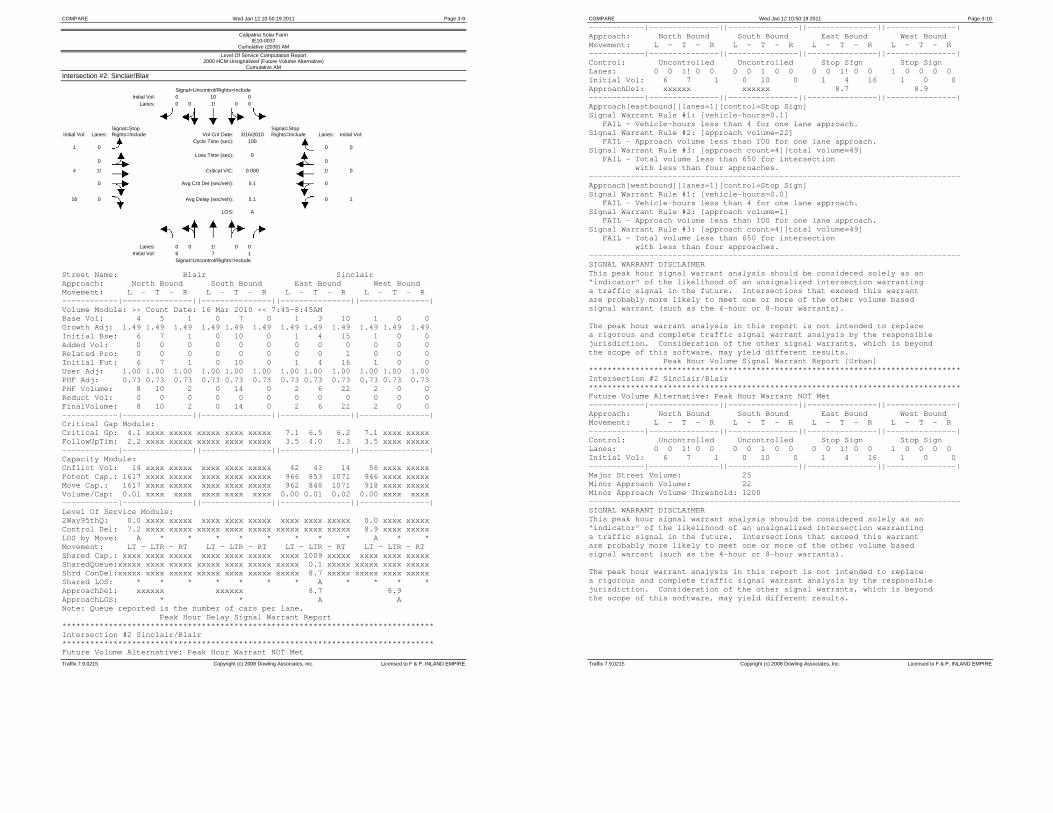
COMPARE Wed Jan 12 10:50:19 2011 Page 3-9
Traffix 7.9.0215 Copyright (c) 2008 Dowling Associates, Inc. Licensed to F & P, INLAND EMPIRE
Calipatria Solar Farm IE10-0037
Cumulative (2030) AM
Level Of Service Computation Report 2000 HCM Unsignalized (Future Volume Alternative)
Cumulative AM
Intersection #2: Sinclair/Blair Signal=Uncontrol/Rights=Include Initial Vol: 0 10 0 Lanes: 0 0 1! 0 0
Signal=Stop
Signal=Stop
Initial Vol: Lanes: Rights=Include Vol Cnt Date: 3/16/2010 Rights=Include Lanes: Initial Vol: 1
0
Cycle Time (sec): 100 0
0
0
Loss Time (sec): 0 0
4 1!
Critical V/C: 0.000 1! 0
0
Avg Crit Del (sec/veh): 5.1 0
16 0 Avg Delay (sec/veh): 5.1 0 1
LOS: A
Lanes: 0 0 1! 0 0 Initial Vol: 6 7 1 Signal=Uncontrol/Rights=Include
Street Name: Blair Sinclair Approach: North Bound South Bound East Bound West Bound Movement: L - T - R L - T - R L - T - R L - T - R ------------|---------------||---------------||---------------||---------------| Volume Module: >> Count Date: 16 Mar 2010 << 7:45-8:45AM Base Vol: 4 5 1 0 7 0 1 3 10 1 0 0 Growth Adj: 1.49 1.49 1.49 1.49 1.49 1.49 1.49 1.49 1.49 1.49 1.49 1.49 Initial Bse: 6 7 1 0 10 0 1 4 15 1 0 0 Added Vol: 0 0 0 0 0 0 0 0 0 0 0 0 Related Pro: 0 0 0 0 0 0 0 0 1 0 0 0 Initial Fut: 6 7 1 0 10 0 1 4 16 1 0 0 User Adj: 1.00 1.00 1.00 1.00 1.00 1.00 1.00 1.00 1.00 1.00 1.00 1.00 PHF Adj: 0.73 0.73 0.73 0.73 0.73 0.73 0.73 0.73 0.73 0.73 0.73 0.73 PHF Volume: 8 10 2 0 14 0 2 6 22 2 0 0 Reduct Vol: 0 0 0 0 0 0 0 0 0 0 0 0 FinalVolume: 8 10 2 0 14 0 2 6 22 2 0 0 ------------|---------------||---------------||---------------||---------------| Critical Gap Module: Critical Gp: 4.1 xxxx xxxxx xxxxx xxxx xxxxx 7.1 6.5 6.2 7.1 xxxx xxxxx FollowUpTim: 2.2 xxxx xxxxx xxxxx xxxx xxxxx 3.5 4.0 3.3 3.5 xxxx xxxxx ------------|---------------||---------------||---------------||---------------| Capacity Module: Cnflict Vol: 14 xxxx xxxxx xxxx xxxx xxxxx 42 43 14 56 xxxx xxxxx Potent Cap.: 1617 xxxx xxxxx xxxx xxxx xxxxx 966 853 1071 946 xxxx xxxxx Move Cap.: 1617 xxxx xxxxx xxxx xxxx xxxxx 962 848 1071 918 xxxx xxxxx Volume/Cap: 0.01 xxxx xxxx xxxx xxxx xxxx 0.00 0.01 0.02 0.00 xxxx xxxx ------------|---------------||---------------||---------------||---------------| Level Of Service Module: 2Way95thQ: 0.0 xxxx xxxxx xxxx xxxx xxxxx xxxx xxxx xxxxx 0.0 xxxx xxxxx Control Del: 7.2 xxxx xxxxx xxxxx xxxx xxxxx xxxxx xxxx xxxxx 8.9 xxxx xxxxx LOS by Move: A * * * * * * * * A * * Movement: LT - LTR - RT LT - LTR - RT LT - LTR - RT LT - LTR - RT Shared Cap.: xxxx xxxx xxxxx xxxx xxxx xxxxx xxxx 1009 xxxxx xxxx xxxx xxxxx SharedQueue:xxxxx xxxx xxxxx xxxxx xxxx xxxxx xxxxx 0.1 xxxxx xxxxx xxxx xxxxx Shrd ConDel:xxxxx xxxx xxxxx xxxxx xxxx xxxxx xxxxx 8.7 xxxxx xxxxx xxxx xxxxx Shared LOS: * * * * * * * A * * * * ApproachDel: xxxxxx xxxxxx 8.7 8.9 ApproachLOS: * * A A Note: Queue reported is the number of cars per lane. Peak Hour Delay Signal Warrant Report ******************************************************************************** Intersection #2 Sinclair/Blair ******************************************************************************** Future Volume Alternative: Peak Hour Warrant NOT Met
COMPARE Wed Jan 12 10:50:19 2011 Page 3-10
Traffix 7.9.0215 Copyright (c) 2008 Dowling Associates, Inc. Licensed to F & P, INLAND EMPIRE
------------|---------------||---------------||---------------||---------------| Approach: North Bound South Bound East Bound West Bound Movement: L - T - R L - T - R L - T - R L - T - R ------------|---------------||---------------||---------------||---------------| Control: Uncontrolled Uncontrolled Stop Sign Stop Sign Lanes: 0 0 1! 0 0 0 0 1 0 0 0 0 1! 0 0 1 0 0 0 0 Initial Vol: 6 7 1 0 10 0 1 4 16 1 0 0 ApproachDel: xxxxxx xxxxxx 8.7 8.9 ------------|---------------||---------------||---------------||---------------| Approach[eastbound][lanes=1][control=Stop Sign] Signal Warrant Rule #1: [vehicle-hours=0.1] FAIL - Vehicle-hours less than 4 for one lane approach. Signal Warrant Rule #2: [approach volume=22] FAIL - Approach volume less than 100 for one lane approach. Signal Warrant Rule #3: [approach count=4][total volume=49] FAIL - Total volume less than 650 for intersection with less than four approaches. -------------------------------------------------------------------------------- Approach[westbound][lanes=1][control=Stop Sign] Signal Warrant Rule #1: [vehicle-hours=0.0] FAIL - Vehicle-hours less than 4 for one lane approach. Signal Warrant Rule #2: [approach volume=1] FAIL - Approach volume less than 100 for one lane approach. Signal Warrant Rule #3: [approach count=4][total volume=49] FAIL - Total volume less than 650 for intersection with less than four approaches. -------------------------------------------------------------------------------- SIGNAL WARRANT DISCLAIMER This peak hour signal warrant analysis should be considered solely as an "indicator" of the likelihood of an unsignalized intersection warranting a traffic signal in the future. Intersections that exceed this warrant are probably more likely to meet one or more of the other volume based signal warrant (such as the 4-hour or 8-hour warrants). The peak hour warrant analysis in this report is not intended to replace a rigorous and complete traffic signal warrant analysis by the responsible jurisdiction. Consideration of the other signal warrants, which is beyond the scope of this software, may yield different results. Peak Hour Volume Signal Warrant Report [Urban] ******************************************************************************** Intersection #2 Sinclair/Blair ******************************************************************************** Future Volume Alternative: Peak Hour Warrant NOT Met ------------|---------------||---------------||---------------||---------------| Approach: North Bound South Bound East Bound West Bound Movement: L - T - R L - T - R L - T - R L - T - R ------------|---------------||---------------||---------------||---------------| Control: Uncontrolled Uncontrolled Stop Sign Stop Sign Lanes: 0 0 1! 0 0 0 0 1 0 0 0 0 1! 0 0 1 0 0 0 0 Initial Vol: 6 7 1 0 10 0 1 4 16 1 0 0 ------------|---------------||---------------||---------------||---------------| Major Street Volume: 25 Minor Approach Volume: 22 Minor Approach Volume Threshold: 1200 -------------------------------------------------------------------------------- SIGNAL WARRANT DISCLAIMER This peak hour signal warrant analysis should be considered solely as an "indicator" of the likelihood of an unsignalized intersection warranting a traffic signal in the future. Intersections that exceed this warrant are probably more likely to meet one or more of the other volume based signal warrant (such as the 4-hour or 8-hour warrants). The peak hour warrant analysis in this report is not intended to replace a rigorous and complete traffic signal warrant analysis by the responsible jurisdiction. Consideration of the other signal warrants, which is beyond the scope of this software, may yield different results.
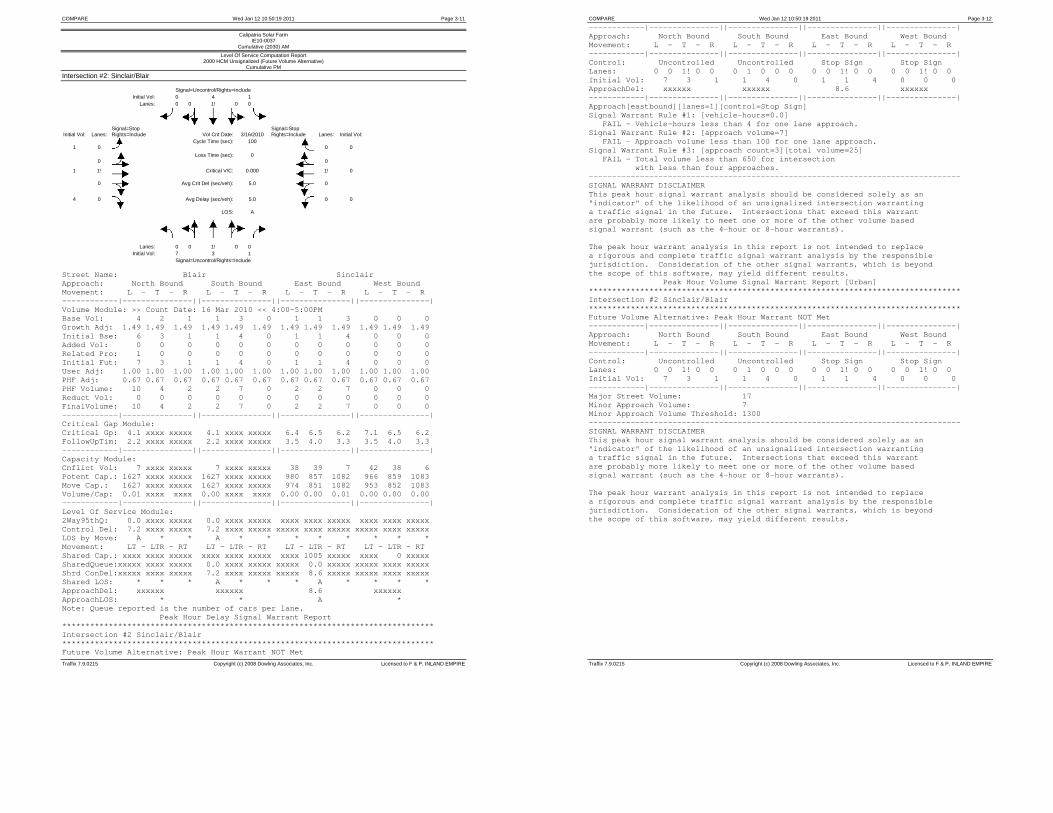
COMPARE Wed Jan 12 10:50:19 2011 Page 3-11
Traffix 7.9.0215 Copyright (c) 2008 Dowling Associates, Inc. Licensed to F & P, INLAND EMPIRE
Calipatria Solar Farm IE10-0037
Cumulative (2030) AM
Level Of Service Computation Report 2000 HCM Unsignalized (Future Volume Alternative)
Cumulative PM
Intersection #2: Sinclair/Blair Signal=Uncontrol/Rights=Include Initial Vol: 0 4 1 Lanes: 0 0 1! 0 0
Signal=Stop
Signal=Stop
Initial Vol: Lanes: Rights=Include Vol Cnt Date: 3/16/2010 Rights=Include Lanes: Initial Vol: 1
0
Cycle Time (sec): 100 0
0
0
Loss Time (sec): 0 0
1 1!
Critical V/C: 0.000 1! 0
0
Avg Crit Del (sec/veh): 5.0 0
4 0 Avg Delay (sec/veh): 5.0 0 0
LOS: A
Lanes: 0 0 1! 0 0 Initial Vol: 7 3 1 Signal=Uncontrol/Rights=Include
Street Name: Blair Sinclair Approach: North Bound South Bound East Bound West Bound Movement: L - T - R L - T - R L - T - R L - T - R ------------|---------------||---------------||---------------||---------------| Volume Module: >> Count Date: 16 Mar 2010 << 4:00-5:00PM Base Vol: 4 2 1 1 3 0 1 1 3 0 0 0 Growth Adj: 1.49 1.49 1.49 1.49 1.49 1.49 1.49 1.49 1.49 1.49 1.49 1.49 Initial Bse: 6 3 1 1 4 0 1 1 4 0 0 0 Added Vol: 0 0 0 0 0 0 0 0 0 0 0 0 Related Pro: 1 0 0 0 0 0 0 0 0 0 0 0 Initial Fut: 7 3 1 1 4 0 1 1 4 0 0 0 User Adj: 1.00 1.00 1.00 1.00 1.00 1.00 1.00 1.00 1.00 1.00 1.00 1.00 PHF Adj: 0.67 0.67 0.67 0.67 0.67 0.67 0.67 0.67 0.67 0.67 0.67 0.67 PHF Volume: 10 4 2 2 7 0 2 2 7 0 0 0 Reduct Vol: 0 0 0 0 0 0 0 0 0 0 0 0 FinalVolume: 10 4 2 2 7 0 2 2 7 0 0 0 ------------|---------------||---------------||---------------||---------------| Critical Gap Module: Critical Gp: 4.1 xxxx xxxxx 4.1 xxxx xxxxx 6.4 6.5 6.2 7.1 6.5 6.2 FollowUpTim: 2.2 xxxx xxxxx 2.2 xxxx xxxxx 3.5 4.0 3.3 3.5 4.0 3.3 ------------|---------------||---------------||---------------||---------------| Capacity Module: Cnflict Vol: 7 xxxx xxxxx 7 xxxx xxxxx 38 39 7 42 38 6 Potent Cap.: 1627 xxxx xxxxx 1627 xxxx xxxxx 980 857 1082 966 859 1083 Move Cap.: 1627 xxxx xxxxx 1627 xxxx xxxxx 974 851 1082 953 852 1083 Volume/Cap: 0.01 xxxx xxxx 0.00 xxxx xxxx 0.00 0.00 0.01 0.00 0.00 0.00 ------------|---------------||---------------||---------------||---------------| Level Of Service Module: 2Way95thQ: 0.0 xxxx xxxxx 0.0 xxxx xxxxx xxxx xxxx xxxxx xxxx xxxx xxxxx Control Del: 7.2 xxxx xxxxx 7.2 xxxx xxxxx xxxxx xxxx xxxxx xxxxx xxxx xxxxx LOS by Move: A * * A * * * * * * * * Movement: LT - LTR - RT LT - LTR - RT LT - LTR - RT LT - LTR - RT Shared Cap.: xxxx xxxx xxxxx xxxx xxxx xxxxx xxxx 1005 xxxxx xxxx 0 xxxxx SharedQueue:xxxxx xxxx xxxxx 0.0 xxxx xxxxx xxxxx 0.0 xxxxx xxxxx xxxx xxxxx Shrd ConDel:xxxxx xxxx xxxxx 7.2 xxxx xxxxx xxxxx 8.6 xxxxx xxxxx xxxx xxxxx Shared LOS: * * * A * * * A * * * * ApproachDel: xxxxxx xxxxxx 8.6 xxxxxx ApproachLOS: * * A * Note: Queue reported is the number of cars per lane. Peak Hour Delay Signal Warrant Report ******************************************************************************** Intersection #2 Sinclair/Blair ******************************************************************************** Future Volume Alternative: Peak Hour Warrant NOT Met
COMPARE Wed Jan 12 10:50:19 2011 Page 3-12
Traffix 7.9.0215 Copyright (c) 2008 Dowling Associates, Inc. Licensed to F & P, INLAND EMPIRE
------------|---------------||---------------||---------------||---------------| Approach: North Bound South Bound East Bound West Bound Movement: L - T - R L - T - R L - T - R L - T - R ------------|---------------||---------------||---------------||---------------| Control: Uncontrolled Uncontrolled Stop Sign Stop Sign Lanes: 0 0 1! 0 0 0 1 0 0 0 0 0 1! 0 0 0 0 1! 0 0 Initial Vol: 7 3 1 1 4 0 1 1 4 0 0 0 ApproachDel: xxxxxx xxxxxx 8.6 xxxxxx ------------|---------------||---------------||---------------||---------------| Approach[eastbound][lanes=1][control=Stop Sign] Signal Warrant Rule #1: [vehicle-hours=0.0] FAIL - Vehicle-hours less than 4 for one lane approach. Signal Warrant Rule #2: [approach volume=7] FAIL - Approach volume less than 100 for one lane approach. Signal Warrant Rule #3: [approach count=3][total volume=25] FAIL - Total volume less than 650 for intersection with less than four approaches. -------------------------------------------------------------------------------- SIGNAL WARRANT DISCLAIMER This peak hour signal warrant analysis should be considered solely as an "indicator" of the likelihood of an unsignalized intersection warranting a traffic signal in the future. Intersections that exceed this warrant are probably more likely to meet one or more of the other volume based signal warrant (such as the 4-hour or 8-hour warrants). The peak hour warrant analysis in this report is not intended to replace a rigorous and complete traffic signal warrant analysis by the responsible jurisdiction. Consideration of the other signal warrants, which is beyond the scope of this software, may yield different results. Peak Hour Volume Signal Warrant Report [Urban] ******************************************************************************** Intersection #2 Sinclair/Blair ******************************************************************************** Future Volume Alternative: Peak Hour Warrant NOT Met ------------|---------------||---------------||---------------||---------------| Approach: North Bound South Bound East Bound West Bound Movement: L - T - R L - T - R L - T - R L - T - R ------------|---------------||---------------||---------------||---------------| Control: Uncontrolled Uncontrolled Stop Sign Stop Sign Lanes: 0 0 1! 0 0 0 1 0 0 0 0 0 1! 0 0 0 0 1! 0 0 Initial Vol: 7 3 1 1 4 0 1 1 4 0 0 0 ------------|---------------||---------------||---------------||---------------| Major Street Volume: 17 Minor Approach Volume: 7 Minor Approach Volume Threshold: 1300 -------------------------------------------------------------------------------- SIGNAL WARRANT DISCLAIMER This peak hour signal warrant analysis should be considered solely as an "indicator" of the likelihood of an unsignalized intersection warranting a traffic signal in the future. Intersections that exceed this warrant are probably more likely to meet one or more of the other volume based signal warrant (such as the 4-hour or 8-hour warrants). The peak hour warrant analysis in this report is not intended to replace a rigorous and complete traffic signal warrant analysis by the responsible jurisdiction. Consideration of the other signal warrants, which is beyond the scope of this software, may yield different results.

COMPARE Wed Jan 12 10:50:19 2011 Page 3-13
Traffix 7.9.0215 Copyright (c) 2008 Dowling Associates, Inc. Licensed to F & P, INLAND EMPIRE
Calipatria Solar Farm IE10-0037
Cumulative (2030) AM
Level Of Service Computation Report 2000 HCM Unsignalized (Future Volume Alternative)
C+P AM
Intersection #2: Sinclair/Blair Signal=Uncontrol/Rights=Include Initial Vol: 0 10 0 Lanes: 0 0 1! 0 0
Signal=Stop
Signal=Stop
Initial Vol: Lanes: Rights=Include Vol Cnt Date: 3/16/2010 Rights=Include Lanes: Initial Vol: 1
0
Cycle Time (sec): 100 0
0
0
Loss Time (sec): 0 0
4 1!
Critical V/C: 0.000 1! 0
0
Avg Crit Del (sec/veh): 5.2 0
18 0 Avg Delay (sec/veh): 5.2 0 1
LOS: A
Lanes: 0 0 1! 0 0 Initial Vol: 6 7 1 Signal=Uncontrol/Rights=Include
Street Name: Blair Sinclair Approach: North Bound South Bound East Bound West Bound Movement: L - T - R L - T - R L - T - R L - T - R ------------|---------------||---------------||---------------||---------------| Volume Module: >> Count Date: 16 Mar 2010 << 7:45-8:45AM Base Vol: 4 5 1 0 7 0 1 3 10 1 0 0 Growth Adj: 1.49 1.49 1.49 1.49 1.49 1.49 1.49 1.49 1.49 1.49 1.49 1.49 Initial Bse: 6 7 1 0 10 0 1 4 15 1 0 0 Added Vol: 0 0 0 0 0 0 0 0 2 0 0 0 Related Pro: 0 0 0 0 0 0 0 0 1 0 0 0 Initial Fut: 6 7 1 0 10 0 1 4 18 1 0 0 User Adj: 1.00 1.00 1.00 1.00 1.00 1.00 1.00 1.00 1.00 1.00 1.00 1.00 PHF Adj: 0.73 0.73 0.73 0.73 0.73 0.73 0.73 0.73 0.73 0.73 0.73 0.73 PHF Volume: 8 10 2 0 14 0 2 6 25 2 0 0 Reduct Vol: 0 0 0 0 0 0 0 0 0 0 0 0 FinalVolume: 8 10 2 0 14 0 2 6 25 2 0 0 ------------|---------------||---------------||---------------||---------------| Critical Gap Module: Critical Gp: 4.1 xxxx xxxxx xxxxx xxxx xxxxx 7.1 6.5 6.2 7.1 xxxx xxxxx FollowUpTim: 2.2 xxxx xxxxx xxxxx xxxx xxxxx 3.5 4.0 3.3 3.5 xxxx xxxxx ------------|---------------||---------------||---------------||---------------| Capacity Module: Cnflict Vol: 14 xxxx xxxxx xxxx xxxx xxxxx 42 43 14 57 xxxx xxxxx Potent Cap.: 1617 xxxx xxxxx xxxx xxxx xxxxx 966 853 1071 944 xxxx xxxxx Move Cap.: 1617 xxxx xxxxx xxxx xxxx xxxxx 962 848 1071 914 xxxx xxxxx Volume/Cap: 0.01 xxxx xxxx xxxx xxxx xxxx 0.00 0.01 0.02 0.00 xxxx xxxx ------------|---------------||---------------||---------------||---------------| Level Of Service Module: 2Way95thQ: 0.0 xxxx xxxxx xxxx xxxx xxxxx xxxx xxxx xxxxx 0.0 xxxx xxxxx Control Del: 7.2 xxxx xxxxx xxxxx xxxx xxxxx xxxxx xxxx xxxxx 8.9 xxxx xxxxx LOS by Move: A * * * * * * * * A * * Movement: LT - LTR - RT LT - LTR - RT LT - LTR - RT LT - LTR - RT Shared Cap.: xxxx xxxx xxxxx xxxx xxxx xxxxx xxxx 1014 xxxxx xxxx xxxx xxxxx SharedQueue:xxxxx xxxx xxxxx xxxxx xxxx xxxxx xxxxx 0.1 xxxxx xxxxx xxxx xxxxx Shrd ConDel:xxxxx xxxx xxxxx xxxxx xxxx xxxxx xxxxx 8.7 xxxxx xxxxx xxxx xxxxx Shared LOS: * * * * * * * A * * * * ApproachDel: xxxxxx xxxxxx 8.7 8.9 ApproachLOS: * * A A Note: Queue reported is the number of cars per lane. Peak Hour Delay Signal Warrant Report ******************************************************************************** Intersection #2 Sinclair/Blair ******************************************************************************** Future Volume Alternative: Peak Hour Warrant NOT Met
COMPARE Wed Jan 12 10:50:19 2011 Page 3-14
Traffix 7.9.0215 Copyright (c) 2008 Dowling Associates, Inc. Licensed to F & P, INLAND EMPIRE
------------|---------------||---------------||---------------||---------------| Approach: North Bound South Bound East Bound West Bound Movement: L - T - R L - T - R L - T - R L - T - R ------------|---------------||---------------||---------------||---------------| Control: Uncontrolled Uncontrolled Stop Sign Stop Sign Lanes: 0 0 1! 0 0 0 0 1 0 0 0 0 1! 0 0 1 0 0 0 0 Initial Vol: 6 7 1 0 10 0 1 4 18 1 0 0 ApproachDel: xxxxxx xxxxxx 8.7 8.9 ------------|---------------||---------------||---------------||---------------| Approach[eastbound][lanes=1][control=Stop Sign] Signal Warrant Rule #1: [vehicle-hours=0.1] FAIL - Vehicle-hours less than 4 for one lane approach. Signal Warrant Rule #2: [approach volume=24] FAIL - Approach volume less than 100 for one lane approach. Signal Warrant Rule #3: [approach count=4][total volume=51] FAIL - Total volume less than 650 for intersection with less than four approaches. -------------------------------------------------------------------------------- Approach[westbound][lanes=1][control=Stop Sign] Signal Warrant Rule #1: [vehicle-hours=0.0] FAIL - Vehicle-hours less than 4 for one lane approach. Signal Warrant Rule #2: [approach volume=1] FAIL - Approach volume less than 100 for one lane approach. Signal Warrant Rule #3: [approach count=4][total volume=51] FAIL - Total volume less than 650 for intersection with less than four approaches. -------------------------------------------------------------------------------- SIGNAL WARRANT DISCLAIMER This peak hour signal warrant analysis should be considered solely as an "indicator" of the likelihood of an unsignalized intersection warranting a traffic signal in the future. Intersections that exceed this warrant are probably more likely to meet one or more of the other volume based signal warrant (such as the 4-hour or 8-hour warrants). The peak hour warrant analysis in this report is not intended to replace a rigorous and complete traffic signal warrant analysis by the responsible jurisdiction. Consideration of the other signal warrants, which is beyond the scope of this software, may yield different results. Peak Hour Volume Signal Warrant Report [Urban] ******************************************************************************** Intersection #2 Sinclair/Blair ******************************************************************************** Future Volume Alternative: Peak Hour Warrant NOT Met ------------|---------------||---------------||---------------||---------------| Approach: North Bound South Bound East Bound West Bound Movement: L - T - R L - T - R L - T - R L - T - R ------------|---------------||---------------||---------------||---------------| Control: Uncontrolled Uncontrolled Stop Sign Stop Sign Lanes: 0 0 1! 0 0 0 0 1 0 0 0 0 1! 0 0 1 0 0 0 0 Initial Vol: 6 7 1 0 10 0 1 4 18 1 0 0 ------------|---------------||---------------||---------------||---------------| Major Street Volume: 25 Minor Approach Volume: 24 Minor Approach Volume Threshold: 1200 -------------------------------------------------------------------------------- SIGNAL WARRANT DISCLAIMER This peak hour signal warrant analysis should be considered solely as an "indicator" of the likelihood of an unsignalized intersection warranting a traffic signal in the future. Intersections that exceed this warrant are probably more likely to meet one or more of the other volume based signal warrant (such as the 4-hour or 8-hour warrants). The peak hour warrant analysis in this report is not intended to replace a rigorous and complete traffic signal warrant analysis by the responsible jurisdiction. Consideration of the other signal warrants, which is beyond the scope of this software, may yield different results.
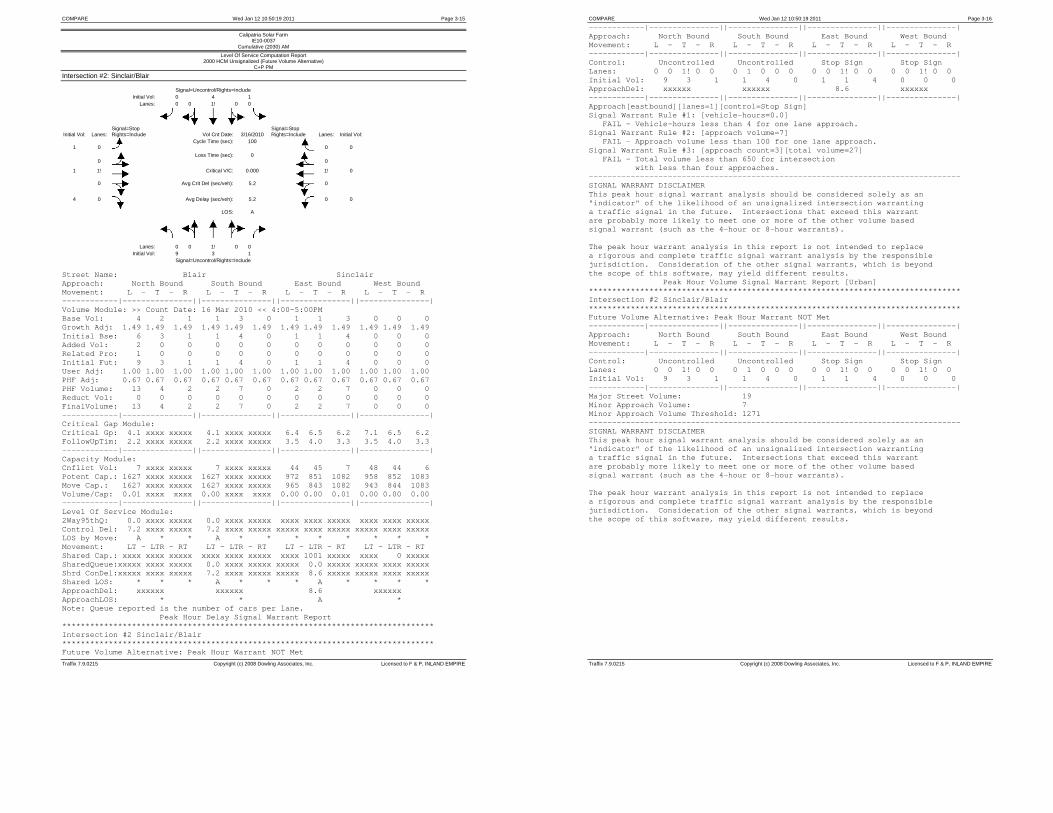
COMPARE Wed Jan 12 10:50:19 2011 Page 3-15
Traffix 7.9.0215 Copyright (c) 2008 Dowling Associates, Inc. Licensed to F & P, INLAND EMPIRE
Calipatria Solar Farm IE10-0037
Cumulative (2030) AM
Level Of Service Computation Report 2000 HCM Unsignalized (Future Volume Alternative)
C+P PM
Intersection #2: Sinclair/Blair Signal=Uncontrol/Rights=Include Initial Vol: 0 4 1 Lanes: 0 0 1! 0 0
Signal=Stop
Signal=Stop
Initial Vol: Lanes: Rights=Include Vol Cnt Date: 3/16/2010 Rights=Include Lanes: Initial Vol: 1
0
Cycle Time (sec): 100 0
0
0
Loss Time (sec): 0 0
1 1!
Critical V/C: 0.000 1! 0
0
Avg Crit Del (sec/veh): 5.2 0
4 0 Avg Delay (sec/veh): 5.2 0 0
LOS: A
Lanes: 0 0 1! 0 0 Initial Vol: 9 3 1 Signal=Uncontrol/Rights=Include
Street Name: Blair Sinclair Approach: North Bound South Bound East Bound West Bound Movement: L - T - R L - T - R L - T - R L - T - R ------------|---------------||---------------||---------------||---------------| Volume Module: >> Count Date: 16 Mar 2010 << 4:00-5:00PM Base Vol: 4 2 1 1 3 0 1 1 3 0 0 0 Growth Adj: 1.49 1.49 1.49 1.49 1.49 1.49 1.49 1.49 1.49 1.49 1.49 1.49 Initial Bse: 6 3 1 1 4 0 1 1 4 0 0 0 Added Vol: 2 0 0 0 0 0 0 0 0 0 0 0 Related Pro: 1 0 0 0 0 0 0 0 0 0 0 0 Initial Fut: 9 3 1 1 4 0 1 1 4 0 0 0 User Adj: 1.00 1.00 1.00 1.00 1.00 1.00 1.00 1.00 1.00 1.00 1.00 1.00 PHF Adj: 0.67 0.67 0.67 0.67 0.67 0.67 0.67 0.67 0.67 0.67 0.67 0.67 PHF Volume: 13 4 2 2 7 0 2 2 7 0 0 0 Reduct Vol: 0 0 0 0 0 0 0 0 0 0 0 0 FinalVolume: 13 4 2 2 7 0 2 2 7 0 0 0 ------------|---------------||---------------||---------------||---------------| Critical Gap Module: Critical Gp: 4.1 xxxx xxxxx 4.1 xxxx xxxxx 6.4 6.5 6.2 7.1 6.5 6.2 FollowUpTim: 2.2 xxxx xxxxx 2.2 xxxx xxxxx 3.5 4.0 3.3 3.5 4.0 3.3 ------------|---------------||---------------||---------------||---------------| Capacity Module: Cnflict Vol: 7 xxxx xxxxx 7 xxxx xxxxx 44 45 7 48 44 6 Potent Cap.: 1627 xxxx xxxxx 1627 xxxx xxxxx 972 851 1082 958 852 1083 Move Cap.: 1627 xxxx xxxxx 1627 xxxx xxxxx 965 843 1082 943 844 1083 Volume/Cap: 0.01 xxxx xxxx 0.00 xxxx xxxx 0.00 0.00 0.01 0.00 0.00 0.00 ------------|---------------||---------------||---------------||---------------| Level Of Service Module: 2Way95thQ: 0.0 xxxx xxxxx 0.0 xxxx xxxxx xxxx xxxx xxxxx xxxx xxxx xxxxx Control Del: 7.2 xxxx xxxxx 7.2 xxxx xxxxx xxxxx xxxx xxxxx xxxxx xxxx xxxxx LOS by Move: A * * A * * * * * * * * Movement: LT - LTR - RT LT - LTR - RT LT - LTR - RT LT - LTR - RT Shared Cap.: xxxx xxxx xxxxx xxxx xxxx xxxxx xxxx 1001 xxxxx xxxx 0 xxxxx SharedQueue:xxxxx xxxx xxxxx 0.0 xxxx xxxxx xxxxx 0.0 xxxxx xxxxx xxxx xxxxx Shrd ConDel:xxxxx xxxx xxxxx 7.2 xxxx xxxxx xxxxx 8.6 xxxxx xxxxx xxxx xxxxx Shared LOS: * * * A * * * A * * * * ApproachDel: xxxxxx xxxxxx 8.6 xxxxxx ApproachLOS: * * A * Note: Queue reported is the number of cars per lane. Peak Hour Delay Signal Warrant Report ******************************************************************************** Intersection #2 Sinclair/Blair ******************************************************************************** Future Volume Alternative: Peak Hour Warrant NOT Met
COMPARE Wed Jan 12 10:50:19 2011 Page 3-16
Traffix 7.9.0215 Copyright (c) 2008 Dowling Associates, Inc. Licensed to F & P, INLAND EMPIRE
------------|---------------||---------------||---------------||---------------| Approach: North Bound South Bound East Bound West Bound Movement: L - T - R L - T - R L - T - R L - T - R ------------|---------------||---------------||---------------||---------------| Control: Uncontrolled Uncontrolled Stop Sign Stop Sign Lanes: 0 0 1! 0 0 0 1 0 0 0 0 0 1! 0 0 0 0 1! 0 0 Initial Vol: 9 3 1 1 4 0 1 1 4 0 0 0 ApproachDel: xxxxxx xxxxxx 8.6 xxxxxx ------------|---------------||---------------||---------------||---------------| Approach[eastbound][lanes=1][control=Stop Sign] Signal Warrant Rule #1: [vehicle-hours=0.0] FAIL - Vehicle-hours less than 4 for one lane approach. Signal Warrant Rule #2: [approach volume=7] FAIL - Approach volume less than 100 for one lane approach. Signal Warrant Rule #3: [approach count=3][total volume=27] FAIL - Total volume less than 650 for intersection with less than four approaches. -------------------------------------------------------------------------------- SIGNAL WARRANT DISCLAIMER This peak hour signal warrant analysis should be considered solely as an "indicator" of the likelihood of an unsignalized intersection warranting a traffic signal in the future. Intersections that exceed this warrant are probably more likely to meet one or more of the other volume based signal warrant (such as the 4-hour or 8-hour warrants). The peak hour warrant analysis in this report is not intended to replace a rigorous and complete traffic signal warrant analysis by the responsible jurisdiction. Consideration of the other signal warrants, which is beyond the scope of this software, may yield different results. Peak Hour Volume Signal Warrant Report [Urban] ******************************************************************************** Intersection #2 Sinclair/Blair ******************************************************************************** Future Volume Alternative: Peak Hour Warrant NOT Met ------------|---------------||---------------||---------------||---------------| Approach: North Bound South Bound East Bound West Bound Movement: L - T - R L - T - R L - T - R L - T - R ------------|---------------||---------------||---------------||---------------| Control: Uncontrolled Uncontrolled Stop Sign Stop Sign Lanes: 0 0 1! 0 0 0 1 0 0 0 0 0 1! 0 0 0 0 1! 0 0 Initial Vol: 9 3 1 1 4 0 1 1 4 0 0 0 ------------|---------------||---------------||---------------||---------------| Major Street Volume: 19 Minor Approach Volume: 7 Minor Approach Volume Threshold: 1271 -------------------------------------------------------------------------------- SIGNAL WARRANT DISCLAIMER This peak hour signal warrant analysis should be considered solely as an "indicator" of the likelihood of an unsignalized intersection warranting a traffic signal in the future. Intersections that exceed this warrant are probably more likely to meet one or more of the other volume based signal warrant (such as the 4-hour or 8-hour warrants). The peak hour warrant analysis in this report is not intended to replace a rigorous and complete traffic signal warrant analysis by the responsible jurisdiction. Consideration of the other signal warrants, which is beyond the scope of this software, may yield different results.

COMPARE Wed Jan 12 10:50:19 2011 Page 3-17
Traffix 7.9.0215 Copyright (c) 2008 Dowling Associates, Inc. Licensed to F & P, INLAND EMPIRE
Calipatria Solar Farm IE10-0037
Cumulative (2030) AM
Level Of Service Computation Report 2000 HCM Unsignalized (Future Volume Alternative)
Cumulative AM
Intersection #3: Peterson/Blair Signal=Uncontrol/Rights=Include Initial Vol: 0 27 0 Lanes: 0 0 1! 0 0
Signal=Stop
Signal=Stop
Initial Vol: Lanes: Rights=Include Vol Cnt Date: n/a Rights=Include Lanes: Initial Vol: 0
0
Cycle Time (sec): 100 0
0
0
Loss Time (sec): 0 0
0 1!
Critical V/C: 0.000 1! 0
0
Avg Crit Del (sec/veh): 0.1 0
0 0 Avg Delay (sec/veh): 0.1 0 1
LOS: B
Lanes: 0 0 1! 0 0 Initial Vol: 0 316 0 Signal=Uncontrol/Rights=Include
Street Name: Blair Peterson Approach: North Bound South Bound East Bound West Bound Movement: L - T - R L - T - R L - T - R L - T - R ------------|---------------||---------------||---------------||---------------| Volume Module: Base Vol: 0 212 0 0 18 0 0 0 0 1 0 0 Growth Adj: 1.49 1.49 1.49 1.49 1.49 1.49 1.49 1.49 1.49 1.49 1.49 1.49 Initial Bse: 0 316 0 0 27 0 0 0 0 1 0 0 Added Vol: 0 0 0 0 0 0 0 0 0 0 0 0 Related Pro: 0 0 0 0 0 0 0 0 0 0 0 0 Initial Fut: 0 316 0 0 27 0 0 0 0 1 0 0 User Adj: 1.00 1.00 1.00 1.00 1.00 1.00 1.00 1.00 1.00 1.00 1.00 1.00 PHF Adj: 0.69 0.69 0.69 0.69 0.69 0.69 0.69 0.69 0.69 0.69 0.69 0.69 PHF Volume: 0 459 0 0 39 0 0 0 0 2 0 0 Reduct Vol: 0 0 0 0 0 0 0 0 0 0 0 0 FinalVolume: 0 459 0 0 39 0 0 0 0 2 0 0 ------------|---------------||---------------||---------------||---------------| Critical Gap Module: Critical Gp:xxxxx xxxx xxxxx xxxxx xxxx xxxxx 7.1 6.5 6.2 6.4 xxxx xxxxx FollowUpTim:xxxxx xxxx xxxxx xxxxx xxxx xxxxx 3.5 4.0 3.3 3.5 xxxx xxxxx ------------|---------------||---------------||---------------||---------------| Capacity Module: Cnflict Vol: xxxx xxxx xxxxx xxxx xxxx xxxxx 498 498 39 498 xxxx xxxxx Potent Cap.: xxxx xxxx xxxxx xxxx xxxx xxxxx 486 477 1038 535 xxxx xxxxx Move Cap.: xxxx xxxx xxxxx xxxx xxxx xxxxx 486 477 1038 535 xxxx xxxxx Volume/Cap: xxxx xxxx xxxx xxxx xxxx xxxx 0.00 0.00 0.00 0.00 xxxx xxxx ------------|---------------||---------------||---------------||---------------| Level Of Service Module: 2Way95thQ: xxxx xxxx xxxxx xxxx xxxx xxxxx xxxx xxxx xxxxx 0.0 xxxx xxxxx Control Del:xxxxx xxxx xxxxx xxxxx xxxx xxxxx xxxxx xxxx xxxxx 11.8 xxxx xxxxx LOS by Move: * * * * * * * * * B * * Movement: LT - LTR - RT LT - LTR - RT LT - LTR - RT LT - LTR - RT Shared Cap.: xxxx xxxx xxxxx xxxx xxxx xxxxx xxxx 0 xxxxx xxxx xxxx xxxxx SharedQueue:xxxxx xxxx xxxxx xxxxx xxxx xxxxx xxxxx xxxx xxxxx xxxxx xxxx xxxxx Shrd ConDel:xxxxx xxxx xxxxx xxxxx xxxx xxxxx xxxxx xxxx xxxxx xxxxx xxxx xxxxx Shared LOS: * * * * * * * * * * * * ApproachDel: xxxxxx xxxxxx xxxxxx 11.8 ApproachLOS: * * * B Note: Queue reported is the number of cars per lane. Peak Hour Delay Signal Warrant Report ******************************************************************************** Intersection #3 Peterson/Blair ******************************************************************************** Future Volume Alternative: Peak Hour Warrant NOT Met
COMPARE Wed Jan 12 10:50:19 2011 Page 3-18
Traffix 7.9.0215 Copyright (c) 2008 Dowling Associates, Inc. Licensed to F & P, INLAND EMPIRE
------------|---------------||---------------||---------------||---------------| Approach: North Bound South Bound East Bound West Bound Movement: L - T - R L - T - R L - T - R L - T - R ------------|---------------||---------------||---------------||---------------| Control: Uncontrolled Uncontrolled Stop Sign Stop Sign Lanes: 0 0 1 0 0 0 0 1 0 0 0 0 1! 0 0 1 0 0 0 0 Initial Vol: 0 316 0 0 27 0 0 0 0 1 0 0 ApproachDel: xxxxxx xxxxxx xxxxxx 11.8 ------------|---------------||---------------||---------------||---------------| Approach[westbound][lanes=1][control=Stop Sign] Signal Warrant Rule #1: [vehicle-hours=0.0] FAIL - Vehicle-hours less than 4 for one lane approach. Signal Warrant Rule #2: [approach volume=1] FAIL - Approach volume less than 100 for one lane approach. Signal Warrant Rule #3: [approach count=3][total volume=344] FAIL - Total volume less than 650 for intersection with less than four approaches. -------------------------------------------------------------------------------- SIGNAL WARRANT DISCLAIMER This peak hour signal warrant analysis should be considered solely as an "indicator" of the likelihood of an unsignalized intersection warranting a traffic signal in the future. Intersections that exceed this warrant are probably more likely to meet one or more of the other volume based signal warrant (such as the 4-hour or 8-hour warrants). The peak hour warrant analysis in this report is not intended to replace a rigorous and complete traffic signal warrant analysis by the responsible jurisdiction. Consideration of the other signal warrants, which is beyond the scope of this software, may yield different results. Peak Hour Volume Signal Warrant Report [Urban] ******************************************************************************** Intersection #3 Peterson/Blair ******************************************************************************** Future Volume Alternative: Peak Hour Warrant NOT Met ------------|---------------||---------------||---------------||---------------| Approach: North Bound South Bound East Bound West Bound Movement: L - T - R L - T - R L - T - R L - T - R ------------|---------------||---------------||---------------||---------------| Control: Uncontrolled Uncontrolled Stop Sign Stop Sign Lanes: 0 0 1 0 0 0 0 1 0 0 0 0 1! 0 0 1 0 0 0 0 Initial Vol: 0 316 0 0 27 0 0 0 0 1 0 0 ------------|---------------||---------------||---------------||---------------| Major Street Volume: 343 Minor Approach Volume: 1 Minor Approach Volume Threshold: 505 -------------------------------------------------------------------------------- SIGNAL WARRANT DISCLAIMER This peak hour signal warrant analysis should be considered solely as an "indicator" of the likelihood of an unsignalized intersection warranting a traffic signal in the future. Intersections that exceed this warrant are probably more likely to meet one or more of the other volume based signal warrant (such as the 4-hour or 8-hour warrants). The peak hour warrant analysis in this report is not intended to replace a rigorous and complete traffic signal warrant analysis by the responsible jurisdiction. Consideration of the other signal warrants, which is beyond the scope of this software, may yield different results.

COMPARE Wed Jan 12 10:50:19 2011 Page 3-19
Traffix 7.9.0215 Copyright (c) 2008 Dowling Associates, Inc. Licensed to F & P, INLAND EMPIRE
Calipatria Solar Farm IE10-0037
Cumulative (2030) AM
Level Of Service Computation Report 2000 HCM Unsignalized (Future Volume Alternative)
Cumulative PM
Intersection #3: Peterson/Blair Signal=Uncontrol/Rights=Include Initial Vol: 0 221 0 Lanes: 0 0 1! 0 0
Signal=Stop
Signal=Stop
Initial Vol: Lanes: Rights=Include Vol Cnt Date: 3/16/2010 Rights=Include Lanes: Initial Vol: 0
0
Cycle Time (sec): 100 0
0
0
Loss Time (sec): 0 0
0 1!
Critical V/C: 0.000 1! 0
0
Avg Crit Del (sec/veh): 0.2 0
0 0 Avg Delay (sec/veh): 0.2 0 4
LOS: B
Lanes: 0 0 1! 0 0 Initial Vol: 0 13 0 Signal=Uncontrol/Rights=Include
Street Name: Blair Peterson Approach: North Bound South Bound East Bound West Bound Movement: L - T - R L - T - R L - T - R L - T - R ------------|---------------||---------------||---------------||---------------| Volume Module: >> Count Date: 16 Mar 2010 << 4:00-5:00PM Base Vol: 0 9 0 0 148 0 0 0 0 3 0 0 Growth Adj: 1.49 1.49 1.49 1.49 1.49 1.49 1.49 1.49 1.49 1.49 1.49 1.49 Initial Bse: 0 13 0 0 221 0 0 0 0 4 0 0 Added Vol: 0 0 0 0 0 0 0 0 0 0 0 0 Related Pro: 0 0 0 0 0 0 0 0 0 0 0 0 Initial Fut: 0 13 0 0 221 0 0 0 0 4 0 0 User Adj: 1.00 1.00 1.00 1.00 1.00 1.00 1.00 1.00 1.00 1.00 1.00 1.00 PHF Adj: 0.66 0.66 0.66 0.66 0.66 0.66 0.66 0.66 0.66 0.66 0.66 0.66 PHF Volume: 0 20 0 0 336 0 0 0 0 7 0 0 Reduct Vol: 0 0 0 0 0 0 0 0 0 0 0 0 FinalVolume: 0 20 0 0 336 0 0 0 0 7 0 0 ------------|---------------||---------------||---------------||---------------| Critical Gap Module: Critical Gp:xxxxx xxxx xxxxx xxxxx xxxx xxxxx 7.1 6.5 6.2 6.4 xxxx xxxxx FollowUpTim:xxxxx xxxx xxxxx xxxxx xxxx xxxxx 3.5 4.0 3.3 3.5 xxxx xxxxx ------------|---------------||---------------||---------------||---------------| Capacity Module: Cnflict Vol: xxxx xxxx xxxxx xxxx xxxx xxxxx 357 357 336 357 xxxx xxxxx Potent Cap.: xxxx xxxx xxxxx xxxx xxxx xxxxx 602 573 710 646 xxxx xxxxx Move Cap.: xxxx xxxx xxxxx xxxx xxxx xxxxx 602 573 710 646 xxxx xxxxx Volume/Cap: xxxx xxxx xxxx xxxx xxxx xxxx 0.00 0.00 0.00 0.01 xxxx xxxx ------------|---------------||---------------||---------------||---------------| Level Of Service Module: 2Way95thQ: xxxx xxxx xxxxx xxxx xxxx xxxxx xxxx xxxx xxxxx 0.0 xxxx xxxxx Control Del:xxxxx xxxx xxxxx xxxxx xxxx xxxxx xxxxx xxxx xxxxx 10.6 xxxx xxxxx LOS by Move: * * * * * * * * * B * * Movement: LT - LTR - RT LT - LTR - RT LT - LTR - RT LT - LTR - RT Shared Cap.: xxxx xxxx xxxxx xxxx xxxx xxxxx xxxx 0 xxxxx xxxx xxxx xxxxx SharedQueue:xxxxx xxxx xxxxx xxxxx xxxx xxxxx xxxxx xxxx xxxxx xxxxx xxxx xxxxx Shrd ConDel:xxxxx xxxx xxxxx xxxxx xxxx xxxxx xxxxx xxxx xxxxx xxxxx xxxx xxxxx Shared LOS: * * * * * * * * * * * * ApproachDel: xxxxxx xxxxxx xxxxxx 10.6 ApproachLOS: * * * B Note: Queue reported is the number of cars per lane. Peak Hour Delay Signal Warrant Report ******************************************************************************** Intersection #3 Peterson/Blair ******************************************************************************** Future Volume Alternative: Peak Hour Warrant NOT Met
COMPARE Wed Jan 12 10:50:19 2011 Page 3-20
Traffix 7.9.0215 Copyright (c) 2008 Dowling Associates, Inc. Licensed to F & P, INLAND EMPIRE
------------|---------------||---------------||---------------||---------------| Approach: North Bound South Bound East Bound West Bound Movement: L - T - R L - T - R L - T - R L - T - R ------------|---------------||---------------||---------------||---------------| Control: Uncontrolled Uncontrolled Stop Sign Stop Sign Lanes: 0 0 1 0 0 0 0 1 0 0 0 0 1! 0 0 1 0 0 0 0 Initial Vol: 0 13 0 0 221 0 0 0 0 4 0 0 ApproachDel: xxxxxx xxxxxx xxxxxx 10.6 ------------|---------------||---------------||---------------||---------------| Approach[westbound][lanes=1][control=Stop Sign] Signal Warrant Rule #1: [vehicle-hours=0.0] FAIL - Vehicle-hours less than 4 for one lane approach. Signal Warrant Rule #2: [approach volume=4] FAIL - Approach volume less than 100 for one lane approach. Signal Warrant Rule #3: [approach count=3][total volume=238] FAIL - Total volume less than 650 for intersection with less than four approaches. -------------------------------------------------------------------------------- SIGNAL WARRANT DISCLAIMER This peak hour signal warrant analysis should be considered solely as an "indicator" of the likelihood of an unsignalized intersection warranting a traffic signal in the future. Intersections that exceed this warrant are probably more likely to meet one or more of the other volume based signal warrant (such as the 4-hour or 8-hour warrants). The peak hour warrant analysis in this report is not intended to replace a rigorous and complete traffic signal warrant analysis by the responsible jurisdiction. Consideration of the other signal warrants, which is beyond the scope of this software, may yield different results. Peak Hour Volume Signal Warrant Report [Urban] ******************************************************************************** Intersection #3 Peterson/Blair ******************************************************************************** Future Volume Alternative: Peak Hour Warrant NOT Met ------------|---------------||---------------||---------------||---------------| Approach: North Bound South Bound East Bound West Bound Movement: L - T - R L - T - R L - T - R L - T - R ------------|---------------||---------------||---------------||---------------| Control: Uncontrolled Uncontrolled Stop Sign Stop Sign Lanes: 0 0 1 0 0 0 0 1 0 0 0 0 1! 0 0 1 0 0 0 0 Initial Vol: 0 13 0 0 221 0 0 0 0 4 0 0 ------------|---------------||---------------||---------------||---------------| Major Street Volume: 234 Minor Approach Volume: 4 Minor Approach Volume Threshold: 607 -------------------------------------------------------------------------------- SIGNAL WARRANT DISCLAIMER This peak hour signal warrant analysis should be considered solely as an "indicator" of the likelihood of an unsignalized intersection warranting a traffic signal in the future. Intersections that exceed this warrant are probably more likely to meet one or more of the other volume based signal warrant (such as the 4-hour or 8-hour warrants). The peak hour warrant analysis in this report is not intended to replace a rigorous and complete traffic signal warrant analysis by the responsible jurisdiction. Consideration of the other signal warrants, which is beyond the scope of this software, may yield different results.

COMPARE Wed Jan 12 10:50:19 2011 Page 3-21
Traffix 7.9.0215 Copyright (c) 2008 Dowling Associates, Inc. Licensed to F & P, INLAND EMPIRE
Calipatria Solar Farm IE10-0037
Cumulative (2030) AM
Level Of Service Computation Report 2000 HCM Unsignalized (Future Volume Alternative)
C+P AM
Intersection #3: Peterson/Blair Signal=Uncontrol/Rights=Include Initial Vol: 0 29 0 Lanes: 0 0 1! 0 0
Signal=Stop
Signal=Stop
Initial Vol: Lanes: Rights=Include Vol Cnt Date: n/a Rights=Include Lanes: Initial Vol: 0
0
Cycle Time (sec): 100 0
0
0
Loss Time (sec): 0 0
0 1!
Critical V/C: 0.000 1! 0
0
Avg Crit Del (sec/veh): 0.1 0
0 0 Avg Delay (sec/veh): 0.1 0 1
LOS: B
Lanes: 0 0 1! 0 0 Initial Vol: 0 316 0 Signal=Uncontrol/Rights=Include
Street Name: Blair Peterson Approach: North Bound South Bound East Bound West Bound Movement: L - T - R L - T - R L - T - R L - T - R ------------|---------------||---------------||---------------||---------------| Volume Module: Base Vol: 0 212 0 0 18 0 0 0 0 1 0 0 Growth Adj: 1.49 1.49 1.49 1.49 1.49 1.49 1.49 1.49 1.49 1.49 1.49 1.49 Initial Bse: 0 316 0 0 27 0 0 0 0 1 0 0 Added Vol: 0 0 0 0 2 0 0 0 0 0 0 0 Related Pro: 0 0 0 0 0 0 0 0 0 0 0 0 Initial Fut: 0 316 0 0 29 0 0 0 0 1 0 0 User Adj: 1.00 1.00 1.00 1.00 1.00 1.00 1.00 1.00 1.00 1.00 1.00 1.00 PHF Adj: 0.69 0.69 0.69 0.69 0.69 0.69 0.69 0.69 0.69 0.69 0.69 0.69 PHF Volume: 0 459 0 0 42 0 0 0 0 2 0 0 Reduct Vol: 0 0 0 0 0 0 0 0 0 0 0 0 FinalVolume: 0 459 0 0 42 0 0 0 0 2 0 0 ------------|---------------||---------------||---------------||---------------| Critical Gap Module: Critical Gp:xxxxx xxxx xxxxx xxxxx xxxx xxxxx 7.1 6.5 6.2 6.4 xxxx xxxxx FollowUpTim:xxxxx xxxx xxxxx xxxxx xxxx xxxxx 3.5 4.0 3.3 3.5 xxxx xxxxx ------------|---------------||---------------||---------------||---------------| Capacity Module: Cnflict Vol: xxxx xxxx xxxxx xxxx xxxx xxxxx 501 501 42 501 xxxx xxxxx Potent Cap.: xxxx xxxx xxxxx xxxx xxxx xxxxx 484 475 1035 533 xxxx xxxxx Move Cap.: xxxx xxxx xxxxx xxxx xxxx xxxxx 484 475 1035 533 xxxx xxxxx Volume/Cap: xxxx xxxx xxxx xxxx xxxx xxxx 0.00 0.00 0.00 0.00 xxxx xxxx ------------|---------------||---------------||---------------||---------------| Level Of Service Module: 2Way95thQ: xxxx xxxx xxxxx xxxx xxxx xxxxx xxxx xxxx xxxxx 0.0 xxxx xxxxx Control Del:xxxxx xxxx xxxxx xxxxx xxxx xxxxx xxxxx xxxx xxxxx 11.8 xxxx xxxxx LOS by Move: * * * * * * * * * B * * Movement: LT - LTR - RT LT - LTR - RT LT - LTR - RT LT - LTR - RT Shared Cap.: xxxx xxxx xxxxx xxxx xxxx xxxxx xxxx 0 xxxxx xxxx xxxx xxxxx SharedQueue:xxxxx xxxx xxxxx xxxxx xxxx xxxxx xxxxx xxxx xxxxx xxxxx xxxx xxxxx Shrd ConDel:xxxxx xxxx xxxxx xxxxx xxxx xxxxx xxxxx xxxx xxxxx xxxxx xxxx xxxxx Shared LOS: * * * * * * * * * * * * ApproachDel: xxxxxx xxxxxx xxxxxx 11.8 ApproachLOS: * * * B Note: Queue reported is the number of cars per lane. Peak Hour Delay Signal Warrant Report ******************************************************************************** Intersection #3 Peterson/Blair ******************************************************************************** Future Volume Alternative: Peak Hour Warrant NOT Met
COMPARE Wed Jan 12 10:50:19 2011 Page 3-22
Traffix 7.9.0215 Copyright (c) 2008 Dowling Associates, Inc. Licensed to F & P, INLAND EMPIRE
------------|---------------||---------------||---------------||---------------| Approach: North Bound South Bound East Bound West Bound Movement: L - T - R L - T - R L - T - R L - T - R ------------|---------------||---------------||---------------||---------------| Control: Uncontrolled Uncontrolled Stop Sign Stop Sign Lanes: 0 0 1 0 0 0 0 1 0 0 0 0 1! 0 0 1 0 0 0 0 Initial Vol: 0 316 0 0 29 0 0 0 0 1 0 0 ApproachDel: xxxxxx xxxxxx xxxxxx 11.8 ------------|---------------||---------------||---------------||---------------| Approach[westbound][lanes=1][control=Stop Sign] Signal Warrant Rule #1: [vehicle-hours=0.0] FAIL - Vehicle-hours less than 4 for one lane approach. Signal Warrant Rule #2: [approach volume=1] FAIL - Approach volume less than 100 for one lane approach. Signal Warrant Rule #3: [approach count=3][total volume=346] FAIL - Total volume less than 650 for intersection with less than four approaches. -------------------------------------------------------------------------------- SIGNAL WARRANT DISCLAIMER This peak hour signal warrant analysis should be considered solely as an "indicator" of the likelihood of an unsignalized intersection warranting a traffic signal in the future. Intersections that exceed this warrant are probably more likely to meet one or more of the other volume based signal warrant (such as the 4-hour or 8-hour warrants). The peak hour warrant analysis in this report is not intended to replace a rigorous and complete traffic signal warrant analysis by the responsible jurisdiction. Consideration of the other signal warrants, which is beyond the scope of this software, may yield different results. Peak Hour Volume Signal Warrant Report [Urban] ******************************************************************************** Intersection #3 Peterson/Blair ******************************************************************************** Future Volume Alternative: Peak Hour Warrant NOT Met ------------|---------------||---------------||---------------||---------------| Approach: North Bound South Bound East Bound West Bound Movement: L - T - R L - T - R L - T - R L - T - R ------------|---------------||---------------||---------------||---------------| Control: Uncontrolled Uncontrolled Stop Sign Stop Sign Lanes: 0 0 1 0 0 0 0 1 0 0 0 0 1! 0 0 1 0 0 0 0 Initial Vol: 0 316 0 0 29 0 0 0 0 1 0 0 ------------|---------------||---------------||---------------||---------------| Major Street Volume: 345 Minor Approach Volume: 1 Minor Approach Volume Threshold: 503 -------------------------------------------------------------------------------- SIGNAL WARRANT DISCLAIMER This peak hour signal warrant analysis should be considered solely as an "indicator" of the likelihood of an unsignalized intersection warranting a traffic signal in the future. Intersections that exceed this warrant are probably more likely to meet one or more of the other volume based signal warrant (such as the 4-hour or 8-hour warrants). The peak hour warrant analysis in this report is not intended to replace a rigorous and complete traffic signal warrant analysis by the responsible jurisdiction. Consideration of the other signal warrants, which is beyond the scope of this software, may yield different results.

COMPARE Wed Jan 12 10:50:19 2011 Page 3-23
Traffix 7.9.0215 Copyright (c) 2008 Dowling Associates, Inc. Licensed to F & P, INLAND EMPIRE
Calipatria Solar Farm IE10-0037
Cumulative (2030) AM
Level Of Service Computation Report 2000 HCM Unsignalized (Future Volume Alternative)
C+P PM
Intersection #3: Peterson/Blair Signal=Uncontrol/Rights=Include Initial Vol: 0 221 0 Lanes: 0 0 1! 0 0
Signal=Stop
Signal=Stop
Initial Vol: Lanes: Rights=Include Vol Cnt Date: 3/16/2010 Rights=Include Lanes: Initial Vol: 0
0
Cycle Time (sec): 100 0
0
0
Loss Time (sec): 0 0
0 1!
Critical V/C: 0.000 1! 0
0
Avg Crit Del (sec/veh): 0.2 0
0 0 Avg Delay (sec/veh): 0.2 0 4
LOS: B
Lanes: 0 0 1! 0 0 Initial Vol: 0 15 0 Signal=Uncontrol/Rights=Include
Street Name: Blair Peterson Approach: North Bound South Bound East Bound West Bound Movement: L - T - R L - T - R L - T - R L - T - R ------------|---------------||---------------||---------------||---------------| Volume Module: >> Count Date: 16 Mar 2010 << 4:00-5:00PM Base Vol: 0 9 0 0 148 0 0 0 0 3 0 0 Growth Adj: 1.49 1.49 1.49 1.49 1.49 1.49 1.49 1.49 1.49 1.49 1.49 1.49 Initial Bse: 0 13 0 0 221 0 0 0 0 4 0 0 Added Vol: 0 2 0 0 0 0 0 0 0 0 0 0 Related Pro: 0 0 0 0 0 0 0 0 0 0 0 0 Initial Fut: 0 15 0 0 221 0 0 0 0 4 0 0 User Adj: 1.00 1.00 1.00 1.00 1.00 1.00 1.00 1.00 1.00 1.00 1.00 1.00 PHF Adj: 0.66 0.66 0.66 0.66 0.66 0.66 0.66 0.66 0.66 0.66 0.66 0.66 PHF Volume: 0 23 0 0 336 0 0 0 0 7 0 0 Reduct Vol: 0 0 0 0 0 0 0 0 0 0 0 0 FinalVolume: 0 23 0 0 336 0 0 0 0 7 0 0 ------------|---------------||---------------||---------------||---------------| Critical Gap Module: Critical Gp:xxxxx xxxx xxxxx xxxxx xxxx xxxxx 7.1 6.5 6.2 6.4 xxxx xxxxx FollowUpTim:xxxxx xxxx xxxxx xxxxx xxxx xxxxx 3.5 4.0 3.3 3.5 xxxx xxxxx ------------|---------------||---------------||---------------||---------------| Capacity Module: Cnflict Vol: xxxx xxxx xxxxx xxxx xxxx xxxxx 360 360 336 360 xxxx xxxxx Potent Cap.: xxxx xxxx xxxxx xxxx xxxx xxxxx 600 570 710 643 xxxx xxxxx Move Cap.: xxxx xxxx xxxxx xxxx xxxx xxxxx 600 570 710 643 xxxx xxxxx Volume/Cap: xxxx xxxx xxxx xxxx xxxx xxxx 0.00 0.00 0.00 0.01 xxxx xxxx ------------|---------------||---------------||---------------||---------------| Level Of Service Module: 2Way95thQ: xxxx xxxx xxxxx xxxx xxxx xxxxx xxxx xxxx xxxxx 0.0 xxxx xxxxx Control Del:xxxxx xxxx xxxxx xxxxx xxxx xxxxx xxxxx xxxx xxxxx 10.7 xxxx xxxxx LOS by Move: * * * * * * * * * B * * Movement: LT - LTR - RT LT - LTR - RT LT - LTR - RT LT - LTR - RT Shared Cap.: xxxx xxxx xxxxx xxxx xxxx xxxxx xxxx 0 xxxxx xxxx xxxx xxxxx SharedQueue:xxxxx xxxx xxxxx xxxxx xxxx xxxxx xxxxx xxxx xxxxx xxxxx xxxx xxxxx Shrd ConDel:xxxxx xxxx xxxxx xxxxx xxxx xxxxx xxxxx xxxx xxxxx xxxxx xxxx xxxxx Shared LOS: * * * * * * * * * * * * ApproachDel: xxxxxx xxxxxx xxxxxx 10.7 ApproachLOS: * * * B Note: Queue reported is the number of cars per lane. Peak Hour Delay Signal Warrant Report ******************************************************************************** Intersection #3 Peterson/Blair ******************************************************************************** Future Volume Alternative: Peak Hour Warrant NOT Met
COMPARE Wed Jan 12 10:50:19 2011 Page 3-24
Traffix 7.9.0215 Copyright (c) 2008 Dowling Associates, Inc. Licensed to F & P, INLAND EMPIRE
------------|---------------||---------------||---------------||---------------| Approach: North Bound South Bound East Bound West Bound Movement: L - T - R L - T - R L - T - R L - T - R ------------|---------------||---------------||---------------||---------------| Control: Uncontrolled Uncontrolled Stop Sign Stop Sign Lanes: 0 0 1 0 0 0 0 1 0 0 0 0 1! 0 0 1 0 0 0 0 Initial Vol: 0 15 0 0 221 0 0 0 0 4 0 0 ApproachDel: xxxxxx xxxxxx xxxxxx 10.7 ------------|---------------||---------------||---------------||---------------| Approach[westbound][lanes=1][control=Stop Sign] Signal Warrant Rule #1: [vehicle-hours=0.0] FAIL - Vehicle-hours less than 4 for one lane approach. Signal Warrant Rule #2: [approach volume=4] FAIL - Approach volume less than 100 for one lane approach. Signal Warrant Rule #3: [approach count=3][total volume=240] FAIL - Total volume less than 650 for intersection with less than four approaches. -------------------------------------------------------------------------------- SIGNAL WARRANT DISCLAIMER This peak hour signal warrant analysis should be considered solely as an "indicator" of the likelihood of an unsignalized intersection warranting a traffic signal in the future. Intersections that exceed this warrant are probably more likely to meet one or more of the other volume based signal warrant (such as the 4-hour or 8-hour warrants). The peak hour warrant analysis in this report is not intended to replace a rigorous and complete traffic signal warrant analysis by the responsible jurisdiction. Consideration of the other signal warrants, which is beyond the scope of this software, may yield different results. Peak Hour Volume Signal Warrant Report [Urban] ******************************************************************************** Intersection #3 Peterson/Blair ******************************************************************************** Future Volume Alternative: Peak Hour Warrant NOT Met ------------|---------------||---------------||---------------||---------------| Approach: North Bound South Bound East Bound West Bound Movement: L - T - R L - T - R L - T - R L - T - R ------------|---------------||---------------||---------------||---------------| Control: Uncontrolled Uncontrolled Stop Sign Stop Sign Lanes: 0 0 1 0 0 0 0 1 0 0 0 0 1! 0 0 1 0 0 0 0 Initial Vol: 0 15 0 0 221 0 0 0 0 4 0 0 ------------|---------------||---------------||---------------||---------------| Major Street Volume: 236 Minor Approach Volume: 4 Minor Approach Volume Threshold: 605 -------------------------------------------------------------------------------- SIGNAL WARRANT DISCLAIMER This peak hour signal warrant analysis should be considered solely as an "indicator" of the likelihood of an unsignalized intersection warranting a traffic signal in the future. Intersections that exceed this warrant are probably more likely to meet one or more of the other volume based signal warrant (such as the 4-hour or 8-hour warrants). The peak hour warrant analysis in this report is not intended to replace a rigorous and complete traffic signal warrant analysis by the responsible jurisdiction. Consideration of the other signal warrants, which is beyond the scope of this software, may yield different results.
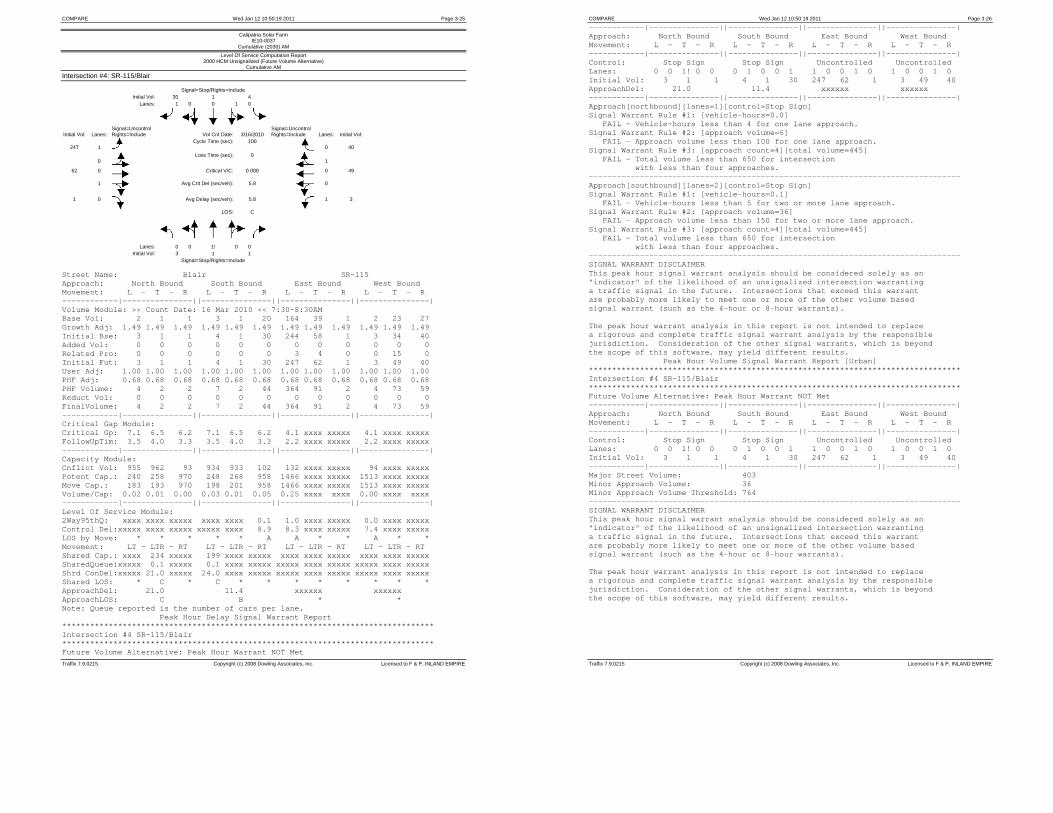
COMPARE Wed Jan 12 10:50:19 2011 Page 3-25
Traffix 7.9.0215 Copyright (c) 2008 Dowling Associates, Inc. Licensed to F & P, INLAND EMPIRE
Calipatria Solar Farm IE10-0037
Cumulative (2030) AM
Level Of Service Computation Report 2000 HCM Unsignalized (Future Volume Alternative)
Cumulative AM
Intersection #4: SR-115/Blair Signal=Stop/Rights=Include Initial Vol: 30 1 4 Lanes: 1 0 0 1 0
Signal=Uncontrol
Signal=Uncontrol
Initial Vol: Lanes: Rights=Include Vol Cnt Date: 3/16/2010 Rights=Include Lanes: Initial Vol:
247
1 Cycle Time (sec): 100
0
40
0
Loss Time (sec): 0 1
62 0
Critical V/C: 0.000 0 49
1
Avg Crit Del (sec/veh): 5.8 0
1 0 Avg Delay (sec/veh): 5.8 1 3
LOS: C
Lanes: 0 0 1! 0 0 Initial Vol: 3 1 1 Signal=Stop/Rights=Include
Street Name: Blair SR-115 Approach: North Bound South Bound East Bound West Bound Movement: L - T - R L - T - R L - T - R L - T - R ------------|---------------||---------------||---------------||---------------| Volume Module: >> Count Date: 16 Mar 2010 << 7:30-8:30AM Base Vol: 2 1 1 3 1 20 164 39 1 2 23 27 Growth Adj: 1.49 1.49 1.49 1.49 1.49 1.49 1.49 1.49 1.49 1.49 1.49 1.49 Initial Bse: 3 1 1 4 1 30 244 58 1 3 34 40 Added Vol: 0 0 0 0 0 0 0 0 0 0 0 0 Related Pro: 0 0 0 0 0 0 3 4 0 0 15 0 Initial Fut: 3 1 1 4 1 30 247 62 1 3 49 40 User Adj: 1.00 1.00 1.00 1.00 1.00 1.00 1.00 1.00 1.00 1.00 1.00 1.00 PHF Adj: 0.68 0.68 0.68 0.68 0.68 0.68 0.68 0.68 0.68 0.68 0.68 0.68 PHF Volume: 4 2 2 7 2 44 364 91 2 4 73 59 Reduct Vol: 0 0 0 0 0 0 0 0 0 0 0 0 FinalVolume: 4 2 2 7 2 44 364 91 2 4 73 59 ------------|---------------||---------------||---------------||---------------| Critical Gap Module: Critical Gp: 7.1 6.5 6.2 7.1 6.5 6.2 4.1 xxxx xxxxx 4.1 xxxx xxxxx FollowUpTim: 3.5 4.0 3.3 3.5 4.0 3.3 2.2 xxxx xxxxx 2.2 xxxx xxxxx ------------|---------------||---------------||---------------||---------------| Capacity Module: Cnflict Vol: 955 962 93 934 933 102 132 xxxx xxxxx 94 xxxx xxxxx Potent Cap.: 240 258 970 248 268 958 1466 xxxx xxxxx 1513 xxxx xxxxx Move Cap.: 183 193 970 198 201 958 1466 xxxx xxxxx 1513 xxxx xxxxx Volume/Cap: 0.02 0.01 0.00 0.03 0.01 0.05 0.25 xxxx xxxx 0.00 xxxx xxxx ------------|---------------||---------------||---------------||---------------| Level Of Service Module: 2Way95thQ: xxxx xxxx xxxxx xxxx xxxx 0.1 1.0 xxxx xxxxx 0.0 xxxx xxxxx Control Del:xxxxx xxxx xxxxx xxxxx xxxx 8.9 8.3 xxxx xxxxx 7.4 xxxx xxxxx LOS by Move: * * * * * A A * * A * * Movement: LT - LTR - RT LT - LTR - RT LT - LTR - RT LT - LTR - RT Shared Cap.: xxxx 234 xxxxx 199 xxxx xxxxx xxxx xxxx xxxxx xxxx xxxx xxxxx SharedQueue:xxxxx 0.1 xxxxx 0.1 xxxx xxxxx xxxxx xxxx xxxxx xxxxx xxxx xxxxx Shrd ConDel:xxxxx 21.0 xxxxx 24.0 xxxx xxxxx xxxxx xxxx xxxxx xxxxx xxxx xxxxx Shared LOS: * C * C * * * * * * * * ApproachDel: 21.0 11.4 xxxxxx xxxxxx ApproachLOS: C B * * Note: Queue reported is the number of cars per lane. Peak Hour Delay Signal Warrant Report ******************************************************************************** Intersection #4 SR-115/Blair ******************************************************************************** Future Volume Alternative: Peak Hour Warrant NOT Met
COMPARE Wed Jan 12 10:50:19 2011 Page 3-26
Traffix 7.9.0215 Copyright (c) 2008 Dowling Associates, Inc. Licensed to F & P, INLAND EMPIRE
------------|---------------||---------------||---------------||---------------| Approach: North Bound South Bound East Bound West Bound Movement: L - T - R L - T - R L - T - R L - T - R ------------|---------------||---------------||---------------||---------------| Control: Stop Sign Stop Sign Uncontrolled Uncontrolled Lanes: 0 0 1! 0 0 0 1 0 0 1 1 0 0 1 0 1 0 0 1 0 Initial Vol: 3 1 1 4 1 30 247 62 1 3 49 40 ApproachDel: 21.0 11.4 xxxxxx xxxxxx ------------|---------------||---------------||---------------||---------------| Approach[northbound][lanes=1][control=Stop Sign] Signal Warrant Rule #1: [vehicle-hours=0.0] FAIL - Vehicle-hours less than 4 for one lane approach. Signal Warrant Rule #2: [approach volume=6] FAIL - Approach volume less than 100 for one lane approach. Signal Warrant Rule #3: [approach count=4][total volume=445] FAIL - Total volume less than 650 for intersection with less than four approaches. -------------------------------------------------------------------------------- Approach[southbound][lanes=2][control=Stop Sign] Signal Warrant Rule #1: [vehicle-hours=0.1] FAIL - Vehicle-hours less than 5 for two or more lane approach. Signal Warrant Rule #2: [approach volume=36] FAIL - Approach volume less than 150 for two or more lane approach. Signal Warrant Rule #3: [approach count=4][total volume=445] FAIL - Total volume less than 650 for intersection with less than four approaches. -------------------------------------------------------------------------------- SIGNAL WARRANT DISCLAIMER This peak hour signal warrant analysis should be considered solely as an "indicator" of the likelihood of an unsignalized intersection warranting a traffic signal in the future. Intersections that exceed this warrant are probably more likely to meet one or more of the other volume based signal warrant (such as the 4-hour or 8-hour warrants). The peak hour warrant analysis in this report is not intended to replace a rigorous and complete traffic signal warrant analysis by the responsible jurisdiction. Consideration of the other signal warrants, which is beyond the scope of this software, may yield different results. Peak Hour Volume Signal Warrant Report [Urban] ******************************************************************************** Intersection #4 SR-115/Blair ******************************************************************************** Future Volume Alternative: Peak Hour Warrant NOT Met ------------|---------------||---------------||---------------||---------------| Approach: North Bound South Bound East Bound West Bound Movement: L - T - R L - T - R L - T - R L - T - R ------------|---------------||---------------||---------------||---------------| Control: Stop Sign Stop Sign Uncontrolled Uncontrolled Lanes: 0 0 1! 0 0 0 1 0 0 1 1 0 0 1 0 1 0 0 1 0 Initial Vol: 3 1 1 4 1 30 247 62 1 3 49 40 ------------|---------------||---------------||---------------||---------------| Major Street Volume: 403 Minor Approach Volume: 36 Minor Approach Volume Threshold: 764 -------------------------------------------------------------------------------- SIGNAL WARRANT DISCLAIMER This peak hour signal warrant analysis should be considered solely as an "indicator" of the likelihood of an unsignalized intersection warranting a traffic signal in the future. Intersections that exceed this warrant are probably more likely to meet one or more of the other volume based signal warrant (such as the 4-hour or 8-hour warrants). The peak hour warrant analysis in this report is not intended to replace a rigorous and complete traffic signal warrant analysis by the responsible jurisdiction. Consideration of the other signal warrants, which is beyond the scope of this software, may yield different results.
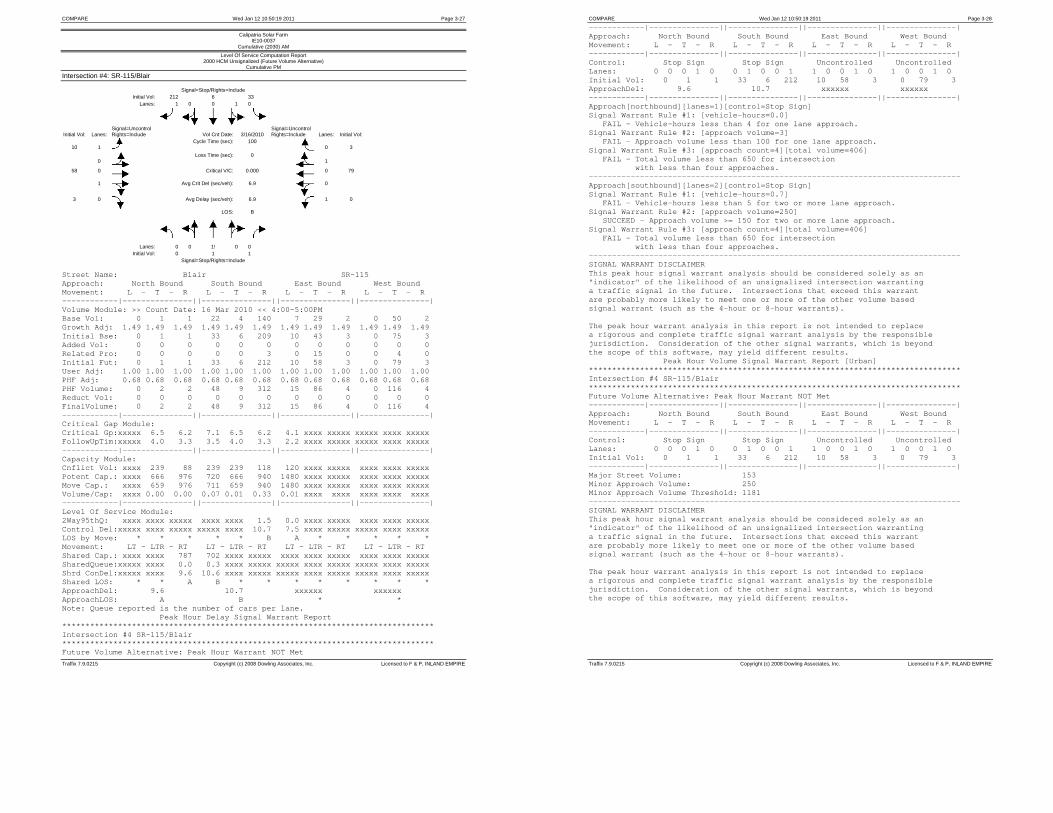
COMPARE Wed Jan 12 10:50:19 2011 Page 3-27
Traffix 7.9.0215 Copyright (c) 2008 Dowling Associates, Inc. Licensed to F & P, INLAND EMPIRE
Calipatria Solar Farm IE10-0037
Cumulative (2030) AM
Level Of Service Computation Report 2000 HCM Unsignalized (Future Volume Alternative)
Cumulative PM
Intersection #4: SR-115/Blair Signal=Stop/Rights=Include Initial Vol: 212 6 33 Lanes: 1 0 0 1 0
Signal=Uncontrol
Signal=Uncontrol
Initial Vol: Lanes: Rights=Include Vol Cnt Date: 3/16/2010 Rights=Include Lanes: Initial Vol:
10
1 Cycle Time (sec): 100
0 3
0
Loss Time (sec): 0 1
58 0
Critical V/C: 0.000 0 79
1
Avg Crit Del (sec/veh): 6.9 0
3 0 Avg Delay (sec/veh): 6.9 1 0
LOS: B
Lanes: 0 0 1! 0 0 Initial Vol: 0 1 1 Signal=Stop/Rights=Include
Street Name: Blair SR-115 Approach: North Bound South Bound East Bound West Bound Movement: L - T - R L - T - R L - T - R L - T - R ------------|---------------||---------------||---------------||---------------| Volume Module: >> Count Date: 16 Mar 2010 << 4:00-5:00PM Base Vol: 0 1 1 22 4 140 7 29 2 0 50 2 Growth Adj: 1.49 1.49 1.49 1.49 1.49 1.49 1.49 1.49 1.49 1.49 1.49 1.49 Initial Bse: 0 1 1 33 6 209 10 43 3 0 75 3 Added Vol: 0 0 0 0 0 0 0 0 0 0 0 0 Related Pro: 0 0 0 0 0 3 0 15 0 0 4 0 Initial Fut: 0 1 1 33 6 212 10 58 3 0 79 3 User Adj: 1.00 1.00 1.00 1.00 1.00 1.00 1.00 1.00 1.00 1.00 1.00 1.00 PHF Adj: 0.68 0.68 0.68 0.68 0.68 0.68 0.68 0.68 0.68 0.68 0.68 0.68 PHF Volume: 0 2 2 48 9 312 15 86 4 0 116 4 Reduct Vol: 0 0 0 0 0 0 0 0 0 0 0 0 FinalVolume: 0 2 2 48 9 312 15 86 4 0 116 4 ------------|---------------||---------------||---------------||---------------| Critical Gap Module: Critical Gp:xxxxx 6.5 6.2 7.1 6.5 6.2 4.1 xxxx xxxxx xxxxx xxxx xxxxx FollowUpTim:xxxxx 4.0 3.3 3.5 4.0 3.3 2.2 xxxx xxxxx xxxxx xxxx xxxxx ------------|---------------||---------------||---------------||---------------| Capacity Module: Cnflict Vol: xxxx 239 88 239 239 118 120 xxxx xxxxx xxxx xxxx xxxxx Potent Cap.: xxxx 666 976 720 666 940 1480 xxxx xxxxx xxxx xxxx xxxxx Move Cap.: xxxx 659 976 711 659 940 1480 xxxx xxxxx xxxx xxxx xxxxx Volume/Cap: xxxx 0.00 0.00 0.07 0.01 0.33 0.01 xxxx xxxx xxxx xxxx xxxx ------------|---------------||---------------||---------------||---------------| Level Of Service Module: 2Way95thQ: xxxx xxxx xxxxx xxxx xxxx 1.5 0.0 xxxx xxxxx xxxx xxxx xxxxx Control Del:xxxxx xxxx xxxxx xxxxx xxxx 10.7 7.5 xxxx xxxxx xxxxx xxxx xxxxx LOS by Move: * * * * * B A * * * * * Movement: LT - LTR - RT LT - LTR - RT LT - LTR - RT LT - LTR - RT Shared Cap.: xxxx xxxx 787 702 xxxx xxxxx xxxx xxxx xxxxx xxxx xxxx xxxxx SharedQueue:xxxxx xxxx 0.0 0.3 xxxx xxxxx xxxxx xxxx xxxxx xxxxx xxxx xxxxx Shrd ConDel:xxxxx xxxx 9.6 10.6 xxxx xxxxx xxxxx xxxx xxxxx xxxxx xxxx xxxxx Shared LOS: * * A B * * * * * * * * ApproachDel: 9.6 10.7 xxxxxx xxxxxx ApproachLOS: A B * * Note: Queue reported is the number of cars per lane. Peak Hour Delay Signal Warrant Report ******************************************************************************** Intersection #4 SR-115/Blair ******************************************************************************** Future Volume Alternative: Peak Hour Warrant NOT Met
COMPARE Wed Jan 12 10:50:19 2011 Page 3-28
Traffix 7.9.0215 Copyright (c) 2008 Dowling Associates, Inc. Licensed to F & P, INLAND EMPIRE
------------|---------------||---------------||---------------||---------------| Approach: North Bound South Bound East Bound West Bound Movement: L - T - R L - T - R L - T - R L - T - R ------------|---------------||---------------||---------------||---------------| Control: Stop Sign Stop Sign Uncontrolled Uncontrolled Lanes: 0 0 0 1 0 0 1 0 0 1 1 0 0 1 0 1 0 0 1 0 Initial Vol: 0 1 1 33 6 212 10 58 3 0 79 3 ApproachDel: 9.6 10.7 xxxxxx xxxxxx ------------|---------------||---------------||---------------||---------------| Approach[northbound][lanes=1][control=Stop Sign] Signal Warrant Rule #1: [vehicle-hours=0.0] FAIL - Vehicle-hours less than 4 for one lane approach. Signal Warrant Rule #2: [approach volume=3] FAIL - Approach volume less than 100 for one lane approach. Signal Warrant Rule #3: [approach count=4][total volume=406] FAIL - Total volume less than 650 for intersection with less than four approaches. -------------------------------------------------------------------------------- Approach[southbound][lanes=2][control=Stop Sign] Signal Warrant Rule #1: [vehicle-hours=0.7] FAIL - Vehicle-hours less than 5 for two or more lane approach. Signal Warrant Rule #2: [approach volume=250] SUCCEED - Approach volume >= 150 for two or more lane approach. Signal Warrant Rule #3: [approach count=4][total volume=406] FAIL - Total volume less than 650 for intersection with less than four approaches. -------------------------------------------------------------------------------- SIGNAL WARRANT DISCLAIMER This peak hour signal warrant analysis should be considered solely as an "indicator" of the likelihood of an unsignalized intersection warranting a traffic signal in the future. Intersections that exceed this warrant are probably more likely to meet one or more of the other volume based signal warrant (such as the 4-hour or 8-hour warrants). The peak hour warrant analysis in this report is not intended to replace a rigorous and complete traffic signal warrant analysis by the responsible jurisdiction. Consideration of the other signal warrants, which is beyond the scope of this software, may yield different results. Peak Hour Volume Signal Warrant Report [Urban] ******************************************************************************** Intersection #4 SR-115/Blair ******************************************************************************** Future Volume Alternative: Peak Hour Warrant NOT Met ------------|---------------||---------------||---------------||---------------| Approach: North Bound South Bound East Bound West Bound Movement: L - T - R L - T - R L - T - R L - T - R ------------|---------------||---------------||---------------||---------------| Control: Stop Sign Stop Sign Uncontrolled Uncontrolled Lanes: 0 0 0 1 0 0 1 0 0 1 1 0 0 1 0 1 0 0 1 0 Initial Vol: 0 1 1 33 6 212 10 58 3 0 79 3 ------------|---------------||---------------||---------------||---------------| Major Street Volume: 153 Minor Approach Volume: 250 Minor Approach Volume Threshold: 1181 -------------------------------------------------------------------------------- SIGNAL WARRANT DISCLAIMER This peak hour signal warrant analysis should be considered solely as an "indicator" of the likelihood of an unsignalized intersection warranting a traffic signal in the future. Intersections that exceed this warrant are probably more likely to meet one or more of the other volume based signal warrant (such as the 4-hour or 8-hour warrants). The peak hour warrant analysis in this report is not intended to replace a rigorous and complete traffic signal warrant analysis by the responsible jurisdiction. Consideration of the other signal warrants, which is beyond the scope of this software, may yield different results.