calphad: computer coupling of phase diagrams and...
TRANSCRIPT

CALPHAD: Computer Coupling of Phase Diagrams and Thermochemistry 42 (2013) 27–37
Contents lists available at ScienceDirect
CALPHAD: Computer Coupling of Phase Diagrams andThermochemistry
0364-59http://d
n CorrE-m
journal homepage: www.elsevier.com/locate/calphad
Experimental investigation and first-principle calculations coupledwith thermodynamic modeling of the Mn–Nd phase diagram
A.O. Mostafa a, A.E. Gheribi b, D. Kevorkov a, Md. Mezbahul-Islam a, M. Medraj a,n
a Department of Mechanical and Industrial Engineering, Concordia University, 1455 Maisonneuve Blvd. W., Montreal, QC, Canada H3G 1M8b CRCT—Centre for Research in Computational Thermochemistry, Department of Chemical Engineering, École Polytechnique de Montréal, C.P. 6079,Succursale Centre-Ville, Montréal, QC, Canada H3C 3A7
a r t i c l e i n f o
Article history:Received 5 March 2013Received in revised form28 May 2013Accepted 9 July 2013Available online 1 August 2013
Keywords:Diffusion couplesExperimental investigationFirst-principles calculationsThermodynamic modelingMn–Nd phase diagram
16/$ - see front matter & 2013 Elsevier Ltd. Ax.doi.org/10.1016/j.calphad.2013.07.004
esponding author. Tel.: +1 514 848 2424x3146ail address: [email protected] (M. M
a b s t r a c t
The complete Mn–Nd phase diagram was established experimentally by means of key samples anddiffusion couple techniques. The phase transformation temperatures, crystal structures and phaseequilibria were studied using differential scanning calorimetry (DSC), X-ray diffraction (XRD), electronprobe microanalysis (EPMA), and scanning electron microscope (SEM) techniques. Three compounds inthe Mn-rich side and two terminal solid solutions in the Nd-rich side were observed. The compoundsMn2Nd, Mn23Nd6, and Mn17Nd2 form peritectically at 850, 940, and 1025 1C, respectively. The eutectoidaldecompositions of the compounds, Mn2Nd, and Mn23Nd6, were confirmed in the temperature ranges of650–550 and 550–400 1C, respectively, using EPMA. The maximum solubility of Mn in DHCP-Nd wasfound to be 2.3 at% Mn at the 685 1C eutectic temperature. The solvus line of DHCP-Nd was determinedusing EPMA. The solubility of Mn in BCC-Nd was extrapolated from DSC data to be 5.0 at% Mn at 728 1C.The existence of a Mn17Nd2 phase of the Th2Ni17 type structure was confirmed using EPMA and XRD. Thesystem was modelled using CALPHAD methodology. The quasi-chemical model (QCM) was used todescribe the liquid phase, the terminal solution phases were modeled as substitutional solutions usingthe random mixing model, and the intermetallic compounds were treated as stoichiometric phases. Theenthalpies of formation of the system compounds were calculated using the electronic density functionalmethod. The resulting enthalpy of mixing was in good agreement with the literature.
& 2013 Elsevier Ltd. All rights reserved.
1. Introduction
Manganese is used mainly as a deoxidizer and desulfurizerelement in the steel, cast iron, and non-ferrous industries. For thisreason it is also called a cleaning agent [1]. Mn alloyed with steelprovides very tough, wear resistant, and ferromagnetic alloys [2].Furthermore, addition of Mn to Mg alloys improves their hot andcold strengths, resistance to corrosion, and formability. Due to itshigh reactivity with other elements, manganese phase diagramsusually show very complicated sequences of intermediate phases.Thus, when manganese is alloyed with various rare earth elements(RE), a significant variation in the properties is obtained [3]. Thecrystal structures of the phases formed in some Mn–RE systemsare listed in Table 1 [4–9]. Addition of Nd to Mg–Mn alloysdevelops their microstructures, with regard to grain size, and theresulting mechanical properties during indirect extrusion pro-cesses. Nd is considered the stronger texture modifier of Mg–Mnalloys compared to other REs, such as Ce [10].
ll rights reserved.
; fax: +1 514 848 3175.edraj).
Binary systems of Mn with heavy RE metals exhibit increasingnumber of stable intermetallic compounds. The Mn–Nd phasediagram was first investigated experimentally by Kirchmayr andLugscheider [11] using DTA and XRD. According to these authors,the eutectic occurs at 700 1C and 27 at% Mn; a negligible terminalsolid solubility near the Nd side was considered. Three peritecticallymelting compounds, Mn2Nd (L+Mn23Nd6 ⇔ Mn2Nd, at 920 1C),Mn23Nd6 (L+Mn12Nd ⇔ Mn23Nd6, at 975 1C) and Mn12Nd (L+β-Mn⇔ Mn12Nd, at 1100 1C) were observed. Two compounds (Mn23Nd6and Mn12Nd) were confirmed with certainty. No evidence of Mn2Ndexistence was obtained by Kirchmayr and Lugscheider [11] usingdiffraction methods; it was suggested from DTA only and shown bydashed lines in Fig. 1(a). The compound Mn2RE, having a 2:1stoichiometric ratio, was observed and reported to occur in twostructure types: hexagonal MgZn2 (a¼5.574 Å and c¼9.082 Å) atroom temperature and monoclinic MgCu2 (a¼5.544 Å, b¼9.721 Å,c¼9.013 Å, and γ¼89.81) at �169 1C [5,7,12]. Another version ofMn–Nd phase diagram was introduced by Makhalenko and Kuz′ma[13] by means of X-ray diffraction, Fig. 1(b). Two intermediatephases, Mn2Nd and Mn23Nd6, were observed. In contrast withKirchmayr and Lugscheider [11], Mn2Nd was described as a lavesphase with narrow range of temperature for its stability and

Table 1Possible structural phases formed in Mn–RE systems [4–9].
Stoichiometry Condition Rare earth element (M) Prototype
Mn3M4 High pressure Yb Co3Ho4Mn2M High
temperatureSc, Nd, Sm, Er, Tm, Lu MgZn2
Y, Gd, Tb, Dy, Ho Cu2MgLowtemperature
Sc, Ho, Er, Tm, Lu MgZn2
Gd, Tb, Dy, Nd Cu2MgSm
High pressure Yb, Y, Gd, Tb, Dy, Ho MgZn2
Mn23M6 Hightemperature
Y, Pr, Nd, Sm, Gd, Tb, Dy, Ho, Er,Tm, Lu
Mn23Th6
Lowtemperature
Y, Sm, Gd, Tb, Dy, Ho, Er, Tm, Lu
High pressure YbMn5M Lu LuMn5
Mn17M2 High pressure Yb Ni17Th2
Mn12M Y, Gd, Tb, Dy, Ho, Er, Tm Mn12Th0
200
400
600
800
1000
1200
1400
Mn
1246
1021
11381100
727
975920
27.0
863
Tem
pera
ture
(°C
)
at % Mn
700
Nd
0
200
400
600
800
1000
1200
1400
Tem
pera
ture
(°C
)1021
836
1246
1100
975
600
727
~550
at% Mn
Mn
Nd
Mn
Nd
Mn
Nd
Mn
Nd
Mn
Nd
650
MnNd
0 10 20 30 40 50 60 70 80 90 100
0 10 20 30 40 50 60 70 80 90 100
200
400
600
800
1000
1200
1400
Tem
pera
ture
(°C
)
Mn
Nd
Mn
Nd
27.0
1021
863
~480
~580
695
820
1246
11381100
930
727
A.O. Mostafa et al. / CALPHAD: Computer Coupling of Phase Diagrams and Thermochemistry 42 (2013) 27–3728
undergoes eutectoid decomposition at �650 1C. Moreover,Mn23Nd6 was found in the range from 975 to 600 1C and to undergoeutectoid decomposition [13]. The liquidus line was modified byOkamoto [14,15], considering the requirements for the initial slopesof the terminal solid solutions, assuming similarity with the Mn–Prsystem. Saccone et al. [4] reinvestigated the 10 to 85 at% Mn partialMn–Nd phase diagram using SEM, DTA and XRD, as shown in Fig. 1(c). They reported that Mn2Nd and Mn23Nd6 formed peritectically at820 and 930 1C, respectively. Mn2Nd and Mn23Nd6 were tentativelysuggested to decompose eutectoidally at �580 and �480 1C,respectively. However, Liu et al. [16] using X-ray diffraction reportedthe existence of Mn12Nd intermetallic at 500 1C. Based on the DTAresults of Saccone et al. [4], the liquidus line was significantlylowered compared to that in both [11] and [13] phase diagrams.
Recently, the enthalpy of mixing of the liquid phases in theMn–Nd system was determined by Ivanov et al. [17] usingisoperibolic calorimetry. The obtained curve showed minimumand maximum at 90 and 40 at% Mn, respectively. More recently,the systemwas modeled by Kim and Jung [18]. In their model, theyadopted the experimental results obtained by Saccone et al. [4],because these results were more reliable from the thermody-namics point of view. They [18] assumed a solid solubility of 4.0 at% Mn in BCC-Nd at 736 1C.
The experimental data available in the literature were contra-dictory, and therefore, different Mn–Nd phase diagram versionswere put forward. Moreover, no concrete knowledge of the phaseequilibria at the composition extremes was established. The purposeof this work is to construct a self-consistent Mn–Nd phase diagramexperimentally by means of key samples and diffusion coupletechniques, using ICP, XRD, DSC, and SEM/EPMA. First-principlescalculations were employed to determine the enthalpies of formationof the system compounds. All the information obtained from thiswork as well as from the literature has enabled a complete thermo-dynamic optimization of this system.
0 10 20 30 40 50 60 70 80 90 1000
at% Mn MnNd
Fig. 1. The Mn–Nd phase diagrams established by (a) Kirchmayr and Lugscheider[11], (b) Makhalenko and Kuz′ma [13], and (c) Saccone et al. [4].
2. Experimental work
The starting materials were Mn metal flakes (purity, 99.95 wt%)and Nd metal ingots (purity, 99.9 wt%) supplied by Alfa Aesars,Johnson Matthey Company, Inc. Alloys (3–4 gm) were preparedusing an arc-melting furnace under argon atmosphere. The sam-ples were melted in a water-cooled copper crucible using a non-consumable tungsten electrode. Every alloy was melted severaltimes to ensure homogeneity. The actual global composition waschemically determined using an ULTIMA2 optical emission spec-trometer (OES) ICP. The samples were dissolved in concentrated
HNO3. The as-cast samples were cut into several divisions some ofwhich were placed in sealed alumina crucibles for thermalanalysis using SETARAM-Setsys1200 differential scanning calori-meter (DSC) for investigating the phase transformation andmelting temperatures. Different heating and cooling rates of 1, 5,10 and 15 1C/min were attempted for the DSC experiments to
A.O. Mostafa et al. / CALPHAD: Computer Coupling of Phase Diagrams and Thermochemistry 42 (2013) 27–37 29
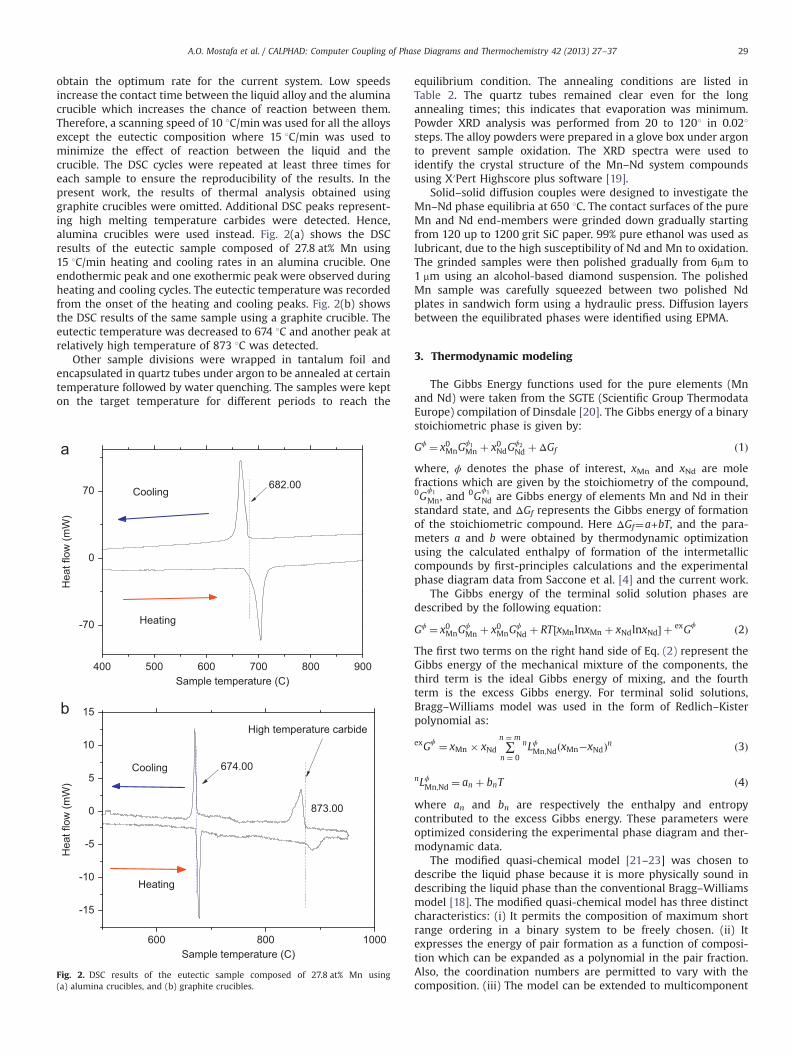
obtain the optimum rate for the current system. Low speedsincrease the contact time between the liquid alloy and the aluminacrucible which increases the chance of reaction between them.Therefore, a scanning speed of 10 1C/min was used for all the alloysexcept the eutectic composition where 15 1C/min was used tominimize the effect of reaction between the liquid and thecrucible. The DSC cycles were repeated at least three times foreach sample to ensure the reproducibility of the results. In thepresent work, the results of thermal analysis obtained usinggraphite crucibles were omitted. Additional DSC peaks represent-ing high melting temperature carbides were detected. Hence,alumina crucibles were used instead. Fig. 2(a) shows the DSCresults of the eutectic sample composed of 27.8 at% Mn using15 1C/min heating and cooling rates in an alumina crucible. Oneendothermic peak and one exothermic peak were observed duringheating and cooling cycles. The eutectic temperature was recordedfrom the onset of the heating and cooling peaks. Fig. 2(b) showsthe DSC results of the same sample using a graphite crucible. Theeutectic temperature was decreased to 674 1C and another peak atrelatively high temperature of 873 1C was detected.
Other sample divisions were wrapped in tantalum foil andencapsulated in quartz tubes under argon to be annealed at certaintemperature followed by water quenching. The samples were kepton the target temperature for different periods to reach the
400 500 600 700 800 900
-70
0
70 Cooling
Hea
t flo
w (m
W)
Sample temperature (C)
682.00
Heating
1000800600
-15
-10
-5
0
5
10
15High temperature carbide
873.00
Hea
t flo
w (m
W)
Sample temperature (C)
Cooling
Heating
674.00
Fig. 2. DSC results of the eutectic sample composed of 27.8 at% Mn using(a) alumina crucibles, and (b) graphite crucibles.
equilibrium condition. The annealing conditions are listed inTable 2. The quartz tubes remained clear even for the longannealing times; this indicates that evaporation was minimum.Powder XRD analysis was performed from 20 to 1201 in 0.021steps. The alloy powders were prepared in a glove box under argonto prevent sample oxidation. The XRD spectra were used toidentify the crystal structure of the Mn–Nd system compoundsusing X′Pert Highscore plus software [19].
Solid–solid diffusion couples were designed to investigate theMn–Nd phase equilibria at 650 1C. The contact surfaces of the pureMn and Nd end-members were grinded down gradually startingfrom 120 up to 1200 grit SiC paper. 99% pure ethanol was used aslubricant, due to the high susceptibility of Nd and Mn to oxidation.The grinded samples were then polished gradually from 6mm to1 mm using an alcohol-based diamond suspension. The polishedMn sample was carefully squeezed between two polished Ndplates in sandwich form using a hydraulic press. Diffusion layersbetween the equilibrated phases were identified using EPMA.
3. Thermodynamic modeling
The Gibbs Energy functions used for the pure elements (Mnand Nd) were taken from the SGTE (Scientific Group ThermodataEurope) compilation of Dinsdale [20]. The Gibbs energy of a binarystoichiometric phase is given by:
Gϕ ¼ x0MnGϕ1Mn þ x0NdG
ϕ2Nd þ ΔGf ð1Þ
where, ϕ denotes the phase of interest, xMn and xNd are molefractions which are given by the stoichiometry of the compound,0G
ϕ1
Mn, and0G
ϕ1
Nd are Gibbs energy of elements Mn and Nd in theirstandard state, and ΔGf represents the Gibbs energy of formationof the stoichiometric compound. Here ΔGf¼a+bT, and the para-meters a and b were obtained by thermodynamic optimizationusing the calculated enthalpy of formation of the intermetalliccompounds by first-principles calculations and the experimentalphase diagram data from Saccone et al. [4] and the current work.
The Gibbs energy of the terminal solid solution phases aredescribed by the following equation:
Gϕ ¼ x0MnGϕMn þ x0MnG
ϕNd þ RT ½xMnlnxMn þ xNdlnxNd� þ exGϕ ð2Þ
The first two terms on the right hand side of Eq. (2) represent theGibbs energy of the mechanical mixture of the components, thethird term is the ideal Gibbs energy of mixing, and the fourthterm is the excess Gibbs energy. For terminal solid solutions,Bragg–Williams model was used in the form of Redlich–Kisterpolynomial as:
exGϕ ¼ xMn � xNd ∑n ¼ m
n ¼ 0
nLϕMn;NdðxMn�xNdÞn ð3Þ
nLϕMn;Nd ¼ an þ bnT ð4Þ
where an and bn are respectively the enthalpy and entropycontributed to the excess Gibbs energy. These parameters wereoptimized considering the experimental phase diagram and ther-modynamic data.
The modified quasi-chemical model [21–23] was chosen todescribe the liquid phase because it is more physically sound indescribing the liquid phase than the conventional Bragg–Williamsmodel [18]. The modified quasi-chemical model has three distinctcharacteristics: (i) It permits the composition of maximum shortrange ordering in a binary system to be freely chosen. (ii) Itexpresses the energy of pair formation as a function of composi-tion which can be expanded as a polynomial in the pair fraction.Also, the coordination numbers are permitted to vary with thecomposition. (iii) The model can be extended to multicomponent

Table 2The experimental results obtained by ICP, DSC and EPMA.
Sample Actual composition (at%) Phase transformationtemperatures (1C)
Annealing Phase composition (at%)
Mn Nd T (1C) Days Phases Mn Nd
2.5 at% Mn 2.94 97.06 633796837968
5 at% Mn 4.6 95.4 644 400 74 DHCP-Nd 1.63 98.37783 Mn17Nd2 88.5 11.5868932
10 at% Mn 10.46 89.54 679 600 30 DHCP-Nd 1.2 98.8726 Mn2Nd 65 35857 Mn23Nd6 77.5 32.5
15 at% Mn 15.41 84.59 682 600 30 DHCP-Nd 1.19 98.81725 Mn2Nd 65.5 34.5790 Mn23Nd6 78.0 22.0
20 at% Mn 21.96 78.04 685746
27 at% Mn 27.8 72.2 68235 at% Mn 36.66 63.34 685
76445 at% Mn 45.59 54.41 682
82355 at% Mn 53.27 46.73 685
850889
65 at% Mn 64.23 35.77 685 Nd 1.0 99.0851 650 30 DHCP-Nd 2.16 97.84936 Mn2Nd 66.5 33.5
550 21 DHCP-Nd 1.86 98.14Mn23Nd6 78.9 21.1
75 at% Mn 75.58 24.42 819 750 31 Mn2Nd 66.5 33.5849 Mn23Nd6 79.3 20.7944 600 30 Mn2Nd 66.3 33.7999 Mn23Nd6 79.3 20.7
Mn17Nd2 87.3 12.787 at% Mn 86.54 13.46 726 750 31 Mn23Nd6 79.3 20.7
945 Mn17Nd2 89.3 10.71025 600 30 Mn23Nd6 79.5 20.51072 Mn17Nd2 89.5 10.5
Mn 100 0400 68 DHCP-Nd - -
Mn23Nd6 78 22Mn17Nd2 88.5 11.5Mn 100 0
88.5 at% Mn 88.1 11.9 730 600 68 Mn23Nd6 79.5 20.5944 Mn17Nd2 89.5 10.51026 Mn 100 01090
400 68 DHCP-Nd - -Mn23Nd6 79.5 20.5Mn17Nd2 89.5 10.5Mn 100 0
92 at% Mn 92.41 7.59 724 750 31 Mn17Nd2 89.5 10.5956 Mn 100 0
10661119 600 30 Mn23Nd6 79.5 20.51136 Mn17Nd2 89.5 10.5
Mn 100 0400 74 Mn23Nd6 79 21
Mn17Nd2 89 11Mn 100 0
96 at% Mn 95.42 4.58 728102210551193
A.O. Mostafa et al. / CALPHAD: Computer Coupling of Phase Diagrams and Thermochemistry 42 (2013) 27–3730
systems. For instance, the Mn–Nd system is a constituent binary ofthe Mg–Mn–Nd ternary system; the liquid phase of the otherbinaries (Mg–Nd and Mg–Mn) was described using the modifiedquasi-chemical model. Therefore, it is preferable to model the Mn–Nd liquid using the modified quasi-chemical model for extrapola-tion compatibility. The model has been discussed extensively in
the literature [21–23] and will be outlined briefly here. Accordingto [21], the Gibbs energy for a solution is given by:
g¼ ðnMng0Mn þ nNdg0NdÞ�TΔSconfig þ ðnMnNd=2ÞΔgMnNd ð5Þ
where g0Mn and g0Nd are the molar Gibbs energies of the puremetals, ΔSconfig is the configurational entropy of mixing given by

A.O. Mostafa et al. / CALPHAD: Computer Coupling of Phase Diagrams and Thermochemistry 42 (2013) 27–37 31
randomly distributing the (Mn–Mn), (Nd–Nd) and (Mn–Nd) pairs.The energy of pair formation can be expressed by the followingequation:
ΔgMnNd ¼Δg0MnNd þ ∑Mn≥1
gMn0MnNdX
MnMnMn þ ∑
Nd≥1g0NdMnNdX
NdNdNd ð6Þ
where, Δg0MnNd, ΔgMn0MnNd and Δg0NdMnNd are the parameters of the
model and can be expressed as functions of temperatureΔg0MnNd ¼ aþ bT . Where a and b are the enthalpy and entropycontributed to the Gibbs energy, respectively. Also, the atom toatom coordination numbers ZMn and ZNd, can be expressed asfunction of composition as:
1ZMn
¼ 1
ZMnMnMn
2nMnMn
2nMnMn þ nNdMn
� �þ 1
ZMnMnNd
nMnNd
2nMnMn þ nMnNd
� �ð7Þ
1ZNd
¼ 1
ZNdNdNd
2nNdNd
2nNdNd þ nMnNd
� �þ 1
ZNdMnNd
nMnNd
2nNdNd þ nMnNd
� �ð8Þ
where nMnNd is the number of moles of (Mn–Nd) pairs, ZMnMnMn and
ZMnMnNd are the coordination numbers when all nearest neighbours
of an Mn atom are Mn or Nd atoms, respectively. The valuesof ZMn
MnNd and ZNdNdMn are unique to the Mn–Nd binary system and
should be carefully determined to fit the thermodynamic experi-mental data. In this work, 3 and 6 have been used for ZMn
MnNd andZNdNdMn, respectively because these gave the best possible fit for
the current system. Kim and Jung [18] also used same coordina-tion numbers during their optimization. The coordination numberof 6 has been used for both ZMn
MnMn and ZNdNdNd since it has been
used successfully during optimization of many binary systems[18,21–23].
4. First-principles calculations
Except for the enthalpy of mixing of the liquid phase [17], thereare no reports on experimental thermochemical data on thesystem. The only available values for the enthalpy of formationof the compounds were obtained by thermodynamic calculationsusing CALPHAD method [18]. Therefore, in this work, numericalestimation was carried out to evaluate the enthalpy of formation ofthe compounds in Mn–Nd system.
The first-principles calculations were performed using theplane wave pseudopotential method within the framework of
Fig. 3. The optimized Mn–Nd phase diagram along with DSC results of the curren
the density functional theory (DFT) as implemented in theABINIT package [24]. A norm conserving Troullier–Martinspseudopotential [25] was employed with electronic configurationsof Mn 3d54s2 and Nd 4f46s2. The generalized gradient approxima-tion (GGA) according to the recipe of Perdew et al. [26] was usedfor the exchange correlation functional. In the present calculations,the plane-wave cut-off energy was set to be 440 eV. The specialpoints sampling integration over the Brillouin zone was employedby using the Monkhorst–Pack (MP) method [27] with the follow-ing k-point mesh: 4�4�4 for Mn, 3�3�2 for Nd, 3�3�2 forMn2Nd, 4�4�4 for Mn23Nd6, and 3�3�2 for Mn17Nd2. ThePulay scheme of density mixing was applied for the evaluation ofenergy [28]. The calculation of total energy and electronic struc-ture were followed by cell optimization with the self-consistent-field (SCF) tolerance of 3�10�3 eV/cell. The final total obtainedtotal energies are used to calculate the enthalpy of formation ofeach compound at 0 K using the following equation:
ΔHðMnnNdmÞ ¼EðMnnNdmÞ�mE0ðMnÞ�nE0ðNdÞ
nþmð9Þ
where E is the calculated total energy of the compound and E0 isthe total energy of the elements in their standard reference state.Each structure is fully relaxed to their equilibrium geometry. Allatomic positions in the lattice were relaxed according to the totalenergy and force using the BFGS [27] scheme based on the celloptimization criterion (RMS force of 0.01 eV/Å, stress of 0.05 GPa).
5. Results and discussion
5.1. Experimental results
The entire composition range of the Mn–Nd system was investigated experi-mentally by means of ICP, XRD, DSC, and SEM/EPMA techniques. 15 key samplesof collected compositions and a solid–solid diffusion couple of Mn to Ndend-members were annealed and analyzed. The experimental results of phasetransformations and phase identification based on DSC and EPMA studies aresummarized in Table 2.
5.1.1. The Mn–Nd liquidusThe phase transformation temperatures obtained by DSC experiments were
recorded based on the best match between the onset peaks of heating and coolingcycles. Fig. 3 shows results of Saccone et al. [4], and the liquidus line of Kirchmayrand Lugscheider [11] superimposed on the experimental results and there-optimized phase diagram from the current work.
(δMn)(γMn)
(βMn)
(αMn)
t work, the partial Mn–Nd phase diagram of [4] and the liquidus line of [11].
Mn2Nd
Mn23Nd6
Mn17Nd2
Mn23Nd6
A.O. Mostafa et al. / CALPHAD: Computer Coupling of Phase Diagrams and Thermochemistry 42 (2013) 27–3732
The pure Nd was found to melt at 1021 1C and undergoes a DHCP-BCC phasetransformation at 862 1C. These temperatures agree with the ones reported inMassalski [29]. On the other hand, pure Mn melts at 1246 1C and undergoes threepolymorphic transformations, α-β at 727 1C, β-γ at 1100 1C, and γ-δ at 1138 1C.Based on the similarity with the Mn–Pr [3] and Ce–Mn [30] systems and on thecurrent results, Nd-rich alloys exhibit a peritectic reaction L+DHCP-Nd⇔BCC-Nd at728 1C. The solubility of Mn in BCC-Nd at this temperature was estimated to be5.0 at% Mn. In addition, the terminal solid solubility of Mn in DHCP-Nd wasdetermined at the 685 1C eutectic temperature to be 2.3 at% Mn. The allotropictransformation temperatures in the Mn-rich side were unaffected by the additionof Nd. This was confirmed by thermal analysis of two Mn-rich alloys; 92 and 96 at%Mn using DSC. The thermal arrests associated with the Mn allotropic transforma-tions, obtained in this work, agree very well with the values reported by Palenzonaand Cirafici [31]. The negligible solubility of Nd in Mn was confirmed by EPMAstudies of the Mn-rich samples in both as-cast and annealed conditions.
To conform with Okamoto′s [14] suggestion, the limiting slope of the liquidusboundaries [32,33] closer to the Nd terminal side, was modified based on thecurrent DSC results. This modification supports the presence of BCC-Nd solidsolution. The DSC experiments of all sample compositions showed a lower liquidusline than that reported in the work of [11,13] and agree with the DTA results ofSaccone et al. [4].
From Table 2, the DSC measurements associated with the extension of γ-Mntransformation line in the Mn-rich alloys containing 88.5, 92, and 96 at% Mn wererecorded at less than 1100 1C. That might be attributed to the supercooling effect.Because these alloys have high melting temperature, the amount of overheating ofthe melt affects the nucleation and growth of crystals of different phases uponcooling [34]. As a result, a significant shift in the DSC peaks can be observed.
5.1.2. The DHCP-Nd–Mn2Nd eutecticThe temperature of the DHCP-Nd–Mn2Nd eutectic (27 at% Mn) was determined
to be 685 1C, which is considerably lower than the reported value by Saccone et al.[4] of 695 1C. The latter value, however, varied slightly, from 700 1C [11,13] to695 1C.
A sample with actual composition of 27.8 at% Mn furnace cooled from the meltgave the eutectic microstructure shown in Fig. 4. Both fine and coarse eutecticdendrites were observed. The fine eutectic dendrites are in the form of twoalternating layers of DHCP-Nd and Mn2Nd. The coarse eutectic dendrites formeddue to the shift in sample composition by 0.8 at% from the actual eutecticcomposition of 27.0 at% Mn that is confirmed in the literature [4,11,13]. Becauseof the shift in composition, Mn2Nd precipitated first to form coarse dendrites (theblack phase in Fig. 4).
5.1.3. The intermetallic compoundsThree intermetallic compounds (Mn2Nd, Mn23Nd6, and Mn17Nd2) peritectically
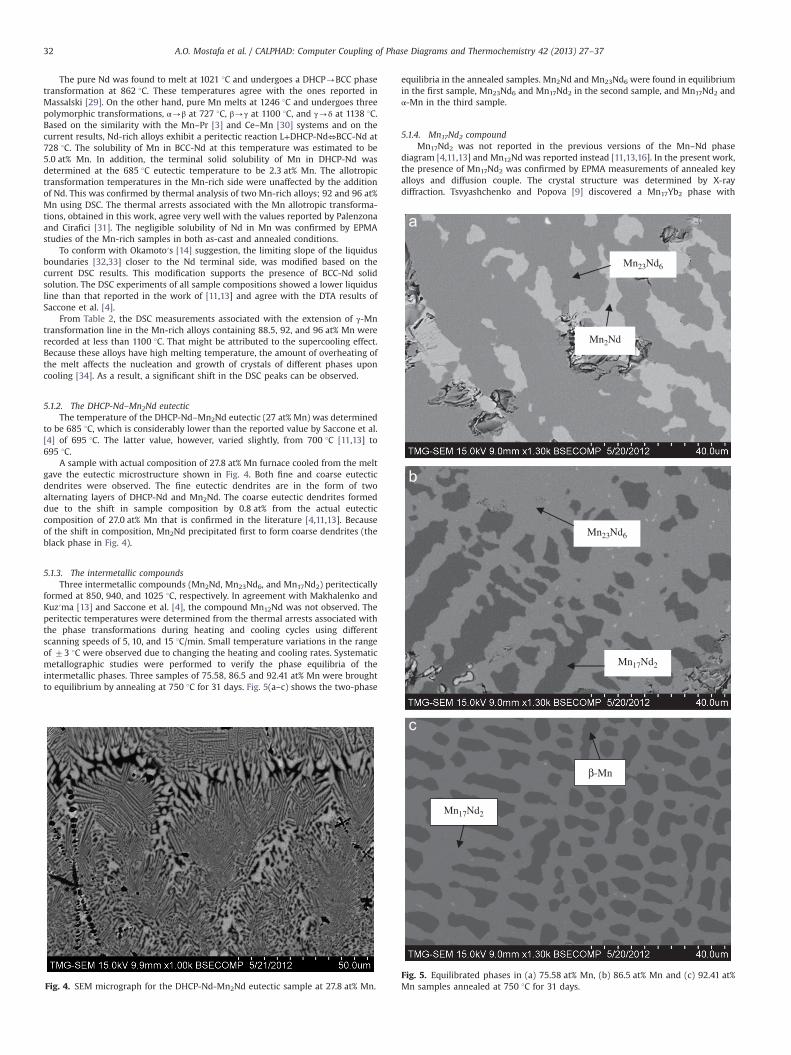
formed at 850, 940, and 1025 1C, respectively. In agreement with Makhalenko andKuz′ma [13] and Saccone et al. [4], the compound Mn12Nd was not observed. Theperitectic temperatures were determined from the thermal arrests associated withthe phase transformations during heating and cooling cycles using differentscanning speeds of 5, 10, and 15 1C/min. Small temperature variations in the rangeof 73 1C were observed due to changing the heating and cooling rates. Systematicmetallographic studies were performed to verify the phase equilibria of theintermetallic phases. Three samples of 75.58, 86.5 and 92.41 at% Mn were broughtto equilibrium by annealing at 750 1C for 31 days. Fig. 5(a–c) shows the two-phase
Fig. 4. SEM micrograph for the DHCP-Nd-Mn2Nd eutectic sample at 27.8 at% Mn.
equilibria in the annealed samples. Mn2Nd and Mn23Nd6 were found in equilibriumin the first sample, Mn23Nd6 and Mn17Nd2 in the second sample, and Mn17Nd2 andα-Mn in the third sample.
5.1.4. Mn17Nd2 compoundMn17Nd2 was not reported in the previous versions of the Mn–Nd phase
diagram [4,11,13] and Mn12Nd was reported instead [11,13,16]. In the present work,the presence of Mn17Nd2 was confirmed by EPMA measurements of annealed keyalloys and diffusion couple. The crystal structure was determined by X-raydiffraction. Tsvyashchenko and Popova [9] discovered a Mn17Yb2 phase with
Mn17Nd2
β-Mn
Fig. 5. Equilibrated phases in (a) 75.58 at% Mn, (b) 86.5 at% Mn and (c) 92.41 at%Mn samples annealed at 750 1C for 31 days.

A.O. Mostafa et al. / CALPHAD: Computer Coupling of Phase Diagrams and Thermochemistry 42 (2013) 27–37 33
Th2Ni17 type structure (Table 1). They proposed that the phase was formed at highpressure of 7.7 GPa and a temperature of 1200 1C. Fig. 6 shows the peritecticformation of Mn17Nd2, according to the equilibrium reaction Mn17Nd2 ⇔ L+β-Mn at1025 1C, from a sample containing 88.5 at% Mn annealed at 850 1C for 31 days.
Moreover, the compound was observed as a thin layer in the Mn–Nd diffusioncouple annealed at 650 1C for 30 days. The composition profile was measuredacross the diffusion layers using EPMA. Fig. 7 shows the formation of Mn17Nd2 as athin layer between the Mn23Nd6 layer and Mn end-member. The compositionprofile revealed that the phase exists with the composition of 89.5 at% Mn, whichcorresponds to the Mn:Nd 17:2 stoichiometry. No evidence of solubility of Nd in Mnup to 850 1C was detected.
Further confirmation of the existence of Mn17Nd2 was obtained from the XRDresults of a sample containing 92 at% Mn annealed at 400 1C for 74 days. The XRDspectrum of Fig. 8 shows peaks of a small amount of Mn23Nd6, pure Mn, andMn17Nd2. This was also confirmed using EPMA studies on the annealed sampleshown in Fig. 9.
β-Mn Mn17Nd2
Mn23Nd6
Fig. 6. The peritectic formation of Mn17Nd2.
0 10 20 30 40
0
20
40
60
80
100
Distance
Mn
(at.%
)
Nd Mn2Nd
α-N
d
Mn17Nd2
Mn23Nd6
Mn2Nd
Nd-dhcp
Nd
Mn
10µm
Fig. 7. (a) and (b) SEM micrograph of Mn–Nd diffusion couple annealed at 650 1C for 30diffusion couple.
Three phases were seen in the binary alloy shown in Fig. 9 because the alloys inthis system need very long annealing time to reach equilibrium due to the presenceof many peritectic reactions. For example in this micrograph, it can be seen that 74days were not enough for the complete peritectic formation of the Mn17Nd2
compound.X-ray diffraction analysis revealed the structure type of Mn17Nd2 as Zn17Th2
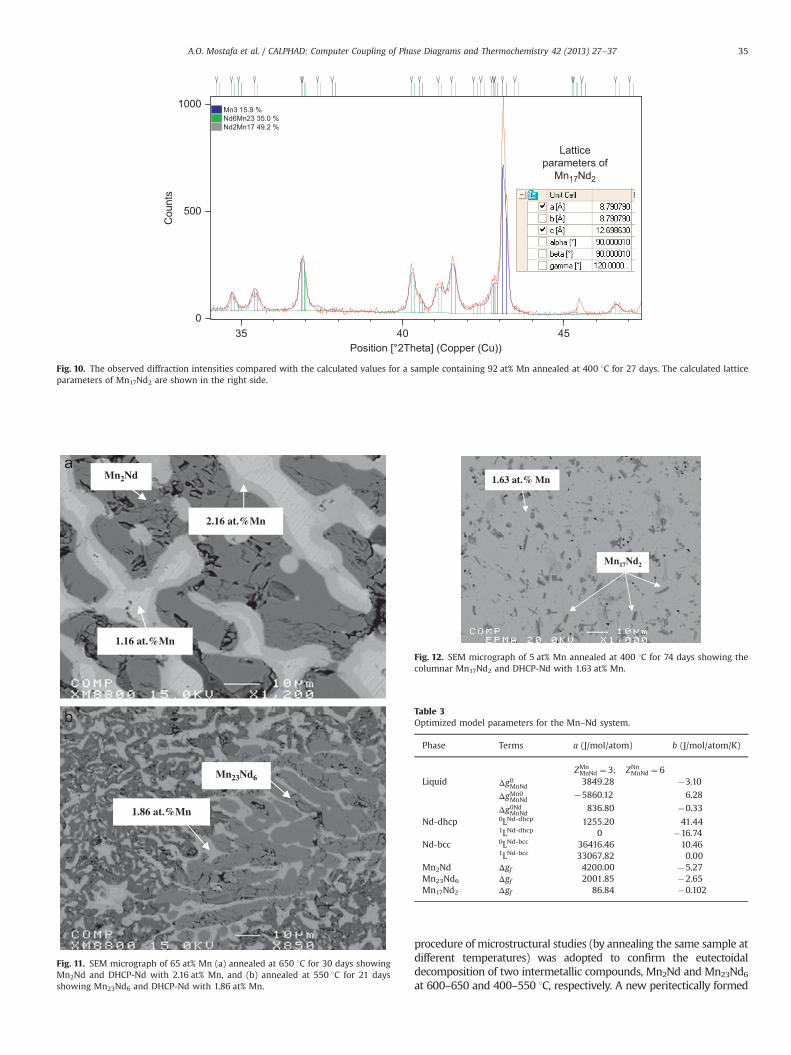
with a¼8.79085 Å and c¼12.6979 Å. The lattice parameters were computedthrough a least-square interpolation using X′pert Highscore plus software [19]. Inall XRD experiments, Rietveld quantitative analysis was performed to measure therelative amounts of the phases existing in each sample as shown in Fig. 10.
5.1.5. Mn2Nd and Mn23Nd6 eutectoidal decompositionIn agreement with Saccone et al. [4], Mn2Nd and Mn23Nd6 were found to
decompose eutectoidally at �580 and �480 1C, respectively. Because of thedifficulty of detecting the solid–solid phase transformation temperatures [35], theeutectoidal decomposition temperatures could not be determined by DSC experi-ments, even at very slow scanning speeds. Therefore, the eutectoidal decompositionsof Mn2Nd and Mn23Nd6 were determined using systematic annealing and quenchingprocedures. The decomposition range of Mn2Nd was determined to be in thetemperature range of 600–650 1C. The 65 at% Mn sample was annealed at 650 1Cfor 30 days in the same quartz tube capsule as a diffusion couple designed to beannealed for 30 days. The EPMA results showed that Mn2Nd was in equilibriumwithan DHCP-Nd solid solution containing 2.16 at% Mn. Another sample with the samecomposition was annealed at 550 1C for 21 days since the annealing time was foundsufficient to reach equilibrium. In case that the equilibrium was not reached, thesamples must be returned to the furnace for longer annealing time. The micro-structure shows that Mn23Nd6, instead of Mn2Nd, is in equilibrium with DHCP-Nd,containing 1.86 at% Mn, as shown in Fig. 11(a) and (b).
For the above-mentioned sample, the equilibrium was reached at 550 1C after21 days of annealing due to the fast reformation of Mn23Nd6 phase, since the caststructure contained larger amount of Mn23Nd6. However, at 650 1C, 30 days ofannealing were necessary to form Mn2Nd compound through a solid-state reactionwhich requires longer time to achieve.
The eutectoidal decomposition range of Mn23Nd6 was confirmed to be in thetemperature range of 400–550 1C, by bringing the Nd-rich sample of 5 at% Mn toequilibrium by annealing at 400 1C for 74 days. Very fine phase features wereobserved because of the dominant DHCP-Nd solid solution. Among these finefeatures, Mn17Nd2 formed a needle-like morphology within an DHCP-Nd solidsolution matrix containing 1.63 at% Mn, as shown in Fig. 12. No traces of Mn23Nd6
could be found in this sample after annealing.
50 60 70 80(μm)
0
20
40
60
80
100
Mn 23
Nd 6
Mn 17
Nd 2
Nd (at.%
)
Mn
Mn23Nd6
Mn17Nd2
Mn
Mn2Nd10µm
days showing the three intermetallics, and (c) the composition profile of the same

30 40 50
0
200
400
600
800
1000 Si Mn23Nd6α−Mn Mn17Nd2
Inte
nsity
2 Theta
Fig. 8. XRD spectrum of 92 at% Mn sample powder annealed at 400 1C for 27 days.
β-Mn
Mn17Nd2
Mn23Nd6
Fig. 9. Sample of 92 at% Mn annealed at 400 1C for 74 days. The peritectic structureof Mn dendrites surrounded by Mn17Nd2, and the brighter phase is the Mn23Nd6.
A.O. Mostafa et al. / CALPHAD: Computer Coupling of Phase Diagrams and Thermochemistry 42 (2013) 27–3734
It was pointed out by [3,4,13] that the phase transformation rates in this type ofalloys are very slow; hence, annealing for long times was required to haveequilibrated samples. Despite the long annealing time, the binary alloys werefound to attain more than two phases at lower temperatures. Hence, the phasemorphologies and phase equilibria were understood through annealing the samesample at different temperatures. Three phases were observed in the twohypoeutectic samples; namely, 10 and 15 at%, after annealing at 600 1C for 30 days.According to the phase equilibria and the samples compositions, it is impossible tohave the compound Mn23Nd6 during solidification. The phase existence wasproposed due to the eutectoidal decomposition of the Mn2Nd at 600 1C. Becauseof the slow solid–solid transformation kinetics, three phases were observed due tothe incomplete decomposition of Mn2nd to Mn23Nd6. However, this can providemore confidence on the Mn2Nd eutectoidal decomposition.
Some authors [4,13] reported the formation of a ThMn12-type structure for aternary compound when using Al2O3 crucibles for thermal analysis experiments. Inthe present work, the DSC experiments were carried out on the full range of systemcompositions using Al2O3 crucibles. No traces of a Mn12Nd phase were observed byeither XRD or EPMA studies. The maximum solubility of 2.3 at% Mn in DHCP-Nd,observed by the EPMA study on the eutectic sample containing 27.8 at% Mn, in theas-cast condition. In contrast, the maximum solubility of Mn in BCC-Nd wasdetermined as 5.0 at% Mn by extrapolating from the DSC results.
5.2. Thermodynamic modeling
The Mn–Nd system has been thermodynamically modeled using the CALPHADapproach. FactSage software 6.3 was used for the thermodynamic optimization. Theexperimental data for the enthalpy of mixing of the liquid was obtained fromIvanov et al. [17]. The enthalpy of formation of the intermetallic compounds wasestimated using first-principles calculations. These values were used as preliminaryapproximation during optimization. Also, the experimental phase diagram datawere provided from the current work and from Saccone et al. [4]. The calculatedphase diagram in Fig. 3 shows reasonable agreement with the experimental data.However, it deviates from those of Kirchmayr and Lugscheider [11] who reported
higher liquidus for the entire composition range. The optimized parameters for theliquid, terminal solid solutions and intermetallic compounds are given in Table 3.The invariant equilibria in the Mn–Nd system are given in Table 4. The maximumsolubility of Mn in DHCP-Nd has been calculated as 2.3 at% at the eutectictemperature. The solubility of Nd in Mn is negligible and is not recorded here.The eutectic reaction occurs at 685 1C and 27 at% Mn.
The DSC curves were analysed carefully. No clear peaks indicating the solid–solid transformation were detected. Therefore, no experimental points associatedwith the eutectoidal decomposition of the two compounds Mn2Nd and Mn23Nd6
were shown in the optimised phase diagram in Fig. 3. However, the decompositiontemperature ranges were obtained through a series of annealing and quenchingexperiments.
Ivanov et al. [17] measured the partial enthalpy of mixing of Nd in the range of0 to 25 at% of Nd and that of Mn from 42 at% to the pure Nd. Their [17] reportedvalues were used during the optimization process. As it can be seen in Fig. 13(a), thepresent calculation can reproduce the partial enthalpies of Nd and Mn within theexperimental error. Based on their experimental data, Ivanov et al. [17] also,calculated the integral enthalpy of mixing of the entire Mn–Nd liquid assumingthat the change of partial enthalpy is negligible in the temperature range between1550 and 1600 K. The enthalpy of mixing curve produced in this work showsreasonable agreement with these results [17] as shown in Fig. 13(b).
First-principles calculations were used to determine the enthalpy of formationof the intermetallic compounds. The calculated values were used as first approx-imation during optimization of the system. The values were adjusted to achieveconsistency between the calculated and experimentally obtained phase diagrams.First-principles calculations were found in reasonable agreement with the currentCALPHAD results except for Mn17Nd2. The calculated values of enthalpy offormation using first-principles calculations, and CALPHAD are summarized inTable 5.
Fig. 14 shows a comparison between the enthalpy of formation of theintermetallic compounds obtained using CALPHAD approach and first-principlescalculations in this work compared to those reported in the work of Kim and Jung[18].
5.3. First-principles calculations
First-principles calculations were used to determine the enthalpy of formationof the intermetallic compounds. The calculated values were used as first approx-imation during optimization of the system. The values were adjusted to achieveconsistency between the calculated and experimentally obtained phase diagrams.First-principles calculations were found in reasonable agreement with the currentCALPHAD results except for Mn17Nd2. The calculated values of enthalpy offormation using first-principles calculations, and CALPHAD are summarized inTable 5.
6. Summary
A self-consistent Mn–Nd phase diagram was obtained based onexperimental investigation and thermodynamic modeling. A diffu-sion couple from pure Mn to pure Nd was annealed at 650 1C and 15key samples were investigated using ICP, DSC, XRD, and SEM/EPMA.The peritectic formation of the intermetallic compounds was con-firmed. The liquidus line was reassessed using DSC. The limitingslopes of the new liquidus support the existence of BCC-Nd solidsolution. The composition profiles obtained from the diffusion couplerevealed the presence of the three intermetallic compounds, as wellas the terminal solid solubility of Mn in DHCP-Nd. A systematic
Position [°2Theta] (Copper (Cu))35 40 45
Cou
nts
0
500
1000Mn3 15.9 %Nd6Mn23 35.0 %Nd2Mn17 49.2 %
Latticeparameters of
Mn17Nd2
Fig. 10. The observed diffraction intensities compared with the calculated values for a sample containing 92 at% Mn annealed at 400 1C for 27 days. The calculated latticeparameters of Mn17Nd2 are shown in the right side.
Mn2Nd
2.16 at.%Mn
1.16 at.%Mn
Mn23Nd6
1.86 at.%Mn
Fig. 11. SEM micrograph of 65 at% Mn (a) annealed at 650 1C for 30 days showingMn2Nd and DHCP-Nd with 2.16 at% Mn, and (b) annealed at 550 1C for 21 daysshowing Mn23Nd6 and DHCP-Nd with 1.86 at% Mn.
Mn17Nd2
1.63 at.% Mn
Fig. 12. SEM micrograph of 5 at% Mn annealed at 400 1C for 74 days showing thecolumnar Mn17Nd2 and DHCP-Nd with 1.63 at% Mn.
Table 3Optimized model parameters for the Mn–Nd system.
Phase Terms a (J/mol/atom) b (J/mol/atom/K)
ZMnMnNd ¼ 3; ZNn
MnNd ¼ 6Liquid Δg0MnNd
3849.28 �3.10
ΔgMn0MnNd
�5860.12 6.28
Δg0NdMnNd836.80 �0.33
Nd-dhcp 0LNd-dhcp 1255.20 41.441LNd-dhcp 0 �16.74
Nd-bcc 0LNd-bcc 36416.46 10.461LNd-bcc 33067.82 0.00
Mn2Nd Δgf 4200.00 �5.27Mn23Nd6 Δgf 2001.85 �2.65Mn17Nd2 Δgf 86.84 �0.102
A.O. Mostafa et al. / CALPHAD: Computer Coupling of Phase Diagrams and Thermochemistry 42 (2013) 27–37 35
procedure of microstructural studies (by annealing the same sample atdifferent temperatures) was adopted to confirm the eutectoidaldecomposition of two intermetallic compounds, Mn2Nd and Mn23Nd6at 600–650 and 400–550 1C, respectively. A new peritectically formed

Table 4Comparison between the experimental and calculated invariant points in the Mn–Nd phase diagram.
Reaction Reaction type Experimental points Calculated points
T (1C) x (Mn) T (1C) x (Mn)
L⇔Mn2Nd+DHCP-Nd Eutectic 685 0.278 0.660 0.023 682 0.268 0.660 0.022L+Mn23Nd6⇔ Mn2Nd Peritectic 850 0.525 0.791 0.660 849 0.523 0.791 0.660L+Mn17Nd2⇔ Mn23Nd6 Peritectic 940 0.676 0.895 0.791 958 0.670 0.895 0.791L+βMn⇔ Mn17Nd2 Peritectic 1025 0.781 1.00 0.895 1025 0.780 1.00 0.895BCC-Nd⇔ DHCP-Nd+L Peritectic 728 0.050 0.023 0.221 728 0.045 0.022 0.220Mn2Nd⇔ Mn23Nd6+ DHCP-Nd Eutectoid �600 0.660 0.791 0.023 561 0.660 0.791 0.022Mn23Nd6⇔ Mn17Nd2+ DHCP-Nd Eutectoid �500 0.791 0.895 0.023 485 0.791 0.895 0.022
0.0 0.1 0.2 0.3 0.4 0.5 0.6 0.7 0.8 0.9 1.0
0.0 0.1 0.2 0.3 0.4 0.5 0.6 0.7 0.8 0.9 1.0
-8
-6
-4
-2
0
2
4
6
8
10 Mn (Ivanov et al.)Nd (Ivanov et al.)Mn (This work)Nd (This work)
Part
ial e
ntha
lpy
of m
ixin
g (k
J/m
ole.
atom
)
Nd (Mole fraction)
-1.0
-0.5
0.0
0.5
1.0
1.5
2.0
2.5
3.0
Hea
t of m
ixin
g at
160
0K (k
J/m
ol.a
tom
)
Nd (Mole fraction)
Ivanov et al., 2011This work
Fig. 13. Calculated (a) partial enthalpies of mixing of liquid Mn–Nd, and (b) integralenthalpy of mixing of liquid Mn–Nd at 1600 K compared with [7].
Table 5The calculated values of enthalpy of formation using different approaches.
Phase Space group Enthalpy of formation kJ/mol atom
First principles CALPHAD
Mn2Nd P63/mmc 3.65 4.2Mn23Nd6 Fm-3m 2.15 2.002Mn17Nd2 P63/mmc 1.25 0.087
0.0 0.1 0.2 0.3 0.4 0.5 0.6 0.7 0.8 0.9 1.0
0
1
2
3
4
5
6
Hea
t of f
orm
atio
n (k
J/m
ol-1
.ato
m)
Nd (Mole fraction)
CALPHAD (this work)Kim and Jung, 2012 [18]First-principle (this work)
Mn 1
7Nd 2Mn 2
3Nd 6
Mn 2
Nd
Fig. 14. Calculated enthalpy of formation of Mn–RE compounds using CALPHADapproach and first-principles calculations compared with the literature data [18].
A.O. Mostafa et al. / CALPHAD: Computer Coupling of Phase Diagrams and Thermochemistry 42 (2013) 27–3736
compound with Zn17Th2-type structure was observed in the Mn-richside. The phase was assigned Mn17Nd2 formula based on EPMA andXRD studies. First-principles calculations and CALPHAD method wereperformed to evaluate the enthalpy of formation of the compounds.The modified quasi-chemical model was used to describe the liquidphase, the terminal solid solution phases in the Nd side weredescribed as substitutional solutions using the random mixing model,
and the three intermetallic phases were treated as stoichiometriccompounds. A self-consistent set of parameters was obtained usingCALPHAD approach, which can produce the phase diagram andthermodynamic properties within experimental error and in generallygood agreement with the first-principles calculations.
Acknowledgement
The authors acknowledge NSERC for financial support of theproject through MagNET network for excellence. Computationalresources for this work were provided by the Réseau québécois decalcul de haute performance (RQCHP).
Appendix A. Supplementry material
Supplementary data associated with this article can be foundin the online version at http://dx.doi.org/10.1016/j.calphad.2013.07.004.

A.O. Mostafa et al. / CALPHAD: Computer Coupling of Phase Diagrams and Thermochemistry 42 (2013) 27–37 37
References
[1] Wellbeloved D., Craven P., Waudby J. Manganese and manganese alloys, in:Ullmann′s Encyclopedia of Industrial Chemistry: Wiley-VCH Verlag GmbH &Co.; 2000.
[2] Matricardi L., Downing J. Manganese and manganese alloys, in: Kirk-OthmerEncyclopedia of Chemical Technology: John Wiley & Sons, Inc.; 2000, pp. 1-27.
[3] A. Saccone, S. Delfino, R. Ferro, Alloying behaviour of manganese with basicmetals: Pr–Mn system, J. Less-Common Met. 108 (1985) 89–105.
[4] A. Saccone, S. Delfino, R. Ferro, Systematics of rare earth-manganese alloys:Nd–Mn phase diagram, Z. Metallkd. 84 (1993) 563–568.
[5] Y. Tagawa, J. Sakurai, Y. Komura, H. Wada, M. Shiga, Y. Nakamura, X-ray studyof crystal distortions in RMn2 compounds (R: Y, Pr, Nd, Sm and Gd), J. Phys.Soc. Jpn. 54 (1985) 591–597.
[6] P. Kripyakevich, D. Frankevich, Y. Voroshilov, Compounds with Th6Mn23-typestructures in alloys of the rare-earth metals with manganese and iron, PowderMetall. Met. Ceram. 4 (1965) 915–919.
[7] M. Teslyuk, P. Kripyakevich, P. Frankevich, New laves phases containingmanganese, Sov. Phys.: Crystallogr. 9 (1965) 558–559.
[8] J. Wernick, S. Haszko, Manganese rare earth compounds with the MgZn2
structure, J. Phys. Chem. Solids 18 (1961) 207–209.[9] A. Tsvyashchenko, S. Popova, High pressure phases in the Mn–Yb system,
J. Less-Common Met. 90 (1983) 211–215.[10] J. Bohlen, S. Yi, D. Letzig, K.U. Kainer, Effect of rare earth elements on the
microstructure and texture development in magnesium–manganese alloysduring extrusion, Mater. Sci. Eng., A 527 (2010) 7092–7098.
[11] H. Kirchmayr, W. Lugscheider, Die Zustandsbilder Neodym-Samarium- undTerbium-Mangan, Z. Metallkd. 61 (1970) 22–23. (German).
[12] J. Gröbner, A. Pisch, R. Schmid-Fetzer, Thermodynamic optimization of thesystems Mn–Gd and Mn–Y using new experimental results, J. Alloys Compd.317–318 (2001) 433–437.
[13] S. Makhalenko, Y. Kuz′ma, X-ray diffraction investigations of the Nd–Mnsystem, Izv. Akad. Nauk. SSSR, Neorg. Mater. 26 (1990) 2432–2433.
[14] H. Okamoto, Mn–Nd (Manganese–Neodymium), J. Phase Equilib. 13 (1992)331–332.
[15] H. Okamoto, Comment on Mn–Nd (Manganese–Neodymium), J. Phase Equilib.15 (1994) 568–569.
[16] J. Liu, W. Liu, L. Wang, Isothermal section of Er–Mn–Nd ternary system at773 K, J. Rare Earths 24 (2006) 582–586.
[17] M. Ivanov, V. Berezutski, N. Usenko, Mixing enthalpies in liquid alloys ofmanganese with the lanthanides, Int. J. Mater. Res. 102 (2011) 277–281.
[18] J. Kim, I.-H. Jung, Critical systematic evaluation and thermodynamic optimiza-tion of the Mn–RE system: RE¼La, Ce, Pr, Nd and Sm, J. Alloys Compd. 525(2012) 191–201.
[19] PANalytical, Ver2.2b (2.2.2). In, Almelo, The Netherlands; 01-11-2006.[20] A. Dinsdale, SGTE data for pure elements, Calphad 15 (1991) 317–425.[21] A. Pelton, S. Degtrov, G. Eriksson, C. Robelin, Y. Dessureault, The modified
quasi-chemical model: Part I. Binary solutions, Metall. Mater. Trans. 31B(2000) 651–659.
[22] P. Chartrand, A. Pelton, The modified quasi-chemical Model: Part III. Twosublattices, Metall. Mater. Trans. A 32 (2001) 1397–1407.
[23] A. Pelton, P. Chartrand, G. Eriksson, The modified quasi-chemical model: PartIV. Two-sublattice quadruplet approximation, Metall. Mater. Trans. A 32(2001) 1409–1416.
[24] X. Gonze, G.-M. Rignanese, M. Verstraete, J.-M. Beuken, Y. Pouillon, R. Caracas,F. Jollet, M Torrent, G. Zerah, M. Mikami, P. Ghosez, M. Veithen, J.-Y. Raty,V. Olevano, F. Bruneval, L. Reining, R. Godby, G. Onida, D.R. Hamann, D.C. Allan,A brief Introduction to the ABINIT software package, Z. Kristallogr. 220 (2005)558–562.
[25] N. Troullier, J.L. Martins, Efficient pseudopotentials for plane-wave calcula-tions, Phys. Rev. B: Condens. Matter 43 (1991) 1993–2006.
[26] J. Perdew, K. Burke, M. Ernzerhof, Generalized gradient approximation madesimple, Phys. Rev. Lett. 3865 (1996) 78.
[27] H.J. Monkhorst, J.D. Pack, Special points for Brillouin-zone integrations, Phys.Rev. B: Condens. Matter 13 (1976) 5188–5192.
[28] B. Hammer, L. Hansen, J. Nørskov, Improved adsorption energetics withindensity-functional theory using revised Perdew–Burke–Ernzerhof functionals,Phys. Rev. B: Condens. Matter 59 (59) (1999) 7413–7421.
[29] T. Massalski, J. Murray, L. Bennett, H. Baker, Binary Alloy Phase Diagrams,second ed., American Society for Metals, Metals Park. Ohio, 1986.
[30] B. Thamer, The system cerium–manganese in the range of 0-–20 at% manga-nese, J. Less-Common Met. 7 (1964) 341–346.
[31] A Palenzona, S. Cirafici, The Ce–Mn (cerium–manganese) system, J. PhaseEquilib. 17 (1996) 53–56.
[32] A. Pelton, On the slopes of phase boundaries, Metall. Mater. Trans. A 19 (1988)1819–1825.
[33] H. Okamoto, T. Massalski, Thermodynamically improbable phase diagrams, J.Phase Equilib. 12 (1991) 148–168.
[34] H. Tong, F. Shi, Dependence of supercooling of a liquid on its overheating, J.Chem. Phys. 107 (1997) 7964–7966.
[35] Y. Zhu, J. Devletian, A. Manthiram, Application of differential thermal analysisto solid–solid transitions in phase diagram determination, J. Phase Equilib. 15(1994) 37–41.