calreticulin and other components of endoplasmic reticulum
TRANSCRIPT
Ní Fhlathartaigh et al. Acta Neuropathologica Communications 2013, 1:37http://www.actaneurocomms.org/content/1/1/37
RESEARCH Open Access
Calreticulin and other components ofendoplasmic reticulum stress in rat and humaninflammatory demyelinationMary Ní Fhlathartaigh1, Jill McMahon1, Richard Reynolds2, David Connolly1, Eibhlín Higgins3,Timothy Counihan3 and Una FitzGerald1*
Abstract
Background: Calreticulin (CRT) is a chaperone protein, which aids correct folding of glycosylated proteins in theendoplasmic reticulum (ER). Under conditions of ER stress, CRT is upregulated and may be displayed on the surfaceof cells or be secreted. This ‘ecto-CRT’ may activate the innate immune response or it may aid clearance ofapoptotic cells. Our and other studies have demonstrated upregulation of ER stress markers CHOP, BiP, ATF4, XBP1and phosphorylated e-IF2 alpha (p-eIF2 alpha) in biopsy and post-mortem human multiple sclerosis (MS) samples.We extend this work by analysing changes in expression of CRT, BiP, CHOP, XBP1 and p-eIF2 alpha in a rat modelof inflammatory demyelination. Demyelination was induced in the spinal cord by intradermal injection ofrecombinant mouse MOG mixed with incomplete Freund’s adjuvant (IFA) at the base of the tail. Tissue sampleswere analysed by semi-quantitative scoring of immunohistochemically stained frozen tissue sections. Datagenerated following sampling of tissue from animals with spinal cord lesions, was compared to that obtained usingtissue derived from IFA- or saline-injected controls. CRT present in rat serum and in a cohort of human serumderived from 14 multiple sclerosis patients and 11 healthy controls was measured by ELISA.
Results: Stained tissue scores revealed significantly (p<0.05) increased amounts of CRT, CHOP and p-eIF2 alpha inthe lesion, lesion edge and normal-appearing white matter when compared to controls. CHOP and p-eIF2 alphawere also significantly raised in regions of grey matter and the central canal (p<0.05). Immunofluorescent dual-labelstaining confirmed expression of these markers in astrocytes, microglia or neurons. Dual staining of rat and humanspinal cord lesions with Oil Red O and CRT antibody showed co-localisation of CRT with the rim of myelinfragments. ELISA testing of sera from control and EAE rats demonstrated significant down-regulation (p<0.05) ofCRT in the serum of EAE animals, compared to saline and IFA controls. This contrasted with significantly increasedamounts of CRT detected in the sera of MS patients (p<0.05), compared to controls.
Conclusion: This data highlights the potential importance of CRT and other ER stress proteins in inflammatorydemyelination.
Keywords: Calreticulin, ER stress, EAE, Spinal cord demyelination, Multiple sclerosis
* Correspondence: [email protected] Centre for Biomedical Engineering Science, Galway NeuroscienceCentre, National University of Ireland, Galway, IrelandFull list of author information is available at the end of the article
© 2013 Ní Fhlathartaigh et al.; licensee BioMed Central Ltd. This is an Open Access article distributed under the terms of theCreative Commons Attribution License (http://creativecommons.org/licenses/by/2.0), which permits unrestricted use,distribution, and reproduction in any medium, provided the original work is properly cited.

Ní Fhlathartaigh et al. Acta Neuropathologica Communications 2013, 1:37 Page 2 of 15http://www.actaneurocomms.org/content/1/1/37
BackgroundProteins associated with endoplasmic reticulum (ER)stress have recently been shown in human demyelin-ating lesions in central nervous system white and greymatter [1-4]. Homeostasis within the ER is of greatimportance as it is the site of synthesis and folding ofapproximately one third of all mammalian proteinsi.e., those which are targeted to membranes or for se-cretion. The ER also plays a central role in lipid syn-thesis and is the major site of calcium storage withinthe cell. However, a range of pathologies may causethe break-down of protein-folding mechanisms,resulting in a cellular response called the ‘unfoldedprotein response’ (UPR) or ‘ER stress’ [5].Triggeredinitially when the ER chaperone GRP78/BiP detachesfrom ER trans-membrane sensors pancreatic PKR-likeER kinase (PERK), inositol-requiring enzyme 1 (IRE1) andactivating transcription factor 6 (ATF6), the UPR tempor-arily halts protein translation, degrades mis-foldedproteins and newly synthesises ER chaperones to restorenormal protein folding. Detection of raised levels ofGrp78 / BiP, X-box-binding factor 1 (XBP1), phosphorylatedPERK (p-PERK), phosphorylated IRE1 (p-Ire1) orphosphorylated eukaryotic initiation factor alpha(p-eIF2α) is indicative of an active ‘protective’ ER stressresponse. On the other hand, increased expression oftranscription factor CHOP is widely considered to in-dicate that cells may have activated a pro-apoptoticresponse following the failure to restore normal ERfunction [6].Calreticulin (CRT) is a molecular chaperone nor-
mally associated with the CRT-calnexin glycoprotein-folding machinery and calcium binding within the ER[7]. However, there is an increasingly diverse array ofphysiological and pathological functions now associ-ated with cell surface or secreted CRT [8,9]. For ex-ample, cell surface CRT has a putative role in theclearance of apoptotic cells [10,11] and in the activa-tion of the innate immune response [12,13]. The factthat it is induced following ER stress and thereported link between CRT and autoimmunity, in thecontext of rheumatoid arthritis [14], prompted us toexamine the expression of CRT and other markers ofER stress in an experimental autoimmune encephalo-myelitis (EAE) model of spinal cord demyelination.Pathology was induced in Dark Agouti (DA) rats inresponse to intradermal injection of recombinantmouse myelin oligodendrocyte glycoprotein (rmMOG)and the expression of CHOP, BiP, p-eIF2α, XBP1 andCRT examined. Levels of circulating CRT in the seraof diseased rats and in MS patient sera were alsoquantified. The potential relevance of CRT and otherER stress marker protein expression in the develop-ment of a demyelinating phenotype is discussed.
ResultsSignificant up-regulation of protein markers of ER stressin demyelinating white matterImmunohistochemical staining confirmed a significantlyhigher degree of expression of CRT, CHOP, XBP1 andp-eIF2α within demyelinating lesions, when comparedto normal IFA- and saline-injected controls (Figure 1). CRTachieved a semi-quantitative score of 4.3 ± 0.4 arbitraryunits (AU), in lesion centres, against scores of 0.7 AU(± 0.1-0.2, p<0.01) in the NAWM of IFA- or saline-injectedanimals. The CRT score dropped slightly (not significant)to 3 AU at the lesion edge. Sample low-magnificationimages of CRT-stained control and experimental tissue areshown in Figure 2a and 2b. Morphological criteria appliedto single chromogenic labelling suggested that differentproportions of a range of cell types were expressingCRT (Figure 2b, c and d). This was confirmed bydual immunofluorescent labelling of astrocytes andmicroglia (Figure 2g-k). Double-staining of myelinfragments and CRT demonstrated that in some areasof lesioned tissue, CRT was colocalising with the lipidrim (Figure 2f ).In contrast to CRT, monitoring of changes in BiP
expression within different tissue regions yielded nosignificant results (Figure 1).When staining for transcription factor CHOP was car-
ried out (see Figure 3a and 3b), it revealed significantlyhigher (p<0.001) expression in the lesion (3.9 AU ± 0.2)and lesion edge (3.9 ± 0.1), when compared to saline(0.8 ± 0.1) or IFA (0.9 ± 0.2) -injected controls(Figure 1). Tissue stained for XBP1 (see Figure 3g and3h) had a slightly lower profile of expression, scoring3.5 ± 0.4 within lesions, rising to 3.8 ± 0.6 at the lesionedge, values which were significantly different (p<0.05)to those calculated for saline controls, but not thoseobtained when IFA controls were analysed. Represen-tative images of tissue stained with CHOP andXBP1antibodies are provided in Figure 3a -3h. Again,morphological criteria suggest that a variety of celltypes express these transcription factors (see Figure 3c,d, h), which, in the case of CHOP, was confirmed byCHOP-IBA1 dual labelling (Figure 3d, e).Finally, immunohistochemical analysis of expres-
sion of p-eIF2α provided confirmation that the PERKarm of the ER stress response was activated in dis-eased WM of the spinal cord. Semi-quantitativescores were slightly lower than those seen for theother markers tested, at 3.1 ± 0.3 (lesion) or 3.0 ±0.4 at the lesion edge. Lesion edge scores differedsignificantly from those recorded for IFA (0.7 ± 0.2,p<0.05) and saline (0.5 ± 0, p<0.05) controls, whilethe lesion scores differed significantly from the salinecontrols only (p<0.05). Staining of a variety of cell typeswas clearly evident (Figure 4b) and expression in microglia

Figure 1 Quantification of up-regulation of protein markers of ER stress in spinal cord EAE lesions. Semi-quantitatitive analysis of thespinal cord white matter EAE lesions and lesion edges revealed a trend towards upregulation of BiP, compared to IFA and saline controls (a).Scores for CRT (b), CHOP (c) and p-eIF2α (e) were significantly higher within lesions and the NAWM than those measured in the NAWM of IFAsamples. Significant upregulation of CRT, CHOP, XBP1 (d) and p-eIF2α, was found in EAE lesions and NAWM, when compared to saline controls.Key: * = p<0.05; ** = p<0.01; *** = p<0.001. Data is represented as mean arbitrary units (AU) ± SEM.
Ní Fhlathartaigh et al. Acta Neuropathologica Communications 2013, 1:37 Page 3 of 15http://www.actaneurocomms.org/content/1/1/37
and was confirmed by dual immunofluorescence(Figure 4c-e).Monitoring of NAWM staining patterns showed that
in all cases, protein expression was lower than that seenin the lesion edge and centre. In the case of CRT (1.7 ±0.5), CHOP (2.2 ± 0.4) and p-eIF2α expression levels dif-fered significantly (p<0.01 or 0.05) from those seen inIFA controls, whereas expression of XBP1 (2.1± 0.3) sig-nificantly differed (p<0.05) from that seen in saline con-trols only.
Significant up-regulation of protein markers of ER stressin grey matter and central canal of the spinal cordExpression of BiP, CRT, CHOP, XBP1 and p-eIF2α was nextexamined in the grey matter (GM). Intense staining of
motoneurons of the ventral horn by anti-BiP and anti-CRTantibodies was obtained (scoring between 2 and 3), butthere was no significant difference in numbers of positivelystained cells, when control and experimental tissue wascompared (Figure 5). However, significantly increased ex-pression of CHOP (2.6 ± 0.4, p<0.05) was detected, whencompared to IFA (0.8 ± 0.2) and saline (0.8 ± 0.3) controlspecimens. The XBP1 scores (3.1 ± 1.6) differedsignificantly from those recorded for saline-injectedsamples (1.1 ± 0.5, p<0.05), differences were notsignificant when comparisons were made with IFAtissue (Figure 5).The intensity of chromogenic staining of neurons for
p-eIF2α, was consistently higher than that obtained inIFA controls (bottom panels Figure 5) and was lower
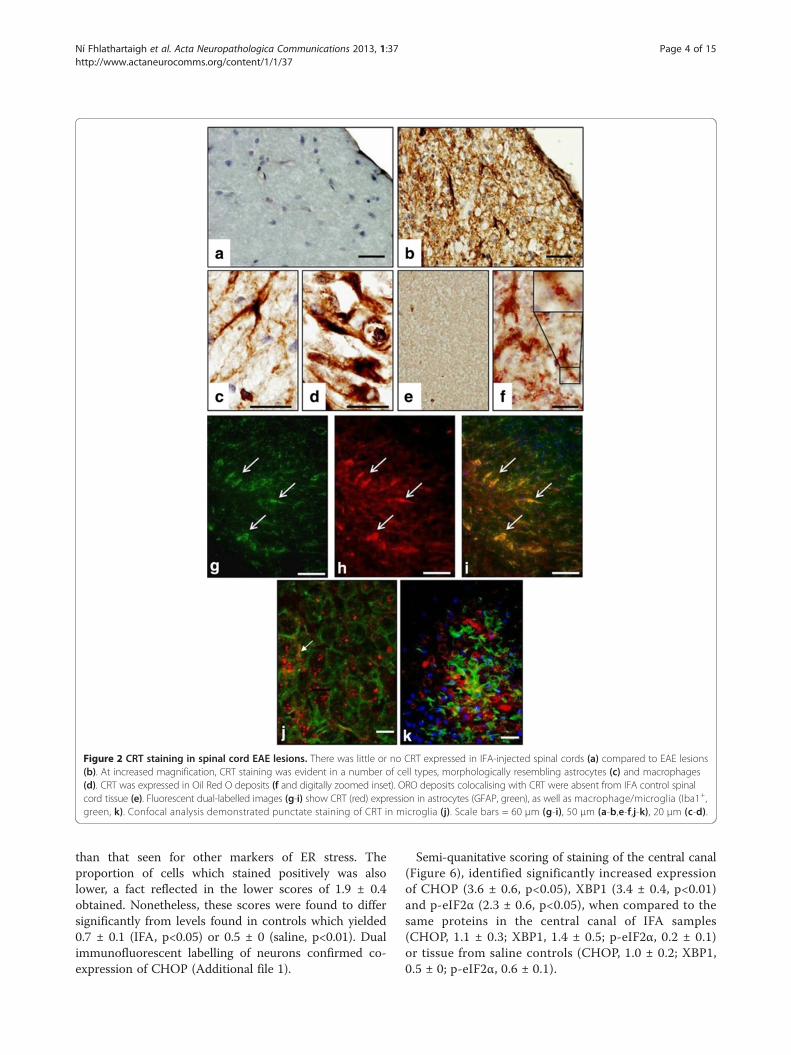
Figure 2 CRT staining in spinal cord EAE lesions. There was little or no CRT expressed in IFA-injected spinal cords (a) compared to EAE lesions(b). At increased magnification, CRT staining was evident in a number of cell types, morphologically resembling astrocytes (c) and macrophages(d). CRT was expressed in Oil Red O deposits (f and digitally zoomed inset). ORO deposits colocalising with CRT were absent from IFA control spinalcord tissue (e). Fluorescent dual-labelled images (g-i) show CRT (red) expression in astrocytes (GFAP, green), as well as macrophage/microglia (Iba1+,green, k). Confocal analysis demonstrated punctate staining of CRT in microglia (j). Scale bars = 60 μm (g-i), 50 μm (a-b,e-f,j-k), 20 μm (c-d).
Ní Fhlathartaigh et al. Acta Neuropathologica Communications 2013, 1:37 Page 4 of 15http://www.actaneurocomms.org/content/1/1/37
than that seen for other markers of ER stress. Theproportion of cells which stained positively was alsolower, a fact reflected in the lower scores of 1.9 ± 0.4obtained. Nonetheless, these scores were found to differsignificantly from levels found in controls which yielded0.7 ± 0.1 (IFA, p<0.05) or 0.5 ± 0 (saline, p<0.01). Dualimmunofluorescent labelling of neurons confirmed co-expression of CHOP (Additional file 1).
Semi-quanitative scoring of staining of the central canal(Figure 6), identified significantly increased expressionof CHOP (3.6 ± 0.6, p<0.05), XBP1 (3.4 ± 0.4, p<0.01)and p-eIF2α (2.3 ± 0.6, p<0.05), when compared to thesame proteins in the central canal of IFA samples(CHOP, 1.1 ± 0.3; XBP1, 1.4 ± 0.5; p-eIF2α, 0.2 ± 0.1)or tissue from saline controls (CHOP, 1.0 ± 0.2; XBP1,0.5 ± 0; p-eIF2α, 0.6 ± 0.1).
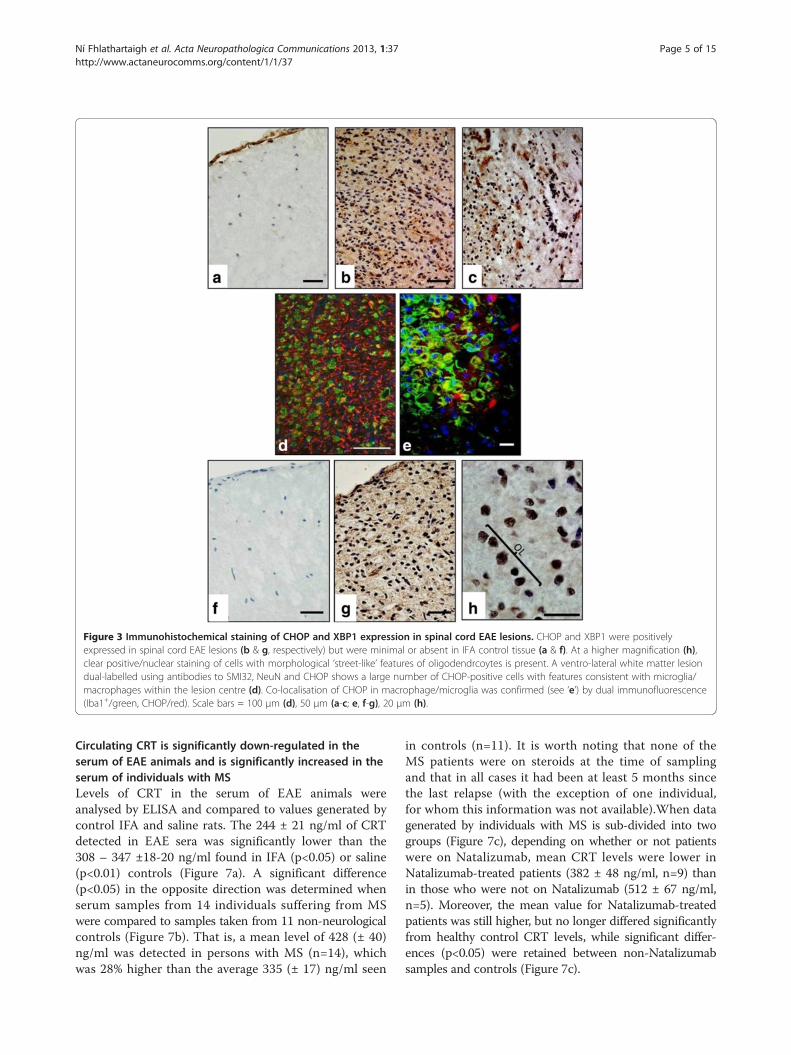
Figure 3 Immunohistochemical staining of CHOP and XBP1 expression in spinal cord EAE lesions. CHOP and XBP1 were positivelyexpressed in spinal cord EAE lesions (b & g, respectively) but were minimal or absent in IFA control tissue (a & f). At a higher magnification (h),clear positive/nuclear staining of cells with morphological ‘street-like’ features of oligodendrcoytes is present. A ventro-lateral white matter lesiondual-labelled using antibodies to SMI32, NeuN and CHOP shows a large number of CHOP-positive cells with features consistent with microglia/macrophages within the lesion centre (d). Co-localisation of CHOP in macrophage/microglia was confirmed (see ‘e’) by dual immunofluorescence(Iba1+/green, CHOP/red). Scale bars = 100 μm (d), 50 μm (a-c; e, f-g), 20 μm (h).
Ní Fhlathartaigh et al. Acta Neuropathologica Communications 2013, 1:37 Page 5 of 15http://www.actaneurocomms.org/content/1/1/37
Circulating CRT is significantly down-regulated in theserum of EAE animals and is significantly increased in theserum of individuals with MSLevels of CRT in the serum of EAE animals wereanalysed by ELISA and compared to values generated bycontrol IFA and saline rats. The 244 ± 21 ng/ml of CRTdetected in EAE sera was significantly lower than the308 – 347 ±18-20 ng/ml found in IFA (p<0.05) or saline(p<0.01) controls (Figure 7a). A significant difference(p<0.05) in the opposite direction was determined whenserum samples from 14 individuals suffering from MSwere compared to samples taken from 11 non-neurologicalcontrols (Figure 7b). That is, a mean level of 428 (± 40)ng/ml was detected in persons with MS (n=14), whichwas 28% higher than the average 335 (± 17) ng/ml seen
in controls (n=11). It is worth noting that none of theMS patients were on steroids at the time of samplingand that in all cases it had been at least 5 months sincethe last relapse (with the exception of one individual,for whom this information was not available).When datagenerated by individuals with MS is sub-divided into twogroups (Figure 7c), depending on whether or not patientswere on Natalizumab, mean CRT levels were lower inNatalizumab-treated patients (382 ± 48 ng/ml, n=9) thanin those who were not on Natalizumab (512 ± 67 ng/ml,n=5). Moreover, the mean value for Natalizumab-treatedpatients was still higher, but no longer differed significantlyfrom healthy control CRT levels, while significant differ-ences (p<0.05) were retained between non-Natalizumabsamples and controls (Figure 7c).

Figure 4 Profile of expression of p-eIF2αin spinal cord EAE lesions. p-eIF2α was expressed in spinal cord EAE lesions (b) at an increasedlevel compared to IFA control tissue (a). Dual immunofluorescence (asterisk, arrows, CD68 / green, CHOP red) demonstrated that p-eIF2α (green)was expressed in macrophages (c-e). Scale bars = 50 μm (a-b), 10 μm (c-e).
Ní Fhlathartaigh et al. Acta Neuropathologica Communications 2013, 1:37 Page 6 of 15http://www.actaneurocomms.org/content/1/1/37
DiscussionThe chief outcomes from this study have been the demon-stration for the first time that: (i) following MOG-inducedspinal cord demyelination in the DA rat, CRT, CHOP andp-EIF2α were present at significantly increased levels withinspinal cord lesions; (ii) significantly increased amounts ofCRT, CHOP, XBP1 and p-eIF2α were detectable in the re-gion of the central canal of diseased animals; (iii) levels ofcirculating CRT were significantly lower in EAE rat sera,when compared to control samples; (iv) CRT in humanblood sera was present at significantly higher levels in indi-viduals with MS, than in healthy controls.Using intradermal injection of rmMOG, demyelination
was induced in the spinal cord of adult female DA rats.Control animals were injected with IFA or saline only.Nine out of 10 animals developed a phenotype 13–21 dayspost MOG injection, which was retained in 5 individualson the day of tissue harvesting. Inflammatory myelin losswas identified by staining of myelin and infiltrating micro-glia and the presence of myelin fragments within lesionswas confirmed using ORO staining. After isolation oftotal RNA from whole spinal cord lysates, real-timePCR analysis of ER stress-related transcripts did notdetect significant differences between control and EAEsamples. A semi-quantitative protocol was then applied toimmunohistochemically-stained tissue from the 5 rats inwhich inflammatory pathology was confirmed. On a scaleof 1 to 5, the degree of staining was scored within thelesion, lesion edge, NAWM, GM and the region of thecentral canal and compared to that generated using IFA
and saline controls. A total of 240 experimental and con-trol tissue sections were examined, enabling us to profilethe expression of BiP, CRT, CHOP, XBP1 and p-eIF2α.At significantly increased scores, ranging from 1.6 to
5 in all EAE-associated regions examined, CRT wasdetected in astrocytes, microglia and GM neurons.When present, oligodendrocyte expression of CRT wasminimal (not shown). IFA and saline control samplesachieved CRT scores of 1 or less. An intriguing findingwas the localisation of CRT to the rim of ORO-positivemyelin fragments (confirmed in a human MS tissuesample, see additional file 2) and the punctate or ‘patchy’nature of CRT staining seen when tissue was dual-labelledwith CRT and GFAP or IBA1 (Figure 4i and j).In contrast to CRT, we were unable to detect significant
changes in the proportion of BiP-positive cells, when con-trol and EAE samples were analysed. However, with scoresof 2.2 to 3.9 AU, compared to staining in saline and IFAsections, which yielded scores of 1 or less, dual-labellingconfirmed CHOP expression in astrocytes and microglia.Positive staining for XBP1, which scored 2.1 to 3.5,could be seen in a range of cell types within WM lesionsfollowing chromogenic single labelling, but the level ofstaining differed significantly only from the pattern seenin saline controls.The final marker of ER stress assessed was p-eIF2α.
Following tissue staining, it yielded scores of 1.9 to3.1 AU. When morphological criteria were applied to thepattern of chromogenic staining seen, p-eIF2α stainingappeared to be present in a range of cell types. Dual

Figure 5 Upregulation of ER stress molecules in spinal cord grey matter neurons. Semi-quantitative analysis of ER stress moleculeexpression in neurons of the grey matter showed an upward trend in BiP and CRT expression, when compared to control IFA or saline groups.CHOP, XBP1 and p-eIF2α scores differed significantly from saline controls, while staining of CHOP and p-eIF2α protein also differed significantlyfrom the pattern seen in IFA controls. Histogram data (RH panels) is represented as semi-quantitative immunostaining score / mean arbitraryunits (AU)±SEM, n = 5 for all scores. Key: * = p<0.05. Representative images of staining of the grey matter in IFA controls (LH panels) and EAEsamples (middle panels), is shown. Scale bars = 50 μm.
Ní Fhlathartaigh et al. Acta Neuropathologica Communications 2013, 1:37 Page 7 of 15http://www.actaneurocomms.org/content/1/1/37
labelling confirmed p-eIF2α in microglia. Expression ofp-eIF2α within lesions, at the lesion edge, in GM and theCC was also significantly higher than levels recorded forequivalent areas in saline and IFA controls.Results obtained when NAWM was examined hinted
that CRT, CHOP and p-eIF2α could be involved inlesion development, as these markers were present atsignificantly higher levels when compared to controlcounterparts.Detection of significantly higher levels of CHOP and
phospho-eIF2α within the region of the central canal indiseased animals hints that possible triggers of ER stressmay be present in the cerebrospinal fluid and an inves-tigation of candidate molecules is warranted.
We then expanded our investigations to include analysisof CRT secretion into the blood of EAE rats and in samplesdrawn from a cohort of 14 individuals with MS and 11healthy controls. Data showed significantly reduced levelsof CRT in rat sera when compared to IFA or saline controlanimals. The reverse was seen when human samples wereanalysed, in that MS patient samples contained significantlyhigher levels of secreted CRT. When results generatedusing samples taken from Natalizumab-treated patientsonly were analysed separately, mean CRT values were notfound to differ significantly from mean values in healthyindividuals. In contrast, the amounts of CRT detected inserum from individuals not undergoing treatment withNatalizumab, remained significantly higher than controls.

Figure 6 Upregulation of ER stress molecules in the spinal cord central canal region. Semiquantitative analysis of the cells of the centralcanal (RH panel) showed a trend towards upregulation of the ER stress chaperones BiP and CRT when compared to control animals but thesedifferences did not reach significance. Significant upregulation of CHOP, XBP1 and p-eIF2α was detected when EAE and saline samples werecompared. CHOP and p-eIF2α values were significantly different to those seen in IFA controls. Representative images of staining in IFA controlspinal cord tissue (LH panels) and in EAE lesions (middle panels) are shown. Magnified images of cells positively stained for CHOP (inset, RH middlepanel) and p-eIF2a (inset, bottom middle panel) show cuboidal morphology consistent with ependymal cells. Histogram data is represented assemi-quantitative immunostaining score / mean arbitrary units (AU)±SEM, n = 5 for all scores except XBP1, where n = 4 for EAE-treated animals andn = 3 for CRT stained section in saline control group. Key: *=p<0.05; **p<0.01. Scale bars = 50 μm.
Ní Fhlathartaigh et al. Acta Neuropathologica Communications 2013, 1:37 Page 8 of 15http://www.actaneurocomms.org/content/1/1/37
There are no previous reports of ER stress in rat EAEmodels. However, in broad terms, the data we havegenerated in rats confirms and adds to findings pub-lished using SJL and C57Bl/6 mice, in that BiP, CHOP,XBP1 and p-eIF2α were reported as significantly altered inthese models [15-19] The question of what individual ERstress proteins are doing in the context of demyelinationhas yet to be answered. Deslauriers et al. [17] showed thatEAE occured to the same degree in CHOP-/- mice as innormal controls, suggesting that CHOP is not required toinduce inflammatory demyelination in mice. When present,as in our rat model, CHOP may be involved in perpetuating
pro-apoptotic signals leading to loss of CHOP-positive cellswithin lesions. Alternatively, Popko and colleagues haveproposed that CHOP is not pro-apoptotic, but is uniquelyrequired to achieve complete remyelination followinginflammatory demyelination [20].The second major transcription factor associated with
ER stress is XBP1. We found this highly specific markerof ER stress to be significantly altered in all regions ofEAE lesions and in NAWM, when compared to saline-injected controls, but levels of XBP1 in EAE lesions didnot differ significantly from those detected in controlIFA animals. This is at odds with reported significant

Figure 7 Quantification of circulating CRT in rat and human sera. Levels of CRT in rat sera (a) were measured by ELISA, revealing that CRT inEAE animals (n=5) was significantly (p<0.05) less than that in control animals (n=5). Testing for CRT in human sera (b) revealed significantlyincreased CRT in human MS sera (p<0.05), n=14) when compared to healthy controls (n=11). When data from MS samples was separated (c)according to whether or not individuals were undergoing treatment with nataluzimab, CRT was still significantly higher (p<0.01) in non-nataluzimab-treated patients (n=5), compared to samples from healthy controls (n=11). There was no significant difference in levels found inindividuals on nataluzimab when compared to CRT in healthy controls.
Ní Fhlathartaigh et al. Acta Neuropathologica Communications 2013, 1:37 Page 9 of 15http://www.actaneurocomms.org/content/1/1/37
transcriptional upregulation of spliced XBP1 in samplesisolated from EAE C57/BL mice [17]. This may be due tothe fact that the antibody used to screen our tissue doesnot discriminate between proteins encoded by spliced orunspliced variants, or may reflect the differences between
the disease profile in our animal model and theirs. It ismost likely that translational arrest is occuring within cellswhich stained positively for p-eIF2α, as phosphorylationof this molecule is known to interfere with protein transla-tion, as part of a well characterised self-protective
Ní Fhlathartaigh et al. Acta Neuropathologica Communications 2013, 1:37 Page 10 of 15http://www.actaneurocomms.org/content/1/1/37
mechanism aimed at reducing the accumulation ofmisfolded proteins within the ER. It would be useful to de-termine the duration of this molecular event and how tim-ing of its appearance or disappearance within lesionsrelates to tissue repair or ultimate cell and tissuedestruction.It is likely that, when functioning within the ER, proteins
may have a role which differs to that found outside theER. For example, while in the ER lumen, CRT participatesin the CRT-calnexin cycle, ensuring correct folding ofglycosylated proteins and trafficking of mis-folded pro-teins to the ER-associated degredation system. By an asyet undefined means which may occur under conditionsof ER stress and may involve removal of the KDEL ER re-tention sequence [7], CRT could be displayed on the cellsurface. This CRT cell surface expression may requireinteraction with C1q complement and CD91 [21]. On theother hand, given that EAE is a T cell-mediated disease, itis also possible that CRT detected in the tissue samplesderived from our EAE rats, was released from granulesproduced by invading cytotoxic T lymphocytes [22,23].Whether originating from brain cells, or released from in-vading T cells, CRT bound to C1q and CD91, may aid rec-ognition and clearance of apoptotic cells by macrophages/microglia [8]. Furthermore, some investigators have dem-onstrated a direct interaction between phosphatidylserine(PS) and CRT which was maintained when apoptosiscaused PS to be ‘flipped’ to the outer leaflet of the plasmamembrane [24,25]. It may be that CRT’s appearance at thecell surface precedes PS exposure, as reported for tumourcells [26]. Tarr et al also described ‘punctate clusters’containing PS and CRT in apoptotic Jurkat T cells, remin-iscent of the puctate staining seen in confocal imaging ofCRT-stained EAE lesions (Figure 4j). Intriguingly, there isalso a puncate quality to some of the CRT staining in theORO-CRT images reported here. Again, it is possible thatPS abnormally displayed on the outer surface of myelinfragments could be bound by CRTas part of a myelin deb-ris clearance process.Once CRT is secreted into the circulation, it may func-
tion in modulating innate and adaptive immune responses.In this regard, a large body of literature is accumulating onthe role of CRT in the pathogenesis of rheumatoid arthritis(RA), another autoimmune disorder, Tarr et al [27] detectedsignificantly higher levels of extracellular CRT in the syn-ovial fluid and plasma of rheumatoid arthritis patients. Atvalues between 232 and 623 ng/ml, the quantities of CRTfound in the serum of MS patients examined in our study,were 20 to 30 times higher than those reported by Tarr etal, leading to the speculation that circulating CRT couldalso be playing a role in the pathogenesis of MS. Recentdescriptions that various proteins including Hsp70, BiP andαB-crytstallin [28] have “chaperokine” functions suggestthat CRT could also be involved in determining the balance
between peripheral pro- and anti-inflammatory T cell sub-sets, although this remains to be definitively established.Our finding that levels of circulating CRT in the serumof EAE animals were significantly lower than levelsdetected in control IFA and saline animals is challengingto explain. Further time-course experiments need tobe carried out in rat and human cohorts, to determinewhether or not circulating CRT is, as we propose, a newrobust surrogate biomarker of demyelinating diseaseand a possible ‘chaperokine’ in MS.
ConclusionThrough detection of significant changes in CRT expres-sion in rat EAE tissue, we have highlighted the potentialimportance of CRT as a mediator of MS pathogenesis.Dual labelling of myelin fragments and CRT hints thatCRT could be involved in myelin clearance. Detectionof circulating CRT points to a possible role for thischaperokine in regulating the profile of circulating immunecells. This, together with our novel detection of significantlyaltered levels of CHOP, CRT and eIF2α in EAE rat spinalcord, highlights a need for the development of modelsof ER stress which may be manipulated in the field ofMS research.
MethodsExpression and purification of MOG proteinRecombinant mouse MOG (rmMOG), corresponding tothe N-terminal Ig-like extracellular domain of mouseMOG (amino acids 1 -116), was prepared as previouslydescribed [29].
AnimalsFemale DA rats (Harlan, UK), weighing between 118-161 g,were used for induction of spinal-cord demyelination. Foodand water were available ad libitum with light:dark cycles12:12 in a temperature controlled room (20 ± 2°C), withrelative humidity of 45–70%. Animals were acclimatised forone week prior to any experimental procedures. All animalwork presented in this paper was performed according tothe EU Directive 86/609 and the Cruelty to Animals Act1876 enacted in Ireland by two Statutory Instruments: S.INo 566/ 2002 and S. I. No 613/ 2005. Additionally and inadherence to NUI Galway policies regarding researchinvolving live animals, this work was also authorised/approved by National University of Ireland Galway AnimalCare and Research Ethics Committee (ACREC).
EAE induction, clinical evaluation and lesioncharacterisationRats (n=10) were anaesthetised via inhalation anaesthesiaand injected intra-dermally into the dorsum base of thetail with a total volume of 100 μl containing 25-50 μgrmMOG (diluted in saline) emulsified in incomplete

Ní Fhlathartaigh et al. Acta Neuropathologica Communications 2013, 1:37 Page 11 of 15http://www.actaneurocomms.org/content/1/1/37
Freund’s adjuvant (IFA; Sigma, Dublin, Ireland) accordingto previously described protocols [29,30]. Control animalswere similarly injected with a total volume of 100 μl IFA(n = 5) or saline (n = 5). In this cohort, this protocol pro-duced a relapsing-remitting disease course in the majorityof animals. Animals were weighed and the clinical level ofEAE was scored daily. Animals were assigned a clinicalscore as follows: 0=no abnormality; 0.5= loss of tone inthe tip of the tail; 1 =flaccid tail; 2 =single hind-limbparalysis; 3=double hind-limb paralysis; 4= quadriplegia;5= moribund.Mean clinical scores obtained in DA rats over a 43-day
period following intradermal injection of rmMOG aredepicted in Additional file 3a. Of 10 animals injected with25 – 50 μg of rmMOG, 9 experienced paralysis at somepoint during the 43-day period and clinical scores rangedfrom 0.5 to 3. Remission was experienced in some animals,leading to large standard deviations in clinical scores(Additional file 3). Rats injected with IFA or saline alonedid not show clinical symptoms, in contrast to thoseinjected with MOG. A humoral response to MOG was alsodetected in MOG-injected animals (Additional file 3b).A representative image of the disappearance of MOG-specific staining in the white matter of affected animalsis shown in Additional file 3c, contrasting with normalMOG levels retained in control saline or IFA groups(Additional file 3d and e). A macrophage-driven pathologywas confirmed as present in all lesions or absent incontrols, following immunofluorescent staining of largenumbers of cells for the macrophage / microglial-specificmarker IBA1 (Additional file 3f – h). Involvement of Tcells in pathology was also confirmed using antibiodiesto CD3 (Additional file 1). Myelin debris-laden areaswere also confirmed in demelinating lesions only, byORO staining (Additional file 3i-k).Quantitative assessment of ER stress proteins was carried
out in 5 rats in which a demyelinating pathology had beenconfirmed by loss reactivity to antibodies to MOG and byloss of LFB staining. Lateral and ventral lesions incorporat-ing GM regions were present in 4 out of 5 animals, while aprominent dorsal lesion was detected in the fifth animal. Itwas noted that the pathological features of the dorsal lesion,in terms of infiltrating immune cells, did not differ tofeatures seen in lateral and ventral lesions. A demyelinatingpathology could not be detected in the remaining 5 an-imals. It is possible that pathology was missed, as halfof the tissue collected was snap-frozen for use in RNAisolation. For the reasons stated above, these individualswere excluded from further analysis.
Measurement of humoral reactivity to MOGTo determine titres of anti-MOG antibody in serum,bloods were collected via cardiac puncture followingtermination and serum analysed by enzyme-linked
immunosorbent assay (ELISA). Following clotting at 4°C,serum was separated and collected following centrifugationand stored at -20°C. Briefly, 10 μg / ml rmMOG was addedto 96-well plates (Sarstedt, Wexford, Ireland) and incubatedovernight at 4°C before blocking with 2% bovine serumalbumin (BSA; Sigma, Dublin, Ireland) in PBS for 1 h atroom temperature. The sera were diluted (1:400) in 1%BSA / PBS and incubated for 2 h. Rat IgG–specific alkalinephosphatase-linked secondary antibody (1:5000 in 1% BSA/PBS; Sigma, Dublin, Ireland) was incubated for 1 h, prior todetection with p-Nitrophenyl phosphate (Sigma, Dublin,Ireland). The optical density was measured at 405 nm. Allincubations were at 37°C unless otherwise stated.
Tissue harvesting and processingAnimals were sacrificed by CO2 asphyxiation 43 days post-inoculation. Spinal cords (average length 80 mm) were cutinto 8 equally sized pieces. Each piece was further bisected,with one piece being snap-frozen for RNA analysis and thesecond used for histological analysis.
Histological analysis and immunohistochemistryAll tissue for histology was fixed in freshly prepared 4%paraformaldehyde overnight at 4°C and cryoprotected in30% sucrose in PBS for 48 h. Tissue was then embeddedin OCT (VWR International Ltd, Dublin, Ireland) andstored at -80°C. Histological evaluation was performed on10 μm frozen sections which were thaw-mounted ontoSuperfrost Plus slides (Fisher Scientific, Dublin, Ireland)and stored at -80°C. Details of antibodies and conjugatesused for immunohistochemistry are shown in Table 1.
Colorimetric immunohistochemistryAll sections were brought to room temperature, air-driedand endogenous peroxidases blocked by incubation in 1%hydrogen peroxidase in methanol. All primary antibodieswere incubated on sections at 4°C overnight, detectedusing biotinylated secondary antibodies (see Table 1)and ABC horseradish peroxidise-labelled VectastainElite ABC reagent (Vector). Diaminobenzidine(DAB)(Dako, Cambridgeshire, UK) was used as chromogen,and all sections were counterstained in haematoxylin.
Oil red O stainingSections were brought to room temperature, air-driedand incubated for 4 min in 60% ethanol. Slides wereincubated in Oil Red O (ORO; Sigma, Ireland) solution(0.5% ORO in 60% ethanol) for 1 h at room temperatureand differentiated by rinsing in 60% ethanol and 4 washesin water. After counterstaining in haematoxylin, slides weremounted in gelatine mounting medium (in-house).

Table 1 Antibodies and conjugates used for immunohistochemistry
Antibody/Conjugate Isotype/Species Supplier Dilution
MOG Mouse mAb Prof R Reynolds, Imperial College London 1/100
BiP/GRP78 Rabbit pAb Abcam (ab32618) 1/100
CRT Mouse mAb Abcam (ab22683) 1/1000
CHOP/GADD153 Mouse mAb Cell signalling (L63F7) 1/200
CHOP/GADD153 Rabbit pAb Santa Cruz biotechnology (sc793) 1/200
p-EIF2a Rabbit mAb Cell signalling (119A11) 1/50
XBP1 Rabbit pAb Santa Cruz biotechnology (sc-7160) 1/100
Iba1 Rabbit pAb Wako (019-19741) 1/1000
GFAP Rabbit pAb Dako (Z0334) 1/1000
GFAP Mouse mAb Sigma (G3893) 1/500
Olig2 Mouse mAb Millipore (MABN50) 1/75
Olig2 Rabbit pAb Chemicon(AB9610) 1/65
NeuN Mouse mAb Millipore (MAB377) 1/1000
CD68 Mouse mAb Calbiochem (CB1014) 1/65
SMI32 Mouse mAb Abcam (ab28029) 1/1000
Biotinylated anti-rabbit Ig Swine pAb Dako (E0353) 1/400
Biotinylated anti-mouse Ig Rabbit pAb Dako (E0354) 1/400
Biotinylated anti-rabbit IgG (H&L) Goat pAb Vector (BA-1000) 1/200
Biotinylated anti-mouse IgG (H&L) Goat pAb Vector (BA-9200) 1/200
Alexafluor 488 anti-rabbit Goat pAb Invitrogen (A11008) 1/1000
Alexafluor 568 anti-rabbit Goat pAb Invitrogen (A11011) 1/1000
Alexafluor 488 anti-mouse Goat pAb Invitrogen (A11059) 1/1000
Alexafluor 568 anti-mouse Goat pAb Invitrogen (A11019) 1/1000
Fluorescein Avidin DCS n/a Vector (A-2011) 1/500
Cy3-conjugated streptavidin n/a Jackson Immuno Research 1/4000
Table 2 Clinical & demographic details of MS & control cases
MS cases Control cases
Lab I.D. Sex/Age(y)
Disease MStype
Lab ID Sex/Age(y)Duration (y) Last relapse Steroids (Y/N) Treatment
MS 11/11 M/33 3 RR 5 mo N Natalizumab C2/11 F/45
MS 16/11 F/33 1 RR 1 yr N Copaxone C4/11 F/28
MS 19/11 F/36 3 RR 3 yr N Copaxone C7/11 M/22
MS 24/11 F/32 12 RR 2 yr N Naltrexone C13/11 M/49
MS 31/11 M/49 3 RR 1 yr N Natalizumab C14/11 F/30
MS 32/11 F/44 22 RR 2.5 yr N Natalizumab C16/11 F/33
MS 33/11 F/39 12 RR 1 yr N Natalizumab C17/11 M/31
MS 35/11 F/24 6 RR 2 yr N Natalizumab C23/11 F/82
MS 36/11 F/33 10 RR 2 yr N Natalizumab C24/11 F/39
MS 38/11 F/46 13 RR 3.5 yr N Natalizumab C2/12 F/24
MS 39/11 M/33 6 RR 3.5 yr N Natalizumab C5/12 F/42
MS 41/11 M/29 3 RR 2 yr N Natalizumab
MS 44/11 F/58 22 RR/SP NK N Copaxone
MS 47/11 F/48 5 RR 5 yr N Rebif
Key: mo months, yr years, NK not known.
Ní Fhlathartaigh et al. Acta Neuropathologica Communications 2013, 1:37 Page 12 of 15http://www.actaneurocomms.org/content/1/1/37

Ní Fhlathartaigh et al. Acta Neuropathologica Communications 2013, 1:37 Page 13 of 15http://www.actaneurocomms.org/content/1/1/37
Immunohistochemistry/ORO double stainDouble-staining for CRT and ORO was carried outby firstly performing standard immunohistochemistry(as described above), prior to counterstaining in haema-toxylin and staining with ORO (as described above).
Immunofluorescent double-stainingAll sections were brought to room temperature, air-dried,washed in PBS/0.05% Triton-X-100 and incubated inice-cold methanol for 10 min. All sections were blockedin 5% normal goat serum (NGS) for 1 h and incubatedovernight with primary antibody diluted in 1% NGS/1%BSA. Antibodies were visualised using the relevantAlexafluor conjugates (see Table 1) and all slides mountedin Vectashield containing diamino-2-phenylindole (DAPI)(Vector) to allow visualisation of nuclei.Prior to carrying out confocal analysis of dual-labelled
tissue, signal from one of the primary antibodies wasamplified. Staining was done as described above, excepta biotinylated primary antibody was used, followed by anappropriate secondary antibody (see Table 1 for details).
ImagingUV microscopy images were acquired using Olympus BX51Upright Fluorescent Microscope (Olympus, Dublin, Ireland)with Improvision Optigrid System, or an Olympus IX81Fluorescent Microscope, together with ImprovisionVolocity software (PerkinElmer, Dublin, Ireland). Confocalanalysis was done using a Zeiss LSM 510 Axiovert InvertedConfocal Microscope (Carl Zeiss).
Semiquantitative scoring of tissue stainingExpression of BiP, CHOP, XBP1, p-eIF2α and CRT wasassessed in the lesion (L) and lesion edge (LE). It wasalso noted whether there was positive staining of ERstress-associated molecules in the grey matter (GM),the central canal (CC) and normal appearing whitematter (NAWM) adjacent to lesioned WM. Scoring ofimmunostaining was carried out using a graded scale,ranging from 0.5– 4. Scores were assigned as follows:0.5=minimal positive staining; 1=small numbers ofpositive cells in the white matter; 2=moderate numberof positive cells 3=moderately high numbers of positivecells; 4=high numbers of positive cells.
Calreticulin ELISASerum levels of CRT were determined by ELISA followingthe manufacturer’s instructions (USCNK, Life Science Inc,Wuhan, China; catalogue number E91486Hu, for humansamples; catalogue number CSB-E14943r for rat samples).Rat serum samples analysed for MOG reactivity were alsoassayed for expression of circulating CRT.Clinical details of MS patients sampled for analysis of
circulating CRT, including age, disease duration, treatment
and time since last relapse are provided in Table 2. A sum-mary of relevant information from age-matched controls isgiven in the same table.
Statistical analysisDifferences in data sets were determined using analysisof variance (ANOVA) or Student’s t-tests. Real time PCRdata was analysed by a one-way ANOVA. Differences inER stress ELISA data sets were calculated using Newman-Keuls multiple comparisons test whereas Dunn’s post-testwas used to evaluate differences for the MOG ELISA dataset. Differences in ER stress expression in spinal cord tissuefollowing semi-quantitative analysis was completed with aKruskal-Wallis test followed by a Dunn’s post test, usingGraphPad Prism software (San Diego, Ca, USA). All datawere expressed as mean and the standard error of the mean(SEM). Differences were deemed significant if p < 0.05.
Additional files
Additional file 1: CD3 and CRT staining in EAE spinal cord.Immunofluorescent labelling of T cells (a) within a demyelinated lesion,using CD3 antibody (Abcam ab5690) incubated overnight at 4°C. Afterwashing and re-probing with fluorescently-tagged anti-rabbit secondaryantibody, positively stained T cells were detected (green). Dual labellingof grey matter in EAE sample spinal cord tissue (b) demonstratedlocalisation of CHOP in neurons staining positively for NeuN (arrow). Thesame protocol used for CD3 staining was followed for fluorescent CHOP(Santa Cruz, Sc793) and NeuN (Millipore MAB377) staining. Stainingobtained in the absence of primary body, but the presence of anti-rabbit(c) or anti-mouse (d) secondary antibody is shown. Scale bars = 500 μm(a, c, d) or 50 μm (b).
Additional file 2: CRT expression in MS spinal cord tissue. Snap-frozenhuman spinal cord tissue was isolated after a 22 h postmortem delay, froma male who suffered from secondary progressive MS and died at the age of45 following a disease duration of 15 years. Staining with MOG antibody(hybridoma supernatant from Reynolds lab) detected using biotinylatedHRP-labelled anti-mouse secondary antibody and DAB chromogenicsubstrate, revealed a loss of MOG expression, consistent with a lateral lesion(dotted black line, L, a). Following the same protocol to that used for MOGstaining, a serial section was stained for CRT using Abcam ab22683antibody. Positive staining for CRT was found within the lateral lesion (b). Athigher magnification, co-localisation of CRT in or at the rim of Oil RedO-stained myelin fragments was seen (c and d). Scale bars: 500 μm (a-b);50 μm (c and d). MS tissue was supplied by the UK Multiple Sclerosis TissueBank, funded by the Multiple Sclerosis Society of Great Britain and NorthernIreland, registered charity 207495.
Additional file 3: Clinical scores, humoral response and spinal corddemyelination following induction of EAE. Clinical signs of paralysiswere monitored daily (a) following EAE induction. Blood samples weretaken following sacrifice and a MOG ELSIA conducted to assess the levelof MOG antibodies in the serum. Serum from animals immunised withrmMOG had a significantly higher antibody response than control groups(b). Data are expressed as mean ± SEM. Representative spinal cordneuropathology (43 days post immunisation) with demyelination andinfiltrating inflammatory cells (by haematoxylin counterstaining) inlesioned areas (c) in DA rats immunized with MOG emulsified in IFA.Intact myelin is seen in the spinal cord white matter of saline- andIFA- injected control rats (“control”; score = 0; d & e). Immunofluorescentdouble-staining for MOG (red) and microglia/macrophage (Iba1; green)(f-h) shows that demyelination is accompanied by macrophage/microglial infiltration of the lesioned area (f). Few Iba1+ cells are presentin control animals (g and h).Tissue from saline- and IFA-injected animals

Ní Fhlathartaigh et al. Acta Neuropathologica Communications 2013, 1:37 Page 14 of 15http://www.actaneurocomms.org/content/1/1/37
(j-k) showed no positive staining for ORO. However, there was positivelipid staining in EAE lesions (i) indicating the presence of foamymacrophages. Scale bars = 100 μm (c-h) and 50 μm (i-k).
AbbreviationsATF4: Activating transcription factor 4; ATF6: Activating transcription factor 6;BiP: B cell immunoglobulin binding protein; CRT: Calreticulin; CHOP: C/EBPhomologous binding protein; EAE: Experimental autoimmuneencephalomyelitis; p-eIF2α: Phosphorylated eukaryotic initiation factor 2alpha; PERK: PKR-like endoplasmic reticulum kinase; IFA: Incomplete Freund’sadjuvant; IRE1: Inositol requiring enzyme 1; rmMOG: Recombinant mousemyelin oligodendrocyte glycoprotein; XBP1: X-box binding protein 1.
Competing interestsThe authors declared that they have no competing interest.
Authors’ contributionsMNíF carried out all of the animal work, the real-time PCR, theimmunocytochemistry and the ELISAs, in cooperation with JMcM; JMcMmanaged collection of serum samples from healthy controls; RR, trainedMNíF and other group members in the setting up of the EAE model; DavidConnolly did the confocal microscopy, EH collected and processed allpatient blood samples for storage; TC facilitated collection of all patientssamples at University College Hospital and advised on study design. Allauthors read and approved the final manuscript.
Authors’ informationThe EAE and ELISA analyses were carried out by MNíF, to fulfull requirementsof her PhD. The work described represents the first EAE study carried out bythis group and the first characterisation of ER stress signalling in a rat EAEmodel. JMcM is a senior postdoctoral researcher in the group, who hasextensive experience in histological analysis of postmortem human braintissue, in particular, that derived from patients with multiple sclerosis. RR is aProfessor of Cellular Neurobiology, based in Imperial College London. Duringa sabbatical stay at NUIG in 2009, RR helped the group to establish thespinal cord EAE model of inflammatory demyelination. RR is well knownwithin the EAE and MS fields. DC is an experimental officer withresponsibility for training and maintenance of imaging facilities within theNCBES, NUIG. He has extensive experience in a range of microscopical andimaging techniques. EH was a 3rd year medical student in receipt of aWellcome Trust summer studentship, who helped us to initiate a newbiomarker activity within our research group. TC is a consultant neruologistbased at University Hospital Galway who looks after multiple sclerosispatients attending neurology clinics. He is part of the recently initiated MSBiomarker activity at NUIG.UF became an independent investigator aftergetting an academic appointment at NUIG in 2006. She has been seniorauthor on 3 studies of ER stress in post-mortem human MS brain tissue. Thisstudy is the first one done by the group using the EAE animal model.
AcknowledgementsM. Ní Fhlathartaigh was funded by the Irish Research Council and the NUIGFoundation Office. J. McMahon is supported by the NUIG Foundation Office.E. Higgins was supported by a Wellcome Trust summer studentship. R.Reynolds was supported by a Science Foundation Ireland Walton VisitingProfessor award, grant 08/W.1/B2561.The authors acknowledge the facilitiesand scientific and technical assistance of the Centre for Microscopy & Imaging atthe National University of Ireland Galway (www.imaging.nuigalway.ie), a facilitythat is funded by NUIG and the Irish Government’s Programme for Research inThird Level Institutions, Cycles 4 and 5, National Development Plan 2007-201.
Author details1National Centre for Biomedical Engineering Science, Galway NeuroscienceCentre, National University of Ireland, Galway, Ireland. 2Centre forNeuroscience, Department of Medicine, Imperial College, London, UK.3University Hospital, Galway, Ireland.
Received: 14 March 2013 Accepted: 28 June 2013Published: 15 July 2013
References1. Antony JM, Ellestad KK, Hammond R, Imaizumi K, Mallet F, Warren KG,
Power C: The human endogenous retrovirus envelope glycoprotein,syncytin-1, regulates neuroinflammation and its receptor expression inmultiple sclerosis: a role for endoplasmic reticulum chaperones inastrocytes. J Immunol 2007, 179:1210–1224.
2. Cunnea P, Mhaille AN, McQuaid S, Farrell M, McMahon J, FitzGerald U:Expression profiles of endoplasmic reticulum stress-related molecules indemyelinating lesions and multiple sclerosis. Mult Scler 2011, 17:808–818.
3. McMahon J, McQuaid S, Reynolds R, Fitzgerald U: Increased expression ofER stress- and hypoxia-associated molecules in grey matter lesions inmultiple sclerosis. Mult Scler 2012, 17:1437–1447.
4. Mhaille AN, McQuaid S, Windebank A, Cunnea P, McMahon J, Samali A,FitzGerald U: Increased expression of endoplasmic reticulum stress-relatedsignaling pathway molecules in multiple sclerosis lesions. J Neuropathol ExpNeurol 2008, 67:200–211.
5. Walter P, Ron D: The unfolded protein response: from stress pathway tohomeostatic regulation. Science 2011, 334:1081–1086.
6. Szegezdi E, Logue SE, Gorman AM, Samali A: Mediators of endoplasmicreticulum stress-induced apoptosis. EMBO Rep 2006, 7:880–885.
7. Michalak M, Groenendyk J, Szabo E, Gold LI, Opas M: Calreticulin,a multi-process calcium-buffering chaperone of the endoplasmicreticulum. Biochem J 2009, 417:651–666.
8. Gold LI, Eggleton P, Sweetwyne MT, Van Duyn LB, Greives MR, Naylor SM,Michalak M, Murphy-Ullrich JE: Calreticulin: non-endoplasmic reticulumfunctions in physiology and disease. FASEB J 2010, 24:665–683.
9. Wang WA, Groenendyk J, Michalak M: Calreticulin signaling in health anddisease. Int J Biochem Cell Biol 2012, 44:842–846.
10. Gardai SJ, McPhillips KA, Frasch SC, Janssen WJ, Starefeldt A, Murphy-Ullrich JE,Bratton DL, Oldenborg PA, Michalak M, Henson PM: Cell-surface calreticulininitiates clearance of viable or apoptotic cells through trans-activation ofLRP on the phagocyte. Cell 2005, 123:321–334.
11. Ogden CA, de Cathelineau A, Hoffmann PR, Bratton D, Ghebrehiwet B,Fadok VA, Henson PM: C1q and mannose binding lectin engagement ofcell surface calreticulin and CD91 initiates macropinocytosis and uptakeof apoptotic cells. J Exp Med 2001, 194:781–795.
12. Kishore U, Sontheimer RD, Sastry KN, Zaner KS, Zappi EG, Hughes GR,Khamashta MA, Strong P, Reid KB, Eggleton P: Release of calreticulin fromneutrophils may alter C1q-mediated immune functions. Biochem J 1997,322(Pt 2):543–550.
13. Peters LR, Raghavan M: Endoplasmic reticulum calcium depletion impactschaperone secretion, innate immunity, and phagocytic uptake of cells.J Immunol 2011, 187:919–931.
14. Holoshitz J, De Almeida DE, Ling S: A role for calreticulin in thepathogenesis of rheumatoid arthritis. Ann N Y Acad Sci 2010, 1209:91–98.
15. Chakrabarty A, Danley MM, LeVine SM: Immunohistochemical localizationof phosphorylated protein kinase R and phosphorylated eukaryoticinitiation factor-2 alpha in the central nervous system of SJL mice withexperimental allergic encephalomyelitis. J Neurosci Res 2004, 76:822–833.
16. Chakrabarty A, Fleming K, Marquis J, LeVine S: Quantifying immunohistochemicalstaining of phospho-eIF2alpha, heme oxygenase-2 and NADPH cytochromeP450 reductase in oligodendrocytes during experimental autoimmuneencephalomyelitis. J Neurosci Methods 2005, 144:227–234.
17. Deslauriers AM, Afkhami-Goli A, Paul AM, Bhat RK, Acharjee S, Ellestad KK,Noorbakhsh F, Michalak M, Power C: Neuroinflammation and endoplasmicreticulum stress are coregulated by crocin to prevent demyelination andneurodegeneration. J Immunol 2011, 187:4788–4799.
18. Lin W, Bailey SL, Ho H, Harding HP, Ron D, Miller SD, Popko B: The integratedstress response prevents demyelination by protecting oligodendrocytesagainst immune-mediated damage. J Clin Invest 2007, 117:448–456.
19. Lin W, Kemper A, Dupree J, Harding H, Ron D, Popko B: Interferon-gammainhibits central nervous system remyelination through a processmodulated by endoplasmic reticulum stress. Brain 2006, 129:1306–1318.
20. Lin W, Popko B: Endoplasmic reticulum stress in disorders of myelinatingcells. Nat Neurosci 2009, 12:379–385.
21. Eggleton P, Lieu TS, Zappi EG, Sastry K, Coburn J, Zaner KS, Sontheimer RD,Capra JD, Ghebrehiwet B, Tauber AI: Calreticulin is released from activatedneutrophils and binds to C1q and mannan-binding protein. Clin ImmunolImmunopathol 1994, 72:405–409.
22. Andrin C, Pinkoski MJ, Burns K, Atkinson EA, Krahenbuhl O, Hudig D, Fraser SA,Winkler U, Tschopp J, Opas M, et al: Interaction between a Ca2+-binding

Ní Fhlathartaigh et al. Acta Neuropathologica Communications 2013, 1:37 Page 15 of 15http://www.actaneurocomms.org/content/1/1/37
protein calreticulin and perforin, a component of the cytotoxic T-cellgranules. Biochemistry 1998, 37:10386–10394.
23. Sipione S, Ewen C, Shostak I, Michalak M, Bleackley RC: Impaired cytolyticactivity in calreticulin-deficient CTLs. J Immunol 2005, 174:3212–3219.
24. Paidassi H, Tacnet-Delorme P, Verneret M, Gaboriaud C, Houen G, Duus K,Ling WL, Arlaud GJ, Frachet P: Investigations on the C1q-calreticulin-phosphatidylserine interactions yield new insights into apoptotic cellrecognition. J Mol Biol 2011, 408:277–290.
25. Tarr JM, Young PJ, Morse R, Shaw DJ, Haigh R, Petrov PG, Johnson SJ,Winyard PG, Eggleton P: A mechanism of release of calreticulin from cellsduring apoptosis. J Mol Biol 2010, 401:799–812.
26. Obeid M, Tesniere A, Ghiringhelli F, Fimia GM, Apetoh L, Perfettini JL, CastedoM, Mignot G, Panaretakis T, Casares N, et al: Calreticulin exposure dictates theimmunogenicity of cancer cell death. Nat Med 2007, 13:54–61.
27. Tarr JM, Winyard PG, Ryan B, Harries LW, Haigh R, Viner N, Eggleton P:Extracellular calreticulin is present in the joints of patients withrheumatoid arthritis and inhibits FasL (CD95L)-mediated apoptosis ofT cells. Arthritis Rheum 2010, 62:2919–2929.
28. Shields AM, Panayi GS, Corrigall VM: Resolution-associated molecularpatterns (RAMP): RAMParts defending immunological homeostasis?Clin Exp Immunol 2011, 165:292–300.
29. Reynolds R, Dawson M, Papadopoulos D, Polito A, Di Bello IC, Pham-Dinh D,Levine J: The response of NG2-expressing oligodendrocyte progenitorsto demyelination in MOG-EAE and MS. J Neurocytol 2002, 31:523–536.
30. Storch MK, Piddlesden S, Haltia M, Iivanainen M, Morgan P, Lassmann H:Multiple sclerosis: in situ evidence for antibody and complement-mediateddemyelination. Annals of Neurology 1998, 43:465–471.
doi:10.1186/2051-5960-1-37Cite this article as: Ní Fhlathartaigh et al.: Calreticulin and othercomponents of endoplasmic reticulum stress in rat and humaninflammatory demyelination. Acta Neuropathologica Communications2013 1:37.
Submit your next manuscript to BioMed Centraland take full advantage of:
• Convenient online submission
• Thorough peer review
• No space constraints or color figure charges
• Immediate publication on acceptance
• Inclusion in PubMed, CAS, Scopus and Google Scholar
• Research which is freely available for redistribution
Submit your manuscript at www.biomedcentral.com/submit