caltrain triennial report v1 22016... · 447 sutter street – penthouse north san ... 2016...
TRANSCRIPT
OCTOBER 2016
Caltrain Triennial Customer Survey
SUMMARY REPORT
Prepared by
COREY, CANAPARY & GALANIS RESEARCH 447 Sutter Street – Penthouse North San Francisco, CA 94108

2016 CALTRAIN TRIENNIAL CUSTOMER SURVEY | SUMMARY REPORT
2 Corey, Canapary & Galanis
CONTENTS
INTRODUCTION ......................................................................................................................................... 4
EXECUTIVE SUMMARY .............................................................................................................................. 7
CHARTS – KEY FINDINGS ......................................................................................................................... 10
Main Reasons for Riding Caltrain ....................................................................................................... 11
Frequency of Riding Caltrain ‐ 2016 ................................................................................................... 12
Trip Purpose ........................................................................................................................................ 13
Car Availability .................................................................................................................................... 14
Station Access by Mode ...................................................................................................................... 15
Fare Payment ...................................................................................................................................... 16
Attribute Ratings (Mean Scores) ........................................................................................................ 17
DETAILED RESULTS .................................................................................................................................. 18
TRIP‐SPECIFIC INFORMATION ................................................................................................................. 19
Rider Longevity ................................................................................................................................... 19
Frequency of Riding Caltrain ............................................................................................................... 20
Fare Payment ...................................................................................................................................... 21
Fare Category ...................................................................................................................................... 22
Round Trip vs. One‐way Trip .............................................................................................................. 23
Trip Purpose ........................................................................................................................................ 24
Distance From Starting Location to Caltrain Station .......................................................................... 25
Main Reasons for Riding Caltrain ....................................................................................................... 26
Boarding Station ................................................................................................................................. 27
Alighting Station ................................................................................................................................. 28
Access and Egress ............................................................................................................................... 29
Car Availability .................................................................................................................................... 31
Motivation for Newer Riders .............................................................................................................. 32
SATISFACTION WITH CALTRAIN .............................................................................................................. 33
Satisfaction Ratings ............................................................................................................................. 33
INFORMATION AND FARE PAYMENT CHOICES ...................................................................................... 35
Internet Access ................................................................................................................................... 35
Banking Access .................................................................................................................................... 36
Clipper Card Use ................................................................................................................................. 37

2016 CALTRAIN TRIENNIAL CUSTOMER SURVEY | SUMMARY REPORT
3 Corey, Canapary & Galanis
Barriers to Clipper Card Use ............................................................................................................... 38
Caltrain Information ........................................................................................................................... 40
RIDER DEMOGRAPHICS ........................................................................................................................... 41
Gender ................................................................................................................................................ 41
Marital Status ..................................................................................................................................... 42
Education ............................................................................................................................................ 43
Employment Status ............................................................................................................................. 44
Age ...................................................................................................................................................... 45
Annual Household Income ................................................................................................................. 46
English Proficiency .............................................................................................................................. 47
Languages Spoken in the Home ......................................................................................................... 49
Ethnicity .............................................................................................................................................. 50
Country of Birth .................................................................................................................................. 51
Home Region (Based on ZIP Code) ..................................................................................................... 52
APPENDICES ............................................................................................................................................ 55
Survey Distribution and Response ...................................................................................................... 56
Language Barriers ............................................................................................................................... 57
Interviewer Instructions ..................................................................................................................... 58
Survey Questionnaires ........................................................................................................................ 74

2016 CALTRAIN TRIENNIAL CUSTOMER SURVEY | SUMMARY REPORT
4 Corey, Canapary & Galanis
INTRODUCTION This report details the findings of an onboard survey of Caltrain riders. The fieldwork on this study was conducted in October 2016. A total of 5,554 surveys were completed by Caltrain riders. Key objectives of the survey include:
Reporting trip characteristics, such as peak/off‐peak/weekend use.
Reporting personal travel characteristics, such as frequency of Caltrain use and primary reasons for riding Caltrain.
Reporting demographic characteristics, such as race, national origin, marital status, age, income, etc.
Ratings of six specific service characteristics, including one overall assessment of the entire Caltrain experience.
This report includes the following key sections: Executive Overview, Charts/Key Findings, Detailed Results, and the Appendix. The Appendix of this report includes a copy of the questionnaire, interviewer training instructions, and information on trains sampled. Additional information is provided in the Verbatim Comments and Cross‐tabulated Tables. Please note that the percentages included in this report may not add to 100% due to statistical rounding. Questions regarding this project may be directed to: Christiane Kwok, Caltrain Market Research & Development Manager, 650.508.7926. Changes in Caltrain Service Since Last Survey
Since the last Caltrain Triennial Customer Survey in 2013, there were several fare changes to the Caltrain Codified Tariff, including adjustments to the daily and monthly parking fees, Go Pass program, Adult and Eligible Discount base fare, Clipper fare differential and Youth age fare.
A new station was built, including grade separation, at San Bruno, which was completed in April 2014. The station features 201 parking spaces and enhanced platform accessibility.
In May 2015 and July 2016, Caltrain increased service capacity by adding one car to the five‐‐car Bombardier train sets.
Replacement of a pedestrian/vehicle bridge over Caltrain tracks at 23rd Street in San Francisco was completed in March 2016.
In April 2016, a third bike car was added to the Bombardier train sets, increasing capacity from 48 to 72 bike spaces, compared with 80 bike spaces on Gallery train sets
Replacement of four San Mateo railway bridges was completed in October 2016.

2016 CALTRAIN TRIENNIAL CUSTOMER SURVEY | SUMMARY REPORT
5 Corey, Canapary & Galanis
Methodology and Response Rate The survey was conducted as an onboard self‐administered questionnaire distributed to Caltrain riders. Surveyors boarded pre‐selected trains, and attempted to distribute questionnaires to all passengers on a randomly selected car of the assigned train. Completed surveys were collected by these surveyors (who stayed onboard during the train route). Specific steps were taken to ensure the highest possible response rate. This included using professional, experienced onboard surveyors on the project, making the questionnaire available in English and Spanish, and providing a business reply mail‐back option for persons who did not have time to complete the survey onboard. The overall response rate (74%) was high for a system‐wide survey of this type. The response rate was calculated by dividing the total number of completes (5,554) by all eligible passengers riding on the sampled trains (7,523). Additional information on the survey distribution and response rate is provided in the Appendix of this report. Field interviewing on this project was conducted from Tuesday, October 4, 2016, to Wednesday, October 26, 2016. The weekday shifts were allocated to allow for surveying during morning and afternoon peak periods, as well as off‐peak periods. Saturday and Sunday trains were also surveyed at various times of the day. The dates of the fieldwork were scheduled to avoid surveying during special events that would unduly impact ridership. Surveyors returned completed questionnaires to Corey, Canapary & Galanis’ office following the completion of the fieldwork. Editing, coding, and inputting were done in‐house once the questionnaires were returned. Sampling In total, 5,554 surveys were completed by riders. This total equates to a system‐wide margin of error of +/‐ 1.30% (at the 95% confidence level). The sampling on the study was designed to achieve a cross section of riders utilizing trains at various times of the day. Surveys were conducted on weekdays (Tuesday, Wednesday, and Thursday), as well as on Saturday and Sunday. We sampled a total of 62 weekday routes and 10 weekend routes. Of the 62 weekday routes surveyed, 29 were Limited trains, 19 were Local trains, and 14 were Bullet trains. For each train sampled, a specific car was selected, and we attempted to survey every passenger in the selected car. The 2016 distribution of trains sampled was comparable to 2013.
2016 CALTRAIN TRIENNIAL CUSTOMER SURVEY | SUMMARY REPORT
6 Corey, Canapary & Galanis
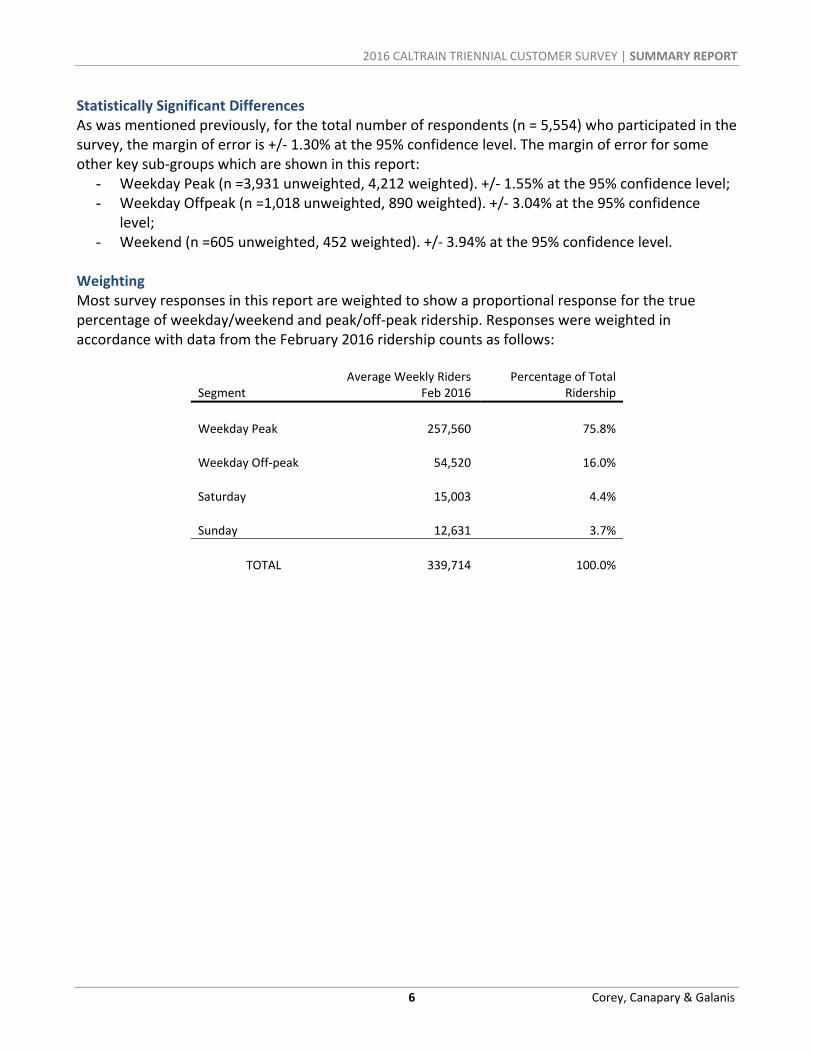
Statistically Significant Differences As was mentioned previously, for the total number of respondents (n = 5,554) who participated in the survey, the margin of error is +/‐ 1.30% at the 95% confidence level. The margin of error for some other key sub‐groups which are shown in this report:
- Weekday Peak (n =3,931 unweighted, 4,212 weighted). +/‐ 1.55% at the 95% confidence level; - Weekday Offpeak (n =1,018 unweighted, 890 weighted). +/‐ 3.04% at the 95% confidence
level; - Weekend (n =605 unweighted, 452 weighted). +/‐ 3.94% at the 95% confidence level.
Weighting Most survey responses in this report are weighted to show a proportional response for the true percentage of weekday/weekend and peak/off‐peak ridership. Responses were weighted in accordance with data from the February 2016 ridership counts as follows:
Segment Average Weekly Riders
Feb 2016 Percentage of Total
Ridership
Weekday Peak 257,560 75.8%
Weekday Off‐peak 54,520 16.0%
Saturday 15,003 4.4%
Sunday 12,631 3.7%
TOTAL 339,714 100.0%
2016 CALTRAIN TRIENNIAL CUSTOMER SURVEY | SUMMARY REPORT
7 Corey, Canapary & Galanis
EXECUTIVE SUMMARY
Length of Time Using Caltrain
More than a third of riders (34%) have been riding Caltrain less than one year.
In 2016, a slightly higher share of weekend riders said this trip was their first trip (18%) compared to 2013 (13%).
Frequency of Riding Caltrain
About two‐thirds of riders (66%) ride Caltrain at least four days per week.
However, in 2016, there has been an increase in Weekday Offpeak and Weekend riders who are using the service less than once a month. In 2013, 16% of Offpeak riders and 36% of Weekend riders said they used the service less than once a month. In 2016, this rose to 20% of Weekday Off‐peak riders and 45% of Weekend riders.
Fare Media Wider use of technology and other ridership trends have changed how riders pay for their trip.
More than one third of respondents (36%) paid for their Caltrain trip with a Clipper Caltrain monthly pass. However, this is a decrease from 2013, when 41% paid in this way.
By contrast, the share who paid for their Caltrain trip using a Go Pass rose from 14% in 2013 to 21% in 2016. Notably, this increase in Go Pass use exists across Weekday Peak, Weekday Off‐peak, and Weekend time periods.
In addition to this change, more respondents in 2016 said they are using Clipper cash value to pay for their Caltrain trip (16% in 2016 vs. 11% in 2013), and slightly fewer are using a one‐way ticket (12% in 2016 vs. 16% in 2013). Day Pass use also declined slightly (from 12% in 2013 to 10% in 2016). This pattern also remains consistent across Weekday Peak, Weekday Off‐peak, and weekend time periods.
Distance from Starting Location to Caltrain Station In 2016, a question was introduced asking respondents how far it was from their starting point to their Caltrain station.
While nearly half of respondents (49%) travel 10 miles or less to reach their Caltrain station, more than a third (35%) travel 20 or more miles.
The median distance traveled between start location and Caltrain station was 12 miles overall; 12 miles among Weekday Peak riders; 15 among Weekday Off‐peak riders; and 14 among Weekend riders.
Why Riders Choose Caltrain
Nearly two‐thirds of riders (62%) said they ride Caltrain to avoid traffic. This is an increase from 57% who said they rode Caltrain for this reason in 2013.
Notably, 22% of respondents in 2016 said they chose Caltrain because it was faster than other options, compared to 17% in 2013.

2016 CALTRAIN TRIENNIAL CUSTOMER SURVEY | SUMMARY REPORT
8 Corey, Canapary & Galanis
While those saying they did not drive or have access to a car dropped from 2013 to 2016 (with 29% of respondents giving this as a reason in 2013 and 25% in 2016), 37% of Weekend riders in 2016 still indicated they chose Caltrain because they did not have a car or did not drive. However, this, too, is a decrease, as in 2013, 44% of Weekend riders indicated they chose Caltrain because they did not have a car or did not drive.
Stations Used
Nearly half of all riders boarded Caltrain in San Francisco (25%), San Jose Diridon (11%), Palo Alto (8%), Sunnyvale (7%), or Mountain View (7%).
San Francisco was the most common boarding station across all major time periods.
San Francisco is the most commonly cited station where riders exit the Caltrain system as well.
After San Francisco, riders most commonly exited the train at Palo Alto (14%) and Mountain View (8%).
Access/Egress on Caltrain
Nearly three in 10 (32%) of respondents walked to Caltrain, and about the same share (32%) got to their final destination by walking from the Caltrain station.
Use of TNC’s rose from less than 1% in 2013 for both access and egress to 3% for both access and egress in 2016.
Weekend riders were most likely to use TNCs, as well as most car‐based transportation, than Weekday Peak or Weekday Off‐peak‐peak riders.
In 2016, private buses (such as Chariot and Megabus) were mentioned, most commonly among Weekday Peak riders.
Car Availability
Overall, 60% of Caltrain riders had a car available for the surveyed trip.
The share of Weekday Peak riders who said they had access to a car for the surveyed trip softened slightly, from 65% in 2013 to 63% in 2016.
Conversely, more Weekend riders said they had access to a car in 2016 (49%) than in 2013 (46%). Motivation for Newer Riders
Those who have ridden Caltrain less than one year cited a change in company (31%), worsening traffic (29%), and lack of access to a car (21%) as the reasons they began riding Caltrain.
Weekday Peak riders were most likely to cite a change in company (37%).
Weekend riders were most likely to cite lack of access to a car (33%).
Weekday Offpeak riders were most likely to cite worsening traffic (25%) and lack of access to a car (24%).
Satisfaction with Caltrain
Overall, Caltrain riders rated their experience on Caltrain 4.09 (out of 5.00), an increase over 2013’s 4.04 (and a return to 2010 satisfaction levels).
Riders rated the effectiveness of station signs 3.90, compared to 2013 rating of 3.81.

2016 CALTRAIN TRIENNIAL CUSTOMER SURVEY | SUMMARY REPORT
9 Corey, Canapary & Galanis
Ratings on value for the money, and satisfaction with www.caltrain.com rose only slightly, while rating of connections with other transit systems softened to 3.52 (from 3.58 in 2013).
Rider Demographics
Among all Caltrain riders, 58% are male, and 46% are single.
Married riders are most likely to be riding during the Weekday Peak time period, while Single riders are most likely to ride on the Weekend.
Nearly all riders (96%) have a high school diploma, while 81% have graduated college.
Caltrain riders are a diverse audience. They speak 72 languages in their homes, and while 60% say they are born in the United States, 40% were born in one of 105 countries around the world.
2016 CALTRAIN TRIENNIAL CUSTOMER SURVEY | SUMMARY REPORT
10 Corey, Canapary & Galanis
CHARTS – KEY FINDINGS Note: Percentages included in this section may not add to 100% due to statistical rounding.

2016 CALTRAIN TRIENNIAL CUSTOMER SURVEY | SUMMARY REPORT
11 Corey, Canapary & Galanis
62%
34%
31%
26%
25%
25%
22%
16%
13%
4%
Avoid Traffic
Relax/Reduce Stress
Productive Use of Time
Help the Environment
Save Money (Gas, Wear and Tearon Car)
Don't have a Car/Don't Drive
Faster Than Other Options
Employer Subsidy
Lack of/Cost of Parking
Other
Main Reasons for Riding Caltrain 8. What are your main reasons for riding Caltrain? Base: Total (5,554) [Multiple answers accepted]

2016 CALTRAIN TRIENNIAL CUSTOMER SURVEY | SUMMARY REPORT
12 Corey, Canapary & Galanis
Frequency of Riding Caltrain ‐ 2016 2. How often do you usually ride Caltrain?
Base: Total (5,554)
11%
6%3%
5%
9%
14%
48%
5%
Less than once amonth
1‐3 days/month 1 day/week 2 days/week 3 days/week 4 days/week 5 days/week 6‐7 days/week

2016 CALTRAIN TRIENNIAL CUSTOMER SURVEY | SUMMARY REPORT
13 Corey, Canapary & Galanis
Trip Purpose 6. What is the main purpose of your trip today?
Base: Total (5,554)
77%
13%
6%3% 2% 1%
Work Social/Recreational/Cultural School Going Home Shopping/Errands Airport

2016 CALTRAIN TRIENNIAL CUSTOMER SURVEY | SUMMARY REPORT
14 Corey, Canapary & Galanis
Car Availability 12. Did you have a car available to take this particular trip?
Those who stated that they had a car available, by time period
Base: Total (5,554)
60%
40%
Yes, had a car available No, did not have a car available
63%
51% 49%
Weekday Peak Weekday Off‐peak Weekend

2016 CALTRAIN TRIENNIAL CUSTOMER SURVEY | SUMMARY REPORT
15 Corey, Canapary & Galanis
Station Access by Mode 11a. How did you get to the station where you got on this train?
Base: Total (5,554) [Multiple answers accepted]
32%
23%
18%
15%
9%
4%
Walked all the way Drove vehicle Transit Bicycle Dropped off by car All Other

2016 CALTRAIN TRIENNIAL CUSTOMER SURVEY | SUMMARY REPORT
16 Corey, Canapary & Galanis
Fare Payment 3. How did you pay for this train trip (today)?
Base: Total (5,554)
36%
21%
16%
12%10%
5%
1%
Clipper/CaltrainMonthly Pass
Go Pass Clipper CashValue
One‐way Ticket Day Pass Clipper 8‐ride All Other
2016 CALTRAIN TRIENNIAL CUSTOMER SURVEY | SUMMARY REPORT
17 Corey, Canapary & Galanis
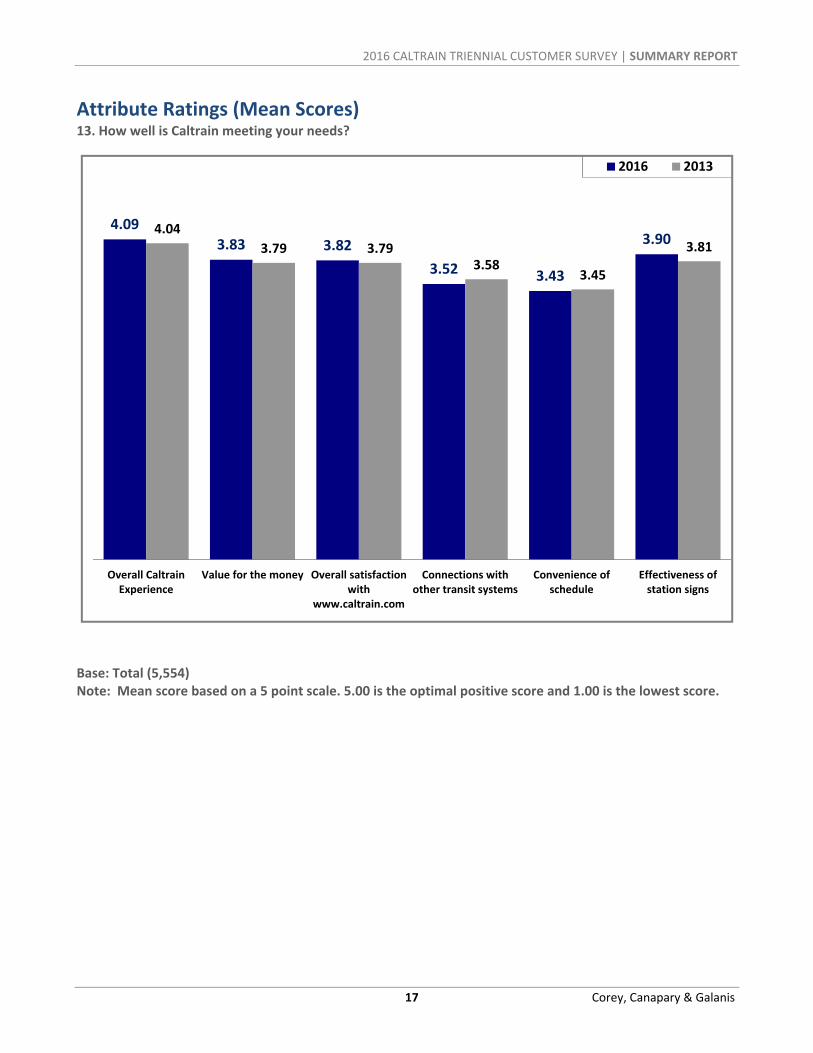
Attribute Ratings (Mean Scores) 13. How well is Caltrain meeting your needs?
Base: Total (5,554) Note: Mean score based on a 5 point scale. 5.00 is the optimal positive score and 1.00 is the lowest score.
4.09
3.83 3.82
3.52 3.43
3.904.04
3.79 3.793.58
3.45
3.81
Overall CaltrainExperience
Value for the money Overall satisfactionwith
www.caltrain.com
Connections withother transit systems
Convenience ofschedule
Effectiveness ofstation signs
2016 2013

2016 CALTRAIN TRIENNIAL CUSTOMER SURVEY | SUMMARY REPORT
18 Corey, Canapary & Galanis
DETAILED RESULTS Note: Percentages included in this section may not add to 100% due to statistical rounding.

2016 CALTRAIN TRIENNIAL CUSTOMER SURVEY | SUMMARY REPORT
19 Corey, Canapary & Galanis
TRIP‐SPECIFIC INFORMATION Rider Longevity 1. How long have you been riding Caltrain?
More than one third of riders (34%) have been riding Caltrain less than one year. This is fairly consistent with the 2013 study. However, in 2016, a slightly higher share of weekend riders said this trip was their first trip (18%) compared to 2013 (13%).
2016 Total 2013 Total Base (All Respondents) 5,554 4,721 % %
This is my first trip 5 5
Less than 6 months 19 21
6 months to less than 1 year 10 10
1 year to less than 2 years 18 18
2 years to less than 4 years 19 18
4 years or more 31 29
Total 100 100
Weekday Peak Weekday Off‐peak Weekend
2016 2013 2016 2013 2016 2013
Base (All Respondents) 4,212 3,547 890 766 452 409 % % % % % %
This is my first trip 3 3 9 9 18 13
Less than 6 months 19 21 17 22 17 19
6 months to less than 1 year 10 10 9 9 8 10
1 year to less than 2 years 19 19 15 15 11 14
2 years to less than 4 years 19 19 18 18 12 12
4 years or more 30 29 33 28 35 33
Total 100 100 100 100 100 100
(See Statistical Table 1)

2016 CALTRAIN TRIENNIAL CUSTOMER SURVEY | SUMMARY REPORT
20 Corey, Canapary & Galanis
Frequency of Riding Caltrain 2. How often do you usually ride Caltrain?
In 2016, two‐thirds of riders (66%) ride Caltrain at least 4 days per week. This is relatively consistent with 2013. However, in 2016, there has been an increase in Weekday Off‐peak and Weekend riders who are using the service less than once a month. In 2013, 16% of Off‐peak riders and 36% of Weekend riders said they use the service less than once a month. In 2016, this rose to 20% of Off‐peak riders and 45% of Weekend riders.
2016 Total 2013 Total Base (All Respondents) 5,554 4,721 % %
6‐7 days a week 5 5
5 days a week 48 49
4 days a week 14 13
3 days a week 9 8
2 days a week 5 5
1 day a week 3 3
1‐3 days a month 6 7
Less than once a month 11 10
Total 100 100
Weekday Peak Weekday Off‐peak Weekend
2016 2013 2016 2013 2016 2013
Base (All Respondents) 4,212 3,547 890 766 452 409 % % % % % %
6‐7 days a week 5 5 5 7 6 7
5 days a week 55 56 31 36 8 9
4 days a week 15 14 13 11 3 4
3 days a week 9 9 11 8 4 6
2 days a week 4 5 7 8 5 8
1 day a week 2 3 5 4 8 9
1‐3 days a month 4 4 9 10 21 21
Less than once a month 6 5 20 16 45 36
Total 100 100 100 100 100 100
(See Statistical Table 2)

2016 CALTRAIN TRIENNIAL CUSTOMER SURVEY | SUMMARY REPORT
21 Corey, Canapary & Galanis
Fare Payment 3. How did you pay for this train trip (today)?
More than one third of respondents (36%) paid for their Caltrain trip with a Clipper Caltrain Monthly Pass. However, this is a decrease from 2013, when 41% paid in this way. By contrast, the share of those who paid for their Caltrain trip using a Go Pass rose from 14% in 2013 to 21% in 2016. Notably, this increase in Go Pass use exists across Weekday Peak, Weekday Off‐peak, and Weekend time periods. In addition to this change, more respondents in 2016 said they are using Clipper cash value to pay for their Caltrain trip (16% in 2016 vs. 11% in 2013), and slightly fewer are using One‐way ticket (12% in 2016 vs. 16% in 2013). Day Pass use also declined slightly (from 12% in 2013 to 10% in 2016). This pattern also remains consistent across Weekday Peak, Weekday Off‐peak, and Weekend time periods.
2016 Total 2013 Total Base (All Respondents) 5,554 4,721 % %
Clipper Caltrain Monthly Pass 36 41
GO Pass 21 14
Clipper Cash Value 16 11
One‐way Ticket 12 16
Day Pass 10 12
Clipper 8‐ride Ticket 5 6
Other <1 1
Total 100 100
Weekday Peak Weekday Off‐peak Weekend
2016 2013 2016 2013 2016 2013
Base (All Respondents) 4,212 3,547 890 766 452 409 % % % % % %
Clipper Caltrain Monthly Pass 43 48 22 26 6 10
GO Pass 23 15 18 13 8 4
Clipper Cash Value 14 10 20 14 22 15
One‐way Ticket 8 11 20 24 29 38
Day Pass 6 9 15 17 32 28
Clipper 8‐ride Ticket 5 7 4 6 2 5
Other <1 1 <1 1 1 <1
Total 100 100 100 100 100 100
“Other” category includes those traveling on an employee pass, law enforcement, active duty military, and those who simply said they did not pay. (See Statistical Table 3)

2016 CALTRAIN TRIENNIAL CUSTOMER SURVEY | SUMMARY REPORT
22 Corey, Canapary & Galanis
Fare Category 4. What is your fare category?
Most respondents (93%) paid an adult fare on their Caltrain trip. However, a slightly higher share of seniors travel during the Weekday Off‐peak period than the Weekday Peak period, and a slightly higher share of both youth and seniors travel during the Weekend period (6% youth, 5% seniors) compared to the Weekday Peak period. The share of seniors riding during the Weekend period, however, has declined since 2013, when they accounted for 8% of Weekend riders.
2016 Total 2013 Total Base (All Respondents) 5,554 4,721 % %
Adult 93 94
Youth 3 2
Senior 3 3
Disabled 1 1
Medicare cardholder <1 <1
Other <1 ‐
Total 100 100
Weekday Peak Weekday Off‐peak Weekend
2016 2013 2016 2013 2016 2013
Base (All Respondents) 4,212 3,547 890 766 452 409 % % % % % %
Adult 94 95 91 92 88 87
Youth 3 2 3 2 6 4
Senior 2 3 5 4 5 8
Disabled <1 1 1 2 1 1
Medicare cardholder <1 <1 1 1 <1 1
Other <1 ‐ ‐ ‐ ‐ ‐
Total 100 100 100 100 100 100
“Other” category includes those traveling on an employee pass, law enforcement, active duty military, and those who simply said they did not pay.
(See Statistical Table 4)

2016 CALTRAIN TRIENNIAL CUSTOMER SURVEY | SUMMARY REPORT
23 Corey, Canapary & Galanis
Round Trip vs. One‐way Trip 5. Are you making a round trip on Caltrain today?
Most riders on Caltrain (87%) are making a round‐trip. Weekday Peak riders are most likely to be making a round trip (90%), while Weekend riders are least likely to do so (71%). However, the share of Weekend riders making a round‐trip has risen slightly from 2013, when 67% said they were making a round‐trip.
2016 Total 2013 Total Base (All Respondents) 5,554 4,721 % %
Yes (Making a Round‐trip) 87 86
No 13 14
Total 100 100
Weekday Peak Weekday Off‐peak Weekend
2016 2013 2016 2013 2016 2013
Base (All Respondents) 4,212 3,547 890 766 452 409 % % % % % %
Yes (Making a Round‐trip) 90 89 81 81 71 67
No 10 11 19 19 29 33
Total 100 100 100 100 100 100
(See Statistical Table 5)

2016 CALTRAIN TRIENNIAL CUSTOMER SURVEY | SUMMARY REPORT
24 Corey, Canapary & Galanis
Trip Purpose 6. What is the main purpose of your trip today? (Multiple responses accepted)
Most riders (77%) use Caltrain for commuting to work or traveling to other work‐related functions. This was highest among the Weekday Peak riders, of whom 87% were traveling for work‐related reasons, and lowest among Weekend riders, of whom only 11% were traveling for work‐related purposes. A higher share of Weekday Off‐peak and Weekend riders were traveling for social/recreational/ cultural purposes in 2016 than in 2013. While 17% of Weekday Off‐peak riders in 2013 were traveling for this purpose, the share of Weekday Off‐peak riders rose to 23% in 2016. Similarly, 66% of Weekend riders were traveling for social/recreational purposes in 2013, but 72% of Weekend riders were traveling for this purpose in 2016.
2016 Total 2013 Total Base (All Respondents) 5,554 4,721 % %
Work 77 75
Social/recreational/cultural 13 13
School 6 6
“Going home” 3 4
Shopping/errands/personal business 2 3
Airport 1 1
Other (not specified) <1 <1
Weekday Peak Weekday Off‐peak‐
peak Weekend
2016 2013 2016 2013 2016 2013
Base (All Respondents) 4,212 3,547 890 766 452 409 % % % % % %
Work 87 85 63 62 11 13
Social/recreational/cultural 5 6 23 17 72 66
School 6 6 7 10 3 3
“Going home” 2 3 5 6 10 11
Shopping/errands/personal business 1 2 3 4 5 7
Airport 1 1 1 3 1 2
Other (not specified) <1 <1 1 1 1 1
(See Statistical Table 6)

2016 CALTRAIN TRIENNIAL CUSTOMER SURVEY | SUMMARY REPORT
25 Corey, Canapary & Galanis
Distance From Starting Location to Caltrain Station Q7. What is the approximate distance between your starting location and the Caltrain station you used today?
Nearly half of all respondents (49%) travel 10 miles or less to reach a Caltrain station; however, more than one third (35%) travel more than 20 miles. The median number of miles traveled to reach a Caltrain station is 12. Weekday Off‐peak and Weekend riders were more likely to travel a longer distance, with the median number of miles traveled 15 and 14 for those time periods, respectively. This question was not asked prior to 2016. TOTAL 2016
Base (All Respondents) 5,554 %
Less than 1 mile 7
1 to 5 miles 32
6 to 10 miles 10
11 to 20 miles 16
More than 20 miles 35
Total % 100
Average Number of Miles: 17.8
Median Number of Miles: 12.0
Weekday Peak Weekday Off‐peak Weekend
2016 2016 2016
Base (All Respondents) 4,212 890 452 % % %
Less than 1 mile 7 6 4
1 to 5 miles 32 31 35
6 to 10 miles 10 9 8
11 to 20 miles 16 18 14
More than 20 miles 35 36 39
Total % 100 100 100
Average Number of Miles: 17.5 18.7 19.2
Median Number of Miles: 12.0 15.0 14.0
(See Statistical Table 7)
2016 CALTRAIN TRIENNIAL CUSTOMER SURVEY | SUMMARY REPORT
26 Corey, Canapary & Galanis
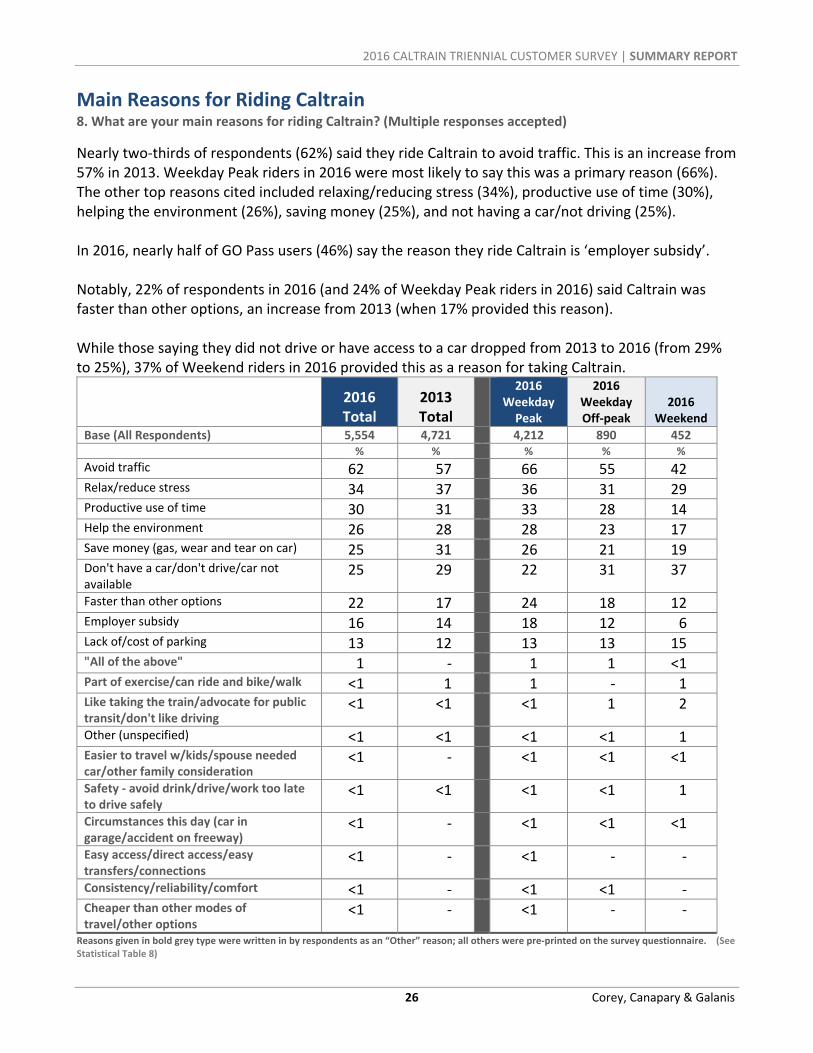
Main Reasons for Riding Caltrain 8. What are your main reasons for riding Caltrain? (Multiple responses accepted)
Nearly two‐thirds of respondents (62%) said they ride Caltrain to avoid traffic. This is an increase from 57% in 2013. Weekday Peak riders in 2016 were most likely to say this was a primary reason (66%). The other top reasons cited included relaxing/reducing stress (34%), productive use of time (30%), helping the environment (26%), saving money (25%), and not having a car/not driving (25%). In 2016, nearly half of GO Pass users (46%) say the reason they ride Caltrain is ‘employer subsidy’. Notably, 22% of respondents in 2016 (and 24% of Weekday Peak riders in 2016) said Caltrain was faster than other options, an increase from 2013 (when 17% provided this reason). While those saying they did not drive or have access to a car dropped from 2013 to 2016 (from 29% to 25%), 37% of Weekend riders in 2016 provided this as a reason for taking Caltrain.
2016 Total
2013 Total
2016 Weekday Peak
2016 Weekday Off‐peak
2016 Weekend
Base (All Respondents) 5,554 4,721 4,212 890 452 % % % % %
Avoid traffic 62 57 66 55 42 Relax/reduce stress 34 37 36 31 29 Productive use of time 30 31 33 28 14 Help the environment 26 28 28 23 17 Save money (gas, wear and tear on car) 25 31 26 21 19 Don't have a car/don't drive/car not available
25 29 22 31 37
Faster than other options 22 17 24 18 12 Employer subsidy 16 14 18 12 6 Lack of/cost of parking 13 12 13 13 15 "All of the above" 1 ‐ 1 1 <1 Part of exercise/can ride and bike/walk <1 1 1 ‐ 1 Like taking the train/advocate for public transit/don't like driving
<1 <1 <1 1 2
Other (unspecified) <1 <1 <1 <1 1 Easier to travel w/kids/spouse needed car/other family consideration
<1 ‐ <1 <1 <1
Safety ‐ avoid drink/drive/work too late to drive safely
<1 <1 <1 <1 1
Circumstances this day (car in garage/accident on freeway)
<1 ‐ <1 <1 <1
Easy access/direct access/easy transfers/connections
<1 ‐ <1 ‐ ‐
Consistency/reliability/comfort <1 ‐ <1 <1 ‐ Cheaper than other modes of travel/other options
<1 ‐ <1 ‐ ‐
Reasons given in bold grey type were written in by respondents as an “Other” reason; all others were pre‐printed on the survey questionnaire. (See Statistical Table 8)

2016 CALTRAIN TRIENNIAL CUSTOMER SURVEY | SUMMARY REPORT
27 Corey, Canapary & Galanis
Boarding Station 9. At what station did you get ON this train?
About half of all riders boarded Caltrain at San Francisco (25%), San Jose Diridon (11%), Palo Alto (8%), Sunnyvale (7%), or Mountain View (7%) stations. San Francisco was the most common station among all time periods.
2016 Total
2016 Weekday Peak
2016 Weekday Off‐peak
2016 Weekend
Base (All Respondents) 5,554 4,212 890 452 % % % %
San Francisco 25 24 29 29
San Jose Diridon 11 10 11 19
Palo Alto 8 8 7 9
Sunnyvale 7 8 6 3
Mountain View 7 7 6 7
Redwood City 6 6 4 4
Millbrae 5 5 6 3
Hillsdale 4 5 3 2
22nd Street 3 3 5 2
San Mateo 3 3 3 1
Tamien 3 3 1 ‐
Menlo Park 2 2 3 3
California Avenue 2 2 2 2
Santa Clara 2 2 3 2
San Carlos 2 2 2 1
Burlingame 2 2 2 2
Lawrence 2 2 3 2
San Antonio 1 1 1 1
San Bruno 1 1 1 2
Belmont 1 1 1 2
Hayward Park 1 1 1 1
South San Francisco 1 1 <1 1
Bayshore <1 <1 1 1
Gilroy <1 1 ‐ ‐
Morgan Hill (weekday only) <1 <1 ‐ ‐
San Martin (weekday only) <1 <1 ‐ ‐
Blossom Hill (weekday only) <1 <1 ‐ ‐
College Park (weekday only) <1 <1 ‐ ‐
Broadway (weekend only) <1 <1 ‐ 1
Capitol (weekday only) <1 <1 ‐ ‐
Stanford Stadium (football only)
<1
‐ ‐ 1
Atherton (weekend only) <1 ‐ ‐ 1
Total % 100 0 100 100 100 (See Statistical Table 9)
2016 CALTRAIN TRIENNIAL CUSTOMER SURVEY | SUMMARY REPORT
28 Corey, Canapary & Galanis
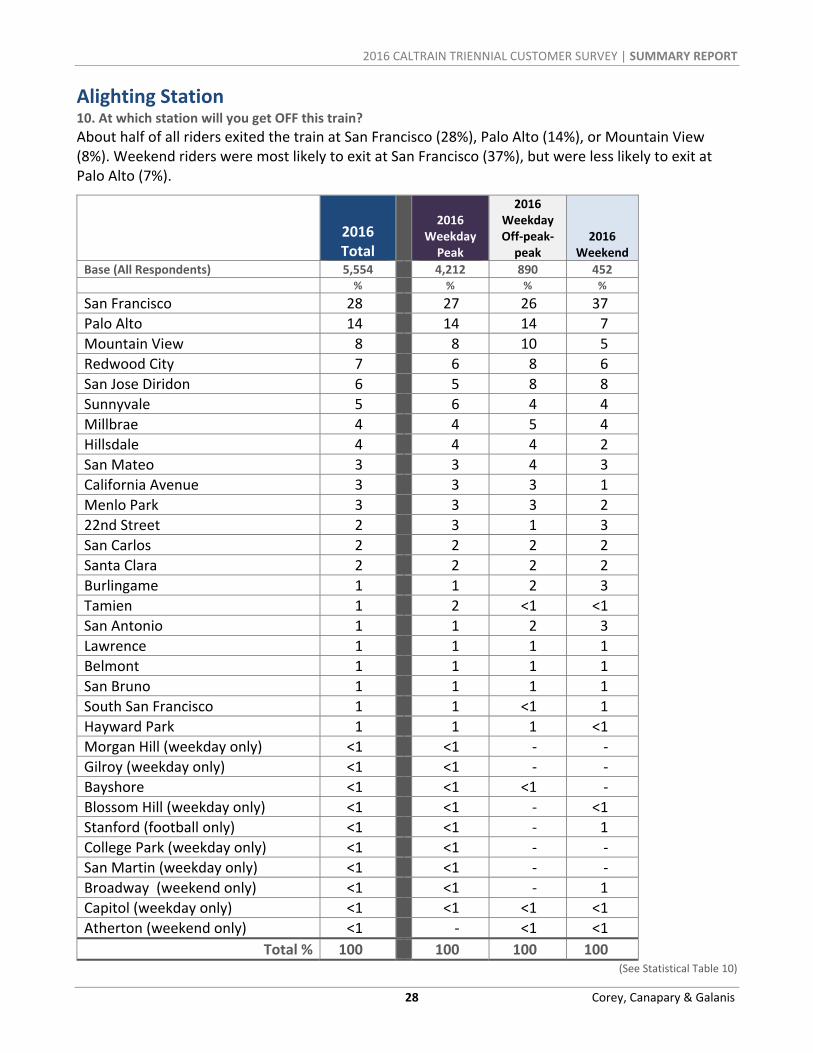
Alighting Station 10. At which station will you get OFF this train?
About half of all riders exited the train at San Francisco (28%), Palo Alto (14%), or Mountain View (8%). Weekend riders were most likely to exit at San Francisco (37%), but were less likely to exit at Palo Alto (7%).
2016 Total
2016 Weekday Peak
2016 Weekday Off‐peak‐peak
2016 Weekend
Base (All Respondents) 5,554 4,212 890 452 % % % %
San Francisco 28 27 26 37
Palo Alto 14 14 14 7
Mountain View 8 8 10 5
Redwood City 7 6 8 6
San Jose Diridon 6 5 8 8
Sunnyvale 5 6 4 4
Millbrae 4 4 5 4
Hillsdale 4 4 4 2
San Mateo 3 3 4 3
California Avenue 3 3 3 1
Menlo Park 3 3 3 2
22nd Street 2 3 1 3
San Carlos 2 2 2 2
Santa Clara 2 2 2 2
Burlingame 1 1 2 3
Tamien 1 2 <1 <1
San Antonio 1 1 2 3
Lawrence 1 1 1 1
Belmont 1 1 1 1
San Bruno 1 1 1 1
South San Francisco 1 1 <1 1
Hayward Park 1 1 1 <1
Morgan Hill (weekday only) <1 <1 ‐ ‐
Gilroy (weekday only) <1 <1 ‐ ‐
Bayshore <1 <1 <1 ‐
Blossom Hill (weekday only) <1 <1 ‐ <1
Stanford (football only) <1 <1 ‐ 1
College Park (weekday only) <1 <1 ‐ ‐
San Martin (weekday only) <1 <1 ‐ ‐
Broadway (weekend only) <1 <1 ‐ 1
Capitol (weekday only) <1 <1 <1 <1
Atherton (weekend only) <1 ‐ <1 <1
Total % 100 0 100 100 100 (See Statistical Table 10)
2016 CALTRAIN TRIENNIAL CUSTOMER SURVEY | SUMMARY REPORT
29 Corey, Canapary & Galanis
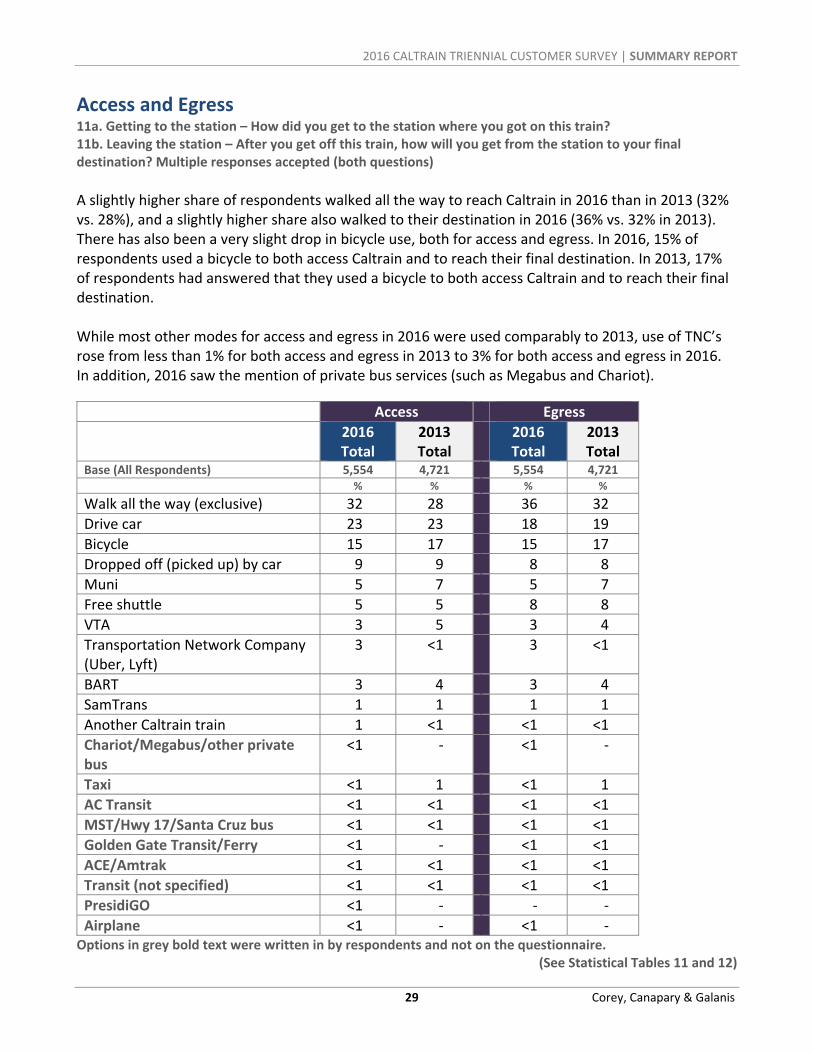
Access and Egress 11a. Getting to the station – How did you get to the station where you got on this train? 11b. Leaving the station – After you get off this train, how will you get from the station to your final destination? Multiple responses accepted (both questions)
A slightly higher share of respondents walked all the way to reach Caltrain in 2016 than in 2013 (32% vs. 28%), and a slightly higher share also walked to their destination in 2016 (36% vs. 32% in 2013). There has also been a very slight drop in bicycle use, both for access and egress. In 2016, 15% of respondents used a bicycle to both access Caltrain and to reach their final destination. In 2013, 17% of respondents had answered that they used a bicycle to both access Caltrain and to reach their final destination. While most other modes for access and egress in 2016 were used comparably to 2013, use of TNC’s rose from less than 1% for both access and egress in 2013 to 3% for both access and egress in 2016. In addition, 2016 saw the mention of private bus services (such as Megabus and Chariot).
Access Egress
2016 Total
2013 Total
2016 Total
2013 Total
Base (All Respondents) 5,554 4,721 5,554 4,721 % % % %
Walk all the way (exclusive) 32 28 36 32
Drive car 23 23 18 19
Bicycle 15 17 15 17
Dropped off (picked up) by car 9 9 8 8
Muni 5 7 5 7
Free shuttle 5 5 8 8
VTA 3 5 3 4
Transportation Network Company (Uber, Lyft)
3 <1 3 <1
BART 3 4 3 4
SamTrans 1 1 1 1
Another Caltrain train 1 <1 <1 <1
Chariot/Megabus/other private bus
<1 ‐ <1 ‐
Taxi <1 1 <1 1
AC Transit <1 <1 <1 <1
MST/Hwy 17/Santa Cruz bus <1 <1 <1 <1
Golden Gate Transit/Ferry <1 ‐ <1 <1
ACE/Amtrak <1 <1 <1 <1
Transit (not specified) <1 <1 <1 <1
PresidiGO <1 ‐ ‐ ‐
Airplane <1 ‐ <1 ‐ Options in grey bold text were written in by respondents and not on the questionnaire.
(See Statistical Tables 11 and 12)

2016 CALTRAIN TRIENNIAL CUSTOMER SURVEY | SUMMARY REPORT
30 Corey, Canapary & Galanis
Weekday Off‐peak riders were most likely to walk to reach Caltrain (35% vs. 32% for Weekday Peak and 30% among Weekend riders). They were also most likely to walk to reach their final destination (40% vs. 36% among Weekday Peak and 34% among Weekend riders). Weekend riders were most likely to use car‐based transportation for both access and egress – including driving, being dropped off/picked up, and/or using a TNC (Transportation Network Company). Weekday Peak riders account for most of the use of private buses, such as Chariot and Megabus. Weekday riders (both Peak and Off‐peak) were much more likely to bike to access Caltrain, as well as to reach their final destination, than Weekend riders.
Access Egress
Weekday Peak
Weekday Off‐peak‐peak Weekend
Weekday Peak
Weekday Off‐peak Weekend
2016 2016 2016 2016 2016 2016
Base (All Respondents) 4,212 890 452 4,212 890 452 % % % % % %
Walk all the way (exclusive) 32 35 30 36 40 34 Drive car 24 16 25 19 14 21 Bicycle 16 16 7 15 15 7 Dropped off (picked up) by car 9 10 12 7 8 11 Muni 5 5 8 5 4 8 Free shuttle 5 2 1 9 6 2 VTA 3 4 4 3 4 5 TNC (Uber, Lyft) 2 5 7 2 4 7 BART 3 4 2 2 3 3 SamTrans 1 1 1 1 1 1 Another Caltrain train <1 1 1 <1 <1 1 Chariot/Megabus/oth. private bus
<1 <1 ‐ <1 ‐ ‐
Taxi <1 1 <1 <1 ‐ 1 AC Transit <1 <1 1 <1 ‐ <1 MST/Hwy 17/Santa Cruz bus <1 <1 <1 <1 <1 ‐ Golden Gate Transit/Ferry <1 ‐ ‐ ‐ <1 <1 ACE/Amtrak <1 <1 <1 <1 ‐ ‐ Transit (not specified) ‐ ‐ 1 <1 <1 <1 PresidiGO ‐ <1 ‐ ‐ ‐ ‐ Airplane ‐ ‐ <1 ‐ ‐ <1
Options in grey bold text were written in by respondents and not on the questionnaire. (See Statistical Tables 11 and 12)
2016 CALTRAIN TRIENNIAL CUSTOMER SURVEY | SUMMARY REPORT
31 Corey, Canapary & Galanis
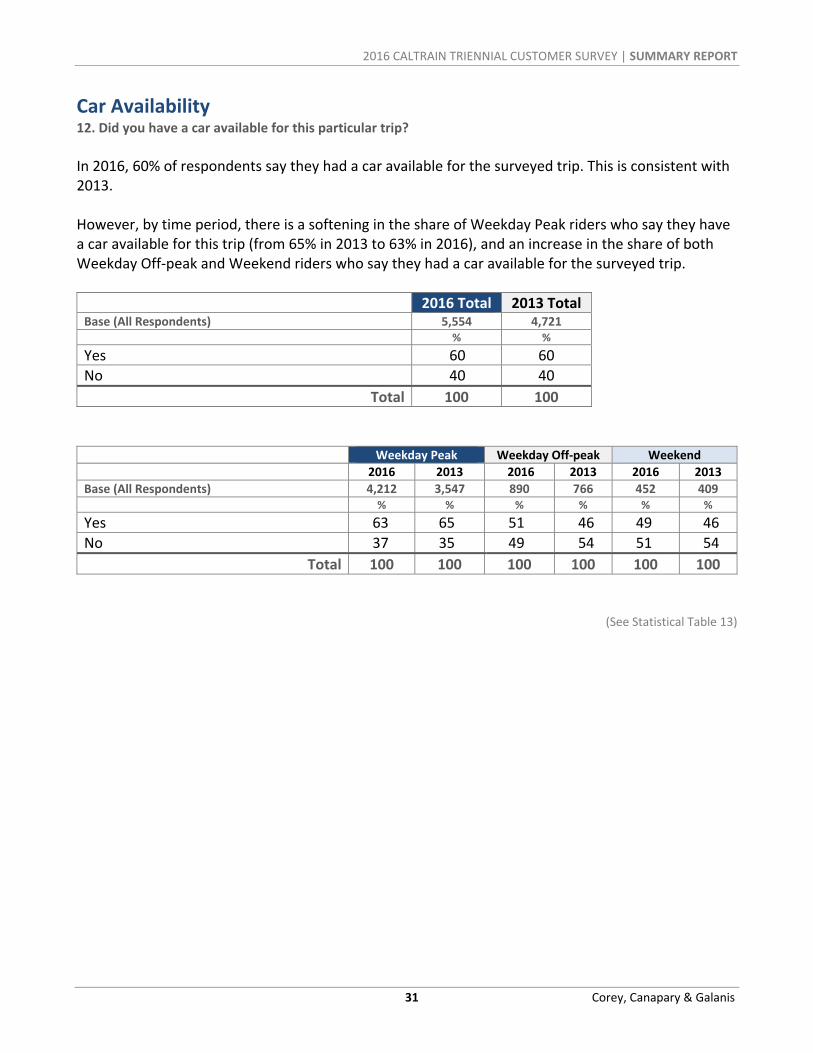
Car Availability 12. Did you have a car available for this particular trip?
In 2016, 60% of respondents say they had a car available for the surveyed trip. This is consistent with 2013. However, by time period, there is a softening in the share of Weekday Peak riders who say they have a car available for this trip (from 65% in 2013 to 63% in 2016), and an increase in the share of both Weekday Off‐peak and Weekend riders who say they had a car available for the surveyed trip.
2016 Total 2013 Total Base (All Respondents) 5,554 4,721 % %
Yes 60 60
No 40 40
Total 100 100
Weekday Peak Weekday Off‐peak Weekend
2016 2013 2016 2013 2016 2013
Base (All Respondents) 4,212 3,547 890 766 452 409 % % % % % %
Yes 63 65 51 46 49 46
No 37 35 49 54 51 54
Total 100 100 100 100 100 100
(See Statistical Table 13)

2016 CALTRAIN TRIENNIAL CUSTOMER SURVEY | SUMMARY REPORT
32 Corey, Canapary & Galanis
Motivation for Newer Riders Q13. If you have been riding Caltrain for less than one year, what motivated you to start using Caltrain? (Multiple responses accepted)
Almost one third of newer riders (31%) started taking Caltrain because of a change of company (including a change in worksite location or assignment); among those providing this reason, 23% paid their fare with a GO Pass. This was the top reason given for starting to take Caltrain, followed closely by worsening traffic, which was cited by 29% of respondents, and lack of access to a car (cited by 21% of all respondents). By time period, Weekend riders were more likely than riders overall to cite lack of access to a car as the reason they began riding Caltrain (33%). They were also more likely than respondents overall to cite a special event, such as a Giants game or concert (18%).
2016 Total
2016 Weekday Peak
2016 Weekday Off‐peak
2016 Weekend
Base (Riding Caltrain 1 Year or Less) 2,004 1,460 330 214 % % % %
Change of company 31 37 22 6
Worsening traffic 29 31 25 19
Lack of access to a car 21 18 24 33
Moved/started school/other similar change 9 10 8 7
Special event (like SF Giants game or concert) 6 3 9 18
Change in financial circumstances 3 2 5 5
Just visiting the area 2 1 4 3
Prefer to drive less/cut down to one car/avoid purchase new car
2
2 2 1
Change in health 1 1 1 1
Employer subsidy/cheaper to ride train 1 1 1 1
Create more time/make commute easier/ faster
1
1 ‐ 2
Change in parking/car broke down 1 1 1 ‐
Other (not specified) <1 <1 1 ‐
Reduce stress <1 <1 <1 ‐
Safety (too tired to drive/drink and drive) <1 <1 ‐ 1
Shown how by family/friend/coworker <1 <1 1 <1
Desire to bike/walk as part of commute <1 <1 ‐ ‐
Options in grey bold type were written in by respondents and not on the questionnaire.
(See Statistical Table 14)
2016 CALTRAIN TRIENNIAL CUSTOMER SURVEY | SUMMARY REPORT
33 Corey, Canapary & Galanis
SATISFACTION WITH CALTRAIN
Satisfaction Ratings 14. How well is Caltrain meeting your needs? Please rate . . .
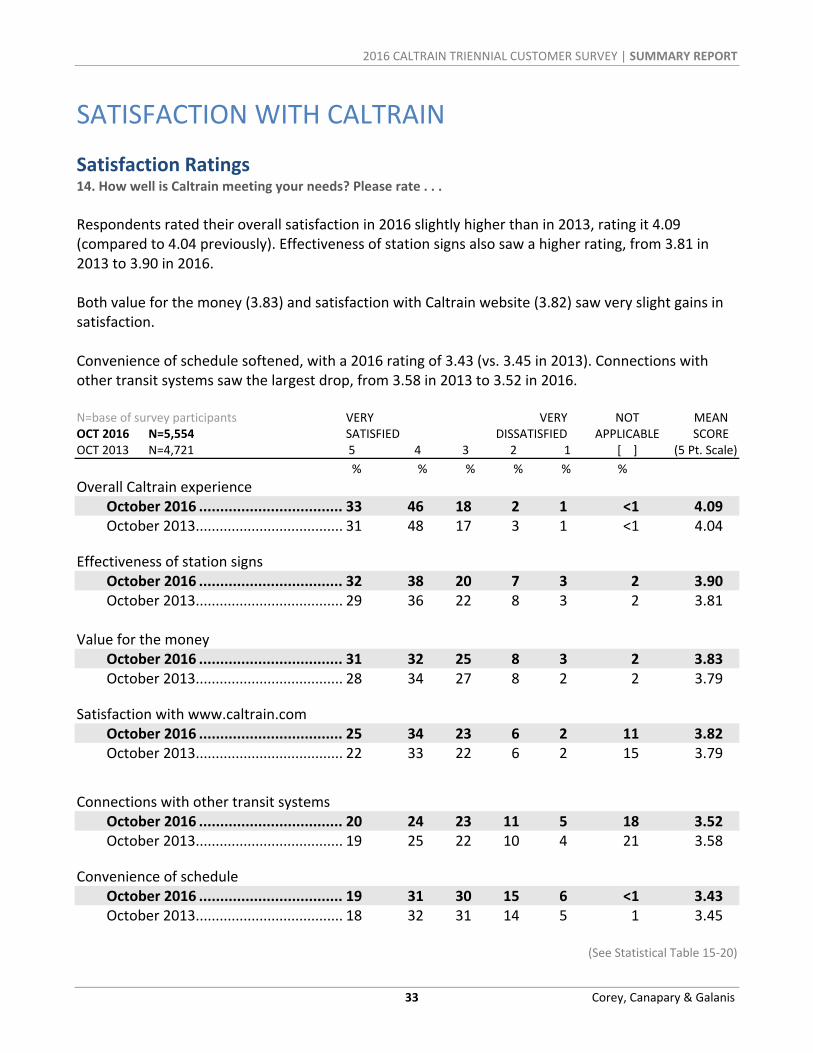
Respondents rated their overall satisfaction in 2016 slightly higher than in 2013, rating it 4.09 (compared to 4.04 previously). Effectiveness of station signs also saw a higher rating, from 3.81 in 2013 to 3.90 in 2016. Both value for the money (3.83) and satisfaction with Caltrain website (3.82) saw very slight gains in satisfaction. Convenience of schedule softened, with a 2016 rating of 3.43 (vs. 3.45 in 2013). Connections with other transit systems saw the largest drop, from 3.58 in 2013 to 3.52 in 2016. N=base of survey participants VERY VERY NOT MEAN OCT 2016 N=5,554 SATISFIED DISSATISFIED APPLICABLE SCORE OCT 2013 N=4,721 5 4 3 2 1 [ ] (5 Pt. Scale)
% % % % % %
Overall Caltrain experience October 2016 .................................. 33 46 18 2 1 <1 4.09 October 2013 ..................................... 31 48 17 3 1 <1 4.04
Effectiveness of station signs October 2016 .................................. 32 38 20 7 3 2 3.90 October 2013 ..................................... 29 36 22 8 3 2 3.81 Value for the money October 2016 .................................. 31 32 25 8 3 2 3.83 October 2013 ..................................... 28 34 27 8 2 2 3.79
Satisfaction with www.caltrain.com October 2016 .................................. 25 34 23 6 2 11 3.82 October 2013 ..................................... 22 33 22 6 2 15 3.79
Connections with other transit systems October 2016 .................................. 20 24 23 11 5 18 3.52 October 2013 ..................................... 19 25 22 10 4 21 3.58
Convenience of schedule October 2016 .................................. 19 31 30 15 6 <1 3.43 October 2013 ..................................... 18 32 31 14 5 1 3.45
(See Statistical Table 15‐20)

2016 CALTRAIN TRIENNIAL CUSTOMER SURVEY | SUMMARY REPORT
34 Corey, Canapary & Galanis
Satisfaction with Caltrain by Rider Segments N=base of survey participants (5,554) By time period, Weekend riders gave higher ratings in every attribute except one: Effectiveness of station signs, which was rated 3.95 by Weekend riders, but 3.97 by Weekday Off‐peak riders. VERY VERY NOT MEAN SATISFIED DISSATISFIED APPLICABLE SCORE 5 4 3 2 1 [ ] (5 Pt. Scale)
Overall Caltrain experience .................... 33 46 18 2 1 <1 4.09 Weekday Peak ................................... 31 48 18 2 1 <1 4.06 Weekday Off‐peak ............................. 39 42 16 2 1 <1 4.17 Weekend ........................................... 44 38 15 2 1 <1 4.23 Effectiveness of station signs ................. 32 38 20 7 3 2 3.90 Weekday Peak ................................... 30 39 20 7 3 2 3.88 Weekday Off‐peak ............................. 37 34 18 7 3 1 3.97 Weekend ........................................... 36 35 19 7 3 2 3.95 Value for the money .............................. 31 32 25 8 3 2 3.83 Weekday Peak ................................... 30 32 25 8 2 2 3.82 Weekday Off‐peak ............................. 31 30 24 9 3 2 3.79 Weekend ........................................... 36 30 26 5 2 1 3.93 Satisfaction with www.caltrain.com ...... 25 34 23 6 2 11 3.82 Weekday Peak ................................... 23 34 24 7 2 11 3.78 Weekday Off‐peak ............................. 29 33 19 6 2 12 3.92 Weekend ........................................... 35 30 18 3 1 12 4.08 Connections with other transit systems . 20 24 23 11 5 18 3.52 Weekday Peak ................................... 18 24 23 11 5 18 3.48 Weekday Off‐peak ............................. 23 23 23 11 4 15 3.58 Weekend ........................................... 28 24 21 9 2 17 3.80 Convenience of schedule ....................... 19 31 30 15 6 <1 3.43 Weekday Peak ................................... 18 31 30 16 5 <1 3.41 Weekday Off‐peak ............................. 22 28 30 14 5 <1 3.48 Weekend ........................................... 25 28 26 12 7 1 3.52
(See Statistical Table 15‐20)

2016 CALTRAIN TRIENNIAL CUSTOMER SURVEY | SUMMARY REPORT
35 Corey, Canapary & Galanis
INFORMATION AND FARE PAYMENT CHOICES Internet Access 15. Where do you usually access the internet? (Multiple responses accepted)
All but 2% of riders have Internet access from at least one source.
Weekday Peak riders were most likely to have access at home and at work, as well as being most likely to have mobile access of some sort.
Weekday Off‐peak riders showed a slight increase in their access at home, and a greater increase in their access at work, when compared to 2013. Weekend riders also saw increases in home and work access – albeit much smaller.
2016 Total 2013 Total Base (All Respondents) 5,554 4,721 % %
Home 79 78
Work 69 68
Cell/tablet/personal hotspot* 69 70
Library/school/cafe/other public area 7 7
I don't have internet access (exclusive) 2 2
Total 100 100
Weekday Peak Weekday Off‐peak Weekend
2016 2013 2016 2013 2016 2013
Base (All Respondents) 4,212 3,547 890 766 452 409 % % % % % %
Home 80 80 78 75 72 71
Work 73 73 62 55 49 46
Cell/tablet/personal hotspot* 70 72 67 67 61 62
Library/school/cafe/other public area 6 6 9 9 8 8
I don't have internet access (exclusive) 1 2 2 3 3 2
Total 100 100 100 100 100 100
*In 2013, this was listed as “Cell/mobile.”
Items in bold grey type were written in by respondents and not part of the printed questionnaire options.
(See Statistical Table 21)

2016 CALTRAIN TRIENNIAL CUSTOMER SURVEY | SUMMARY REPORT
36 Corey, Canapary & Galanis
Banking Access 16. Do you currently have a checking account, savings account, credit union account, or a credit card?
Most respondents (94%) have a checking account, savings account, credit union account, or credit card. Weekday Peak riders were most likely to have one of these accounts (95%), while Weekday Off‐peak and Weekend riders were somewhat less likely to (91%). This question was not asked before 2016.
2016 Total Base (All Respondents) 5,554 %
Yes 94
No 4
Don’t know 2
Total 100
Weekday Peak Weekday Off‐peak Weekend
2016 2016 2016
Base (All Respondents) 4,212 890 452 % % %
Yes 95 91 91
No 3 6 7
Don’t know 2 3 2
Total % 100 100 100
(See Statistical Table 22)

2016 CALTRAIN TRIENNIAL CUSTOMER SURVEY | SUMMARY REPORT
37 Corey, Canapary & Galanis
Clipper Card Use Q17. Do you use a Clipper® card?
Most respondents (72%) use a Clipper® card. However, this varies widely by time period – with 77% of Weekday Peak riders using the card, but only 62% of Weekday Off‐peak riders and 47% of Weekend riders. This question was not asked before 2016.
2016 Total Base (All Respondents) 5,554 %
Yes 72
No 28
Total 100
Weekday Peak Weekday Off‐peak Weekend
2016 2016 2016
Base (All Respondents) 4,212 890 452 % % %
Yes 77 62 47
No 23 38 53
Total % 100 100 100
(See Statistical Table 23)

2016 CALTRAIN TRIENNIAL CUSTOMER SURVEY | SUMMARY REPORT
38 Corey, Canapary & Galanis
Barriers to Clipper® Card Use Q18. Are there any barriers to using a Clipper® card? (Multiple responses accepted)
Just over half of respondents say there are no barriers to using a Clipper card (56%). Weekday Peak riders are most likely to say this is so (58%), while Weekend riders are least likely to make this statement (47%). Among Weekday Peak and Weekday Off‐peak riders, the most commonly cited barrier is limited vendors to get and load the card. Among Weekend riders, however, the most common barrier (cited by 21%) is they don’t use it enough or don’t need it. This question was not asked prior to 2016.
2016 Total
2016 Weekday Peak
2016 Weekday Off‐peak
2016 Weekend
Base (All Respondents) 5,554 4,212 890 452 % % % %
No, there are no barriers (exclusive) 56 58 52 47 Limited vendors to get and load card 14 14 14 9 I don't use it enough/don't need it 11 9 12 21 I had a bad experience with Clipper 8 9 7 3 I prefer to pay as I go 5 4 7 11 I don't know about Clipper/have never heard of it 4 2 6 10 I don't understand how to use it 3 3 4 6 Don't like tag on/tag off/monthly passholders shouldn't have to
3
4 3 1
Adding funds online takes too long/website inferior 3 3 3 1 Not enough add value machines/need at all stations/too slow
2
2 2 1
Confusing/too many options/takes too long/no signage how to use
1
1 1 1
Difficult to use w/multiple cards/transit subsidy/other programs
1
1 1 <1
Issues w/Caltrain ticketing on Clipper (8‐ride issues, add day pass to Clipper request, etc.)
1
1 <1 <1
Cost of card/cost to consolidate/minimum balance 1 1 <1 1 Don't want to use card/want on phone/want a paper pass
<1
<1 <1 <1
Don't live here/doesn't seem to be for visitors <1 <1 <1 1 No live customer service/reps not helpful <1 <1 <1 <1 Cannot use on other forms of transit/cannot pay for parking
<1
<1 <1 ‐
Just not using today/forgot/ran out of value on card <1 <1 <1 <1 Privacy policy issues <1 <1 <1 <1 Never really considered/don't know/too lazy <1 <1 <1 <1 Other <1 <1 ‐ ‐
Reasons in grey bold type were written in by respondents. (See Statistical Table 24)

2016 CALTRAIN TRIENNIAL CUSTOMER SURVEY | SUMMARY REPORT
39 Corey, Canapary & Galanis
Among those who said they do not use a Clipper card, feedback on barriers is quite different. Among this group of respondents, more than a third (34%) say they just would not use it enough or do not need it. However, 33% say there are no barriers (even though they are not using the card currently). Notably, 13% say they don’t know about it or have never heard of it. This varies by time period, with only 10% of Weekday Peak riders saying they don’t know about it, compared to 18% of Weekday Off‐peak and 20% of Weekend riders.
2016 Total
2016 Weekday Peak
2016 Weekday Off‐peak
2016 Weekend
Base (All Respondents Who Do NOT Use A Clipper Card) 1,524 961 328 235 % % % %
I don't use it enough/don't need it 34 36 29 35 No, there are no barriers (exclusive) 33 33 33 31 I don't know about Clipper/have never heard of it 13 10 18 20 I prefer to pay as I go 12 11 14 13 I don't understand how to use it 7 7 7 9 Limited vendors to get and load card 6 7 4 4 I had a bad experience with clipper 4 5 4 1 Don't live here/doesn't seem to be for visitors 1 1 1 1 Don't like tag on/tag off/monthly passholders shouldn't have to
1
1 <1 ‐
Confusing/too many options/takes too long/no signage how to use
1
1 1 1
Not enough add value machines/need at all stations/too slow
<1
1 ‐ <1
Never really considered/don't know/too lazy <1 <1 1 <1 Cost of card/cost to consolidate/minimum balance <1 <1 ‐ <1 Issues w/caltrain ticketing on Clipper (8‐ride, day pass) <1 <1 1 ‐ Adding funds online takes too long/website inferior <1 <1 1 ‐ Just not using today/forgot/ran out of value on card <1 <1 ‐ ‐ Don't want to use card/want it on phone/want a paper pass
<1
<1 ‐ <1
Privacy policy issues <1 ‐ <1 <1 Other <1 <1 ‐ ‐ Difficult to use w/multiple cards/transit subsidy/other programs
<1
<1 ‐ ‐
Cannot use on other forms of transit/cannot pay for parking
<1
<1 ‐ ‐
Reasons in grey bold type were written in by respondents.
(See Statistical Table 25)
2016 CALTRAIN TRIENNIAL CUSTOMER SURVEY | SUMMARY REPORT
40 Corey, Canapary & Galanis
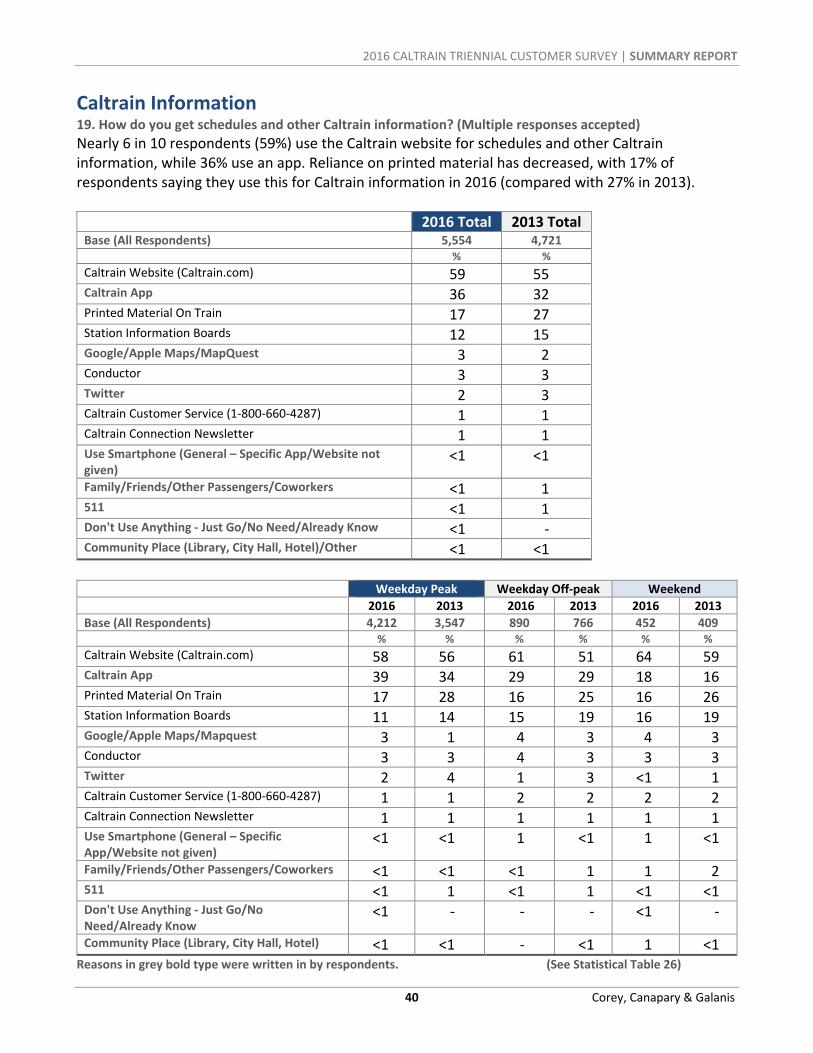
Caltrain Information 19. How do you get schedules and other Caltrain information? (Multiple responses accepted)
Nearly 6 in 10 respondents (59%) use the Caltrain website for schedules and other Caltrain information, while 36% use an app. Reliance on printed material has decreased, with 17% of respondents saying they use this for Caltrain information in 2016 (compared with 27% in 2013).
2016 Total 2013 Total Base (All Respondents) 5,554 4,721 % %
Caltrain Website (Caltrain.com) 59 55 Caltrain App 36 32 Printed Material On Train 17 27 Station Information Boards 12 15 Google/Apple Maps/MapQuest 3 2 Conductor 3 3 Twitter 2 3 Caltrain Customer Service (1‐800‐660‐4287) 1 1 Caltrain Connection Newsletter 1 1 Use Smartphone (General – Specific App/Website not given)
<1 <1
Family/Friends/Other Passengers/Coworkers <1 1 511 <1 1 Don't Use Anything ‐ Just Go/No Need/Already Know <1 ‐ Community Place (Library, City Hall, Hotel)/Other <1 <1
Weekday Peak Weekday Off‐peak Weekend
2016 2013 2016 2013 2016 2013
Base (All Respondents) 4,212 3,547 890 766 452 409 % % % % % %
Caltrain Website (Caltrain.com) 58 56 61 51 64 59 Caltrain App 39 34 29 29 18 16 Printed Material On Train 17 28 16 25 16 26 Station Information Boards 11 14 15 19 16 19 Google/Apple Maps/Mapquest 3 1 4 3 4 3 Conductor 3 3 4 3 3 3 Twitter 2 4 1 3 <1 1 Caltrain Customer Service (1‐800‐660‐4287) 1 1 2 2 2 2 Caltrain Connection Newsletter 1 1 1 1 1 1 Use Smartphone (General – Specific App/Website not given)
<1 <1 1 <1 1 <1
Family/Friends/Other Passengers/Coworkers <1 <1 <1 1 1 2 511 <1 1 <1 1 <1 <1 Don't Use Anything ‐ Just Go/No Need/Already Know
<1 ‐ ‐ ‐ <1 ‐
Community Place (Library, City Hall, Hotel) <1 <1 ‐ <1 1 <1 Reasons in grey bold type were written in by respondents. (See Statistical Table 26)

2016 CALTRAIN TRIENNIAL CUSTOMER SURVEY | SUMMARY REPORT
41 Corey, Canapary & Galanis
RIDER DEMOGRAPHICS Gender Overall 58% of respondents are male, 41% female, and less than 1% identify as “other.”
2016 Total 2013 Total Base (All Respondents) 5,554 4,721 % %
Male 58 60
Female 41 40
Other <1 <1
Total 100 100
Weekday Peak Weekday Off‐peak Weekend
2016 2013 2016 2013 2016 2013
Base (All Respondents) 4,212 3,547 890 766 452 409 % % % % % %
Male 58 59 64 63 58 53
Female 42 41 36 37 42 47
Other <1 ‐ <1 <1 <1 ‐
Total 100 100 100 100 100 100
(See Statistical Table 27)
2016 CALTRAIN TRIENNIAL CUSTOMER SURVEY | SUMMARY REPORT
42 Corey, Canapary & Galanis
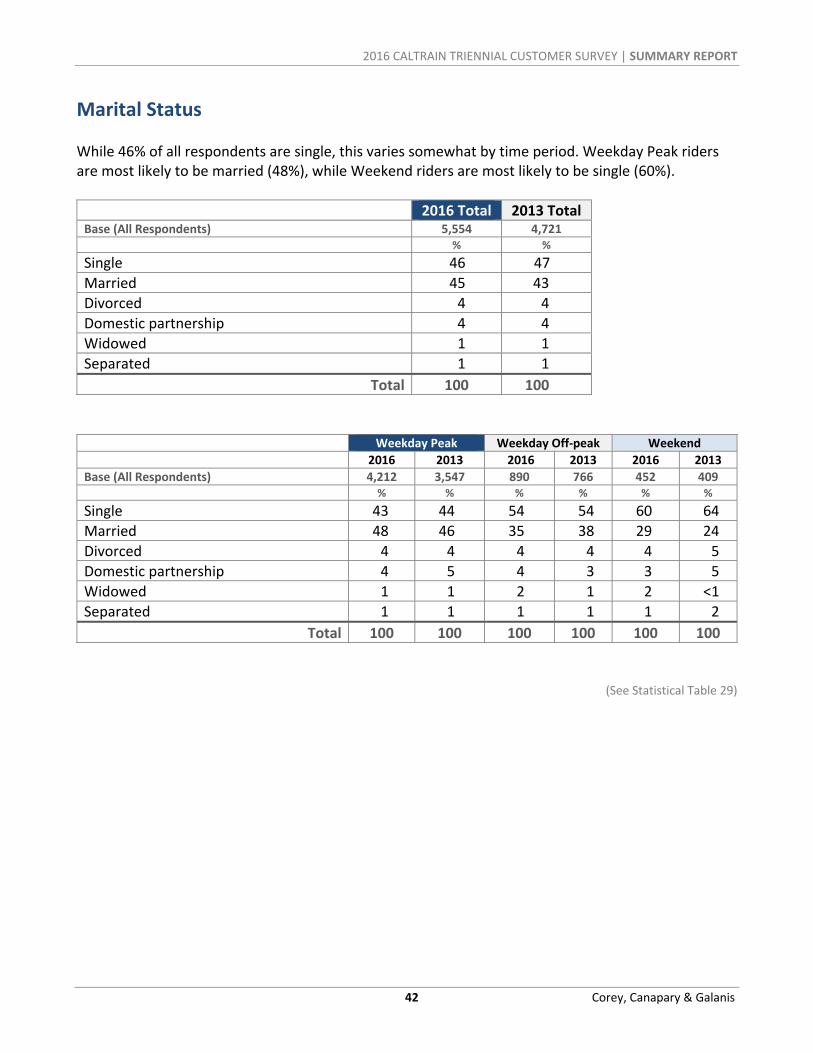
Marital Status While 46% of all respondents are single, this varies somewhat by time period. Weekday Peak riders are most likely to be married (48%), while Weekend riders are most likely to be single (60%).
2016 Total 2013 Total Base (All Respondents) 5,554 4,721 % %
Single 46 47
Married 45 43
Divorced 4 4
Domestic partnership 4 4
Widowed 1 1
Separated 1 1
Total 100 100
Weekday Peak Weekday Off‐peak Weekend
2016 2013 2016 2013 2016 2013
Base (All Respondents) 4,212 3,547 890 766 452 409 % % % % % %
Single 43 44 54 54 60 64
Married 48 46 35 38 29 24
Divorced 4 4 4 4 4 5
Domestic partnership 4 5 4 3 3 5
Widowed 1 1 2 1 2 <1
Separated 1 1 1 1 1 2
Total 100 100 100 100 100 100
(See Statistical Table 29)

2016 CALTRAIN TRIENNIAL CUSTOMER SURVEY | SUMMARY REPORT
43 Corey, Canapary & Galanis
Education Q24. What is the highest level of education you have completed?
Nearly all riders (96%) have a high school diploma, while 81% have graduated college.
2016 Total 2013 Total Base (All Respondents) 5,554 4,721 % %
College Graduate 43 45
Post‐Graduate Degree 38 35
Some College Or Tech School 10 12
Some High School 4 3
High School Graduate 4 5
Total 100 100
Weekday Peak Weekday Off‐peak Weekend
2016 2013 2016 2013 2016 2013
Base (All Respondents) 4,212 3,547 890 766 452 409 % % % % % %
College Graduate 44 46 43 42 40 42
Post‐Graduate Degree 39 36 37 33 29 26
Some College Or Tech School 9 11 12 15 20 16
Some High School 5 2 3 2 4 6
High School Graduate 3 4 6 8 7 11
Total 100 100 100 100 100 100
(See Statistical Table 37)

2016 CALTRAIN TRIENNIAL CUSTOMER SURVEY | SUMMARY REPORT
44 Corey, Canapary & Galanis
Employment Status Q25. What is your current employment status?
Most respondents (84%) are employed full‐time. By time period: 88% of Weekday Peak riders are employed full‐time. 75% of Weekday Off‐peak riders are employed full‐time. 65% of Weekend riders are employed full‐time.
2016 Total 2013 Total Base (All Respondents) 5,554 4,721 % %
Employed Full Time (35 or more hours per week) 84 80
Employed Part Time 4 6
Student 7 7
Retired 2 2
Homemaker 1 <1
Unemployed 2 2
Freelance/self‐employed/contractor <1 4
Disabled <1 <1
Total 100 100
Weekday Peak Weekday Off‐peak Weekend
2016 2013 2016 2013 2016 2013
Base (All Respondents) 4,212 3,547 890 766 452 409 % % % % % %
Employed Full Time 88 89 75 72 65 64
Employed Part Time 4 4 7 10 8 10
Student 6 5 9 10 14 17
Retired 1 1 4 3 7 4
Homemaker/Caregiver <1 <1 2 1 2 1
Unemployed 1 1 3 4 4 5
Disabled <1 <1 <1 ‐ <1 ‐
Total 100 100 100 100 100 100
(See Statistical Table 31)

2016 CALTRAIN TRIENNIAL CUSTOMER SURVEY | SUMMARY REPORT
45 Corey, Canapary & Galanis
Age* The age of the average Caltrain rider remained relatively steady, at 36.7 years. However, the average age of Weekday Peak riders has dropped, from 37.4 years to 36.7 years, while the average age of Weekday Off‐peak and Weekend riders has increased slightly.
2016 Total 2013 Total Base (All Respondents) 5,554 4,721 % %
13 To 18 Years Of Age** 3 2
19 To 24 Years Of Age** 12 13
25 To 34 Years Of Age 41 40
35 To 44 Years Of Age 20 21
45 To 54 Years Of Age 12 13
55 To 64 Years Of Age 8 8
65 Years Of Age And Older 3 3
Total 100 100
Average Age (# of years) 36.7 36.7
Weekday Peak Weekday Off‐peak Weekend
2016 2013 2016 2013 2016 2013
Base (All Respondents) 4,212 3,547 890 766 452 409 % % % % % %
13 To 18 Years Of Age** 3 2 2 2 4 6
19 To 24 Years Of Age** 11 11 15 19 22 26
25 To 34 Years Of Age 41 40 43 43 34 36
35 To 44 Years Of Age 22 23 17 16 13 12
45 To 54 Years Of Age 12 13 11 10 9 11
55 To 64 Years Of Age 8 8 6 7 10 5
65 Years Of Age And Older 2 3 5 4 8 5
Total 100 100 100 100 100 100
Average Age (# of Years) 36.7 37.4 36.3 35.2 37.3 33.7
*A small percentage of respondents were under the age of 13; since riders 13 and over were targeted for this survey, those responses have been removed. **In 2013, these categories were 13‐17 years of age and 18‐24 years of age.
(See Statistical Table 35)

2016 CALTRAIN TRIENNIAL CUSTOMER SURVEY | SUMMARY REPORT
46 Corey, Canapary & Galanis
Annual Household Income The average income among Caltrain riders has increased by more than $10,000 per year, to around $129,000 (from about $117,000 in 2013). This is largely due to a higher share of respondents in 2016 who earn $200,000 or more (23%) compared to those who earned this much in 2013 (15%). Income categories for 2016 changed, so only the current study is shown in detail below. However, the average income across time periods changed from 2013 to 2016 as follows:
Among Weekday Peak riders, income rose from $124,000 in 2013 to about $136,000 in 2016.
Among Weekday Off‐peak riders, income rose from about $100,000 in 2013 to about $116,000 in 2016.
Among Weekend riders, income rose from about $91,000 in 2013 to about $95,000 in 2016.
2016 Total Base (All Respondents) 5,554 %
Less than $24,999 a year 6
$25,000 to $29,999 2
$30,000 to $39,999 3
$40,000 to $49,999 4
$50,000 to $74,999 12
$75,000 to $99,999 13
$100,000 to $124,999 13
$125,000 to $149,999 10
$150,000 to $199,999 15
$200,000 or more 23
Total 100
Weekday Peak Weekday Off‐peak Weekend
2016 2016 2016
Base (All Respondents) 4,212 890 452 % % %
Less than $24,999 a year 4 10 18
$25,000 to $29,999 2 3 5
$30,000 to $39,999 2 5 5
$40,000 to $49,999 3 3 8
$50,000 to $74,999 12 11 14
$75,000 to $99,999 13 13 12
$100,000 to $124,999 13 13 10
$125,000 to $149,999 10 10 4
$150,000 to $199,999 17 12 9
$200,000 or more 25 19 15
Total 100 100 100
(See Statistical Table 37)
2016 CALTRAIN TRIENNIAL CUSTOMER SURVEY | SUMMARY REPORT
47 Corey, Canapary & Galanis
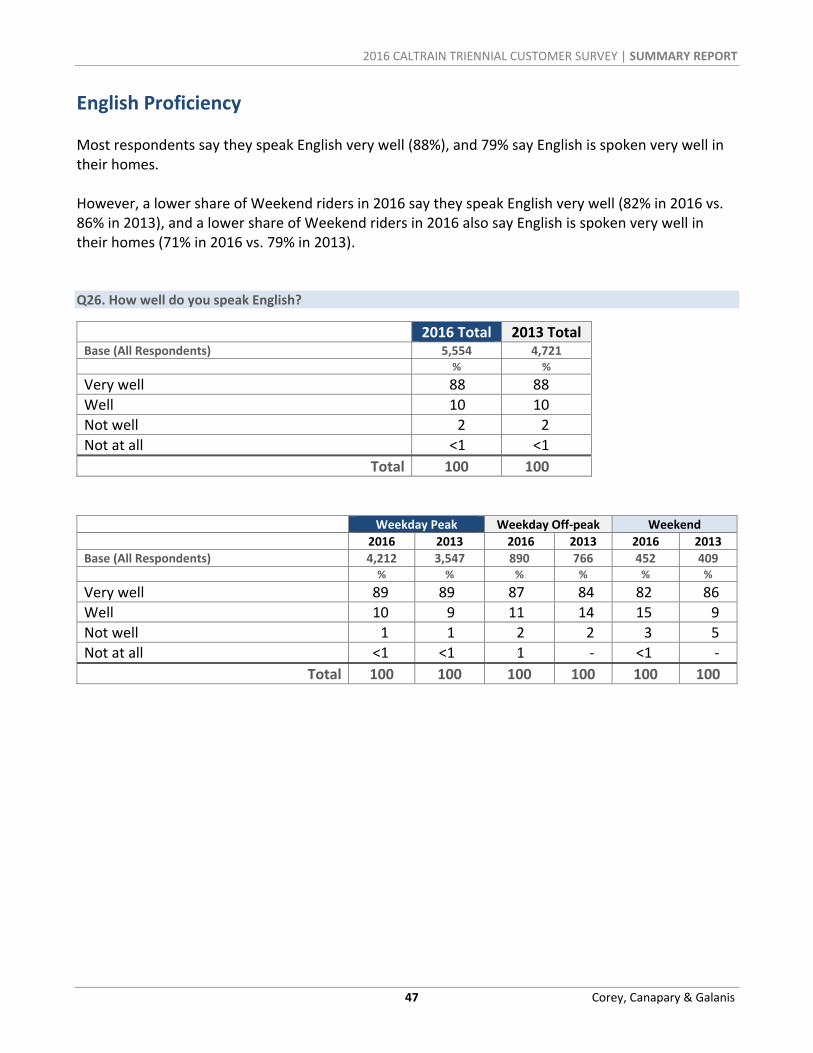
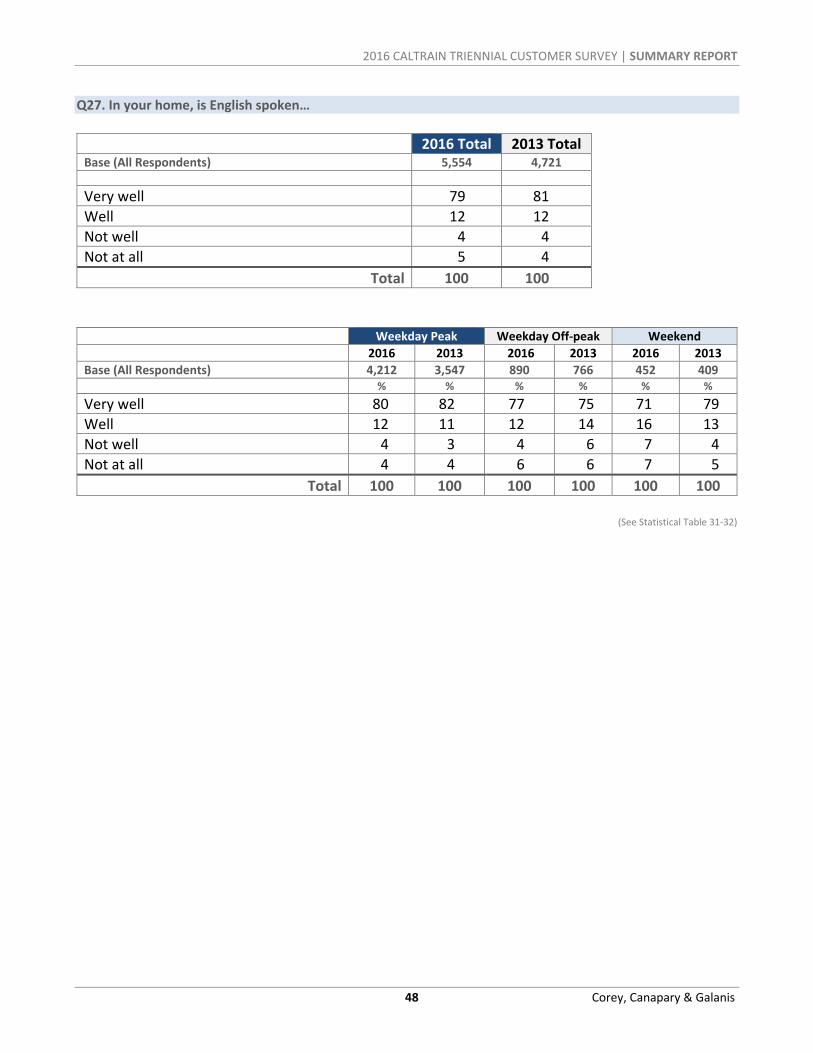
English Proficiency Most respondents say they speak English very well (88%), and 79% say English is spoken very well in their homes. However, a lower share of Weekend riders in 2016 say they speak English very well (82% in 2016 vs. 86% in 2013), and a lower share of Weekend riders in 2016 also say English is spoken very well in their homes (71% in 2016 vs. 79% in 2013). Q26. How well do you speak English?
2016 Total 2013 Total Base (All Respondents) 5,554 4,721 % %
Very well 88 88
Well 10 10
Not well 2 2
Not at all <1 <1
Total 100 100
Weekday Peak Weekday Off‐peak Weekend
2016 2013 2016 2013 2016 2013
Base (All Respondents) 4,212 3,547 890 766 452 409 % % % % % %
Very well 89 89 87 84 82 86
Well 10 9 11 14 15 9
Not well 1 1 2 2 3 5
Not at all <1 <1 1 ‐ <1 ‐
Total 100 100 100 100 100 100
2016 CALTRAIN TRIENNIAL CUSTOMER SURVEY | SUMMARY REPORT
48 Corey, Canapary & Galanis
Q27. In your home, is English spoken…
2016 Total 2013 Total Base (All Respondents) 5,554 4,721
Very well 79 81
Well 12 12
Not well 4 4
Not at all 5 4
Total 100 100
Weekday Peak Weekday Off‐peak Weekend
2016 2013 2016 2013 2016 2013
Base (All Respondents) 4,212 3,547 890 766 452 409 % % % % % %
Very well 80 82 77 75 71 79
Well 12 11 12 14 16 13
Not well 4 3 4 6 7 4
Not at all 4 4 6 6 7 5
Total 100 100 100 100 100 100
(See Statistical Table 31‐32)

2016 CALTRAIN TRIENNIAL CUSTOMER SURVEY | SUMMARY REPORT
49 Corey, Canapary & Galanis
Languages Spoken in the Home Q28. Which languages are spoken in your home? (Multiple responses accepted)
Respondents speak 72 languages in their homes. While 87% of respondents speak English in their homes, 12% speak Spanish, 11% Hindi or other Indian languages, and 7% speak Mandarin.
2016 Total
2016 Weekday Peak
2016 Weekday Off‐peak
2016 Weekend
Base (All Respondents) 5,554 4,212 890 452 % % % %
English 87 88 86 83
Spanish 12 11 13 14
Hindi Or Other Indian Languages 11 11 9 9
Mandarin 7 7 6 5
Cantonese 3 3 3 2
Tagalog 3 3 2 3
French 2 2 2 1
Russian 2 2 2 1
German 1 1 1 3
Korean 1 1 1 1
Vietnamese 1 1 1 <1
Japanese 1 1 <1 1
Italian 1 1 1 1
Portuguese 1 1 1 1
Farsi (Persian) 1 1 1 <1
Arabic 1 <1 1 1
Other languages spoken on a regular basis with at least one response in the survey:
Afrikaans Amharic Armenian ASL/Sign Language Belarusian Bosnian Bulgarian Burmese Cambodia Cebuano/Ilocano/ Other Filipino Language (Other Than Tagalog) Chamorro Chinese (Unspec.)
Cree Creole Croatian Czech Danish Dutch Estonian Fijian Finnish Greek Gujarati Hebrew Hungarian Icelandic Igbo
Indonesian Irish (Gaelic) Khmer Kurdish Kyrgyz Latvian Malayan Native American Language (Unspecified) Nepali Norwegian Polish Quechua Romanian
Samoan Serbian Somali Swahili Swedish Swiss‐German Tajik Thai Tibetan Tigrinya Tongan Turkish Twi (Asante Twi) Ukranian Yiddish
(See Statistical Table 34)

2016 CALTRAIN TRIENNIAL CUSTOMER SURVEY | SUMMARY REPORT
50 Corey, Canapary & Galanis
Ethnicity Q29. Which of the following best describes your race/ethnic background? (Multiple responses accepted)
2016 Total
2016 Weekday Peak
2016 Weekday Off‐peak
2016 Weekend
Base (All Respondents) 5,554 4,212 890 452 % % % %
White/Caucasian 53 52 54 54
Asian 36 37 33 30
Hispanic/Latino 11 11 12 13
Black/African American 4 3 4 4
Native Hawaiian Or Other Pacific Islander
2
2 2 2
American Indian Or Alaska Native 1 1 2 1
Middle Eastern/Arabic/Persian 1 1 1 1
Mixed (Unspecified) <1 <1 <1 ‐
(See Statistical Table 35)
2016 CALTRAIN TRIENNIAL CUSTOMER SURVEY | SUMMARY REPORT
51 Corey, Canapary & Galanis
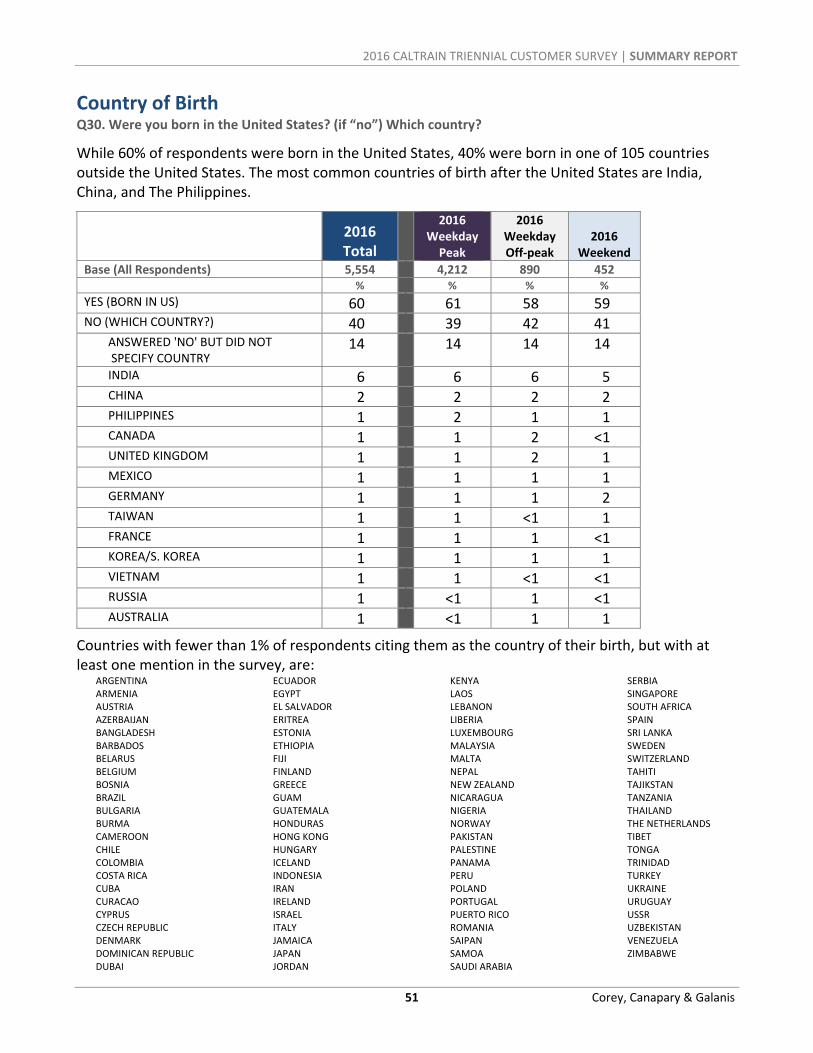
Country of Birth Q30. Were you born in the United States? (if “no”) Which country?
While 60% of respondents were born in the United States, 40% were born in one of 105 countries outside the United States. The most common countries of birth after the United States are India, China, and The Philippines.
2016 Total
2016 Weekday Peak
2016 Weekday Off‐peak
2016 Weekend
Base (All Respondents) 5,554 4,212 890 452 % % % %
YES (BORN IN US) 60 61 58 59 NO (WHICH COUNTRY?) 40 39 42 41 ANSWERED 'NO' BUT DID NOT SPECIFY COUNTRY
14
14 14 14
INDIA 6 6 6 5 CHINA 2 2 2 2 PHILIPPINES 1 2 1 1 CANADA 1 1 2 <1 UNITED KINGDOM 1 1 2 1 MEXICO 1 1 1 1 GERMANY 1 1 1 2 TAIWAN 1 1 <1 1 FRANCE 1 1 1 <1 KOREA/S. KOREA 1 1 1 1 VIETNAM 1 1 <1 <1 RUSSIA 1 <1 1 <1 AUSTRALIA 1 <1 1 1
Countries with fewer than 1% of respondents citing them as the country of their birth, but with at least one mention in the survey, are: ARGENTINA ARMENIA AUSTRIA AZERBAIJAN BANGLADESH BARBADOS BELARUS BELGIUM BOSNIA BRAZIL BULGARIA BURMA CAMEROON CHILE COLOMBIA COSTA RICA CUBA CURACAO CYPRUS CZECH REPUBLIC DENMARK DOMINICAN REPUBLIC DUBAI
ECUADOR EGYPT EL SALVADOR ERITREA ESTONIA ETHIOPIA FIJI FINLAND GREECE GUAM GUATEMALA HONDURAS HONG KONG HUNGARY ICELAND INDONESIA IRAN IRELAND ISRAEL ITALY JAMAICA JAPAN JORDAN
KENYA LAOS LEBANON LIBERIA LUXEMBOURG MALAYSIA MALTA NEPAL NEW ZEALAND NICARAGUA NIGERIA NORWAY PAKISTAN PALESTINE PANAMA PERU POLAND PORTUGAL PUERTO RICO ROMANIA SAIPAN SAMOA SAUDI ARABIA
SERBIA SINGAPORE SOUTH AFRICA SPAIN SRI LANKA SWEDEN SWITZERLAND TAHITI TAJIKSTAN TANZANIA THAILAND THE NETHERLANDS TIBET TONGA TRINIDAD TURKEY UKRAINE URUGUAY USSR UZBEKISTAN VENEZUELA ZIMBABWE

2016 CALTRAIN TRIENNIAL CUSTOMER SURVEY | SUMMARY REPORT
52 Corey, Canapary & Galanis
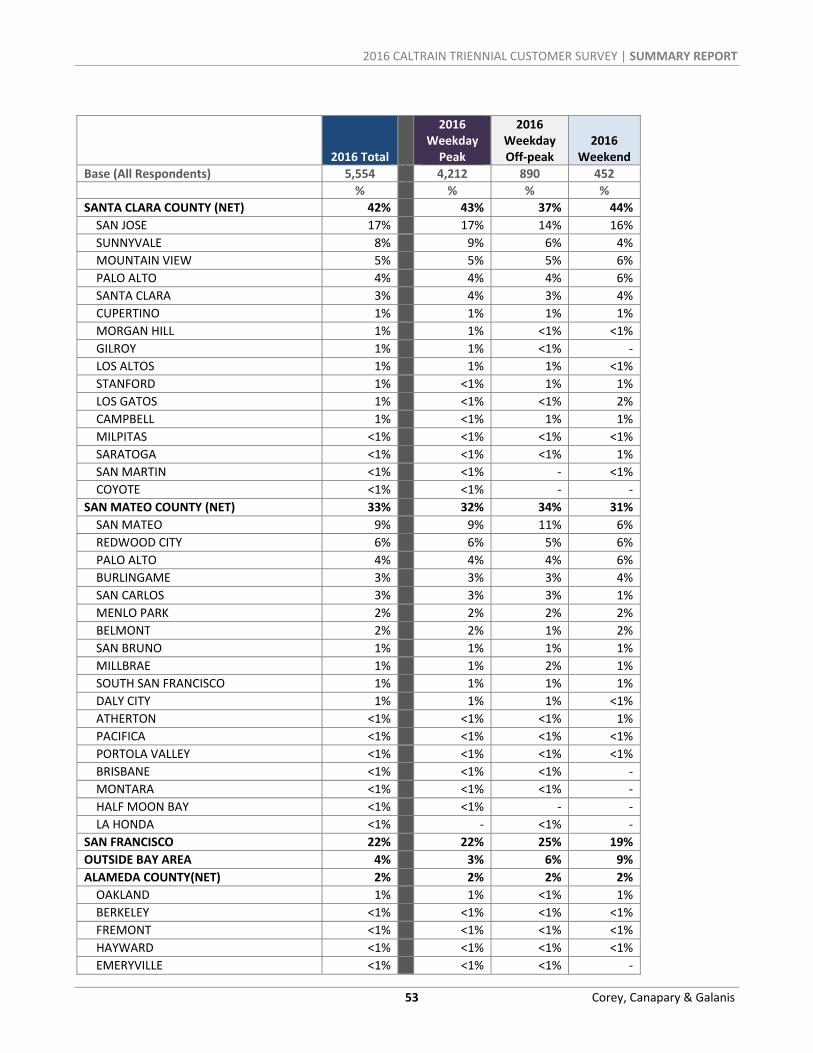
Home Region (Based on ZIP Code) Most Caltrain riders live in the Bay Area (96%) – particularly Santa Clara County (41%), San Mateo County (30%), and San Francisco (22%). On the next page is a breakdown by Bay Area city. The most common home cities among Caltrain riders are San Francisco (22%), San Jose (17%), San Mateo (9%), and Sunnyvale (8%).
2016 Total
2016 Weekday Peak
2016 Weekday Off‐peak
2016 Weekend
Base (All Respondents) 5,554 4,212 890 452 % % % %
BAY AREA (NET) 96% 97% 94% 91%
SANTA CLARA COUNTY 41% 42% 35% 41%
SAN MATEO COUNTY 30% 30% 31% 28%
SAN FRANCISCO 22% 22% 25% 19%
ALAMEDA COUNTY 2% 2% 2% 2%
MARIN COUNTY <1% <1% <1% ‐
NAPA COUNTY <1% <1% ‐ ‐
CONTRA COSTA COUNTY <1% <1% 1% <1%
SOLANO COUNTY <1% <1% <1% <1%
SONOMA COUNTY <1% <1% <1% <1%
OTHER CALIFORNIA BY COUNTY (NET) 2% 2% 2% 5%
OUTSIDE OF CALIFORNIA (NET) 2% 1% 3% 5%
OUTSIDE THE US <1% <1% <1% ‐
2016 CALTRAIN TRIENNIAL CUSTOMER SURVEY | SUMMARY REPORT
53 Corey, Canapary & Galanis
2016 Total
2016Weekday Peak
2016 Weekday Off‐peak
2016 Weekend
Base (All Respondents) 5,554 4,212 890 452
% % % %
SANTA CLARA COUNTY (NET) 42% 43% 37% 44%
SAN JOSE 17% 17% 14% 16%
SUNNYVALE 8% 9% 6% 4%
MOUNTAIN VIEW 5% 5% 5% 6%
PALO ALTO 4% 4% 4% 6%
SANTA CLARA 3% 4% 3% 4%
CUPERTINO 1% 1% 1% 1%
MORGAN HILL 1% 1% <1% <1%
GILROY 1% 1% <1% ‐
LOS ALTOS 1% 1% 1% <1%
STANFORD 1% <1% 1% 1%
LOS GATOS 1% <1% <1% 2%
CAMPBELL 1% <1% 1% 1%
MILPITAS <1% <1% <1% <1%
SARATOGA <1% <1% <1% 1%
SAN MARTIN <1% <1% ‐ <1%
COYOTE <1% <1% ‐ ‐
SAN MATEO COUNTY (NET) 33% 32% 34% 31%
SAN MATEO 9% 9% 11% 6%
REDWOOD CITY 6% 6% 5% 6%
PALO ALTO 4% 4% 4% 6%
BURLINGAME 3% 3% 3% 4%
SAN CARLOS 3% 3% 3% 1%
MENLO PARK 2% 2% 2% 2%
BELMONT 2% 2% 1% 2%
SAN BRUNO 1% 1% 1% 1%
MILLBRAE 1% 1% 2% 1%
SOUTH SAN FRANCISCO 1% 1% 1% 1%
DALY CITY 1% 1% 1% <1%
ATHERTON <1% <1% <1% 1%
PACIFICA <1% <1% <1% <1%
PORTOLA VALLEY <1% <1% <1% <1%
BRISBANE <1% <1% <1% ‐
MONTARA <1% <1% <1% ‐
HALF MOON BAY <1% <1% ‐ ‐
LA HONDA <1% ‐ <1% ‐
SAN FRANCISCO 22% 22% 25% 19%
OUTSIDE BAY AREA 4% 3% 6% 9%
ALAMEDA COUNTY(NET) 2% 2% 2% 2%
OAKLAND 1% 1% <1% 1%
BERKELEY <1% <1% <1% <1%
FREMONT <1% <1% <1% <1%
HAYWARD <1% <1% <1% <1%
EMERYVILLE <1% <1% <1% ‐
2016 CALTRAIN TRIENNIAL CUSTOMER SURVEY | SUMMARY REPORT
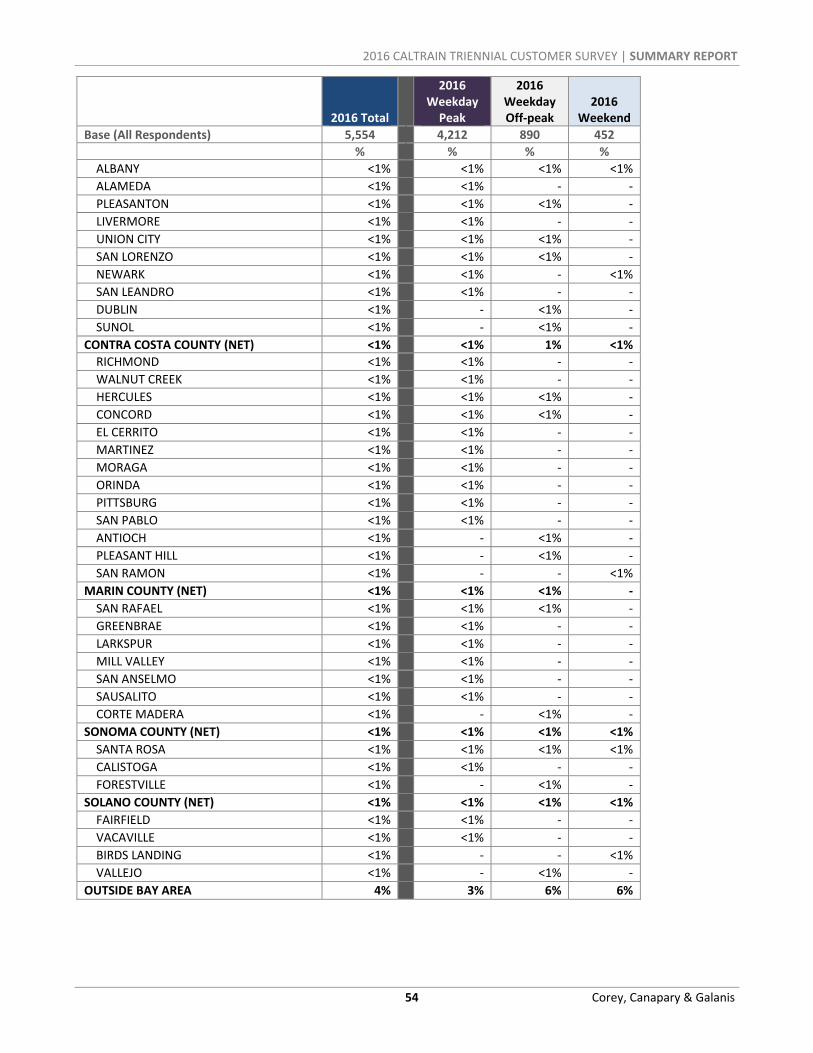
54 Corey, Canapary & Galanis
2016 Total
2016Weekday Peak
2016 Weekday Off‐peak
2016 Weekend
Base (All Respondents) 5,554 4,212 890 452
% % % %
ALBANY <1% <1% <1% <1%
ALAMEDA <1% <1% ‐ ‐
PLEASANTON <1% <1% <1% ‐
LIVERMORE <1% <1% ‐ ‐
UNION CITY <1% <1% <1% ‐
SAN LORENZO <1% <1% <1% ‐
NEWARK <1% <1% ‐ <1%
SAN LEANDRO <1% <1% ‐ ‐
DUBLIN <1% ‐ <1% ‐
SUNOL <1% ‐ <1% ‐
CONTRA COSTA COUNTY (NET) <1% <1% 1% <1%
RICHMOND <1% <1% ‐ ‐
WALNUT CREEK <1% <1% ‐ ‐
HERCULES <1% <1% <1% ‐
CONCORD <1% <1% <1% ‐
EL CERRITO <1% <1% ‐ ‐
MARTINEZ <1% <1% ‐ ‐
MORAGA <1% <1% ‐ ‐
ORINDA <1% <1% ‐ ‐
PITTSBURG <1% <1% ‐ ‐
SAN PABLO <1% <1% ‐ ‐
ANTIOCH <1% ‐ <1% ‐
PLEASANT HILL <1% ‐ <1% ‐
SAN RAMON <1% ‐ ‐ <1%
MARIN COUNTY (NET) <1% <1% <1% ‐
SAN RAFAEL <1% <1% <1% ‐
GREENBRAE <1% <1% ‐ ‐
LARKSPUR <1% <1% ‐ ‐
MILL VALLEY <1% <1% ‐ ‐
SAN ANSELMO <1% <1% ‐ ‐
SAUSALITO <1% <1% ‐ ‐
CORTE MADERA <1% ‐ <1% ‐
SONOMA COUNTY (NET) <1% <1% <1% <1%
SANTA ROSA <1% <1% <1% <1%
CALISTOGA <1% <1% ‐ ‐
FORESTVILLE <1% ‐ <1% ‐
SOLANO COUNTY (NET) <1% <1% <1% <1%
FAIRFIELD <1% <1% ‐ ‐
VACAVILLE <1% <1% ‐ ‐
BIRDS LANDING <1% ‐ ‐ <1%
VALLEJO <1% ‐ <1% ‐
OUTSIDE BAY AREA 4% 3% 6% 6%
2016 CALTRAIN TRIENNIAL CUSTOMER SURVEY | SUMMARY REPORT
55 Corey, Canapary & Galanis
APPENDICES
2016 CALTRAIN TRIENNIAL CUSTOMER SURVEY | SUMMARY REPORT
56 Corey, Canapary & Galanis
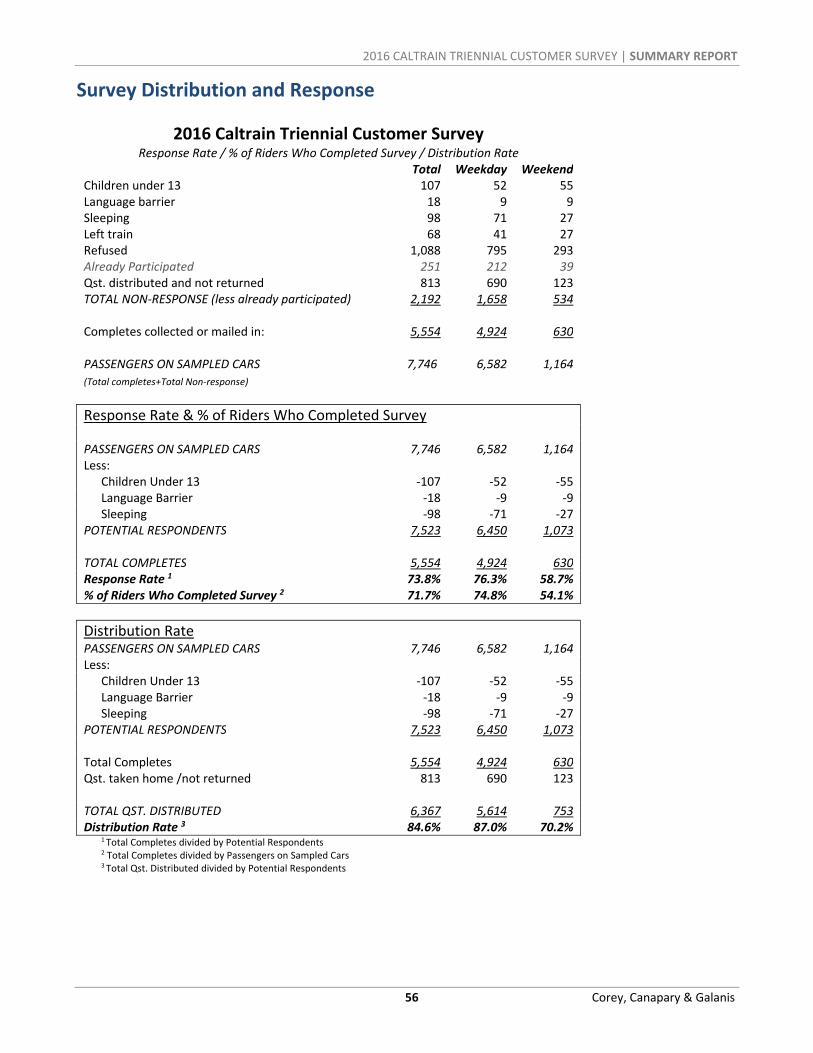
Survey Distribution and Response
2016 Caltrain Triennial Customer SurveyResponse Rate / % of Riders Who Completed Survey / Distribution Rate
Total Weekday Weekend Children under 13 107 52 55 Language barrier 18 9 9 Sleeping 98 71 27 Left train 68 41 27 Refused 1,088 795 293 Already Participated 251 212 39 Qst. distributed and not returned 813 690 123 TOTAL NON‐RESPONSE (less already participated) 2,192 1,658 534
Completes collected or mailed in: 5,554 4,924 630
PASSENGERS ON SAMPLED CARS 7,746 6,582 1,164
(Total completes+Total Non‐response)
Response Rate & % of Riders Who Completed Survey PASSENGERS ON SAMPLED CARS 7,746 6,582 1,164 Less: Children Under 13 ‐107 ‐52 ‐55 Language Barrier ‐18 ‐9 ‐9 Sleeping ‐98 ‐71 ‐27 POTENTIAL RESPONDENTS 7,523 6,450 1,073
TOTAL COMPLETES 5,554 4,924 630 Response Rate 1 73.8% 76.3% 58.7% % of Riders Who Completed Survey 2 71.7% 74.8% 54.1%
Distribution Rate PASSENGERS ON SAMPLED CARS 7,746 6,582 1,164 Less: Children Under 13 ‐107 ‐52 ‐55 Language Barrier ‐18 ‐9 ‐9 Sleeping ‐98 ‐71 ‐27 POTENTIAL RESPONDENTS 7,523 6,450 1,073 Total Completes 5,554 4,924 630 Qst. taken home /not returned 813 690 123 TOTAL QST. DISTRIBUTED 6,367 5,614 753 Distribution Rate 3 84.6% 87.0% 70.2%
1 Total Completes divided by Potential Respondents
2 Total Completes divided by Passengers on Sampled Cars
3 Total Qst. Distributed divided by Potential Respondents

2016 CALTRAIN TRIENNIAL CUSTOMER SURVEY | SUMMARY REPORT
57 Corey, Canapary & Galanis
Language Barriers Surveys were printed in Spanish and English. The majority of respondents used the English language survey, with only 23 respondents (out of 5,554) opting for the Spanish language survey. Surveyors were also provided a card (see the Interviewer Training Instructions section of the Appendix) to measure the amount of potential responses who spoke neither English nor Spanish. Potential respondents were shown a card that stated “I speak ___” with responses in Hindi, Mandarin, Cantonese, Tagalog, French, German, Vietnamese, Russian, Korean, Italian, and Japanese. Of the 18 language barriers encountered, 14 were willing to complete the language card. Responses are tabulated below:
Language #
Mandarin* 7
Cantonese* 3
Japanese 2
Russian 1
Telugu (added) 1
Greek (added) 1
French ‐
German ‐
Hindi ‐
Italian ‐
Korean ‐
Tagalog ‐
Vietnamese ‐
Unknown (did not complete card) 4
*One of the 14 language barriers indicated they spoke both Mandarin and Cantonese.

2016 CALTRAIN TRIENNIAL CUSTOMER SURVEY | SUMMARY REPORT
58 Corey, Canapary & Galanis
Interviewer Instructions Caltrain Triennial Onboard Survey
October 2016 | Interviewer Instructions
INTERVIEWER NAME: __________________________________
PROJECTOVERVIEW This project is a passenger survey that seeks to learn who rides Caltrain. It is a self‐administered questionnaire to be distributed onboard Caltrain trains. The questionnaires will be handed out and collected on sampled Caltrain routes. The field work will take place October 4‐13, 2016. You can learn more about Caltrain at www.caltrain.com (Keep this information handy for schedule information, too – see Part 2.) The primary goals of this survey are to:
Assess key passenger satisfaction components.
Understand ridership characteristics, such as demographics and trip purpose.
Analyze usage patterns, including access mode, frequency of using Caltrain, and type of ticket used.
Part1:HowtoconductthesurveyonCaltrain SAFETY Working on a moving train can be challenging at times. Your safety and the safety of the passengers around you is your most important priority. Please hold on to a handrail or bar at all times when you are standing or walking on the train. Allow passengers the time to find a seat or a safe place to stand before offering them a survey. Do not block passengers entering or exiting the train.
Distributing (and collecting) questionnaires from passengers is your primary task on this project. For each of your runs, you should strive to get the questionnaire into the hands of every (or nearly every) passenger. Your approach as a surveyor will make a tremendous difference in whether or not riders agree to complete the survey. BEFORE EACH RUN: SURVEY CONTROL SHEET (Yellow Card) It is very important that you enter information accurately on your survey control sheet. A separate survey control sheet will be used for each run. A run is one trip on one train from the boarding point to the end of the line or the point at which you exit the train. Each run has its own unique number, referred to as the Run ID.

2016 CALTRAIN TRIENNIAL CUSTOMER SURVEY | SUMMARY REPORT
59 Corey, Canapary & Galanis
AT THE START OF EACH RUN YOU SHOULD ENTER ON SURVEY CONTROL SHEET (Yellow Card):
The current date and day Route number of the train
Your last name
Run ID (the Run ID# from your surveyor shift assignment sheet)
The specific station where you are boarding the train to start the run (“Trip Start Location”) The time the run started (actual time the train left the station)
It is important that you enter the time departed accurately. Late trains are a key component in rider satisfaction. The delay time will be used as a factor in evaluating the rider trip satisfaction data. Run ID A shift will consist of a number of runs. Each route for a given shift will have an assigned Run ID# which is indicated on your surveyor shift assignment sheet and on the Master Schedule. Because we are offering a mail back option, it is ESSENTIAL that all questionnaires distributed to passengers have the correct Run ID. You will need to write this in before you begin surveying.
You must write the Run ID on ALL questionnaires distributed on every run. In order to be sure every questionnaire you distribute has the proper Run ID, you will need to pre‐number questionnaires BEFORE entering the train. If you exhaust all of the pre‐numbered questionnaires, you MUST write the RUN ID on EVERY questionnaire you distribute – BEFORE they are in the passengers’ hands. Review the Surveyor schedule, and based on the Route Average, pre‐number a minimum of 10 English questionnaires: You will want to pre‐number additional questionnaires if your run is during morning or evening rush hour, or on a bullet train. Since passenger volume varies, you may need additional questionnaires, so be prepared to add the Run ID if necessary. Unused surveys with the Run ID written in can be reused – cross out the prior Run ID and write in the correct Run ID. AS YOU BOARD THE TRAIN . . . REMEMBER YOU ARE A GUEST OF CALTRAIN.
DISTRIBUTING QUESTIONNAIRES Caltrain trains have five or six cars. You will be distributing questionnaires on only one of these cars. The train car for you to survey will be pre‐assigned and listed on your Interviewer Survey Schedule. For example ‐ “Train car number: 2” – means that you will survey the second car on the train. Be sure to only survey this assigned car. Do not substitute another car for the one you are assigned. Refer to the “Caltrain Information Section” for instructions on how to find your car. As noted some trains have 6 cars. These trains are highlighted on the schedule. If you are scheduled to have a 6‐car train, but it is only 5 cars: If you are on car 1, 2, 3, 4, or 5 – then take the same car as assigned.
If you are assigned car 6 – and the train is only 5 cars – then survey car 5 instead.
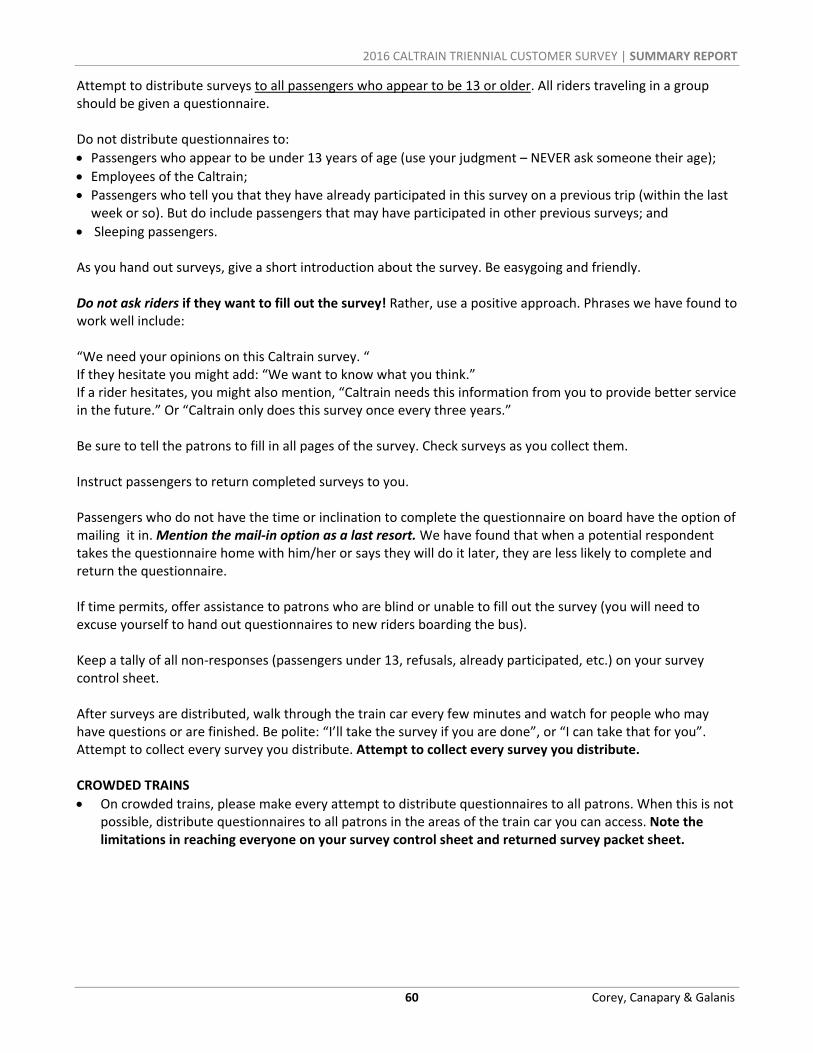
2016 CALTRAIN TRIENNIAL CUSTOMER SURVEY | SUMMARY REPORT
60 Corey, Canapary & Galanis
Attempt to distribute surveys to all passengers who appear to be 13 or older. All riders traveling in a group should be given a questionnaire. Do not distribute questionnaires to:
Passengers who appear to be under 13 years of age (use your judgment – NEVER ask someone their age);
Employees of the Caltrain;
Passengers who tell you that they have already participated in this survey on a previous trip (within the last week or so). But do include passengers that may have participated in other previous surveys; and
Sleeping passengers. As you hand out surveys, give a short introduction about the survey. Be easygoing and friendly. Do not ask riders if they want to fill out the survey! Rather, use a positive approach. Phrases we have found to work well include: “We need your opinions on this Caltrain survey. “ If they hesitate you might add: “We want to know what you think.” If a rider hesitates, you might also mention, “Caltrain needs this information from you to provide better service in the future.” Or “Caltrain only does this survey once every three years.” Be sure to tell the patrons to fill in all pages of the survey. Check surveys as you collect them. Instruct passengers to return completed surveys to you. Passengers who do not have the time or inclination to complete the questionnaire on board have the option of mailing it in. Mention the mail‐in option as a last resort. We have found that when a potential respondent takes the questionnaire home with him/her or says they will do it later, they are less likely to complete and return the questionnaire. If time permits, offer assistance to patrons who are blind or unable to fill out the survey (you will need to excuse yourself to hand out questionnaires to new riders boarding the bus). Keep a tally of all non‐responses (passengers under 13, refusals, already participated, etc.) on your survey control sheet. After surveys are distributed, walk through the train car every few minutes and watch for people who may have questions or are finished. Be polite: “I’ll take the survey if you are done”, or “I can take that for you”. Attempt to collect every survey you distribute. Attempt to collect every survey you distribute. CROWDED TRAINS
On crowded trains, please make every attempt to distribute questionnaires to all patrons. When this is not possible, distribute questionnaires to all patrons in the areas of the train car you can access. Note the limitations in reaching everyone on your survey control sheet and returned survey packet sheet.

2016 CALTRAIN TRIENNIAL CUSTOMER SURVEY | SUMMARY REPORT
61 Corey, Canapary & Galanis
LANGUAGE BARRIER
Passengers who speak English or Spanish and who refuse a questionnaire are tallied as “refusals,” since we have English and Spanish survey instruments. Only passengers who speak a language other than English or Spanish are tallied as Language Barrier.
Caltrain also wants to discover what languages (other than English and Spanish) their passengers speak. o Only when you have a passenger who is classified as a Language Barrier, give the passenger a
Spoken Language Card (Tan Card) to allow the passenger to denote what language it is that they speak. Collect these cards when complete and include with your completed surveys.
o These cards list the twelve most cited languages given as answers in the last Triennial Study to the question: “What language do you speak at home?”
As an example, this is a Spoken Language Card:
SPOKEN LANGUAGE Caltrain Onboard Survey OCTOBER 2016
I speak Translation Check
Hindi हम िहदंी जानते ह
Mandarin 我说普通话 (我說普通話)
Cantonese 我讲粤语 (我講粵語)
Tagalog Nagsasalita ako ng Tagalog
French Je parle français
German Ich spreche Deutsch
Vietnamese Tôi nói tiếng Việt
Russian Я говорю русский
Korean 나는 한국어를 한다
Italian Io parlo italiano
Japanese 私は日本語を話す

2016 CALTRAIN TRIENNIAL CUSTOMER SURVEY | SUMMARY REPORT
62 Corey, Canapary & Galanis
AT THE END OF EACH RUN – ENTER ON THE SURVEY CONTROL SHEET:
Location/station where you exited the train The time when the train arrived and the run ended.
The total number of questionnaires DISTRIBUTED for English and Spanish passengers
The total number of questionnaires RETURNED (collected by you and in your possession).
The total number of Spoken Language Cards RETURNED (collected by you and in your possession).
All returned surveys and the completed survey control sheet should be rubber banded together and placed in the “Completed Questionnaire” envelope. IMMEDIATELY complete the information on the front of this envelope for that run (e.g. RUN ID, # of Questionnaires Distributed, etc.)
You may have several bundles of completed surveys per route for a given shift. If the envelope becomes too full, use additional envelope(s) and label each (i.e. “envelope 1 of 2”, “envelope 2 of 2”, etc).
DEFINITIONS (SURVEY CONTROL SHEET CATEGORIES)
LANGUAGE BARRIER: Passengers who speak English or Spanish and who refuse a questionnaire are tallied as “refusals,” since we have English and Spanish survey instruments. Only passengers who speak a language other than English or Spanish are tallied as Language Barrier.
LEFT TRAIN: This is a non‐response that occurs when the surveyor cannot offer a questionnaire because of the short distance of the rider’s trip. If the rider refuses because of time constraints, it is important to offer the “mail back option”. We anticipate very few “Left Train” dispositions on this project.

2016 CALTRAIN TRIENNIAL CUSTOMER SURVEY | SUMMARY REPORT
63 Corey, Canapary & Galanis
As an example, a Survey Control Sheet may look like this at the end of a shift:
CALTRAIN ONBOARD STUDY | Survey Control Sheet FALL 2016
DATE 10 / 18 /2016 DAY OF WEEK __Thur__ Train # __312________ INTERVIEWER NAME ___Canapary_______________ RUN ID ___1234_______ BOARDED TRAIN AT: ___4th & King_______________ TIME _6:57 AM____ EXITED TRAIN AT: ___SJ - Diridon______________ TIME _7:58 AM_____
LANGUAGE # DISTRIBUTED # RETURNED ENGLISH 57 51 SPANISH 19 13 SPOKEN LANGUAGE CARD
2 2
TOTAL: 78 66 NON-RESPONSE TALLY
REFUSALS
/ // /
[ 5 ] LANGUAGE BARRIER (SPECIFY TYPE IF KNOWN)
/ / [ 2 ]
CHILD (UNDER 13)
[ ] SLEEPING
[ ] LEFT TRAIN
[ ] ALREADY PARTICIPATED
[ ] OTHER (specify) ______________
/ / (Other CCG interviewers riding to reach their shift)
[ 2 ] TOTAL
[ 9 ]
Please use hash marks ( example: //// ). Only one tally per patron.At the end of each trip, write in number totals in the brackets of each box.
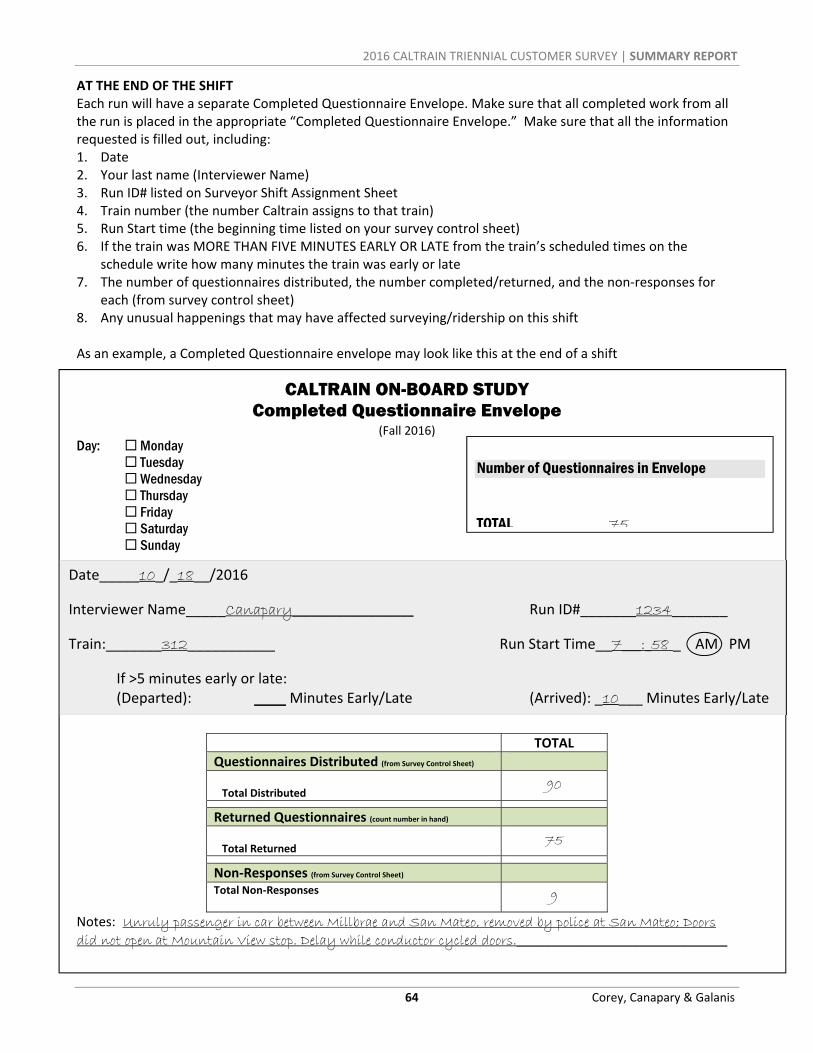
2016 CALTRAIN TRIENNIAL CUSTOMER SURVEY | SUMMARY REPORT
64 Corey, Canapary & Galanis
AT THE END OF THE SHIFT Each run will have a separate Completed Questionnaire Envelope. Make sure that all completed work from all the run is placed in the appropriate “Completed Questionnaire Envelope.” Make sure that all the information requested is filled out, including: 1. Date 2. Your last name (Interviewer Name) 3. Run ID# listed on Surveyor Shift Assignment Sheet 4. Train number (the number Caltrain assigns to that train) 5. Run Start time (the beginning time listed on your survey control sheet) 6. If the train was MORE THAN FIVE MINUTES EARLY OR LATE from the train’s scheduled times on the
schedule write how many minutes the train was early or late 7. The number of questionnaires distributed, the number completed/returned, and the non‐responses for
each (from survey control sheet) 8. Any unusual happenings that may have affected surveying/ridership on this shift
As an example, a Completed Questionnaire envelope may look like this at the end of a shift
CALTRAIN ON-BOARD STUDY Completed Questionnaire Envelope
(Fall 2016) Day: Monday Tuesday Wednesday Thursday Friday Saturday Sunday
TOTAL
Questionnaires Distributed (from Survey Control Sheet) Total Distributed
90
Returned Questionnaires (count number in hand) Total Returned
75
Non‐Responses (from Survey Control Sheet) Total Non‐Responses
9
Notes: Unruly passenger in car between Millbrae and San Mateo, removed by police at San Mateo; Doors did not open at Mountain View stop. Delay while conductor cycled doors.____________________________________
Date_____10_/_18__/2016
Interviewer Name_____Canapary___________________ Run ID#_______1234_______
Train:_______312___________ Run Start Time__7___:_58 _ AM PM
If >5 minutes early or late: (Departed): ____ Minutes Early/Late (Arrived): _10___ Minutes Early/Late
Number of Questionnaires in Envelope TOTAL 75
2016 CALTRAIN TRIENNIAL CUSTOMER SURVEY | SUMMARY REPORT
65 Corey, Canapary & Galanis
Part2–Logistics,GeneralConduct,andCommunication
Even if you are very good at conducting surveys on‐board, behaving unprofessionally, failing to be prepared (or communicate significant events) can negate your hard work. Conversely, paying attention to your travel arrangement details, time management, professional communication, and record‐keeping and other duties can help keep you organized – and actually make you a better interviewer!
Make Sure You are Off to a Good Start! Be Prepared and On Time! You should be at the train station where your shift starts at least 15 minutes prior to the scheduled rain departure time. (It is always preferable to be at the station even earlier – say, 30 minutes or so – than to be even 1 minute late.)
Have all of your supplies (see the Supplies Checklist). Before you leave for your shift, know what trains you are surveying and when they arrive and depart. Some trains may become delayed along the route. Frequently, they are able to make up the time prior to the end of the run. Occasionally, however, the delay may impact your ability to make your next train. It may be preferable to alight from the train a station early to catch your next train. Have the Caltrain schedule with you at all times to aid in making this decision.
All interviewers should bring a watch. You may also consider wearing clothes with pockets since you will have to carry a good deal of material.
All surveyors must wear their ID badges and have a valid photo ID at all times while surveying.
Please act professionally at all times. Passengers, Caltrain employees, and others are observing your behavior.
Always introduce yourself to at least one of the conductors. We are guests on their trains.
The average number of passengers will vary significantly by run and time of day. You will be provided with pencils for use by passengers who need them.
Conduct Yourself Professionally Under our contract with Caltrain, the badge/access letter which allows you to ride free of charge may only be used when working on this study. Any misuse will be embarrassing to all and is cause for immediate dismissal.
As representatives of CC&G and Caltrain, interviewers are expected to act professionally at all times.
Professional ‘business casual’ attire is a must. Your overall appearance should be neat and professional. This also means:
o Long trousers and collared shirts for men (jacket optional). o For women, slacks and a blouse/shirt are acceptable. Skirts or dresses may also be worn. o Wear comfortable, closed toed shoes. You will be standing/walking most of your shift. o NO t‐shirts, sweatshirts/sweat pants/other workout wear, open‐toed shoes, or denim. o NO hats. o NO clothing with logos/messages prominently displayed.
All surveyors must wear their name badge while surveying, and have a valid photo ID at all times. Notify CC&G immediately if your name badge is lost so that it can be replaced immediately.
All survey data collected is confidential and must be treated with care. Any sharing or use of data is cause for immediate dismissal and may result in criminal charges.
Backpacks, aprons, Clipper cards, and other materials used on this project should be returned to CC&G at the end of the study.
2016 CALTRAIN TRIENNIAL CUSTOMER SURVEY | SUMMARY REPORT
66 Corey, Canapary & Galanis
Scheduling You will receive a schedule for the project today. This schedule is based on the availability you provided to CC&G and the study needs. Prior to leaving training today, it is your responsibility to review the schedule and be sure you can make all your shift
Once the fieldwork begins, it is important to adhere to the shifts as assigned. If you cannot make any shift, notify Carol immediately.
Starting shifts late or missed shifts may be cause for dismissal.
End of Shift – Checking In and Returning Work It is very important to check in and return all completed work as soon as possible. For the first two to three (2‐3) days you work on this project, check in immediately after your shift. o If you are on a morning or day shift, this means returning to CC&G as soon as your shift is complete. o If you are on an evening shift, this means returning to CC&G the next day AND ALLOWING SUFFICIENT
TIME to review your work from the previous day before you head to that day’s shift. Once you are told you do not have to check in (generally after the first 2 shifts), it is still very important to return work soon after completing a shift. You must turn in work after each shift (within 24 hours). If you cannot turn in your work, notify CC&G immediately. Remember, CC&G’s building is open 24/7. Drop off work within 24 hours after completing a shift. Materials can be left in the wooden trunk outside the office if the office is not open. Supplies will be available right outside the office at all times.

2016 CALTRAIN TRIENNIAL CUSTOMER SURVEY | SUMMARY REPORT
67 Corey, Canapary & Galanis
Wrapping Up – A Few Other Items “What do I do if . . . . a conductor doesn’t want me on a train?” Exit the train. Do not argue with the
conductor. Do not create a confrontation. Call CC&G immediately – either the CC&G main number (during office hours) or the Emergencies Only number.
“What if I get off schedule?” You cannot substitute trains on this study. If your train is running late and you feel it is likely that you will miss your next train (you are scheduled to survey), it is OK to exit the train one or two stops prior to the final station in order to make your connnection. Be sure to collect all surveys prior to exiting the train. We have tried to design the schedule to avoid this situation, but it is possible.
Remember – your demeanor reflects on CC&G – including the condition of the questionnaires you hand out. Do not allow your questionnaires to get ragged, stained, or grubby. Keep your backpack neat so coffee, candy, gum, etc. does not come in contact with your questionnaires. Dirty/stained questionnaires look unattractive and deter riders from participating.
Always make sure the Run ID is written in – and make sure it is the CORRECT Run ID. It makes a large difference. When a survey is mailed in or completed online, the Run ID will tell us key pieces of information, including the day, the date, and train. If these pieces of information are missing, the collected information is not as valuable.
CONTACT INFORMATION COREY, CANAPARY & GALANIS RESEARCH Supervisor – Elizabeth Grant Project Manager – Carol Anne Carroll; [email protected] CC&G 800 Number is 1 (800) 877‐1201 The regular office number is 415‐397‐1200 – Voicemail 24/7 Outside of normal office hours, contact:
Jon Canapary (415) 577‐2428 (after 5 pm Monday‐Friday; afternoon/evening weekends)
Carol Anne Carroll (415) 200‐5277 (before 8 am Monday‐Friday; before 12 noon weekends) CALTRAIN Agency Contact – Julian Jest, Caltrain Marketing, 650‐508‐6245

2016 CALTRAIN TRIENNIAL CUSTOMER SURVEY | SUMMARY REPORT
68 Corey, Canapary & Galanis
SUPPLIES CHECKLIST USE THIS TO GATHER SUPPLIES TODAY AFTER TRAINING, AND USE IT AS A REMINDER TO BE SURE YOU HAVE WHAT YOU NEED BEFORE YOU LEAVE FOR YOUR SHIFT Backpack Surveyor badge Photo ID Surveyor Schedule Travel information/supplies, including:
o Caltrain schedule o Shift‐specific information
Apron Pencils Questionnaires (English & Spanish) – use the ridership figures on your schedule to
determine how many English questionnaires you should take per run; always have a supply of at least 20 Spanish questionnaires per shift.
Spoken Language Cards for other languages – take at least 10. Completed Questionnaire Envelope(s) Survey control sheets Rubber bands Interviewer Instructions Clipboard A watch Time sheet

2016 CALTRAIN TRIENNIAL CUSTOMER SURVEY | SUMMARY REPORT
69 Corey, Canapary & Galanis
INFORMATION ABOUT CALTRAIN TRAINS TRAINSET TYPE Caltrain operates two types of equipment, Gallery and Bombardier. Gallery equipment looks like the picture below and has a center car entry: Bombardier equipment looks like the picture below and has two entry doors, one on either end of the car:

2016 CALTRAIN TRIENNIAL CUSTOMER SURVEY | SUMMARY REPORT
70 Corey, Canapary & Galanis
All runs end either at San Francisco at 4th & King, Gilroy, or San Jose Diridon stations. If your run ends at San Jose Diridon, the train MAY be continuing past this station. Be sure you exit the train at San Jose Diridon. Check your Caltrain schedule before your run.
CAR ORIENTATION, E.G. “WHICH CAR IS MY ASSIGNED CAR?” Car #1 is always at the FRONT of the train, depending on the direction of travel. When travelling south, the locomotive is in front of the train and PULLS the train. Car #1 is directly behind the locomotive. When travelling north, the locomotive is at the back of the train and PUSHES the train. Car #1 is on the opposite end of the train from the locomotive. For example: At San Francisco/4th & King – 5 cars:
At San Francisco/4th & King – 6 cars:
Car 6 (Cab) –
BIKE CAR
Car 4 Car 3 – BIKE CAR
Car 1 Locomotive Car 5
S T A T I O N
Travel Direction ‐ South
Car 2 – BIKE CAR
Car 5 (Cab) – BIKE CAR
Car 4 Car 3 Car 2 – BIKE CAR
Car 1 Locomotive
S T A T I O N
Travel Direction ‐ South
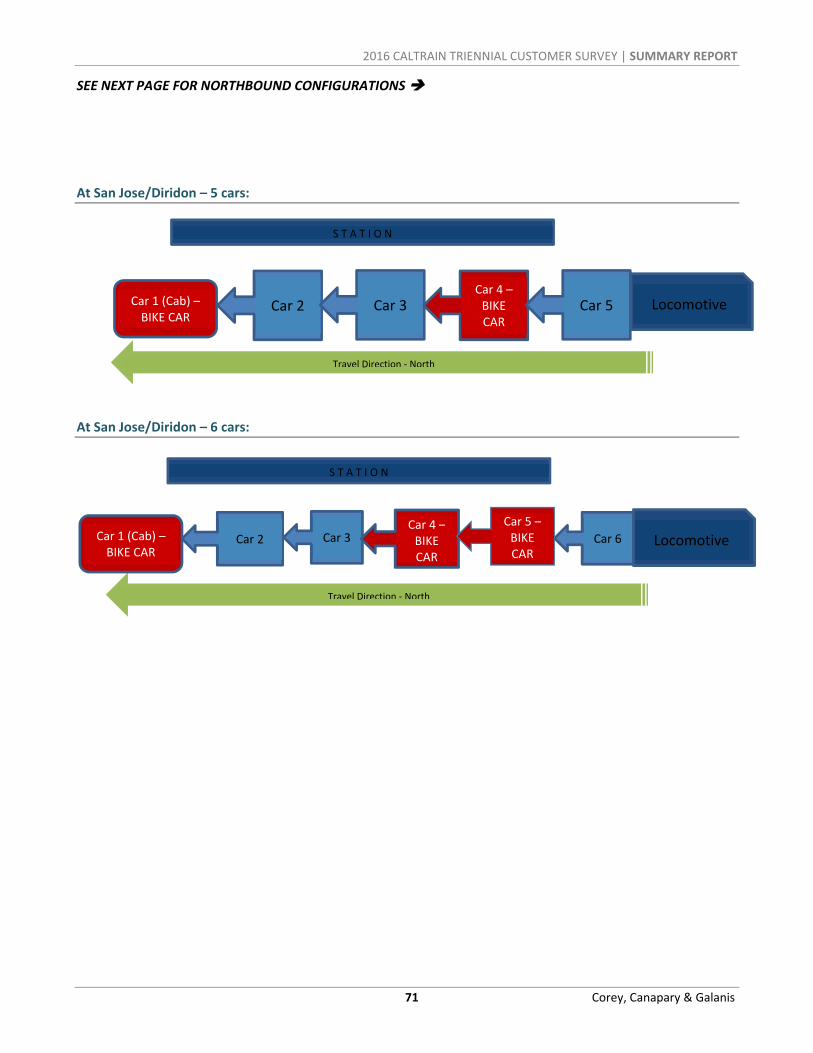
2016 CALTRAIN TRIENNIAL CUSTOMER SURVEY | SUMMARY REPORT
71 Corey, Canapary & Galanis
SEE NEXT PAGE FOR NORTHBOUND CONFIGURATIONS At San Jose/Diridon – 5 cars:
At San Jose/Diridon – 6 cars:
Car 2 Car 3 Car 4 –BIKE CAR
Car 6 Locomotive
Travel Direction ‐ North
S T A T I O N
Car 1 (Cab) – BIKE CAR
Car 5 –BIKE CAR
Car 2 Car 3 Car 4 – BIKE CAR
Car 5 Locomotive
S T A T I O N
Travel Direction ‐ North
Car 1 (Cab) – BIKE CAR
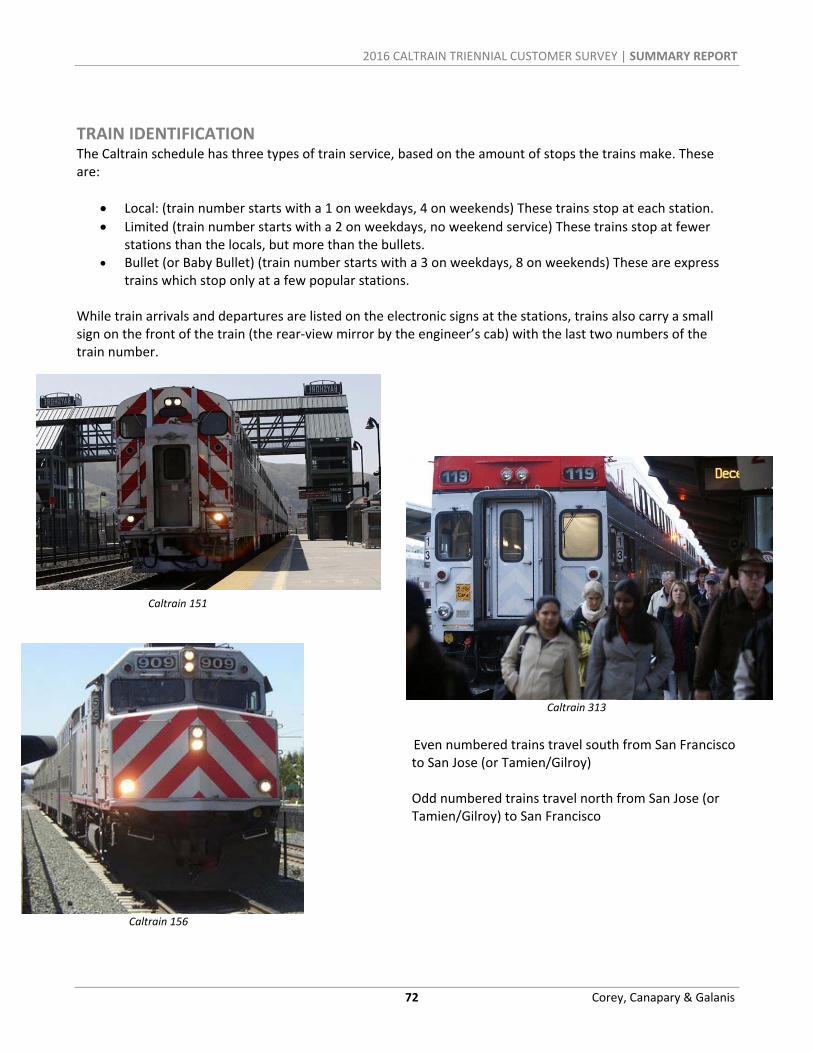
2016 CALTRAIN TRIENNIAL CUSTOMER SURVEY | SUMMARY REPORT
72 Corey, Canapary & Galanis
TRAIN IDENTIFICATION The Caltrain schedule has three types of train service, based on the amount of stops the trains make. These are:
Local: (train number starts with a 1 on weekdays, 4 on weekends) These trains stop at each station.
Limited (train number starts with a 2 on weekdays, no weekend service) These trains stop at fewer stations than the locals, but more than the bullets.
Bullet (or Baby Bullet) (train number starts with a 3 on weekdays, 8 on weekends) These are express trains which stop only at a few popular stations.
While train arrivals and departures are listed on the electronic signs at the stations, trains also carry a small sign on the front of the train (the rear‐view mirror by the engineer’s cab) with the last two numbers of the train number.
Even numbered trains travel south from San Francisco to San Jose (or Tamien/Gilroy)
Odd numbered trains travel north from San Jose (or
Tamien/Gilroy) to San Francisco
Caltrain 151
Caltrain 313
Caltrain 156
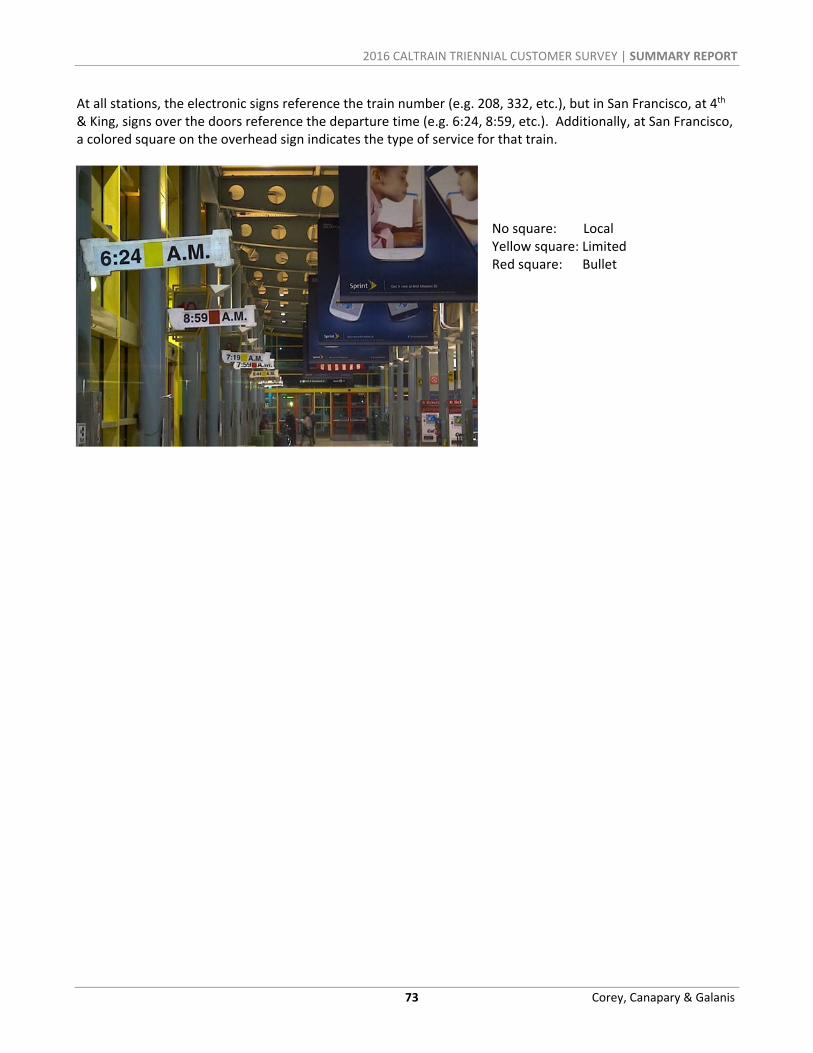
2016 CALTRAIN TRIENNIAL CUSTOMER SURVEY | SUMMARY REPORT
73 Corey, Canapary & Galanis
At all stations, the electronic signs reference the train number (e.g. 208, 332, etc.), but in San Francisco, at 4th & King, signs over the doors reference the departure time (e.g. 6:24, 8:59, etc.). Additionally, at San Francisco, a colored square on the overhead sign indicates the type of service for that train.
No square: Local Yellow square: Limited Red square: Bullet

2016 CALTRAIN TRIENNIAL CUSTOMER SURVEY | SUMMARY REPORT
74 Corey, Canapary & Galanis
Survey Questionnaires

[ 5 ] [ 1 ]10/16-6.9K-JBJ-C
(Please tape closed here)
Please open Run ID_____________
PASS
ENG
ER S
UR
VEY
CAL
TRAI
N M
ARKE
T R
ESEA
RC
H D
EPT.
PO
BO
X 3
006
SA
N C
AR
LOS
CA
940
70-9
927
NO
PO
STA
GE
NE
CE
SS
AR
YIF
MA
ILE
DIN
TH
EU
NIT
ED
STA
TES
BU
SIN
ES
S R
EP
LY M
AIL
FIR
ST-
CLA
SS
MA
ILS
AN
CA
RLO
S C
AP
ER
MIT
NO
. 15
PO
STA
GE
WIL
L B
E P
AID
BY
AD
DR
ES
SE
E
26. How well do you speak English? Very well Well Not well Not at all
27. In your home, is English spoken: Very well Well Not well Not at all
28. Which languages are spoken in your home? (Check ALL that apply) English Mandarin Spanish Cantonese Hindi or other Indian language Tagalog Other - specify: __________________________________
29. Which of the following best describes your race/ethnic background? (Check ALL that apply) Asian American Indian or Alaska Native Black/African American Hispanic/Latino Native Hawaiian or Other Pacific Islander White/Caucasian Other race - specify: _______________________
30. Were you born in the United States? Yes No - in which country? ___________________
31. Annual household income (before taxes): Less than $24,999/year $100,000 - $124,999 $30,000 - $39,999 $125,000 - $149,999 $40,000 - $49,999 $150,000 - $199,999 $50,000 - $74,999 $200,000 or more $75,000 - $99,999
Comments or Suggestions for Caltrain
___________________________________________________
___________________________________________________
___________________________________________________
___________________________________________________
___________________________________________________
Thank you for completing this survey! Please return it to a surveyor on the train or mail it to us by Nov. 06, 2016. (No postage necessary. Please fold, then tape the side where indicated; no staples.)
Dear Caltrain Passenger,
Please take a moment to complete this survey to help Caltrain serve you better. We appreciate you choosing Caltrain.Your responses are confidential and will be used for statistical purposes only. One survey per passenger please. Return your completed survey to the onboard surveyor or drop in the mail - no postage necessary.
1. How long have you been riding Caltrain? This is my first trip 1 year to less than 2 years Less than 6 months 2 years to less than 4 years 6 months to less than 1 year 4 years or more
2. How often do you usually ride Caltrain? 6-7 days/week 2 days/week 5 days/week 1 day/week 4 days/week 1-3 days/month 3 days/week Less than once a month
3. How did you pay for this train trip (today)? One-way ticket Clipper cash value Day Pass Clipper 8-ride Ticket Go Pass Clipper Caltrain Monthly Pass Other - specify: _____________________
4. What is your fare category? Adult (Age 19 through 64) Youth (Age 18 & younger) Senior (Age 65 & older) Disabled Medicare cardholder
5. Are you making a round trip on Caltrain today?(That is, you either rode Caltrain earlier today or will ride later today.) Yes No
6. What is the main purpose of your trip today?(Check only ONE) Work Social/recreational School Shopping Airport (SFO, San Jose Int'l) Going home Other - specify: ___________
7. What is the approximate distance between your starting location and the Caltrain station you used today? _______ miles

[ 4 ][ 3 ][ 2 ] Continued on back
8. What are your main reasons for riding Caltrain? Productive use of time Don't have a car/don't drive Help the environment Employer subsidy Avoid traffic Lack of/cost of parking Relax/reduce stress Faster than other options Save money (gas, wear and tear on car) Other - specify: ___________________________________
9. At which station did you get ON this train?
_______________________________________(station)
10. At which station will you get OFF this train?
_______________________________________(station)
18. Are there any barriers to using a Clipper® card? (Check up to THREE) No, there are no barriers I don't know about Clipper/never heard of it I don't understand how to use it I had a bad experience with Clipper I prefer to pay as I go I don't use it enough/don't need it Limited vendors (to get and load card) Other - specify: ___________________________________
19. How do you get schedules and other Caltrain information? (Check all that apply) Printed material on train Conductor Station information boards Caltrain customer service (1.800.660.4287) Caltrain website (www.caltrain.com) "Caltrain Connection" newsletter Other - specify: __________________________________
20. What is your home ZIP code? ___ ___ ___ ___ ___
21. Gender: Male Female
22. Age: Under 13 25-34 55-64 13-18 35-44 65 or older 19-24 45-54
23. Marital Status: Married Single Divorced Widowed Separated Domestic Partnership
24. What is the highest level of education you have completed? Some high school College graduate High school graduate Post graduate degree Some college or technical school
25. What is your current employment status? Employed full time (35 or more hours per week) Employed part time (fewer than 35 hours per week) Student Homemaker Retired Unemployed Other - specify: __________________________________
12. Did you have a car available to take this particular trip? Yes No
13. If you have been riding Caltrain for less than one year, what motivated you to start using Caltrain? Worsening traffic Change in financial Change of company circumstances Change in health Lack of access to a car Special event (like a SF Giants game or concert) Other - specify: ___________________________________
14. How well is Caltrain meeting your needs? Please rate each item below, where 5=Very Satisfied and
1=Very Dissatisfied. If the question does not apply, circle NA for Not Applicable. Very Very Satisfied Dissatisfied
a. Overall Caltrain experience 5 4 3 2 1 NA
b. Value for the money 5 4 3 2 1 NA
c. Overall satisfaction with www.caltrain.com 5 4 3 2 1 NA
d. Connections with other transit systems (i.e. SamTrans, BART, Muni, VTA)
5 4 3 2 1 NA
e. Convenience of schedule (goes where you want to go, when you want to go)
5 4 3 2 1 NA
f. Effectiveness of station signage 5 4 3 2 1 NA
15. Where do you usually access the internet? (Check all that apply) I don't have internet access Cell/tablet/personal hotspot Home Library or other public areas Work Other - specify: __________
16. Do you currently have a checking account, savings account, credit union account or a credit card? Yes No I don't know
17. Do you use a Clipper® card? Yes No
11a. Getting to the station How did you get to the station where you got on this train?
(Please check one main mode.)
11b. Leaving the station After you get off this train, how will you get from the station to your final destination? (Please check one main mode.)
Drove car Drive car
Walked all the way Walk all the way
Another Caltrain train Another Caltrain train
BART BART
SamTrans SamTrans
Muni Muni
VTA VTA
AC Transit AC Transit
Got dropped off by car Get picked up by car
Bicycled Bicycle
Free shuttle Free shuttle
TNC (Transportation Networking Companies)
TNC (Transportation Networking Companies)
Other - specify: ____________________
Other - specify _____________________

[ 1 ][ 5 ] 10/16-0.6K-JBJ-C Run ID______________ Por favor abra
(Por favor sellar aqui con cinta adhesiva)
PASS
ENG
ER S
UR
VEY
CAL
TRAI
N M
ARKE
T R
ESEA
RC
H D
EPT.
PO
BO
X 3
006
SA
N C
AR
LOS
CA
940
70-9
927
NO
PO
STA
GE
NE
CE
SS
AR
YIF
MA
ILE
DIN
TH
EU
NIT
ED
STA
TES
BU
SIN
ES
S R
EP
LY M
AIL
FIR
ST-
CLA
SS
MA
ILS
AN
CA
RLO
S C
AP
ER
MIT
NO
. 15
PO
STA
GE
WIL
L B
E P
AID
BY
AD
DR
ES
SE
E
26. ¿Qué tan bien habla usted el inglés? Muy bien Bien No muy bien No lo hablo
27. En su casa, el inglés se habla: Muy bien Bien No muy bien No se habla
28. ¿Cuáles idiomas se hablan regularmente en su casa? (Marque TODOS los que sean pertinentes) Inglés Mandarin Español Cantones Hindi o otro idioma Indio Tagalo
Otro - especifique: __________________
29. ¿Cuáles de los siguientes grupos étnicos describe mejor su origen? (Marque TODOS los que sean pertinentes) Asiático Indígena de los EE.UU. o Alaska Negro/Afro Americano Hispano/Latino Nativo de Hawai o otras islas del Pacífico Blanco/caucásico Otro - especifique: ________________________
30. ¿Usted nació en los Estados Unidos? Si No - ¿en qué país? ___________________
31. ¿Cuál es el ingreso anual total en su casa (antes de impuestos)? Less than $24,999/year $100,000 - $124,999 $30,000 - $39,999 $125,000 - $149,999 $40,000 - $49,999 $150,000 - $199,999 $50,000 - $74,999 $200,000 or more $75,000 - $99,999
Comentarios o sugerencias para Caltrain
___________________________________________________
___________________________________________________
___________________________________________________
___________________________________________________
___________________________________________________
¡Gracias por completar esta encuesta! Por favor regrésela al encuestador en el tren o envienos por correo antes de 6 de noviembre de 2016. (No necesita estampilla. Por favor dóbrela y cierre el lado indicado con cinta adhesiva; no grapas.)
Estimado Pasajero de Caltrain,Por favor tome un momento para completar esta encuesta para ayudar a Caltrain a servirle mejor. Apreciamos su elección en viajar con Caltrain.Sus respuestas son confidenciales y serán usadas para propósitos estadísticos solamente. Una encuesta por pasajero por favor. Regrese su encuesta completa al supervisor abordo o envíela por correo no necesita estampilla.
1. ¿Cuánto tiempo ha estado viajando en Caltrain? Este es mi primer viaje Entre 1 año a menos de 2 años Menos de 6 meses Entre 2 años a menos de 4 años Entre 6 meses y menos 4 años o más de 1 año
2. ¿Con que frecuencia viaja en Caltrain? 6-7 dias/semana 2 dias/semana 5 dias/semana 1 dias/semana 4 dias/semana 1-3 dias/mes 3 dias/semana Menos de una vez al mes
3. ¿Cómo pagó por este viaje en el tren? Boleto de un viaje Clipper e-cash Pase diario Clipper boleto de 8 viajes Go Pass Clipper pase mensual de Caltrain Otro - especifique: ______________
4. ¿Cuál es la categoría de su tarifa? Adulto (de 19 a 64 años) Joven (18 años o menor) Anciano (65 años o mayor) Discapacitado Afiliados a Medicare
5. ¿Estás haciendo un viaje de ida y vuelta en Caltrain hoy?(Esto es, viajaste hoy más temprano o viajarás más tarde este día en Caltrain.) Si No
6. ¿Cuál es el propósito principal de su viaje hoy? (Marque solo UNO) Trabajo Social/recreativo Escuela Compras Aeropuerto (SFO, Int'l de San José) Ir a casa Otro - especifique: ______________
7. ¿Cuál es la distancia aproximada entre su ubicación inicial y la estación de Caltrain que utilizó hoy? ___ millas.
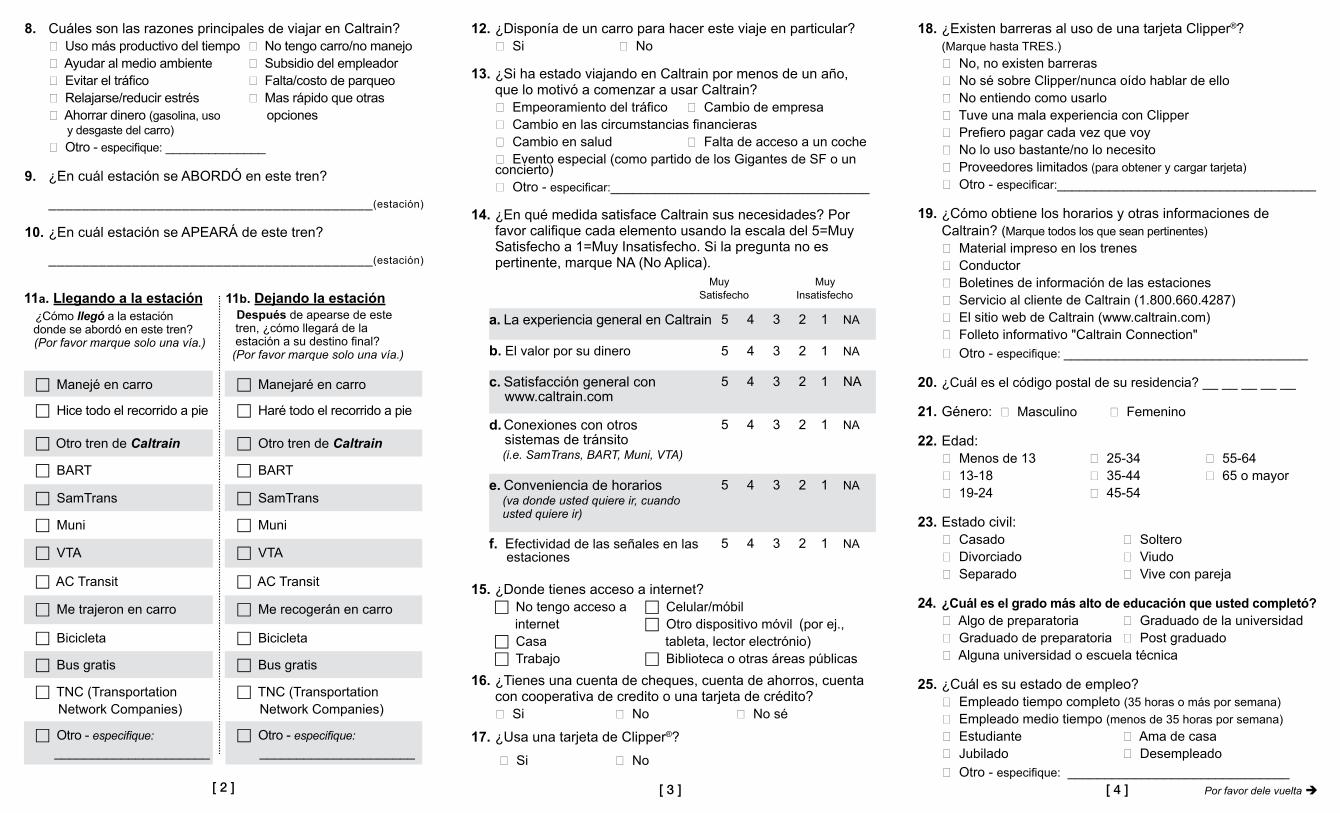
[ 4 ][ 3 ][ 2 ] Por favor dele vuelta
8. Cuáles son las razones principales de viajar en Caltrain? Uso más productivo del tiempo No tengo carro/no manejo Ayudar al medio ambiente Subsidio del empleador Evitar el tráfico Falta/costo de parqueo Relajarse/reducir estrés Mas rápido que otras Ahorrar dinero (gasolina, uso opciones y desgaste del carro) Otro - especifique: ______________
9. ¿En cuál estación se ABORDÓ en este tren?
_______________________________________(estación)
10. ¿En cuál estación se APEARÁ de este tren?
_______________________________________(estación)
18. ¿Existen barreras al uso de una tarjeta Clipper®? (Marque hasta TRES.) No, no existen barreras No sé sobre Clipper/nunca oído hablar de ello No entiendo como usarlo Tuve una mala experiencia con Clipper Prefiero pagar cada vez que voy No lo uso bastante/no lo necesito Proveedores limitados (para obtener y cargar tarjeta) Otro - especificar:___________________________________
19. ¿Cómo obtiene los horarios y otras informaciones de Caltrain? (Marque todos los que sean pertinentes) Material impreso en los trenes Conductor Boletines de información de las estaciones Servicio al cliente de Caltrain (1.800.660.4287) El sitio web de Caltrain (www.caltrain.com) Folleto informativo "Caltrain Connection" Otro - especifique: _________________________________
20. ¿Cuál es el código postal de su residencia? __ __ __ __ __
21. Género: Masculino Femenino
22. Edad: Menos de 13 25-34 55-64 13-18 35-44 65 o mayor 19-24 45-54
23. Estado civil: Casado Soltero Divorciado Viudo Separado Vive con pareja
24. ¿Cuál es el grado más alto de educación que usted completó? Algo de preparatoria Graduado de la universidad Graduado de preparatoria Post graduado Alguna universidad o escuela técnica
25. ¿Cuál es su estado de empleo? Empleado tiempo completo (35 horas o más por semana) Empleado medio tiempo (menos de 35 horas por semana) Estudiante Ama de casa Jubilado Desempleado Otro - especifique: ______________________________
12. ¿Disponía de un carro para hacer este viaje en particular? Si No
13. ¿Si ha estado viajando en Caltrain por menos de un año, que lo motivó a comenzar a usar Caltrain? Empeoramiento del tráfico Cambio de empresa Cambio en las circumstancias financieras Cambio en salud Falta de acceso a un coche Evento especial (como partido de los Gigantes de SF o un concierto) Otro - especificar:___________________________________
14. ¿En qué medida satisface Caltrain sus necesidades? Por favor califique cada elemento usando la escala del 5=Muy Satisfecho a 1=Muy Insatisfecho. Si la pregunta no es pertinente, marque NA (No Aplica). Muy Muy Satisfecho Insatisfecho
a. La experiencia general en Caltrain 5 4 3 2 1 NA
b. El valor por su dinero 5 4 3 2 1 NA
c. Satisfacción general con www.caltrain.com
5 4 3 2 1 NA
d. Conexiones con otros sistemas de tránsito (i.e. SamTrans, BART, Muni, VTA)
5 4 3 2 1 NA
e. Conveniencia de horarios (va donde usted quiere ir, cuando usted quiere ir)
5 4 3 2 1 NA
f. Efectividad de las señales en las estaciones
5 4 3 2 1 NA
15. ¿Donde tienes acceso a internet? No tengo acceso a Celular/móbil internet Otro dispositivo móvil (por ej., Casa tableta, lector electrónio) Trabajo Biblioteca o otras áreas públicas
16. ¿Tienes una cuenta de cheques, cuenta de ahorros, cuenta con cooperativa de credito o una tarjeta de crédito? Si No No sé
17. ¿Usa una tarjeta de Clipper®?
Si No
11a. Llegando a la estación ¿Cómo llegó a la estación donde se abordó en este tren? (Por favor marque solo una vía.)
11b. Dejando la estación Después de apearse de este tren, ¿cómo llegará de la estación a su destino final? (Por favor marque solo una vía.)
Manejé en carro Manejaré en carro
Hice todo el recorrido a pie Haré todo el recorrido a pie
Otro tren de Caltrain Otro tren de Caltrain
BART BART
SamTrans SamTrans
Muni Muni
VTA VTA
AC Transit AC Transit
Me trajeron en carro Me recogerán en carro
Bicicleta Bicicleta
Bus gratis Bus gratis
TNC (Transportation Network Companies)
TNC (Transportation Network Companies)
Otro - especifique: _____________________
Otro - especifique: _____________________