calvert socially responsible funds - prospectus january 31, 2006, as revised april 7, 2006 these...
TRANSCRIPT
Prospectus
Socially Responsible Funds
Calvert Social Investment Fund (CSIF)• Balanced Portfolio• Equity Portfolio• Enhanced Equity Portfolio• Bond Portfolio• Money Market Portfolio
Calvert Social Index FundCalvert Large Cap Growth FundCalvert Capital Accumulation FundCalvert World Values International Equity FundCalvert New Vision Small Cap FundCalvert Small Cap Value FundCalvert Mid Cap Value Fund
January 31, 2006,as revised April 7, 2006

PROSPECTUS January 31, 2006,
as revised April 7, 2006
These securities have not been approved or disapproved by the Securities andExchange Commission (SEC) or any State Securities Commission, nor has theSEC or any State Securities Commission passed on the accuracy or adequacy ofthis prospectus. Any representation to the contrary is a criminal offense.
About the FundsInvestment Objective, Strategy,Principal Risks, Past Performance 2 CSIF Balanced7 CSIF Equity11 Calvert Social Index Fund14 CSIF Enhanced Equity19 Calvert Large Cap Growth 24 Calvert Capital Accumulation 29 Calvert World Values
International Equity 34 Calvert New Vision Small Cap 38 Calvert Small Cap Value 42 Calvert Mid Cap Value 47 CSIF Bond54 CSIF Money Market
56 Fees and Expenses71 Principal Investment Strategies
and Risks
About Social Investing80 Investment Selection Process 81 Socially Responsible Investment
Criteria84 High Social Impact Investments85 Special Equities85 Manager Discovery Program86 Shareholder Advocacy and
Social Responsibility
About Your Investment86 About Calvert 87 Advisor, Subadvisors and
Portfolio Managers96 Advisory Fees97 How to Buy Shares97 Getting Started98 Choosing a Share Class101 Calculation of CDSC/Waiver102 Reduced Sales Charges (sales
load breakpoints/discount)105 Reinstatement Privilege 105 Distribution and Service Fees107 Next Step – Account Application108 Important – How Shares are
Priced109 When Your Account Will be
Credited110 Other Calvert Features / Policies
(Exchanges, Market Timing Policy, Minimum Account Balance, etc.)
114 Dividends, Capital Gains and Taxes
116 How to Sell Shares119 Financial Highlights151 Exhibit A – Service Fees and
Other Arrangements with Dealers
SOCIALLY RESPONSIBLE PROSPECTUS – 2
CSIF BALANCED
ObjectiveCSIF Balanced seeks to achieve a competitive total return through an activelymanaged portfolio of stocks, bonds, and money market instruments which offerincome and capital growth opportunity and which satisfy the investment andsocial criteria.
Principal Investment StrategiesThe Fund typically invests about 60% of its assets in stocks and 40% in bondsor other fixed-income investments. Stock investments are primarily commonstock in large-cap companies, while the fixed-income investments are primarily awide variety of investment grade bonds.
CSIF Balanced invests in a combination of stocks, bonds and money marketinstruments in an attempt to provide a complete investment portfolio in a singleproduct. The Advisor rebalances the portfolio quarterly to adjust for changes inmarket value. The equity portion of the Fund is, primarily, a large cap core U.S.domestic portfolio, although it may have other investments, including some for-eign stocks and mid-cap stocks. The equity portion of the Fund seeks companiesthat have the potential to outperform the market through exceptional growthand/or valuation improvement. The fixed-income portion reflects an active trad-ing strategy, seeking total return.
Equity investments are selected by the Subadvisors, while the Advisor managesthe fixed-income assets and determines the overall mix for the Fund dependingupon its view of market conditions and economic outlook.
The Fund invests with the philosophy that long-term rewards to investors willcome from those organizations whose products, services, and methods enhancethe human condition and the traditional American values of individual initia-tive, equality of opportunity, and cooperative effort. All investments are selectedon the basis of their ability to contribute to the dual objectives of financialsoundness and societal impact. See "Investment Selection Process."

SOCIALLY RESPONSIBLE PROSPECTUS – 3
Principal RisksYou could lose money on your investment in the Fund, or the Fund couldunderperform for any of the following reasons:
• The market prices of stocks or bonds decline.• The individual stocks and bonds in the Fund do not perform as well as
expected, and/or the Fund’s portfolio management practices do not work toachieve their desired result.
• Large cap companies may be unable to respond quickly to new competitivechallenges such as changes in technology, and also may not be able to attainthe high growth rate of successful smaller companies, especially during extend-ed periods of economic expansion.
• For the fixed-income portion of the Fund, the Advisor’s forecast as to interestrates is not correct.
• For the fixed-income securities held in the Fund, the credit quality of thesecurities deteriorates, which could lead to default or bankruptcy of the issuer,where the issuer becomes unable to pay its obligations when due.
• The Federal National Mortgage Association and the Federal Home LoanMortgage Corporation issue debt and mortgage-backed securities commonlyknown as Fannie Maes and Freddie Macs, respectively. Securities issued bygovernment-sponsored enterprises (“GSEs”) such as Fannie Mae and FreddieMac are neither insured nor guaranteed by the U.S. Treasury and are notbacked by the full faith and credit of the U.S. Government. Such securities areonly supported by the credit of the GSE. Mortgage-backed securities are sub-ject to the risk of prepayment, where unanticipated prepayments may occur(usually in response to a reduction in interest rates), reducing the value of amortgage-backed security. The Fund must then reinvest those assets at thecurrent market rate, which may be lower. Mortgage-backed securities are alsosubject to the risk of extension, where an unexpected rise in interest rates willextend the life of a mortgage-backed security beyond the expected prepaymenttime, typically reducing the security’s value.
• For the foreign securities held in the Fund, there are additional risks relatingto political, social, and economic developments abroad. Other risks from theseinvestments result from the differences between the regulations to which U.S.and foreign issuers and markets are subject, the potential for foreign marketsto be less liquid than U.S. markets and the currency risk associated with secu-rities that trade in currencies other than the U.S. dollar.
• The Advisor’s allocation among different sectors of the stock and bond mar-kets does not perform as well as expected.
• Common stocks represent an ownership interest in a company. They may ormay not pay dividends or carry voting rights. Common stock occupies themost junior position in a company's capital structure. Debt securities and pre-ferred stocks have rights senior to a company's common stock. Although com-mon stocks have a history of long-term growth in value, their prices fluctuate
SOCIALLY RESPONSIBLE PROSPECTUS – 4
based on changes in a company's financial condition and on overall marketand economic conditions.
The fixed-income portion of the Fund employs an active style that seeks to posi-tion the Fund with securities that offer the greatest price appreciation while min-imizing risk. The active style can result in higher turnover, exceeding 100%, andmay cause the Fund to have a relatively high amount of short-term capital gains,which are taxable to you at the ordinary income tax rate, and may translate tohigher transaction costs.
An investment in the Fund is not a bank deposit and is not insured or guaran-teed by the Federal Deposit Insurance Corporation or any other governmentagency.
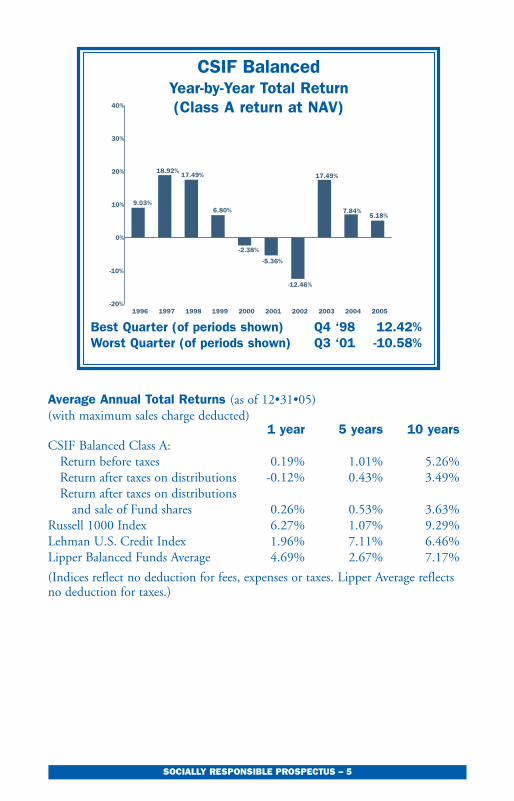
CSIF Balanced PerformanceThe bar chart and table below show the Fund’s annual returns and its long-termperformance. The chart and table provide some indication of the risks of invest-ing in the Fund. The chart shows how the performance of the Class A shares hasvaried from year to year. The table compares the Fund’s performance over timeto that of the Russell 1000 Index and the Lehman U.S. Credit Index, widely rec-ognized unmanaged indexes of common stock and bond prices, respectively. Italso shows the Fund’s returns compared to the Lipper Balanced Funds Average,an average of the annual return of mutual funds that have an investment goalsimilar to that of the Fund. After-tax returns are calculated using the historicalhighest individual federal marginal income tax rates, and do not reflect theimpact of state and local taxes. Actual after-tax returns depend on your tax situa-tion and may differ from these shown. The after-tax returns shown are not rele-vant to you if you hold your Fund shares through a tax-deferred arrangementsuch as a 401(k) plan or individual retirement account. The return after taxes ondistributions and sale of Fund shares may be higher than the return before taxesbecause the calculation assumes that shareholders receive a tax benefit for capitallosses incurred on the sale of their shares. After-tax returns are shown only forClass A shares; after-tax returns for other classes will vary. The Fund’s past per-formance does not necessarily indicate how the Fund will perform in the future.
The return for the Fund’s other classes of shares offered by this prospectus willdiffer from the Class A returns shown in the bar chart, depending upon theexpenses of that Class. The bar chart does not reflect any sales charge that youmay be required to pay upon purchase or redemption of the Fund’s shares. Anysales charge will reduce your return. The average total return table shows theFund’s returns with the maximum sales charge deducted. No sales charge hasbeen applied to the indices used for comparison in the table.
SOCIALLY RESPONSIBLE PROSPECTUS – 5
Average Annual Total Returns (as of 12•31•05)(with maximum sales charge deducted)
1 year 5 years 10 yearsCSIF Balanced Class A:
Return before taxes 0.19% 1.01% 5.26%Return after taxes on distributions -0.12% 0.43% 3.49%Return after taxes on distributions
and sale of Fund shares 0.26% 0.53% 3.63% Russell 1000 Index 6.27% 1.07% 9.29%Lehman U.S. Credit Index 1.96% 7.11% 6.46%Lipper Balanced Funds Average 4.69% 2.67% 7.17%
(Indices reflect no deduction for fees, expenses or taxes. Lipper Average reflectsno deduction for taxes.)
Best Quarter (of periods shown) Q4 ‘98 12.42%Worst Quarter (of periods shown) Q3 ‘01 -10.58%
1996 1997 1998 1999 2000 2001 2002 2003 2004 2005-20%
-10%
0%
10%
20%
30%
40%
9.03%
18.92%17.49%
6.80%
-2.38%
-5.36%
-12.46%
17.49%
7.84%5.18%
CSIF BalancedYear-by-Year Total Return (Class A return at NAV)

SOCIALLY RESPONSIBLE PROSPECTUS – 6
Average Annual Total Returns (as of 12•31•05)(with maximum sales charge deducted)
1 year 5 years SinceInception(3/31/98)
CSIF Balanced: Class B -0.86% 0.76% 1.68%Russell 1000 Index 6.27% 1.07% 3.62%Lehman U.S. Credit Index 1.96% 7.11% 6.40%Lipper Balanced Funds Average 4.69% 2.67% 4.00%
(Indices reflect no deduction for fees, expenses or taxes. Lipper Average reflectsno deduction for taxes.)
1 year 5 years 10 yearsCSIF Balanced: Class C 3.19% 0.98% 4.68%Russell 1000 Index 6.27% 1.07% 9.29%Lehman U.S. Credit Index 1.96% 7.11% 6.46%Lipper Balanced Funds Average 4.69% 2.67% 7.17%
(Indices reflect no deduction for fees, expenses or taxes. Lipper Average reflectsno deduction for taxes.)

SOCIALLY RESPONSIBLE PROSPECTUS – 7
CSIF EQUITY ObjectiveCSIF Equity seeks growth of capital through investment in stocks of issuers inindustries believed to offer opportunities for potential capital appreciation andwhich meet the Fund’s investment and social criteria.
Principal Investment StrategiesUnder normal circumstances, the Fund will invest at least 80% of its net assets(including borrowings for investment purposes) in equity securities. “Equity securi-ties” for purposes of this 80% policy means common stock. The Fund will provideshareholders with at least 60 days’ notice before changing this 80% policy. The Fundinvests primarily in the common stocks of U.S. large-cap companies, although it mayhave other investments, including some foreign stocks and mid-cap stocks. The Funddefines large-cap companies as those whose market capitalization falls within the rangeof the S&P 500 Index. The S&P 500 Index is reconstituted from time to time. Themarket capitalization range for the S&P 500 Index was $768 million to $370 billionas of December 31, 2005. Under normal circumstances, the Fund seeks to have aweighted average market capitalization of at least $20 billion. The Fund also may pur-chase stocks outside the S&P 500 Index. Investment returns will be primarily fromchanges in the price of the Fund’s holdings (capital appreciation).
The Subadvisor looks for growing companies with a history of steady earningsgrowth. Companies are selected based on the Subadvisor’s opinion that the companyhas the ability to sustain growth through growing profitability and that the stock isfavorably priced with respect to those growth expectations. The Subadvisor may electto sell a security when deteriorating business or financial prospects, excessive valua-tion, or other factors that conflict with the original rationale that support investing inthe company make the investment less attractive.
The Fund invests with the philosophy that long-term rewards to investors willcome from those organizations whose products, services, and methods enhancethe human condition and the traditional American values of individual initia-tive, equality of opportunity, and cooperative effort. All investments are selectedon the basis of their ability to contribute to the dual objectives of financialsoundness and societal impact. See "Investment Selection Process."
Principal RisksYou could lose money on your investment in the Fund, or the Fund couldunderperform for any of the following reasons:
• The stock market goes down.• The individual stocks in the Fund do not perform as well as expected, and/or the
Fund's portfolio management practices do not work to achieve their desired result.• The prices of growth company securities held by the Fund may fall to a greater
extent than the overall equity markets due to changing economic, political or mar-ket conditions or disappointing growth company earnings results. Growth stocks
SOCIALLY RESPONSIBLE PROSPECTUS – 8
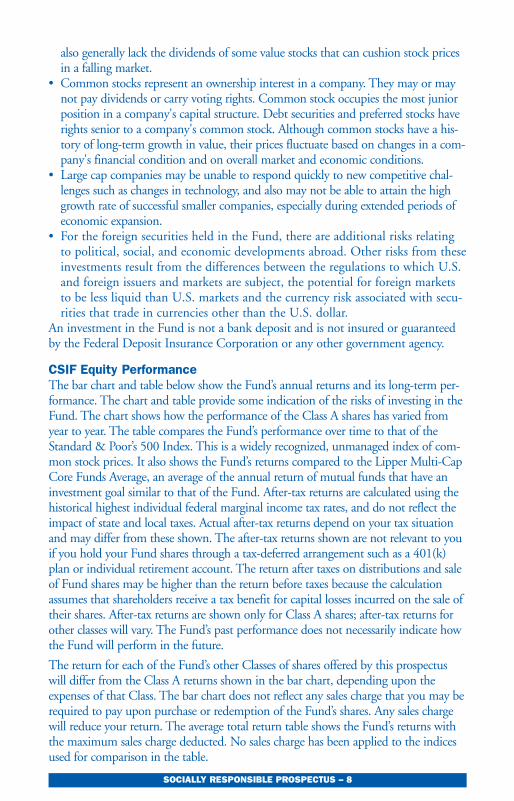
also generally lack the dividends of some value stocks that can cushion stock pricesin a falling market.
• Common stocks represent an ownership interest in a company. They may or maynot pay dividends or carry voting rights. Common stock occupies the most juniorposition in a company's capital structure. Debt securities and preferred stocks haverights senior to a company's common stock. Although common stocks have a his-tory of long-term growth in value, their prices fluctuate based on changes in a com-pany's financial condition and on overall market and economic conditions.
• Large cap companies may be unable to respond quickly to new competitive chal-lenges such as changes in technology, and also may not be able to attain the highgrowth rate of successful smaller companies, especially during extended periods ofeconomic expansion.
• For the foreign securities held in the Fund, there are additional risks relatingto political, social, and economic developments abroad. Other risks from theseinvestments result from the differences between the regulations to which U.S.and foreign issuers and markets are subject, the potential for foreign marketsto be less liquid than U.S. markets and the currency risk associated with secu-rities that trade in currencies other than the U.S. dollar.
An investment in the Fund is not a bank deposit and is not insured or guaranteedby the Federal Deposit Insurance Corporation or any other government agency.
CSIF Equity PerformanceThe bar chart and table below show the Fund’s annual returns and its long-term per-formance. The chart and table provide some indication of the risks of investing in theFund. The chart shows how the performance of the Class A shares has varied fromyear to year. The table compares the Fund’s performance over time to that of theStandard & Poor’s 500 Index. This is a widely recognized, unmanaged index of com-mon stock prices. It also shows the Fund’s returns compared to the Lipper Multi-CapCore Funds Average, an average of the annual return of mutual funds that have aninvestment goal similar to that of the Fund. After-tax returns are calculated using thehistorical highest individual federal marginal income tax rates, and do not reflect theimpact of state and local taxes. Actual after-tax returns depend on your tax situationand may differ from these shown. The after-tax returns shown are not relevant to youif you hold your Fund shares through a tax-deferred arrangement such as a 401(k)plan or individual retirement account. The return after taxes on distributions and saleof Fund shares may be higher than the return before taxes because the calculationassumes that shareholders receive a tax benefit for capital losses incurred on the sale oftheir shares. After-tax returns are shown only for Class A shares; after-tax returns forother classes will vary. The Fund’s past performance does not necessarily indicate howthe Fund will perform in the future.
The return for each of the Fund’s other Classes of shares offered by this prospectuswill differ from the Class A returns shown in the bar chart, depending upon theexpenses of that Class. The bar chart does not reflect any sales charge that you may berequired to pay upon purchase or redemption of the Fund’s shares. Any sales chargewill reduce your return. The average total return table shows the Fund’s returns withthe maximum sales charge deducted. No sales charge has been applied to the indicesused for comparison in the table.

SOCIALLY RESPONSIBLE PROSPECTUS – 9
Best Quarter (of periods shown) Q4 ‘98 26.98%Worst Quarter (of periods shown) Q3 ‘98 -17.56%
1996 1997 1998 1999 2000 2001 2002 2003 2004 2005-20%
-10%
0%
10%
20%
30%
21.68%19.33%
10.89%
23.17%
11.61%
0.67%
-14.93%
22.31%
6.69%4.16%
CSIF EquityYear-by-Year Total Return (Class A return at NAV)
Average Annual Total Returns (as of 12•31•05)(with maximum sales charge deducted)
1 year 5 years 10 yearsCSIF Equity Class A:
Return before taxes -0.79% 2.09% 9.40%Return after taxes on distributions -1.03% 1.92% 8.31%Return after taxes on distributions
and sale of Fund shares -0.19% 1.75% 7.73% S&P 500 Index 4.91% 0.54% 9.07%Lipper Multi-Cap Core Funds Average 6.59% 1.65% 9.01%
(Index reflects no deduction for fees, expenses or taxes. Lipper Average reflectsno deduction for taxes.)

SOCIALLY RESPONSIBLE PROSPECTUS – 10
Average Annual Total Returns (as of 12•31•05)(with maximum sales charge deducted)
1 year 5 years SinceInception(3/31/98)
CSIF Equity: Class B -1.70% 1.99% 5.16%S&P 500 Index 4.91% 0.54% 3.19%Lipper Multi-Cap Core Funds Average 6.59% 1.65% 4.46%
(Index reflects no deduction for fees, expenses or taxes. Lipper Average reflectsno deduction for taxes.)
Average Annual Total Returns (as of 12•31•05)(with maximum sales charge deducted)
1 year 5 years 10 yearsCSIF Equity: Class C 2.37% 2.24% 8.91%S&P 500 Index 4.91% 0.54% 9.07%Lipper Multi-Cap Core Funds Average 6.59% 1.65% 9.01%
(Index reflects no deduction for fees, expenses or taxes. Lipper Average reflectsno deduction for taxes.)

SOCIALLY RESPONSIBLE PROSPECTUS – 11
CALVERT SOCIAL INDEX FUNDObjectiveCalvert Social Index Fund seeks to match the performance of the Calvert SocialIndex™, which measures the investment return of large- and mid-capitalizationstocks.
Principal Investment StrategiesThe Fund employs a passive management strategy designed to track, as closely aspossible, the performance of the Calvert Social Index. The Fund uses a replica-tion index method, investing in the common stock of each company in theIndex in about the same proportion as represented in the Index itself. Under nor-mal circumstances, the Fund will invest at least 95% of its net assets (including bor-rowings for investment purposes) in securities contained in the Index. The Fund willprovide shareholders with at least 60 days’ notice before changing this policy.Generally, the Fund sells securities only to reflect a change in the Calvert SocialIndex.
Calvert Social IndexThe Calvert Social Index measures the performance of those companies thatmeet the social investment criteria selected from the universe of approximatelythe 1,000 largest U.S. companies, based on total market capitalization, listed onthe NYSE or NASDAQ-AMEX. As of December 31, 2005, the capitalizationrange of the Index was $808 million to $278 billion, and the weighted averagecapitalization was $65.4 billion. The Fund seeks to have a weighted average cap-italization that approximates that of the Index. As of December 31, 2005, therewere 618 companies in the Index, though this number will change over time dueto company mergers or changes due to Calvert’s evaluation of an issuer’s conductrelative to the Fund’s social criteria. The Index is reconstituted once a year basedon an updated list of the 1000 largest companies. The Index is also reviewedquarterly to adjust for social criteria and other factors.
The socially responsible criteria are described in the section “Socially ResponsibleInvestment Criteria.” Calvert continuously evaluates the performance of compa-nies included in the Index to ensure compliance with these criteria.
PRINCIPAL RISKSYou could lose money on your investment in the Fund, or the Fund couldunderperform the stock market for any of the following reasons:
• The stock market or the Calvert Social Index goes down.• An index fund has operating expenses; a market index does not. The Fund -
while expected to track its target index as closely as possible while satisfying itsinvestment and social criteria - will not be able to match the performance ofthe index exactly.

SOCIALLY RESPONSIBLE PROSPECTUS – 12
• The possibility of greater risk by investing in medium-sized companies ratherthan larger, more established companies.
• Common stocks represent an ownership interest in a company. They may ormay not pay dividends or carry voting rights. Common stock occupies themost junior position in a company's capital structure. Debt securities and pre-ferred stocks have rights senior to a company's common stock. Although com-mon stocks have a history of long-term growth in value, their prices fluctuatebased on changes in a company's financial condition and on overall marketand economic conditions.
An investment in the Fund is not a bank deposit and is not insured or guaran-teed by the Federal Deposit Insurance Corporation or any other governmentagency.
Calvert Social Index Fund PerformanceThe bar chart and table below show the Fund’s annual returns and its long-termperformance. The chart and table provide some indication of the risks of invest-ing in the Fund. The chart shows how the performance of the Class A shares hasvaried from year to year. The table compares the Fund’s performance over time tothat of the Calvert Social Index. It also shows the Fund’s returns compared to theLipper Multi-Cap Core Funds Average, an average of the annual return of mutualfunds that have an investment goal similar to that of the Fund. After-tax returnsare calculated using the historical highest individual federal marginal income taxrates, and do not reflect the impact of state and local taxes. Actual after-taxreturns depend on your tax situation and may differ from these shown. Theafter-tax returns shown are not relevant to you if you hold your Fund sharesthrough a tax-deferred arrangement such as a 401(k) plan or individual retire-ment account. The return after taxes on distributions and sale of Fund sharesmay be higher than the return before taxes because the calculation assumes thatshareholders receive a tax benefit for capital losses incurred on the sale of theirshares. After-tax returns are shown only for Class A shares; after-tax returns forother classes will vary. The Fund’s past performance does not necessarily indicatehow the Fund will perform in the future.
The return for each of the Fund’s other Classes of shares offered by this prospec-tus will differ from the Class A returns shown in the bar chart, depending uponthe expenses of that Class. The bar chart does not reflect any sales charge thatyou may be required to pay upon purchase or redemption of the Fund’s shares.Any sales charge will reduce your return. The average total return table showsthe Fund’s returns with the maximum sales charge deducted. No sales charge hasbeen applied to the indices used for comparison in the table.

Average Annual Total Returns (as of 12•31•05)(with maximum sales charge deducted)
1 year 5 year Since Inception(6/30/00)
Calvert Social Index Fund Class A:Return before taxes -1.80% -2.40% -4.89%Return after taxes on distributions -1.91% -2.53% -5.03%Return after taxes on distributions
and sale of Fund shares -1.02% -2.08% -4.14%Calvert Social Index Fund: Class B -2.90% -2.62% -5.14%Calvert Social Index Fund: Class C 1.10% -2.41% -4.97%Calvert Social Index 3.92% -0.69% -3.29%Lipper Multi-Cap Core Funds Avg. 6.59% 1.65% 0.89%
(Index reflects no deduction for fees, expenses or taxes. Lipper Average reflectsno deduction for taxes.)
SOCIALLY RESPONSIBLE PROSPECTUS – 13
Best Quarter (of periods shown) Q2 ‘03 16.13%Worst Quarter (of periods shown) Q3 ‘02 -17.76%
Calvert Social Index FundYear-by-Year Total Return (Class A return at NAV)
2001 2002 2003 2004 2005-30%
-20%
-10%
0%
10%
20%
30%
-14.17%
-24.68%
29.56%
7.74%3.07%
SOCIALLY RESPONSIBLE PROSPECTUS – 14
CSIF ENHANCED EQUITY
ObjectiveCSIF Enhanced Equity seeks a total return after expenses which exceeds overtime the total return of the Russell 1000 Index. It seeks to obtain this objectivewhile maintaining risk characteristics similar to those of the Russell 1000 Indexand through investments in stocks that meet the Fund’s investment and socialcriteria. This objective may be changed by the Fund’s Board of Trustees withoutshareholder approval.
Principal Investment StrategiesThe Fund invests in common stock of U.S. companies that meet the social crite-ria and creates a portfolio whose characteristics closely resemble the characteristicsof the Russell 1000 Index, while emphasizing the stocks which it believes offerthe greatest potential for return. Under normal circumstances, the Fund willinvest at least 80% of its net assets (including borrowings for investment purpos-es) in equity securities. “Equity securities” for purposes of this 80% policy meanscommon stock. The Fund will provide shareholders with at least 60 days’ noticebefore changing this 80% policy.
The Russell 1000 Index measures the performance of the 1,000 largest U.S.companies based on total market capitalization. The Index is adjusted, or recon-stituted, annually. As of the latest reconstitution, the average market capitaliza-tion of the Russell 1000 Index was approximately $13 billion. As of December31, 2005, the capitalization range of the Index was $582 million to $370 bil-lion. Under normal circumstances, the Fund seeks to have a weighted averagemarket capitalization of at least $20 billion.
CSIF Enhanced Equity follows an enhanced index management strategy. Insteadof passively holding a representative basket of securities designed to match theRussell 1000 Index, the Subadvisor actively uses a proprietary analytical modelto attempt to enhance the Fund’s performance, relative to the Index. The Fundmay purchase stocks not in the Russell 1000 Index, but at least 65% of theFund’s total assets will be invested in stocks that are in the Index. Any invest-ments not in the Index will meet the Fund’s social screening criteria and beselected to closely mirror the Index’s risk/return characteristics. The Subadvisorrebalances the Fund quarterly to maintain its relative exposure to the Index.
The first step of the investment strategy is to identify those stocks in the Russell1000 Index which meet the Fund's social screening criteria. From this list ofstocks, the Subadvisor chooses stocks that closely mirror the Index in terms ofvarious factors such as industry weightings, capitalization, and yield. Eventhough certain industries may be eliminated from the Fund by the screens, thefactor model permits mathematical substitutes which the Subadvisor expects tomimic the return characteristics of the missing industries and stocks.

SOCIALLY RESPONSIBLE PROSPECTUS – 15
The final step in the process is to apply the Subadvisor's proprietary valuationmethod which attempts to identify the stocks which have the greatest potentialfor superior performance. Each security identified for potential investment isranked according to three separate measures: growth, value, and momentum ofmarket sentiment. These three measures are combined to create a single com-posite score of each stock's attractiveness. The Fund is constructed fromsecurities that meet its social criteria, weighted through a mathematical processthat seeks to reduce risk vis-à-vis the Russell 1000 Index. The Subadvisor maychoose to sell a security when it no longer appears attractive under this process.
Principal RisksYou could lose money on your investment in the Fund, or the Fund couldunderperform the stock market for any of the following reasons:
• The stock market or the Russell 1000 Index goes down.• The individual stocks in the Fund or the enhanced equity modeling portfolio
do not perform as well as expected, and/or the Fund's portfolio managementpractices do not work to achieve their desired result.
• The Fund has operating expenses; a market index does not. The Fund - whileexpected to track its target index as closely as possible while satisfying its owninvestment and social criteria - will not be able to match the performance ofthe index exactly.
• Common stocks represent an ownership interest in a company. They may ormay not pay dividends or carry voting rights. Common stock occupies themost junior position in a company's capital structure. Debt securities and pre-ferred stocks have rights senior to a company's common stock. Although com-mon stocks have a history of long-term growth in value, their prices fluctuatebased on changes in a company's financial condition and on overall marketand economic conditions.
An investment in the Fund is not a bank deposit and is not insured or guaran-teed by the Federal Deposit Insurance Corporation or any other governmentagency. The Fund is not sponsored, sold, promoted, or endorsed by the FrankRussell Company.
Tracking the IndexThe Subadvisor expects the annual tracking error, relative to the return of theIndex before deducting expenses, to be within certain limits established by theAdvisor and Subadvisor. The Fund's ability to track the Index will be monitoredby analyzing returns to ensure that the returns are reasonably consistent withIndex returns. Any deviations of realized returns from the Index which are inexcess of those expected will be analyzed for sources of variance.
The Fund invests with the philosophy that long-term rewards to investors will

SOCIALLY RESPONSIBLE PROSPECTUS – 16
come from those organizations whose products, services, and methods enhancethe human condition and the traditional American values of individual initia-tive, equality of opportunity, and cooperative effort. All investments are selectedon the basis of their ability to contribute to the dual objectives of financialsoundness and societal impact. See "Investment Selection Process."
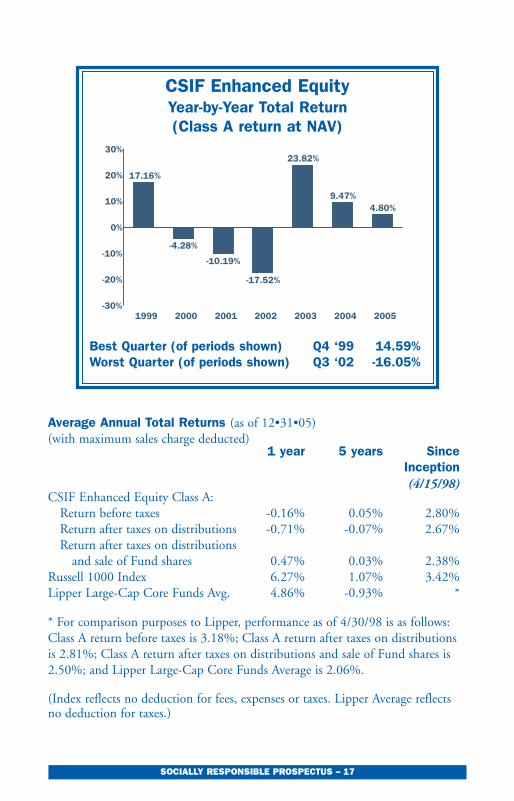
CSIF Enhanced Equity PerformanceThe bar chart and table below show the Fund’s annual returns and its long-termperformance. The chart and table provide some indication of the risks of invest-ing in the Fund. The chart shows how the performance of the Class A shares hasvaried from year to year. The table compares the Fund’s performance over timeto that of the Russell 1000 Index, a widely recognized, unmanaged index ofcommon stock prices. It also shows the Fund’s returns compared to the LipperLarge-Cap Core Funds Average, an average of the annual return of mutual fundsthat have an investment goal similar to that of the Fund. After-tax returns arecalculated using the historical highest individual federal marginal income taxrates, and do not reflect the impact of state and local taxes. Actual after-taxreturns depend on your tax situation and may differ from these shown. Theafter-tax returns shown are not relevant to you if you hold your Fund sharesthrough a tax-deferred arrangement such as a 401(k) plan or individual retire-ment account. The return after taxes on distributions and sale of Fund sharesmay be higher than the return before taxes because the calculation assumes thatshareholders receive a tax benefit for capital losses incurred on the sale of theirshares. After-tax returns are shown only for Class A shares; after-tax returns forother classes will vary. The Fund’s past performance does not necessarily indicatehow the Fund will perform in the future.
The return for the Fund’s other classes of shares offered by this prospectus willdiffer from the Class A returns shown in the bar chart, depending upon theexpenses of that Class. The bar chart does not reflect any sales charge that youmay be required to pay upon purchase or redemption of the Fund’s shares. Anysales charge will reduce your return. The average total return table shows theFund’s returns with the maximum sales charge deducted. No sales charge hasbeen applied to the indices used for comparison in the table.
SOCIALLY RESPONSIBLE PROSPECTUS – 17
Average Annual Total Returns (as of 12•31•05)(with maximum sales charge deducted)
1 year 5 years SinceInception(4/15/98)
CSIF Enhanced Equity Class A:Return before taxes -0.16% 0.05% 2.80%Return after taxes on distributions -0.71% -0.07% 2.67%Return after taxes on distributions
and sale of Fund shares 0.47% 0.03% 2.38% Russell 1000 Index 6.27% 1.07% 3.42%Lipper Large-Cap Core Funds Avg. 4.86% -0.93% *
* For comparison purposes to Lipper, performance as of 4/30/98 is as follows:Class A return before taxes is 3.18%; Class A return after taxes on distributionsis 2.81%; Class A return after taxes on distributions and sale of Fund shares is2.50%; and Lipper Large-Cap Core Funds Average is 2.06%.
(Index reflects no deduction for fees, expenses or taxes. Lipper Average reflectsno deduction for taxes.)
Best Quarter (of periods shown) Q4 ‘99 14.59%Worst Quarter (of periods shown) Q3 ‘02 -16.05%
1999 2000 2001 2002 2003 2004 2005-30%
-20%
-10%
0%
10%
20%
30%
17.16%
-4.28%
-10.19%
-17.52%
23.82%
9.47%4.80%
CSIF Enhanced EquityYear-by-Year Total Return (Class A return at NAV)
SOCIALLY RESPONSIBLE PROSPECTUS – 18
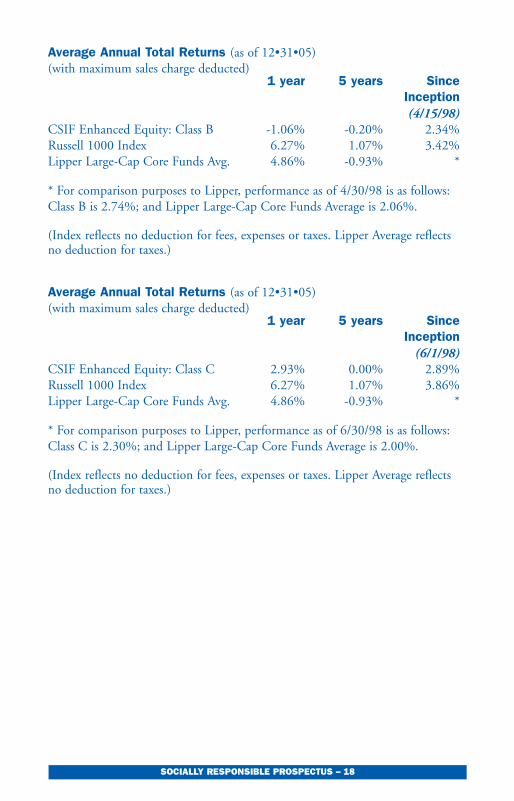
Average Annual Total Returns (as of 12•31•05)(with maximum sales charge deducted)
1 year 5 years SinceInception(4/15/98)
CSIF Enhanced Equity: Class B -1.06% -0.20% 2.34%Russell 1000 Index 6.27% 1.07% 3.42%Lipper Large-Cap Core Funds Avg. 4.86% -0.93% *
* For comparison purposes to Lipper, performance as of 4/30/98 is as follows:Class B is 2.74%; and Lipper Large-Cap Core Funds Average is 2.06%.
(Index reflects no deduction for fees, expenses or taxes. Lipper Average reflectsno deduction for taxes.)
Average Annual Total Returns (as of 12•31•05)(with maximum sales charge deducted)
1 year 5 years SinceInception
(6/1/98)CSIF Enhanced Equity: Class C 2.93% 0.00% 2.89%Russell 1000 Index 6.27% 1.07% 3.86%Lipper Large-Cap Core Funds Avg. 4.86% -0.93% *
* For comparison purposes to Lipper, performance as of 6/30/98 is as follows:Class C is 2.30%; and Lipper Large-Cap Core Funds Average is 2.00%.
(Index reflects no deduction for fees, expenses or taxes. Lipper Average reflectsno deduction for taxes.)

SOCIALLY RESPONSIBLE PROSPECTUS – 19
CALVERT LARGE CAP GROWTHObjectiveCalvert Large Cap Growth seeks to exceed the stock market total return (primarilythrough capital appreciation) at a level of total risk roughly equal to that of thestock market over longer periods of time (three years or more). The S&P 500 Indexwith dividends reinvested serves as a proxy for "stock market" in this objective.
Principal Investment StrategiesThe Fund invests in a diversified portfolio of U.S. common stocks of companiesthat meet the Fund's investment and social criteria. Under normal circumstances,the Fund will invest at least 80% of its net assets (including borrowings for invest-ment purposes) in large cap companies. The Fund will provide shareholders with atleast 60 days’ notice before changing this 80% policy. The Fund defines "large cap"companies as those whose market capitalization falls within the range of the S&P500 Index. The S&P 500 Index is reconstituted from time to time. The market cap-italization range for the S&P 500 Index was $768 million to $370 billion as ofDecember 31, 2005. Under normal circumstances, the Fund seeks to have aweighted average market capitalization of at least $10 billion. The Fund also maypurchase stocks outside the S&P 500 Index. The Fund invests in both value andgrowth companies. Value stocks are those priced cheaply relative to some financialmeasures of worth. Growth stocks have faster increasing sales and earnings.
As part of a secondary portfolio strategy, the Subadvisor may purchase or sell "tradi-tional" (i.e., exchange-traded) stock index options or futures for purposes of hedg-ing, speculation or leverage. The Subadvisor would use these investments only in itseffort to keep the long-term average market risk of the Fund roughly equal to themarket itself. For example, when market conditions are favorable in the view of theSubadvisor, the Fund may use options and index futures to increase exposure to themarket. When market conditions appear unfavorable, the Fund may use optionsand index futures to reduce exposure to the market. In this regard, to increasemarket exposure, the Fund may establish long futures positions and buy call optionson stock indices. To reduce market exposure, the Fund may buy put options onstock indices and establish short futures positions on stock indices correlated to theFund’s portfolio. At any one point in time however, the Fund’s market exposuremay be as high as 150% or as low as 50% of the market. The Advisor andSubadvisor do not intend to leverage overall market risk for the long term.
The Subadvisor to the Fund purchases and sells securities for the Fund’s portfoliobased on information derived from its proprietary stock ranking and rating models.Stocks that are rated as sufficiently attractive in the model are subject to purchase.When a holding of the Fund deteriorates in ranking or rating, it is subject to sale.

SOCIALLY RESPONSIBLE PROSPECTUS – 20
The Fund invests with the philosophy that long-term rewards to investors willcome from those organizations whose products, services, and methods enhancethe human condition and the traditional American values of individual initia-tive, equality of opportunity, and cooperative effort. All investments are selectedon the basis of their ability to contribute to the dual objectives of financialsoundness and societal impact. See "Investment Selection Process."
Principal RisksYou could lose money on your investment in the Fund, or the Fund could under-perform, most likely for any of the following reasons:
• The stock market goes down.• The individual stocks in the Fund do not perform as well as expected, and/or the
Fund's portfolio management practices do not work to achieve their desired result.• Large cap companies may be unable to respond quickly to new competitive
challenges such as changes in technology, and also may not be able to attainthe high growth rate of successful smaller companies, especially during extend-ed periods of economic expansion.
• The use of stock index futures and options may increase the volatility of theFund and may involve a small investment of cash relative to the magnitude ofthe risk assumed. At any one point in time, the Fund’s market exposure maybe as high as 150% of the market through the use of stock index futures andoptions. A stock index future is a contract to buy or sell the cash value of aspecific stock index at a specific price by a specified date. An option gives theholder a right but not the obligation to purchase or sell a security at a speci-fied price within a specified time, and a stock index option is an option basedon a stock market index (or the cash value thereof ). A call option gives thepurchaser of the option the right to purchase the underlying security from thewriter of the option at a specified price. A put option gives the purchaser ofthe option the right to sell the underlying security to the writer of the optionat a specified exercise price. Stock index futures and options are derivatives.A derivative is an instrument that derives its value from the performance of anunderlying financial asset, index or other investment. If changes in a deriva-tive’s value do not correspond to changes in the value of the Fund’s otherinvestments, the Fund may not fully benefit from or could lose money on thederivative position. Derivatives also can involve risk of loss if the party whoissued the derivative defaults on its obligation. In addition, derivatives may beless liquid and more difficult to value.
• The prices of growth company securities held by the Fund may fall to agreater extent than the overall equity markets due to changing economic,political or market conditions or disappointing growth company earningsresults. Growth stocks also generally lack the dividends of some value stocksthat can cushion stock prices in a falling market.
• Common stocks represent an ownership interest in a company. They may ormay not pay dividends or carry voting rights. Common stock occupies the

most junior position in a company's capital structure. Debt securities and pre-ferred stocks have rights senior to a company's common stock. Although com-mon stocks have a history of long-term growth in value, their prices fluctuatebased on changes in a company's financial condition and on overall marketand economic conditions.
An investment in the Fund is not a bank deposit and is not insured or guaranteedby the Federal Deposit Insurance Corporation or any other government agency.
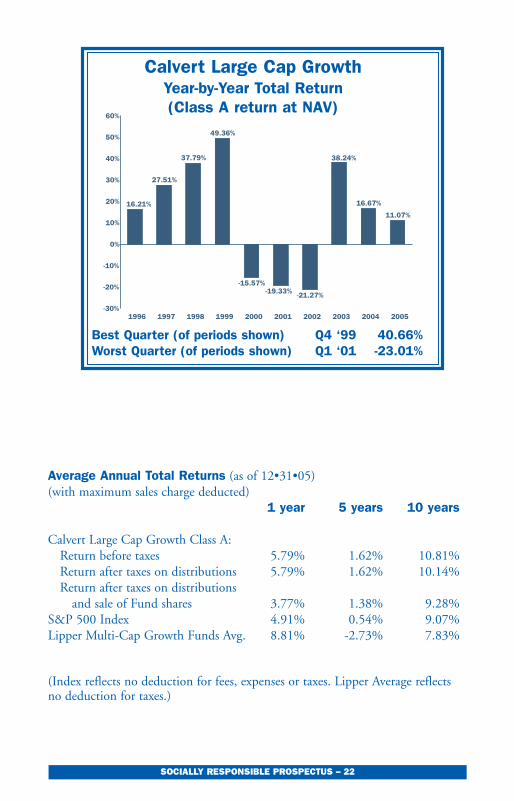
Calvert Large Cap Growth Performance*The following bar chart and table show the Fund's annual returns and its long-termperformance. The chart shows how the performance of the Fund’s shares has variedfrom year to year. The table compares the Fund's performance over time to that ofthe Standard & Poor’s 500 Index, a widely recognized, unmanaged index of com-mon stock prices. It also compares the Fund’s performance to the Lipper Multi-CapGrowth Funds Average, an average of the annual return of mutual funds that havean investment goal similar to that of the Fund. Class A, B and C shares have anactual inception date of 10/31/2000. However, Class I Shares (not offered in thisprospectus) have an inception date of 8/5/1994. In the bar chart, and in the tableClass A return before and after taxes, performance results before 10/31/2000 are forClass I. Class I shares did not have Rule 12b-1 fees and performance of the Class Awould have been lower if Rule 12b-1 fees of Class A had been reflected. After-taxreturns for other classes will vary. After-tax returns are calculated using the histori-cal highest individual federal marginal income tax rates, and do not reflect theimpact of state and local taxes. Actual after-tax returns depend on your tax situa-tion and may differ from these shown. The after-tax returns shown are not rele-vant to you if you hold your Fund shares through a tax-deferred arrangementsuch as a 401(k) plan or individual retirement account. The return after taxes ondistributions and sale of Fund shares may be higher than the return before taxesbecause the calculation assumes that shareholders receive a tax benefit for capitallosses incurred on the sale of their shares. The Fund's past performance does notnecessarily indicate how the Fund will perform in the future.
The return for the Fund's classes of shares offered by this prospectus will differ from thereturns shown in the bar chart, depending upon the expenses of that class and any appli-cable sales charge. The bar chart does not reflect any sales charge that you may berequired to pay upon purchase or redemption of the Fund's shares. Any sales charge willreduce your return. The average total return table shows the Fund’s returns with the maxi-mum sales charge deducted. No sales charge has been applied to the indices used forcomparison in the table.
* Pursuant to an Agreement and Plan of Reorganization, the Social ResponsibilityPortfolio of Bridgeway Fund, Inc. (“Bridgeway”) was reorganized into the Class I Sharesof the Calvert Large Cap Growth Fund, which commenced operations on 10/31/2000.The performance results prior to 10/31/2000 for Class A shares of the Calvert Large CapGrowth Fund reflect the performance of Bridgeway since its inception on 8/5/94.
SOCIALLY RESPONSIBLE PROSPECTUS – 21
SOCIALLY RESPONSIBLE PROSPECTUS – 22
Average Annual Total Returns (as of 12•31•05) (with maximum sales charge deducted)
1 year 5 years 10 years
Calvert Large Cap Growth Class A:Return before taxes 5.79% 1.62% 10.81%Return after taxes on distributions 5.79% 1.62% 10.14%Return after taxes on distributions
and sale of Fund shares 3.77% 1.38% 9.28% S&P 500 Index 4.91% 0.54% 9.07%Lipper Multi-Cap Growth Funds Avg. 8.81% -2.73% 7.83%
(Index reflects no deduction for fees, expenses or taxes. Lipper Average reflectsno deduction for taxes.)
Best Quarter (of periods shown) Q4 ‘99 40.66%Worst Quarter (of periods shown) Q1 ‘01 -23.01%
1996 1997 1998 1999 2000 2001 2002 2003 2004 2005-30%
-20%
-10%
0%
10%
20%
30%
40%
50%
60%
16.21%
27.51%
37.79%
49.36%
-15.57%-19.33% -21.27%
38.24%
16.67%
11.07%
Calvert Large Cap GrowthYear-by-Year Total Return (Class A return at NAV)

SOCIALLY RESPONSIBLE PROSPECTUS – 23
Average Annual Total Returns (as of 12•31•05) (with maximum sales charge deducted)
1 year 5 years SinceInception(10/31/00)
Calvert Large Cap Growth Class B 5.07% 1.44% -0.86%
S&P 500 Index 4.91% 0.54% -0.96%Lipper Multi-Cap Growth Funds Avg. 8.81% -2.73% -5.82%
(Index reflects no deduction for fees, expenses or taxes. Lipper Average reflectsno deduction for taxes.)
Average Annual Total Returns (as of 12•31•05) (with maximum sales charge deducted)
1 year 5 years SinceInception(10/31/00)
Calvert Large Cap Growth Class C 9.19% 1.64% -0.58%
S&P 500 Index 4.91% 0.54% -0.96%Lipper Multi-Cap Growth Funds Avg. 8.81% -2.73% -5.82%
(Index reflects no deduction for fees, expenses or taxes. Lipper Average reflectsno deduction for taxes.)

SOCIALLY RESPONSIBLE PROSPECTUS – 24
CALVERT CAPITAL ACCUMULATION
ObjectiveCalvert Capital Accumulation seeks to provide long-term capital appreciation byinvesting primarily in mid-cap stocks that meet the Fund’s investment and social crite-ria. This objective may be changed by the Fund’s Board of Directors without share-holder approval.
Principal Investment StrategiesInvestments are primarily in the common stocks of mid-size U.S. companies. Returnsin the Fund will be mostly from the changes in the price of the Fund’s holdings (capi-tal appreciation).
The Fund currently defines mid-cap companies as those whose market capital-ization falls within the range of the Russell MidCap Growth Index. The RussellMidCap Growth Index undergoes an annual reconstitution. The market capital-ization range for the Russell MidCap Growth Index was $583 million to $19billion as of December 31, 2005. Under normal circumstances, the Fund seeksto have a weighted average market capitalization between $2 billion and $12 bil-lion. The Fund also may purchase stocks outside the Russell MidCap GrowthIndex. Stocks chosen for the Fund combine growth and value characteristics oroffer the opportunity to buy growth at a reasonable price.
The Fund may also invest up to 25% of its net assets in foreign securities.
The Subadvisor favors companies which have an above market average prospec-tive growth rate, but sell at below market average valuations. The Subadvisorevaluates each stock in terms of its growth potential, the return for risk freeinvestments, and the risk and reward potential for the company to determine areasonable price for the stock. The Subadvisor may elect to sell a security whendeteriorating business or financial prospects, excessive valuation, or other factorsthat conflict with the original rationale that support investing in the companymake the investment less attractive.
The Fund invests with the philosophy that long-term rewards to investors willcome from those organizations whose products, services, and methods enhancethe human condition and the traditional American values of individual initia-tive, equality of opportunity, and cooperative effort. All investments are selectedon the basis of their ability to contribute to the dual objectives of financialsoundness and societal impact. See "Investment Selection Process."
Principal RisksYou could lose money on your investment in the Fund, or the Fund couldunderperform for any of the following reasons:

SOCIALLY RESPONSIBLE PROSPECTUS – 25
• The stock market goes down.• The individual stocks in the Fund do not perform as well as expected, and/or the
Fund's portfolio management practices do not work to achieve their desired result.• The possibility of greater risk by investing in medium-sized companies rather
than larger, more established companies.• The Fund is non-diversified. Compared to other funds, the Fund may invest
more of its assets in a smaller number of companies. Gains or losses on asingle stock may have greater impact on the Fund.
• Investment in foreign securities involves additional risks relating to political,social and economic developments abroad. Other risks from these investmentsresult from the differences between the regulations to which U.S. and foreignissuers and markets are subject, the potential for foreign markets to be less liquidthan U.S. markets, and the currency risk associated with securities that trade incurrencies other than the U.S. dollar.
• Common stocks represent an ownership interest in a company. They may or maynot pay dividends or carry voting rights. Common stock occupies the most juniorposition in a company's capital structure. Debt securities and preferred stocks haverights senior to a company's common stock. Although common stocks have a his-tory of long-term growth in value, their prices fluctuate based on changes in a com-pany's financial condition and on overall market and economic conditions.
An investment in the Fund is not a bank deposit and is not insured or guaranteed bythe Federal Deposit Insurance Corporation or any other government agency.
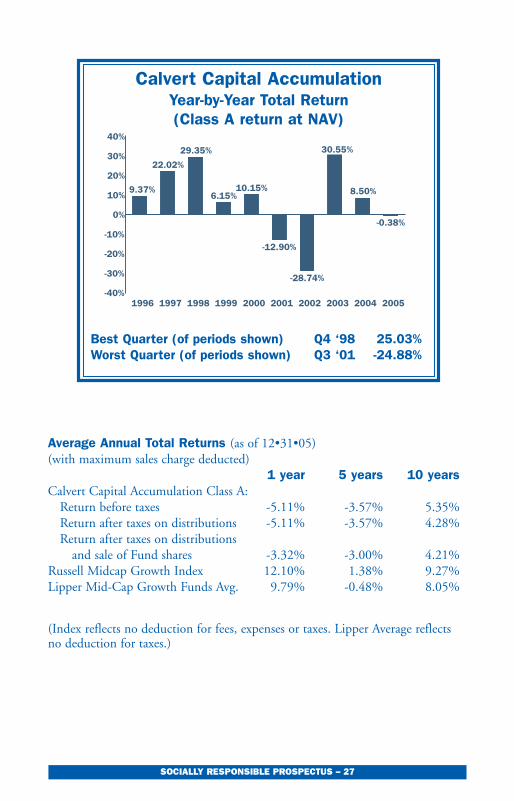
Calvert Capital Accumulation PerformanceThe bar chart and table below show the Fund’s annual returns and its long-termperformance. The chart and table provide some indication of the risks of invest-ing in the Fund. The chart shows how the performance of the Fund’s Class Ashares has varied from year to year. The table compares the Fund’s performanceover time to that of the Russell Midcap Growth Index. It also shows the Fund’sreturns compared to the Lipper Mid-Cap Growth Funds Average, an average ofthe annual return of mutual funds that have an investment goal similar to thatof the Fund. After-tax returns are calculated using the historical highest individ-ual federal marginal income tax rates, and do not reflect the impact of state andlocal taxes. Actual after-tax returns depend on your tax situation and may differfrom these shown. The after-tax returns shown are not relevant to you if youhold your Fund shares through a tax-deferred arrangement such as a 401(k) planor individual retirement account. The return after taxes on distributions and saleof Fund shares may be higher than the return before taxes because the calcula-tion assumes that shareholders receive a tax benefit for capital losses incurred onthe sale of their shares. After-tax returns are shown only for Class A shares; after-tax returns for other classes will vary. The Fund’s past performance does not nec-essarily indicate how the Fund will perform in the future.
The return for the Fund’s other classes of shares offered by this prospectus willdiffer from the Class A returns shown in the bar chart, depending upon the

SOCIALLY RESPONSIBLE PROSPECTUS – 26
expenses of that Class. The bar chart does not reflect any sales charge that youmay be required to pay upon purchase or redemption of the Fund’s shares. Anysales charge will reduce your return. The average total return table shows theFund’s returns with the maximum sales charge deducted. No sales charge hasbeen applied to the indices used for comparison in the table.
SOCIALLY RESPONSIBLE PROSPECTUS – 27
Average Annual Total Returns (as of 12•31•05)(with maximum sales charge deducted)
1 year 5 years 10 yearsCalvert Capital Accumulation Class A:
Return before taxes -5.11% -3.57% 5.35%Return after taxes on distributions -5.11% -3.57% 4.28%Return after taxes on distributions
and sale of Fund shares -3.32% -3.00% 4.21% Russell Midcap Growth Index 12.10% 1.38% 9.27%Lipper Mid-Cap Growth Funds Avg. 9.79% -0.48% 8.05%
(Index reflects no deduction for fees, expenses or taxes. Lipper Average reflectsno deduction for taxes.)
Best Quarter (of periods shown) Q4 ‘98 25.03%Worst Quarter (of periods shown) Q3 ‘01 -24.88%
1996 1997 1998 1999 2000 2001 2002 2003 2004 2005-40%
-30%
-20%
-10%
0%
10%
20%
30%
40%
9.37%
22.02%
29.35%
6.15%10.15%
-12.90%
-28.74%
30.55%
8.50%
-0.38%
Calvert Capital AccumulationYear-by-Year Total Return (Class A return at NAV)

SOCIALLY RESPONSIBLE PROSPECTUS – 28
Average Annual Total Returns (as of 12•31•05)(with maximum sales charge deducted)
1 year 5 years SinceInception(3/31/98)
Capital Accumulation: Class B -6.15% -3.68% 0.88%Russell Midcap Growth Index 12.10% 1.38% 5.42%Lipper Mid-Cap Growth Funds Avg. 9.79% -0.48% 4.84%
(Index reflects no deduction for fees, expenses or taxes. Lipper Average reflectsno deduction for taxes.)
Average Annual Total Returns (as of 12•31•05)(with maximum sales charge deducted)
1 year 5 years 10 yearsCapital Accumulation: Class C -2.10% -3.42% 4.94%Russell Midcap Growth Index 12.10% 1.38% 9.27%Lipper Mid-Cap Growth Funds Avg. 9.79% -0.48% 8.05%
(Index reflects no deduction for fees, expenses or taxes. Lipper Average reflectsno deduction for taxes.)

SOCIALLY RESPONSIBLE PROSPECTUS – 29
CALVERT WORLD VALUES (CWVF)INTERNATIONAL EQUITY
ObjectiveCWVF International Equity seeks to provide a high total return consistent withreasonable risk by investing primarily in a diversified portfolio of stocks thatmeet the Fund’s investment and social criteria.
Principal Investment StrategiesUnder normal circumstances, the Fund will invest at least 80% of its net assets(including borrowings for investment purposes) in equity securities of foreigncompanies. “Equity securities” for purposes of this 80% policy means commonand preferred stock and the depositary receipts on such shares. The Fund willprovide shareholders with at least 60 days’ notice before changing this 80% poli-cy. The Fund invests primarily in the common and preferred stocks of non-U.S.large cap companies using a core investment approach. The Fund defines "non-U.S. large cap" companies as those whose market capitalization falls within therange of the Morgan Stanley Capital International (MSCI) EAFE Index. TheMSCI EAFE Index undergoes a quarterly reconstitution. The market capitaliza-tion range for the MSCI EAFE Index was $102 million to $219 billion as ofDecember 31, 2005. Under normal circumstances, the Fund seeks to have aweighted average market capitalization of at least $10 billion.
The Fund will generally hold stocks of companies from the constituent coun-tries of the MSCI EAFE Index, but may opportunistically invest in other coun-tries, including some emerging markets stocks. The Subadvisor uses an invest-ment process that focuses on deriving returns from individual stock selection(bottom-up). The Subadvisor creates original fundamental research on a broadrange of non-U.S. securities and applies a set of quantitative screening models toidentify stocks that are expected to provide returns that are superior to that ofthe benchmark. These models evaluate stocks based on fundamental valuationjudgments and market activity. The Subadvisor constructs the portfolio in amanner that attempts to control the level of risk in the portfolio, relative to thebenchmark, MSCI’s EAFE Index. As stocks improve or decline in rating oversuccessive periodic model evaluations, they are gradually added to or sold fromthe portfolio.
No more than 5% of the Fund’s net assets will be invested in U.S. companies(excluding High Social Impact and Special Equities investments).
The Fund invests with the philosophy that long-term rewards to investors willcome from those organizations whose products, services, and methods enhancethe human condition and the traditional American values of individual initia-tive, equality of opportunity, and cooperative effort. All investments are selected
SOCIALLY RESPONSIBLE PROSPECTUS – 30
on the basis of their ability to contribute to the dual objectives of financialsoundness and societal impact. See "Investment Selection Process."
Principal RisksYou could lose money on your investment in the Fund, or the Fund couldunderperform for any of the following reasons:
• The stock markets go down (including markets outside the U.S.)• The individual stocks in the Fund do not perform as well as expected, and/or
the Fund's portfolio management practices do not work to achieve theirdesired result.
• Investment in foreign securities involves additional risks relating to political,social and economic developments abroad. Other risks from these investmentsresult from the differences between the regulations to which U.S. and foreignissuers and markets are subject, the potential for foreign markets to be less liq-uid than U.S. markets, and the currency risk associated with securities thattrade in currencies other than the U.S. dollar.
• Investment in emerging market securities involves greater risk than that associ-ated with investment in the foreign securities of developed foreign countries.These risks include volatile currency exchange rates, periods of high inflation,increased risk of default, greater social, economic and political uncertainty andinstability, less governmental supervision and regulation of securities markets,weaker auditing and financial reporting standards, lack of liquidity in the mar-kets, and the significantly smaller market capitalizations of emerging marketissuers.
• Common stocks represent an ownership interest in a company. They may ormay not pay dividends or carry voting rights. Common stock occupies themost junior position in a company's capital structure. Debt securities and pre-ferred stocks have rights senior to a company's common stock. Although com-mon stocks have a history of long-term growth in value, their prices fluctuatebased on changes in a company's financial condition and on overall marketand economic conditions.
An investment in the Fund is not a bank deposit and is not insured or guaran-teed by the Federal Deposit Insurance Corporation or any other governmentagency.
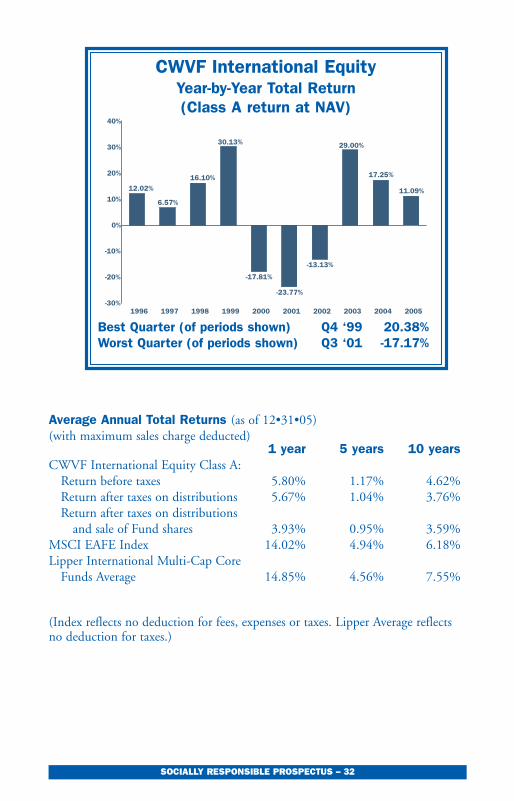
CWVF International Equity PerformanceThe bar chart and table below show the Fund’s annual returns and its long-termperformance. The chart and table provide some indication of the risks of invest-ing in the Fund. The chart shows how the performance of the Class A shares hasvaried from year to year. The table compares the Fund’s performance over timeto that of the MSCI EAFE Index. This is a widely recognized, unmanaged indexof common stock prices around the world. It also shows the Fund’s returns com-pared to the Lipper International Multi-Cap Core Funds Average, an average ofthe annual return of mutual funds that have an investment goal similar to that
SOCIALLY RESPONSIBLE PROSPECTUS – 31
of the Fund. After-tax returns are calculated using the historical highest individ-ual federal marginal income tax rates, and do not reflect the impact of state andlocal taxes. Actual after-tax returns depend on your tax situation and may differfrom these shown. The after-tax returns shown are not relevant to you if youhold your Fund shares through a tax-deferred arrangement such as a 401(k) planor individual retirement account. The return after taxes on distributions and saleof Fund shares may be higher than the return before taxes because the calcula-tion assumes that shareholders receive a tax benefit for capital losses incurred onthe sale of their shares. After-tax returns are shown only for Class A shares; after-tax returns for other classes will vary. The Fund’s past performance does not nec-essarily indicate how the Fund will perform in the future.
The return for the Fund’s other Classes of shares offered by this prospectus willdiffer from the Class A returns shown in the bar chart, depending upon theexpenses of that Class. The bar chart does not reflect any sales charge that youmay be required to pay upon purchase or redemption of the Fund’s shares. Anysales charge will reduce your return. The average total return table shows theFund’s returns with the maximum sales charge deducted. No sales charge hasbeen applied to the indices used for comparison in the table.
SOCIALLY RESPONSIBLE PROSPECTUS – 32
Average Annual Total Returns (as of 12•31•05)(with maximum sales charge deducted)
1 year 5 years 10 yearsCWVF International Equity Class A:
Return before taxes 5.80% 1.17% 4.62%Return after taxes on distributions 5.67% 1.04% 3.76%Return after taxes on distributions
and sale of Fund shares 3.93% 0.95% 3.59% MSCI EAFE Index 14.02% 4.94% 6.18%Lipper International Multi-Cap Core
Funds Average 14.85% 4.56% 7.55%
(Index reflects no deduction for fees, expenses or taxes. Lipper Average reflectsno deduction for taxes.)
Best Quarter (of periods shown) Q4 ‘99 20.38%Worst Quarter (of periods shown) Q3 ‘01 -17.17%
1996 1997 1998 1999 2000 2001 2002 2003 2004 2005-30%
-20%
-10%
0%
10%
20%
30%
40%
12.02%
6.57%
16.10%
30.13%
-17.81%
-23.77%
-13.13%
29.00%
17.25%
11.09%
CWVF International EquityYear-by-Year Total Return (Class A return at NAV)

SOCIALLY RESPONSIBLE PROSPECTUS – 33
Average Annual Total Returns (as of 12•31•05)(with maximum sales charge deducted)
1 year 5 years SinceInception(3/31/98)
CWVF International Equity: Class B 4.87% 0.68% 1.07%MSCI EAFE Index GD 14.02% 4.94% 5.02%Lipper International Multi-Cap Core
Funds Average 14.85% 4.56% 5.03%
(Index reflects no deduction for fees, expenses or taxes. Lipper Average reflectsno deduction for taxes.)
Average Annual Total Returns (as of 12•31•05)(with maximum sales charge deducted)
1 year 5 years 10 yearsCWVF International Equity: Class C 9.14% 1.17% 4.09%MSCI EAFE Index GD 14.02% 4.94% 6.18%Lipper International Multi-Cap Core
Funds Average 14.85% 4.56% 7.55%
(Index reflects no deduction for fees, expenses or taxes. Lipper Average reflectsno deduction for taxes.)

SOCIALLY RESPONSIBLE PROSPECTUS – 34
CALVERT NEW VISION SMALL CAP ObjectiveCalvert New Vision Small Cap seeks to provide long-term capital appreciationby investing primarily in small-cap stocks of U.S. companies that meet theFund’s investment and social criteria. This objective may be changed by theFund’s Board of Trustees without shareholder approval.
Principal Investment StrategiesAt least 80% of the Fund’s net assets (including borrowings for investment pur-poses) will be invested in the common stocks of small-cap companies. The Fundwill provide shareholders with at least 60 days’ notice before changing this 80%policy. Returns in the Fund will be mostly from the changes in the price of theFund’s holdings (capital appreciation).
The Fund currently defines small-cap companies as those with market capitaliza-tion of $2 billion or less at the time the Fund initially invests. The Subadvisormay elect to sell a security when deteriorating business or financial prospects,excessive valuation, or other factors that conflict with the original rationale thatsupport investing in the company make the investment less attractive.
The Fund invests with the philosophy that long-term rewards to investors willcome from those organizations whose products, services, and methods enhancethe human condition and the traditional American values of individual initia-tive, equality of opportunity, and cooperative effort. All investments are selectedon the basis of their ability to contribute to the dual objectives of financialsoundness and societal impact. See "Investment Selection Process."
Principal RisksYou could lose money on your investment in the Fund, or the Fund couldunderperform for any of the following reasons:
• The stock market goes down.• The individual stocks in the Fund do not perform as well as expected, and/or
the Fund's portfolio management practices do not work to achieve theirdesired result.
• Prices of small-cap stocks may respond to market activity differently than larg-er, more established companies and can be more volatile than those of largerissuers.
• The prices of micro-cap securities are generally even more volatile and theirmarkets are even less liquid relative to small-cap, mid-cap and large-cap securi-ties. Therefore, the Fund may involve considerably more risk of loss and itsreturns may differ significantly from funds that do not invest in micro-capsecurities.
• Common stocks represent an ownership interest in a company. They may or

SOCIALLY RESPONSIBLE PROSPECTUS – 35
may not pay dividends or carry voting rights. Common stock occupies themost junior position in a company's capital structure. Debt securities and pre-ferred stocks have rights senior to a company's common stock. Although com-mon stocks have a history of long-term growth in value, their prices fluctuatebased on changes in a company's financial condition and on overall marketand economic conditions.
An investment in the Fund is not a bank deposit and is not insured or guaran-teed by the Federal Deposit Insurance Corporation or any other governmentagency.
Calvert New Vision Small Cap PerformanceThe bar chart and table below show the Fund’s annual returns and its long-termperformance. The chart and table provide some indication of the risks of invest-ing in the Fund. The chart shows how the performance of the Class A shares hasvaried from year to year. The table compares the Fund’s performance over timeto that of the Russell 2000 Index. This is a widely recognized, unmanaged indexof common stock prices. It also shows the Fund’s returns compared to the LipperSmall-Cap Core Funds Average, an average of the annual return of mutual fundsthat have an investment goal similar to that of the Fund. After-tax returns arecalculated using the historical highest individual federal marginal income taxrates, and do not reflect the impact of state and local taxes. Actual after-taxreturns depend on your tax situation and may differ from these shown. Theafter-tax returns shown are not relevant to you if you hold your Fund sharesthrough a tax-deferred arrangement such as a 401(k) plan or individual retire-ment account. The return after taxes on distributions and sale of Fund sharesmay be higher than the return before taxes because the calculation assumes thatshareholders receive a tax benefit for capital losses incurred on the sale of theirshares. After-tax returns are shown only for Class A shares; after-tax returns forother classes will vary. The Fund’s past performance does not necessarily indicatehow the Fund will perform in the future.
The return for the Fund’s other Classes of shares offered by this prospectus willdiffer from the Class A returns shown in the bar chart, depending upon theexpenses of that Class. The bar chart does not reflect any sales charge that youmay be required to pay upon purchase or redemption of the Fund’s shares. Anysales charge will reduce your return. The average total return table shows theFund’s returns with the maximum sales charge deducted. No sales charge hasbeen applied to the indices used for comparison in the table.

SOCIALLY RESPONSIBLE PROSPECTUS – 36
Average Annual Total Returns (as of 12•31•05)(with maximum sales charge deducted)
1 year 5 years SinceInception(1/31/97)
Calvert New Vision Small Cap Class A:Return before taxes -13.16% 1.97% 3.45%Return after taxes on distributions -14.47% 1.38% 2.73%Return after taxes on distributions
and sale of Fund shares -6.81% 1.57% 2.66% Russell 2000 Index 4.55% 8.22% 8.33%Lipper Small-Cap Core Funds Avg. 6.42% 9.15% 9.49%
(Index reflects no deduction for fees, expenses or taxes. Lipper Average reflectsno deduction for taxes.)
Best Quarter (of periods shown) Q4 ‘99 23.57%Worst Quarter (of periods shown) Q3 ‘98 -21.82%
1998 1999 2000 2001 2002 2003 2004 2005-30%
-20%
-10%
0%
10%
20%
30%
40%
-9.43%
23.03%
10.23%7.62%
-20.97%
36.91%
9.03%
-8.85%
Calvert New Vision Small CapYear-by-Year Total Return (Class A return at NAV)
SOCIALLY RESPONSIBLE PROSPECTUS – 37
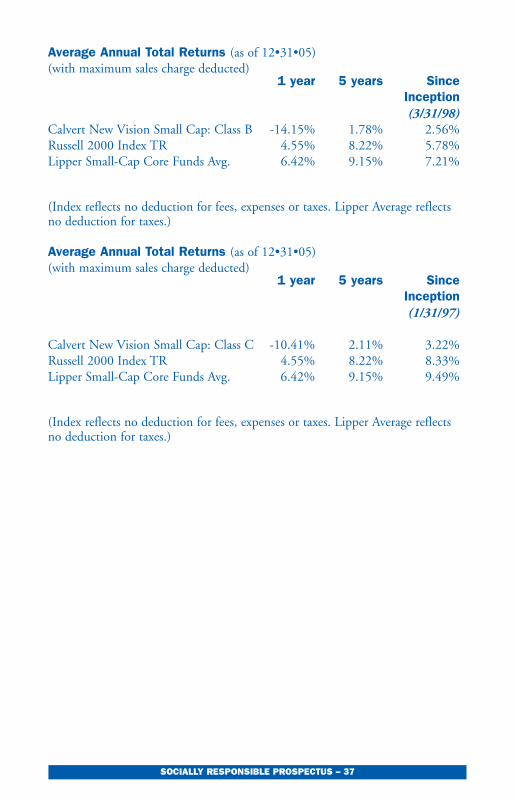
Average Annual Total Returns (as of 12•31•05)(with maximum sales charge deducted)
1 year 5 years SinceInception(3/31/98)
Calvert New Vision Small Cap: Class B -14.15% 1.78% 2.56%Russell 2000 Index TR 4.55% 8.22% 5.78%Lipper Small-Cap Core Funds Avg. 6.42% 9.15% 7.21%
(Index reflects no deduction for fees, expenses or taxes. Lipper Average reflectsno deduction for taxes.)
Average Annual Total Returns (as of 12•31•05)(with maximum sales charge deducted)
1 year 5 years SinceInception(1/31/97)
Calvert New Vision Small Cap: Class C -10.41% 2.11% 3.22%Russell 2000 Index TR 4.55% 8.22% 8.33%Lipper Small-Cap Core Funds Avg. 6.42% 9.15% 9.49%
(Index reflects no deduction for fees, expenses or taxes. Lipper Average reflectsno deduction for taxes.)
SOCIALLY RESPONSIBLE PROSPECTUS – 38
CALVERT SMALL CAP VALUE
Objective
Calvert Small Cap Value seeks to provide long-term capital appreciation primarilythrough investment in small company U.S. common stocks that are trading at pricesbelow what are believed to be their intrinsic value. This objective may be changed bythe Fund's Board of Directors without shareholder approval.
Principal Investment Strategies
The Fund will offer opportunities for long-term capital appreciation with a moderatedegree of risk through a mix of smaller company stocks that meet the Fund’s invest-ment and social criteria. Under normal circumstances, at least 80% of the Fund’s netassets (including borrowings for investment purposes) will be invested in the com-mon stocks of small U.S. companies. The Fund will provide shareholders with atleast 60 days’ notice before changing this 80% policy. Calvert quantifies small com-panies as having a market capitalization of $2 billion or less at the time of initial pur-chase.
The Fund identifies the common stocks of undervalued companies with long-termgrowth potential. Returns in the Fund will be mostly from the changes in the priceof the Fund’s holdings (capital appreciation). Generally, the Advisor sells when astock’s target price is reached, when the issuer or industry suffers negative changes, orwhen there is a change in the investment criteria that prompted the initial purchase.
The Fund invests with the philosophy that long-term rewards to investors will comefrom those organizations whose products, services, and methods enhance the humancondition and what it views as the traditional American values of individual initia-tive, equality of opportunity, and cooperative effort. All investments are selected onthe basis of their ability to contribute to the dual objectives of financial soundnessand societal impact. See "Investment Selection Process."
Principal Risks
You could lose money on your investment in the Fund, or the Fund could underper-form for any of the following reasons:
• The stock market goes down.
• The individual stocks in the Fund do not perform as well as expected, and/or the Fund's portfolio management practices do not work to achieve their desired result.
• The market may not recognize a security's intrinsic value for a long time or that a stock judged to be undervalued may actually be appropriately priced.
• Prices of small-cap stocks may respond to market activity differently than larger, more established companies, and can be more volatile than those of larger issuers.

SOCIALLY RESPONSIBLE PROSPECTUS – 39
• The prices of micro-cap securities are generally even more volatile and their markets are even less liquid relative to small-cap, mid-cap and large-cap securities. Therefore, the Fund may involve considerably more risk of loss and its returns maydiffer significantly from funds that do not invest in micro-cap securities.
• Common stocks represent an ownership interest in a company. They may or may not pay dividends or carry voting rights. Common stock occupies the most junior position in a company's capital structure. Debt securities and preferred stocks have rights senior to a company's common stock. Although common stocks have a history of long-term growth in value, their prices fluctuate based on changes in a company's financial condition and on overall market and economic conditions.
An investment in the Fund is not a bank deposit and is not insured or guaranteed bythe Federal Deposit Insurance Corporation or any other government agency.
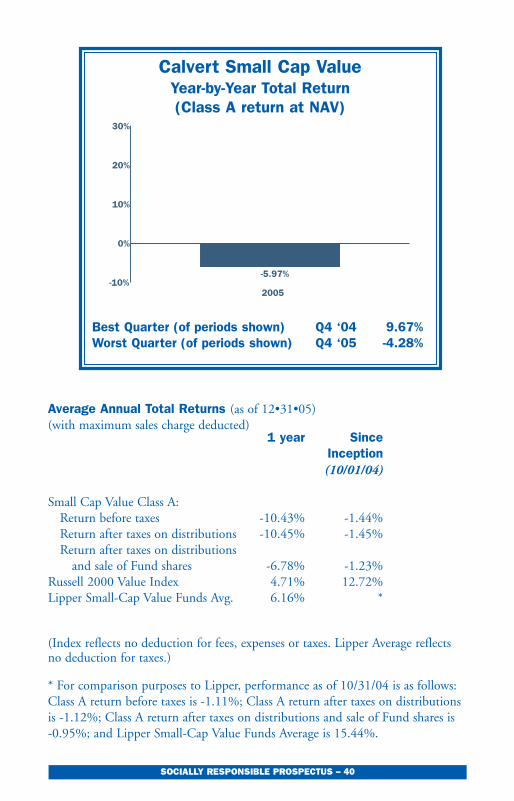
Calvert Small Cap Value PerformanceThe bar chart and table below show the Fund’s annual returns and its long-termperformance. The chart and table provide some indication of the risks of invest-ing in the Fund. The chart shows the performance of the Fund’s Class A sharesfor the past calendar year. The table compares the Fund’s performance over timeto that of the Russell 2000 Value Index. It also shows the Fund’s returns com-pared to the Lipper Small-Cap Value Funds Average, an average of the annualreturn of mutual funds that have an investment goal similar to that of the Fund.After-tax returns are calculated using the historical highest individual federalmarginal income tax rates, and do not reflect the impact of state and local taxes.Actual after-tax returns depend on your tax situation and may differ from theseshown. The after-tax returns shown are not relevant to you if you hold yourFund shares through a tax-deferred arrangement such as a 401(k) plan or indi-vidual retirement account. The return after taxes on distributions and sale ofFund shares may be higher than the return before taxes because the calculationassumes that shareholders receive a tax benefit for capital losses incurred on thesale of their shares. After-tax returns are shown only for Class A shares; after-taxreturns for other classes will vary. The Fund’s past performance does not neces-sarily indicate how the Fund will perform in the future.
The return for the Fund’s other class of shares offered by this prospectus will dif-fer from the Class A returns shown in the bar chart, depending upon the expens-es of that Class. The bar chart does not reflect any sales charge that you may berequired to pay upon purchase or redemption of the Fund’s shares. Any salescharge will reduce your return. The average total return table shows the Fund’sreturns with the maximum sales charge deducted. No sales charge has beenapplied to the indices used for comparison in the table.
SOCIALLY RESPONSIBLE PROSPECTUS – 40
Average Annual Total Returns (as of 12•31•05)(with maximum sales charge deducted)
1 year SinceInception(10/01/04)
Small Cap Value Class A:Return before taxes -10.43% -1.44%Return after taxes on distributions -10.45% -1.45%Return after taxes on distributions
and sale of Fund shares -6.78% -1.23%Russell 2000 Value Index 4.71% 12.72%Lipper Small-Cap Value Funds Avg. 6.16% *
(Index reflects no deduction for fees, expenses or taxes. Lipper Average reflectsno deduction for taxes.)
* For comparison purposes to Lipper, performance as of 10/31/04 is as follows:Class A return before taxes is -1.11%; Class A return after taxes on distributionsis -1.12%; Class A return after taxes on distributions and sale of Fund shares is -0.95%; and Lipper Small-Cap Value Funds Average is 15.44%.
Best Quarter (of periods shown) Q4 ‘04 9.67%Worst Quarter (of periods shown) Q4 ‘05 -4.28%
2005-10%
0%
10%
20%
30%
-5.97%
Calvert Small Cap Value Year-by-Year Total Return (Class A return at NAV)

SOCIALLY RESPONSIBLE PROSPECTUS – 41
There are no performance tables for Class C of the Fund because the Class hashad less than one calendar year of operations.
SOCIALLY RESPONSIBLE PROSPECTUS – 42
CALVERT MID CAP VALUE
Objective
Calvert Mid Cap Value will seek primarily to provide long-term capital appreciationthrough investment in mid-cap U.S. common stocks that are trading at prices belowwhat are believed to be their intrinsic value. This objective may be changed by theFund's Board of Directors without shareholder approval.
Principal Investment Strategies
The Fund will offer opportunities for long-term capital appreciation with a moderatedegree of risk through a mix of mid-sized company stocks that meet the Fund’sinvestment and social criteria. Under normal circumstances, at least 80% of theFund’s net assets (including borrowings for investment purposes) will be invested inthe common stocks of mid-size companies. The Fund will provide shareholders withat least 60 days’ notice before changing this 80% policy. Calvert quantifies mid-sizecompanies as those within the range of market capitalizations of the Russell MidCapValue Index where companies have a capitalization of $582 million to $19 billion asof December 31, 2005. Under normal circumstances, the Fund seeks to have aweighted average market capitalization of between $2 and $10 billion.
The Advisor defines the mid cap category based upon the constitution of the RussellMidCap Value Index, which had the market capitalization range stated above. TheRussell MidCap Value Index undergoes an annual reconstitution. The annual indexreconstitution as well as the general nature of an index means that the constitutionof the Russell MidCap Value Index will vary due to market changes, which can alsoaffect the market capitalization range. Any changes to the constitution and marketcapitalization of the Russell MidCap Value Index will cause the Advisor’s universe ofstocks and range of market capitalizations to change accordingly. The Advisor alsomay purchase companies outside of the Russell Mid-Cap Value Index.
Returns in the Fund will be mostly from the changes in the price of the Fund’s hold-ings (capital appreciation). Generally, the Advisor sells when a stock’s target price isreached, when the issuer or industry suffers negative changes, or when there is achange in the investment criteria that prompted the initial purchase.
The Fund invests with the philosophy that long-term rewards to investors will comefrom those organizations whose products, services, and methods enhance the humancondition and the traditional American values of individual initiative, equality ofopportunity, and cooperative effort. All investments are selected on the basis of theirability to contribute to the dual objectives of financial soundness and societalimpact. See "Investment Selection Process."

SOCIALLY RESPONSIBLE PROSPECTUS – 43
Principal RisksYou could lose money on your investment in the Fund, or the Fund could underper-form for any of the following reasons:
• The stock market goes down.
• The individual stocks in the Fund do not perform as well as expected, and/or the Fund's portfolio management practices might not work to achieve their desired result.
• The market may not recognize a security's intrinsic value for a long time or that a stock judged to be undervalued may actually be appropriately priced.
• The possibility of greater risk by investing in medium-sized companies rather than larger, more established companies.
• Prices of small-cap and mid-cap stocks may respond to market activity differently than larger, more established companies, and can be more volatile than those of larger issuers.
• Common stocks represent an ownership interest in a company. They may or may not pay dividends or carry voting rights. Common stock occupies the most junior position in a company's capital structure. Debt securities and preferred stocks have rights senior to a company's common stock. Although common stocks have a history of long-term growth in value, their prices fluctuate based on changes in a company's financial condition and on overall market and economic conditions.
An investment in the Fund is not a bank deposit and is not insured or guaranteed bythe Federal Deposit Insurance Corporation or any other government agency.
Calvert Mid Cap Value PerformanceThe bar chart and table below show the Fund’s annual returns and its long-termperformance. The chart and table provide some indication of the risks of invest-ing in the Fund. The chart shows the performance of the Fund’s Class A sharesfor the past calendar year. The table compares the Fund’s performance over timeto that of the Russell Mid Cap Value Index. It also shows the Fund’s returnscompared to the Lipper Mid-Cap Value Funds Average, an average of the annualreturn of mutual funds that have an investment goal similar to that of the Fund.After-tax returns are calculated using the historical highest individual federalmarginal income tax rates, and do not reflect the impact of state and local taxes.Actual after-tax returns depend on your tax situation and may differ from theseshown. The after-tax returns shown are not relevant to you if you hold yourFund shares through a tax-deferred arrangement such as a 401(k) plan or indi-vidual retirement account. The return after taxes on distributions and sale ofFund shares may be higher than the return before taxes because the calculationassumes that shareholders receive a tax benefit for capital losses incurred on thesale of their shares. After-tax returns are shown only for Class A shares; after-tax

SOCIALLY RESPONSIBLE PROSPECTUS – 44
returns for other classes will vary. The Fund’s past performance does not neces-sarily indicate how the Fund will perform in the future.
The return for the Fund’s other class of shares offered by this prospectus will dif-fer from the Class A returns shown in the bar chart, depending upon the expens-es of that Class. The bar chart does not reflect any sales charge that you may berequired to pay upon purchase or redemption of the Fund’s shares. Any salescharge will reduce your return. The average total return table shows the Fund’sreturns with the maximum sales charge deducted. No sales charge has beenapplied to the indices used for comparison in the table.

SOCIALLY RESPONSIBLE PROSPECTUS – 45
Average Annual Total Returns (as of 12•31•05)(with maximum sales charge deducted)
1 year SinceInception(10/01/04)
Mid Cap Value Class A:Return before taxes -0.40% 8.40%Return after taxes on distributions -0.80% 8.04%Return after taxes on distributions
and sale of Fund shares -0.19% 6.96% Russell Mid Cap Value Index 12.65% 20.54%Lipper Mid-Cap Value Funds Avg. 9.15% *
(Index reflects no deduction for fees, expenses or taxes. Lipper Average reflectsno deduction for taxes.)
* For comparison purposes to Lipper, performance as of 10/31/04 is as follows:Class A return before taxes is 8.02%; Class A return after taxes on distributionsis 7.65%; Class A return after taxes on distributions and sale of Fund shares is6.64%; and Lipper Mid-Cap Value Funds Average is 17.48%.
Best Quarter (of periods shown) Q4 ‘04 11.07%Worst Quarter (of periods shown) Q1 ‘05 0.12%
2005-10%
0%
10%
20%
30%
4.56%
Calvert Mid Cap Value Year-by-Year Total Return (Class A return at NAV)

SOCIALLY RESPONSIBLE PROSPECTUS – 46
There are no performance tables for Class C of the Fund because the Class hashad less than one calendar year of operations.

SOCIALLY RESPONSIBLE PROSPECTUS – 47
CSIF BONDObjectiveCSIF Bond seeks to provide as high a level of current income as is consistent withprudent investment risk and preservation of capital through investment in bondsand other straight debt securities meeting the Fund’s investment and socialcriteria.
Principal Investment StrategiesThe Fund uses an active strategy, seeking relative value to earn incrementalincome. Under normal circumstances, the Fund invests at least 80% of its netassets (including borrowings for investment purposes) in fixed-income securities.The Fund will provide shareholders with at least 60 days’ notice before changingthis 80% policy. At least 65% of the Fund’s net assets will be invested in invest-ment grade debt securities rated A or above. A debt security is investment gradewhen assigned a credit quality rating of BBB or higher by Standard & Poor’s oran equivalent rating by a nationally recognized statistical rating organization(‘‘NRSRO”), including Moody’s Investors Service or Fitch Ratings, or if unrated,considered to be of comparable credit quality by the Fund’s Advisor. There is nolimit on the amount of unrated securities that may be purchased.
With a change in rating of a debt security, the Advisor will review the funda-mentals with the credit research team and determine its position on the credit,given its fundamental outlook for the credit and the price at which the bondsnow trade. This is consistent with the Advisor’s relative value approach to invest-ing in all securities. A downgrade/upgrade is not an automatic signal to sell/buy.
The Fund invests principally in bonds issued by U.S. corporations, U.S. munici-palities and U.S. agencies, the Federal National Mortgage Association and theFederal Home Loan Mortgage Corporation. The Fund also can invest in asset-backed securities of U.S. issuers.
The Fund may invest in mortgage-backed securities, which represent interests inpools of mortgage loans assembled for sale to investors by various U.S. govern-mental agencies, government-related organizations and private issuers. Theseinvestments may include mortgage-related derivative securities such as collateral-ized mortgage obligations (“CMOs”).The holder of an interest in a CMO isentitled to receive specified cash flows from a pool of mortgages. Dependingupon the category of CMO purchased, the holder may be entitled to paymentbefore the cash flow from the pool is used to fund other CMOs or, alternatively,the holder may be paid only after the cash flow has been used to fund otherCMOs first.
SOCIALLY RESPONSIBLE PROSPECTUS – 48
The Fund may invest up to 35% of its net assets in below-investment grade debtsecurities (commonly known as “junk bonds”), including bonds rated in default.A debt security is below investment grade when assigned a credit quality ratingbelow BBB by Standard & Poor’s or an equivalent rating by an NRSRO, or ifunrated, considered to be of comparable credit quality by the Fund’s Advisor.Junk bonds are considered speculative securities.
The Fund may also invest up to 25% of its net assets in foreign debt securities.Foreign debt securities include American Depositary Receipts (“ADRs”), whichare certificates issued by a U.S. bank and traded in the U.S. as domestic shares.The certificates represent the number of foreign securities the U.S. bank holds inthe country of origin.
The Fund’s investments may have all types of interest rate payments and resetterms, including fixed rate, adjustable rate, zero coupon, contingent, deferred,payment-in-kind and auction rate features. The Fund will invest in instrumentswith principal payments that are both fixed and variable.
The Fund employs an active style that seeks to position the Fund with securitiesthat offer the greatest price appreciation while minimizing risk. The active stylecan result in higher turnover, exceeding 100%, and may cause the Fund to havea relatively high amount of short-term capital gains, which are taxable to you atthe ordinary income tax rate, and may translate to higher transaction costs.
See the “Investment Practices” Table and the SAI for further discussion of thesetypes of investments.
The sell discipline is one that seeks to maximize relative value by liquidatingsecurities that have outperformed their comparables, swapping them for cheapersecurities with more upside potential and by reducing portfolio risk by sellingsecurities that, in the Advisor’s opinion, have weakened, when considering creditrisk and the overall economic outlook.
The Fund invests with the philosophy that long-term rewards to investors willcome from those organizations whose products, services, and methods enhancethe human condition and the traditional American values of individual initia-tive, equality of opportunity, and cooperative effort. All investments are selectedon the basis of their ability to contribute to the dual objectives of financialsoundness and social impact. See "Investment Selection Process."

SOCIALLY RESPONSIBLE PROSPECTUS – 49
Principal RisksYou could lose money on your investment in the Fund, or the Fund couldunderperform, for any of the following reasons:
• The market prices of bonds decline.
• The credit quality of the securities deteriorates, which could lead to default orbankruptcy of the issuer, where the issuer becomes unable to pay its obliga-tions when due.
• The Federal National Mortgage Association and the Federal Home LoanMortgage Corporation issue debt and mortgage backed securities commonlyknown as Fannie Maes and Freddie Macs, respectively. Securities issued bygovernment-sponsored enterprises (“GSEs”) such as Fannie Mae and FreddieMac are neither insured nor guaranteed by the U.S. Treasury and are notbacked by the full faith and credit of the U.S. Government. Such securities areonly supported by the credit of the GSE. Mortgage-backed securities are sub-ject to the risk of prepayment, where unanticipated prepayments may occur(usually in response to a reduction in interest rates), reducing the value of amortgage-backed security. The Fund must then reinvest those assets at thecurrent market rate, which may be lower. Mortgage-backed securities are alsosubject to the risk of extension, where an unexpected rise in interest rates willextend the life of a mortgage-backed security beyond the expected prepaymenttime, typically reducing the security’s value.
• The individual bonds in the Fund do not perform as well as expected, due tocredit, political or other risks and/or the Fund’s portfolio management prac-tices do not work to achieve their desired result.
• There is the risk that changes in interest rates will adversely affect the value ofan investor’s securities.
• The Advisor's allocation among different sectors of the bond market does notperform as well as expected.
• The Fund is non-diversified. Compared to other funds, the Fund may investmore of its assets in a smaller number of companies. Gains or losses on a sin-gle bond may have greater impact on the Fund.
• The Fund may be subject to currency risk, which may be hedged orunhedged. Unhedged currency exposure may result in gains or losses as aresult of a change in the relationship between the U.S. dollar and the respec-tive foreign currency.
• Investments in junk bonds can involve a substantial risk of loss. Junk bondsare considered to be speculative with respect to the issuer’s ability to pay inter-est and principal. These securities, which are rated below investment grade,have a higher risk of issuer default, are subject to greater price volatility andmay be illiquid.

SOCIALLY RESPONSIBLE PROSPECTUS – 50
• For the bonds in default (rated “D” by Standard & Poor’s or the equivalent byan NRSRO) held in the Fund, there is a significant risk of not achieving fullrecovery.
• For corporate and municipal bonds as well as for collateralized loan obliga-tions and collateralized debt obligations held in the Fund, there is credit riskin addition to the interest rate risk that affects all fixed-income securities.
• For the foreign debt securities held in the Fund, there are additional risksrelating to political, social, and economic developments abroad. Other risksfrom these investments result from the differences between the regulations towhich U.S. and foreign issuers and markets are subject, the potential for for-eign markets to be less liquid than U.S. markets and the currency risk associat-ed with securities that trade in currencies other than the U.S. dollar.
• American Depository Receipts (ADRs) are certificates evidencing ownership ofshares of a foreign issuer. ADRs are U.S. dollar-denominated and traded in theU.S. on exchanges or over the counter, and the Fund may invest in eithersponsored or unsponsored ADRs. A sponsored ADR is preferable as the com-pany is then subject to U.S. reporting requirements and will pay the costs ofdistributing dividends and materials. With an unsponsored ADR, the U.S.bank will recover costs from the movement of shares and dividends. Normally,less information is available on unsponsored ADRs. The risks of ADRsinclude many of the risks associated with investing directly in foreign securi-ties such as individual country risk (i.e., political and economic) and currencyrisk.
An investment in the Fund is not a bank deposit and is not insured or guaran-teed by the Federal Deposit Insurance Corporation or any other governmentagency.
CSIF Bond PerformanceThe bar chart and table below show the Fund’s annual returns and its long-termperformance. The chart and table provide some indication of the risks of invest-ing in the Fund. The chart shows how the performance of the Class A shares hasvaried from year to year. The table compares the Fund’s performance over timeto that of the Lehman U.S. Credit Index, a widely recognized unmanaged indexof bond prices. It also shows the Fund’s returns compared to the LipperCorporate Debt Funds A-Rated Average, an average of the annual return ofmutual funds that have an investment goal similar to that of the Fund. After-taxreturns are calculated using the historical highest individual federal marginalincome tax rates, and do not reflect the impact of state and local taxes. Actualafter-tax returns depend on your tax situation and may differ from these shown.The after-tax returns shown are not relevant to you if you hold your Fund sharesthrough a tax-deferred arrangement such as a 401(k) plan or individual retire-

SOCIALLY RESPONSIBLE PROSPECTUS – 51
ment account. The return after taxes on distributions and sale of Fund sharesmay be higher than the return before taxes because the calculation assumes thatshareholders receive a tax benefit for capital losses incurred on the sale of theirshares. After-tax returns are shown only for Class A shares; after-tax returns forother classes will vary. The Fund’s past performance does not necessarily indicatehow the Fund will perform in the future.
The return for the Fund’s other Classes of shares offered by this prospectus willdiffer from the Class A returns shown in the bar chart, depending upon theexpenses of that Class. The bar chart does not reflect any sales charge that youmay be required to pay upon purchase or redemption of the Fund’s shares. Anysales charge will reduce your return. The average total return table shows theFund’s returns with the maximum sales charge deducted. No sales charge hasbeen applied to the indices used for comparison in the table.
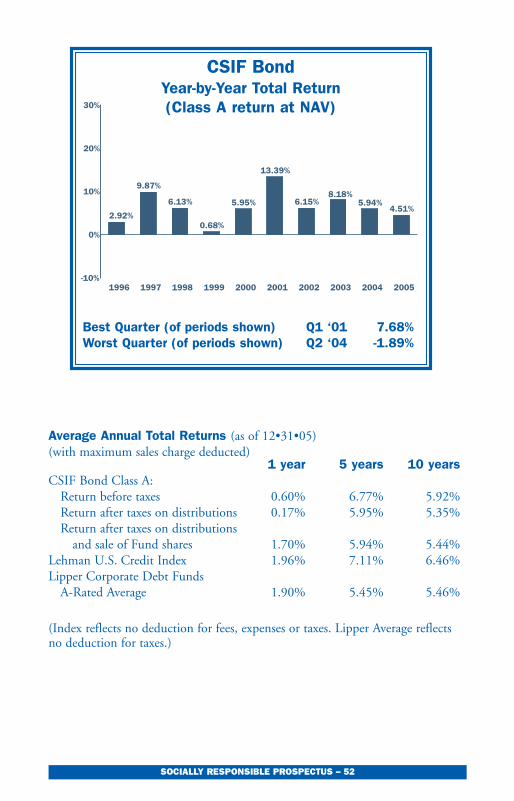
SOCIALLY RESPONSIBLE PROSPECTUS – 52
Average Annual Total Returns (as of 12•31•05)(with maximum sales charge deducted)
1 year 5 years 10 yearsCSIF Bond Class A:
Return before taxes 0.60% 6.77% 5.92%Return after taxes on distributions 0.17% 5.95% 5.35%Return after taxes on distributions
and sale of Fund shares 1.70% 5.94% 5.44% Lehman U.S. Credit Index 1.96% 7.11% 6.46%Lipper Corporate Debt Funds
A-Rated Average 1.90% 5.45% 5.46%
(Index reflects no deduction for fees, expenses or taxes. Lipper Average reflectsno deduction for taxes.)
Best Quarter (of periods shown) Q1 ‘01 7.68%Worst Quarter (of periods shown) Q2 ‘04 -1.89%
CSIF BondYear-by-Year Total Return (Class A return at NAV)
1996 1997 1998 1999 2000 2001 2002 2003 2004 2005-10%
0%
10%
20%
30%
2.92%
9.87%
6.13%
0.68%
5.95%
13.39%
6.15%8.18%
5.94%4.51%

SOCIALLY RESPONSIBLE PROSPECTUS – 53
Average Annual Total Returns (as of 12•31•05)(with maximum sales charge deducted)
1 year 5 years Since Inception(3/31/98)
CSIF Bond: Class B -0.51% 6.60% 5.25%Lehman U.S. Credit Index 1.96% 7.11% 6.40%Lipper Corporate Debt Funds
A-Rated Average 1.90% 5.45% 5.25%
(Index reflects no deduction for fees, expenses or taxes. Lipper Average reflectsno deduction for taxes.)
Average Annual Total Returns (as of 12•31•05)(with maximum sales charge deducted)
1 year 5 years SinceInception
(6/1/98)CSIF Bond: Class C 2.56% 6.57% 5.10%Lehman U.S. Credit Index 1.96% 7.11% 6.26%Lipper Corporate Debt Funds
A-Rated Average 1.90% 5.45% *
*For comparison purposes to Lipper, performance for Class C as of 6/30/98 is5.12%; and the performance for the Lipper Corporate Debt Funds A-RatedAverage is 5.09%.
(Index reflects no deduction for fees, expenses or taxes. Lipper Average reflectsno deduction for taxes.)

SOCIALLY RESPONSIBLE PROSPECTUS – 54
CSIF MONEY MARKET
ObjectiveCSIF Money Market seeks to provide the highest level of current income, con-sistent with liquidity, safety and security of capital, through investment inmoney market instruments meeting the Fund’s investment and social criteria.
Principal Investment StrategiesThe Fund invests in high quality, money market instruments, such as commer-cial paper, variable rate demand notes, corporate, agency and taxable municipalobligations. All investments must comply with the SEC’s money market fundrequirements per Rule 2a-7 of the Investment Company Act of 1940.
The Fund invests with the philosophy that long-term rewards to investors willcome from those organizations whose products, services, and methods enhancethe human condition and the traditional American values of individual initia-tive, equality of opportunity, and cooperative effort. All investments are selectedon the basis of their ability to contribute to the dual objectives of financialsoundness and societal impact. See "Investment Selection Process."
Principal RisksThe Fund’s yield will change in response to market interest rates. In general, asmarket rates go up so will the Fund’s yield, and vice versa. Although the Fundtries to keep the value of its shares constant at $1.00 per share, changes in mar-ket rates, and or sudden credit deterioration of a holding could cause the valueto decrease. Note: securities issued by government-sponsored entities such asFannie Mae and Freddie Mac are neither insured nor guaranteed by the U.S.Treasury and are not backed by the full faith and credit of the U.S. Government.
The Fund limits the amount it invests in any one issuer to try to lessen itsexposure.
An investment in the Fund is not a bank deposit and is not insured or guaran-teed by the Federal Deposit Insurance Corporation or any other governmentagency. Although the Fund seeks to preserve the value of your investment at$1.00 per share, it is possible to lose money by investing in the Fund.

SOCIALLY RESPONSIBLE PROSPECTUS – 55
CSIF Money Market PerformanceThe bar chart and table below show the Fund’s annual returns and its long-termperformance. The chart and table provide some indication of the risks of invest-ing in the Fund. The chart shows how the performance has varied from year toyear. The table compares the Fund’s returns over time to the Lipper MoneyMarket Instrument Funds Average, an average of the annual return of mutualfunds that have an investment goal similar to that of the Fund. The Fund’s pastperformance does not necessarily indicate how the Fund will perform in thefuture.
Average Annual Total Returns (as of 12•31•05)
1 year 5 years 10 yearsCSIF Money Market 2.48% 1.68% 3.34%Lipper Money Market InstrumentFunds Average 2.37% 1.59% 3.32%
For current yield information, call 800-368-2745, or visit Calvert’s websiteat www.calvert.com.
Best Quarter (of periods shown) Q4 ‘00 1.48%Worst Quarter (of periods shown) Q1 ‘04 0.08%
1996 1997 1998 1999 2000 2001 2002 2003 2004 20050%
5%
10%
4.83% 4.95% 4.93%4.62%
5.81%
3.57%
1.25%
0.49% 0.64%
2.48%
CSIF Money MarketYear-by-Year Total Return

SOCIALLY RESPONSIBLE PROSPECTUS – 56
Fees and ExpensesThis table describes the fees and expenses that you may pay if you buy and holdshares of a Fund. Shareholder fees are paid directly from your account; annualFund operating expenses are deducted from Fund assets.
CSIF Balanced
Shareholder Fees(fees paid directly from your account) Class A Class B Class C
Maximum sales charge (load)imposed on purchases 4.75% None None(as a percentage of offering price)
Maximum deferred salescharge (load)(as a percentage of purchase None1 5%2 1%3
or redemption proceeds, whichever is lower)
Redemption fee4 2% 2% 2%(as a % of redemption proceeds)Note: Redemption fee applies only toredemptions, including exchanges, within30 days of purchase.
Annual Fund Operating Expenses6
(deducted from fund assets)
Management fees 0.70% 0.70% 0.70%
Distribution and service (12b-1) fees 0.24% 1.00% 1.00%
Other expenses 0.28% 0.50% 0.46%
Total annual fund operating expenses 1.22% 2.20% 2.16%
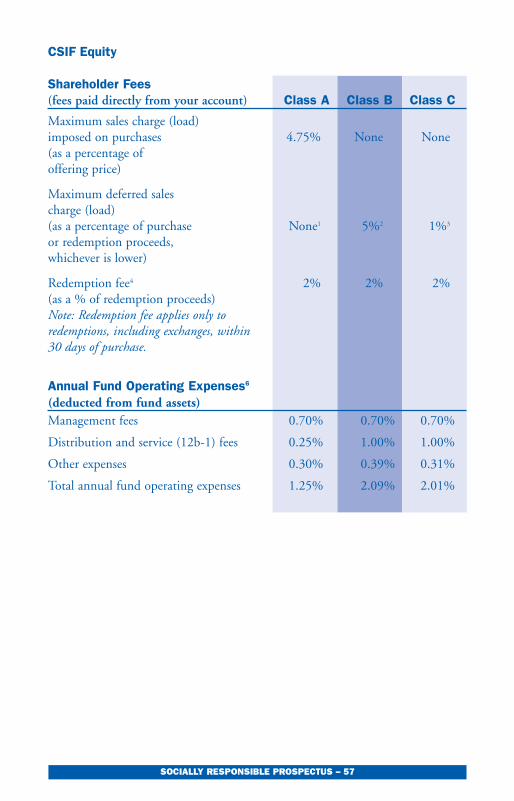
SOCIALLY RESPONSIBLE PROSPECTUS – 57
CSIF Equity
Shareholder Fees(fees paid directly from your account) Class A Class B Class C
Maximum sales charge (load)imposed on purchases 4.75% None None(as a percentage of offering price)
Maximum deferred salescharge (load)(as a percentage of purchase None1 5%2 1%3
or redemption proceeds, whichever is lower)
Redemption fee4 2% 2% 2%(as a % of redemption proceeds)Note: Redemption fee applies only toredemptions, including exchanges, within30 days of purchase.
Annual Fund Operating Expenses6
(deducted from fund assets)Management fees 0.70% 0.70% 0.70%
Distribution and service (12b-1) fees 0.25% 1.00% 1.00%
Other expenses 0.30% 0.39% 0.31%
Total annual fund operating expenses 1.25% 2.09% 2.01%

SOCIALLY RESPONSIBLE PROSPECTUS – 58
Calvert Social Index Fund
Shareholder Fees(fees paid directly from your account) Class A Class B Class C
Maximum sales charge (load)imposed on purchases 4.75% None None(as a percentage of offering price)
Maximum deferred salescharge (load)(as a percentage of purchase None1 5%2 1%3
or redemption proceeds, whichever is lower)
Redemption fee4 2% 2% 2%(as a % of redemption proceeds)Note: Redemption fee applies only toredemptions, including exchanges, within30 days of purchase.
Low balance fee(applies only to Calvert Social Index Fund for regular accounts under $5,000; $15/year $15/year $15/yearIRA accounts under $1,000)
Annual Fund Operating Expenses6
(deducted from fund assets)Management fees 0.45% 0.45% 0.45%
Distribution and service (12b-1) fees 0.25% 1.00% 1.00%
Other expenses 0.64% 0.98% 0.85%
Total annual fund operating expenses 1.34% 2.43% 2.30%
Less fee waiver and/or expense reimbursement7 (0.59%) (0.68%) (0.55%)
Net expenses 0.75% 1.75% 1.75%
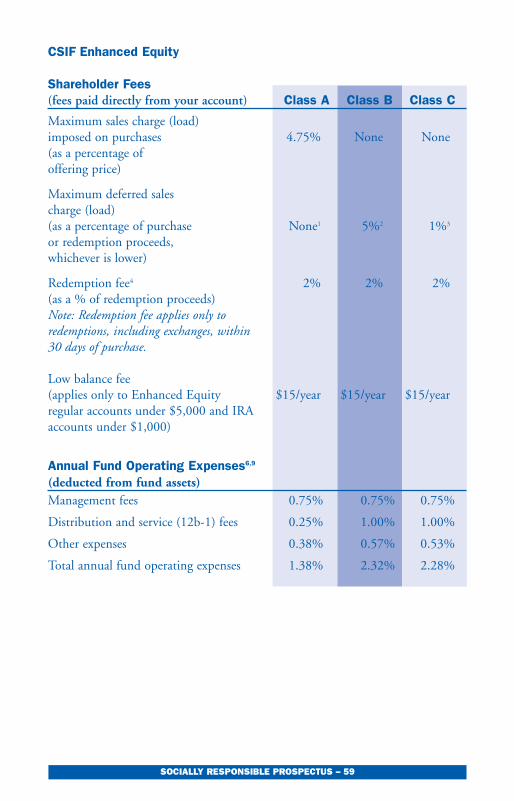
SOCIALLY RESPONSIBLE PROSPECTUS – 59
CSIF Enhanced Equity
Shareholder Fees(fees paid directly from your account) Class A Class B Class C
Maximum sales charge (load)imposed on purchases 4.75% None None(as a percentage of offering price)
Maximum deferred salescharge (load)(as a percentage of purchase None1 5%2 1%3
or redemption proceeds, whichever is lower)
Redemption fee4 2% 2% 2%(as a % of redemption proceeds)Note: Redemption fee applies only toredemptions, including exchanges, within30 days of purchase.
Low balance fee(applies only to Enhanced Equity $15/year $15/year $15/yearregular accounts under $5,000 and IRAaccounts under $1,000)
Annual Fund Operating Expenses6,9
(deducted from fund assets)Management fees 0.75% 0.75% 0.75%
Distribution and service (12b-1) fees 0.25% 1.00% 1.00%
Other expenses 0.38% 0.57% 0.53%
Total annual fund operating expenses 1.38% 2.32% 2.28%
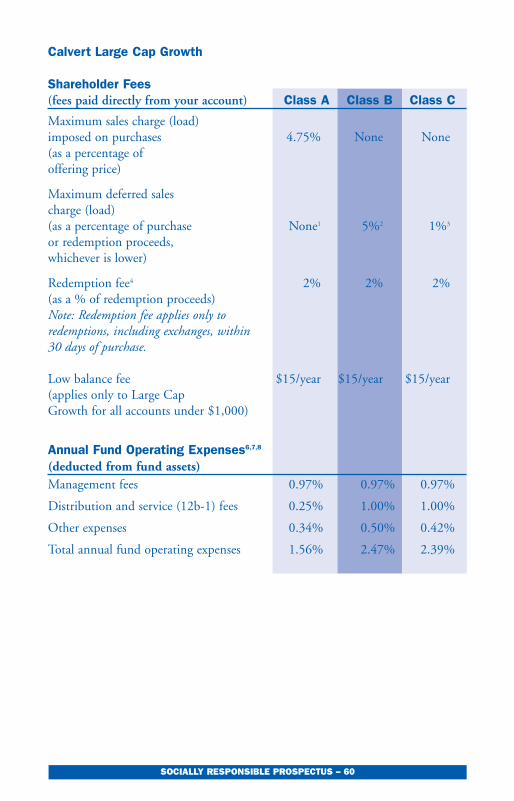
SOCIALLY RESPONSIBLE PROSPECTUS – 60
Calvert Large Cap Growth
Shareholder Fees(fees paid directly from your account) Class A Class B Class C
Maximum sales charge (load)imposed on purchases 4.75% None None(as a percentage of offering price)
Maximum deferred salescharge (load)(as a percentage of purchase None1 5%2 1%3
or redemption proceeds, whichever is lower)
Redemption fee4 2% 2% 2%(as a % of redemption proceeds)Note: Redemption fee applies only toredemptions, including exchanges, within30 days of purchase.
Low balance fee $15/year $15/year $15/year(applies only to Large CapGrowth for all accounts under $1,000)
Annual Fund Operating Expenses6,7,8
(deducted from fund assets)Management fees 0.97% 0.97% 0.97%
Distribution and service (12b-1) fees 0.25% 1.00% 1.00%
Other expenses 0.34% 0.50% 0.42%
Total annual fund operating expenses 1.56% 2.47% 2.39%

SOCIALLY RESPONSIBLE PROSPECTUS – 61
Calvert Capital Accumulation
Shareholder Fees(fees paid directly from your account) Class A Class B Class C
Maximum sales charge (load)imposed on purchases 4.75% None None(as a percentage of offering price)
Maximum deferred salescharge (load)(as a percentage of purchase None1 5%2 1%3
or redemption proceeds, whichever is lower)
Redemption fee4 2% 2% 2%(as a % of redemption proceeds)Note: Redemption fee applies only toredemptions, including exchanges, within30 days of purchase.
Annual Fund Operating Expenses6
(deducted from fund assets)Management fees 0.90% 0.90% 0.90%
Distribution and service (12b-1) fees 0.35% 1.00% 1.00%
Other expenses 0.43% 0.64% 0.59%
Total annual fund operating expenses 1.68% 2.54% 2.49%
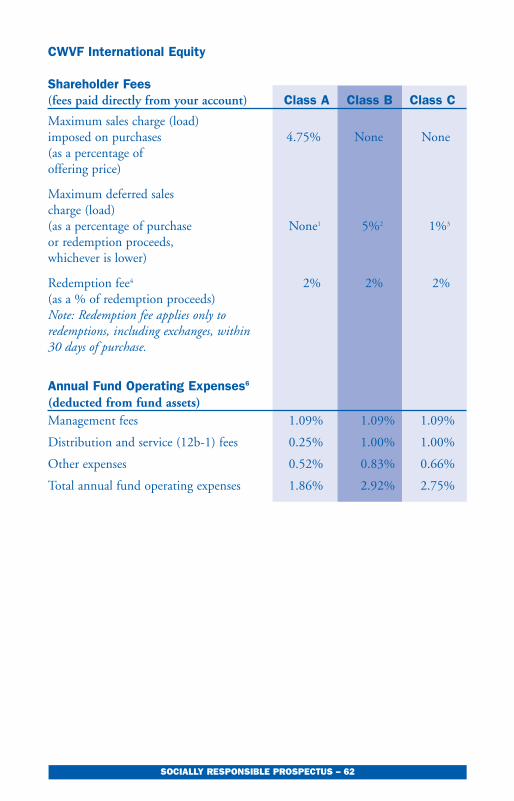
SOCIALLY RESPONSIBLE PROSPECTUS – 62
CWVF International Equity
Shareholder Fees(fees paid directly from your account) Class A Class B Class C
Maximum sales charge (load)imposed on purchases 4.75% None None(as a percentage of offering price)
Maximum deferred salescharge (load)(as a percentage of purchase None1 5%2 1%3
or redemption proceeds, whichever is lower)
Redemption fee4 2% 2% 2%(as a % of redemption proceeds)Note: Redemption fee applies only toredemptions, including exchanges, within30 days of purchase.
Annual Fund Operating Expenses6
(deducted from fund assets)Management fees 1.09% 1.09% 1.09%
Distribution and service (12b-1) fees 0.25% 1.00% 1.00%
Other expenses 0.52% 0.83% 0.66%
Total annual fund operating expenses 1.86% 2.92% 2.75%
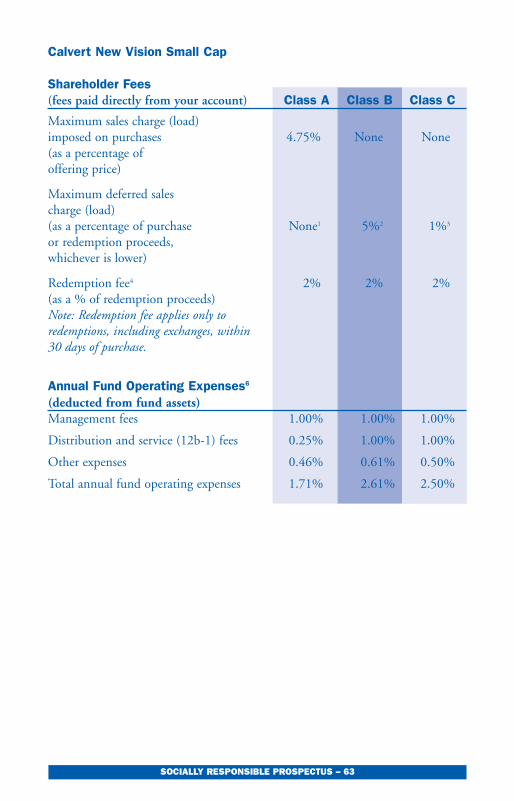
SOCIALLY RESPONSIBLE PROSPECTUS – 63
Calvert New Vision Small Cap
Shareholder Fees(fees paid directly from your account) Class A Class B Class C
Maximum sales charge (load)imposed on purchases 4.75% None None(as a percentage of offering price)
Maximum deferred salescharge (load)(as a percentage of purchase None1 5%2 1%3
or redemption proceeds, whichever is lower)
Redemption fee4 2% 2% 2%(as a % of redemption proceeds)Note: Redemption fee applies only toredemptions, including exchanges, within30 days of purchase.
Annual Fund Operating Expenses6
(deducted from fund assets)Management fees 1.00% 1.00% 1.00%
Distribution and service (12b-1) fees 0.25% 1.00% 1.00%
Other expenses 0.46% 0.61% 0.50%
Total annual fund operating expenses 1.71% 2.61% 2.50%

SOCIALLY RESPONSIBLE PROSPECTUS – 64
Calvert Small Cap Value
Shareholder Fees(fees paid directly from your account) Class A Class B Class C
Maximum sales charge (load)imposed on purchases 4.75% None None(as a percentage of offering price)
Maximum deferred salescharge (load)(as a percentage of purchase None1 5%2 1%3
or redemption proceeds, whichever is lower)
Redemption fee4 2% 2% 2%(as a % of redemption proceeds)Note: Redemption fee applies only toredemptions, including exchanges, within30 days of purchase.
Annual Fund Operating Expenses6
(deducted from fund assets)Management fees 1.00% 1.00% 1.00%
Distribution and service (12b-1) fees 0.25% 1.00% 1.00%
Other expenses 1.15% 0.98% 0.98%
Total annual fund operating expenses 2.40% 2.98% 2.98%
Less fee waiver and/or expense reimbursement7 (0.71%) (0.29%) (0.29%)
Net expenses 1.69% 2.69% 2.69%
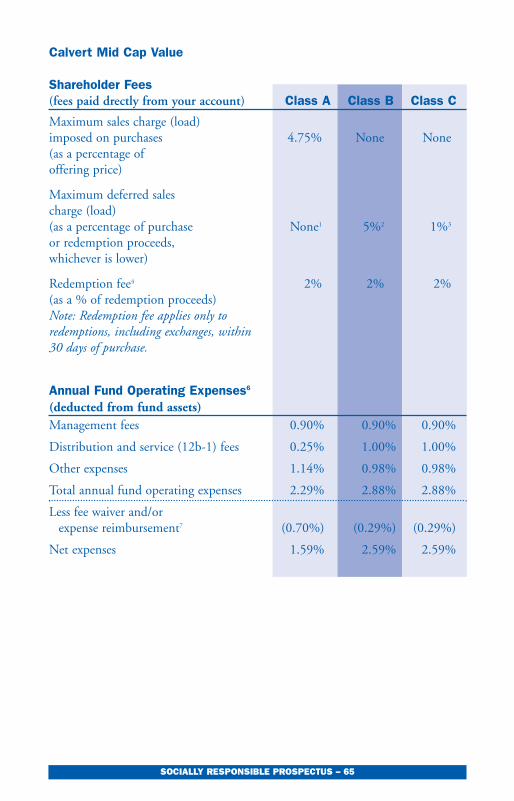
SOCIALLY RESPONSIBLE PROSPECTUS – 65
Calvert Mid Cap Value
Shareholder Fees(fees paid drectly from your account) Class A Class B Class C
Maximum sales charge (load)imposed on purchases 4.75% None None(as a percentage of offering price)
Maximum deferred salescharge (load)(as a percentage of purchase None1 5%2 1%3
or redemption proceeds, whichever is lower)
Redemption fee4 2% 2% 2%(as a % of redemption proceeds)Note: Redemption fee applies only toredemptions, including exchanges, within30 days of purchase.
Annual Fund Operating Expenses6
(deducted from fund assets)Management fees 0.90% 0.90% 0.90%
Distribution and service (12b-1) fees 0.25% 1.00% 1.00%
Other expenses 1.14% 0.98% 0.98%
Total annual fund operating expenses 2.29% 2.88% 2.88%
Less fee waiver and/or expense reimbursement7 (0.70%) (0.29%) (0.29%)
Net expenses 1.59% 2.59% 2.59%

SOCIALLY RESPONSIBLE PROSPECTUS – 66
CSIF Bond
Shareholder Fees(fees paid directly from your account) Class A Class B Class CMaximum sales charge (load)imposed on purchases 3.75% None None(as a percentage of offering price)
Maximum deferred salescharge (load)(as a percentage of purchase None1 4%5 1%3
or redemption proceeds, whichever is lower)
Redemption fee4 2% 2% 2%(as a % of redemption proceeds)Note: Redemption fee applies only toredemptions, including exchanges, within30 days of purchase.
Annual Fund Operating Expenses6
(deducted from fund assets)Management fees 0.65% 0.65% 0.65%
Distribution and service (12b-1) fees 0.20% 1.00% 1.00%
Other expenses 0.31% 0.46% 0.39%
Total annual fund operating expenses 1.16% 2.11% 2.04%
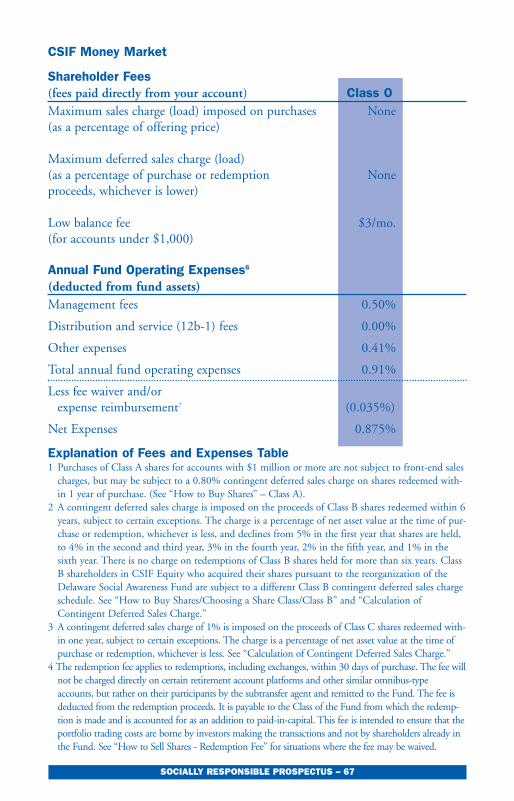
SOCIALLY RESPONSIBLE PROSPECTUS – 67
CSIF Money Market
Shareholder Fees (fees paid directly from your account) Class OMaximum sales charge (load) imposed on purchases None(as a percentage of offering price)
Maximum deferred sales charge (load)(as a percentage of purchase or redemption Noneproceeds, whichever is lower)
Low balance fee $3/mo.(for accounts under $1,000)
Annual Fund Operating Expenses6
(deducted from fund assets)Management fees 0.50%
Distribution and service (12b-1) fees 0.00%
Other expenses 0.41%
Total annual fund operating expenses 0.91%
Less fee waiver and/or expense reimbursement7 (0.035%)
Net Expenses 0.875%
Explanation of Fees and Expenses Table1 Purchases of Class A shares for accounts with $1 million or more are not subject to front-end sales
charges, but may be subject to a 0.80% contingent deferred sales charge on shares redeemed with-in 1 year of purchase. (See “How to Buy Shares” – Class A).
2 A contingent deferred sales charge is imposed on the proceeds of Class B shares redeemed within 6years, subject to certain exceptions. The charge is a percentage of net asset value at the time of pur-chase or redemption, whichever is less, and declines from 5% in the first year that shares are held,to 4% in the second and third year, 3% in the fourth year, 2% in the fifth year, and 1% in thesixth year. There is no charge on redemptions of Class B shares held for more than six years. ClassB shareholders in CSIF Equity who acquired their shares pursuant to the reorganization of theDelaware Social Awareness Fund are subject to a different Class B contingent deferred sales chargeschedule. See “How to Buy Shares/Choosing a Share Class/Class B” and “Calculation ofContingent Deferred Sales Charge.”
3 A contingent deferred sales charge of 1% is imposed on the proceeds of Class C shares redeemed with-in one year, subject to certain exceptions. The charge is a percentage of net asset value at the time ofpurchase or redemption, whichever is less. See “Calculation of Contingent Deferred Sales Charge.”
4 The redemption fee applies to redemptions, including exchanges, within 30 days of purchase. The fee willnot be charged directly on certain retirement account platforms and other similar omnibus-typeaccounts, but rather on their participants by the subtransfer agent and remitted to the Fund. The fee isdeducted from the redemption proceeds. It is payable to the Class of the Fund from which the redemp-tion is made and is accounted for as an addition to paid-in-capital. This fee is intended to ensure that theportfolio trading costs are borne by investors making the transactions and not by shareholders already inthe Fund. See “How to Sell Shares - Redemption Fee” for situations where the fee may be waived.
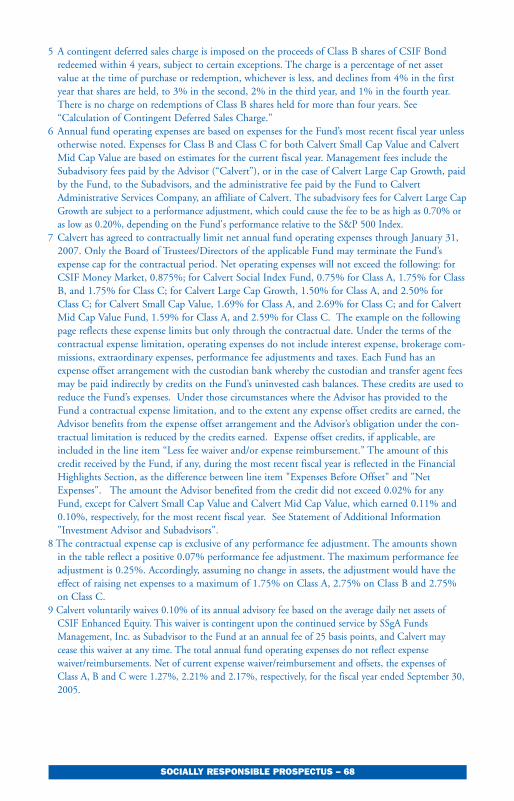
SOCIALLY RESPONSIBLE PROSPECTUS – 68
5 A contingent deferred sales charge is imposed on the proceeds of Class B shares of CSIF Bondredeemed within 4 years, subject to certain exceptions. The charge is a percentage of net assetvalue at the time of purchase or redemption, whichever is less, and declines from 4% in the firstyear that shares are held, to 3% in the second, 2% in the third year, and 1% in the fourth year.There is no charge on redemptions of Class B shares held for more than four years. See“Calculation of Contingent Deferred Sales Charge.”
6 Annual fund operating expenses are based on expenses for the Fund’s most recent fiscal year unlessotherwise noted. Expenses for Class B and Class C for both Calvert Small Cap Value and CalvertMid Cap Value are based on estimates for the current fiscal year. Management fees include theSubadvisory fees paid by the Advisor (“Calvert”), or in the case of Calvert Large Cap Growth, paidby the Fund, to the Subadvisors, and the administrative fee paid by the Fund to CalvertAdministrative Services Company, an affiliate of Calvert. The subadvisory fees for Calvert Large CapGrowth are subject to a performance adjustment, which could cause the fee to be as high as 0.70% oras low as 0.20%, depending on the Fund's performance relative to the S&P 500 Index.
7 Calvert has agreed to contractually limit net annual fund operating expenses through January 31,2007. Only the Board of Trustees/Directors of the applicable Fund may terminate the Fund’sexpense cap for the contractual period. Net operating expenses will not exceed the following: forCSIF Money Market, 0.875%; for Calvert Social Index Fund, 0.75% for Class A, 1.75% for ClassB, and 1.75% for Class C; for Calvert Large Cap Growth, 1.50% for Class A, and 2.50% forClass C; for Calvert Small Cap Value, 1.69% for Class A, and 2.69% for Class C; and for CalvertMid Cap Value Fund, 1.59% for Class A, and 2.59% for Class C. The example on the followingpage reflects these expense limits but only through the contractual date. Under the terms of thecontractual expense limitation, operating expenses do not include interest expense, brokerage com-missions, extraordinary expenses, performance fee adjustments and taxes. Each Fund has anexpense offset arrangement with the custodian bank whereby the custodian and transfer agent feesmay be paid indirectly by credits on the Fund’s uninvested cash balances. These credits are used toreduce the Fund’s expenses. Under those circumstances where the Advisor has provided to theFund a contractual expense limitation, and to the extent any expense offset credits are earned, theAdvisor benefits from the expense offset arrangement and the Advisor’s obligation under the con-tractual limitation is reduced by the credits earned. Expense offset credits, if applicable, areincluded in the line item “Less fee waiver and/or expense reimbursement.” The amount of thiscredit received by the Fund, if any, during the most recent fiscal year is reflected in the FinancialHighlights Section, as the difference between line item "Expenses Before Offset" and "NetExpenses". The amount the Advisor benefited from the credit did not exceed 0.02% for anyFund, except for Calvert Small Cap Value and Calvert Mid Cap Value, which earned 0.11% and0.10%, respectively, for the most recent fiscal year. See Statement of Additional Information"Investment Advisor and Subadvisors".
8 The contractual expense cap is exclusive of any performance fee adjustment. The amounts shown in the table reflect a positive 0.07% performance fee adjustment. The maximum performance feeadjustment is 0.25%. Accordingly, assuming no change in assets, the adjustment would have theeffect of raising net expenses to a maximum of 1.75% on Class A, 2.75% on Class B and 2.75%on Class C.
9 Calvert voluntarily waives 0.10% of its annual advisory fee based on the average daily net assets ofCSIF Enhanced Equity. This waiver is contingent upon the continued service by SSgA FundsManagement, Inc. as Subadvisor to the Fund at an annual fee of 25 basis points, and Calvert maycease this waiver at any time. The total annual fund operating expenses do not reflect expensewaiver/reimbursements. Net of current expense waiver/reimbursement and offsets, the expenses ofClass A, B and C were 1.27%, 2.21% and 2.17%, respectively, for the fiscal year ended September 30,2005.

SOCIALLY RESPONSIBLE PROSPECTUS – 69
Cla
ss A
Cla
ss B
(wit
h re
dem
ptio
n)
Cla
ss B
(no
rede
mpt
ion)
Cla
ss C
(wit
h re
dem
ptio
n)
Cla
ss C
(no
rede
mpt
ion)
ExampleThis example is intended to help you compare the cost of investing in a Fundwith the cost of investing in other mutual funds. The example assumes that:
• You invest $10,000 in the Fund for the time periods indicated;• Your investment has a 5% return each year; and• The Fund’s operating expenses remain the same.
The expense example for Calvert Large Cap Growth reflects a positive 0.07%performance fee adjustment for all years shown, based on the most recent fiscal year's results.
Although your actual costs may be higher or lower, under these assumptionsyour costs would be:
Number of Years Investment is Held
CSIF Balanced1 $593 $723 $223 $319 $219
3 844 1,088 688 676 676
5 1,113 1,380 1,180 1,159 1,159
10 1,882 2,286 2,286 2,493 2,493
CSIF Equity1 596 712 212 304 204
3 853 1,055 655 630 630
5 1,129 1,324 1,124 1,083 1,083
10 1,915 2,206 2,206 2,338 2,338
Calvert Social Index Fund1 548 678 178 278 178
3 824 1,093 693 666 666
5 1,120 1,434 1,234 1,180 1,180
10 1,962 2,443 2,443 2,593 2,593
CSIF Enhanced Equity1 609 735 235 331 231
3 891 1,124 724 712 712
5 1,194 1,440 1,240 1,220 1,220
10 2,054 2,421 2,421 2,615 2,615
Calvert Large Cap Growth 1 626 750 250 342 242
3 944 1,170 770 745 745
5 1,285 1,516 1,316 1,275 1,275
10 2,243 2,582 2,582 2,726 2,726
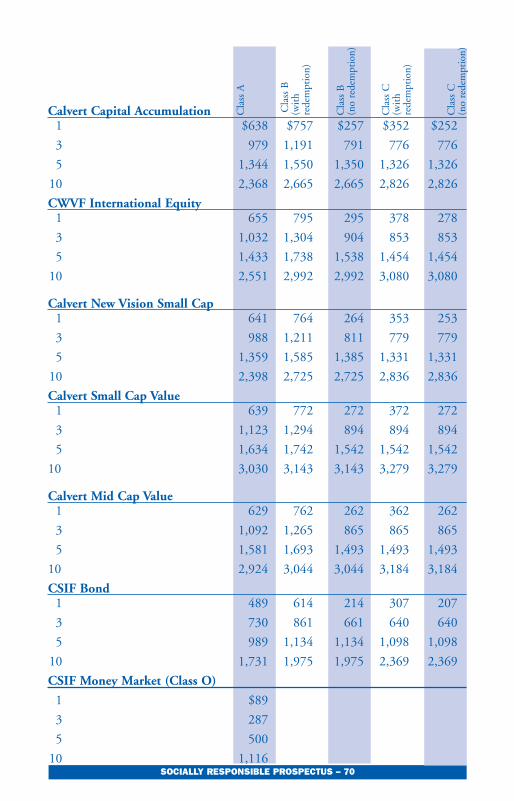
SOCIALLY RESPONSIBLE PROSPECTUS – 70
Calvert Capital Accumulation1 $638 $757 $257 $352 $252
3 979 1,191 791 776 776
5 1,344 1,550 1,350 1,326 1,326
10 2,368 2,665 2,665 2,826 2,826
CWVF International Equity1 655 795 295 378 278
3 1,032 1,304 904 853 853
5 1,433 1,738 1,538 1,454 1,454
10 2,551 2,992 2,992 3,080 3,080
Calvert New Vision Small Cap1 641 764 264 353 253
3 988 1,211 811 779 779
5 1,359 1,585 1,385 1,331 1,331
10 2,398 2,725 2,725 2,836 2,836
Calvert Small Cap Value1 639 772 272 372 272
3 1,123 1,294 894 894 894
5 1,634 1,742 1,542 1,542 1,542
10 3,030 3,143 3,143 3,279 3,279
Calvert Mid Cap Value1 629 762 262 362 262
3 1,092 1,265 865 865 865
5 1,581 1,693 1,493 1,493 1,493
10 2,924 3,044 3,044 3,184 3,184
CSIF Bond1 489 614 214 307 207
3 730 861 661 640 640
5 989 1,134 1,134 1,098 1,098
10 1,731 1,975 1,975 2,369 2,369
CSIF Money Market (Class O)
1 $89
3 287
5 500
10 1,116
Cla
ss A
Cla
ss B
(wit
h re
dem
ptio
n)
Cla
ss B
(no
rede
mpt
ion)
Cla
ss C
(wit
h re
dem
ptio
n)
Cla
ss C
(no
rede
mpt
ion)

SOCIALLY RESPONSIBLE PROSPECTUS – 71
PRINCIPAL INVESTMENT STRATEGIES AND RISKSThe most concise description of each Fund’s principal investment strategies andassociated risks is under the earlier summary for each Fund. On the followingpages are brief descriptions of these principal investment strategies and tech-niques, along with their risks.
For each of the investment strategies listed, the table below shows each Fund’slimitations as a percentage of its assets and the principal types of risk involved.(See the pages following the table for a description of the types of risks).Numbers in this table show maximum allowable amount only; for actual usage,consult the Fund’s annual/semi-annual reports.
Key to Table✪ Fund currently uses as a principal investment strategy❑ Permitted, but not a principal investment strategy
(% of assets allowable, if restricted)✘ Not permittedxN Allowed up to x% of Fund’s net assetsxT Allowed up to x% of Fund’s total assetsNA Not applicable to this type of fund

SOCIALLY RESPONSIBLE PROSPECTUS – 72
✪❑
❑❑
❑❑
❑❑
❑❑
✪N
A
❑❑
❑❑
❑❑
❑❑
❑❑
❑❑
Inve
stm
ent
Stra
tegi
esA
ctiv
e Tr
adin
g St
rate
gy/T
urno
ver
invo
lves
sel
ling
a se
curi
ty s
oon
afte
rpu
rcha
se. A
n ac
tive
tra
ding
str
ateg
yca
uses
a f
und
to h
ave
high
er p
ortf
olio
turn
over
com
pare
d to
oth
er f
unds
and
high
er t
rans
acti
on c
osts
, suc
h as
com
-m
issi
ons
and
cust
odia
n an
d se
ttle
men
tfe
es, a
nd m
ay in
crea
se y
our
tax
liabi
lity.
Ris
ks: O
ppor
tuni
ty, M
arke
t an
dTr
ansa
ctio
n.
Tem
pora
ry D
efen
sive
Pos
itio
ns.
Dur
ing
adve
rse
mar
ket,
econ
omic
or
polit
ical
con
diti
ons,
the
Fun
d m
ayde
part
fro
m it
s pr
inci
pal i
nves
tmen
tst
rate
gies
by
incr
easi
ng it
s in
vest
men
t in
shor
t-te
rm in
tere
st-b
eari
ng s
ecur
itie
s.D
urin
g ti
mes
of
any
tem
pora
ry d
efen
-si
ve p
osit
ion,
a F
und
may
not
be
able
to
achi
eve
its
inve
stm
ent
obje
ctiv
e. R
isks
:O
ppor
tuni
ty.
CSIFMoney Market
CSIF Bond
Calvert Mid CapValue
Calvert Small CapValue
Calvert NewVision Small Cap
CWVFInternationalEquity
Calvert CapitalAccumulation
Calvert Large CapGrowth
CSIFEnhanced Equity
Calvert SocialIndex Fund
CSIF Equity
CSIFBalanced

SOCIALLY RESPONSIBLE PROSPECTUS – 73
✪✪
✪✪
✪✪
✪✪
✪✪
NA
NA
Con
vent
iona
l Sec
urit
ies
Stoc
ks i
n G
ener
alT
he F
und
is su
bjec
t to
stoc
k m
arke
t risk
.St
ock
pric
es o
vera
ll m
ay d
eclin
e ov
ersh
ort o
r ev
en lo
ng p
erio
ds. T
he F
und
isal
so s
ubje
ct to
inve
stm
ent s
tyle
risk
,w
hich
is th
e ch
ance
that
ret
urns
from
the
type
of s
tock
s it
purc
hase
s (la
rge-
cap,
mid
-cap
, gro
wth
, val
ue, e
tc.)
will
trai
lre
turn
s fr
om o
ther
ass
et c
lass
es o
r th
eov
eral
l sto
ck m
arke
t. E
ach
type
of s
tock
tend
s to
go
thro
ugh
cycl
es o
f doi
ng b
ette
ror
wor
se th
an th
e st
ock
mar
ket i
n ge
ner-
al. F
inal
ly, i
ndiv
idua
l sto
cks
may
lose
valu
e fo
r a
vari
ety
of r
easo
ns, e
ven
whe
nth
e ov
eral
l sto
ck m
arke
t has
incr
ease
d.R
isks
: Mar
ket.

SOCIALLY RESPONSIBLE PROSPECTUS – 74
25N
25N
5N1
✘10
N25
N✪
15T
210
N10
N25
NN
A
❑❑
❑❑
❑❑
❑✪
✪✪
NA
NA
✪❑
NA
NA
❑❑
❑❑
❑❑
✪N
A
Con
vent
iona
l Sec
urit
ies
(con
t’d)
Fore
ign
Secu
riti
es.S
ecur
itie
s is
sued
by
com
pani
es w
hose
pri
ncip
al p
lace
of
busi
ness
is lo
cate
d ou
tsid
e th
e U
.S. F
orfu
nds
that
may
inve
st in
deb
t, th
isin
clud
es d
ebt
inst
rum
ents
den
omin
ated
in o
ther
cur
renc
ies
such
as
Eur
obon
ds.
Ris
ks: M
arke
t, C
urre
ncy,
Tra
nsac
tion
,L
iqui
dity
, Inf
orm
atio
n an
d Po
litic
al.
Smal
l cap
sto
cks.
Inve
stin
g in
sm
all
com
pani
es in
volv
es g
reat
er r
isk
than
wit
h m
ore
esta
blis
hed
com
pani
es. S
mal
lca
p st
ock
pric
es a
re m
ore
vola
tile
and
the
com
pani
es o
ften
hav
e lim
ited
pro
d-uc
t lin
es, m
arke
ts, f
inan
cial
res
ourc
es,
and
man
agem
ent
expe
rien
ce. R
isks
:M
arke
t, L
iqui
dity
and
Inf
orm
atio
n.
Inve
stm
ent
grad
e bo
nds.
Bon
ds r
ated
BB
B/B
aa o
r hi
gher
by
an N
RSR
O o
rco
mpa
rabl
e un
rate
d bo
nds.
Ris
ks:
Inte
rest
Rat
e, M
arke
t an
d C
redi
t.
CSIFMoney Market
CSIF Bond
Calvert Mid CapValue
Calvert Small CapValue
Calvert NewVision Small Cap
CWVFInternationalEquity
Calvert CapitalAccumulation
Calvert Large CapGrowth
CSIFEnhanced Equity
Calvert SocialIndex Fund
CSIF Equity
CSIFBalanced
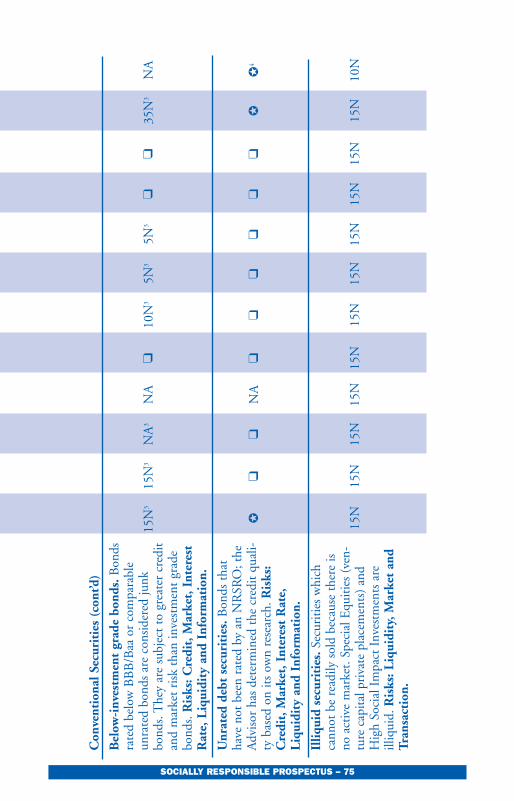
SOCIALLY RESPONSIBLE PROSPECTUS – 75
Con
vent
iona
l Sec
urit
ies
(con
t’d)
Bel
ow-i
nves
tmen
t gr
ade
bond
s.B
onds
rate
d be
low
BB
B/B
aa o
r co
mpa
rabl
eun
rate
d bo
nds
are
cons
ider
ed ju
nkbo
nds.
The
y ar
e su
bjec
t to
gre
ater
cre
dit
and
mar
ket
risk
tha
n in
vest
men
t gr
ade
bond
s. R
isks
: Cre
dit,
Mar
ket,
Int
eres
tR
ate,
Liq
uidi
ty a
nd I
nfor
mat
ion.
Unr
ated
deb
t se
curi
ties
.Bon
ds t
hat
have
not
bee
n ra
ted
by a
n N
RSR
O; t
heA
dvis
or h
as d
eter
min
ed t
he c
redi
t qu
ali-
ty b
ased
on
its
own
rese
arch
. Ris
ks:
Cre
dit,
Mar
ket,
Int
eres
t R
ate,
Liq
uidi
ty a
nd I
nfor
mat
ion.
Illiq
uid
secu
riti
es.S
ecur
itie
s w
hich
cann
ot b
e re
adily
sol
d be
caus
e th
ere
isno
act
ive
mar
ket.
Spec
ial E
quit
ies
(ven
-tu
re c
apit
al p
riva
te p
lace
men
ts)
and
Hig
h So
cial
Im
pact
Inv
estm
ents
are
illiq
uid.
Ris
ks: L
iqui
dity
, Mar
ket
and
Tran
sact
ion.
15N
315
N3
NA
3N
A❑
10N
35N
35N
3❑
❑35
N3
NA
✪❑
❑N
A❑
❑❑
❑❑
❑✪
✪4
15N
15N
15N
15N
15N
15N
15N
15N
15N
15N
15N
10N

SOCIALLY RESPONSIBLE PROSPECTUS – 76
Unl
ever
aged
Der
ivat
ive
Secu
riti
es
Ass
et-b
acke
d se
curi
ties
.Sec
urit
ies
are
back
ed b
y un
secu
red
debt
, suc
h as
aut
o-m
obile
loan
s, h
ome
equi
ty lo
ans,
equ
ip-
men
t or
com
pute
r le
ases
, or
cred
it c
ard
debt
. The
se s
ecur
itie
s ar
e of
ten
guar
an-
teed
or
over
-col
late
raliz
ed t
o en
hanc
eth
eir
cred
it q
ualit
y. R
isks
: Cre
dit,
Inte
rest
Rat
e an
d L
iqui
dity
.
Mor
tgag
e-ba
cked
sec
urit
ies.
Secu
riti
esar
e ba
cked
by
pool
s of
mor
tgag
es,
incl
udin
g se
nior
cla
sses
of
colla
tera
lized
mor
tgag
e ob
ligat
ions
(C
MO
s). R
isks
:C
redi
t, E
xten
sion
, Pre
paym
ent,
Liq
uidi
ty a
nd I
nter
est
Rat
e.
Cur
renc
y co
ntra
cts.
Con
trac
ts in
volv
-in
g th
e ri
ght
or o
blig
atio
n to
buy
or
sell
a gi
ven
amou
nt o
f fo
reig
n cu
rren
cy a
t a
spec
ified
pri
ce a
nd f
utur
e da
te. R
isks
:C
urre
ncy,
Lev
erag
e, C
orre
lati
on,
Liq
uidi
ty a
nd O
ppor
tuni
ty.
✪❑
NA
NA
❑❑
❑❑
❑❑
✪✪
4
✪❑
NA
NA
❑❑
❑❑
❑❑
✪❑
4
❑❑
NA
NA
❑5T
5T✘
❑❑
❑N
ACSIFMoney Market
CSIF Bond
Calvert Mid CapValue
Calvert Small CapValue
Calvert NewVision Small Cap
CWVFInternationalEquity
Calvert CapitalAccumulation
Calvert Large CapGrowth
CSIFEnhanced Equity
Calvert SocialIndex Fund
CSIF Equity
CSIFBalanced

SOCIALLY RESPONSIBLE PROSPECTUS – 77
5T5
5T5
NA
5T5
✪7
5T5
5T5
5T5
5T5
5T5
5T5
NA
5N6
5N6
5N6
5N6
✪8
5N6
5N6
5N6
5N6
5N6
5N6
NA
Lev
erag
ed D
eriv
ativ
e In
stru
men
ts
Opt
ions
on
secu
riti
es a
nd i
ndic
es.
Con
trac
ts g
ivin
g th
e ho
lder
the
rig
htbu
t no
t th
e ob
ligat
ion
to p
urch
ase
orse
ll a
secu
rity
(or
the
cas
h va
lue,
in t
heca
se o
f an
opt
ion
on a
n in
dex)
at
a sp
ec-
ified
pri
ce w
ithi
n a
spec
ified
tim
e. I
nth
e ca
se o
f se
lling
(w
riti
ng)
opti
ons,
the
Fund
will
wri
te c
all o
ptio
ns o
nly
if it
alre
ady
owns
the
sec
urit
y (i
f it
is “
cov-
ered
”). R
isks
: Int
eres
t R
ate,
Cur
renc
y,M
arke
t, L
ever
age,
Cor
rela
tion
,L
iqui
dity
, Cre
dit
and
Opp
ortu
nity
.
Futu
res
cont
ract
.Agr
eem
ent
to b
uy o
rse
ll a
spec
ific
amou
nt o
f a
com
mod
ity
or f
inan
cial
inst
rum
ent
at a
par
ticu
lar
pric
e on
a s
peci
fic f
utur
e da
te. R
isks
:In
tere
st R
ate,
Cur
renc
y, M
arke
t,L
ever
age,
Cor
rela
tion
, Liq
uidi
ty a
ndO
ppor
tuni
ty.
1C
alve
rt S
ocia
l Ind
ex F
und
may
inve
st in
for
eign
sec
urit
ies
to t
he e
xten
t ne
cess
ary
to c
arry
out
its
inve
stm
ent
stra
tegy
of
hold
ing
all o
f th
e st
ocks
tha
t co
mpr
ise
the
Inde
x. T
he I
ndex
(an
d he
nce
the
Fund
) m
ay in
clud
e se
curi
ties
issu
ed b
y co
mpa
nies
loca
ted
outs
ide
the
U.S
. but
onl
y if
they
are
tra
ded
prim
arily
on
the
NY
SE o
r
AM
EX
/NA
SDA
Q.
2 C
alve
rt N
ew V
isio
n Sm
all C
ap m
ay in
vest
onl
y in
Am
eric
an D
epos
itor
y R
ecei
pts
(AD
Rs)
— d
olla
r-de
nom
inat
ed r
ecei
pts
repr
esen
ting
sha
res
of a
fore
ign
issu
er. A
DR
s ar
e tr
aded
on
U.S
. exc
hang
es. S
ee t
he S
AI.
3 E
xclu
des
any
high
soc
ial i
mpa
ct in
vest
men
ts.
4 M
ust
be m
oney
-mar
ket
fund
elig
ible
und
er S
EC
Rul
e 2a
-7.
5 B
ased
on
net p
rem
ium
pay
men
ts.
6 B
ased
on
initi
al m
argi
n re
quire
d to
est
ablis
h po
sitio
n.7
Up
to 5
% o
f to
tal a
sset
s ba
sed
on n
et p
rem
ium
pay
men
ts.
8 U
p to
5%
of
net
asse
ts b
ased
on
init
ial m
argi
n re
quir
ed t
o es
tabl
ish
the
posi
tion
.

SOCIALLY RESPONSIBLE PROSPECTUS – 78
The Funds have additional investment policies and restrictions (for example,repurchase agreements, borrowing, pledging, reverse repurchase agreements,securities lending, when-issued securities, swap agreements and short sales).These policies and restrictions are discussed in the Statement of AdditionalInformation (“SAI”).
Glossary of Investment Risk TypeCorrelation riskThis occurs when a Fund “hedges”- uses one investment to offset the Fund’sposition in another. If the two investments do not behave in relation to oneanother the way Fund managers expect them to, then unexpected or undesiredresults may occur. For example, a hedge may eliminate or reduce gains as well asoffset losses.
Credit riskThe risk that the issuer of a security or the counterparty to an investment con-tract may default or become unable to pay its obligations when due.
Currency riskCurrency risk occurs when a Fund buys, sells or holds a security denominated inforeign currency. Foreign currencies “float” in value against the U.S. dollar.Adverse changes in foreign currency values can cause investment losses when aFund’s investments are converted to U.S. dollars.
Extension riskThe risk that an unexpected rise in interest rates will extend the life of a mort-gage-backed security beyond the expected prepayment time, typically reducingthe security’s value.
Information riskThe risk that information about a security or issuer or the market might not beavailable, complete, accurate, or comparable.
Interest rate riskThe risk that changes in interest rates will adversely affect the value of aninvestor’s securities. When interest rates rise, the value of fixed-income securitieswill generally fall. Conversely, a drop in interest rates will generally cause anincrease in the value of fixed-income securities. Longer-term securities and zerocoupon/“stripped” coupon securities (“strips”) are subject to greater interest raterisk.
Leverage riskThe risk that occurs in some securities or techniques which tend to magnify theeffect of small changes in an index or a market. This can result in a loss thatexceeds the amount actually invested.

SOCIALLY RESPONSIBLE PROSPECTUS – 79
Liquidity riskThe risk that occurs when investments cannot be readily sold. A Fund may haveto accept a less-than-desirable price to complete the sale of an illiquid security ormay not be able to sell it at all.
Market riskThe risk that securities prices in a market, a sector or an industry will fluctuate,and that such movements might reduce an investment’s value.
Opportunity riskThe risk of missing out on an investment opportunity because the assets neededto take advantage of it are committed to less advantageous investments or strate-gies.
Political riskThe risk that may occur when the value of a foreign investment may be adverse-ly affected by nationalization, taxation, war, government instability or other eco-nomic or political actions or factors.
Prepayment riskThe risk that unanticipated prepayments may occur, reducing the value of amortgage-backed security. The Fund must then reinvest those assets at the cur-rent market rate which may be lower.
Transaction riskThe risk that a Fund may be delayed or unable to settle a transaction or thatcommissions and settlement expenses may be higher than usual.
What is Indexing? (Calvert Social Index Fund)An index is an unmanaged group of securities whose overall performance is usedas a standard to measure investment performance. An index (or “passively man-aged”) fund tries to match, as closely as possible, the performance of an estab-lished target index.
Index funds are not actively managed by investment advisors who buy and sellsecurities based on research and analysis in an attempt to outperform a particularbenchmark or the market as a whole. Rather, index funds simply attempt to mir-ror what the target index does, for better or for worse. The socially responsiblecriteria used by the Calvert Social Index may result in economic sector weight-ings that are significantly different from those of the overall market.To track its target index as closely as possible, the Fund attempts to remain fullyinvested in stocks. To help stay fully invested, and to reduce transaction costs,the Fund may invest to a limited extent in stock futures contracts, or otherregistered investment companies. The Fund may purchase U.S. Treasury
SOCIALLY RESPONSIBLE PROSPECTUS – 80
securities in connection with its hedging activities.
The Fund uses a replication method of indexing. If assets should ever decline tobelow $20 million, it may use the sampling method.
Although index funds by their nature tend to be tax-efficient investment vehi-cles, the Fund generally is managed without regard to tax ramifications.
INVESTMENT SELECTION PROCESSInvestments are selected on the basis of their ability to contribute to the dualobjectives of financial soundness and social criteria.
Potential investments for a Fund are first selected for financial soundness andthen evaluated according to that Fund’s social criteria. To the greatest extentpossible, the Funds seek to invest in companies that exhibit positive accomplish-ments with respect to one or more of the social criteria. Investments for a Fundmust meet the minimum standards for all of the Fund’s financial and social cri-teria.
Investments in fixed income securities for Calvert’s socially screened funds may bemade prior to the application of social analysis, due to the nature of fixed incomemarket, where unlike equities, fixed income securities are not available on exchangetraded markets, and the window of availability may not be sufficient to permitCalvert to perform social analysis prior to purchase. However, following purchase,the fixed income security is immediately evaluated according to the Fund’s socialcriteria and if it is not found to meet the minimum standards for the Fund’s socialcriteria, the security must be sold as soon as is possible, at a time that is in the bestinterests of the shareholders.
Investment decisions on whether a company meets that Fund’s social criteria applyto all securities issued by that company. In rare instances, however, different deci-sions can be made on a company’s equity and its debt.
Although each Fund’s social criteria tend to limit the availability of investmentopportunities more than is customary with other investment companies, Calvertand the Subadvisors of the Funds believe there are sufficient investment oppor-tunities to permit full investment among issuers which satisfy each Fund’s invest-ment and social objectives.
The selection of an investment by a Fund does not constitute endorsement orvalidation by that Fund, nor does the exclusion of an investment necessarilyreflect failure to satisfy the Fund’s social criteria. Investors are invited to send abrief description of companies they believe might be suitable for investment.
SOCIALLY RESPONSIBLE PROSPECTUS – 81
Socially Responsible Investment CriteriaThe Funds invest in accordance with the philosophy that long-term rewards toinvestors will come from those organizations whose products, services, andmethods enhance the human condition and the traditional American values ofindividual initiative, equality of opportunity and cooperative effort. In addi-tion, we believe that there are long-term benefits in an investment philosophythat demonstrates concern for the environment, labor relations, human rightsand community relations. Calvert believes that those enterprises that exhibit asocial awareness in these issues should be better prepared to meet future societalneeds. By responding to social concerns, these enterprises should not only avoidthe liability that may be incurred when a product or service is determined tohave a negative social impact or has outlived its usefulness, but also be betterpositioned to develop opportunities to make a profitable contribution to society.These enterprises should be ready to respond to external demands and ensurethat over the longer term they will be viable to seek to provide a positive returnto both investors and society as a whole.
Each Fund has developed social investment criteria, detailed below. These crite-ria represent standards of behavior which few, if any, organizations totally satisfy.As a matter of practice, evaluation of a particular organization in the context ofthese criteria will involve subjective judgment by Calvert and the Subadvisors.All social criteria may be changed by the Board of Trustees/Directors withoutshareholder approval.
CSIF Portfolios, Calvert Capital Accumulation, Calvert Social Index Fund,Calvert Large Cap Growth, Calvert New Vision Small Cap, Calvert SmallCap Value and Calvert Mid Cap Value:
The Funds seek to invest in companies that:
• Have good environmental compliance and performance records, develop andmarket innovative products and services, and embrace and advance sustain-able development.
• Provide safe and healthy work environments; negotiate fairly with their work-ers; treat their employees with dignity and respect; and provide opportunitiesfor women, minorities, and others who have been discriminated against ordenied equal opportunities.
• Are responsible corporate citizens abroad, as well as at home, by developingand observing appropriate human rights standards.
• Respect indigenous peoples and their territories, cultures, environment, and

SOCIALLY RESPONSIBLE PROSPECTUS – 82
livelihood.
• Produce or market products and services that are safe and enhance the healthor quality of life of consumers.
• Contribute to the quality of life in the communities where they operate, suchas through corporate philanthropy and employee volunteerism.
• Have sound corporate governance and business ethics policies and practices,including independent and diverse boards, independent auditors, respect forshareholder rights, and good legal and regulatory compliance records.
The Funds seek to avoid investing in companies that:
• Are the subject of serious labor related actions by federal, state or local regula-tory agencies.
• Have recent significant environmental fines or violations; are significantlyresponsible for environmental accidents; or own or operate nuclear powerplants or have substantial contracts to supply key components in the nuclearpower process.
• Have serious and persistent human rights problems or directly support govern-ments that systematically deny human rights.
• Have a pattern and practice of violating the rights of indigenous peoples.
• Develop genetically-modified organisms for environmental release withoutcountervailing social benefits such as demonstrating leadership in promotingsafety, labeling, protection of indigenous rights, the interests of organic farm-ers and the interests of developing countries generally.
• Abuse animals, cause unnecessary suffering and death of animals, or whoseoperations involve the exploitation or mistreatment of animals.
• Manufacture tobacco products.
• Are significantly involved in the manufacture of weapons.
• Are significantly involved in the manufacture of alcoholic beverages.
• Have direct involvement in gambling operations.
• Have poor corporate governance or engage in harmful or unethical businesspractices.
SOCIALLY RESPONSIBLE PROSPECTUS – 83
With respect to U.S. government securities, CSIF invests primarily in debt obli-gations issued or guaranteed by agencies or instrumentalities of the U.S.Government whose purposes further, or are compatible with, the Fund’s socialcriteria, such as obligations of the Student Loan Marketing Association, ratherthan general obligations of the U.S. Government, such as Treasury securities.
CWVF International Equity
The spirit of CWVF International Equity’s social criteria is similar to CSIF, butthe application of the social analysis is significantly different. Internationalinvesting brings unique challenges in terms of corporate disclosure, regulatorystructures, environmental standards, and differing national and culturalpriorities. Due to these factors, the CWVF International Equity social invest-ment standards are less stringent than those of CSIF.
CWVF International Equity seeks to invest in companies that:
• Take positive steps to improve environmental management and performance,and provide innovative and forward-looking solutions to environmental prob-lems through their products and services.
• Have positive labor practices, including hiring and promoting women and ethnicminorities; respecting the right to form unions and bargain collectively; complying,at a minimum, with domestic hour and wage laws; and providing good health andsafety standards. We consider the International Labor Organization’s basic conven-tions on worker rights as a guideline for our labor criteria.
• Are responsible corporate citizens abroad, as well as at home, by developingand observing appropriate human rights standards.
• Respect indigenous peoples and their territories, cultures, environment, andlivelihood.
• Produce or market products and services that are safe and enhance the healthor quality of life of consumers.
• Contribute to the quality of life in the communities where they operate, suchas through corporate philanthropy and employee volunteerism.
• Have sound corporate governance and business ethics policies and practices,including independent and diverse boards, independent auditors, respect forshareholder rights, and good legal and regulatory compliance records.
CWVF International Equity seeks to avoid investing in companies that:• Directly contribute to the systematic denial of basic human rights.

SOCIALLY RESPONSIBLE PROSPECTUS – 84
• Demonstrate a pattern of employing forced, compulsory or child labor.
• Have poor environmental compliance and performance records and lack pro-grams and policies to address environmental impacts; or whose business oroperations threaten environmental sustainability; or own or operate nuclearpower plants or have substantial contracts to supply key components in thenuclear power process.
• Have poor corporate governance or engage in harmful or unethical business prac-tices.
• Develop genetically-modified organisms for environmental release withoutcountervailing social benefits such as demonstrating leadership in promotingsafety, labeling, protection of indigenous rights, the interests of organic farm-ers and the interests of developing countries generally.
• Derive more than 10% of revenues from the production of weapons systems.
• Derive more than 10% of revenues from the production of tobacco or alcoholproducts.
Special Investment ProgramsAs part of Calvert’s and Fund shareholders’ ongoing commitment to providingand fostering innovative initiatives, those Funds invest a small percentage oftheir respective assets in special investment programs – High Social ImpactInvestments, Special Equities, and the Calvert Manager Discovery Program.
High Social Impact InvestmentsCSIF Balanced, CSIF Bond and CSIF Equity, CWVF International Equity,Calvert Capital Accumulation, Calvert New Vision Small Cap, Calvert SocialIndex Fund, Calvert Large Cap Growth, Calvert Small Cap Value andCalvert Mid Cap ValueHigh Social Impact Investments is a program that targets a percentage of theFund’s assets (up to 1% for each of CSIF Balanced, CSIF Equity and CSIFBond, Calvert Social Index Fund, Calvert Large Cap Growth, Calvert NewVision Small Cap, Calvert Small Cap Value and Calvert Mid Cap Value and upto 3% for each of CWVF International Equity and Calvert CapitalAccumulation) to directly support the growth of community-based organizationsfor the purposes of promoting business creation, housing development, and eco-nomic and social development of urban and rural communities. These types ofinvestments offer a rate of return below the then-prevailing market rate, and areconsidered illiquid, unrated and below-investment grade. They also involve agreater risk of default or price decline than investment grade securities. However,the Funds believe that these investments have a significant social return throughtheir impact in our local communities. A Fund’s High Social Impact Investmentsare valued under the direction of the Fund’s Board.

SOCIALLY RESPONSIBLE PROSPECTUS – 85
Pursuant to an exemptive order, the Funds invest those assets allocated forinvestment in high social impact investments through the purchase ofCommunity Investment Notes issued by the Calvert Social Investment Foundation.
The Calvert Social Investment Foundation is a non-profit organization, legallydistinct from the Funds and Calvert Group, Ltd., organized as a charitable andeducational foundation for the purpose of increasing public awareness andknowledge of the concept of socially responsible investing. It has instituted theCalvert Community Investments program to raise assets from individual andinstitutional investors and then invest these assets directly in non-profit or not-for-profit community development organizations and community developmentbanks that focus on low income housing, economic development and businessdevelopment in urban and rural communities.
The Funds may also invest directly in high social impact issuers.
Investments in High Social Impact Investments may hinder the Calvert SocialIndex Fund’s ability to track the Index. For this reason, the Fund limits theamount of such investments to only 1% of Fund assets, and will not engage inthis program until reaching $50 million in assets.
Special Equities CSIF Balanced, CSIF Equity, CWVF International Equity, Calvert CapitalAccumulation, Calvert Large Cap Growth and Calvert Social Index Each of these funds has a Special Equities investment program that allows the Fund topromote especially promising approaches to social goals through privately placed invest-ments. The investments are generally venture capital privately placed investments in small,untried enterprises. These include pre-IPO companies and private funds. The SpecialEquities Committee of each Fund identifies, evaluates, and selects the Special Equitiesinvestments. Special Equities involve a high degree of risk – they are subject to liquidity,information and, if a debt investment, credit risk. A Fund’s Special Equities are valuedunder the direction of the Fund’s Board. Calvert Social Index Fund may engage in thisprogram upon reaching $50 million in assets and its Special Equities investments will belimited to 1% of its assets once it commences the program.
Pursuant to approval by the Board of Trustees/Directors of each Fund, the SpecialEquities Committee of each Fund has retained Stephen Moody and Jean-Luc Parkas consultants to administer the Special Equities Program.
Manager Discovery ProgramAs part of Calvert’s and CSIF shareholders’ ongoing commitment to promotingequal opportunity, Calvert has introduced the Manager Discovery Program as acomponent of CSIF Balanced. The program allocates up to 5% of CSIF Balanced’s

SOCIALLY RESPONSIBLE PROSPECTUS – 86
assets to strong-performing yet often overlooked minority and women-ownedmoney management firms. These firms must have a proven track record and invest-ment discipline that mirror the investment objectives of the equity portion of CSIFBalanced. The Manager Discovery Program seeks to bring a dynamic new perspec-tive to CSIF Balanced, while maintaining Calvert’s long-standing commitment toseeking financial performance and societal impact.
Shareholder Advocacy and Social Responsibility
As each Fund’s investment advisor, Calvert takes a proactive role to make a tangiblepositive contribution to our society and that of future generations. Calvert seeks topositively influence corporate behavior through its role as a shareholder by movingcompanies toward higher standards of social and environmental responsibility.Calvert’s activities may include but are not limited to:
Dialogue with companiesCalvert regularly initiates dialogue with company management as part of its socialresearch process. After a Fund has become a shareholder, Calvert often continues itsdialogue with management through phone calls, letters and in-person meetings.Through its interaction, Calvert learns about management’s successes and challengesand presses for improvement on issues of concern.
Proxy votingAs a shareholder in the various portfolio companies, the Fund is guaranteed an opportu-nity each year to express its views on issues of corporate governance and social responsibil-ity at annual stockholder meetings. Calvert takes its voting responsibility seriously andvotes all proxies consistent with the financial and social objectives of the Fund.
Shareholder resolutionsCalvert proposes resolutions on a variety of social issues. It files shareholder resolu-tions when its dialogue with corporate management proves unsuccessful to encour-age a company to take action. In most cases, Calvert’s efforts have led to negotiatedsettlements with positive results for shareholders and companies alike. For example,one of its shareholder resolutions resulted in the company’s first-ever disclosure ofits equal employment policies, programs and workforce demographics.
ABOUT CALVERT Calvert Asset Management Company, Inc. (Calvert), 4550 MontgomeryAvenue, Suite 1000N, Bethesda, MD 20814, is the Funds’ investment advisor.Calvert provides the Funds with investment supervision and management andoffice space, furnishes executive and other personnel to the Funds, and pays thesalaries and fees of all Trustees/Directors who are affiliated persons of andemployed by Calvert. It has been managing mutual funds since 1976. Calvert isthe investment advisor for over 30 mutual fund portfolios, including the firstand largest family of socially screened funds. As of December 31, 2005, Calvert

had over $11 billion in assets under management.
Advisor, Subadvisors and Portfolio Managers
Information is provided below identifying each individual and or member of a teamwho is employed by or associated with the Advisor and respective Subadvisor ofeach Fund, and who is primarily (and jointly, as applicable) responsible for the day-to-day management of the Fund (each a “Portfolio Manager”). The SAI providesadditional information about each Portfolio Manager’s management of otheraccounts, compensation and ownership of securities in the respective Fund.
CSIF Balanced
Calvert Asset Management Company, Inc.
See “About Calvert” Above.
Steve Falci, Calvert’s Chief Investment Officer for Equities, handles the allocation ofassets and Portfolio Managers for CSIF Balanced.
Gregory Habeeb and Matt Nottingham, CFA, manage the day-to-day investment ofthe fixed-income investments of CSIF Balanced.
Name ofPortfolioManager
Steve Falci
Title
ChiefInvestmentOfficer,Equities, andSenior VicePresident
Length of Servicewith Advisor
2 years
BusinessExperienceDuring Last 5Years
2000-2004:Senior PortfolioManager, MellonEquity Associates
2004-2005:CIO, Equities,Calvert
Mr. Falci has 18years of experi-ence in the secu-rities industry.
Role onManagementTeam
Asset andPortfolioManagerAllocationsfor CSIFBalanced
SOCIALLY RESPONSIBLE PROSPECTUS – 87

SOCIALLY RESPONSIBLE PROSPECTUS – 88
Fixed Income Investments of CSIF Balanced
Calvert Asset Management Company, Inc.
Equity Investments of CSIF Balanced
New Amsterdam Partners, LLC (New Amsterdam), 475 Park Avenue South,20th Floor, New York, New York 10016, has managed a portion of the equityassets of CSIF Balanced since June 30, 2004.
Name ofPortfolioManager
GregoryHabeeb
MattNottingham,CFA
Title
Senior VicePresident,PortfolioManager
PortfolioManager
Length ofService withAdvisor
Since January1997
Since July 1999
BusinessExperienceDuring Last 5Years
Lead PortfolioManager of Calvert’staxable fixed-incomefunds since 1997
Mr. Habeeb hasover 20 years ofexperience as ananalyst, trader andportfolio manager.
Co-lead portfoliomanager of Calvert’staxable fixed-incomefunds since 2001
Mr. Nottinghamhas 11 years ofexperience as ananalyst, trader andportfolio manager.
Role onManagementTeam
Lead PortfolioManager
Co-PortfolioManager
Name ofPortfolioManager
MichelleClayman, CFA
Title
ManagingPartner, ChiefInvestmentOfficer
Length ofService withSubadvisoryFirm
19 years
BusinessExperienceDuring Last 5Years
New AmsterdamPartners LLCMs. Claymanfounded the firmin 1986.
Role onManagementTeam
Portfolio Manager

SOCIALLY RESPONSIBLE PROSPECTUS – 89
Profit Investment Management (Profit), 8720 Georgia Avenue, Suite 808, SilverSpring, Maryland 20910, has managed a portion of the equity assets of CSIFBalanced since October 2002. Profit is a part of Calvert’s Manager DiscoveryProgram.
SSgA Funds Management, Inc. (SSgA FM), One Lincoln Street, Boston, MA02111, is a subsidiary of State Street Corporation. SSgA FM has managed equityassets in CSIF Balanced since March 2002. SSgA FM is the successor to State StreetGlobal Advisors (SSgA), a division of State Street Bank & Trust Company.
Nathaniel Paull,CFA
Partner, SeniorPortfolioManager
9 years New AmsterdamPartners LLC
Portfolio Manager
Name ofPortfolioManager
Eugene A. Profit
Title
President
Length ofService withSubadvisoryFirm
9 years
BusinessExperienceDuring Last 5Years
Profit InvestmentManagement
Name ofPortfolioManager
ArleneRockefeller
Title
ManagingDirector ofEquities
Length ofService withSubadvisoryFirm
22 Years withaffiliates; withSSgA FM sinceinception onApril 30, 2001.
BusinessExperienceDuring Last 5Years
2000-2003:Leader of theEvaluation Groupas well as PortfolioManager in theEnhanced EquitiesGroup.
2003-2004: Director of theGlobal EnhancedEquities Group aswell as a SeniorPortfolio Managerwithin the Group.
Role onManagementTeam
Ms. Rockefeller isresponsible fordirection of theEnhancedEquities Group.She takes part inthe researchprocess of SSgAFM’s stock-rank-ing models andreviews portfoliosin an oversightrole to ensurecompliance withclient objectivesand guidelines.
Role onManagementTeam
Portfolio Manager
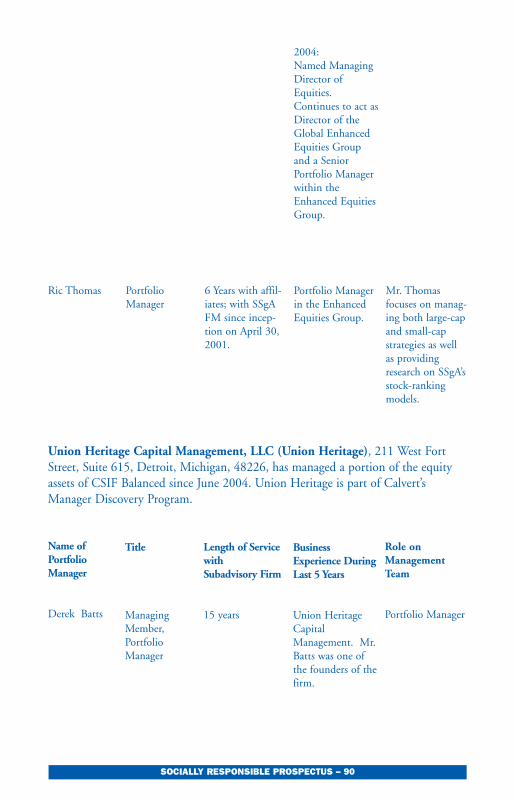
SOCIALLY RESPONSIBLE PROSPECTUS – 90
Union Heritage Capital Management, LLC (Union Heritage), 211 West FortStreet, Suite 615, Detroit, Michigan, 48226, has managed a portion of the equityassets of CSIF Balanced since June 2004. Union Heritage is part of Calvert’sManager Discovery Program.
2004:Named ManagingDirector ofEquities.Continues to act asDirector of theGlobal EnhancedEquities Groupand a SeniorPortfolio Managerwithin theEnhanced EquitiesGroup.
Ric Thomas PortfolioManager
6 Years with affil-iates; with SSgAFM since incep-tion on April 30,2001.
Portfolio Managerin the EnhancedEquities Group.
Mr. Thomasfocuses on manag-ing both large-capand small-capstrategies as wellas providingresearch on SSgA’sstock-rankingmodels.
Name ofPortfolioManager
Derek Batts
Title
ManagingMember,PortfolioManager
Length of ServicewithSubadvisory Firm
15 years
BusinessExperience DuringLast 5 Years
Union HeritageCapitalManagement. Mr.Batts was one ofthe founders of thefirm.
Role onManagementTeam
Portfolio Manager

SOCIALLY RESPONSIBLE PROSPECTUS – 91
CSIF Equity
Atlanta Capital Management Company, L.L.C. (Atlanta Capital), Two MidtownPlaza, Suite 1600, 1349 West Peachtree Street, Atlanta, GA 30309, has managedCSIF Equity since September 1998.
Calvert Social Index Fund
World Asset Management, L.L.C. (World), 255 E. Brown St., Birmingham, MI48009, is the Subadvisor for the Calvert Social Index Fund. World has been in theindex business since the mid 1970s and specializes in passive portfolio managementtechnique. It has managed the Fund since inception.
Name ofPortfolioManager
Daniel W.Boone, III,CFA
Marilyn R.Irvin
William R.Hackney III
Paul J.Marshall
Title
ManagingPartner
Senior VicePresident/Principal
ManagingPartner
Vice President/Direcctor ofResearch
Length ofService withSubadvisoryFirm
30 years
16 years
10 years
5 years
BusinessExperienceDuring Last 5Years
Atlanta CapitalManagement
Atlanta CapitalManagement
Atlanta CapitalManagement
Atlanta CapitalManagement
Role onManagementTeam
Lead PortfolioManager
Portfolio Manager
Portfolio Manager
Portfolio Manager
Name ofPortfolioManager
Kenneth A.Schluchter, III
Kevin K. Yousif Sr.
Title
Director,DomesticInvestments
SeniorPortfolioManager
Length ofService withSubadvisoryFirm
10 Years
5 Years
BusinessExperienceDuring Last 5Years
World AssetManagement
World AssetManagement
Role onManagementTeam
PortfolioManager
PortfolioManager

SOCIALLY RESPONSIBLE PROSPECTUS – 92
CSIF Enhanced Equity
SSgA Funds Management, Inc. (SSgA FM), One Lincoln Street, Boston, MA02111, is a subsidiary of State Street Corporation. SSgA FM has managed CSIFEnhanced Equity since its inception in April 1998. SSgA FM is the successor toState Street Global Advisors (SSgA), a division of State Street Bank & TrustCompany.
Arlene Rockefeller and Ric Thomas are SSgA’s FM’s Portfolio Managers for CSIFEnhanced Equity. Please see the information presented above with respect to SSgAFM’s management of CSIF Balanced regarding these Portfolio Managers’ titles,length of service with the Subadvisory firm, business experience during the last fiveyears and role on the management team.
Calvert Large Cap Growth
Bridgeway Capital Management, Inc. (Bridgeway), 5615 Kirby Drive, Suite 518,Houston Texas 77005-2448, has managed Calvert Large Cap Growth (previouslythe Bridgeway Fund, Inc. Social Responsibility Portfolio) since its inception in1994.
Calvert Capital Accumulation
New Amsterdam Partners, LLC (New Amsterdam), 475 Park Avenue South,20th Floor, New York, New York 10016, has managed the assets of CalvertCapital Accumulation, since September 2005
Michelle Clayman and Nathaniel Paull are New Amsterdam’s Portfolio Managers forCalvert Capital Accumulation. Please see the information presented above withrespect to New Amsterdam’s management of CSIF Balanced regarding thesePortfolio Managers’ titles, length of service with the Subadvisory firm, businessexperience during the last five years and role on the management team.
Name ofPortfolioManager
John N.R.Montgomery
Title
President
Length of ServicewithSubadvisory Firm
12 years
BusinessExperience DuringLast 5 Years
Bridgeway CapitalManagement
Role onManagementTeam
Portfolio Manager
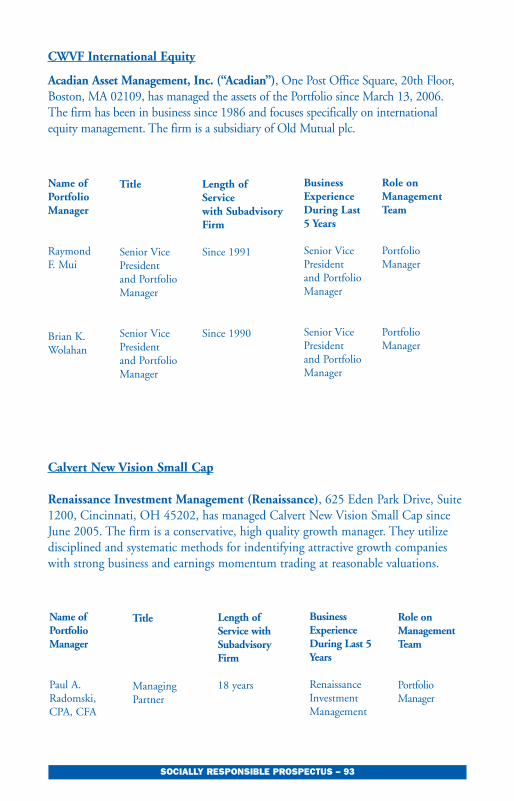
SOCIALLY RESPONSIBLE PROSPECTUS – 93
CWVF International Equity
Acadian Asset Management, Inc. (“Acadian”), One Post Office Square, 20th Floor,Boston, MA 02109, has managed the assets of the Portfolio since March 13, 2006. The firm has been in business since 1986 and focuses specifically on international equity management. The firm is a subsidiary of Old Mutual plc.
Calvert New Vision Small Cap
Renaissance Investment Management (Renaissance), 625 Eden Park Drive, Suite1200, Cincinnati, OH 45202, has managed Calvert New Vision Small Cap sinceJune 2005. The firm is a conservative, high quality growth manager. They utilizedisciplined and systematic methods for indentifying attractive growth companieswith strong business and earnings momentum trading at reasonable valuations.
Name of Portfolio Manager
Raymond F. Mui
Brian K.Wolahan
Title
Senior Vice Presidentand Portfolio Manager
Senior Vice Presidentand Portfolio Manager
Length of Service with SubadvisoryFirm
Since 1991
Since 1990
Business Experience During Last 5 Years
Senior Vice Presidentand Portfolio Manager
Senior Vice Presidentand Portfolio Manager
Role onManagementTeam
Portfolio Manager
Portfolio Manager
Name ofPortfolioManager
Paul A.Radomski,CPA, CFA
Title
ManagingPartner
Length ofService withSubadvisoryFirm
18 years
BusinessExperienceDuring Last 5Years
RenaissanceInvestmentManagement
Role onManagementTeam
PortfolioManager

SOCIALLY RESPONSIBLE PROSPECTUS – 94
Calvert Small Cap Value and Calvert Mid Cap Value
Channing Capital Management, LLC (Channing), 10 South LaSalle Street, Suite2650, Chicago, IL 60603, has managed both Calvert Small Cap Value and CalvertMid Cap Value since their inception in October 2004.
Michael E.Schroer, CFA
ManagingPartnerand ChiefInvestmentOfficer
21 years RenaissanceInvestmentManagement
PortfolioManager
Name ofPortfolioManager
Eric T.McKissack,CFA
Title
FoundingPrincipal,ChiefExecutiveOfficer
Length ofService withSubadvisoryFirm
2 years
BusinessExperienceDuring Last 5Years
ChanningCapitalManagement(2003-Present);Ariel CapitalManagement,LLC
Role onManagementTeam
PortfolioManager
Wendell E.Mackey, CFA
FoundingPrincipal,Director ofInvestments
2 years ChanningCapitalManagement,(2003-Present);ValenzuelaCapitalPartners, LLC
PortfolioManager

SOCIALLY RESPONSIBLE PROSPECTUS – 95
CSIF Bond
Calvert Asset Management Company, Inc.
Gregory Habeeb and Matt Nottingham, CFA, are the Portfolio Managers forCSIF Bond. Please see the information presented above with respect to Calvert’smanagement of the fixed income investments of CSIF Balanced regarding thesePortfolio Managers’ titles, length of service with Calvert, business experienceduring the last five years and role on the management team.
Each of the Funds has obtained an exemptive order from the SEC to permit theFund, pursuant to approval by the Board of Trustees/Directors, to enter into andmaterially amend contracts with the Fund's Subadvisor without shareholderapproval. See "Investment Advisor and Subadvisor" in the SAI for further details.

SOCIALLY RESPONSIBLE PROSPECTUS – 96
Advisory FeesThe following table shows the aggregate annual advisory fee paid by each Fundfor the most recent fiscal year as a percentage of that Fund’s average daily netassets. This figure is the total of all advisory fees (paid to Calvert) and subadviso-ry fees, if any, paid directly by the Fund. (Subadvisory fees paid by Calvert to aSubadvisor are reflected in the total advisory fees paid by the Fund to Calvert.)Note, the advisory fee does not include any administrative service fees.
Fund Advisory FeeCSIF Balanced 0.422%CSIF Equity 0.50%Calvert Social Index Fund 0.225%CSIF Enhanced Equity 0.50%1
Calvert Large Cap Growth 0.77%2
Calvert Capital Accumulation 0.65%CWVF International Equity 0.74%Calvert New Vision Small Cap 0.75%Calvert Small Cap Value 0.75%Calvert Mid Cap Value 0.65%CSIF Bond 0.35%CSIF Money Market 0.30%
1 Contractual advisory fee is 0.60%; the Advisor voluntarily waived 0.10% of its fee.
2 This includes a 0.45% subadvisory fee the Fund pays directly to the Subadvisor. The Subadvisor may earn
(or have its base fee reduced by) a performance fee adjustment ("Performance Fee"), which shall vary with
the Fund's performance over a "performance period" as compared to a "benchmark index" and will range
from a minimum of -0.25% to a maximum of +0.25% based on the extent to which performance exceeds or
trails the S&P 500 Index. The performance rate adjustment is 5.00% times the difference between the per-
formance of the Fund and that of the benchmark index, except that there is no performance adjustment if
the difference between the Fund performance and the benchmark index performance is less than or equal to
2%. The performance period is the most recent one-year period ending on the last day of the previous
month that the New York Stock Exchange was open for trading. For purposes of calculating the base fee, net
assets are averaged over the most recent month of the rolling one-year period. For purposes of calculating the
performance fee, net assets are averaged over the rolling one-year performance period.
A discussion regarding the basis for the approval by the Board of Trustees/Directors of theFunds of the investment advisory agreement and any applicable subadvisory agreementwith respect to each Fund (except Calvert Small Cap Value and Calvert Mid Cap Value,and except the subadvisory agreements for Calvert Capital Accumulation and CalvertNew Vision Small Cap) is available in the Semi-Annual Report of the applicable Fund forthe six months ended March 31, 2005 or a more recent Semi-Annual Report of suchFund, when available. A discussion regarding the basis for the approval by the Board ofTrustees/Directors of the investment advisory agreement and the subadvisory agreementwith respect to each of Calvert Small Cap Value and Calvert Mid Cap Value, and thebasis for approval by the Trustees/Directors of new investment subadvisory agreementswith respect to each of Calvert Capital Accumulation and Calvert New Vision Small Cap,is available in the respective Annual Report of each of those Funds for the year endedSeptember 30, 2005.
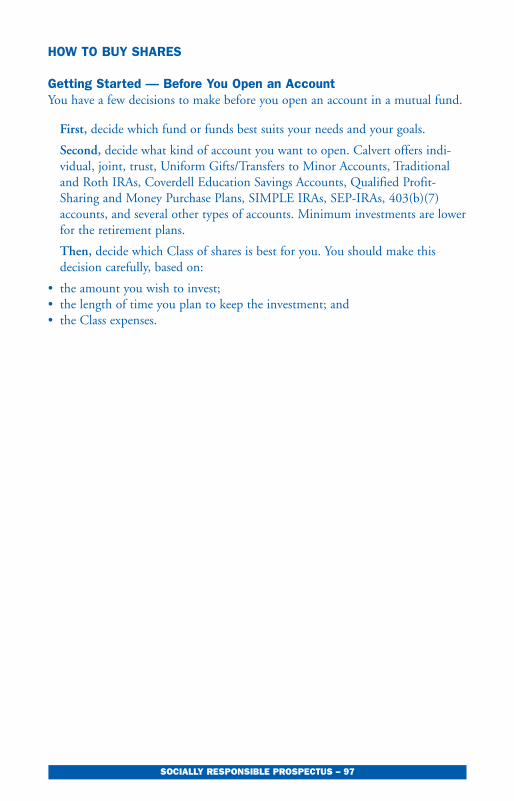
SOCIALLY RESPONSIBLE PROSPECTUS – 97
HOW TO BUY SHARES
Getting Started — Before You Open an AccountYou have a few decisions to make before you open an account in a mutual fund.
First, decide which fund or funds best suits your needs and your goals.
Second, decide what kind of account you want to open. Calvert offers indi-vidual, joint, trust, Uniform Gifts/Transfers to Minor Accounts, Traditionaland Roth IRAs, Coverdell Education Savings Accounts, Qualified Profit-Sharing and Money Purchase Plans, SIMPLE IRAs, SEP-IRAs, 403(b)(7)accounts, and several other types of accounts. Minimum investments are lowerfor the retirement plans.
Then, decide which Class of shares is best for you. You should make thisdecision carefully, based on:
• the amount you wish to invest;• the length of time you plan to keep the investment; and• the Class expenses.
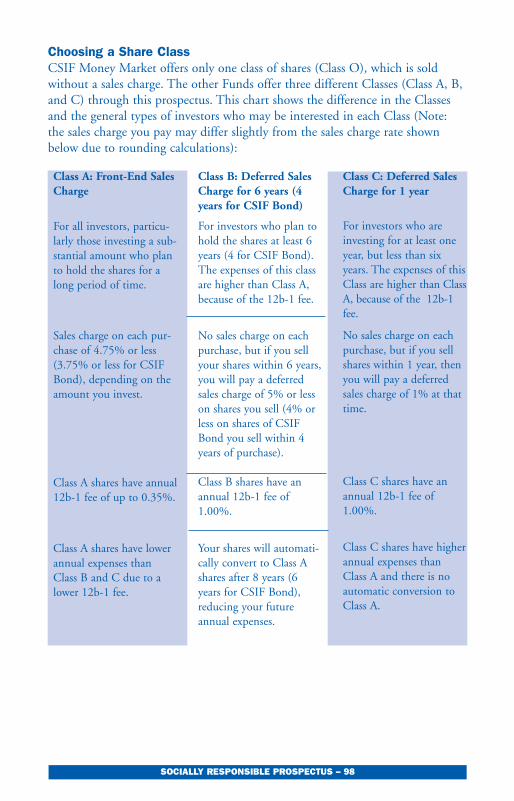
SOCIALLY RESPONSIBLE PROSPECTUS – 98
Choosing a Share ClassCSIF Money Market offers only one class of shares (Class O), which is soldwithout a sales charge. The other Funds offer three different Classes (Class A, B,and C) through this prospectus. This chart shows the difference in the Classesand the general types of investors who may be interested in each Class (Note:the sales charge you pay may differ slightly from the sales charge rate shownbelow due to rounding calculations):
Class A: Front-End SalesCharge
For all investors, particu-larly those investing a sub-stantial amount who planto hold the shares for along period of time.
Sales charge on each pur-chase of 4.75% or less(3.75% or less for CSIFBond), depending on theamount you invest.
Class A shares have annual12b-1 fee of up to 0.35%.
Class A shares have lowerannual expenses thanClass B and C due to alower 12b-1 fee.
Class B: Deferred SalesCharge for 6 years (4years for CSIF Bond)
For investors who plan tohold the shares at least 6years (4 for CSIF Bond).The expenses of this classare higher than Class A,because of the 12b-1 fee.
No sales charge on eachpurchase, but if you sellyour shares within 6 years,you will pay a deferredsales charge of 5% or lesson shares you sell (4% orless on shares of CSIFBond you sell within 4years of purchase).
Class B shares have anannual 12b-1 fee of1.00%.
Your shares will automati-cally convert to Class Ashares after 8 years (6years for CSIF Bond),reducing your futureannual expenses.
Class C: Deferred SalesCharge for 1 year
For investors who areinvesting for at least oneyear, but less than sixyears. The expenses of thisClass are higher than ClassA, because of the 12b-1fee.
No sales charge on eachpurchase, but if you sellshares within 1 year, thenyou will pay a deferredsales charge of 1% at thattime.
Class C shares have anannual 12b-1 fee of1.00%.
Class C shares have higherannual expenses thanClass A and there is noautomatic conversion toClass A.

SOCIALLY RESPONSIBLE PROSPECTUS – 99
CSIF Balanced, Equity,Enhanced Equity;Calvert Capital AccumulationCWVF International EquityCalvert New Vision Small CapCalvert Social Index FundCalvert Large Cap GrowthCalvert Small Cap ValueCalvert Mid Cap Value
CSIF Bond
Once the total balance of your existing Class B holdings of Calvert’s fundsreaches or exceeds $100,000, you should make future investments in Class A orClass C shares, rather than Class B, since you will qualify for Class A sales loadbreakpoints/discount.
When the total balance of your existing Class C holdings of Calvert’s fundsreaches or exceeds $500,000 you should make future investments in Class AShares since you will qualify to purchase Class A Shares at a reduced sales load.
Class AIf you choose Class A, you will pay a sales charge at the time of each purchase.Shares acquired through reinvestment of dividends or capital gain distributionsare not subject to an initial sales charge. This table shows the charges both as apercentage of offering price and as a percentage of the amount you invest. Theterm “offering price” includes the front-end sales charge. If you invest more, thepercentage rate of sales charge will be lower. For example, if you invest morethan $50,000 in CSIF Balanced, or if your cumulative purchases or the value inyour account is more than $50,000,4 then the sales charge is reduced to 3.75%.
Your investment in Sales Charge % % of Amt. Sales Charge % % of Amt.Class A shares of offering price Invested of offering price Invested
Less than $50,000 4.75% 4.99% 3.75% 3.90%$50,000 but less than $100,000 3.75% 3.90% 3.00% 3.09%$100,000 but less than $250,000 2.75% 2.83% 2.25% 2.30%$250,000 but less than $500,000 1.75% 1.78% 1.75% 1.78%$500,000 but less than $1,000,000 1.00% 1.01% 1.00% 1.01%$1,000,000 and over None5 None5 None5 None5
4 This is called “Rights of Accumulation.” The sales charge is calculated by taking into account notonly the dollar amount of the new purchase of shares, but also the current value of shares youhave previously purchased in Calvert Funds that impose sales charges.
5 Purchases of Class A shares at NAV for accounts with $1,000,000 or more on which a finder’s feehas been paid by Calvert Distributors, Inc. are subject to a one-year CDSC of 0.80%. See the“Calculation of Contingent Deferred Sales Charge and Waiver of Sales Charges.”
The Class A front-end sales charge may be waived for certain purchases orinvestors, such as participants in certain group retirement plans or other quali-fied groups and clients of certain investment advisers.

SOCIALLY RESPONSIBLE PROSPECTUS – 100
Class BIf you choose Class B, there is no front-end sales charge like Class A, but if yousell the shares within the first 6 years (or 4 years for CSIF Bond), you will haveto pay a “contingent deferred” sales charge (“CDSC”). This means that you donot have to pay the sales charge unless you sell your shares within the first 6years after purchase (or 4 years for CSIF Bond). Keep in mind that the longeryou hold the shares, the less you will have to pay in deferred sales charges. Sharesacquired through reinvestment of dividends or capital gain distributions are notsubject to a contingent deferred sales charge.
Time Since Purchase CDSC CDSC1st year 5% 4%2nd year 4% 3%3rd year 4% 2%4th year 3% 1%5th year 2% None6th year 1% NoneAfter 6 years None None
* The following schedule applies to Class B shareholders of CSIF Equity whoacquired their shares pursuant to the reorganization of the Delaware SocialAwareness Fund: 4.00% during the first year, 3.25% during the second year,2.75% during the third year, 2.25% during the fourth and fifth years, 1.50%during the sixth year and 0% thereafter.
CSIF Balanced, Equity*, Enhanced Equity; Calvert Capital AccumulationCWVF International EquityCalvert New Vision Small Cap;Calvert Social Index FundCalvert Large Cap GrowthCalvert Small Cap ValueCalvert Mid Cap Value
CSIF Bond

SOCIALLY RESPONSIBLE PROSPECTUS – 101
Calculation of Contingent Deferred Sales Charge and Waiver of Sales Charges
The CDSC will not be charged on shares you received as dividends or from capitalgains distributions or on any capital appreciation (gain in the value) of shares that aresold.
Shares that are not subject to the CDSC will be redeemed first, followed byshares you have held the longest. The CDSC is calculated by determining theshare value at both the time of purchase and redemption and then multiplyingwhichever value is less by the percentage that applies as shown above. For exam-ple, if you invested $5,000 in CSIF Equity Class B shares three years ago, andyour investment is now worth $5,750, the CDSC will be calculated by takingthe lesser of the two values ($5,000), and multiplying it by 4%, for a CDSC of$200. If you choose to sell only part of your shares, the capital appreciation forthose shares only is included in the calculation, rather than the capital apprecia-tion for the entire account.
The CDSC on Class B Shares will be waived in the following circumstances:
• Redemption upon the death or disability of the shareholder, plan participant,or beneficiary. “Disability” means a total disability as evidenced by a determi-nation by the U.S. Social Security Administration.
• Minimum required distributions from retirement plan accounts for sharehold-ers 70 1/2 and older. The maximum amount subject to this waiver is basedonly upon the shareholder’s Calvert retirement accounts.
• The return of an excess contribution or deferral amounts, pursuant to sections408(d)(4) or (5), 401(k)(8), 402(g)(2), or 401(m)(6) of the Internal RevenueCode (“Code”) of 1986, as amended.
• Involuntary redemptions of accounts under procedures set forth by the Fund’sBoard of Trustees/Directors.
• A single annual withdrawal under a systematic withdrawal plan of up to 10% peryear of the shareholder’s account balance, but no sooner than nine months frompurchase date or within 30 days of a redemption.This systematic withdrawal planrequires a minimum account balance of $50,000 to be established.
• If the selling broker/dealer has an agreement with Calvert Distributors, Inc.(“CDI”), the Funds’ distributor, to sell such shares for omnibus retirementaccount platforms and without a CDSC upon the redemption of the shares.(For more information on the agreement, see Exhibit A, Service Fees andArrangements with Broker/Dealers.) Ask your broker/dealer if this waiverapplies to you (generally, applicable only to 401(k) and 403(b) platforms).
NOTE: Class B shares may not always present the most cost efficient option toshareholders in comparison with Class A shares. Consider the classes of shares carefully to determine which Class is most suitable for you.
SOCIALLY RESPONSIBLE PROSPECTUS – 102
Class CIf you choose Class C, there is no front-end sales charge like Class A, but if yousell the shares within the first year, you will have to pay a 1% CDSC. Sharesacquired through reinvestment of dividends or capital gain distributions are notsubject to a contingent deferred sales charge. Class C may be a good choice foryou if you plan to buy shares and hold them for at least 1 year, but not morethan five or six years.
The CDSC on Class C Shares will be waived if the shares were sold by a bro-ker/dealer that has an agreement with CDI to sell such shares for omnibusretirement account platforms and without a CDSC upon the redemption of theshares. (For more information on the agreement, see Exhibit A, “Service Feesand Arrangements with Broker/Dealers.”) Ask your broker/dealer if this CDSCwaiver applies to you (generally, applicable only to 401(k) and 403(b) plat-forms).
Reduced Sales ChargesYou may qualify for a reduced sales charge (sales load breakpoints/discount)through several purchase plans available. You must notify your broker/dealer orthe Fund at the time of purchase to take advantage of the reduced sales charge.If you do not let your broker/dealer or Fund know that you are eligible for areduction, you may not receive a reduced sales charge to which you are other-wise entitled. In order to determine your eligibility to receive a reduced salescharge, it may be necessary for you to provide your broker/dealer or Fund withinformation and records (including account statements) of all relevant accountsinvested in Calvert Funds. Information regarding sales load breakpoints/dis-counts is available on Calvert’s website at www.calvert.com.
Rights of Accumulation can be applied to several accountsIn determining the applicable Class A sales load breakpoints/discount you may takeinto account the current value of your existing holdings of any class of Calvert’s non-money market funds, including shares held by your family group or other qualifiedgroup* and through your retirement plan(s). In order to determine your eligibility toreceive a sales charge discount, it may be necessary for you to provide yourbroker/dealer or Fund with information and records (including account statements)of all relevant accounts invested in Calvert Funds. Shares could then be purchased atthe reduced sales charge which applies to the entire group; that is, the current valueof shares previously purchased and currently held by all the members of the group.
* A “family group” includes a spouse, parent, stepparent, grandparent, child, stepchild, grandchild,sibling, father-in-law, mother-in-law, brother-in-law, or sister-in-law, including trusts and estates onwhich such persons are signatories.
SOCIALLY RESPONSIBLE PROSPECTUS – 103
Statement of IntentionYou may reduce your Class A sales charge by establishing a statement of inten-tion (“Statement”). A Statement allows you to combine all Calvert Funds(excluding money market funds) purchases of all share classes you intend tomake over a 13-month period to determine the applicable sales charge. At yourrequest, purchases made during the previous 90 days may be included.
A portion of your account will be held in escrow to cover additional Class Asales charges that may be due if your total investments over the 13-month peri-od do not qualify for the applicable sales charge reduction. In this regard, sharesequal to 5% of the dollar amount specified in the Statement will be held inescrow in shares (computed to the nearest full share) of the Fund by the TransferAgent. All dividends and any capital gains distribution on the escrowed shareswill be credited to your account.
If the total minimum investment specified under the Statement is completedwithin a thirteen-month period, escrowed shares will be promptly released toyou. However, shares disposed of prior to completion of the purchase require-ment under the Statement will be deducted from the amount required to com-plete the investment commitment.
Upon expiration of the Statement period, if the total purchases pursuant to theStatement are less than the amount specified in the Statement as the intendedaggregate purchases, Calvert Distributors, Inc. ("CDI") will debit the differencebetween the lower sales charge you paid and the dollar amount of sales chargeswhich you would have paid if the total amount purchased had been made at asingle time from your account. Full shares, if any, remaining in escrow after theaforementioned adjustment will be released and, upon request, remitted to you.
The Statement may be revised upward at any time during the Statement period, andsuch a revision will be treated as a new Statement, except that the Statement periodduring which the purchase must be made will remain unchanged and there will be noretroactive reduction of the sales charges paid on prior purchases.
Your first purchase of shares at a reduced sales charge under a Statement indi-cates acceptance of these terms.
Retirement Plans Under Section 457, Section 403(b)(7), or Section 401(k)There is no sales charge on shares purchased for the benefit of a retirement planunder section 457 of the Internal Revenue Code of 1986, as amended (“Code”).There is no sales charge on shares purchased for the benefit of a retirement planqualifying under section 403(b) or 401(k) of the Code if, at the time of pur-chase: (i) Calvert has been notified in writing that the 403(b) or 401(k) plan hasat least 300 eligible employees and is not sponsored by a K-12 school district; or

SOCIALLY RESPONSIBLE PROSPECTUS – 104
(ii) the cost or current value of shares a 401(k) plan has in Calvert Funds (exceptmoney market funds) is at least $1 million.
Neither the Funds, nor CDI, nor any affiliate thereof will reimburse a plan or partici-pant for any sales charges paid prior to receipt and confirmation by CDI of suchrequired written communication. Plan administrators should send requests for thewaiver of sales charges based on the above conditions to: Calvert Retirement Plans,4550 Montgomery Avenue, Suite 1000N, Bethesda, Maryland 20814.
College Savings Plans under Section 529There is no sales charge on shares purchased for the D.C. College Savings Planif, at the time of purchase, the owner of the savings plan account is (i) a Districtof Columbia resident, or (ii) a participant in payroll deduction to the D.C.College Savings Plan of a business with at least 300 employees.
There is no sales charge imposed by Calvert on shares purchased by DelawareInvestments for its omnibus account established for the Pennsylvania TAP 529Investment Plan.
Other CircumstancesThere is no sales charge on shares of any Calvert Fund sold to or constituting the follow-ing:
• current or retired Directors, Trustees, or Officers of the Calvert Funds or Calvert and its affiliates; employees of Calvert and its affiliates; or their family members;
• Directors, officers, and employees of any subadvisor for the Calvert Family of Funds, employees of broker/dealers distributing the Fund's shares and immediate family members of the subadvisor, or broker/dealer; (iii) purchases made through a Registered Investment Advisor;
• trust departments of banks or savings institutions for trust clients of such bank orinstitution, and
• purchases through a broker/dealer maintaining an omnibus account with a Fund, provided the purchases are made by: (a) investment advisors or financial planners placing trades for their own accounts (or the accounts of their clients) and who charge a management, consulting, or other fee for their services; (b) clients of such investment advisors or financial planners who place trades for their own accounts if such accounts are linked to the master account of such investment advisor or financial planner on the books and records of the broker/dealer or agent; or (c) retirement and deferred compensation plans and trusts, including, but not limited to, those defined in section 401(a) or section 403(b) of the Code,and "rabbi trusts."
Established AccountsShares of CSIF Balanced may be sold at net asset value to you if your accountwas established on or before July 17, 1986.

SOCIALLY RESPONSIBLE PROSPECTUS – 105
Dividends and Capital Gain Distributions from other Calvert FundsYou may prearrange to have your dividends and capital gain distributions fromanother Calvert Fund automatically invested in another Calvert Fund accountwith no additional sales charge.
Purchases made at NAVExcept for money market funds, if you make a purchase at NAV, you mayexchange that amount to another Calvert Fund at no additional sales charge.
Reinstatement PrivilegeIf you redeem Class A or B shares and then within 90 days decide to reinvest inany Calvert Fund, you may reinvest in Class A of the Fund at the net asset valuenext computed after the reinvestment order is received, without a sales charge.Proceeds from Class B share redemptions where a contingent deferred salescharge was charged will be reinvested in Class A shares. In order to take advan-tage of this privilege, you must notify the Fund or broker/dealer at the time ofthe repurchase. Each Fund reserves the right to modify or eliminate this privi-lege.
A "qualified group" is one which:
1. has been in existence for more than six months, and2. has a purpose other than acquiring shares at a discount, and3. satisfies uniform criteria which enable CDI and broker/dealers offering shares to realize economies of scale in distributing such shares.
A qualified group must have more than 10 members, must be available to arrange for group meet-ings between representatives of CDI or broker/dealers distributing shares, must agree to include salesand other materials related to the Funds in its publications and mailings to members at reduced orno cost to CDI or broker/dealers.
Distribution and Service FeesEach Fund has adopted a plan under Rule 12b-1 of the Investment CompanyAct of 1940 that allows the Fund to pay distribution fees for the sale and distri-bution of its shares. The distribution plan also pays service fees to persons (suchas your financial professional) for services provided to shareholders. See“Method of Distribution” in the SAI for further discussion of these services.Because these fees are paid out of a Fund’s assets on an ongoing basis, over time,these fees will increase the cost of your investment and may cost you more thanpaying other types of sales charges. Please see Exhibit A for more service fee andother information regarding arrangements with broker/dealers.
The table below shows the maximum annual percentage payable under the dis-tribution plan, and the amount actually paid by each Fund for the most recentfiscal year. The fees are based on average daily net assets by particular Class.
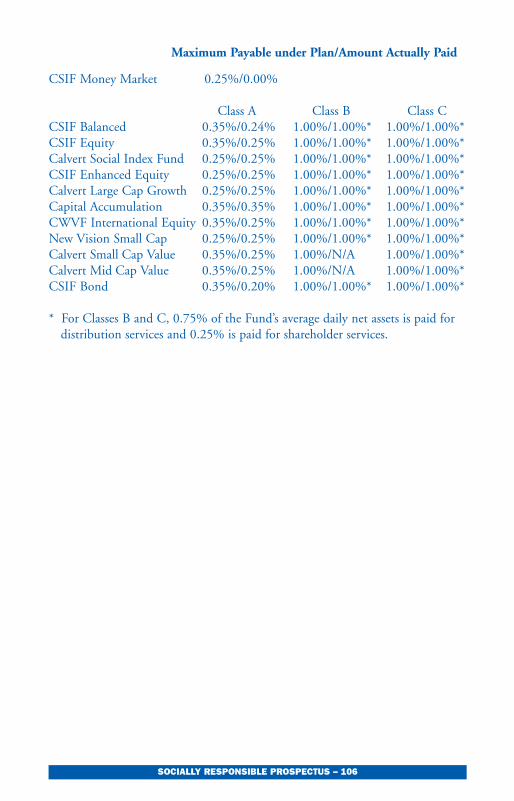
SOCIALLY RESPONSIBLE PROSPECTUS – 106
Maximum Payable under Plan/Amount Actually Paid
CSIF Money Market 0.25%/0.00%
Class A Class B Class CCSIF Balanced 0.35%/0.24% 1.00%/1.00%* 1.00%/1.00%*CSIF Equity 0.35%/0.25% 1.00%/1.00%* 1.00%/1.00%*Calvert Social Index Fund 0.25%/0.25% 1.00%/1.00%* 1.00%/1.00%*CSIF Enhanced Equity 0.25%/0.25% 1.00%/1.00%* 1.00%/1.00%*Calvert Large Cap Growth 0.25%/0.25% 1.00%/1.00%* 1.00%/1.00%*Capital Accumulation 0.35%/0.35% 1.00%/1.00%* 1.00%/1.00%*CWVF International Equity 0.35%/0.25% 1.00%/1.00%* 1.00%/1.00%*New Vision Small Cap 0.25%/0.25% 1.00%/1.00%* 1.00%/1.00%*Calvert Small Cap Value 0.35%/0.25% 1.00%/N/A 1.00%/1.00%*Calvert Mid Cap Value 0.35%/0.25% 1.00%/N/A 1.00%/1.00%*CSIF Bond 0.35%/0.20% 1.00%/1.00%* 1.00%/1.00%*
* For Classes B and C, 0.75% of the Fund’s average daily net assets is paid fordistribution services and 0.25% is paid for shareholder services.

SOCIALLY RESPONSIBLE PROSPECTUS – 107
Next Step – Account ApplicationComplete and sign an application for each new account. When multiple classesof shares are offered, please specify which class you wish to purchase. For moreinformation, contact your financial professional or our shareholder servicesdepartment at 800-368-2748.
Minimum To Open an AccountCSIF Balanced $1,000CSIF Equity $1,000CSIF Bond $1,000CSIF Money Market $1,000Calvert Small Cap Value $1,000Calvert Mid Cap Value $1,000
Calvert Large Cap Growth $2,000CWVF International Equity $2,000Capital Accumulation $2,000New Vision Small Cap $2,000
CSIF Enhanced Equity $5,000Calvert Social Index Fund $5,000 ($2,000 for IRAs)
Minimum additional investments$250; The Funds may charge a $2 service fee on purchases of less than $250. A Fund may waive minimums and any applicable service fees for initial and subsequent purchases for investors who purchase shares through certain omnibus accounts.
Please make your check payable to the Fund and mail it to:
New Accounts Subsequent investments(include application): (include investment slip):Calvert CalvertP.O. Box 219544 P.O. Box 219739Kansas City, MO 64121-9544 Kansas City, MO 64121-9739
By Registered, CalvertCertified, or c/o BFDSOvernight Mail 330 West 9th Street
Kansas City, MO 64105-1807
Federal regulations require all financial institutions to obtain, verify and recordinformation that identifies each person who opens an account. Each Fundrequires your name, date of birth, residential street address or principal place of

SOCIALLY RESPONSIBLE PROSPECTUS – 108
business, social security number, employer identification number or other gov-ernmental issued identification when you open an account in order to verifyyour identity. A Fund may place limits on account transactions while it is in theprocess of attempting to verify your identity. If the Fund is unable to verifyyour identity, the Fund may be required to redeem your shares and close youraccount.
IMPORTANT – HOW SHARES ARE PRICEDThe price of shares is based on each Fund’s net asset value (“NAV”). NAV iscomputed by adding the value of a Fund’s securities holdings plus other assets,subtracting liabilities, and then dividing the result by the number of shares out-standing. If a Fund has more than one class of shares, the NAV of each class willbe different, depending on the number of shares outstanding for each class.
Generally, portfolio securities and other assets are valued based on market quota-tions, except that all securities held by CSIF Money Market are valued accordingto the “amortized cost” method, which is intended to stabilize the NAV at $1per share. Debt securities are valued utilizing the average of bid prices or at bidprices based on a matrix system (which considers such factors as security prices,yields, maturities and ratings) furnished by dealers through an independent pric-ing service. Debt securities that will mature in 60 days or less are valued atamortized cost, which approximates fair value.
The Advisor determines when a market quotation is not readily available or reli-able for a particular security. Investments for which market quotations are notreadily available or reliable are fair valued by a fair value team consisting of offi-cers of a Fund and of the Advisor, as determined in good faith under consistent-ly applied procedures under the general supervision of the Board ofTrustees/Directors. No single standard exists for determining fair value, whichdepends on the circumstances of each investment, but in general fair value isdeemed to be the amount an owner might reasonably expect to receive for asecurity upon its current sale.
In making a fair value determination, a Board generally considers a variety ofqualitative and quantitative factors relevant to the particular security or type ofsecurity. These factors are subject to change over time and are reviewed periodi-cally to ascertain whether there are changes in the particular circumstancesaffecting an investment which may warrant a change in either the valuationmethodology for the investment, or the fair value derived from that methodolo-gy, or both. The general factors considered typically include for example, funda-mental analytical data relating to the investment, the nature and duration ofrestrictions, if any, on the security, and the forces that influence the market inwhich the security is purchased and sold, as well as the type of security, the sizeof the holding and numerous other specific factors. Foreign securities are valued

SOCIALLY RESPONSIBLE PROSPECTUS – 109
based on quotations from the principal market in which such securities are nor-mally traded. If events occur after the close of the principal market in which secu-rities are traded, and before the close of business of the Fund, that are expected tomaterially affect the value of those securities, then they are valued at their fairvalue taking these events into account.
For assistance in making fair value determinations, the Board of CWVFInternational Equity has retained a third-party fair value pricing service to quantita-tively value holdings of the Fund that trade on foreign exchanges. From time totime, market moves in the U.S. subsequent to the close of those local markets butprior to the Fund’s official pricing time of 4 p.m. Eastern Time may cause thoselocal market prices to not be representative of what a reasonable investor would payfor those securities. Factors that may influence this process include changes in U.S.market index values, price movements in futures contracts based on foreign mar-kets that trade in the U.S., and changes in industry or economic sector indices. Inthe event of such market movements in excess of specified parameters, the Fund’sservice providers quantitatively estimate the fair value of each affected security.
The values assigned to fair value investments are based on available informationand do not necessarily represent amounts that might ultimately be realized.Further, because of the inherent uncertainty of valuation, the fair values maydiffer significantly from the value that would have been used had a ready marketfor the investment existed, and these differences could be material.
The NAV is calculated as of the close of each business day, which coincides withthe closing of the regular session of the New York Stock Exchange (“NYSE”)(generally 4 p.m. ET). Each Fund is open for business each day the NYSE isopen. Please note that there are some federal holidays, however, such asColumbus Day and Veterans Day, when the NYSE is open and the Fund isopen but federal wires and check purchases cannot be received because thebanks and post offices are closed.
Some Funds hold securities that are primarily listed on foreign exchanges thattrade on days when the NYSE is closed. These Funds do not price shares ondays when the NYSE is closed, even if foreign markets may be open. As a result,the value of the Fund’s shares may change on days when you will not be able tobuy or sell your shares.
WHEN YOUR ACCOUNT WILL BE CREDITEDYour purchase will be processed at the next NAV calculated after your order isreceived and in good order, as defined below. All of your purchases must bemade in U.S. dollars. No cash or third-party checks will be accepted. No creditcard or credit loan checks will be accepted. Each Fund reserves the right to sus-pend the offering of shares for a period of time or to reject any specific purchase

SOCIALLY RESPONSIBLE PROSPECTUS – 110
order. All purchase orders must be sent to the Transfer Agent; however, as a con-venience, check purchases received at Calvert’s office in Bethesda, Maryland, willbe sent by overnight delivery to the Transfer Agent and will be credited the nextbusiness day upon receipt. Any check purchase received without an investmentslip may cause delayed crediting. Any purchase less than the $250 minimum forsubsequent investments may be charged a service fee of $2. If your check doesnot clear your bank, your purchase will be canceled and you will be charged a$25 fee plus any costs incurred. All purchases will be confirmed and credited toyour account in full and fractional shares (rounded to the nearest 1/1000th of ashare). See “Request in ‘Good Order’.”
CSIF Money MarketYour purchase will be credited at the net asset value calculated after your order isreceived and accepted. If the Transfer Agent receives your wire purchase by 5p.m. ET, your account will begin earning dividends on the next business day.Exchanges begin earning dividends the next business day after the exchangerequest is received by mail or telephone. Purchases received by check will beginearning dividends the next business day after they are credited to the account.
OTHER CALVERT FEATURES / POLICIES
Calvert Information NetworkFor 24 hour performance and account information call 800-368-2745 or visit www.calvert.comYou can obtain current performance and pricing information, verify accountbalances, and authorize certain transactions with the convenience of one phonecall, 24 hours a day.
Note: The information on our website is not incorporated by reference into thisprospectus; our website address is included as an inactive textual reference only.
Account ServicesBy signing up for services when you open your account, you avoid having toobtain a signature guarantee. If you wish to add services at a later date, theFunds require a signature guarantee to verify your signature, which may beobtained from any bank, trust company and savings and loan association, creditunion, broker-dealer firm or member of a domestic stock exchange. A notarypublic cannot provide a signature guarantee.
Calvert Money ControllerCalvert Money Controller allows you to purchase or sell shares by electronicfunds transfer without the time delay of mailing a check or the added expense ofa wire. Use this service to transfer up to $300,000 electronically. Allow one ortwo business days after you place your request for the transfer to take place.Money transferred to purchase new shares will be subject to a hold of up to 10

SOCIALLY RESPONSIBLE PROSPECTUS – 111
business days before redemption requests are honored. Transaction requestsmust be received by 4 p.m. ET. You may request this service on your initialaccount application. Calvert Money Controller transactions returned for insuf-ficient funds will incur a $25 charge.
Telephone TransactionsYou may purchase, redeem, or exchange shares, wire funds and use CalvertMoney Controller by telephone if you have pre-authorized service instructions.You receive telephone privileges automatically when you open your accountunless you elect otherwise. For our mutual protection, the Funds, the sharehold-er servicing agent and their affiliates use precautions such as verifying sharehold-er identity and recording telephone calls to confirm instructions given by phone.A confirmation statement is sent for these transactions; please review this state-ment and verify the accuracy of your transaction immediately.
ExchangesCalvert offers a wide variety of investment options that include common stockfunds, tax-exempt and corporate bond funds, and money market funds (callyour broker/dealer or Calvert representative for more information). We make iteasy for you to purchase shares in other Calvert Funds if your investment goalschange. The exchange privilege offers flexibility by allowing you to exchangeshares on which you have already paid a sales charge from one mutual fund toanother at no additional charge.
Complete and sign an account application, taking care to register your newaccount in the same name and taxpayer identification number as your existingCalvert account(s). Exchange instructions may then be given by telephone if tele-phone redemptions have been authorized and the shares are not in certificateform.
Before you make an exchange, please note the following:Each exchange represents the sale of shares of one Fund and the purchase ofshares of another. Therefore, you could realize a taxable gain or loss.
You may exchange shares acquired by reinvestment of dividends or distributionsinto another Calvert Fund at no additional charge.
Shares may only be exchanged for shares of the same class of another CalvertFund.
No CDSC is imposed on exchanges of shares subject to a CDSC at the time ofthe exchange. The applicable CDSC is imposed at the time the shares acquiredby the exchange are redeemed.

SOCIALLY RESPONSIBLE PROSPECTUS – 112
Exchange requests will not be accepted on any day when Calvert is open but theFund’s custodian bank is closed (e.g., Columbus Day and Veteran’s Day); theseexchange requests will be processed the next day the Fund’s custodian bank isopen.
Each Fund reserves the right to terminate or modify the exchange privilege with60 days’ written notice.
Market Timing PolicyIn general, the Funds are designed for long-term investment and not as frequentor short-term trading (“market timing”) vehicles. The Funds discourage frequentpurchases and redemptions of fund shares by fund shareholders. Further, theFunds do not accommodate frequent purchases and redemptions of fund sharesby fund shareholders. Accordingly, each Fund’s Board of Trustees/Directors hasadopted policies and procedures in an effort to detect and prevent market timingin the Fund. The Funds believe that market timing activity is not in the bestinterest of shareholders. Market timing can be disruptive to the portfolio man-agement process and may adversely impact the ability of the Advisor andSubadvisor(s) to implement a Fund’s investment strategies. In addition, markettiming can disrupt the management of a Fund and raise its expenses through:increased trading and transaction costs; forced and unplanned portfolioturnover; time-zone arbitration for securities traded on foreign markets; andlarge asset swings that decrease a Fund’s ability to provide maximum investmentreturn to all shareholders. This in turn can have an adverse effect on Fund per-formance. In addition to seeking to limit market timing by imposition ofredemption fees, a Fund or Calvert at its discretion may reject any purchase orexchange request it believes to be market timing.
As stated under “How to Sell Shares” in this prospectus, retirement planomnibus accounts maintained by a retirement plan service provider that (1) doesnot have the systematic capability of assessing the redemption fee at the individ-ual or participant account level or (2) implements its own policies and proce-dures to detect and prevent market timing that are acceptable to the Fund'sBoard of Trustees/Directors, are exempt from the redemption fee. If a significantpercentage of a Fund’s shareholder accounts are held through retirement planomnibus accounts that are not subject to the redemption fee, then the Fundwould be more susceptible to the risks of market timing activity in the Fund.Even if a retirement plan omnibus account is exempt from the redemption fee, ifa Fund or its Transfer Agent or shareholder servicing agent suspects there is mar-ket timing activity in the account, Calvert will seek full cooperation from theservice provider maintaining the account to identify the underlying participant.Calvert expects the service provider to take immediate action to stop any furthermarket timing activity in the Fund by such participant(s) or plan, or else theFund will be withdrawn as an investment option for that account.

SOCIALLY RESPONSIBLE PROSPECTUS – 113
There is no guarantee that Calvert will detect or prevent market timing activity.
Note: This Market Timing Policy does not apply to CSIF Money Market.
Each Fund and CDI reserve the right at any time to reject or cancel any part ofany purchase or exchange order (purchase side only). Orders are canceled withinone business day, and the purchase price is returned to the investor. Each Fundand CDI also may: modify any terms or conditions of purchase of shares of anyFund (upon prior notice); or withdraw all or any part of the offering made bythis prospectus.
Electronic Delivery of Prospectuses and Shareholder ReportsYou may request to receive electronic delivery of Fund prospectuses and annualand semi-annual reports.
Combined General Mailings (Householding)Multiple accounts with the same social security number will receive one mailingper household of information such as prospectuses and semi-annual and annualreports. Call customer service at 800-368-2745 to request further grouping ofaccounts to receive fewer mailings, or to request that each account still receive aseparate mailing. Separate statements will be generated for each separate accountand will be mailed in one envelope for each combination above.
Special Services and ChargesEach Fund pays for shareholder services but not for special services that arerequired by a few shareholders, such as a request for a historical transcript of anaccount or a stop payment on a draft. You may be required to pay a fee for thesespecial services; for example, the fee for stop payments is $25. CSIF MoneyMarket will charge a service fee of $25 for drafts returned for insufficient oruncollected funds.
If you are purchasing shares through a program of services offered by abroker/dealer or other financial institution, you should read the program materi-als together with this prospectus. Certain features may be modified in theseprograms. Investors may be charged a fee if they effect transactions in Fundshares through a broker/dealer or other agent.
Minimum Account Balance / Low Balance FeePlease maintain a balance in each of your Fund accounts of at least $1,000 perclass ($5,000 for CSIF Enhanced Equity and Calvert Social Index Fund). If thebalance in your account falls below the minimum during a month, a low balancefee will be charged to your account (CSIF Money Market, $3/month; CSIFEnhanced Equity, Calvert Large Cap Growth and Calvert Social Index Fund$15/year).

SOCIALLY RESPONSIBLE PROSPECTUS – 114
If the balance in your account falls below the minimum during a month, theaccount may be closed and the proceeds mailed to the address of record. You willreceive notice that your account is below the minimum and will be closed if thebalance is not brought up to the required minimum within 30 days.
DIVIDENDS, CAPITAL GAINS, AND TAXESEach Fund pays dividends from its net investment income as shown below. Netinvestment income consists of interest income and dividends declared and paidon investments, less expenses. Distributions of net short-term capital gains(treated as dividends for tax purposes) and net long-term capital gains, if any, arenormally paid once a year; however, the Funds do not anticipate making anysuch distributions unless available capital loss carryovers have been used or haveexpired. Dividend and distribution payments will vary between classes.
CSIF Money Market Accrued daily, paid monthlyCSIF Bond Paid monthlyCSIF Balanced Paid quarterlyCSIF Equity Paid annuallyCalvert Social Index Fund Paid annuallyCSIF Enhanced Equity Paid annuallyCalvert Large Cap Growth Paid annuallyCapital Accumulation Paid annuallyCWVF International Equity Paid annuallyNew Vision Small Cap Paid annuallyCalvert Small Cap Value Paid annuallyCalvert Mid Cap Value Paid annually
Dividend Payment OptionsDividends and any distributions are automatically reinvested in the same Fundat NAV (without sales charge), unless you elect to have amounts of $10 or morepaid in cash (by check or by Calvert Money Controller). Dividends and distribu-tions from any Calvert Fund may be automatically invested in an identically reg-istered account in any other Calvert Fund at NAV. If reinvested in the sameaccount, new shares will be purchased at NAV on the reinvestment date, whichis generally 1 to 3 days prior to the payment date. You must notify a Fund inwriting to change your payment options. If you elect to have dividends and/ordistributions paid in cash, and the U.S. Postal Service returns the check as unde-liverable, it, as well as future dividends and distributions, will be reinvested inadditional shares. No dividends will accrue on amounts represented by uncasheddistribution or redemption checks.
Buying a Dividend (Not Applicable to Money Market Funds)At the time of purchase, the share price of each class may reflect undistributedincome, capital gains or unrealized appreciation of securities. Any income or

SOCIALLY RESPONSIBLE PROSPECTUS – 115
capital gains from these amounts which are later distributed to you are fully tax-able. On the record date for a distribution, share value is reduced by the amountof the distribution. If you buy shares just before the record date (“buying a divi-dend”), you will pay the full price for the shares and then receive a portion ofthe price back as a taxable distribution.
Federal TaxesIn January, your Fund will mail Form 1099-DIV indicating the federal tax statusof dividends and any capital gain distributions paid to you during the past year.Generally, dividends and distributions are taxable in the year they are paid.However, any dividends and distributions paid in January but declared duringthe prior three months are taxable in the year declared. Dividends and distribu-tions are taxable to you regardless of whether they are taken in cash or reinvest-ed. Dividends, including short-term capital gains, are taxable as ordinaryincome. Distributions from long-term capital gains are taxable as long-term capi-tal gains, regardless of how long you have owned shares.
For Non-Money Market FundsYou may realize a capital gain or loss when you sell or exchange shares. This cap-ital gain or loss will be short- or long-term, depending on how long you haveowned the shares which were sold. In January, the Funds whose shares you havesold or exchanged in the past year will mail Form 1099-B indicating the totalamount of all such sales, including exchanges. You should keep your annualyear-end account statements to determine the cost (basis) of the shares to reporton your tax returns.
Other Tax InformationIn addition to federal taxes, you may be subject to state or local taxes on yourinvestment, depending on the laws in your area. You will be notified to theextent, if any, that dividends reflect interest received from U.S. Governmentsecurities. Such dividends may be exempt from certain state income taxes. If youinvest in CWVF International Equity, you may receive additonal informationregarding foreign source income and foreign taxes to assist in your calculation offoreign tax credits.
Taxpayer Identification NumberIf we do not have your correct Social Security or Taxpayer IdentificationNumber (“TIN”) and a signed certified application or Form W-9, Federal lawrequires us to withhold 28% of your reportable dividends, and possibly 28% ofcertain redemptions. In addition, you may be subject to a fine by the InternalRevenue Service. You will also be prohibited from opening another account byexchange. If this TIN information is not received within 60 days after youraccount is established, your account may be redeemed (closed) at the currentNAV on the date of redemption. Calvert reserves the right to reject any newaccount or any purchase order for failure to supply a certified TIN.
SOCIALLY RESPONSIBLE PROSPECTUS – 116
HOW TO SELL SHARESYou may redeem all or a portion of your shares on any day your Fund is openfor business, provided the amount requested is not on hold. When you purchaseby check or with Calvert Money Controller (electronic funds transfer), the pur-chase will be on hold for up to 10 business days from the date of receipt. Duringthe hold period, redemption proceeds will not be sent until the Transfer Agent isreasonably satisfied that the purchase payment has been collected. Drafts writtenon CSIF Money Market during the hold period will be returned for uncollectedfunds. Your shares will be redeemed at the next NAV calculated after yourredemption request is received by the Transfer Agent in good order (less anyapplicable CDSC and redemption fee). The proceeds will normally be sent toyou on the next business day, but if making immediate payment could adverselyaffect your Fund, it may take up to seven (7) days to make payment. CalvertMoney Controller redemptions generally will be credited to your bank accountby the second business day after your phone call. A Fund has the right to redeemshares in assets other than cash for redemption amounts exceeding, in any 90-day period, $250,000 or 1% of the net asset value of the affected Fund,whichever is less, by making redemptions-in-kind (distributions of a pro ratashare of the portfolio securities, rather than cash). A redemption-in-kind trans-fers the transaction costs associated with redeeming the security from a Fund tothe shareholder. The shareholder will also bear any market risks associated withthe security until the security can be sold. Each Fund reserves the right to sus-pend or postpone redemptions during any period when: (a) trading on theNYSE is restricted, as determined by the SEC, or the NYSE is closed all day forother than customary weekend and holiday closings; (b) the SEC has granted anorder to the Fund permitting such suspension; or (c) an emergency, as deter-mined by the SEC, exists, making disposal of portfolio securities or valuation ofnet assets of the Fund not reasonably practicable. Please note that there are somefederal holidays, however, such as Columbus Day and Veterans’ Day, when theNYSE is open and the Fund is open but redemptions cannot be mailed or wiredbecause the post offices and banks are closed.
Follow these suggestions to ensure timely processing of your redemptionrequest:
By TelephoneYou may redeem shares from your account by telephone and have your moneymailed to your address of record or electronically transferred or wired to a bankyou have previously authorized. A charge of $5 may be imposed on wire trans-fers of less than $1,000.
Written RequestsSend your written requests to: Calvert, P.O. Box 219544, Kansas City, MO64121-9544Your letter should include your account number and fund/class and the number

SOCIALLY RESPONSIBLE PROSPECTUS – 117
of shares or the dollar amount you are redeeming. Please provide a daytime tele-phone number, if possible, for us to call if we have questions. If the money isbeing sent to a new bank, person, or address other than the address of record,your letter must be signature guaranteed.
Draftwriting (CSIF Money Market only)You may redeem shares in your CSIF Money Market account by writing a draftfor at least $250. If you complete and return the signature card for draftwriting,CSIF Money Market will mail bank drafts to you, printed with your name andaddress. Drafts may not be ordered until your initial purchase has cleared.Calvert will provide printed drafts (checks). You may not print your own. Anycustomer-printed checks will not be honored and will be returned withoutnotice. CSIF Money Market will charge a service fee of $25 for drafts returnedfor insufficient or uncollected funds and for any stop payment on drafts. As aservice to shareholders, shares may be automatically transferred between yourCalvert money market accounts to cover drafts you have written. The signatureof only one authorized signer is required to honor a draft.
Systematic Check RedemptionsIf you maintain an account with a balance of $10,000 or more, you may haveup to two (2) redemption checks for a fixed amount mailed to you at youraddress of record on the 15th of the month, simply by sending a letter with allinformation, including your account number, and the dollar amount ($100 min-imum). If you would like a regular check mailed to another person or place,your letter must be signature guaranteed. Unless they otherwise qualify for awaiver, Class B or Class C shares redeemed by Systematic Check Redemptionwill be subject to the Contingent Deferred Sales Charge.
Corporations and AssociationsYour letter of instruction and corporate resolution should be signed by person(s)authorized to act on the account, accompanied by signature guarantee(s).
TrustsYour letter of instruction should be signed by the Trustee(s) (as Trustee(s)), witha signature guarantee. (If the Trustee’s name is not registered on your account,please provide a copy of the trust document, certified within the last 60 days).
Through your Broker/DealerYour broker/dealer must receive your request before the close of regular tradingon the NYSE to receive that day’s NAV. Your broker/dealer will be responsiblefor furnishing all necessary documentation to Calvert and may charge you forservices provided.
SOCIALLY RESPONSIBLE PROSPECTUS – 118
Request in “Good Order”All requests (both purchase orders and redemption requests) must be received bythe Transfer Agent in “good order.” This means that your request must include:
• The Fund name and account number.• The amount of the transaction (in dollars or shares).• Signatures of all owners exactly as registered on the account (for mail requests).• Signature guarantees (if required).*• Any supporting legal documentation that may be required.• Any outstanding certificates representing shares to be redeemed.
*For instance, a signature guarantee must be provided by all registered accountshareholders when redemption proceeds are sent to a different person or address.A signature guarantee can be obtained from most commercial and savings banks,credit unions, trust companies, or member firms of a U.S. stock exchange. Pleasenote: Notarization is not the equivalent of a signature guarantee.
Transactions are processed at the next determined share price after theTransfer Agent has received all required information.
Purchase and Redemption of Shares Through a Financial Intermediary
Each Fund has authorized one or more broker/dealers to accept on its behalfpurchase and redemption orders. Such broker/dealers are authorized to designateother intermediaries to accept purchase and redemption orders on the Fund'sbehalf. The Fund will be deemed to have received a purchase or redemptionorder when an authorized broker/dealer, or if applicable, a broker/dealer'sauthorized designee, accepts the order in good order. The customer orders willbe priced at the Fund's NAV next computed after they are accepted by anauthorized broker/dealer or the broker/dealer's authorized designee.
Redemption FeeEach Fund (except CSIF Money Market) charges a 2% redemption fee onredemptions, including exchanges, within 30 days of purchase into that Fund.
The redemption fee will only be waived in the following circumstances:
• Redemption upon the death or disability of the shareholder, plan participant,or beneficiary. “Disability” means a total disability as evidenced by a determi-nation by the U.S. Social Security Administration.
• Minimum required distributions from retirement plan accounts for sharehold-ers 70 1/2 and older. The maximum amount subject to this waiver is basedonly upon the shareholder’s Calvert retirement accounts.
• The return of an excess contribution or deferral amounts, pursuant to sections
SOCIALLY RESPONSIBLE PROSPECTUS – 119
408(d)(4) or (5), 401(k)(8), 402(g)(2), or 401(m)(6) of the Internal RevenueCode.
• Involuntary redemptions of accounts under procedures set forth by a Fund’sBoard of Trustees/Directors.
• Redemption for the reallocation of purchases received under a systematicinvestment plan for rebalancing purposes (but no more than quarterly), or bya discretionary platform for mutual fund wrap programs for rebalancing pur-poses (but no more than quarterly).
• Redemption of shares purchased with reinvested dividends or capital gain dis-tributions.
• Shares transferred from one retirement plan to another in the same Fund.
• Shares redeemed as part of a retirement plan termination or restructuring.
• Exchange or redemption transactions by accounts that the Fund or its TransferAgent reasonably believes are maintained in a retirement plan omnibus accountby a retirement plan service provider that either (i) does not have the systematiccapability of assessing the redemption fee at the individual or participant accountlevel or (ii) implements its own policies and procedures to detect and preventmarket timing that are acceptable to the Fund's Board of Trustees/Directors. Forthis purpose, a retirement plan omnibus account is a Fund account where theownership of, or interest in, Fund shares by more than one individual or partici-pant is held through the account and the subaccounting for such Fund account isdone by the retirement plan service provider, not the Fund’s transfer agent.
For shares held through an intermediary in an omnibus account, Calvert relieson the intermediary to assess the redemption fee on underlying shareholder accounts. Calvert seeks to identify intermediaries establishing omnibus accounts and to enter into agreements requiring the intermediary to assess the redemption fee. There are no assurances that Calvert will be successful in identifying all intermediaries or that intermediaries will properly assess the fee.
FINANCIAL HIGHLIGHTSThe financial highlights table is intended to help you understand the Funds’financial performance for the past five (5) fiscal years (or if shorter, the period ofthe Fund’s operations). The Funds’ fiscal year end is September 30. Certaininformation reflects financial results for a single share, by Fund and Class. Thetotal returns in the table represent the rate that an investor would have earned(or lost) on an investment in a Fund (assuming reinvestment of all dividendsand distributions), and does not reflect any applicable front- or back-end salescharge. The information has been derived from the Fund’s financial statements,which for 2002 through 2005 were audited by KPMG LLP. Their report, alongwith a Fund’s financial statements, is included in the Fund’s annual report,which is available upon request. The information for the year ended September30, 2001, was audited by other auditors.

SOCIALLY RESPONSIBLE PROSPECTUS – 120SOCIALLY RESPONSIBLE PROSPECTUS – 120
CSIF BALANCED FINANCIAL HIGHLIGHTS
YEARS ENDED
SEPTEMBER 30, SEPTEMBER 30,CLASS A SHARES 2005 2004
Net asset value, beginning . . . . . . . . . . . . . . . . . . . . . . . . . . . . . . . . $26.13 $24.35Income from investment operations
Net investment income . . . . . . . . . . . . . . . . . . . . . . . . . . . . . . . . . . . .44 .36Net realized and unrealized gain (loss) . . . . . . . . . . . . . . . . . . . . . . . . 2.08 1.77
Total from investment operations . . . . . . . . . . . . . . . . . . . . . . . . . 2.52 2.13Distributions from
Net investment income . . . . . . . . . . . . . . . . . . . . . . . . . . . . . . . . . . . (.40) (.35)Total distributions . . . . . . . . . . . . . . . . . . . . . . . . . . . . . . . . . . . . (.40) (.35)
Total increase (decrease) in net asset value . . . . . . . . . . . . . . . . . . . . . . . 2.12 1.78Net asset value, ending . . . . . . . . . . . . . . . . . . . . . . . . . . . . . . . . . . . $28.25 $26.13
Total return* . . . . . . . . . . . . . . . . . . . . . . . . . . . . . . . . . . . . . . . . . . . . . 9.68% 8.77%Ratios to average net assets:A
Net investment income . . . . . . . . . . . . . . . . . . . . . . . . . . . . . . . . . . . 1.59% 1.37%Total expenses . . . . . . . . . . . . . . . . . . . . . . . . . . . . . . . . . . . . . . . . . . 1.22% 1.25%Expenses before offsets . . . . . . . . . . . . . . . . . . . . . . . . . . . . . . . . . . . 1.22% 1.25%Net expenses . . . . . . . . . . . . . . . . . . . . . . . . . . . . . . . . . . . . . . . . . . . 1.21% 1.25%
Portfolio turnover . . . . . . . . . . . . . . . . . . . . . . . . . . . . . . . . . . . . . . . . . 83% 106%Net assets, ending (in thousands) . . . . . . . . . . . . . . . . . . . . . . . . . . . $517,840 $486,255
YEARS ENDED
SEPTEMBER 30, SEPTEMBER 30, SEPTEMBER 30,CLASS A SHARES 2003 2002 2001
Net asset value, beginning . . . . . . . . . . . . . . . . . . . . $21.44 $24.48 $33.23Income from investment operations
Net investment income . . . . . . . . . . . . . . . . . . . . . . .38 .56 .84Net realized and unrealized gain (loss) . . . . . . . . . . . 2.87 (3.04) (6.37)
Total from investment operations . . . . . . . . . . . . 3.25 (2.48) (5.53)Distributions from
Net investment income . . . . . . . . . . . . . . . . . . . . . . (.34) (.56) (.82)Net realized gains . . . . . . . . . . . . . . . . . . . . . . . . . . . — — (2.40)
Total distributions . . . . . . . . . . . . . . . . . . . . . . . . (.34) (.56) (3.22)Total increase (decrease) in net asset value . . . . . . . . . . 2.91 (3.04) (8.75)Net asset value, ending . . . . . . . . . . . . . . . . . . . . . . . $24.35 $21.44 $24.48
Total return* . . . . . . . . . . . . . . . . . . . . . . . . . . . . . . . . . 15.28% (10.38%) (17.74%)Ratios to average net assets:A
Net investment income . . . . . . . . . . . . . . . . . . . . . . 1.67% 2.23% 2.98%Total expenses . . . . . . . . . . . . . . . . . . . . . . . . . . . . . 1.25% 1.25% 1.20%Expenses before offsets . . . . . . . . . . . . . . . . . . . . . . . 1.25% 1.25% 1.20%Net expenses . . . . . . . . . . . . . . . . . . . . . . . . . . . . . . 1.24% 1.25% 1.19%
Portfolio turnover . . . . . . . . . . . . . . . . . . . . . . . . . . . . . 175% 192% 214%Net assets, ending (in thousands) . . . . . . . . . . . . . . . $480,201 $458,947 $532,008
See notes to financial highlights.
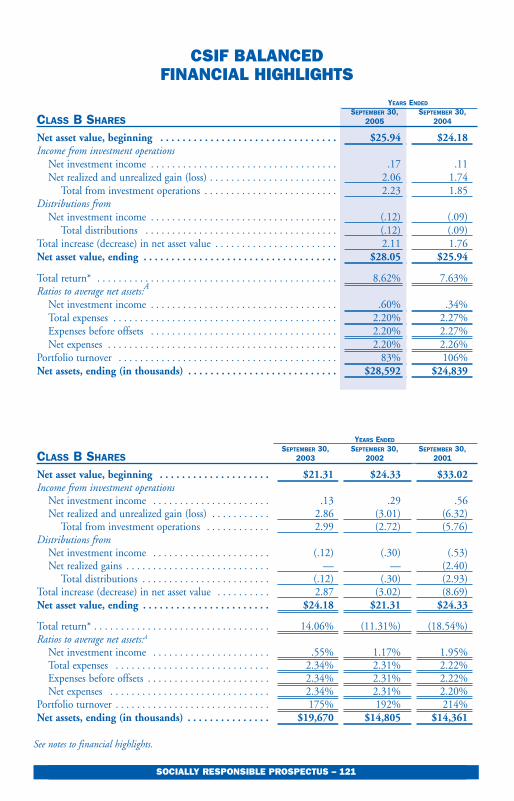
SOCIALLY RESPONSIBLE PROSPECTUS – 121SOCIALLY RESPONSIBLE PROSPECTUS – 121
CSIF BALANCED FINANCIAL HIGHLIGHTS
YEARS ENDED
SEPTEMBER 30, SEPTEMBER 30,CLASS B SHARES 2005 2004
Net asset value, beginning . . . . . . . . . . . . . . . . . . . . . . . . . . . . . . . . $25.94 $24.18Income from investment operations
Net investment income . . . . . . . . . . . . . . . . . . . . . . . . . . . . . . . . . . . .17 .11Net realized and unrealized gain (loss) . . . . . . . . . . . . . . . . . . . . . . . . 2.06 1.74
Total from investment operations . . . . . . . . . . . . . . . . . . . . . . . . . 2.23 1.85Distributions from
Net investment income . . . . . . . . . . . . . . . . . . . . . . . . . . . . . . . . . . . (.12) (.09)Total distributions . . . . . . . . . . . . . . . . . . . . . . . . . . . . . . . . . . . . (.12) (.09)
Total increase (decrease) in net asset value . . . . . . . . . . . . . . . . . . . . . . . 2.11 1.76Net asset value, ending . . . . . . . . . . . . . . . . . . . . . . . . . . . . . . . . . . . $28.05 $25.94
Total return* . . . . . . . . . . . . . . . . . . . . . . . . . . . . . . . . . . . . . . . . . . . . . 8.62% 7.63%Ratios to average net assets:A
Net investment income . . . . . . . . . . . . . . . . . . . . . . . . . . . . . . . . . . . .60% .34%Total expenses . . . . . . . . . . . . . . . . . . . . . . . . . . . . . . . . . . . . . . . . . . 2.20% 2.27%Expenses before offsets . . . . . . . . . . . . . . . . . . . . . . . . . . . . . . . . . . . 2.20% 2.27%Net expenses . . . . . . . . . . . . . . . . . . . . . . . . . . . . . . . . . . . . . . . . . . . 2.20% 2.26%
Portfolio turnover . . . . . . . . . . . . . . . . . . . . . . . . . . . . . . . . . . . . . . . . . 83% 106%Net assets, ending (in thousands) . . . . . . . . . . . . . . . . . . . . . . . . . . . $28,592 $24,839
YEARS ENDED
SEPTEMBER 30, SEPTEMBER 30, SEPTEMBER 30,CLASS B SHARES 2003 2002 2001
Net asset value, beginning . . . . . . . . . . . . . . . . . . . . $21.31 $24.33 $33.02Income from investment operations
Net investment income . . . . . . . . . . . . . . . . . . . . . . .13 .29 .56Net realized and unrealized gain (loss) . . . . . . . . . . . 2.86 (3.01) (6.32)
Total from investment operations . . . . . . . . . . . . 2.99 (2.72) (5.76)Distributions from
Net investment income . . . . . . . . . . . . . . . . . . . . . . (.12) (.30) (.53)Net realized gains . . . . . . . . . . . . . . . . . . . . . . . . . . . — — (2.40)
Total distributions . . . . . . . . . . . . . . . . . . . . . . . . (.12) (.30) (2.93)Total increase (decrease) in net asset value . . . . . . . . . . 2.87 (3.02) (8.69)Net asset value, ending . . . . . . . . . . . . . . . . . . . . . . . $24.18 $21.31 $24.33
Total return* . . . . . . . . . . . . . . . . . . . . . . . . . . . . . . . . . 14.06% (11.31%) (18.54%)Ratios to average net assets:A
Net investment income . . . . . . . . . . . . . . . . . . . . . . .55% 1.17% 1.95%Total expenses . . . . . . . . . . . . . . . . . . . . . . . . . . . . . 2.34% 2.31% 2.22%Expenses before offsets . . . . . . . . . . . . . . . . . . . . . . . 2.34% 2.31% 2.22%Net expenses . . . . . . . . . . . . . . . . . . . . . . . . . . . . . . 2.34% 2.31% 2.20%
Portfolio turnover . . . . . . . . . . . . . . . . . . . . . . . . . . . . . 175% 192% 214%Net assets, ending (in thousands) . . . . . . . . . . . . . . . $19,670 $14,805 $14,361
See notes to financial highlights.

SOCIALLY RESPONSIBLE PROSPECTUS – 122SOCIALLY RESPONSIBLE PROSPECTUS – 122
CSIF BALANCED FINANCIAL HIGHLIGHTS
YEARS ENDED
SEPTEMBER 30, SEPTEMBER 30,CLASS C SHARES 2005 2004
Net asset value, beginning . . . . . . . . . . . . . . . . . . . . . . . . . . . . . . . . $25.70 $23.95Income from investment operations
Net investment income . . . . . . . . . . . . . . . . . . . . . . . . . . . . . . . . . . . .18 .12Net realized and unrealized gain (loss) . . . . . . . . . . . . . . . . . . . . . . . . 2.04 1.73
Total from investment operations . . . . . . . . . . . . . . . . . . . . . . . . . 2.22 1.85Distributions from
Net investment income . . . . . . . . . . . . . . . . . . . . . . . . . . . . . . . . . . . (.13) (.10)Total distributions . . . . . . . . . . . . . . . . . . . . . . . . . . . . . . . . . . . . (.13) (.10)
Total increase (decrease) in net asset value . . . . . . . . . . . . . . . . . . . . . . . 2.09 1.75Net asset value, ending . . . . . . . . . . . . . . . . . . . . . . . . . . . . . . . . . . . $27.79 $25.70
Total return* . . . . . . . . . . . . . . . . . . . . . . . . . . . . . . . . . . . . . . . . . . . . . 8.67% 7.71%Ratios to average net assets:A
Net investment income . . . . . . . . . . . . . . . . . . . . . . . . . . . . . . . . . . . .65% .39%Total expenses . . . . . . . . . . . . . . . . . . . . . . . . . . . . . . . . . . . . . . . . . . 2.16% 2.22%Expenses before offsets . . . . . . . . . . . . . . . . . . . . . . . . . . . . . . . . . . . 2.16% 2.22%Net expenses . . . . . . . . . . . . . . . . . . . . . . . . . . . . . . . . . . . . . . . . . . . 2.15% 2.22%
Portfolio turnover . . . . . . . . . . . . . . . . . . . . . . . . . . . . . . . . . . . . . . . . . 83% 106%Net assets, ending (in thousands) . . . . . . . . . . . . . . . . . . . . . . . . . . . $25,980 $21,819
YEARS ENDED
SEPTEMBER 30, SEPTEMBER 30, SEPTEMBER 30,CLASS C SHARES 2003 2002 2001
Net asset value, beginning . . . . . . . . . . . . . . . . . . . . $21.12 $24.10 $32.74Income from investment operations
Net investment income . . . . . . . . . . . . . . . . . . . . . . .13 .29 .56Net realized and unrealized gain (loss) . . . . . . . . . . . 2.82 (2.96) (6.29)
Total from investment operations . . . . . . . . . . . . 2.95 (2.67) (5.73)Distributions from
Net investment income . . . . . . . . . . . . . . . . . . . . . . (.12) (.31) (.51)Net realized gains . . . . . . . . . . . . . . . . . . . . . . . . . . . — — (2.40)
Total distributions . . . . . . . . . . . . . . . . . . . . . . . . (.12) (.31) (2.91)Total increase (decrease) in net asset value . . . . . . . . . . 2.83 (2.98) (8.64)Net asset value, ending . . . . . . . . . . . . . . . . . . . . . . . $23.95 $21.12 $24.10
Total return* . . . . . . . . . . . . . . . . . . . . . . . . . . . . . . . . . 14.02% (11.25%) (18.60%)Ratios to average net assets:A
Net investment income . . . . . . . . . . . . . . . . . . . . . . .59% 1.20% 1.98%Total expenses . . . . . . . . . . . . . . . . . . . . . . . . . . . . . 2.31% 2.29% 2.19%Expenses before offsets . . . . . . . . . . . . . . . . . . . . . . . 2.31% 2.29% 2.19%Net expenses . . . . . . . . . . . . . . . . . . . . . . . . . . . . . . 2.30% 2.28% 2.18%
Portfolio turnover . . . . . . . . . . . . . . . . . . . . . . . . . . . . . 175% 192% 214%Net assets, ending (in thousands) . . . . . . . . . . . . . . . $16,585 $12,626 $12,889
See notes to financial highlights.
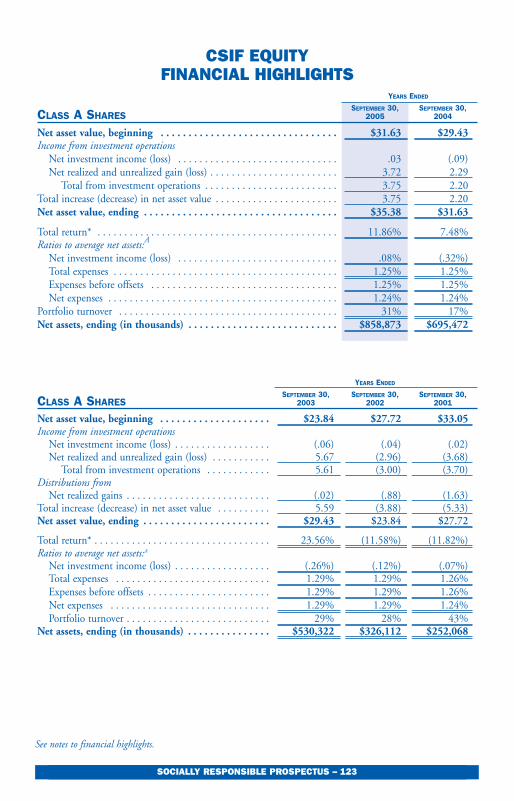
SOCIALLY RESPONSIBLE PROSPECTUS – 123
CSIF EQUITY FINANCIAL HIGHLIGHTS
YEARS ENDED
SEPTEMBER 30, SEPTEMBER 30,CLASS A SHARES 2005 2004
Net asset value, beginning . . . . . . . . . . . . . . . . . . . . . . . . . . . . . . . . $31.63 $29.43Income from investment operations
Net investment income (loss) . . . . . . . . . . . . . . . . . . . . . . . . . . . . . . .03 (.09)Net realized and unrealized gain (loss) . . . . . . . . . . . . . . . . . . . . . . . . 3.72 2.29
Total from investment operations . . . . . . . . . . . . . . . . . . . . . . . . . 3.75 2.20Total increase (decrease) in net asset value . . . . . . . . . . . . . . . . . . . . . . . 3.75 2.20Net asset value, ending . . . . . . . . . . . . . . . . . . . . . . . . . . . . . . . . . . . $35.38 $31.63
Total return* . . . . . . . . . . . . . . . . . . . . . . . . . . . . . . . . . . . . . . . . . . . . . 11.86% 7.48%Ratios to average net assets:A
Net investment income (loss) . . . . . . . . . . . . . . . . . . . . . . . . . . . . . . .08% (.32%)Total expenses . . . . . . . . . . . . . . . . . . . . . . . . . . . . . . . . . . . . . . . . . . 1.25% 1.25%Expenses before offsets . . . . . . . . . . . . . . . . . . . . . . . . . . . . . . . . . . . 1.25% 1.25%Net expenses . . . . . . . . . . . . . . . . . . . . . . . . . . . . . . . . . . . . . . . . . . . 1.24% 1.24%
Portfolio turnover . . . . . . . . . . . . . . . . . . . . . . . . . . . . . . . . . . . . . . . . . 31% 17%Net assets, ending (in thousands) . . . . . . . . . . . . . . . . . . . . . . . . . . . $858,873 $695,472
YEARS ENDED
SEPTEMBER 30, SEPTEMBER 30, SEPTEMBER 30,CLASS A SHARES 2003 2002 2001
Net asset value, beginning . . . . . . . . . . . . . . . . . . . . $23.84 $27.72 $33.05Income from investment operations
Net investment income (loss) . . . . . . . . . . . . . . . . . . (.06) (.04) (.02)Net realized and unrealized gain (loss) . . . . . . . . . . . 5.67 (2.96) (3.68)
Total from investment operations . . . . . . . . . . . . 5.61 (3.00) (3.70)Distributions from
Net realized gains . . . . . . . . . . . . . . . . . . . . . . . . . . . (.02) (.88) (1.63)Total increase (decrease) in net asset value . . . . . . . . . . 5.59 (3.88) (5.33)Net asset value, ending . . . . . . . . . . . . . . . . . . . . . . . $29.43 $23.84 $27.72
Total return* . . . . . . . . . . . . . . . . . . . . . . . . . . . . . . . . . 23.56% (11.58%) (11.82%)Ratios to average net assets:A
Net investment income (loss) . . . . . . . . . . . . . . . . . . (.26%) (.12%) (.07%)Total expenses . . . . . . . . . . . . . . . . . . . . . . . . . . . . . 1.29% 1.29% 1.26%Expenses before offsets . . . . . . . . . . . . . . . . . . . . . . . 1.29% 1.29% 1.26%Net expenses . . . . . . . . . . . . . . . . . . . . . . . . . . . . . . 1.29% 1.29% 1.24%Portfolio turnover . . . . . . . . . . . . . . . . . . . . . . . . . . . 29% 28% 43%
Net assets, ending (in thousands) . . . . . . . . . . . . . . . $530,322 $326,112 $252,068
SOCIALLY RESPONSIBLE PROSPECTUS – 123
See notes to financial highlights.

SOCIALLY RESPONSIBLE PROSPECTUS – 124
CSIF EQUITY FINANCIAL HIGHLIGHTS
YEARS ENDED
SEPTEMBER 30, SEPTEMBER 30,CLASS B SHARES 2005 2004
Net asset value, beginning . . . . . . . . . . . . . . . . . . . . . . . . . . . . . . . . $29.61 $27.78Income from investment operations
Net investment income (loss) . . . . . . . . . . . . . . . . . . . . . . . . . . . . . . (0.24) (.33)Net realized and unrealized gain (loss) . . . . . . . . . . . . . . . . . . . . . . . . 3.47 2.16
Total from investment operations . . . . . . . . . . . . . . . . . . . . . . . . . 3.23 1.83Total increase (decrease) in net asset value . . . . . . . . . . . . . . . . . . . . . . . 3.23 1.83Net asset value, ending . . . . . . . . . . . . . . . . . . . . . . . . . . . . . . . . . . . 32.84 $29.61
Total return* . . . . . . . . . . . . . . . . . . . . . . . . . . . . . . . . . . . . . . . . . . . . . 10.91% 6.59%Ratios to average net assets:A
Net investment income (loss) . . . . . . . . . . . . . . . . . . . . . . . . . . . . . . (.77%) (1.16%)Total expenses . . . . . . . . . . . . . . . . . . . . . . . . . . . . . . . . . . . . . . . . . . 2.09% 2.09%Expenses before offsets . . . . . . . . . . . . . . . . . . . . . . . . . . . . . . . . . . . 2.09% 2.09%Net expenses . . . . . . . . . . . . . . . . . . . . . . . . . . . . . . . . . . . . . . . . . . . 2.09% 2.08%
Portfolio turnover . . . . . . . . . . . . . . . . . . . . . . . . . . . . . . . . . . . . . . . . . 31% 17%Net assets, ending (in thousands) . . . . . . . . . . . . . . . . . . . . . . . . . . . $105,189 $86,242
YEARS ENDED
SEPTEMBER 30, SEPTEMBER 30, SEPTEMBER 30,CLASS B SHARES 2003 2002 2001
Net asset value, beginning . . . . . . . . . . . . . . . . . . . . $22.70 $26.67 $32.17Income from investment operations
Net investment income (loss) . . . . . . . . . . . . . . . . . . (.25) (.24) (.24)Net realized and unrealized gain (loss) . . . . . . . . . . . 5.35 (2.85) (3.63)
Total from investment operations . . . . . . . . . . . . 5.10 (3.09) (3.87)Distributions from
Net realized gains . . . . . . . . . . . . . . . . . . . . . . . . . . . (.02) (.88) (1.63)Total increase (decrease) in net asset value . . . . . . . . . . 5.08 (3.97) (5.50)Net asset value, ending . . . . . . . . . . . . . . . . . . . . . . . $27.78 $22.70 $26.67
Total return* . . . . . . . . . . . . . . . . . . . . . . . . . . . . . . . . . 22.50% (12.39%) (12.71%)Ratios to average net assets:A
Net investment income (loss) . . . . . . . . . . . . . . . . . . (1.12%) (1.02%) (1.00%)Total expenses . . . . . . . . . . . . . . . . . . . . . . . . . . . . . 2.15% 2.19% 2.20%Expenses before offsets . . . . . . . . . . . . . . . . . . . . . . . 2.15% 2.19% 2.20%Net expenses . . . . . . . . . . . . . . . . . . . . . . . . . . . . . . 2.15% 2.19% 2.17%
Portfolio turnover . . . . . . . . . . . . . . . . . . . . . . . . . . . . . 29% 28% 43%Net assets, ending (in thousands) . . . . . . . . . . . . . . . $70,824 $43,091 $30,015
SOCIALLY RESPONSIBLE PROSPECTUS – 124
See notes to financial highlights.

SOCIALLY RESPONSIBLE PROSPECTUS – 125
CSIF EQUITY FINANCIAL HIGHLIGHTS
YEARS ENDED
SEPTEMBER 30, SEPTEMBER 30,CLASS C SHARES 2005 2004
Net asset value, beginning . . . . . . . . . . . . . . . . . . . . . . . . . . . . . . . . $27.64 $25.92Income from investment operations.
Net investment income (loss) . . . . . . . . . . . . . . . . . . . . . . . . . . . . . . (.20) (.27)Net realized and unrealized gain (loss) . . . . . . . . . . . . . . . . . . . . . . . . 3.24 1.99
Total from investment operations . . . . . . . . . . . . . . . . . . . . . . . . . 3.04 1.72Total increase (decrease) in net asset value . . . . . . . . . . . . . . . . . . . . . . . 3.04 1.72Net asset value, ending . . . . . . . . . . . . . . . . . . . . . . . . . . . . . . . . . . . $30.68 $27.64
Total return* . . . . . . . . . . . . . . . . . . . . . . . . . . . . . . . . . . . . . . . . . . . . . 11.00% 6.64%Ratios to average net assets:A
Net investment income (loss) . . . . . . . . . . . . . . . . . . . . . . . . . . . . . . (.69%) (1.09%) Total expenses . . . . . . . . . . . . . . . . . . . . . . . . . . . . . . . . . . . . . . . . . . 2.01% 2.03%Expenses before offsets . . . . . . . . . . . . . . . . . . . . . . . . . . . . . . . . . . . 2.01% 2.03%Net expenses . . . . . . . . . . . . . . . . . . . . . . . . . . . . . . . . . . . . . . . . . . . 2.01% 2.03%
Portfolio turnover . . . . . . . . . . . . . . . . . . . . . . . . . . . . . . . . . . . . . . . . . 31% 17%Net assets, ending (in thousands) . . . . . . . . . . . . . . . . . . . . . . . . . . . $107,305 $86,514
YEARS ENDED
SEPTEMBER 30, SEPTEMBER 30, SEPTEMBER 30,CLASS C SHARES 2003 2002 2001
Net asset value, beginning . . . . . . . . . . . . . . . . . . . . $21.17 $24.91 $30.13Income from investment operations.
Net investment income (loss) . . . . . . . . . . . . . . . . . . (.22) (.21) (.22)Net realized and unrealized gain (loss) . . . . . . . . . . . 4.99 (2.65) (3.37)
Total from investment operations . . . . . . . . . . . . 4.77 (2.86) (3.59)Distributions from
Net realized gains . . . . . . . . . . . . . . . . . . . . . . . . . . . (.02) (.88) (1.63)Total increase (decrease) in net asset value . . . . . . . . . . 4.75 (3.74) (5.22)Net asset value, ending . . . . . . . . . . . . . . . . . . . . . . . $25.92 $21.17 $24.91
Total return* . . . . . . . . . . . . . . . . . . . . . . . . . . . . . . . . . 22.56% (12.34%) (12.63%)Ratios to average net assets:A
Net investment income (loss) . . . . . . . . . . . . . . . . . . (1.06%) (.96%) (.94%)Total expenses . . . . . . . . . . . . . . . . . . . . . . . . . . . . . 2.10% 2.14% 2.14%Expenses before offsets . . . . . . . . . . . . . . . . . . . . . . . 2.10% 2.14% 2.14%Net expenses . . . . . . . . . . . . . . . . . . . . . . . . . . . . . . 2.09% 2.13% 2.11%
Portfolio turnover . . . . . . . . . . . . . . . . . . . . . . . . . . . . . 29% 28% 43%Net assets, ending (in thousands) . . . . . . . . . . . . . . . $61,897 $37,109 $26,455
SOCIALLY RESPONSIBLE PROSPECTUS – 125
See notes to financial highlights.

SOCIALLY RESPONSIBLE PROSPECTUS – 126
CALVERT SOCIAL INDEX FUNDFINANCIAL HIGHLIGHTS
YEARS ENDED
SEPTEMBER 30, SEPTEMBER 30,CLASS A SHARES 2005 (z) 2004 (z)
Net asset value, beginning . . . . . . . . . . . . . . . . . . . . . . . . . . . . . . . . $10.43 $9.55Income from investment operations
Net investment income . . . . . . . . . . . . . . . . . . . . . . . . . . . . . . . . . . . .13 .06Net realized and unrealized gain (loss) . . . . . . . . . . . . . . . . . . . . . . . . .84 .87
Total from investment operations . . . . . . . . . . . . . . . . . . . . . . . . . .97 .93Distributions from:
Net investment income . . . . . . . . . . . . . . . . . . . . . . . . . . . . . . . . . . . (.11) (.05)Total distributions . . . . . . . . . . . . . . . . . . . . . . . . . . . . . . . . . . . . (.11) (.05)
Total increase (decrease) in net asset value . . . . . . . . . . . . . . . . . . . . . . . 0.86 0.88Net asset value, ending . . . . . . . . . . . . . . . . . . . . . . . . . . . . . . . . . . . $11.29 $10.43
Total return* . . . . . . . . . . . . . . . . . . . . . . . . . . . . . . . . . . . . . . . . . . . . . 9.31% 9.73%Ratios to average net assets:A
Net investment income . . . . . . . . . . . . . . . . . . . . . . . . . . . . . . . . . . . 1.21% .64%Total expenses . . . . . . . . . . . . . . . . . . . . . . . . . . . . . . . . . . . . . . . . . . 1.34% 1.48%Expenses before offsets . . . . . . . . . . . . . . . . . . . . . . . . . . . . . . . . . . . .77% .77%Net expenses . . . . . . . . . . . . . . . . . . . . . . . . . . . . . . . . . . . . . . . . . . . .75% .75%
Portfolio turnover . . . . . . . . . . . . . . . . . . . . . . . . . . . . . . . . . . . . . . . . . 14% 14%Net assets, ending (in thousands) . . . . . . . . . . . . . . . . . . . . . . . . . . . $44,108 $39,684
YEARS ENDED
SEPTEMBER 30, SEPTEMBER 30, SEPTEMBER 30,CLASS A SHARES 2003 2002 2001
Net asset value, beginning . . . . . . . . . . . . . . . . . . . . $7.50 $9.68 $14.78Income from investment operations
Net investment income . . . . . . . . . . . . . . . . . . . . . .. .05 .03 .04Net realized and unrealized gain (loss) . . . . . . . . . . . 2.03 (2.17) (5.10)
Total from investment operations . . . . . . . . . . . . 2.08 (2.14) (5.06)Distributions from:
Net investment income . . . . . . . . . . . . . . . . . . . . . . (.03) (.04) (.04)Total distributions . . . . . . . . . . . . . . . . . . . . . . . . (.03) (.04) (.04)
Total increase (decrease) in net asset value . . . . . . . . . . 2.05 (2.18) (5.10)Net asset value, ending . . . . . . . . . . . . . . . . . . . . . . . $9.55 $7.50 $9.68
Total return* . . . . . . . . . . . . . . . . . . . . . . . . . . . . . . . . . 27.88% (22.27%) (34.31%)Ratios to average net assets:A
Net investment income . . . . . . . . . . . . . . . . . . . . . . .63% .36% .33%Total expenses . . . . . . . . . . . . . . . . . . . . . . . . . . . . . 1.62% 1.65% 1.84%Expenses before offsets . . . . . . . . . . . . . . . . . . . . . . . .77% .77% .85%Net expenses . . . . . . . . . . . . . . . . . . . . . . . . . . . . . . .75% .75% .75%
Portfolio turnover . . . . . . . . . . . . . . . . . . . . . . . . . . . . . 7% 9% 13%Net assets, ending (in thousands) . . . . . . . . . . . . . . . $27,802 $17,663 $18,614
SOCIALLY RESPONSIBLE PROSPECTUS – 126
See notes to financial highlights.
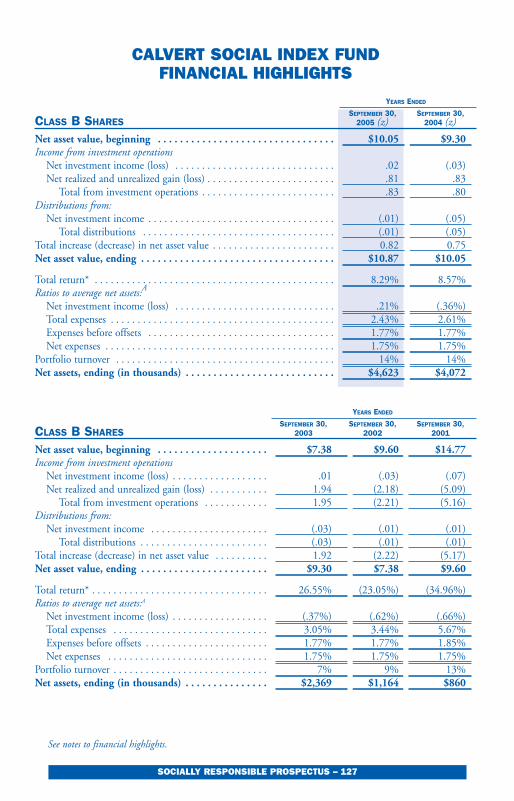
SOCIALLY RESPONSIBLE PROSPECTUS – 127
CALVERT SOCIAL INDEX FUNDFINANCIAL HIGHLIGHTS
YEARS ENDED
SEPTEMBER 30, SEPTEMBER 30,CLASS B SHARES 2005 (z) 2004 (z)
Net asset value, beginning . . . . . . . . . . . . . . . . . . . . . . . . . . . . . . . . $10.05 $9.30Income from investment operations
Net investment income (loss) . . . . . . . . . . . . . . . . . . . . . . . . . . . . . . .02 (.03)Net realized and unrealized gain (loss) . . . . . . . . . . . . . . . . . . . . . . . . .81 .83
Total from investment operations . . . . . . . . . . . . . . . . . . . . . . . . . .83 .80Distributions from:
Net investment income . . . . . . . . . . . . . . . . . . . . . . . . . . . . . . . . . . . (.01) (.05)Total distributions . . . . . . . . . . . . . . . . . . . . . . . . . . . . . . . . . . . . (.01) (.05)
Total increase (decrease) in net asset value . . . . . . . . . . . . . . . . . . . . . . . 0.82 0.75Net asset value, ending . . . . . . . . . . . . . . . . . . . . . . . . . . . . . . . . . . . $10.87 $10.05
Total return* . . . . . . . . . . . . . . . . . . . . . . . . . . . . . . . . . . . . . . . . . . . . . 8.29% 8.57%Ratios to average net assets:A
Net investment income (loss) . . . . . . . . . . . . . . . . . . . . . . . . . . . . . . .21% (.36%)Total expenses . . . . . . . . . . . . . . . . . . . . . . . . . . . . . . . . . . . . . . . . . . 2.43% 2.61%Expenses before offsets . . . . . . . . . . . . . . . . . . . . . . . . . . . . . . . . . . . 1.77% 1.77%Net expenses . . . . . . . . . . . . . . . . . . . . . . . . . . . . . . . . . . . . . . . . . . . 1.75% 1.75%
Portfolio turnover . . . . . . . . . . . . . . . . . . . . . . . . . . . . . . . . . . . . . . . . . 14% 14%Net assets, ending (in thousands) . . . . . . . . . . . . . . . . . . . . . . . . . . . $4,623 $4,072
YEARS ENDED
SEPTEMBER 30, SEPTEMBER 30, SEPTEMBER 30,CLASS B SHARES 2003 2002 2001
Net asset value, beginning . . . . . . . . . . . . . . . . . . . . $7.38 $9.60 $14.77Income from investment operations
Net investment income (loss) . . . . . . . . . . . . . . . . . . .01 (.03) (.07)Net realized and unrealized gain (loss) . . . . . . . . . . . 1.94 (2.18) (5.09)
Total from investment operations . . . . . . . . . . . . 1.95 (2.21) (5.16)Distributions from:
Net investment income . . . . . . . . . . . . . . . . . . . . . . (.03) (.01) (.01)Total distributions . . . . . . . . . . . . . . . . . . . . . . . . (.03) (.01) (.01)
Total increase (decrease) in net asset value . . . . . . . . . . 1.92 (2.22) (5.17)Net asset value, ending . . . . . . . . . . . . . . . . . . . . . . . $9.30 $7.38 $9.60
Total return* . . . . . . . . . . . . . . . . . . . . . . . . . . . . . . . . . 26.55% (23.05%) (34.96%)Ratios to average net assets:A
Net investment income (loss) . . . . . . . . . . . . . . . . . . (.37%) (.62%) (.66%) Total expenses . . . . . . . . . . . . . . . . . . . . . . . . . . . . . 3.05% 3.44% 5.67% Expenses before offsets . . . . . . . . . . . . . . . . . . . . . . . 1.77% 1.77% 1.85% Net expenses . . . . . . . . . . . . . . . . . . . . . . . . . . . . . . 1.75% 1.75% 1.75%
Portfolio turnover . . . . . . . . . . . . . . . . . . . . . . . . . . . . . 7% 9% 13%Net assets, ending (in thousands) . . . . . . . . . . . . . . . $2,369 $1,164 $860
See notes to financial highlights.
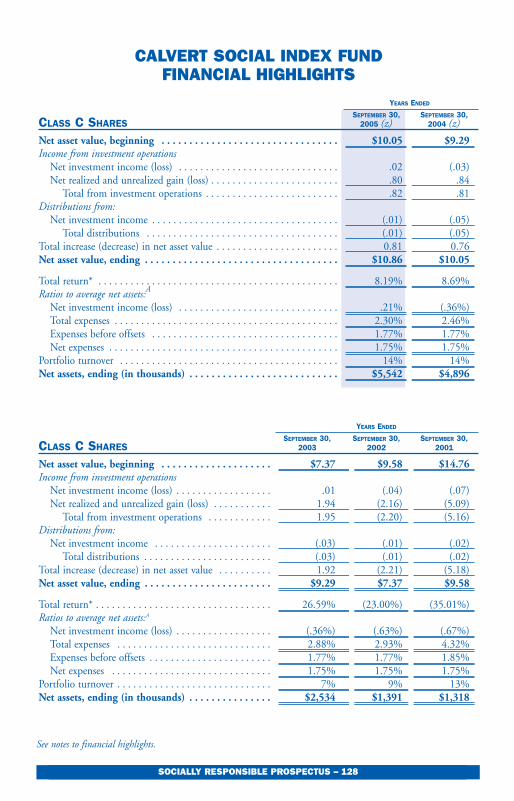
SOCIALLY RESPONSIBLE PROSPECTUS – 128
CALVERT SOCIAL INDEX FUNDFINANCIAL HIGHLIGHTS
YEARS ENDED
SEPTEMBER 30, SEPTEMBER 30,CLASS C SHARES 2005 (z) 2004 (z)
Net asset value, beginning . . . . . . . . . . . . . . . . . . . . . . . . . . . . . . . . $10.05 $9.29Income from investment operations
Net investment income (loss) . . . . . . . . . . . . . . . . . . . . . . . . . . . . . . .02 (.03)Net realized and unrealized gain (loss) . . . . . . . . . . . . . . . . . . . . . . . . .80 .84
Total from investment operations . . . . . . . . . . . . . . . . . . . . . . . . . .82 .81Distributions from:
Net investment income . . . . . . . . . . . . . . . . . . . . . . . . . . . . . . . . . . . (.01) (.05)Total distributions . . . . . . . . . . . . . . . . . . . . . . . . . . . . . . . . . . . . (.01) (.05)
Total increase (decrease) in net asset value . . . . . . . . . . . . . . . . . . . . . . . 0.81 0.76Net asset value, ending . . . . . . . . . . . . . . . . . . . . . . . . . . . . . . . . . . . $10.86 $10.05
Total return* . . . . . . . . . . . . . . . . . . . . . . . . . . . . . . . . . . . . . . . . . . . . . 8.19% 8.69%Ratios to average net assets:A
Net investment income (loss) . . . . . . . . . . . . . . . . . . . . . . . . . . . . . . .21% (.36%)Total expenses . . . . . . . . . . . . . . . . . . . . . . . . . . . . . . . . . . . . . . . . . . 2.30% 2.46%Expenses before offsets . . . . . . . . . . . . . . . . . . . . . . . . . . . . . . . . . . . 1.77% 1.77%Net expenses . . . . . . . . . . . . . . . . . . . . . . . . . . . . . . . . . . . . . . . . . . . 1.75% 1.75%
Portfolio turnover . . . . . . . . . . . . . . . . . . . . . . . . . . . . . . . . . . . . . . . . . 14% 14%Net assets, ending (in thousands) . . . . . . . . . . . . . . . . . . . . . . . . . . . $5,542 $4,896
YEARS ENDED
SEPTEMBER 30, SEPTEMBER 30, SEPTEMBER 30,CLASS C SHARES 2003 2002 2001
Net asset value, beginning . . . . . . . . . . . . . . . . . . . . $7.37 $9.58 $14.76Income from investment operations
Net investment income (loss) . . . . . . . . . . . . . . . . . . .01 (.04) (.07)Net realized and unrealized gain (loss) . . . . . . . . . . . 1.94 (2.16) (5.09)
Total from investment operations . . . . . . . . . . . . 1.95 (2.20) (5.16)Distributions from:
Net investment income . . . . . . . . . . . . . . . . . . . . . . (.03) (.01) (.02)Total distributions . . . . . . . . . . . . . . . . . . . . . . . . (.03) (.01) (.02)
Total increase (decrease) in net asset value . . . . . . . . . . 1.92 (2.21) (5.18)Net asset value, ending . . . . . . . . . . . . . . . . . . . . . . . $9.29 $7.37 $9.58
Total return* . . . . . . . . . . . . . . . . . . . . . . . . . . . . . . . . . 26.59% (23.00%) (35.01%)Ratios to average net assets:A
Net investment income (loss) . . . . . . . . . . . . . . . . . . (.36%) (.63%) (.67%) Total expenses . . . . . . . . . . . . . . . . . . . . . . . . . . . . . 2.88% 2.93% 4.32%Expenses before offsets . . . . . . . . . . . . . . . . . . . . . . . 1.77% 1.77% 1.85%Net expenses . . . . . . . . . . . . . . . . . . . . . . . . . . . . . . 1.75% 1.75% 1.75%
Portfolio turnover . . . . . . . . . . . . . . . . . . . . . . . . . . . . . 7% 9% 13%Net assets, ending (in thousands) . . . . . . . . . . . . . . . $2,534 $1,391 $1,318
SOCIALLY RESPONSIBLE PROSPECTUS – 128
See notes to financial highlights.

SOCIALLY RESPONSIBLE PROSPECTUS – 129
CSIF ENHANCED EQUITY FINANCIAL HIGHLIGHTS
YEARS ENDED
SEPTEMBER 30, SEPTEMBER 30,CLASS A SHARES 2005 2004
Net asset value, beginning . . . . . . . . . . . . . . . . . . . . . . . . . . . . . . . . $16.96 $15.17Income from investment operations
Net investment income (loss) . . . . . . . . . . . . . . . . . . . . . . . . . . . . . . .12 .03Net realized and unrealized gain (loss) . . . . . . . . . . . . . . . . . . . . . . . . 1.75 1.76
Total from investment operations . . . . . . . . . . . . . . . . . . . . . . . . . 1.87 1.79Distributions from
Net investment income . . . . . . . . . . . . . . . . . . . . . . . . . . . . . . . . . . . (.07) —Total increase (decrease) in net asset value . . . . . . . . . . . . . . . . . . . . . . . 1.80 1.79Net asset value, ending . . . . . . . . . . . . . . . . . . . . . . . . . . . . . . . . . . . $18.76 $16.96
Total return* . . . . . . . . . . . . . . . . . . . . . . . . . . . . . . . . . . . . . . . . . . . . . 11.03%(r) 11.80%Ratios to average net assets:A
Net investment income (loss) . . . . . . . . . . . . . . . . . . . . . . . . . . . . . . .64% .19%Total expenses . . . . . . . . . . . . . . . . . . . . . . . . . . . . . . . . . . . . . . . . . . 1.38% 1.43%Expenses before offsets . . . . . . . . . . . . . . . . . . . . . . . . . . . . . . . . . . . 1.28% 1.43% Net expenses . . . . . . . . . . . . . . . . . . . . . . . . . . . . . . . . . . . . . . . . . . . 1.27% 1.41%
Portfolio turnover . . . . . . . . . . . . . . . . . . . . . . . . . . . . . . . . . . . . . . . . . 38% 13%Net assets, ending (in thousands) . . . . . . . . . . . . . . . . . . . . . . . . . . . $54,618 $55,253
YEARS ENDED
SEPTEMBER 30, SEPTEMBER 30, SEPTEMBER 30,CLASS A SHARES 2003 2002 2001
Net asset value, beginning . . . . . . . . . . . . . . . . . . . . $12.24 $14.64 $19.91Income from investment operations
Net investment income (loss) . . . . . . . . . . . . . . . . . . .03 .01 (.01)Net realized and unrealized gain (loss) . . . . . . . . . . . 2.90 (2.41) (5.12)
Total from investment operations . . . . . . . . . . . . 2.93 (2.40) (5.13)Distributions from
Net investment income . . . . . . . . . . . . . . . . . . . . . . — — —Net realized gain . . . . . . . . . . . . . . . . . . . . . . . . . . . — — (.14)
Total distributions . . . . . . . . . . . . . . . . . . . . . . . . — — (.14)Total increase (decrease) in net asset value . . . . . . . . . . 2.93 (2.40) (5.27)Net asset value, ending . . . . . . . . . . . . . . . . . . . . . . . $15.17 $12.24 $14.64
Total return* . . . . . . . . . . . . . . . . . . . . . . . . . . . . . . . . . 23.94% (16.37%) (25.93%)Ratios to average net assets:A
Net investment income (loss) . . . . . . . . . . . . . . . . . . .24% .09% (.06%)Total expenses . . . . . . . . . . . . . . . . . . . . . . . . . . . . . 1.54% 1.46% 1.43%Expenses before offsets . . . . . . . . . . . . . . . . . . . . . . . 1.45% 1.27% 1.32%Net expenses . . . . . . . . . . . . . . . . . . . . . . . . . . . . . . 1.44% 1.25% 1.25%
Portfolio turnover . . . . . . . . . . . . . . . . . . . . . . . . . . . . . 42% 36% 39%Net assets, ending (in thousands) . . . . . . . . . . . . . . . $39,145 $26,842 $30,525
SOCIALLY RESPONSIBLE PROSPECTUS – 129
See notes to financial highlights.

SOCIALLY RESPONSIBLE PROSPECTUS – 130
CSIF ENHANCED EQUITY FINANCIAL HIGHLIGHTS
YEARS ENDED
SEPTEMBER 30, SEPTEMBER 30,CLASS B SHARES 2005 2004
Net asset value, beginning . . . . . . . . . . . . . . . . . . . . . . . . . . . . . . . . $15.84 $14.30Income from investment operations
Net investment income (loss) . . . . . . . . . . . . . . . . . . . . . . . . . . . . . . (.05) (.12)Net realized and unrealized gain (loss) . . . . . . . . . . . . . . . . . . . . . . . . 1.64 1.66
Total from investment operations . . . . . . . . . . . . . . . . . . . . . . . . . 1.59 1.54Total increase (decrease) in net asset value . . . . . . . . . . . . . . . . . . . . . . . 1.59 1.54Net asset value, ending . . . . . . . . . . . . . . . . . . . . . . . . . . . . . . . . . . . $17.43 $15.84
Total return* . . . . . . . . . . . . . . . . . . . . . . . . . . . . . . . . . . . . . . . . . . . . . 10.04%(r) 10.77%Ratios to average net assets:A
Net investment income (loss) . . . . . . . . . . . . . . . . . . . . . . . . . . . . . . (.31%) (.75%)Total expenses . . . . . . . . . . . . . . . . . . . . . . . . . . . . . . . . . . . . . . . . . . 2.32% 2.37%Expenses before offsets . . . . . . . . . . . . . . . . . . . . . . . . . . . . . . . . . . . 2.22% 2.37%Net expenses . . . . . . . . . . . . . . . . . . . . . . . . . . . . . . . . . . . . . . . . . . . 2.21% 2.36%
Portfolio turnover . . . . . . . . . . . . . . . . . . . . . . . . . . . . . . . . . . . . . . . . . 38% 13%Net assets, ending (in thousands) . . . . . . . . . . . . . . . . . . . . . . . . . . . $9,043 $8,391
YEARS ENDED
SEPTEMBER 30, SEPTEMBER 30, SEPTEMBER 30,CLASS B SHARES 2003 2002 2001
Net asset value, beginning . . . . . . . . . . . . . . . . . . . . $11.67 $14.12 $19.41Income from investment operations
Net investment income (loss) . . . . . . . . . . . . . . . . . . (.10) (.16) (.20)Net realized and unrealized gain (loss) . . . . . . . . . . . 2.73 (2.29) (4.95)
Total from investment operations . . . . . . . . . . . . 2.63 (2.45) (5.15)Distributions from
Net realized gain . . . . . . . . . . . . . . . . . . . . . . . . . . . — — (.14)Total increase (decrease) in net asset value . . . . . . . . . . 2.63 (2.45) (5.29)Net asset value, ending . . . . . . . . . . . . . . . . . . . . . . . $14.30 $11.67 $14.12
Total return* . . . . . . . . . . . . . . . . . . . . . . . . . . . . . . . . . 22.54% (17.33%) (26.70%)Ratios to average net assets:A
Net investment income (loss) . . . . . . . . . . . . . . . . . . (.82%) (1.11%) (1.18%)Total expenses . . . . . . . . . . . . . . . . . . . . . . . . . . . . . 2.55% 2.47% 2.42%Expenses before offsets . . . . . . . . . . . . . . . . . . . . . . . 2.51% 2.47% 2.42%Net expenses . . . . . . . . . . . . . . . . . . . . . . . . . . . . . . 2.50% 2.45% 2.36%
Portfolio turnover . . . . . . . . . . . . . . . . . . . . . . . . . . . . . 42% 36% 39%Net assets, ending (in thousands) . . . . . . . . . . . . . . . $6,936 $4,980 $5,488
SOCIALLY RESPONSIBLE PROSPECTUS – 130
See notes to financial highlights.

SOCIALLY RESPONSIBLE PROSPECTUS – 131SOCIALLY RESPONSIBLE PROSPECTUS – 131
CSIF ENHANCED EQUITY FINANCIAL HIGHLIGHTS
YEARS ENDED
SEPTEMBER 30, SEPTEMBER 30,CLASS C SHARES 2005 2004
Net asset value, beginning . . . . . . . . . . . . . . . . . . . . . . . . . . . . . . . . $15.90 $14.35Income from investment operations
Net investment income (loss) . . . . . . . . . . . . . . . . . . . . . . . . . . . . . . (.05) (.10)Net realized and unrealized gain (loss) . . . . . . . . . . . . . . . . . . . . . . . . 1.65 1.65
Total from investment operations . . . . . . . . . . . . . . . . . . . . . . . . . 1.60 1.55Total increase (decrease) in net asset value . . . . . . . . . . . . . . . . . . . . . . . 1.60 1.55Net asset value, ending . . . . . . . . . . . . . . . . . . . . . . . . . . . . . . . . . . . $17.50 $15.90
Total return* . . . . . . . . . . . . . . . . . . . . . . . . . . . . . . . . . . . . . . . . . . . . . 10.06%(r) 10.80%Ratios to average net assets:A
Net investment income (loss) . . . . . . . . . . . . . . . . . . . . . . . . . . . . . . (.29%) (.72%)Total expenses . . . . . . . . . . . . . . . . . . . . . . . . . . . . . . . . . . . . . . . . . . 2.28% 2.34%Expenses before offsets . . . . . . . . . . . . . . . . . . . . . . . . . . . . . . . . . . . 2.18% 2.34%Net expenses . . . . . . . . . . . . . . . . . . . . . . . . . . . . . . . . . . . . . . . . . . . 2.17% 2.32%
Portfolio turnover . . . . . . . . . . . . . . . . . . . . . . . . . . . . . . . . . . . . . . . . . 38% 13%Net assets, ending (in thousands) . . . . . . . . . . . . . . . . . . . . . . . . . . . $7,344 $6,038
YEARS ENDED
SEPTEMBER 30, SEPTEMBER 30, SEPTEMBER 30,CLASS C SHARES 2003 2002 2001
Net asset value, beginning . . . . . . . . . . . . . . . . . . . . $11.71 $14.16 $19.48Income from investment operations
Net investment income (loss) . . . . . . . . . . . . . . . . . . (.10) (.16) (.19)Net realized and unrealized gain (loss) . . . . . . . . . . . 2.74 (2.29) (4.99)
Total from investment operations . . . . . . . . . . . . 2.64 (2.45) (5.18)Distributions from
Net realized gain . . . . . . . . . . . . . . . . . . . . . . . . . . . — (.14)Total increase (decrease) in net asset value . . . . . . . . . . 2.64 (2.45) (5.32)Net asset value, ending . . . . . . . . . . . . . . . . . . . . . . . $14.35 $11.71 $14.16
Total return* . . . . . . . . . . . . . . . . . . . . . . . . . . . . . . . . . 22.54% (17.28%) (26.76%)Ratios to average net assets:A
Net investment income (loss) . . . . . . . . . . . . . . . . . . (.83%) (1.10%) (1.14%)Total expenses . . . . . . . . . . . . . . . . . . . . . . . . . . . . . 2.56% 2.47% 2.38%Expenses before offsets . . . . . . . . . . . . . . . . . . . . . . . 2.51% 2.47% 2.38%Net expenses . . . . . . . . . . . . . . . . . . . . . . . . . . . . . . 2.50% 2.45% 2.32%
Portfolio turnover . . . . . . . . . . . . . . . . . . . . . . . . . . . . . 42% 36% 39%Net assets, ending (in thousands) . . . . . . . . . . . . . . . $4,433 $3,060 $3,376
See notes to financial highlights.

SOCIALLY RESPONSIBLE PROSPECTUS – 132SOCIALLY RESPONSIBLE PROSPECTUS – 132
CALVERT LARGE CAP GROWTHFINANCIAL HIGHLIGHTS
YEARS ENDED
SEPTEMBER 30, SEPTEMBER 30, SEPTEMBER 30,CLASS A SHARES 2005 2004 2003
Net asset value, beginning . . . . . . . . . . . . . . . . . . . . $24.37 $21.09 $16.25Income from investment operations
Net investment income (loss) . . . . . . . . . . . . . . . . . . (.12) (.10) (.16)Net realized and unrealized gain (loss) . . . . . . . . . . . 5.07 3.38 5.00
Total from investment operations . . . . . . . . . . . . 4.95 3.28 4.84Total increase (decrease) in net asset value . . . . . . . . . . 4.95 3.28 4.84Net asset value, ending . . . . . . . . . . . . . . . . . . . . . . . $29.32 $24.37 $21.09
Total return* . . . . . . . . . . . . . . . . . . . . . . . . . . . . . . . . . 20.31% 15.55% 29.78%Ratios to average net assets:A
Net investment income (loss) . . . . . . . . . . . . . . . . . . (.72%) (.87%) (1.07%)Total expenses . . . . . . . . . . . . . . . . . . . . . . . . . . . . . 1.56% 1.85% 2.53%Expenses before offsets . . . . . . . . . . . . . . . . . . . . . . . 1.56% 1.62% 1.70%Net expenses . . . . . . . . . . . . . . . . . . . . . . . . . . . . . . 1.55% 1.61% 1.68%
Portfolio turnover . . . . . . . . . . . . . . . . . . . . . . . . . . . . . 61% 56% 78%Net assets, ending (in thousands) . . . . . . . . . . . . . . . $373,113 $97,781 $18,139
PERIODS ENDED
SEPTEMBER 30, SEPTEMBER 30 JUNE 30,CLASS A SHARES 2002 2001## 2001#
Net asset value, beginning . . . . . . . . . . . . . . . . . . . . $19.19 $23.27 $29.87Income from investment operations
Net investment income (loss) . . . . . . . . . . . . . . . . . . (.10) (.02) (.08)Net realized and unrealized gain (loss) . . . . . . . . . . . (2.84) (4.06) (6.52)
Total from investment operations . . . . . . . . . . . . (2.94) (4.08) (6.60)Total increase (decrease) in net asset value . . . . . . . . . . (2.94) (4.08) (6.60)Net asset value, ending . . . . . . . . . . . . . . . . . . . . . . . $16.25 $19.19 $23.27
Total return* . . . . . . . . . . . . . . . . . . . . . . . . . . . . . . . . . (15.32%) (17.53%) (22.10%)Ratios to average net assets:A
Net investment income (loss) . . . . . . . . . . . . . . . . . . (.64%) (.61%) (a) (.54%) (a)Total expenses . . . . . . . . . . . . . . . . . . . . . . . . . . . . . 2.48% 2.62% (a) 3.02% (a)Expenses before offsets . . . . . . . . . . . . . . . . . . . . . . . 1.42% 1.39% (a) 1.42% (a)Net expenses . . . . . . . . . . . . . . . . . . . . . . . . . . . . . . 1.39% 1.30% (a) 1.37% (a)
Portfolio turnover . . . . . . . . . . . . . . . . . . . . . . . . . . . . . 71% 31% 122%Net assets, ending (in thousands) . . . . . . . . . . . . . . . $8,758 $6,915 $7,318
See notes to financial highlights.
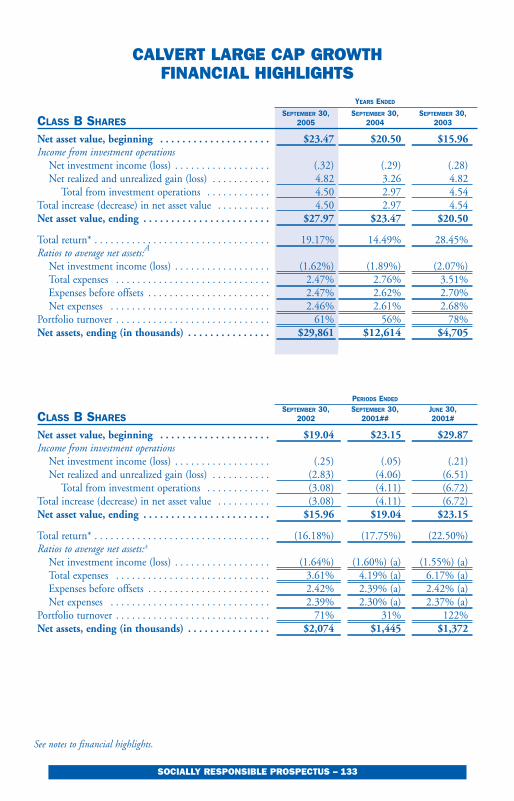
SOCIALLY RESPONSIBLE PROSPECTUS – 133
CALVERT LARGE CAP GROWTHFINANCIAL HIGHLIGHTS
YEARS ENDED
SEPTEMBER 30, SEPTEMBER 30, SEPTEMBER 30,CLASS B SHARES 2005 2004 2003
Net asset value, beginning . . . . . . . . . . . . . . . . . . . . $23.47 $20.50 $15.96Income from investment operations
Net investment income (loss) . . . . . . . . . . . . . . . . . . (.32) (.29) (.28)Net realized and unrealized gain (loss) . . . . . . . . . . . 4.82 3.26 4.82
Total from investment operations . . . . . . . . . . . . 4.50 2.97 4.54Total increase (decrease) in net asset value . . . . . . . . . . 4.50 2.97 4.54Net asset value, ending . . . . . . . . . . . . . . . . . . . . . . . $27.97 $23.47 $20.50
Total return* . . . . . . . . . . . . . . . . . . . . . . . . . . . . . . . . . 19.17% 14.49% 28.45%Ratios to average net assets:A
Net investment income (loss) . . . . . . . . . . . . . . . . . . (1.62%) (1.89%) (2.07%)Total expenses . . . . . . . . . . . . . . . . . . . . . . . . . . . . . 2.47% 2.76% 3.51%Expenses before offsets . . . . . . . . . . . . . . . . . . . . . . . 2.47% 2.62% 2.70%Net expenses . . . . . . . . . . . . . . . . . . . . . . . . . . . . . . 2.46% 2.61% 2.68%
Portfolio turnover . . . . . . . . . . . . . . . . . . . . . . . . . . . . . 61% 56% 78%Net assets, ending (in thousands) . . . . . . . . . . . . . . . $29,861 $12,614 $4,705
PERIODS ENDED
SEPTEMBER 30, SEPTEMBER 30, JUNE 30,CLASS B SHARES 2002 2001## 2001#
Net asset value, beginning . . . . . . . . . . . . . . . . . . . . $19.04 $23.15 $29.87Income from investment operations
Net investment income (loss) . . . . . . . . . . . . . . . . . . (.25) (.05) (.21)Net realized and unrealized gain (loss) . . . . . . . . . . . (2.83) (4.06) (6.51)
Total from investment operations . . . . . . . . . . . . (3.08) (4.11) (6.72)Total increase (decrease) in net asset value . . . . . . . . . . (3.08) (4.11) (6.72)Net asset value, ending . . . . . . . . . . . . . . . . . . . . . . . $15.96 $19.04 $23.15
Total return* . . . . . . . . . . . . . . . . . . . . . . . . . . . . . . . . . (16.18%) (17.75%) (22.50%)Ratios to average net assets:A
Net investment income (loss) . . . . . . . . . . . . . . . . . . (1.64%) (1.60%) (a) (1.55%) (a)Total expenses . . . . . . . . . . . . . . . . . . . . . . . . . . . . . 3.61% 4.19% (a) 6.17% (a) Expenses before offsets . . . . . . . . . . . . . . . . . . . . . . . 2.42% 2.39% (a) 2.42% (a) Net expenses . . . . . . . . . . . . . . . . . . . . . . . . . . . . . . 2.39% 2.30% (a) 2.37% (a)
Portfolio turnover . . . . . . . . . . . . . . . . . . . . . . . . . . . . . 71% 31% 122%Net assets, ending (in thousands) . . . . . . . . . . . . . . . $2,074 $1,445 $1,372
See notes to financial highlights.

SOCIALLY RESPONSIBLE PROSPECTUS – 134SOCIALLY RESPONSIBLE PROSPECTUS – 134
CALVERT LARGE CAP GROWTHFINANCIAL HIGHLIGHTS
YEARS ENDED
SEPTEMBER 30, SEPTEMBER 30, SEPTEMBER 30,CLASS C SHARES 2005 2004 2003
Net asset value, beginning . . . . . . . . . . . . . . . . . . . . $23.55 $20.59 $16.02Income from investment operations
Net investment income (loss) . . . . . . . . . . . . . . . . . . (.25) (.24) (.26)Net realized and unrealized gain (loss) . . . . . . . . . . . 4.80 3.20 4.83
Total from investment operations . . . . . . . . . . . . 4.55 2.96 4.57Total increase (decrease) in net asset value . . . . . . . . . . 4.55 2.96 4.57Net asset value, ending . . . . . . . . . . . . . . . . . . . . . . . $28.10 $23.55 $20.59
Total return* . . . . . . . . . . . . . . . . . . . . . . . . . . . . . . . . . 19.32% 14.38% 28.53%Ratios to average net assets:A
Net investment income (loss) . . . . . . . . . . . . . . . . . . (1.54%) (1.88%) (2.08%) Total expenses . . . . . . . . . . . . . . . . . . . . . . . . . . . . . 2.39% 2.74% 3.78%Expenses before offsets . . . . . . . . . . . . . . . . . . . . . . . 2.39% 2.62% 2.70%Net expenses . . . . . . . . . . . . . . . . . . . . . . . . . . . . . . 2.38% 2.61% 2.68%
Portfolio turnover . . . . . . . . . . . . . . . . . . . . . . . . . . . . . 61% 56% 78%Net assets, ending (in thousands) . . . . . . . . . . . . . . . $41,036 $11,288 $2,635
PERIODS ENDED
SEPTEMBER 30, SEPTEMBER 30, JUNE 30,CLASS C SHARES 2002 2001## 2001#
Net asset value, beginning . . . . . . . . . . . . . . . . . . . . $19.12 $23.24 $29.87Income from investment operations
Net investment income (loss) . . . . . . . . . . . . . . . . . . (.24) (.06) (.21)Net realized and unrealized gain (loss) . . . . . . . . . . . (2.86) (4.06) (6.42)
Total from investment operations . . . . . . . . . . . . (3.10) (4.12) (6.63)Total increase (decrease) in net asset value . . . . . . . . . . (3.10) (4.12) (6.63)Net asset value, ending . . . . . . . . . . . . . . . . . . . . . . . $16.02 $19.12 $23.24
Total return* . . . . . . . . . . . . . . . . . . . . . . . . . . . . . . . . . (16.21%) (17.73%) (22.20%)Ratios to average net assets:A
Net investment income (loss) . . . . . . . . . . . . . . . . . . (1.64%) (1.62%) (a) (1.50%) (a)Total expenses . . . . . . . . . . . . . . . . . . . . . . . . . . . . . 3.96% 5.14% (a) 5.75% (a)Expenses before offsets . . . . . . . . . . . . . . . . . . . . . . . 2.42% 2.39% (a) 2.42% (a)Net expenses . . . . . . . . . . . . . . . . . . . . . . . . . . . . . . 2.39% 2.30% (a) 2.37% (a)
Portfolio turnover . . . . . . . . . . . . . . . . . . . . . . . . . . . . . 71% 31% 122%Net assets, ending (in thousands) . . . . . . . . . . . . . . . $1,234 $691 $743
See notes to financial highlights.
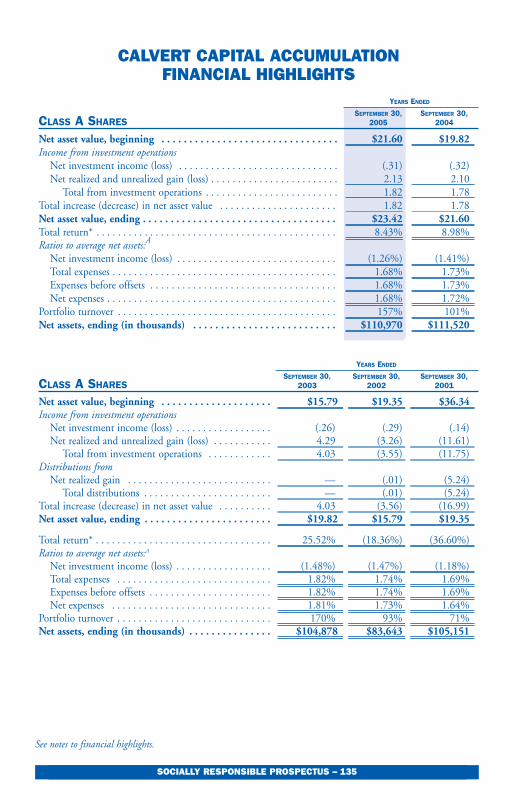
SOCIALLY RESPONSIBLE PROSPECTUS – 135SOCIALLY RESPONSIBLE PROSPECTUS – 135
CALVERT CAPITAL ACCUMULATIONFINANCIAL HIGHLIGHTS
YEARS ENDED
SEPTEMBER 30, SEPTEMBER 30,CLASS A SHARES 2005 2004
Net asset value, beginning . . . . . . . . . . . . . . . . . . . . . . . . . . . . . . . . $21.60 $19.82Income from investment operations
Net investment income (loss) . . . . . . . . . . . . . . . . . . . . . . . . . . . . . . (.31) (.32)Net realized and unrealized gain (loss) . . . . . . . . . . . . . . . . . . . . . . . . 2.13 2.10
Total from investment operations . . . . . . . . . . . . . . . . . . . . . . . . . 1.82 1.78Total increase (decrease) in net asset value . . . . . . . . . . . . . . . . . . . . . . 1.82 1.78Net asset value, ending . . . . . . . . . . . . . . . . . . . . . . . . . . . . . . . . . . . $23.42 $21.60Total return* . . . . . . . . . . . . . . . . . . . . . . . . . . . . . . . . . . . . . . . . . . . . . 8.43% 8.98%Ratios to average net assets:A
Net investment income (loss) . . . . . . . . . . . . . . . . . . . . . . . . . . . . . . (1.26%) (1.41%)Total expenses . . . . . . . . . . . . . . . . . . . . . . . . . . . . . . . . . . . . . . . . . . 1.68% 1.73%Expenses before offsets . . . . . . . . . . . . . . . . . . . . . . . . . . . . . . . . . . . 1.68% 1.73%Net expenses . . . . . . . . . . . . . . . . . . . . . . . . . . . . . . . . . . . . . . . . . . . 1.68% 1.72%
Portfolio turnover . . . . . . . . . . . . . . . . . . . . . . . . . . . . . . . . . . . . . . . . . 157% 101%Net assets, ending (in thousands) . . . . . . . . . . . . . . . . . . . . . . . . . . $110,970 $111,520
YEARS ENDED
SEPTEMBER 30, SEPTEMBER 30, SEPTEMBER 30,CLASS A SHARES 2003 2002 2001
Net asset value, beginning . . . . . . . . . . . . . . . . . . . . $15.79 $19.35 $36.34Income from investment operations
Net investment income (loss) . . . . . . . . . . . . . . . . . . (.26) (.29) (.14)Net realized and unrealized gain (loss) . . . . . . . . . . . 4.29 (3.26) (11.61)
Total from investment operations . . . . . . . . . . . . 4.03 (3.55) (11.75)Distributions from
Net realized gain . . . . . . . . . . . . . . . . . . . . . . . . . . . — (.01) (5.24)Total distributions . . . . . . . . . . . . . . . . . . . . . . . . — (.01) (5.24)
Total increase (decrease) in net asset value . . . . . . . . . . 4.03 (3.56) (16.99)Net asset value, ending . . . . . . . . . . . . . . . . . . . . . . . $19.82 $15.79 $19.35
Total return* . . . . . . . . . . . . . . . . . . . . . . . . . . . . . . . . . 25.52% (18.36%) (36.60%)Ratios to average net assets:A
Net investment income (loss) . . . . . . . . . . . . . . . . . . (1.48%) (1.47%) (1.18%)Total expenses . . . . . . . . . . . . . . . . . . . . . . . . . . . . . 1.82% 1.74% 1.69%Expenses before offsets . . . . . . . . . . . . . . . . . . . . . . . 1.82% 1.74% 1.69%Net expenses . . . . . . . . . . . . . . . . . . . . . . . . . . . . . . 1.81% 1.73% 1.64%
Portfolio turnover . . . . . . . . . . . . . . . . . . . . . . . . . . . . . 170% 93% 71%Net assets, ending (in thousands) . . . . . . . . . . . . . . . $104,878 $83,643 $105,151
See notes to financial highlights.

SOCIALLY RESPONSIBLE PROSPECTUS – 136SOCIALLY RESPONSIBLE PROSPECTUS – 136
CALVERT CAPITAL ACCUMULATIONFINANCIAL HIGHLIGHTS
YEARS ENDED
SEPTEMBER 30, SEPTEMBER 30,CLASS B SHARES 2005 2004
Net asset value, beginning . . . . . . . . . . . . . . . . . . . . . . . . . . . . . . . . $20.24 $18.73Income from investment operations
Net investment income (loss) . . . . . . . . . . . . . . . . . . . . . . . . . . . . . . (.49) (.48)Net realized and unrealized gain (loss) . . . . . . . . . . . . . . . . . . . . . . . 2.01 1.99
Total from investment operations . . . . . . . . . . . . . . . . . . . . . . . . 1.52 1.51Total increase (decrease) in net asset value . . . . . . . . . . . . . . . . . . . . . . 1.52 1.51Net asset value, ending . . . . . . . . . . . . . . . . . . . . . . . . . . . . . . . . . . . $21.76 $20.24Total return* . . . . . . . . . . . . . . . . . . . . . . . . . . . . . . . . . . . . . . . . . . . . . 7.51% 8.06%Ratios to average net assets:A
Net investment income (loss) . . . . . . . . . . . . . . . . . . . . . . . . . . . . . . (2.12%) (2.28%)Total expenses . . . . . . . . . . . . . . . . . . . . . . . . . . . . . . . . . . . . . . . . . . 2.54% 2.60%Expenses before offsets . . . . . . . . . . . . . . . . . . . . . . . . . . . . . . . . . . . 2.54% 2.60%Net expenses . . . . . . . . . . . . . . . . . . . . . . . . . . . . . . . . . . . . . . . . . . . 2.53% 2.59%
Portfolio turnover . . . . . . . . . . . . . . . . . . . . . . . . . . . . . . . . . . . . . . . . . 157% 101%Net assets, ending (in thousands) . . . . . . . . . . . . . . . . . . . . . . . . . . $16,503 $16,936
YEARS ENDED
SEPTEMBER 30, SEPTEMBER 30, SEPTEMBER 30,CLASS B SHARES 2003 2002 2001
Net asset value, beginning . . . . . . . . . . . . . . . . . . . . $15.07 $18.64 $35.47Income from investment operations
Net investment income (loss) . . . . . . . . . . . . . . . . . . (.39) (.44) (.24)Net realized and unrealized gain (loss) . . . . . . . . . . . 4.05 (3.12) (11.35)
Total from investment operations . . . . . . . . . . . . 3.66 (3.56) (11.59)Distributions from
Net realized gain . . . . . . . . . . . . . . . . . . . . . . . . . . . — (.01) (5.24)Total distributions . . . . . . . . . . . . . . . . . . . . . . . . — (.01) (5.24)
Total increase (decrease) in net asset value . . . . . . . . . . 3.66 (3.57) (16.83)Net asset value, ending . . . . . . . . . . . . . . . . . . . . . . . $18.73 $15.07 $18.64
Total return* . . . . . . . . . . . . . . . . . . . . . . . . . . . . . . . . . 24.29% (19.11%) (37.12%)Ratios to average net assets:A
Net investment income (loss) . . . . . . . . . . . . . . . . . . (2.45%) (2.38%) (2.04%)Total expenses . . . . . . . . . . . . . . . . . . . . . . . . . . . . . 2.79% 2.65% 2.56%Expenses before offsets . . . . . . . . . . . . . . . . . . . . . . . 2.79% 2.65% 2.56%Net expenses . . . . . . . . . . . . . . . . . . . . . . . . . . . . . . 2.78% 2.64% 2.50%
Portfolio turnover . . . . . . . . . . . . . . . . . . . . . . . . . . . . . 170% 93% 71%Net assets, ending (in thousands) . . . . . . . . . . . . . . . $15,152 $11,534 $13,914
See notes to financial highlights.
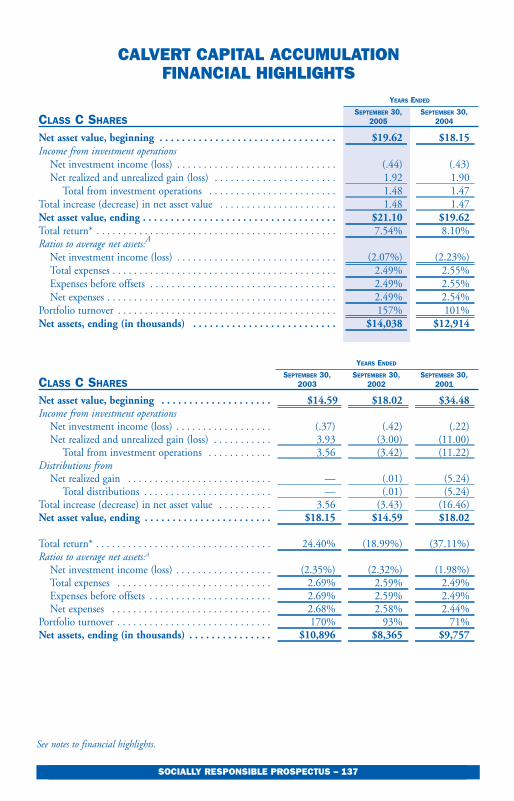
SOCIALLY RESPONSIBLE PROSPECTUS – 137SOCIALLY RESPONSIBLE PROSPECTUS – 137
CALVERT CAPITAL ACCUMULATIONFINANCIAL HIGHLIGHTS
YEARS ENDED
SEPTEMBER 30, SEPTEMBER 30,CLASS C SHARES 2005 2004
Net asset value, beginning . . . . . . . . . . . . . . . . . . . . . . . . . . . . . . . . $19.62 $18.15Income from investment operations
Net investment income (loss) . . . . . . . . . . . . . . . . . . . . . . . . . . . . . . (.44) (.43)Net realized and unrealized gain (loss) . . . . . . . . . . . . . . . . . . . . . . . 1.92 1.90
Total from investment operations . . . . . . . . . . . . . . . . . . . . . . . . 1.48 1.47Total increase (decrease) in net asset value . . . . . . . . . . . . . . . . . . . . . . 1.48 1.47Net asset value, ending . . . . . . . . . . . . . . . . . . . . . . . . . . . . . . . . . . . $21.10 $19.62Total return* . . . . . . . . . . . . . . . . . . . . . . . . . . . . . . . . . . . . . . . . . . . . . 7.54% 8.10%Ratios to average net assets:A
Net investment income (loss) . . . . . . . . . . . . . . . . . . . . . . . . . . . . . . (2.07%) (2.23%)Total expenses . . . . . . . . . . . . . . . . . . . . . . . . . . . . . . . . . . . . . . . . . . 2.49% 2.55%Expenses before offsets . . . . . . . . . . . . . . . . . . . . . . . . . . . . . . . . . . . 2.49% 2.55%Net expenses . . . . . . . . . . . . . . . . . . . . . . . . . . . . . . . . . . . . . . . . . . . 2.49% 2.54%
Portfolio turnover . . . . . . . . . . . . . . . . . . . . . . . . . . . . . . . . . . . . . . . . . 157% 101%Net assets, ending (in thousands) . . . . . . . . . . . . . . . . . . . . . . . . . . $14,038 $12,914
YEARS ENDED
SEPTEMBER 30, SEPTEMBER 30, SEPTEMBER 30,CLASS C SHARES 2003 2002 2001
Net asset value, beginning . . . . . . . . . . . . . . . . . . . . $14.59 $18.02 $34.48Income from investment operations
Net investment income (loss) . . . . . . . . . . . . . . . . . . (.37) (.42) (.22)Net realized and unrealized gain (loss) . . . . . . . . . . . 3.93 (3.00) (11.00)
Total from investment operations . . . . . . . . . . . . 3.56 (3.42) (11.22)Distributions from
Net realized gain . . . . . . . . . . . . . . . . . . . . . . . . . . . — (.01) (5.24)Total distributions . . . . . . . . . . . . . . . . . . . . . . . . — (.01) (5.24)
Total increase (decrease) in net asset value . . . . . . . . . . 3.56 (3.43) (16.46)Net asset value, ending . . . . . . . . . . . . . . . . . . . . . . . $18.15 $14.59 $18.02
Total return* . . . . . . . . . . . . . . . . . . . . . . . . . . . . . . . . . 24.40% (18.99%) (37.11%)Ratios to average net assets:A
Net investment income (loss) . . . . . . . . . . . . . . . . . . (2.35%) (2.32%) (1.98%)Total expenses . . . . . . . . . . . . . . . . . . . . . . . . . . . . . 2.69% 2.59% 2.49%Expenses before offsets . . . . . . . . . . . . . . . . . . . . . . . 2.69% 2.59% 2.49%Net expenses . . . . . . . . . . . . . . . . . . . . . . . . . . . . . . 2.68% 2.58% 2.44%
Portfolio turnover . . . . . . . . . . . . . . . . . . . . . . . . . . . . . 170% 93% 71%Net assets, ending (in thousands) . . . . . . . . . . . . . . . $10,896 $8,365 $9,757
See notes to financial highlights.

SOCIALLY RESPONSIBLE PROSPECTUS – 138SOCIALLY RESPONSIBLE PROSPECTUS – 138
CALVERT WORLD VALUES INTERNATIONAL EQUITYFINANCIAL HIGHLIGHTS
YEARS ENDED
SEPTEMBER 30, SEPTEMBER 30,CLASS A SHARES 2005 2004 (z)
Net asset value, beginning . . . . . . . . . . . . . . . . . . . . . . . . . . . . . . . . $16.60 $14.55Income from investment operations
Net investment income (loss) . . . . . . . . . . . . . . . . . . . . . . . . . . . . . . .21 .10Net realized and unrealized gain (loss) . . . . . . . . . . . . . . . . . . . . . . . . 3.59 2.12
Total from investment operations . . . . . . . . . . . . . . . . . . . . . . . . . 3.80 2.22Distributions from
Net investment income . . . . . . . . . . . . . . . . . . . . . . . . . . . . . . . . . . . (.11) (.17)Net realized gains . . . . . . . . . . . . . . . . . . . . . . . . . . . . . . . . . . . . . . . — —
Total distributions . . . . . . . . . . . . . . . . . . . . . . . . . . . . . . . . . . . . (.11) (.17)Total increase (decrease) in net asset value . . . . . . . . . . . . . . . . . . . . . . . 3.69 2.05Net asset value, ending . . . . . . . . . . . . . . . . . . . . . . . . . . . . . . . . . . . $20.29 $16.60
Total return* . . . . . . . . . . . . . . . . . . . . . . . . . . . . . . . . . . . . . . . . . . . . . 22.95% 15.30%Ratios to average net assets:A
Net investment income (loss) . . . . . . . . . . . . . . . . . . . . . . . . . . . . . . 1.23% .60%Total expenses . . . . . . . . . . . . . . . . . . . . . . . . . . . . . . . . . . . . . . . . . . 1.86% 1.97%Expenses before offsets . . . . . . . . . . . . . . . . . . . . . . . . . . . . . . . . . . . 1.86% 1.97%Net expenses . . . . . . . . . . . . . . . . . . . . . . . . . . . . . . . . . . . . . . . . . . . 1.85% 1.96%
Portfolio turnover . . . . . . . . . . . . . . . . . . . . . . . . . . . . . . . . . . . . . . . . . 49% 72%Net assets, ending (in thousands) . . . . . . . . . . . . . . . . . . . . . . . . . . . $297,151 $213,524
YEARS ENDED
SEPTEMBER 30, SEPTEMBER 30, SEPTEMBER 30,CLASS A SHARES 2003 2002 2001
Net asset value, beginning . . . . . . . . . . . . . . . . . . . . $11.99 $13.65 $21.77Income from investment operations
Net investment income (loss) . . . . . . . . . . . . . . . . . . .09 .01 .01Net realized and unrealized gain (loss) . . . . . . . . . . . 2.53 (1.59) (6.75)
Total from investment operations . . . . . . . . . . . .. 2.62 (1.58) (6.74)Distributions from
Net investment income . . . . . . . . . . . . . . . . . . . . . . (.06) — —Net realized gains . . . . . . . . . . . . . . . . . . . . . . . . . . — (.08) (1.38)
Total distributions . . . . . . . . . . . . . . . . . . . . . . . . (.06) (.08) (1.38)Total increase (decrease) in net asset value . . . . . . . . . . 2.56 (1.66) (8.12)Net asset value, ending . . . . . . . . . . . . . . . . . . . . . . . $14.55 $11.99 $13.65
Total return* . . . . . . . . . . . . . . . . . . . . . . . . . . . . . . . . . 21.93% (11.69%) (32.93%)Ratios to average net assets:A
Net investment income (loss) . . . . . . . . . . . . . . . . . . .72% .06% .07%Total expenses . . . . . . . . . . . . . . . . . . . . . . . . . . . . . 2.07% 2.02% 1.85%Expenses before offsets . . . . . . . . . . . . . . . . . . . . . . . 2.05% 2.00% 1.85%Net expenses . . . . . . . . . . . . . . . . . . . . . . . . . . . . . . 2.05% 1.99% 1.83%
Portfolio turnover . . . . . . . . . . . . . . . . . . . . . . . . . . . . . 71% 106% 93%Net assets, ending (in thousands) . . . . . . . . . . . . . . . $162,699 $129,887 $152,278
See notes to financial highlights.
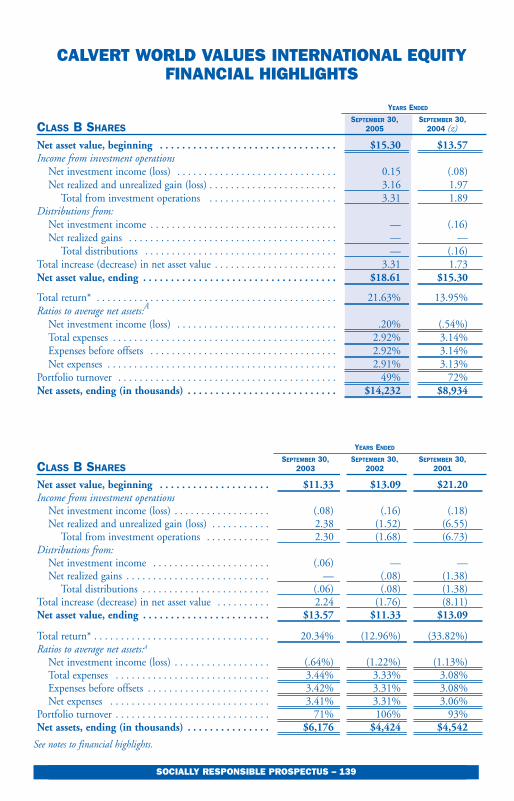
SOCIALLY RESPONSIBLE PROSPECTUS – 139SOCIALLY RESPONSIBLE PROSPECTUS – 139
CALVERT WORLD VALUES INTERNATIONAL EQUITYFINANCIAL HIGHLIGHTS
YEARS ENDED
SEPTEMBER 30, SEPTEMBER 30,CLASS B SHARES 2005 2004 (z)
Net asset value, beginning . . . . . . . . . . . . . . . . . . . . . . . . . . . . . . . . $15.30 $13.57Income from investment operations
Net investment income (loss) . . . . . . . . . . . . . . . . . . . . . . . . . . . . . . 0.15 (.08)Net realized and unrealized gain (loss) . . . . . . . . . . . . . . . . . . . . . . . . 3.16 1.97
Total from investment operations . . . . . . . . . . . . . . . . . . . . . . . . 3.31 1.89Distributions from:
Net investment income . . . . . . . . . . . . . . . . . . . . . . . . . . . . . . . . . . . — (.16)Net realized gains . . . . . . . . . . . . . . . . . . . . . . . . . . . . . . . . . . . . . . . — —
Total distributions . . . . . . . . . . . . . . . . . . . . . . . . . . . . . . . . . . . . — (.16)Total increase (decrease) in net asset value . . . . . . . . . . . . . . . . . . . . . . . 3.31 1.73Net asset value, ending . . . . . . . . . . . . . . . . . . . . . . . . . . . . . . . . . . . $18.61 $15.30
Total return* . . . . . . . . . . . . . . . . . . . . . . . . . . . . . . . . . . . . . . . . . . . . . 21.63% 13.95%Ratios to average net assets:A
Net investment income (loss) . . . . . . . . . . . . . . . . . . . . . . . . . . . . . . .20% (.54%)Total expenses . . . . . . . . . . . . . . . . . . . . . . . . . . . . . . . . . . . . . . . . . . 2.92% 3.14%Expenses before offsets . . . . . . . . . . . . . . . . . . . . . . . . . . . . . . . . . . . 2.92% 3.14%Net expenses . . . . . . . . . . . . . . . . . . . . . . . . . . . . . . . . . . . . . . . . . . . 2.91% 3.13%
Portfolio turnover . . . . . . . . . . . . . . . . . . . . . . . . . . . . . . . . . . . . . . . . . 49% 72%Net assets, ending (in thousands) . . . . . . . . . . . . . . . . . . . . . . . . . . . $14,232 $8,934
YEARS ENDED
SEPTEMBER 30, SEPTEMBER 30, SEPTEMBER 30,CLASS B SHARES 2003 2002 2001
Net asset value, beginning . . . . . . . . . . . . . . . . . . . . $11.33 $13.09 $21.20Income from investment operations
Net investment income (loss) . . . . . . . . . . . . . . . . . . (.08) (.16) (.18)Net realized and unrealized gain (loss) . . . . . . . . . . . 2.38 (1.52) (6.55)
Total from investment operations . . . . . . . . . . . . 2.30 (1.68) (6.73)Distributions from:
Net investment income . . . . . . . . . . . . . . . . . . . . . . (.06) — —Net realized gains . . . . . . . . . . . . . . . . . . . . . . . . . . . — (.08) (1.38)
Total distributions . . . . . . . . . . . . . . . . . . . . . . . . (.06) (.08) (1.38)Total increase (decrease) in net asset value . . . . . . . . . . 2.24 (1.76) (8.11)Net asset value, ending . . . . . . . . . . . . . . . . . . . . . . . $13.57 $11.33 $13.09
Total return* . . . . . . . . . . . . . . . . . . . . . . . . . . . . . . . . . 20.34% (12.96%) (33.82%)Ratios to average net assets:A
Net investment income (loss) . . . . . . . . . . . . . . . . . . (.64%) (1.22%) (1.13%)Total expenses . . . . . . . . . . . . . . . . . . . . . . . . . . . . . 3.44% 3.33% 3.08%Expenses before offsets . . . . . . . . . . . . . . . . . . . . . . . 3.42% 3.31% 3.08%Net expenses . . . . . . . . . . . . . . . . . . . . . . . . . . . . . . 3.41% 3.31% 3.06%
Portfolio turnover . . . . . . . . . . . . . . . . . . . . . . . . . . . . . 71% 106% 93%Net assets, ending (in thousands) . . . . . . . . . . . . . . . $6,176 $4,424 $4,542
See notes to financial highlights.

SOCIALLY RESPONSIBLE PROSPECTUS – 140SOCIALLY RESPONSIBLE PROSPECTUS – 140
CALVERT WORLD VALUES INTERNATIONAL EQUITYFINANCIAL HIGHLIGHTS
YEARS ENDED
SEPTEMBER 30, SEPTEMBER 30,CLASS C SHARES 2005 2004 (z)
Net asset value, beginning . . . . . . . . . . . . . . . . . . . . . . . . . . . . . . . . $14.91 $13.18Income from investment operations
Net investment income (loss) . . . . . . . . . . . . . . . . . . . . . . . . . . . . . . .15 (.04)Net realized and unrealized gain (loss) . . . . . . . . . . . . . . . . . . . . . . . . 3.12 1.92
Total from investment operations . . . . . . . . . . . . . . . . . . . . . . . . . 3.27 1.88Distributions from:
Net investment income . . . . . . . . . . . . . . . . . . . . . . . . . . . . . . . . . . . — (.15)Net realized gains . . . . . . . . . . . . . . . . . . . . . . . . . . . . . . . . . . . . . . . — —
Total distributions . . . . . . . . . . . . . . . . . . . . . . . . . . . . . . . . . . . . — (.15)Total increase (decrease) in net asset value . . . . . . . . . . . . . . . . . . . . . . . 3.27 1.73Net asset value, ending . . . . . . . . . . . . . . . . . . . . . . . . . . . . . . . . . . . $18.18 $14.91
Total return* . . . . . . . . . . . . . . . . . . . . . . . . . . . . . . . . . . . . . . . . . . . . . 21.93% 14.33%Ratios to average net assets:A
Net investment income (loss) . . . . . . . . . . . . . . . . . . . . . . . . . . . . . . .38% (.25%)Total expenses . . . . . . . . . . . . . . . . . . . . . . . . . . . . . . . . . . . . . . . . . . 2.75% 2.85%Expenses before offsets . . . . . . . . . . . . . . . . . . . . . . . . . . . . . . . . . . . 2.75% 2.85%Net expenses . . . . . . . . . . . . . . . . . . . . . . . . . . . . . . . . . . . . . . . . . . . 2.74% 2.84%
Portfolio turnover . . . . . . . . . . . . . . . . . . . . . . . . . . . . . . . . . . . . . . . . . 49% 72%Net assets, ending (in thousands) . . . . . . . . . . . . . . . . . . . . . . . . . . . $22,856 $14,533
YEARS ENDED
SEPTEMBER 30, SEPTEMBER 30, SEPTEMBER 30,CLASS C SHARES 2003 2002 2001
Net asset value, beginning . . . . . . . . . . . . . . . . . . . . $10.97 $12.64 $20.46Income from investment operations
Net investment income (loss) . . . . . . . . . . . . . . . . . . (.03) (.12) (.14)Net realized and unrealized gain (loss) . . . . . . . . . . . 2.30 (1.47) (6.30)
Total from investment operations . . . . . . . . . . . .. 2.27 (1.59) (6.44)Distributions from
Net investment income . . . . . . . . . . . . . . . . . . . . . . (.06) — —Net realized gains . . . . . . . . . . . . . . . . . . . . . . . . . . — (.08) (1.38)
Total distributions . . . . . . . . . . . . . . . . . . . . . . . . (.06) (.08) (1.38)Total increase (decrease) in net asset value . . . . . . . . . . 2.21 (1.67) (7.82)Net asset value, ending . . . . . . . . . . . . . . . . . . . . . . . $13.18 $10.97 $12.64
Total return* . . . . . . . . . . . . . . . . . . . . . . . . . . . . . . . . . 20.72% (12.71%) (33.62%)Ratios to average net assets:A
Net investment income (loss) . . . . . . . . . . . . . . . . . . (.27%) (.95%) (.89%)Total expenses . . . . . . . . . . . . . . . . . . . . . . . . . . . . . 3.09% 3.05% 2.81%Expenses before offsets . . . . . . . . . . . . . . . . . . . . . . . 3.07% 3.04% 2.81%Net expenses . . . . . . . . . . . . . . . . . . . . . . . . . . . . . . 3.07% 3.03% 2.79%
Portfolio turnover . . . . . . . . . . . . . . . . . . . . . . . . . . . . . 71% 106% 93%Net assets, ending (in thousands) . . . . . . . . . . . . . . . $9,764 $7,021 $7,434
See notes to financial highlights.

SOCIALLY RESPONSIBLE PROSPECTUS – 141SOCIALLY RESPONSIBLE PROSPECTUS – 141
CALVERT NEW VISION SMALL CAPFINANCIAL HIGHLIGHTS
YEARS ENDED
SEPTEMBER 30, SEPTEMBER 30,CLASS A SHARES 2005 2004
Net asset value, beginning . . . . . . . . . . . . . . . . . . . . . . . . . . . . . . . . $18.70 $16.43Income from investment operations
Net investment income (loss) . . . . . . . . . . . . . . . . . . . . . . . . . . . . . . (.06) (.10)Net realized and unrealized gain (loss) . . . . . . . . . . . . . . . . . . . . . . . .22 2.37
Total from investment operations . . . . . . . . . . . . . . . . . . . . . . . . .16 2.27Distributions from
Net investment income . . . . . . . . . . . . . . . . . . . . . . . . . . . . . . . . . . — —Net realized gain . . . . . . . . . . . . . . . . . . . . . . . . . . . . . . . . . . . . . . . . (.61) —
Total distributions . . . . . . . . . . . . . . . . . . . . . . . . . . . . . . . . . . . . (.61) —Total increase (decrease) in net asset value . . . . . . . . . . . . . . . . . . . . . . (.45) 2.27Net asset value, ending . . . . . . . . . . . . . . . . . . . . . . . . . . . . . . . . . . . $18.25 $18.70Total return* . . . . . . . . . . . . . . . . . . . . . . . . . . . . . . . . . . . . . . . . . . . . . 0.64% 13.82%Ratios to average net assets:A
Net investment income (loss) . . . . . . . . . . . . . . . . . . . . . . . . . . . . . . (0.28%) (0.53%) Total expenses . . . . . . . . . . . . . . . . . . . . . . . . . . . . . . . . . . . . . . . . . . 1.71% 1.69%Expenses before offsets . . . . . . . . . . . . . . . . . . . . . . . . . . . . . . . . . . . 1.71% 1.69%Net expenses . . . . . . . . . . . . . . . . . . . . . . . . . . . . . . . . . . . . . . . . . . . 1.70% 1.68%
Portfolio turnover . . . . . . . . . . . . . . . . . . . . . . . . . . . . . . . . . . . . . . . . . 169% 54%Net assets, ending (in thousands) . . . . . . . . . . . . . . . . . . . . . . . . . . $172,540 $214,143
YEARS ENDED
SEPTEMBER 30, SEPTEMBER 30, SEPTEMBER 30,CLASS A SHARES 2003 2002 2001
Net asset value, beginning . . . . . . . . . . . . . . . . . . . . $13.61 $15.39 $18.43Income from investment operations
Net investment income (loss) . . . . . . . . . . . . . . . . . . (.15) .19 (.11)Net realized and unrealized gain (loss) . . . . . . . . . . . 3.11 (1.60) (1.51)
Total from investment operations . . . . . . . . . . . . 2.96 (1.41) (1.62)Distributions from
Net investment income . . . . . . . . . . . . . . . . . . . . . . (.13) — —Net realized gain . . . . . . . . . . . . . . . . . . . . . . . . . . . (.01) (.37) (1.42)
Total distributions . . . . . . . . . . . . . . . . . . . . . . . . (.14) (.37) (1.42)Total increase (decrease) in net asset value . . . . . . . . . . 2.82 (1.78) (3.04)Net asset value, ending . . . . . . . . . . . . . . . . . . . . . . . $16.43 $13.61 $15.39Total return*. . . . . . . . . . . . . . . . . . . . . . . . . . . . . . . . . 21.89% (9.65%) (8.99%)Ratios to average net assets:A
Net investment income (loss) . . . . . . . . . . . . . . . . . . (1.03%) 1.11% (.66%)Total expenses . . . . . . . . . . . . . . . . . . . . . . . . . . . . . 1.77% 1.70% 1.76%Expenses before offsets . . . . . . . . . . . . . . . . . . . . . . . 1.76% 1.70% 1.72%Net expenses . . . . . . . . . . . . . . . . . . . . . . . . . . . . . . 1.75% 1.70% 1.63%
Portfolio turnover . . . . . . . . . . . . . . . . . . . . . . . . . . . . . 54% 41% 66%Net assets, ending (in thousands) . . . . . . . . . . . . . . . $157,611 $109,207 $84,979
See notes to financial highlights.
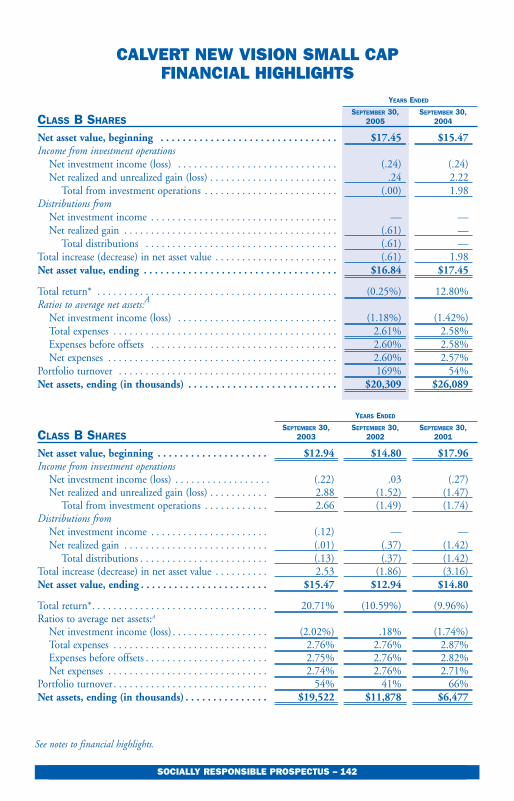
SOCIALLY RESPONSIBLE PROSPECTUS – 142SOCIALLY RESPONSIBLE PROSPECTUS – 142
CALVERT NEW VISION SMALL CAPFINANCIAL HIGHLIGHTS
YEARS ENDED
SEPTEMBER 30, SEPTEMBER 30,CLASS B SHARES 2005 2004
Net asset value, beginning . . . . . . . . . . . . . . . . . . . . . . . . . . . . . . . . $17.45 $15.47Income from investment operations
Net investment income (loss) . . . . . . . . . . . . . . . . . . . . . . . . . . . . . . (.24) (.24)Net realized and unrealized gain (loss) . . . . . . . . . . . . . . . . . . . . . . . . .24 2.22
Total from investment operations . . . . . . . . . . . . . . . . . . . . . . . . . (.00) 1.98Distributions from
Net investment income . . . . . . . . . . . . . . . . . . . . . . . . . . . . . . . . . . . — —Net realized gain . . . . . . . . . . . . . . . . . . . . . . . . . . . . . . . . . . . . . . . . (.61) —
Total distributions . . . . . . . . . . . . . . . . . . . . . . . . . . . . . . . . . . . . (.61) —Total increase (decrease) in net asset value . . . . . . . . . . . . . . . . . . . . . . . (.61) 1.98Net asset value, ending . . . . . . . . . . . . . . . . . . . . . . . . . . . . . . . . . . . $16.84 $17.45
Total return* . . . . . . . . . . . . . . . . . . . . . . . . . . . . . . . . . . . . . . . . . . . . . (0.25%) 12.80%Ratios to average net assets:A
Net investment income (loss) . . . . . . . . . . . . . . . . . . . . . . . . . . . . . . (1.18%) (1.42%)Total expenses . . . . . . . . . . . . . . . . . . . . . . . . . . . . . . . . . . . . . . . . . . 2.61% 2.58%Expenses before offsets . . . . . . . . . . . . . . . . . . . . . . . . . . . . . . . . . . . 2.60% 2.58%Net expenses . . . . . . . . . . . . . . . . . . . . . . . . . . . . . . . . . . . . . . . . . . . 2.60% 2.57%
Portfolio turnover . . . . . . . . . . . . . . . . . . . . . . . . . . . . . . . . . . . . . . . . . 169% 54%Net assets, ending (in thousands) . . . . . . . . . . . . . . . . . . . . . . . . . . . $20,309 $26,089
YEARS ENDED
SEPTEMBER 30, SEPTEMBER 30, SEPTEMBER 30,CLASS B SHARES 2003 2002 2001
Net asset value, beginning . . . . . . . . . . . . . . . . . . . . $12.94 $14.80 $17.96Income from investment operations
Net investment income (loss) . . . . . . . . . . . . . . . . . . (.22) .03 (.27)Net realized and unrealized gain (loss) . . . . . . . . . . . 2.88 (1.52) (1.47)
Total from investment operations . . . . . . . . . . . . 2.66 (1.49) (1.74)Distributions from
Net investment income . . . . . . . . . . . . . . . . . . . . . . (.12) — —Net realized gain . . . . . . . . . . . . . . . . . . . . . . . . . . . (.01) (.37) (1.42)
Total distributions . . . . . . . . . . . . . . . . . . . . . . . . (.13) (.37) (1.42)Total increase (decrease) in net asset value . . . . . . . . . . 2.53 (1.86) (3.16)Net asset value, ending . . . . . . . . . . . . . . . . . . . . . . . $15.47 $12.94 $14.80
Total return*. . . . . . . . . . . . . . . . . . . . . . . . . . . . . . . . . 20.71% (10.59%) (9.96%)Ratios to average net assets:A
Net investment income (loss) . . . . . . . . . . . . . . . . . . (2.02%) .18% (1.74%)Total expenses . . . . . . . . . . . . . . . . . . . . . . . . . . . . . 2.76% 2.76% 2.87%Expenses before offsets . . . . . . . . . . . . . . . . . . . . . . . 2.75% 2.76% 2.82%Net expenses . . . . . . . . . . . . . . . . . . . . . . . . . . . . . . 2.74% 2.76% 2.71%
Portfolio turnover . . . . . . . . . . . . . . . . . . . . . . . . . . . . . 54% 41% 66%Net assets, ending (in thousands) . . . . . . . . . . . . . . . $19,522 $11,878 $6,477
See notes to financial highlights.
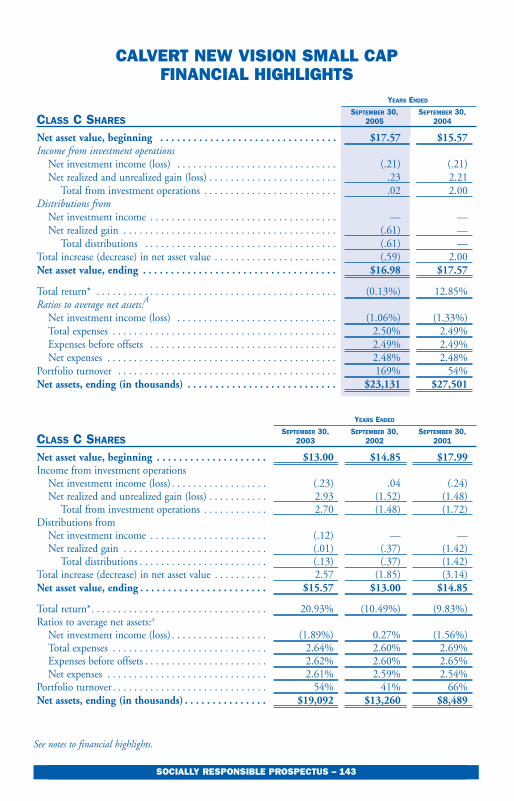
SOCIALLY RESPONSIBLE PROSPECTUS – 143
CALVERT NEW VISION SMALL CAPFINANCIAL HIGHLIGHTS
YEARS ENDED
SEPTEMBER 30, SEPTEMBER 30,CLASS C SHARES 2005 2004
Net asset value, beginning . . . . . . . . . . . . . . . . . . . . . . . . . . . . . . . . $17.57 $15.57Income from investment operations
Net investment income (loss) . . . . . . . . . . . . . . . . . . . . . . . . . . . . . . (.21) (.21)Net realized and unrealized gain (loss) . . . . . . . . . . . . . . . . . . . . . . . . .23 2.21
Total from investment operations . . . . . . . . . . . . . . . . . . . . . . . . . .02 2.00Distributions from
Net investment income . . . . . . . . . . . . . . . . . . . . . . . . . . . . . . . . . . . — —Net realized gain . . . . . . . . . . . . . . . . . . . . . . . . . . . . . . . . . . . . . . . . (.61) —
Total distributions . . . . . . . . . . . . . . . . . . . . . . . . . . . . . . . . . . . . (.61) —Total increase (decrease) in net asset value . . . . . . . . . . . . . . . . . . . . . . . (.59) 2.00Net asset value, ending . . . . . . . . . . . . . . . . . . . . . . . . . . . . . . . . . . . $16.98 $17.57
Total return* . . . . . . . . . . . . . . . . . . . . . . . . . . . . . . . . . . . . . . . . . . . . . (0.13%) 12.85%Ratios to average net assets:A
Net investment income (loss) . . . . . . . . . . . . . . . . . . . . . . . . . . . . . . (1.06%) (1.33%)Total expenses . . . . . . . . . . . . . . . . . . . . . . . . . . . . . . . . . . . . . . . . . . 2.50% 2.49%Expenses before offsets . . . . . . . . . . . . . . . . . . . . . . . . . . . . . . . . . . . 2.49% 2.49%Net expenses . . . . . . . . . . . . . . . . . . . . . . . . . . . . . . . . . . . . . . . . . . . 2.48% 2.48%
Portfolio turnover . . . . . . . . . . . . . . . . . . . . . . . . . . . . . . . . . . . . . . . . . 169% 54%Net assets, ending (in thousands) . . . . . . . . . . . . . . . . . . . . . . . . . . . $23,131 $27,501
YEARS ENDED
SEPTEMBER 30, SEPTEMBER 30, SEPTEMBER 30,CLASS C SHARES 2003 2002 2001
Net asset value, beginning . . . . . . . . . . . . . . . . . . . . $13.00 $14.85 $17.99Income from investment operations
Net investment income (loss) . . . . . . . . . . . . . . . . . . (.23) .04 (.24)Net realized and unrealized gain (loss) . . . . . . . . . . . 2.93 (1.52) (1.48)
Total from investment operations . . . . . . . . . . . . 2.70 (1.48) (1.72)Distributions from
Net investment income . . . . . . . . . . . . . . . . . . . . . . (.12) — —Net realized gain . . . . . . . . . . . . . . . . . . . . . . . . . . . (.01) (.37) (1.42)
Total distributions . . . . . . . . . . . . . . . . . . . . . . . . (.13) (.37) (1.42)Total increase (decrease) in net asset value . . . . . . . . . . 2.57 (1.85) (3.14)Net asset value, ending . . . . . . . . . . . . . . . . . . . . . . . $15.57 $13.00 $14.85
Total return*. . . . . . . . . . . . . . . . . . . . . . . . . . . . . . . . . 20.93% (10.49%) (9.83%)Ratios to average net assets:A
Net investment income (loss) . . . . . . . . . . . . . . . . . . (1.89%) 0.27% (1.56%)Total expenses . . . . . . . . . . . . . . . . . . . . . . . . . . . . . 2.64% 2.60% 2.69%Expenses before offsets . . . . . . . . . . . . . . . . . . . . . . . 2.62% 2.60% 2.65%Net expenses . . . . . . . . . . . . . . . . . . . . . . . . . . . . . . 2.61% 2.59% 2.54%
Portfolio turnover . . . . . . . . . . . . . . . . . . . . . . . . . . . . . 54% 41% 66%Net assets, ending (in thousands) . . . . . . . . . . . . . . . $19,092 $13,260 $8,489
SOCIALLY RESPONSIBLE PROSPECTUS – 143
See notes to financial highlights.

SOCIALLY RESPONSIBLE PROSPECTUS – 144
CALVERT SMALL CAP VALUEFINANCIAL HIGHLIGHTS
YEAR ENDED
SEPTEMBER 30,CLASS A SHARES 2005 (S)(Z)
Net asset value, beginning . . . . . . . . . . . . . . . . . . . . . . . . . . . . . . . . . . . . . . . . . . $15.00Income from investment operations
Net investment income . . . . . . . . . . . . . . . . . . . . . . . . . . . . . . . . . . . . . . . . . . . . . (.15)Net realized and unrealized gain (loss) . . . . . . . . . . . . . . . . . . . . . . . . . . . . . . . . . . 1.31
Total from investment operations . . . . . . . . . . . . . . . . . . . . . . . . . . . . . . . . . . . 1.16Total increase (decrease) in net asset value . . . . . . . . . . . . . . . . . . . . . . . . . . . . . . . . . 1.16Net asset value, ending . . . . . . . . . . . . . . . . . . . . . . . . . . . . . . . . . . . . . . . . . . . . . $16.16
Total return* . . . . . . . . . . . . . . . . . . . . . . . . . . . . . . . . . . . . . . . . . . . . . . . . . . . . . . . 7.73%Ratios to average net assets: A
Net investment income . . . . . . . . . . . . . . . . . . . . . . . . . . . . . . . . . . . . . . . . . . . . . (1.01%) (a)Total expenses . . . . . . . . . . . . . . . . . . . . . . . . . . . . . . . . . . . . . . . . . . . . . . . . . . . . 2.40% (a)Expenses before offsets . . . . . . . . . . . . . . . . . . . . . . . . . . . . . . . . . . . . . . . . . . . . . . 1.80% (a)Net expenses . . . . . . . . . . . . . . . . . . . . . . . . . . . . . . . . . . . . . . . . . . . . . . . . . . . . . 1.69% (a)
Portfolio turnover . . . . . . . . . . . . . . . . . . . . . . . . . . . . . . . . . . . . . . . . . . . . . . . . . . . . 39%Net assets, ending (in thousands) . . . . . . . . . . . . . . . . . . . . . . . . . . . . . . . . . . . . . $19,060
PERIOD ENDED
SEPTEMBER 30,CLASS C SHARES 2005 (T)(Z)
Net asset value, beginning . . . . . . . . . . . . . . . . . . . . . . . . . . . . . . . . . . . . . . . . . . $15.70Income from investment operations
Net investment income . . . . . . . . . . . . . . . . . . . . . . . . . . . . . . . . . . . . . . . . . . . . . (.13)Net realized and unrealized gain (loss) . . . . . . . . . . . . . . . . . . . . . . . . . . . . . . . . . . .52
Total from investment operations . . . . . . . . . . . . . . . . . . . . . . . . . . . . . . . . . . . .39Total increase (decrease) in net asset value . . . . . . . . . . . . . . . . . . . . . . . . . . . . . . . . . .39Net asset value, ending . . . . . . . . . . . . . . . . . . . . . . . . . . . . . . . . . . . . . . . . . . . . . $16.09
Total return* . . . . . . . . . . . . . . . . . . . . . . . . . . . . . . . . . . . . . . . . . . . . . . . . . . . . . . . 2.48%Ratios to average net assets: A
Net investment income . . . . . . . . . . . . . . . . . . . . . . . . . . . . . . . . . . . . . . . . . . . . . (2.04%) (a)Total expenses . . . . . . . . . . . . . . . . . . . . . . . . . . . . . . . . . . . . . . . . . . . . . . . . . . . . 21.28% (a)Expenses before offsets . . . . . . . . . . . . . . . . . . . . . . . . . . . . . . . . . . . . . . . . . . . . . . 2.80% (a)Net expenses . . . . . . . . . . . . . . . . . . . . . . . . . . . . . . . . . . . . . . . . . . . . . . . . . . . . . 2.69% (a)
Portfolio turnover . . . . . . . . . . . . . . . . . . . . . . . . . . . . . . . . . . . . . . . . . . . . . . . . . . . . 24%Net assets, ending (in thousands) . . . . . . . . . . . . . . . . . . . . . . . . . . . . . . . . . . . . . $203
See notes to financial highlights.

SOCIALLY RESPONSIBLE PROSPECTUS – 145
CALVERT MID CAP VALUEFINANCIAL HIGHLIGHTS
YEAR ENDED,SEPTEMBER 30,
CLASS A SHARES 2005(S)(Z)
Net asset value, beginning . . . . . . . . . . . . . . . . . . . . . . . . . . . . . . . . . . . . . . . . . . $15.00Income from investment operations
Net investment income . . . . . . . . . . . . . . . . . . . . . . . . . . . . . . . . . . . . . . . . . . . . . (.14)Net realized and unrealized gain (loss) . . . . . . . . . . . . . . . . . . . . . . . . . . . . . . . . . 2.30
Total from investment operations . . . . . . . . . . . . . . . . . . . . . . . . . . . . . . . . . . . 2.16Total increase (decrease) in net asset value . . . . . . . . . . . . . . . . . . . . . . . . . . . . . . . . . 2.16Net asset value, ending . . . . . . . . . . . . . . . . . . . . . . . . . . . . . . . . . . . . . . . . . . . . $17.16
Total return* . . . . . . . . . . . . . . . . . . . . . . . . . . . . . . . . . . . . . . . . . . . . . . . . . . . . . . . 14.40%Ratios to average net assets: A
Net investment income . . . . . . . . . . . . . . . . . . . . . . . . . . . . . . . . . . . . . . . . . . . . . (.89%) (a)Total expenses . . . . . . . . . . . . . . . . . . . . . . . . . . . . . . . . . . . . . . . . . . . . . . . . . . . . 2.29% (a)Expenses before offsets . . . . . . . . . . . . . . . . . . . . . . . . . . . . . . . . . . . . . . . . . . . . . 1.69% (a)Net expenses . . . . . . . . . . . . . . . . . . . . . . . . . . . . . . . . . . . . . . . . . . . . . . . . . . . . . 1.59% (a)
Portfolio turnover . . . . . . . . . . . . . . . . . . . . . . . . . . . . . . . . . . . . . . . . . . . . . . . . . . . 55%Net assets, ending (in thousands) . . . . . . . . . . . . . . . . . . . . . . . . . . . . . . . . . . . . $19,362
PERIOD ENDED,SEPTEMBER 30,
CLASS C SHARES 2005(T)(Z)
Net asset value, beginning . . . . . . . . . . . . . . . . . . . . . . . . . . . . . . . . . . . . . . . . . . $16.62Income from investment operations
Net investment income . . . . . . . . . . . . . . . . . . . . . . . . . . . . . . . . . . . . . . . . . . . . . (.13)Net realized and unrealized gain (loss) . . . . . . . . . . . . . . . . . . . . . . . . . . . . . . . . . .60
Total from investment operations . . . . . . . . . . . . . . . . . . . . . . . . . . . . . . . . . . . .47Total increase (decrease) in net asset value . . . . . . . . . . . . . . . . . . . . . . . . . . . . . . . . . .47Net asset value, ending . . . . . . . . . . . . . . . . . . . . . . . . . . . . . . . . . . . . . . . . . . . . $17.09
Total return* . . . . . . . . . . . . . . . . . . . . . . . . . . . . . . . . . . . . . . . . . . . . . . . . . . . . . . . 2.83%Ratios to average net assets: A
Net investment income . . . . . . . . . . . . . . . . . . . . . . . . . . . . . . . . . . . . . . . . . . . . . (1.86%) (a)Total expenses . . . . . . . . . . . . . . . . . . . . . . . . . . . . . . . . . . . . . . . . . . . . . . . . . . . . 11.25% (a)Expenses before offsets . . . . . . . . . . . . . . . . . . . . . . . . . . . . . . . . . . . . . . . . . . . . . 2.69% (a)Net expenses . . . . . . . . . . . . . . . . . . . . . . . . . . . . . . . . . . . . . . . . . . . . . . . . . . . . . 2.59% (a)
Portfolio turnover . . . . . . . . . . . . . . . . . . . . . . . . . . . . . . . . . . . . . . . . . . . . . . . . . . . 34%Net assets, ending (in thousands) . . . . . . . . . . . . . . . . . . . . . . . . . . . . . . . . . . . . $382
See notes to financial highlights.

SOCIALLY RESPONSIBLE PROSPECTUS – 146SOCIALLY RESPONSIBLE PROSPECTUS – 146
CSIF BOND FINANCIAL HIGHLIGHTS
YEARS ENDED
SEPTEMBER 30, SEPTEMBER 30,CLASS A SHARES 2005 2004
Net asset value, beginning . . . . . . . . . . . . . . . . . . . . . . . . . . . . . . . . $16.33 $16.29Income from investment operations
Net investment income . . . . . . . . . . . . . . . . . . . . . . . . . . . . . . . . . . . .47 .45Net realized and unrealized gain (loss) . . . . . . . . . . . . . . . . . . . . . . . . .32 .48
Total from investment operations . . . . . . . . . . . . . . . . . . . . . . . . . .79 .93Distributions from
Net investment income . . . . . . . . . . . . . . . . . . . . . . . . . . . . . . . . . . . (.48) (.45)Net realized gains . . . . . . . . . . . . . . . . . . . . . . . . . . . . . . . . . . . . . . . (.46) (.44)
Total distributions . . . . . . . . . . . . . . . . . . . . . . . . . . . . . . . . . . . . (.94) (.89)Total increase (decrease) in net asset value . . . . . . . . . . . . . . . . . . . . . . . (0.15) 0.04Net asset value, ending . . . . . . . . . . . . . . . . . . . . . . . . . . . . . . . . . . . $16.18 $16.33
Total return* . . . . . . . . . . . . . . . . . . . . . . . . . . . . . . . . . . . . . . . . . . . . . 5.05% 5.97%Ratios to average net assets:A
Net investment income . . . . . . . . . . . . . . . . . . . . . . . . . . . . . . . . . . . 3.00% 2.82%Total expenses . . . . . . . . . . . . . . . . . . . . . . . . . . . . . . . . . . . . . . . . . . 1.16% 1.19%Expenses before offsets . . . . . . . . . . . . . . . . . . . . . . . . . . . . . . . . . . . 1.16% 1.19%Net expenses . . . . . . . . . . . . . . . . . . . . . . . . . . . . . . . . . . . . . . . . . . . 1.16% 1.18%
Portfolio turnover . . . . . . . . . . . . . . . . . . . . . . . . . . . . . . . . . . . . . . . . . 161% 244%Net assets, ending (in thousands) . . . . . . . . . . . . . . . . . . . . . . . . . . . $237,396 $172,470
YEARS ENDED
SEPTEMBER 30, SEPTEMBER 30, SEPTEMBER 30,CLASS A SHARES 2003 2002 2001
Net asset value, beginning . . . . . . . . . . . . . . . . . . . . $15.80 $16.38 $15.38Income from investment operations
Net investment income . . . . . . . . . . . . . . . . . . . . . . .58 .80 1.01Net realized and unrealized gain (loss) . . . . . . . . . . . .67 (.01) .99
Total from investment operations . . . . . . . . . . . . 1.25 .79 2.00Distributions from
Net investment income . . . . . . . . . . . . . . . . . . . . . . (.56) (.82) (1.00)Net realized gains . . . . . . . . . . . . . . . . . . . . . . . . . . . (.20) (.55) —
Total distributions . . . . . . . . . . . . . . . . . . . . . . . . (.76) (1.37) (1.00)Total increase (decrease) in net asset value . . . . . . . . . . .49 (.58) 1.00Net asset value, ending . . . . . . . . . . . . . . . . . . . . . . . $16.29 $15.80 $16.38
Total return* . . . . . . . . . . . . . . . . . . . . . . . . . . . . . . . . . 8.20% 5.18% 13.46%Ratios to average net assets:A
Net investment income . . . . . . . . . . . . . . . . . . . . . . 3.62% 5.07% 6.32%Total expenses . . . . . . . . . . . . . . . . . . . . . . . . . . . . . 1.18% 1.19% 1.19%Expenses before offsets . . . . . . . . . . . . . . . . . . . . . . . 1.18% 1.19% 1.19%Net expenses . . . . . . . . . . . . . . . . . . . . . . . . . . . . . . 1.17% 1.18% 1.17%
Portfolio turnover . . . . . . . . . . . . . . . . . . . . . . . . . . . . . 395% 607% 955%Net assets, ending (in thousands) . . . . . . . . . . . . . . . $148,791 $128,077 $96,736
See notes to financial highlights.

SOCIALLY RESPONSIBLE PROSPECTUS – 147SOCIALLY RESPONSIBLE PROSPECTUS – 147
CSIF BOND FINANCIAL HIGHLIGHTS
YEARS ENDED
SEPTEMBER 30, SEPTEMBER 30,CLASS B SHARES 2005 2004
Net asset value, beginning . . . . . . . . . . . . . . . . . . . . . . . . . . . . . . . . $16.27 $16.22Income from investment operations
Net investment income . . . . . . . . . . . . . . . . . . . . . . . . . . . . . . . . . . . .32 .31Net realized and unrealized gain (loss) . . . . . . . . . . . . . . . . . . . . . . . . .31 .49
Total from investment operations . . . . . . . . . . . . . . . . . . . . . . . . . .63 .80Distributions from
Net investment income . . . . . . . . . . . . . . . . . . . . . . . . . . . . . . . . . . . (.33) (.31)Net realized gains . . . . . . . . . . . . . . . . . . . . . . . . . . . . . . . . . . . . . . . (.46) (.44)
Total distributions . . . . . . . . . . . . . . . . . . . . . . . . . . . . . . . . . . . . (.79) (.75)Total increase (decrease) in net asset value . . . . . . . . . . . . . . . . . . . . . . . (.16) .05Net asset value, ending . . . . . . . . . . . . . . . . . . . . . . . . . . . . . . . . . . . $16.11 $16.27
Total return* . . . . . . . . . . . . . . . . . . . . . . . . . . . . . . . . . . . . . . . . . . . . . 4.03% 5.11%Ratios to average net assets:A
Net investment income . . . . . . . . . . . . . . . . . . . . . . . . . . . . . . . . . . . 2.03% 1.93%Total expenses . . . . . . . . . . . . . . . . . . . . . . . . . . . . . . . . . . . . . . . . . . 2.11% 2.09%Expenses before offsets . . . . . . . . . . . . . . . . . . . . . . . . . . . . . . . . . . . 2.11% 2.09%Net expenses . . . . . . . . . . . . . . . . . . . . . . . . . . . . . . . . . . . . . . . . . . . 2.10% 2.08%
Portfolio turnover . . . . . . . . . . . . . . . . . . . . . . . . . . . . . . . . . . . . . . . . . 161% 244%Net assets, ending (in thousands) . . . . . . . . . . . . . . . . . . . . . . . . . . . $18,559 $17,605
YEARS ENDED
SEPTEMBER 30, SEPTEMBER 30, SEPTEMBER 30,CLASS B SHARES 2003 2002 2001
Net asset value, beginning . . . . . . . . . . . . . . . . . . . . $15.75 $16.32 $15.33Income from investment operations
Net investment income . . . . . . . . . . . . . . . . . . . . . . .43 .65 .85Net realized and unrealized gain (loss) . . . . . . . . . . . .66 — .98
Total from investment operations . . . . . . . . . . . . 1.09 .65 1.83Distributions from
Net investment income . . . . . . . . . . . . . . . . . . . . . . (.42) (.67) (0.84)Net realized gains . . . . . . . . . . . . . . . . . . . . . . . . . . . (.20) (.55) —
Total distributions . . . . . . . . . . . . . . . . . . . . . . . . (.62) (1.22) (0.84)Total increase (decrease) in net asset value . . . . . . . . . . .47 (.57) 0.99Net asset value, ending . . . . . . . . . . . . . . . . . . . . . . . $16.22 $15.75 $16.32
Total return* . . . . . . . . . . . . . . . . . . . . . . . . . . . . . . . . . 7.13% 4.26% 12.31%Ratios to average net assets:A
Net investment income . . . . . . . . . . . . . . . . . . . . . . 2.70% 4.10% 5.21%Total expenses . . . . . . . . . . . . . . . . . . . . . . . . . . . . . 2.08% 2.13% 2.19%Expenses before offsets . . . . . . . . . . . . . . . . . . . . . . . 2.08% 2.13% 2.19%Net expenses . . . . . . . . . . . . . . . . . . . . . . . . . . . . . . 2.07% 2.12% 2.17%
Portfolio turnover . . . . . . . . . . . . . . . . . . . . . . . . . . . . . 395% 607% 955%Net assets, ending (in thousands) . . . . . . . . . . . . . . . $18,860 $14,305 $8,046
See notes to financial highlights.
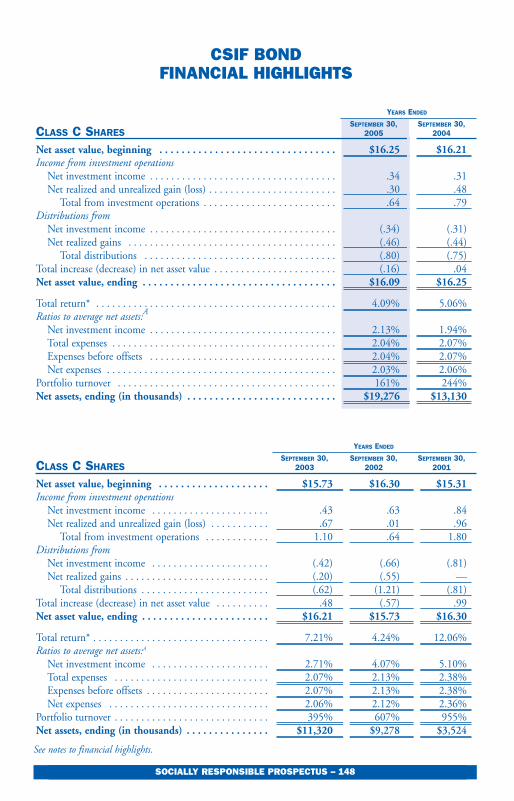
SOCIALLY RESPONSIBLE PROSPECTUS – 148
CSIF BOND FINANCIAL HIGHLIGHTS
YEARS ENDED
SEPTEMBER 30, SEPTEMBER 30,CLASS C SHARES 2005 2004
Net asset value, beginning . . . . . . . . . . . . . . . . . . . . . . . . . . . . . . . . $16.25 $16.21Income from investment operations
Net investment income . . . . . . . . . . . . . . . . . . . . . . . . . . . . . . . . . . . .34 .31Net realized and unrealized gain (loss) . . . . . . . . . . . . . . . . . . . . . . . . .30 .48
Total from investment operations . . . . . . . . . . . . . . . . . . . . . . . . . .64 .79Distributions from
Net investment income . . . . . . . . . . . . . . . . . . . . . . . . . . . . . . . . . . . (.34) (.31)Net realized gains . . . . . . . . . . . . . . . . . . . . . . . . . . . . . . . . . . . . . . . (.46) (.44)
Total distributions . . . . . . . . . . . . . . . . . . . . . . . . . . . . . . . . . . . . (.80) (.75)Total increase (decrease) in net asset value . . . . . . . . . . . . . . . . . . . . . . . (.16) .04Net asset value, ending . . . . . . . . . . . . . . . . . . . . . . . . . . . . . . . . . . . $16.09 $16.25
Total return* . . . . . . . . . . . . . . . . . . . . . . . . . . . . . . . . . . . . . . . . . . . . . 4.09% 5.06%Ratios to average net assets:A
Net investment income . . . . . . . . . . . . . . . . . . . . . . . . . . . . . . . . . . . 2.13% 1.94%Total expenses . . . . . . . . . . . . . . . . . . . . . . . . . . . . . . . . . . . . . . . . . . 2.04% 2.07%Expenses before offsets . . . . . . . . . . . . . . . . . . . . . . . . . . . . . . . . . . . 2.04% 2.07%Net expenses . . . . . . . . . . . . . . . . . . . . . . . . . . . . . . . . . . . . . . . . . . . 2.03% 2.06%
Portfolio turnover . . . . . . . . . . . . . . . . . . . . . . . . . . . . . . . . . . . . . . . . . 161% 244%Net assets, ending (in thousands) . . . . . . . . . . . . . . . . . . . . . . . . . . . $19,276 $13,130
YEARS ENDED
SEPTEMBER 30, SEPTEMBER 30, SEPTEMBER 30,CLASS C SHARES 2003 2002 2001
Net asset value, beginning . . . . . . . . . . . . . . . . . . . . $15.73 $16.30 $15.31Income from investment operations
Net investment income . . . . . . . . . . . . . . . . . . . . . . .43 .63 .84Net realized and unrealized gain (loss) . . . . . . . . . . . .67 .01 .96
Total from investment operations . . . . . . . . . . . . 1.10 .64 1.80Distributions from
Net investment income . . . . . . . . . . . . . . . . . . . . . . (.42) (.66) (.81)Net realized gains . . . . . . . . . . . . . . . . . . . . . . . . . . . (.20) (.55) —
Total distributions . . . . . . . . . . . . . . . . . . . . . . . . (.62) (1.21) (.81)Total increase (decrease) in net asset value . . . . . . . . . . .48 (.57) .99Net asset value, ending . . . . . . . . . . . . . . . . . . . . . . . $16.21 $15.73 $16.30
Total return* . . . . . . . . . . . . . . . . . . . . . . . . . . . . . . . . . 7.21% 4.24% 12.06%Ratios to average net assets:A
Net investment income . . . . . . . . . . . . . . . . . . . . . . 2.71% 4.07% 5.10%Total expenses . . . . . . . . . . . . . . . . . . . . . . . . . . . . . 2.07% 2.13% 2.38%Expenses before offsets . . . . . . . . . . . . . . . . . . . . . . . 2.07% 2.13% 2.38%Net expenses . . . . . . . . . . . . . . . . . . . . . . . . . . . . . . 2.06% 2.12% 2.36%
Portfolio turnover . . . . . . . . . . . . . . . . . . . . . . . . . . . . . 395% 607% 955%Net assets, ending (in thousands) . . . . . . . . . . . . . . . $11,320 $9,278 $3,524
SOCIALLY RESPONSIBLE PROSPECTUS – 148
See notes to financial highlights.

SOCIALLY RESPONSIBLE PROSPECTUS – 149
CSIF MONEY MARKET FINANCIAL HIGHLIGHTS
YEARS ENDED
SEPTEMBER 30, SEPTEMBER 30,CLASS O SHARES 2005 2004
Net asset value, beginning . . . . . . . . . . . . . . . . . . . . . . . . . . . . . . . . $1.00 $1.00Income from investment operations
Net investment income . . . . . . . . . . . . . . . . . . . . . . . . . . . . . . . . . . . .019 .004Distributions from
Net investment income . . . . . . . . . . . . . . . . . . . . . . . . . . . . . . . . . . . (.019) (.004)
Net asset value, ending . . . . . . . . . . . . . . . . . . . . . . . . . . . . . . . . . . . $1.00 $1.00
Total return* . . . . . . . . . . . . . . . . . . . . . . . . . . . . . . . . . . . . . . . . . . . . . 1.94% .44%Ratios to average net assets:A
Net investment income . . . . . . . . . . . . . . . . . . . . . . . . . . . . . . . . . . . 1.91% .44%Total expenses . . . . . . . . . . . . . . . . . . . . . . . . . . . . . . . . . . . . . . . . .. .91% .91%Expenses before offsets . . . . . . . . . . . . . . . . . . . . . . . . . . . . . . . . . . . .88% .88%Net expenses . . . . . . . . . . . . . . . . . . . . . . . . . . . . . . . . . . . . . . . . . . . .87% .87%
Net assets, ending (in thousands) . . . . . . . . . . . . . . . . . . . . . . . . . . . $160,218 $169,916
YEARS ENDED
SEPTEMBER 30, SEPTEMBER 30, SEPTEMBER 30,CLASS O SHARES 2003 2002 2001
Net asset value, beginning . . . . . . . . . . . . . . . . . . . . $1.00 $1.00 $1.00Income from investment operations
Net investment income . . . . . . . . . . . . . . . . . . . . . . .006 .015 .045Distributions from
Net investment income . . . . . . . . . . . . . . . . . . . . . . (.006) (.015) (.045)Net asset value, ending . . . . . . . . . . . . . . . . . . . . . . . $1.00 $1.00 $1.00
Total return* . . . . . . . . . . . . . . . . . . . . . . . . . . . . . . . . . .63% 1.49% 4.63%Ratios to average net assets:A
Net investment income . . . . . . . . . . . . . . . . . . . . . . .63% 1.48% 4.52%Total expenses . . . . . . . . . . . . . . . . . . . . . . . . . . . . . .90% .89% .84%Expenses before offsets . . . . . . . . . . . . . . . . . . . . . . . .88% .88% .84%Net expenses . . . . . . . . . . . . . . . . . . . . . . . . . . . . . . .87% .87% .83%
Net assets, ending (in thousands) . . . . . . . . . . . . . . $181,788 $192,680 $206,061
SOCIALLY RESPONSIBLE PROSPECTUS – 149
See notes to financial highlights.

SOCIALLY RESPONSIBLE PROSPECTUS – 150
NOTES TO FINANCIAL HIGHLIGHTSA Total expenses do not reflect amounts reimbursed and/or waived by the advisor or reductions from
expense offset arrangements. Expenses before offsets reflect expenses after reimbursement and/or waiver by the Advisor but prior to reductions from expense offset arrangements. Net expenses are net of all reductions and represent the net expenses paid by the Portfolio.
* Total return is not annualized for periods less than one year and does not reflect deduction of any front-end or deferred sales charge.
(a) Annualized.
(r) Total return would have been 10.86%, 9.79% and 9.81% for Classes A, B and C, respectively, of CSIF Enhanced Equity, without the payment by affiliate.
(s) From October 1, 2004 inception.
(t) From April 1, 2005 inception.
(z) Per share figures are calculated using the Average Shares Method.
# From October 31, 2000 inception.
# # Three month audited period.

SOCIALLY RESPONSIBLE PROSPECTUS – 151
EXHIBIT A
Service Fees and Arrangements with Broker/DealersCalvert Distributors, Inc., each Fund’s principal underwriter, pays broker/dealers acommission, or reallowance (expressed as a percentage of the offering price for ClassA, and a percentage of amount invested for Class B and C), when you purchaseshares of non-money market funds. CDI also pays broker/dealers an ongoing serv-ice fee while you own shares of that Fund (expressed as an annual percentage rate ofaverage daily net assets held in Calvert accounts by that dealer). The table belowshows the amount of payment which differs depending on the Class.
Maximum Commission/Service Fees
CSIF Money Market None/0.05%Class A* Class B** Class C***
CSIF Balanced 4.00%/0.25% 4.00%/0.25% 1.00%/1.00%CSIF Equity 4.00%/0.25% 4.00%/0.25% 1.00%/1.00%Calvert Social Index Fund 4.00%/0.25% 4.00%/0.25% 1.00%/1.00%CSIF Enhanced Equity 4.00%/0.25% 4.00%/0.25% 1.00%/1.00%Calvert Large Cap Growth 4.00%/0.25% 4.00%/0.25% 1.00%/1.00%Capital Accumulation 4.00%/0.25% 4.00%/0.25% 1.00%/1.00%CWVF International Equity 4.00%/0.25% 4.00%/0.25% 1.00%/1.00%New Vision Small Cap 4.00%/0.25% 4.00%/0.25% 1.00%/1.00%Calvert Small Cap Value 4.00%/0.25% N/A 1.00%/1.00%Calvert Mid Cap Value 4.00%/0.25% N/A 1.00%/1.00%CSIF Bond 3.00%/0.25% 3.00%/0.25% 1.00%/1.00%
*Class A service fee begins to accrue in 1st month after purchase.**Class B service fee begins to accrue in 13th month.***Class C pays broker/dealers a service fee of 0.25% and additional compensa-tion of 0.75% for a total annual percentage rate of 1%. These fees begin toaccrue in 13th month.
Note: If the selling broker/dealer has an agreement with CDI to sell Class B andClass C shares for omnibus retirement account platforms and without a CDSCupon the redemption of the shares, CDI does not pay the selling broker/dealer acommission but does pay the selling broker/dealer a service fee and additionalcompensation totaling 1.00%, which may begin in the first month, rather thanin the 13th month after sale.
During special sales promotions, CDI may reallow to broker/dealers the fullClass A front-end sales charge. CDI may also pay additional concessions, includ-ing de minimis non-cash promotional incentives, such as de minimis merchan-dise or trips, to broker/dealers employing registered representatives who havesold or are expected to sell a minimum dollar amount of shares of a Fund and/or

SOCIALLY RESPONSIBLE PROSPECTUS – 152
shares of other Funds underwritten by CDI. CDI may make expense reimburse-ments for special training of a broker/dealer’s registered representatives, advertis-ing or equipment, or to defray the expenses of sales contests. Calvert, CDI, ortheir affiliates may pay, from their own resources, certain broker/dealers and/orother persons, for the sale and distribution of the securities or for services to theFund. These amounts may be significant. Payments may include additional com-pensation beyond the regularly scheduled rates, and finder’s fees. CDI may paybroker/dealers a finder’s fee on Class A shares purchased at NAV in accountswith $1 million or more (excluding CSIF Money Market.) The finder’s fee is0.80% of the purchase NAV amount on the first $2 million, 0.64% on $2 to $3million, 0.40% on $3 to $50 million, 0.20% on $50 to $100 million, and0.12% over $100 million. If a finder's fee is paid, and some or all of the pur-chase is exchanged into another Calvert Fund with a lower finder's fee withinone year, then CDI will recoup the difference in the finder's fee from the bro-ker/dealer. Purchases of shares at NAV for accounts on which a finder's fee hasbeen paid are subject to a one-year CDSC of 0.80%. All payments will be incompliance with the rules of the National Association of Securities Dealers, Inc.

SOCIALLY RESPONSIBLE PROSPECTUS – 153
To Open an Account:800-368-2748
Performance and Prices:www.calvert.comCalvert Information Network24 hours, 7 days a week800-368-2745
Service for Existing Accounts:Shareholders 800-368-2745Brokers 800-368-2746
TDD for Hearing-Impaired:800-541-1524
Calvert Office:4550 Montgomery AvenueSuite 1000NBethesda, MD 20814
Registered, Certified orOvernight Mail:Calvertc/o BFDS330 West 9th StreetKansas City, MO 64105
Calvert Web-SiteAddress: www.calvert.com
PRINCIPAL UNDERWRITERCalvert Distributors, Inc.4550 Montgomery AvenueSuite 1000NBethesda, MD 20814

This page intentionally left blank.

This page intentionally left blank.

This page intentionally left blank.
Printed on recycled paper using soy inksE
For investors who want more information about the Funds, the following docu-ments are available free upon request:
Annual/Semi-Annual Reports: Additional information about each Fund’s invest-ments is available in the Fund’s Annual and Semi-Annual reports to sharehold-ers. In each Fund’s annual report (except for CSIF Money Market), you will finda discussion of the market conditions and investment strategies that significantlyaffected the Fund’s performance during its last fiscal year.
Statement of Additional Information (SAI): The SAI for each Fund providesmore detailed information about the Fund, including a description of eachFund’s policies and procedures with respect to the disclosure of its portfolioholdings. The SAI is incorporated into this prospectus by reference.
You can get free copies of reports and SAIs, request other information and dis-cuss your questions about the Funds by contacting your financial professional, orthe Funds at:
Calvert Group, Ltd.4550 Montgomery Ave.Suite 1000NBethesda, MD 20814
Telephone: 1-800-368-2745
The Funds’ SAIs and Annual and Semi-Annual Reports are available free of charge,on Calvert’s website at the Internet address listed below:
Calvert Web-Sitewww.calvert.com
You can review and copy information about a Fund (including the SAI) at theSEC’s Public Reference Room in Washington, D.C. Information on the operationof the public reference room may be obtained by calling the SEC at 1-202-942-8090. Reports and other information about the Funds are available on the EDGARdatabase on the SEC's Internet site at http://www.sec.gov. Copies of this informa-tion may also be obtained, upon payment of a duplicating fee, by electronic requestat [email protected], or by writing to the Public Reference Section of the SEC,Washington, D.C. 20549-0102.
Investment Company Act file:
no. 811-3334(CSIF)
no. 811- 06563(CWVF International Equity and Calvert Capital Accumulation)
no. 811- 3416 (Calvert New Vision Small Cap)
no. 811-09877 (Calvert Social Index Fund)
no. 811-10045 (Calvert Large Cap Growth, Calvert Small Cap Value and Calvert Mid Cap Value)