cambodia post-flood relief and recovery survey 2012 · iv cambodia post-flood relief and recovery...
TRANSCRIPT
Project Number: 46009Project Number: 26194 May 2012
Cambodia: Flood Damage Emergency Reconstruction Project Cambodia Post-Flood Relief and Recovery Survey 2012
CAMBODIAPOST-FLOOD RELIEF AND RECOVERY SURVEY2012
CAMBODIA POST-FLOOD RELIEF AND RECOVERY SURVEY
May 2012
iiiCAMBODIAPost-Flood Relief and Recovery Survey 2012
contents
table of contents
Page
tables anD fIGURes vi
abbReVIatIons viii
foReWoRD ix
acKnoWleDGeMents x
eXecUtIVe sUMMaRy xi
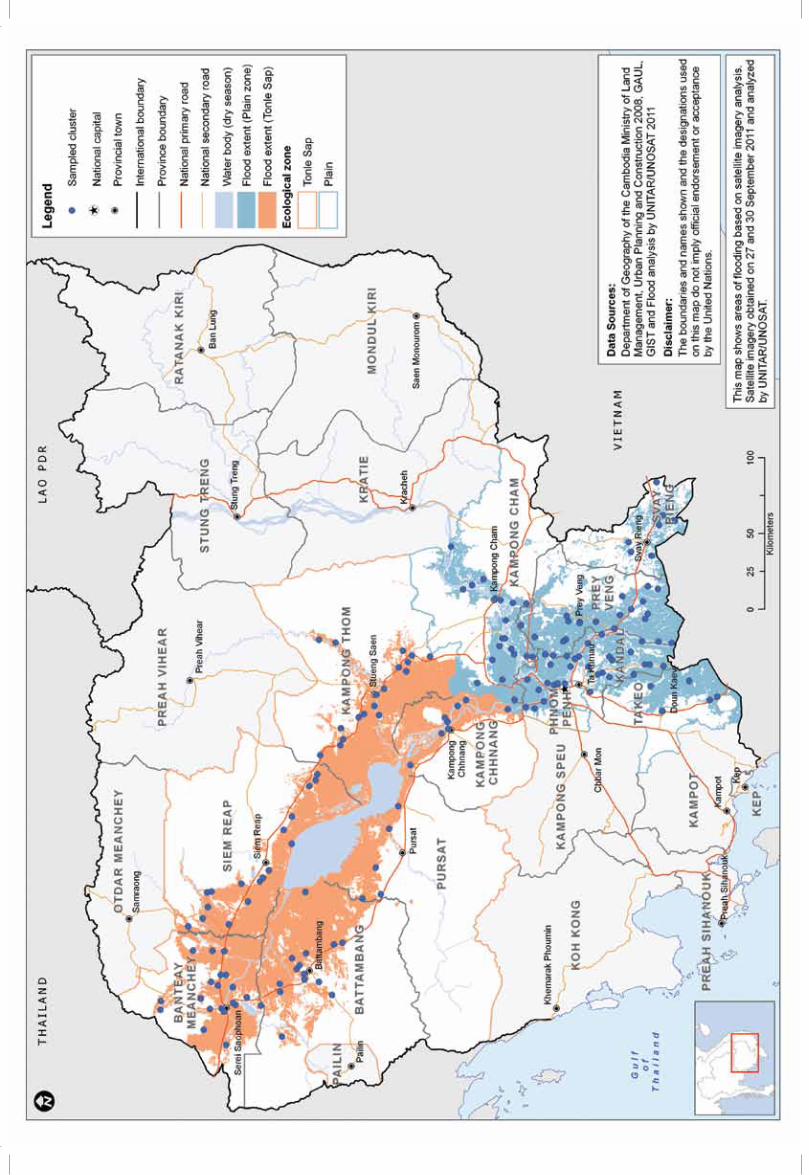
MaP of sURVeyeD VIllaGes xiv
SeCTION 1 INTRODUCTION 1
1.1 background 1
1.2 survey objectives 1
SeCTION 2 MeTHODOLOgY 2
2.1 survey Design 2
2.2 sample size 2
2.3 sampling 3
First Stage 3
Second Stage 3
Missing Households and Children 3
Informed Consent and Refusals 3
2.4 training and Pre-testing 3
2.5 fieldwork logistics 4
2.6 survey Questionnaires 4
2.7 Data Quality control 4
2.8 Data entry, Processing, cleaning 5
2.9 Data analysis 5
2.10 sample coverage 5
SeCTION 3 HOUSeHOLD CHaRaCTeRISTICS 6
3.1 Household composition 6
3.2 Household characteristics 6
Source of Drinking Water 6
Type of Toilet Facility 6
Hand Washing and Soap Availability 6
Housing Materials 6
Source of Cooking Fuel 8
IDPoor Status 8
3.3 Household Possessions 8
Asset Ownership 8
3.4 Household Wealth 8
3.5 education of Mothers 8
3.6 school attendance of children 5-14 years 10
3.7 background characteristics of children 0-59 Months 10
iv CAMBODIAPost-Flood Relief and Recovery Survey 2012
contents
SeCTION 4 geNeRaL eFFeCTS 11
4.1 Information and communication 11
Types of Information 11
Sources of Information 11
Preferred Source of Information 12
4.2 Household Displacement 12
4.3 Infrastructure 12
Housing Material 12
Water and Sanitation 13
4.4 Hosting/supporting others 13
4.5 Migration since floods 13
4.6 Main Household Difficulties since floods 14
4.7 affect Index 15
SeCTION 5 eCONOMIC IMPaCT 16
5.1 Income sources 16
Number of Income Earners 16
Compare Number of Earners 16
Main Income Sources 16
Change in Income Since Floods 16
Child Labour 17
5.2 expenditures 17
Food Expenditures 18
Non-food Expenditures 18
Total Expenditures 19
Change in Expenditures 19
5.3 assets 19
Damaged by Floods 19
SeCTION 6 agRICULTURe, LIVeSTOCK, & FISHINg 21
6.1 Wet season cultivation (2011) 21
Wet Season Rice Crop 21
6.2 Dry season cultivation 22
6.3 seed stocks 22
6.4 Irrigation 23
6.5 livestock 23
6.6 fishing 23
SeCTION 7 LOaNS & DeBT 25
7.1 Household loan status 25
7.2 Main Reasons for loans 25
7.3 Primary source of loans 26
7.4 financial terms of loans 26
SeCTION 8 FOOD SeCURITY 29
8.1 number of Meals 29
8.2 food consumption score 29
8.3 coping strategies 30
Basic Frequencies 30
vCAMBODIAPost-Flood Relief and Recovery Survey 2012
contents
Household Food Insecurity Access Scale 30
Coping Strategies Index (Reduced) 31
Household Hunger Scale 31
SeCTION 9 HeaLTH & NUTRITION 34
9.1 nutritional status of Mothers 34
Body Mass Index 34
9.2 Health status of children Under five 34
Measles Immunization 34
Vitamin A and Deworming Supplementation 36
Diarrhea 36
Acute Respiratory Infection 36
Fever 36
9.3 nutritional status of children 6-59 Months 38
Wasting 38
Stunting 38
Underweight 38
Management of Acute Malnutrition 38
9.4 Infant and young child feeding 40
Early Initiation of Breastfeeding 40
Breastfeeding Status by Age 40
SeCTION 10 aSSISTaNCe & PRIORITY NeeDS 41
10.1 assistance Received 41
10.2 Priority needs 41
SeCTION 11 DISCUSSION 44
11.1 General effects 44
11.2 economic Impact 45
11.3 agriculture, livestock, and fishing 46
11.4 loans and Debt 48
11.5 food security 49
11.6 Health and nutrition 50
11.7 assistance and Priority needs 51
11.8 limitations 52
CONCLUSIONS 53
ReCOMMeNDaTIONS 54
ReFeReNCeS 56
aPPeNDIX I TRaININg SCHeDULe 58
aPPeNDIX II FIeLDWORK PLaN 60
aPPeNDIX III QUeSTIONNaIReS 64
aPPeNDIX IV HOUSeHOLD FOOD INSeCURITY aCCeSS SCaLe 98
aPPeNDIX V MaRKeT aSSeSSMeNT FINDINgS 99
aPPeNDIX VI SaMPLINg FRaMe 102
aPPeNDIX VII aDDITIONaL TaBLeS & FIgUReS 109
vi CAMBODIAPost-Flood Relief and Recovery Survey 2012
tables anD fIGURes
tables anD fIGUResPage
SeCTION 2table 1 Provinces for Post-flood survey 2table 2 sample size calculations 2table 3 Results of Household Interviews 5
SeCTION 3table 4 Household composition 109table 5 Household Drinking Water 7table 6 Household sanitation facilities 110table 7 Hand-washing and soap 110table 8 Household characteristics 111table 9 Household Durable Goods 9table 10 Wealth Quintiles 9table 11 educational attainment of Mothers 112table 12 school attendance of children 5-14 years 113table 13 background characteristics of surveyed children 10
SeCTION 4 table 14 types of Information 113table 15 sources of Information transmission 11table 16 Most Preferred sources of Information transmission 114table 17 Household Displacement 12table 18 Damaged flooring 13table 19 Damaged Walls 114table 20 Damaged Roofing 115table 21 Water and sanitation access 115table 22 Hosting/supporting others 116table 23 Migration 14table 24 Main Difficulties 117table 25 affect Index 15figure 1 affect Index Indicators and Weights 145
SeCTION 5 table 26 number of Income earners 118table 27 compare number of Income earners 118table 28 Main Income sources 119table 29 change in Income since flood 17table 30 child labour 120table 31 food expenditures 18table 32 non-food expenditures 120table 33 total expenditures 19table 34 change in year-on-year expenses 121table 35 Household asset Damage 20
SeCTION 6table 36 Wet season cultivation (2011) 21table 37 Wet season Rice cultivation 122table 38 Dry season cultivation (2011/2012) 122table 39 seed stock 123table 40 Irrigation 24
viiCAMBODIAPost-Flood Relief and Recovery Survey 2012
tables anD fIGURes
table 41 livestock 123table 42 fishing activities 124figure 2 Household Wet season Rice Harvest 22
SeCTION 7 table 43 Household loan status 25table 44 Main Reasons for loans 26table 45 Primary source of loans 125table 46 financial terms of loans 27
SeCTION 8 table 47 number of Meals 126table 48 food consumption score 30table 49 coping strategies 127table 50 Household food Insecurity access scale 128table 51 coping strategies Index (Reduced) 129table 52 Household Hunger scale 32figure 3 Household Responses to Various coping strategies 145
SeCTION 9 table 53 nutritional status of Mothers 35table 54 Measles Vaccination 130table 55 Vitamin a and Deworming supplementation 131table 56 Prevalence of Diarrhea 37table 57 treatment of Diarrhea 132table 58 Prevalence and treatment of symptoms of aRI 133table 59 Prevalence and treatment of fever 134table 60 Prevalence of Wasting (WHo 2006 Growth standards) 39table 61 Prevalence of stunting (WHo 2006 Growth standards) 135table 62 Prevalence of Underweight (WHo 2006 Growth standards) 136table 63 Management of acute Malnutrition 40table 64 Initial breastfeeding 137table 65 breastfeeding status by age 138
SeCTION 10 table 66 assistance Received since floods 139table 67 assistance Received by affect Index 41table 68 Priority needs 42
SeCTION 11table 69 total expenditure by loan status (zone) 139table 70 total expenditure by loan status (wealth) 140table 71 total expenditure by type of loan (zone) 141table 72 total expenditure by type of loan (wealth) 47table 73 Household sanitation facilities by Wealth 142table 74 Household Wall Materials 142table 75 Household Roofing Materials 143table 76 Housing complete Damage 143table 77 food security Measures by Wealth, affect Index 144table 78 Pairwise correlations of food security Indicators and nutritional outcomes 144figure 4 Median Monthly food expenditure (Riel) 50figure 5 food consumption score by loan status 145figure 6 HfIas and csI by loan status 145figure 7 Median Monthly Rice expenditure by loan status (Riel) 50
viii CAMBODIAPost-Flood Relief and Recovery Survey 2012
abbReVIatIons
abbReVIatIons
aDb asian Development bank
anoVa analysis of Variance
aRI acute Respiratory Infection
bMI body Mass Index
cI confidence Interval
cDHs cambodia Demographic and Health survey
cses cambodia socioeconomic survey
csI coping strategies Index
Deff Design effect
ena emergency nutrition assessment
ePI expanded Programme on Immunisation
fcs food consumption score
fGD focus Group Discussion
GaM Global acute Malnutrition
GIs Geographic Information system
GPs Global Positioning system
Gs Growth standard
HaZ Height-for-age Z-score
HfIaP Household food Insecurity access Prevalence
HfIas Household food Insecurity access scale
HHs Household Hunger scale
HKI Helen Keller International
Iycf Infant and young child feeding
IQR Interquartile Range
Maff Ministry of agriculture, forestry, and fisheries
MaM Management of acute Malnutrition
MDG Millennium Development Goal
MfI Microfinance Institution
MoP Ministry of Planning
MUac Mid-Upper arm circumference
ncDM national committee for Disaster Management
nGo non-Governmental organisation
Pca Principal component analysis
PlW Pregnant and lactating Women
PPs Probability-Proportional-to-size
saM severe acute Malnutrition
sD standard Deviation
sMaRt standardised Monitoring and assessment of Relief and transitions
sMs short Message service
sPss statistical Package for social sciences
UnIcef United nations children’s fund
VHV Village Health Volunteer
WasH Water, sanitation, and Hygiene
WaZ Weight-for-age Z-score
WfP United nations World food Programme
WHo World Health organization
WHZ Weight-for-Height Z-score
ixCAMBODIAPost-Flood Relief and Recovery Survey 2012
foReWoRD
foReWoRD
the immense power and destructiveness that natural disasters are capable of were on full display during the floods
that affected cambodia in 2011. families were displaced from their communities, entire wet season crops were
devastated, farmers, fishermen, and day labourers all saw their livelihoods upended. Many households already
operating on a thin margin were forced to cope with an additional problem they did not create and for which they had
few options to better prepare.
the 2012 Post-flood Relief and Recovery survey is an attempt to understand the different ways that households were
affected by the floods, to learn how their coping strategies are changing, evolving over time to more effectively and
efficiently meet their needs, and to uncover the preparedness and response gaps that made their coping efforts all
the more necessary.
yet, valuable as these lessons are, they cannot serve as an end unto themselves. the development community—
Government, nGo, and Un agencies—needs to learn from and act upon these results to better prepare and assist
those that will endure future floods. When the cause, the impact and the needs are as clear as for flood disasters
and their victims, then the development community must show it can jointly engage with affected communities by
using the lessons learned from this event, develop appropriate recovery programmes and improve emergency
preparedness plans so that affected populations might be better protected when future disasters occur.
the 2012 Post-flood Relief and Recovery survey findings represent the great efforts of those dedicated to improving
the safety and coping ability of households throughout the country. a very sincere appreciation goes out to the survey
teams, coordinating members, and, not least, to the communities for giving their valuable time in the service of such
an important exercise.
Jean-Pierre de Margerie H.e. Dr. Nhim Vanda
country Representative senior Minister in charge of
Un World food Programme first Vice President
On behalf of the seven participating organizations national committee for Disaster Management
x CAMBODIAPost-Flood Relief and Recovery Survey 2012
acKnoWleDGeMents
acKnoWleDGeMents
the 2012 Post-flood Relief and Recovery survey
was a joint initiative by action aid, asian Development
bank (aDb), Danchurchaid/act alliance, Danish
Red cross, save the children,UnIcef and World
food Programme, in collaboration with the national
committee for Disaster Management (ncDM).
Very special thanks go to ncDM, which provided
valuable logistical and coordination support at various
stages of the survey. In addition, ncDM hosted a
preliminary findings workshop in March 2012 that greatly
improved the overall value of the survey results, and co-
hosted the national dissemination of the survey report
and findings in May 2012.
the Helen Keller International country office in
Phnom Penh played a critical role in organizing and
implementing the survey: Zaman talukder, Hou Kroeun,
and ly sokHoing ensured that the survey progressed
efficiently and according to the highest of standards. the
eight teams of enumerators who worked tirelessly, often
in less than desirable conditions, to collect this data in a
timely fashion are also gratefully acknowledged.
thanks is also owed to the WfP country office in
Phnom Penh; particular thanks is extended to yav
long for his assistance with the survey training, Khmer
translations, and logistical support,chanvibol choeur for
his expertise with GIs mapping and support to sampling
frame construction, John Jeong for his assistance
analysing the market assessment data and invaluable
contributions to the interpretation of survey findings,and
Kurt burja for his support with the overall survey design
and navigating the countless major and minor obstacles
that invariably challenge any large-scale, multi-partner
survey.
finally, several other people immeasurably improved
this report by reading and providing feedback on
various drafts, and the author is grateful for their time:
belinda abraham, sarthi acharya, Joel conkle, ammar
Kawash, lindsey Horton, and Isidro navarro.
aaron Wise
survey coordinator
Survey Supervisors:
ly sok Hoing
noun ty
sao sovann Vannak
sim chhoeun
Data entry:
chea Molika
Keo navy
ou samsophorn
Mut chansotheara
Kheang tola
Rin sinan
Survey enumerators:
tren sameth long Mony Van
Meas Rachana tim nearady
Phal Rong tho soton
sim seang Khuy som sarun
Mat Poeuv Him sean
Khan thy Hak sihun
Khun Davun chuch sao Vandy
you siradeth Pen bunroth
lun bunthoeun soy Kimseng
chum sophea choun Radoeun
Un sokheng an Rady
eth narorng nuth siranin
Data analysis and Report Preparation:
aaron Wise
xiCAMBODIAPost-Flood Relief and Recovery Survey 2012
eXecUtIVe sUMMaRy
eXecUtIVe sUMMaRy
In september 2011, above average rainfall resulted
in severe flooding along the Mekong and tonle sap
river basins, affecting 18 of cambodia’s 24 provinces.
the floods were reportedly the worst cambodia had
experienced in more than a decade.
as immediate relief efforts by government agencies,
the cambodian Red cross, and development
partners gradually gave way to longer-term recovery
considerations, it was agreed that an expanded
investigation into the floods’ effects on food security
and nutrition, health, water and sanitation, household
assets and economic situation was needed to better
identify the most appropriate emergency preparedness
and recovery phase response options.
a two-stage cluster survey was conducted from
January 10–29, 2012 and collected representative data
for areas within 250 meters of the peak-flood boundary
in the Plains and tonle sap ecological zones. In total,
information was collected on 2,397 households and
1,282 children aged 0-59 months from 164 villages in
these areas considered most affected by the floods.
an estimated 64,000 households living within 250
meters of the peak-flood boundary were displaced
from their homes for at least one night as a result of
the floods; this includes some 19,600 households that
were displaced outside of their home communities.
survey findings show that the floods disproportionately
displaced the poorest households: nearly 20 percent
of the poorest households living in these areas were
forced from their homes compared to just one percent
of the richest households. between 5–10 percent of
households living in these areas experienced damage
to their housing (flooring, walls, and roofing) as a result
of the floods. at the time of the survey, most households
reported having access to their usual water and
sanitation sources.
Just less than 10 percent of households had a member
migrate out since the floods, though more than half of
these reported that the main reason was due to the
flood. Migration from households was most prevalent
among the poorest households, and those considered
most affected by the floods; the findings suggest that
these migrations were driven in large part by household
economic pressures.
the most common household assets destroyed
by the floods in these areas were fishing nets (33
percent), boats (21 percent), and bicycles (19 percent).
Households relying on fishing for their livelihoods
appeared particularly affected by the floods, as were
those dependent upon agricultural and non-agricultural
wage labour: more than two-thirds of these households
reported that their income had decreased since the
floods. the economic hardships currently facing these
households are further exemplified by the finding that,
among the poorest and most affected households
with children aged 5–14 years, between 8–15 percent
reported that their children had done work for someone
else or for the family business in the week prior to the
survey.
the floods’ impact on agriculture in the areas of the
Plains and tonle sap considered most affected was
extensive. there is some evidence that households in
these areas were less likely to plant wet season rice
compared to households in the rest of the ecological
zones due to historical weather and environmental
conditions. However, of the households growing 2011
wet season rice, 90 percent reported that their crop
had been damaged in some way; for 30 percent of
households, the damage was so complete that they
were not able to harvest any rice. the average yield
for households who did manage to harvest 2011
wet season rice was 1,100 kg/ha—less than half the
average yield reported for these zones in 2010.
More than two-thirds of households owning livestock
reported losing some animals as a result of the 2011
floods. the animals most likely to have died during the
floods were chickens, though many cows were also
xii CAMBODIAPost-Flood Relief and Recovery Survey 2012
eXecUtIVe sUMMaRy
lost as a result. counter to anecdotal evidence, half of
the households fishing for wild fish reported the current
catch was less than that from a year ago.
nearly 40 percent of households living in these areas
reported having taken out a loan as a direct result of the
floods. the poorest households were disproportionately
forced to take on debt: nearly 50 percent had a flood-
related loan compared to just 22 percent of the richest
households. the most common reasons reported
for taking on flood-related loans were to buy food,
agricultural inputs, and for business development. the
main sources of loans to households—microfinance
institutions (MfI), private lenders, and banks—differed
greatly on their terms for borrowing: the costs of
financing from private lenders were nearly twice that
of MfI and banks. among the three main sources of
lending, the poorest households were least likely to have
accessed financing from banks, and most likely to have
used private lenders.
findings related to household food security suggest
that the situation at the time of the survey was stable.
the food consumption score, which is a measure of
the overall quality and diversity of diet, was relatively
high for all households the week before the survey. the
Household food Insecurity access scale, which better
captures food access difficulties, found 15 percent of
households were severely food insecure. all measures
of household food security captured in the survey were
significantly associated with household wealth and the
extent to which households were affected by the floods,
such that the poorest households and those considered
most affected scored lowest on these indices.
the health and nutrition status of mothers aged 15–49
years and children aged 0–59 months were also stable,
though underlying factors suggest these measures
could deteriorate should the currently tenuous financial
situation of many households worsen. thirteen percent
of non-pregnant mothers were considered thin
according to body Mass Index. overall, 87 percent of
children aged 6–59 months in these areas had received
vitamin a supplementation in the 6 months prior to
the survey. nearly a quarter of all children aged 0-59
months (22 percent) had suffered from diarrhea in the
two weeks prior to the survey, though the proportion of
these children taken for treatment to a health facility or
provider (64 percent) suggests that, at least at the time
of the survey, the floods’ had not limited access to the
formal health system.
Height and weight measurements were collected
from 1,116 children aged 6–59 months. according to
the 2006 WHo Growth standards, the prevalence of
wasting (low weight-for-height) among these children
was 5.6 percent (95% cI: 4.0–7.2); just 0.3 percent of
children in these areas were severely wasted. thirty-
seven percent of these same children were stunted
(95% cI: 33.9–40.3), and 23.3 percent were found to be
underweight (95% cI: 20.4–26.1).
based on the findings from the 2012 Post-flood
Relief and Recovery survey, a set of recommendations,
reviewed and discussed by all survey partners, are
proposed to government and development stakeholders
that address high priority areas for future emergency
preparations and recovery phase programmes:
1) existing emergency communication plans
should test and strengthen, or implement if
they do not already have, a word-of-mouth
system to ensure optimal coverage and
saturation (e.g., from commune chief to village
chief/VHV or someone else within the village
dedicated for such a purpose). Moreover,
emergency partners should consider adding
and testing an sMs system that takes advantage
of households’ high ownership of mobile phones.
xiiiCAMBODIAPost-Flood Relief and Recovery Survey 2012
eXecUtIVe sUMMaRy
2) Partners interested in helping the poorest
households and reducing the impact of future
natural disasters (e.g., household displacement
and its associated economic losses) are
encouraged to support the poorest households’
ability to improve their housing structures.
3) WasH-related preparedness and recovery
efforts will best be directed towards hygiene
education, as well as strategic prepositioning
and continued distribution of soap and water
treatment materials in high-risk and flood-
affected areas.
4) Recovery programmes that aim to alleviate financial
pressures by directing assistance through the
labour market (i.e. public works programmes)
should target the poorest households and those
considered most affected by the floods. these
programmes are encouraged to explore multi-
faceted channels and more frequent disbursement
modalities for this assistance.
5) In the short-term, the price paid to farmers
for dry season paddy should be closely monitored:
substantial deviations from historical prices will
undoubtedly affect farmers’ ability to meet
their increased financial burdens resulting from
the floods. In the medium- to long-term, more
robust protection mechanisms are needed for
small-scale farmers to prevent them from
resorting to negative coping strategies to deal
with external shocks.
6) the newly standardized health benefits
package for households qualifying for social
safety net programmes (IDPoor, Health equity
funds, etc.) should be widely communicated
throughout the health system, to sub-national
and local governments, and eligible house-
holds to ensure optimal programme participation.
7) Recovery programmes that seek to protect
children and to improve school attendance
should be designed in ways that recognize
the economic context within which households,
particularly those affected by the floods, are
being forced to rely upon child labour.
8) Recovery programmes that seek to improve
households’ investment in productive activities
(agricultural as well as self-employment/small
business) with financial assistance will see
the greatest marginal benefits from the poorest
households.
9) additional financial support, in the form of
targeted social safety net activities, is needed
by the poorest and most vulnerable households
to protect against the deterioration of the health
and nutritional status of their families, particularly
children under 5.
10) the continued provision of preventative nutrition
support (e.g., vitamin a supplementation,
micronutrient fortification of foods, and home
gardening projects, among others) is considered
a vital gap-filling strategy for protecting these
households and children.
11) Disaster preparedness plans, and future relief
phase responses in general, will do well by
aiming to mitigate an external shock’s impact on
livelihoods and incomes through targeted
supports (agricultural inputs, credit for self-
employed, etc.) and financial assistance for
large monthly expenses.
xiv CAMBODIAPost-Flood Relief and Recovery Survey 2012
1CAMBODIAPost-Flood Relief and Recovery Survey 2012
sectIon
1.1 bacKGRoUnD
In september 2011, above average rainfall resulted in
severe flooding along the Mekong and tonle sap river
basins, affecting 18 of cambodia’s 24 provinces [1].
the floods were reportedly the worst cambodia had
experienced in more than a decade.
cambodia’s national committee for Disaster Mana-
gement (ncDM) estimated that more than 350,000
households were affected and 50,000 households
were displaced by the flooding [2]. the floods affected
an estimated 3,800 kilometers of roads, 1,200 schools,
and more than 100 health centers. More than 400,000
hectares of cultivated land were affected and 270,000
hectares reportedly destroyed by the flooding [3].
In the immediate aftermath, rapid assessments in
the most affected provinces found that the floods
had negatively impacted household food stocks and
normal livelihood activities, potentially reducing rural
households’ ability to access food [4]. Destruction of
roads, schools, and health centers, as well as village-
level infrastructure, created concern that access to
basic services had been severely disrupted in flooded
areas. Moreover, according to the Ministry of Planning’s
Identification of Poor Households Programme, nearly
a third of rural households are classified as poor [5],
the implications of which were that many households in
flood-affected provinces had a low capacity for coping
with external shocks in general, and therefore would
have been especially vulnerable to the effects of the
2011 floods.
as immediate relief efforts by government agencies,
the cambodian Red cross, and development
partners gradually gave way to longer-term recovery
considerations, it was agreed that an expanded
investigation into the floods’ effects on food security and
nutrition, health, water and sanitation, household assets
and economic situation was needed to better identify
the most appropriate preparedness and recovery
phase activities.
1.2 sURVey obJectIVes
The main objectives of the Cambodia Post-flood Relief
and Recovery Survey were to:
1. collect timely information on household- and
individual-level food security, nutrition, health
and livelihood measures among a representative
sample of households in flood-affected
provinces:
food security (food stocks, food consumption,
dietary diversity, access to markets, access to
food assistance)
Health and nutrition (child and maternal
anthropometry, infant and young child feeding
practices, recent morbidity, access to health
services)
Water, sanitation, and hygiene (access to safe
water and adequate sanitation facilities, water
treatment, hand-washing and soap)
livelihoods (current income sources, household
expenditures, loans and debt)
assets (damage to housing, village infrastructure,
livestock, farm land)
coping capacity (type and severity of coping
strategies)
2. Identify household and community needs, inform
the timing of transit ion from relief to recovery
phase activities, and recommend areas of high
priority for emergency preparation and recovery
programmes to government and development
stakeholders.
IntRoDUctIon1
2 CAMBODIAPost-Flood Relief and Recovery Survey 2012
2.1 sURVey DesIGn
the Post-flood survey was designed to provide
representative information on households and children
under-5 living within 250 meters of the peak-flood
boundary as photographed by satellite from september
27–30, 2011.1 for data quality and logistical reasons,
the geographical coverage of the survey was limited
to flood-affected provinces in the Plains and tonle sap
ecological zones.2
the survey employed a two-stage cluster design and
was stratified by ecological zone. eighty-two villages
were sampled from each zone for a total of 164 villages.
Within each village, fifteen households were randomly
sampled according to the updated ePI method
recommended by the sMaRt methodology; this
household sampling method was used because time
and budgetary limitations did not allow for a detailed
household listing required by a simple or systematic
random sample [6].
the indicator requiring the most households was wasting among children aged 6–59 months (table 2). this number
was rounded up to 1,230 to allow for fifteen households within each of the 82 villages; thus there were 2,460
households in the overall sample.
table 1. Provinces for Post-flood survey
Tonle Sap (#villages) Plains (#villages)
siem Reap (17) Kampong cham (20)
Pursat (5) Kandal (29)
Kampong thom (18) Prey Veng (20)
Kampong chnnang (8) svay Rieng (7)
battambong (14) takeo (6)
banteay Meanchey (20)
2.2 saMPle sIZe
the sample size of households required for each
ecological zone was determined by calculating the
minimum sample required for various individual
indicators of interest.
equation 1. n = [Deff * 1.962 * P * (1-P)] / [(a * d2)]
n: minimum sample of households required
Deff: estimated design effect
P: estimated prevalence of indicator
a: estimated non-response
d: desired precisiontable 2. sample size caculations
Target group estimated Prevalence
estimated DeFF
Desired Precision
Number Individuals
Per HH
estimated HH Non-
ResponseTotal HH
children 6-59 Months
Wasting 0.109 1.20 0.03 0.46 0.88 1228.9
stunting 0.399 1.35 0.05 0.46 0.88 1228.9
sectIon
MetHoDoloGy2
1
this design was chosen because there were large areas in many flood-affected provinces that were not at risk of having been directly affected by the floods. the survey’s primary
objectives were to understand the floods’ impact on households and identify priority recovery activities; as a result, this more limited sampling frame avoided visiting households with near
zero probability of having directly experienced the floods’ effects. an important implication of this design is that the estimates contained within this report cannot be extrapolated to
the entire populations of the Plains and tonle sap ecological zones; inferences can only be made about the total population living within 250 meters of the peak-flood boundary. the total
population figures for this area are provided in appendix 6.
2 even within the more limited sampling area, there were invariably some households (albeit a very small number) which did not directly experience the floods’ effects. However, for
simplicity, the phrase “flood-affected” has been used to denote the area within 250 meters of the peak-flood boundary (i.e. the sampling frame).
3CAMBODIAPost-Flood Relief and Recovery Survey 2012
sectIon 2
2.3 saMPlInG
First Stage
as stated above, the Post-flood survey employed a
two-stage cluster design. In the first stage of sampling,
a master sampling frame was developed that contained
all villages according to the 2008 census within 250
meters of the peak-flood boundary.3 this sampling
frame was divided by ecological zone to generate
two strata, Plains and tonle sap. for each stratum, a
listing was constructed that included the number of
households for every census enumeration area. eighty-
two clusters were then sampled from each stratum
listing using probability-proportional-to-size (PPs). to do
this, a sampling interval (sI) was first created by dividing
the stratum’s cumulative population by the planned
number of clusters (82). a random number between
one and the sI was generated and the first cluster
was identified by finding the enumeration area with a
cumulative population matching this random number.
following the selection of the first cluster, each
subsequent cluster was identified by adding the sI
to the previous figure and finding the corresponding
enumeration area.
Second Stage
Upon entering a sampled village, enumerators first
visited with the village chief to notify him of their arrival
and to explain the purpose of survey. enumerators then
asked the chief to take them to the approximate center
of the village, whereupon they spun a pen to determine
the first direction of travel; enumerators proceeded in
this direction until they reached the edge of the village.
after reaching the edge of the village, the pen was
again spun to determine a second direction of travel.
enumerators counted the number of households they
passed along this second direction up to the edge of
the village. a random number table was then used to
select the first household for the survey from the list.
after completing the first household, enumerators
proceeded to interview the next nearest household.
enumerators continued in this way, selecting the next
nearest household, until fifteen were completed.
Missing Households and Children
for the household questionnaire, enumerators interviewed
the head of household, or a member of the household
who was familiar with its day-to-day affairs. If members
of a selected household had not been present in the
past three months, enumerators were instructed to skip
to the next nearest household (i.e. this household was
not counted as one of the fifteen required). However, if
members were currently living in a household but follow-
ups proved unsuccessful, the household was counted
as one of the fifteen required for interview.
for the child questionnaire, enumerators made every
effort to interview the child’s mother. If she was not
present at the time of visit, enumerators were instructed
to make an appointment to meet with her later in the day.
If children under-5 were not present, an appointment
was made to collect their height and weight information
later on the day of visit.
Informed Consent and Refusals
before beginning the household and child question-
naires, enumerators read respondents a statement
explaining the purpose of the survey and the importance
of information to be collected. Respondents were
given the chance to ask questions and then had to give
verbal consent before the enumerator proceeded with
the questionnaire. Respondents refusing to participate
in the survey were thanked for their time and recorded
as a refusal for non-response purposes.
2.4 tRaInInG anD PRe-testInG
a comprehensive training for enumerators was
conducted January 5–7, 2012 (appendix 1). the
training covered all aspects of survey implementation
and was coordinated and conducted by Helen Keller
International (HKI) staff, with additional support from
World food Programme (WfP) for food security-related
modules. topics for the training included:
survey background and objectives
Roles of team members, responsibilities and
accountabilities
3 to generate the list of villages within 250 meters of the peak-flood boundary, the satellite photograph was superimposed onto a digital map containing GPs coordinates. arcGIs software
enabled the identification of all villages within the stipulated distance.
4 CAMBODIAPost-Flood Relief and Recovery Survey 2012
sectIon 2
survey methodology and sampling issues
Interviewing techniques
anthropometric measurement training
Review of each question in the household, child,
and focus Group Discussion (fGD) questionnaires
following the training, a field practicum was held on
January 8 in two villages near Phnom Penh. enumerators
practiced household sampling, interviewing, and
anthropometric measurements during the pre-test.
Helen Keller staff then conducted a systematic review of
the pre-test performance of each enumerator to identify
the strongest to participate in fieldwork activities.
2.5 fIelDWoRK loGIstIcs
Helen Keller was also contracted to provide overall
coordination of fieldwork operations (appendix 2). four
HKI staff supervised the eight teams of enumerators
(three enumerators per team) who were tasked with
interviewing 15 households per day. teams traveled
together according to a survey schedule prepared by
HKI, and when possible, convened at night to discuss
that day’s work and solve any problems that arose.
fieldwork activities were conducted from January 10–
29, 2012.
2.6 sURVey QUestIonnaIRes
there were four primary data collection tools for the
survey (appendix 3). the most comprehensive of these,
a household questionnaire, was administered to each
household sampled within the villages. enumerators
were expected to speak with the head of the household
or with someone intimately familiar with the household’s
affairs if the head was not available. the household
questionnaire was divided into 13 sections that aimed
to collect the most important information highlighted in
the objectives.
the survey also used a child questionnaire to collect
relevant information on children under-5 in sampled
households. enumerators were expected to speak
with the child’s mother or the child’s primary caretaker
if the mother could not be interviewed. If a household
contained multiple children under-5, a separate child
questionnaire was filled out for each child. Height,
weight, and MUac measurements were taken for all
children aged 6–59 months and their mothers.
In addition to the household and child questionnaires, a
short focus Group Discussion (fGD) questionnaire with
additional, open-ended questions was administered for
each village. When all households for the village had
been completed, enumerators requested six men and
women to gather at a central point for the short session.
enumerators then asked a short series of questions
meant to promote discussion and reflection to generate
additional information that would complement the data
collected at the household level. the purpose of the
fGD was to get community members talking freely
about the questions presented.
finally, in each province, two or three different markets
were visited to assess their overall condition. the
market chief was asked a short series of questions
to gauge whether the market was operating at pre-
flood levels. Prices of basic commodities were also
collected from traders and information on wages for day
labourers was collected. this information was needed
to help determine whether communities had access to
functioning markets and if elevated food prices might
have been further affecting households’ ability to cope
with the floods.
the english version of each questionnaire was translated
into Khmer, which was subsequently back-translated
to ensure the translated version’s meaning was faithful
to the original.
2.7 Data QUalIty contRol
throughout the entire survey process, several levels
of supervision ensured that the data collected was
accurate and reliable. Helen Keller supervisors carefully
managed the training and pre-testing phases to ensure
a complete understanding of the meaning and intent of
all questions. these supervisors also closely monitored
fieldwork activities and reviewed all questionnaires for
completeness.
at the start of fieldwork activities, HKI supervisors
also performed spot checks of enumerators during
administration of the questionnaires to identify any
significant variations in tone or rapport that might have
biased the respondents’ answers.
to further ensure the quality of anthropometric data
collected, the height and weight data of children under-5
were routinely entered and checked for digit preference,
5CAMBODIAPost-Flood Relief and Recovery Survey 2012
sectIon 2
acceptable standard deviation ranges, and normalcy of
z-score distributions.
2.8 Data entRy, PRocessInG, cleanInG
Helen Keller data management staff designed a data
entry screen using sPss Data entry builder to capture
the information from the hard-copy questionnaires
into electronic format [7]. the screen used various
measures to prevent entry errors, such as range limits for
all numerical variables; checks were also incorporated
to flag incongruous responses from different sections
of the questionnaire. the screen was further cross-
checked with pre-test questionnaires to identify errors
and updated to accommodate final questionnaire
changes.
a team of five data entry clerks based in Phnom Penh
entered all questionnaires twice to ensure complete
verification of the data. the duplicate data files were
compared to identify entry differences; when differences
were found, the hard-copy questionnaires were
consulted to confirm the correct information. the master
files were then checked for duplicate entries.
2.9 Data analysIs
Descriptive statistics for all variables were run to
ensure that the distribution of responses (and relative
frequencies) fell within expected ranges. Household
and child weights were derived to account for differential
probabilities of selection and response rates of
population sub-groups. all survey data were analyzed
using stata/MP v. 11.0, and the complex sampling
design was accounted for using the software’s svyset
function [8].
an sPss syntax file provided by WHo was used to
generate children’s anthropometric z-scores according
to WHo 2006 Growth standards. the anthropometric
data were checked for various biases, including age
heaping, digit preference and intra-team weight and
height variances. cases that were flagged as having
very high or low z-scores (i.e. less than -3 sD or more
than +3 sD from the mean) were checked against the
hard-copy questionnaires.
2.10 saMPle coVeRaGe
according to the sample design, a total of 2,460
households were expected for the 2012 cambodia
Post-flood Relief and Recovery survey. table 3 shows
the final number of households and eligible children
for which data was collected. the response rate for
all households was 97 percent, and the majority of
incomplete questionnaires resulted from unsuccessful
follow-ups in the Plains ecological zone.
table 3. Results of Household Interviews
number of households and children aged 0-59 months, and response rates, by ecological zone (unweighted).
cambodia Post-flood Relief and Recovery survey, January 2012.
Resultsecological Zone
Plains Tonle Sap Total
Households
selected 1,230 1,230 2,460
completed 1,176 1,221 2,397
Refused 14 2 16
not at home 39 7 46
other 1 0 1
Household response rate 95.6 99.3 97.4
children
eligible 591 685 1,276
completed 591 685 1,276
eligible children response rate 100.0 100.0 100.0
overall response rate 95.6 95.6 97.4
6 CAMBODIAPost-Flood Relief and Recovery Survey 2012
for the 2012 cambodia Post-flood survey, a household
was defined as a group of people who shared the same
cooking arrangements. a series of questions were
asked of each household to construct the contextual
information that many of the outcome indicators would
be considered against.Unless otherwise noted, the data
presented henceforth have been weighted to reflect
that, though an equal number of villages were visited in
each ecological zone, the population of flood-affected
households was much larger in the Plains area.
3.1 HoUseHolD coMPosItIon
as shown in table 4, the survey found that a majority
of flood-affected households in the Plains and tonle
sap zones were headed by women (53 percent for
both).4 the average number of usual members, at five,
was consistent with findings for rural areas from other
national surveys.
3.2 HoUseHolD cHaRacteRIstIcs
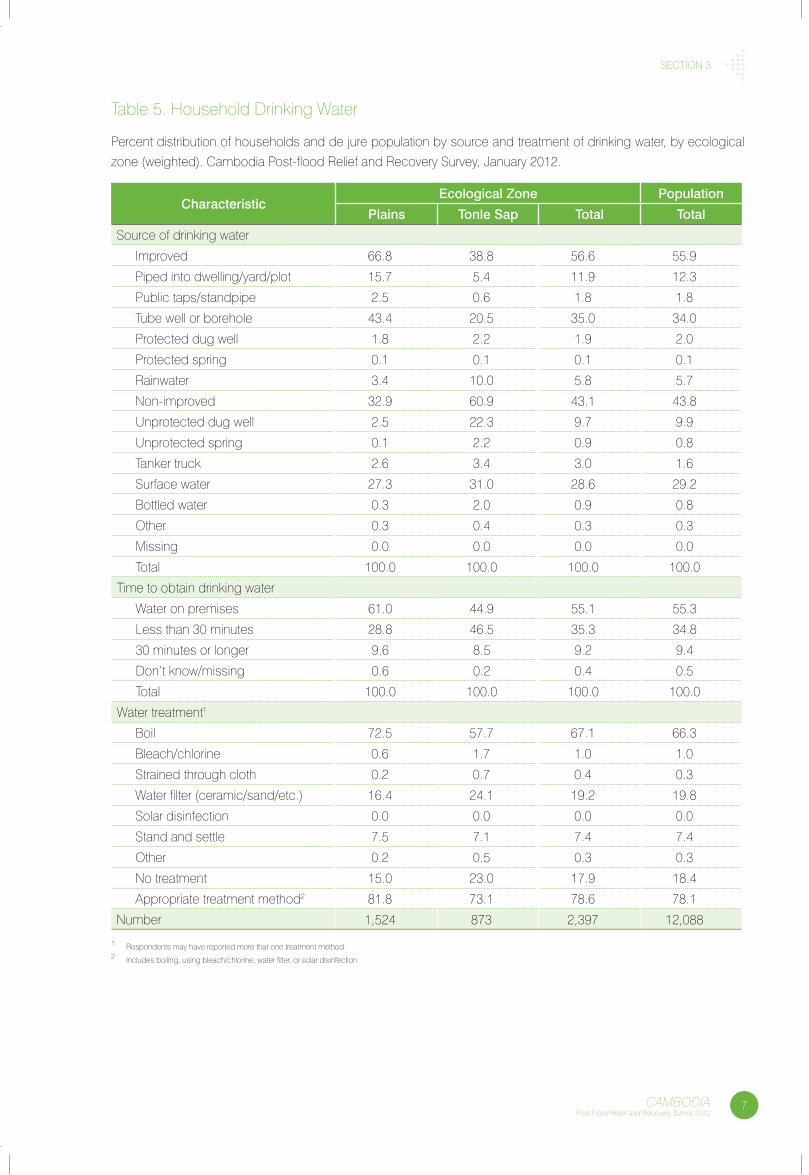
Source of Drinking Water
as relevant information for many outcome indicators,
and because the flood’s impact on household-level
access measures was unclear, respondents were
asked to provide information on thier currrent source
of drinking water. table 5 shows that access to an
improved source of drinking water varied considerably
by ecological zone; two-thirds of Plains households
were using an improved source, while less than half of
tonle sap households were doing the same (67 and
39 percent, respectively). Households in the tonle sap
were more reliant on unprotected wells (22 percent
vs. 3 percent), while Plains households had better
access to boreholes (43 percent vs. 21 percent). a
majority of households in both zones reported using an
appropriate method for treating their drinking water (82
and 73 percent for Plains and tonle sap, respectively).
Type of Toilet Facility
access to an improved toilet facility varied less by zone.
table 6 shows that roughly a third of flood-affected
households in the Plains and tonle sap areas (34 and
29 percent, respectively) were using improved toilets,
which is consistent with 2010 cDHs findings [9]. More
than half of all flood-affected households had no facility
and were defecating in open areas.
Hand-washing and Soap Availability
because of the environmental risks associated with the
flood, a primary response in the immediate aftermath
was to provide soap and other hygiene materials. the
2012 Post-flood survey sought to determine whether
the hygiene situation in households met acceptable
standards. enumerators were instructed to visually verify
whether a location with water and soap existed at or
near the household; as shown in table 7, nearly 3 in
4 households (73 percent) had such a hand-washing
area. a majority of affected households (87 percent)
appeared to have access to soap of some kind.
Housing Materials
In addition to water and sanitation access, the 2012
Post-flood survey sought to assess the floods’effect
on housing as well. enumerators observed the main
materials of each household’s floor, walls, and roof,
before asking a series of questions related to the floods’
impact. table 8 shows the distribution of households by
flooring material (see tables 73 and 74 for household
distribution by wall and roofing material). Most
households in the tonle sap zone (76 percent) had
sectIon
HoUseHolD cHaRacteRIstIcs3
4 this finding is at odds with other national figures that show a much higher percentage of households headed by men (73% in 2010 cDHs). one likely explanation: during survey training,
enumerators were advised to probe respondents about “who makes the day-to-day household and financial decisions,” a difference that might have resulted in capturing which sex
“managed” the household as opposed to which one “headed” it.
7CAMBODIAPost-Flood Relief and Recovery Survey 2012
sectIon 3
table 5. Household Drinking Water
Percent distribution of households and de jure population by source and treatment of drinking water, by ecological
zone (weighted). cambodia Post-flood Relief and Recovery survey, January 2012.
Characteristicecological Zone Population
Plains Tonle Sap Total Total
source of drinking water
Improved 66.8 38.8 56.6 55.9
Piped into dwelling/yard/plot 15.7 5.4 11.9 12.3
Public taps/standpipe 2.5 0.6 1.8 1.8
tube well or borehole 43.4 20.5 35.0 34.0
Protected dug well 1.8 2.2 1.9 2.0
Protected spring 0.1 0.1 0.1 0.1
Rainwater 3.4 10.0 5.8 5.7
non-improved 32.9 60.9 43.1 43.8
Unprotected dug well 2.5 22.3 9.7 9.9
Unprotected spring 0.1 2.2 0.9 0.8
tanker truck 2.6 3.4 3.0 1.6
surface water 27.3 31.0 28.6 29.2
bottled water 0.3 2.0 0.9 0.8
other 0.3 0.4 0.3 0.3
Missing 0.0 0.0 0.0 0.0
total 100.0 100.0 100.0 100.0
time to obtain drinking water
Water on premises 61.0 44.9 55.1 55.3
less than 30 minutes 28.8 46.5 35.3 34.8
30 minutes or longer 9.6 8.5 9.2 9.4
Don’t know/missing 0.6 0.2 0.4 0.5
total 100.0 100.0 100.0 100.0
Water treatment1
boil 72.5 57.7 67.1 66.3
bleach/chlorine 0.6 1.7 1.0 1.0
strained through cloth 0.2 0.7 0.4 0.3
Water filter (ceramic/sand/etc.) 16.4 24.1 19.2 19.8
solar disinfection 0.0 0.0 0.0 0.0
stand and settle 7.5 7.1 7.4 7.4
other 0.2 0.5 0.3 0.3
no treatment 15.0 23.0 17.9 18.4
appropriate treatment method2 81.8 73.1 78.6 78.1
number 1,524 873 2,397 12,088
1 Respondents may have reported more that one treatment method.2 Includes boiling, using bleach/chlorine, water filter, or solar disinfection.
8 CAMBODIAPost-Flood Relief and Recovery Survey 2012
sectIon 3
wood planks as flooring, while the distribution according
to flooring material was more varied in the Plains zone.
the distribution of wall material was fairly consistent
across zones, such that covered adobe was the most
prevalent source (42 percent), followed by palm/
thatch and metal (35 and 12 percent, respectively); a
greater discrepancy was seen within household roofing
material, with a larger proportion of households in the
tonle sap using metal (60 percent vs. 47 percent), and
a greater proportion of households in the Plains using
clay tiles (35 percent vs. 22 percent).
Source of Cooking Fuel
also of interest for the Post-flood survey was the impact
the floods might have had on the access and usage
of fuel sources for cooking. ninety-two percent of
households in flood-affected areas of the Plains and
tonle sap zones were using wood to heat and prepare
their meals, a finding that is largely consistent with that
from the 2010 cDHs [9].
IDPoor Status
finally, table 8 also shows the distribution of flood-
affected households by IDPoor and other poverty-
related status. Roughly 1 in 4 households (23 percent)
had been identified in some way as candidates for
social safety net support.
3.3 HoUseHolD PossessIons
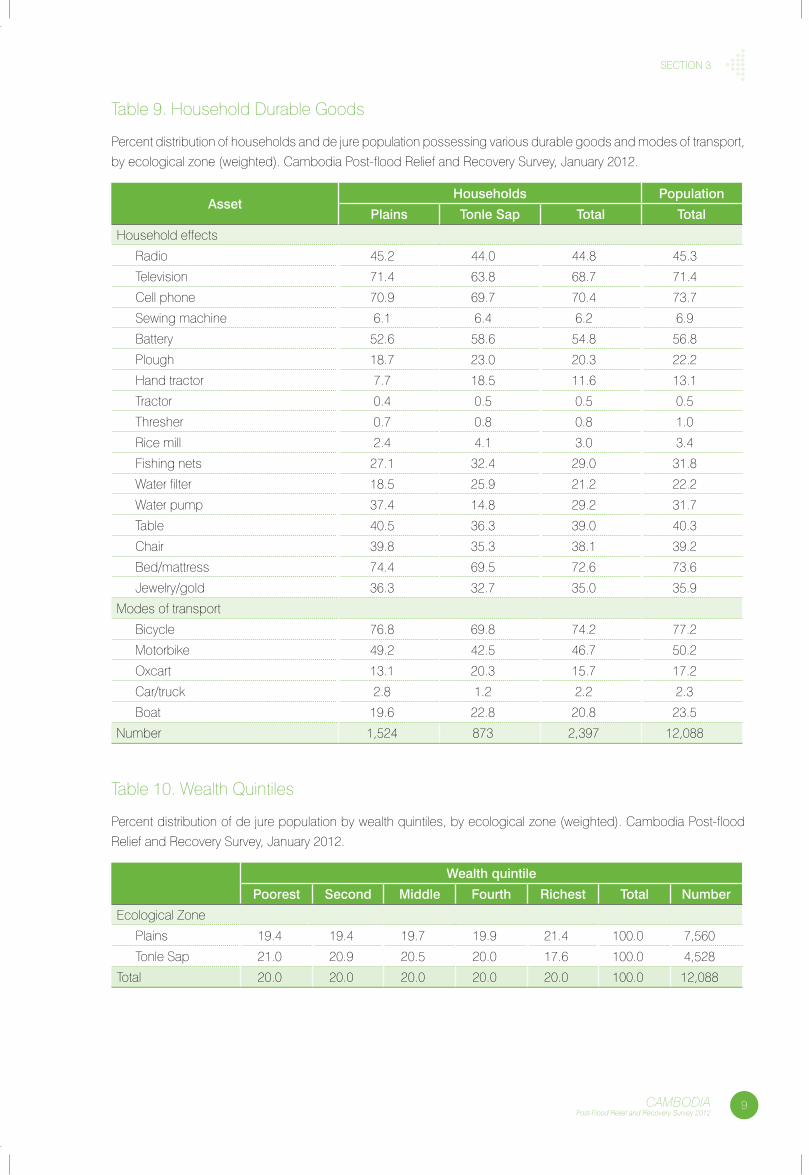
Asset Ownership
Households were also asked whether they owned
a range of assets prior to the floods; this information
allowed both for the construction of a wealth profile of
each household and for an understanding of assets lost
as a result of the floods. table 9 shows the distribution
of households by individual asset ownership. among
the most common assets owned in each zone prior
to the floods were mobile phones and televisions (70
and 69 percent, respectively). Households in the tonle
sap area appeared to have slightly more agriculturally
productive assets, including ploughs (23 percent) and
hand tractors (19 percent). the distribution of households
owning water filters in each zone aligns well with the
water treatment findings. the relatively high proportion of
households in both zones owning a boat, as compared
to the 2010 cDHs findings, reflects the underlying
design of the Post-flood survey, which was more likely
to sample households in close proximity to bodies of
water. three in four households (74 percent) owned a
bicycle, and nearly half (47 percent) owned a motorbike.
3.4 HoUseHolD WealtH
the relative wealth of a household was estimated by
constructing a wealth index for the entire sample. a set
of dichotomous indicators assumed to be associated
with wealth (e.g., source of drinking water, toilet facility,
roofing material, and ownership of various assets) were
given weights created from a principal component
analysis (Pca). these scores were subsequently
normalized with a mean of zero and standard deviation
of one and summed for each household. following this,
a weighted distribution frequency of households was
created in order to determine the cut-points for each
wealth quintile [10].
table 10 shows the distribution of household population
by wealth quintiles, which is mostly similar for each zone,
though it appears that households in flood-affected
areas of the Plains were slightly wealthier than those
in the tonle sap. Many of the main indicators from the
2012 Post-flood survey have been disaggregated by
wealth index to facilitate an equity-based interpretation
of the floods’ impact on households.
3.5 eDUcatIon of MotHeRs
another important source of information for interpreting
many of the survey’s key indicators is the educational
attainment of mothers. Many child-level indicators,
including malnutrition and health-seeking behavior,
are dramatically dependent on the level of education
attained by the child’s mother. as part of the child
questionnaire, the Post-flood survey asked all available
mothers how much schooling they had attended and
completed.
the proportion of mothers who reported ever attending
school (table 11) decreased with age, such that the
percentage of 15–24-year-old mothers ever attending
school (92 percent) was significantly higher than that of
40–44-year-old mothers (70 percent). Mothers living in
the Plains were slightly more likely to have ever attended
school than mothers in the tonle sap (85 and 77
percent, respectively). among mothers in the poorest
households, 64 percent had ever attended school,
compared to 93 percent of mothers in the richest
households.
9CAMBODIAPost-Flood Relief and Recovery Survey 2012
sectIon 3
table 9. Household Durable Goods
Percent distribution of households and de jure population possessing various durable goods and modes of transport,
by ecological zone (weighted). cambodia Post-flood Relief and Recovery survey, January 2012.
assetHouseholds Population
Plains Tonle Sap Total Total
Household effects
Radio 45.2 44.0 44.8 45.3
television 71.4 63.8 68.7 71.4
cell phone 70.9 69.7 70.4 73.7
sewing machine 6.1 6.4 6.2 6.9
battery 52.6 58.6 54.8 56.8
Plough 18.7 23.0 20.3 22.2
Hand tractor 7.7 18.5 11.6 13.1
tractor 0.4 0.5 0.5 0.5
thresher 0.7 0.8 0.8 1.0
Rice mill 2.4 4.1 3.0 3.4
fishing nets 27.1 32.4 29.0 31.8
Water filter 18.5 25.9 21.2 22.2
Water pump 37.4 14.8 29.2 31.7
table 40.5 36.3 39.0 40.3
chair 39.8 35.3 38.1 39.2
bed/mattress 74.4 69.5 72.6 73.6
Jewelry/gold 36.3 32.7 35.0 35.9
Modes of transport
bicycle 76.8 69.8 74.2 77.2
Motorbike 49.2 42.5 46.7 50.2
oxcart 13.1 20.3 15.7 17.2
car/truck 2.8 1.2 2.2 2.3
boat 19.6 22.8 20.8 23.5
number 1,524 873 2,397 12,088
table 10. Wealth Quintiles
Percent distribution of de jure population by wealth quintiles, by ecological zone (weighted). cambodia Post-flood
Relief and Recovery survey, January 2012.
Wealth quintile
Poorest Second Middle Fourth Richest Total Number
ecological Zone
Plains 19.4 19.4 19.7 19.9 21.4 100.0 7,560
tonle sap 21.0 20.9 20.5 20.0 17.6 100.0 4,528
total 20.0 20.0 20.0 20.0 20.0 100.0 12,088
10 CAMBODIAPost-Flood Relief and Recovery Survey 2012
sectIon 3
3.6 scHool attenDance of cHIlDRen 5–14 yeaRs
In addition to maternal education status, households
with children aged 5–14 years were asked to report
whether any of these children were not attending school
at the time of the survey. table 12 shows that 94 percent
of all boys aged 5–14 years were attending school at
the time of the survey; 95 percent of all girls aged 5–14
years were attending school. the proportion of children
attending school was associated with wealth such that
children living in wealthier households were more likely
to have been attending school.
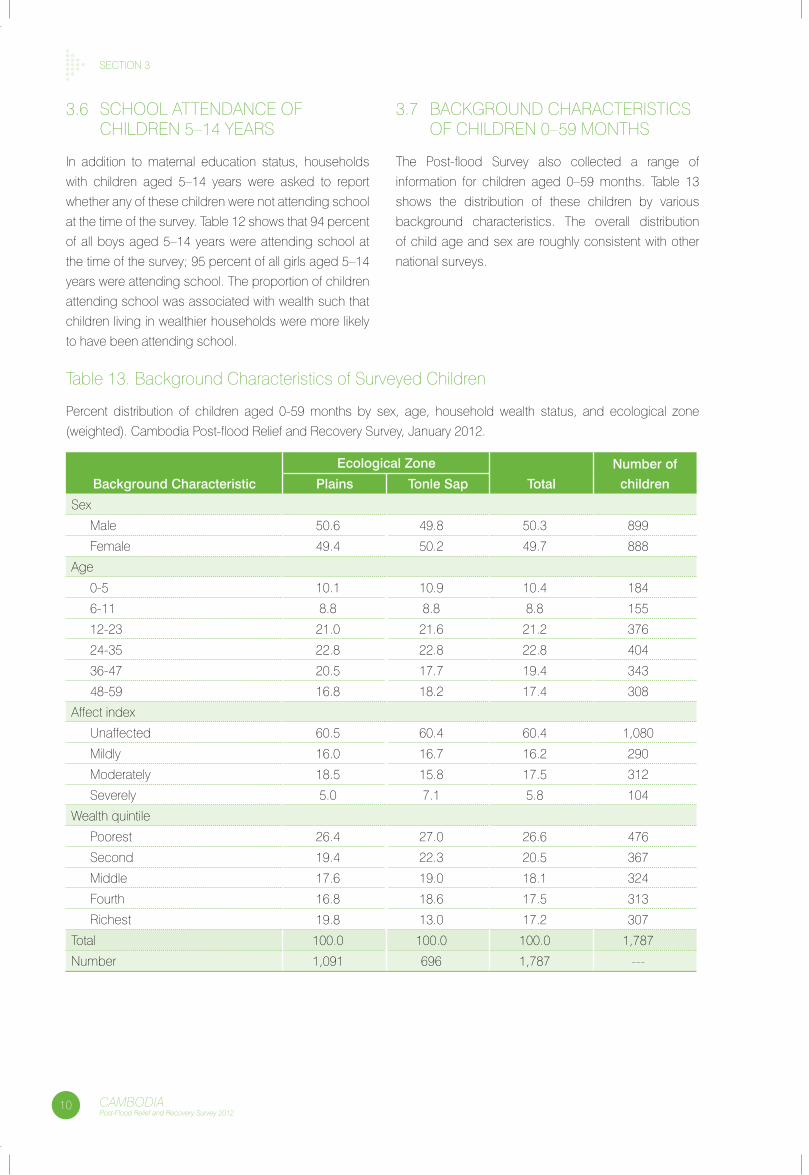
3.7 bacKGRoUnD cHaRacteRIstIcs of cHIlDRen 0–59 MontHs
the Post-flood survey also collected a range of
information for children aged 0–59 months. table 13
shows the distribution of these children by various
background characteristics. the overall distribution
of child age and sex are roughly consistent with other
national surveys.
table 13. background characteristics of surveyed children
Percent distribution of children aged 0-59 months by sex, age, household wealth status, and ecological zone
(weighted). cambodia Post-flood Relief and Recovery survey, January 2012.
ecological Zone
Total
Number of
childrenBackground Characteristic Plains Tonle Sap
sex
Male 50.6 49.8 50.3 899
female 49.4 50.2 49.7 888
age
0-5 10.1 10.9 10.4 184
6-11 8.8 8.8 8.8 155
12-23 21.0 21.6 21.2 376
24-35 22.8 22.8 22.8 404
36-47 20.5 17.7 19.4 343
48-59 16.8 18.2 17.4 308
affect index
Unaffected 60.5 60.4 60.4 1,080
Mildly 16.0 16.7 16.2 290
Moderately 18.5 15.8 17.5 312
severely 5.0 7.1 5.8 104
Wealth quintile
Poorest 26.4 27.0 26.6 476
second 19.4 22.3 20.5 367
Middle 17.6 19.0 18.1 324
fourth 16.8 18.6 17.5 313
Richest 19.8 13.0 17.2 307
total 100.0 100.0 100.0 1,787
number 1,091 696 1,787 ---
4.1 InfoRMatIon anD coMMUnIcatIon
the Post-flood survey sought to better understand the
way important information was received by households
living in flood-affected areas. More specifically, the
survey assessed the various types of information that
households received, the mediums through which
these messages were received, and households’
preferred mediums of information in the event of a future
emergency.
Types of Information
table 14 shows the various types of flood-related
information that households had received since the onset
of flooding. the most common information households
received was related to the flooding situation, which
included messages related to water levels, the need
for relocation, weather forecasts, etc. Households
were least likely to have received information pertaining
to schools (e.g., open/closed) and health care (e.g.,
where/how to seek emergency medical services). the
types of messages received varied little by ecological
zone. More variation was observed according to wealth,
such that the poorest households, in general, were less
likely to receive flood-related information compared to
wealthier households.
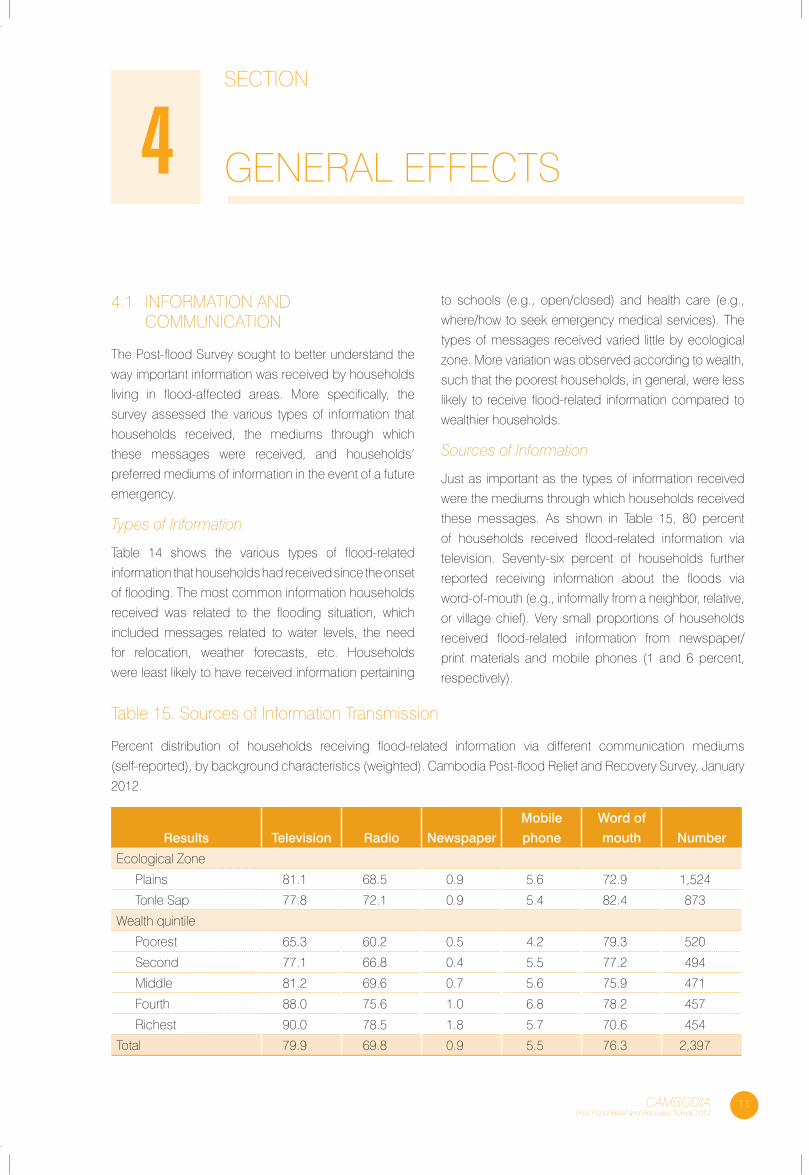
Sources of Information
Just as important as the types of information received
were the mediums through which households received
these messages. as shown in table 15, 80 percent
of households received flood-related information via
television. seventy-six percent of households further
reported receiving information about the floods via
word-of-mouth (e.g., informally from a neighbor, relative,
or village chief). Very small proportions of households
received flood-related information from newspaper/
print materials and mobile phones (1 and 6 percent,
respectively).
sectIon
GeneRal effects4
11CAMBODIAPost-Flood Relief and Recovery Survey 2012
table 15. sources of Information transmission
Percent distribution of households receiving flood-related information via different communication mediums
(self-reported), by background characteristics (weighted). cambodia Post-flood Relief and Recovery survey, January
2012.
Results Television Radio Newspaper
Mobile
phone
Word of
mouth Number
ecological Zone
Plains 81.1 68.5 0.9 5.6 72.9 1,524
tonle sap 77.8 72.1 0.9 5.4 82.4 873
Wealth quintile
Poorest 65.3 60.2 0.5 4.2 79.3 520
second 77.1 66.8 0.4 5.5 77.2 494
Middle 81.2 69.6 0.7 5.6 75.9 471
fourth 88.0 75.6 1.0 6.8 78.2 457
Richest 90.0 78.5 1.8 5.7 70.6 454
total 79.9 69.8 0.9 5.5 76.3 2,397
12 CAMBODIAPost-Flood Relief and Recovery Survey 2012
sectIon 4
Preferred Source of Information
because even well-designed public service messages
will not have the desired effect if they are transmitted
through mediums with minimal reach, households were
also asked to identify their preferred way of receiving
important information in the event of a future disaster.
table 16 shows that two-thirds of households (66
percent) chose television as their preferred source of
emergency-related messaging in the future. the poorest
households were least likely to choose television, but
it was still their most preferred source of emergency
information by a 2 to 1 margin over word-of-mouth.
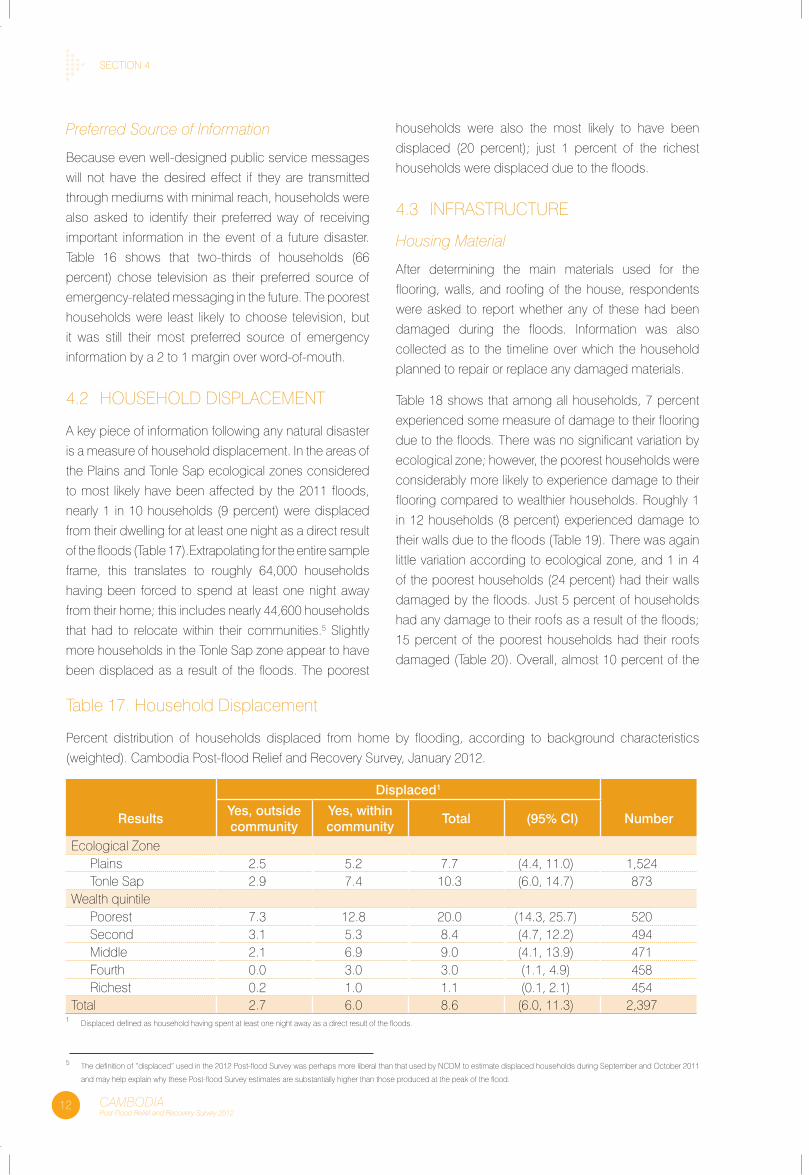
4.2 HoUseHolD DIsPlaceMent
a key piece of information following any natural disaster
is a measure of household displacement. In the areas of
the Plains and tonle sap ecological zones considered
to most likely have been affected by the 2011 floods,
nearly 1 in 10 households (9 percent) were displaced
from their dwelling for at least one night as a direct result
of the floods (table 17).extrapolating for the entire sample
frame, this translates to roughly 64,000 households
having been forced to spend at least one night away
from their home; this includes nearly 44,600 households
that had to relocate within their communities.5 slightly
more households in the tonle sap zone appear to have
been displaced as a result of the floods. the poorest
households were also the most likely to have been
displaced (20 percent); just 1 percent of the richest
households were displaced due to the floods.
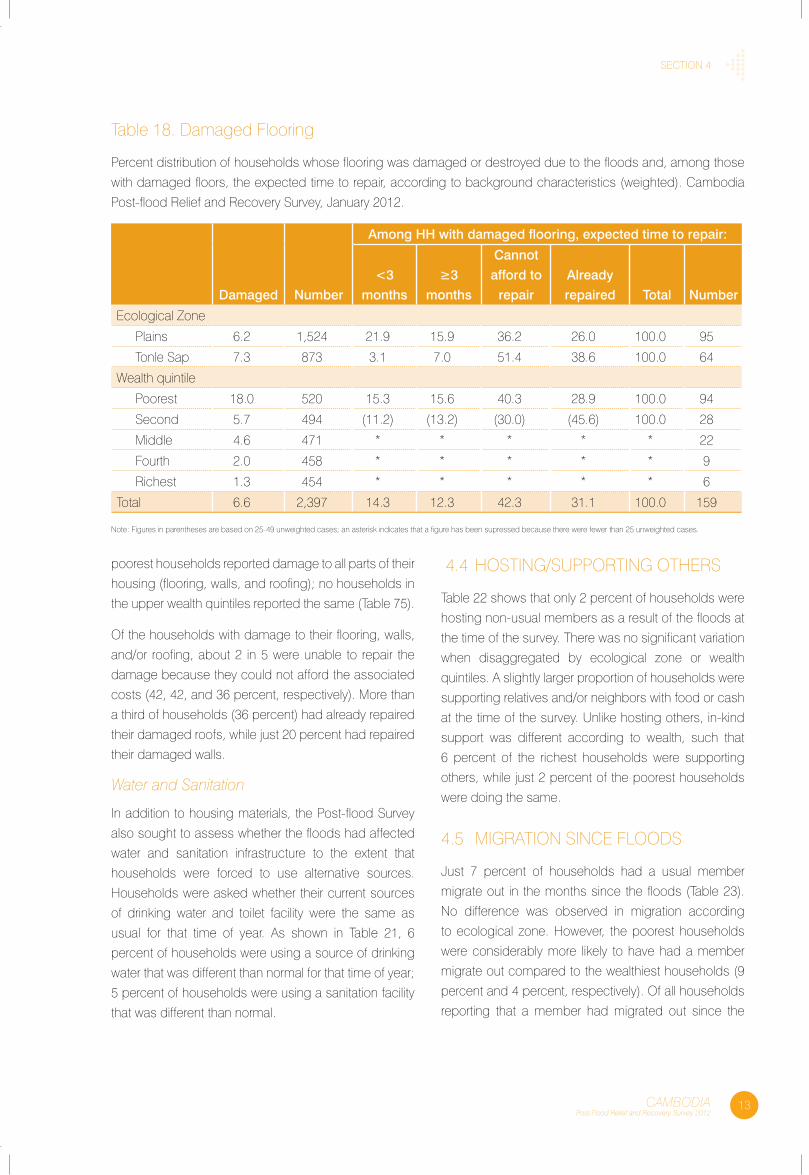
4.3 InfRastRUctURe
Housing Material
after determining the main materials used for the
flooring, walls, and roofing of the house, respondents
were asked to report whether any of these had been
damaged during the floods. Information was also
collected as to the timeline over which the household
planned to repair or replace any damaged materials.
table 18 shows that among all households, 7 percent
experienced some measure of damage to their flooring
due to the floods. there was no significant variation by
ecological zone; however, the poorest households were
considerably more likely to experience damage to their
flooring compared to wealthier households. Roughly 1
in 12 households (8 percent) experienced damage to
their walls due to the floods (table 19). there was again
little variation according to ecological zone, and 1 in 4
of the poorest households (24 percent) had their walls
damaged by the floods. Just 5 percent of households
had any damage to their roofs as a result of the floods;
15 percent of the poorest households had their roofs
damaged (table 20). overall, almost 10 percent of the
table 17. Household Displacement
Percent distribution of households displaced from home by flooding, according to background characteristics
(weighted). cambodia Post-flood Relief and Recovery survey, January 2012.
Displaced1
ResultsYes, outside community
Yes, within community
Total (95% CI) Number
ecological Zone Plains 2.5 5.2 7.7 (4.4, 11.0) 1,524tonle sap 2.9 7.4 10.3 (6.0, 14.7) 873
Wealth quintilePoorest 7.3 12.8 20.0 (14.3, 25.7) 520second 3.1 5.3 8.4 (4.7, 12.2) 494Middle 2.1 6.9 9.0 (4.1, 13.9) 471fourth 0.0 3.0 3.0 (1.1, 4.9) 458Richest 0.2 1.0 1.1 (0.1, 2.1) 454
total 2.7 6.0 8.6 (6.0, 11.3) 2,3971 Displaced defined as household having spent at least one night away as a direct result of the floods.
5 the definition of “displaced” used in the 2012 Post-flood survey was perhaps more liberal than that used by ncDM to estimate displaced households during september and october 2011
and may help explain why these Post-flood survey estimates are substantially higher than those produced at the peak of the flood.
13CAMBODIAPost-Flood Relief and Recovery Survey 2012
sectIon 4
poorest households reported damage to all parts of their
housing (flooring, walls, and roofing); no households in
the upper wealth quintiles reported the same (table 75).
of the households with damage to their flooring, walls,
and/or roofing, about 2 in 5 were unable to repair the
damage because they could not afford the associated
costs (42, 42, and 36 percent, respectively). More than
a third of households (36 percent) had already repaired
their damaged roofs, while just 20 percent had repaired
their damaged walls.
Water and Sanitation
In addition to housing materials, the Post-flood survey
also sought to assess whether the floods had affected
water and sanitation infrastructure to the extent that
households were forced to use alternative sources.
Households were asked whether their current sources
of drinking water and toilet facility were the same as
usual for that time of year. as shown in table 21, 6
percent of households were using a source of drinking
water that was different than normal for that time of year;
5 percent of households were using a sanitation facility
that was different than normal.
4.4 HostInG/sUPPoRtInG otHeRs
table 22 shows that only 2 percent of households were
hosting non-usual members as a result of the floods at
the time of the survey. there was no significant variation
when disaggregated by ecological zone or wealth
quintiles. a slightly larger proportion of households were
supporting relatives and/or neighbors with food or cash
at the time of the survey. Unlike hosting others, in-kind
support was different according to wealth, such that
6 percent of the richest households were supporting
others, while just 2 percent of the poorest households
were doing the same.
4.5 MIGRatIon sInce flooDs
Just 7 percent of households had a usual member
migrate out in the months since the floods (table 23).
no difference was observed in migration according
to ecological zone. However, the poorest households
were considerably more likely to have had a member
migrate out compared to the wealthiest households (9
percent and 4 percent, respectively). of all households
reporting that a member had migrated out since the
table 18. Damaged flooring
Percent distribution of households whose flooring was damaged or destroyed due to the floods and, among those
with damaged floors, the expected time to repair, according to background characteristics (weighted). cambodia
Post-flood Relief and Recovery survey, January 2012.
Damaged Number
among HH with damaged flooring, expected time to repair:
<3
months
≥3
months
Cannot
afford to
repair
already
repaired Total Number
ecological Zone
Plains 6.2 1,524 21.9 15.9 36.2 26.0 100.0 95
tonle sap 7.3 873 3.1 7.0 51.4 38.6 100.0 64
Wealth quintile
Poorest 18.0 520 15.3 15.6 40.3 28.9 100.0 94
second 5.7 494 (11.2) (13.2) (30.0) (45.6) 100.0 28
Middle 4.6 471 * * * * * 22
fourth 2.0 458 * * * * * 9
Richest 1.3 454 * * * * * 6
total 6.6 2,397 14.3 12.3 42.3 31.1 100.0 159
note: figures in parentheses are based on 25-49 unweighted cases; an asterisk indicates that a figure has been supressed because there were fewer than 25 unweighted cases.
14 CAMBODIAPost-Flood Relief and Recovery Survey 2012
sectIon 4
14 CAMBODIAPost-Flood Relief and Recovery Survey 2012
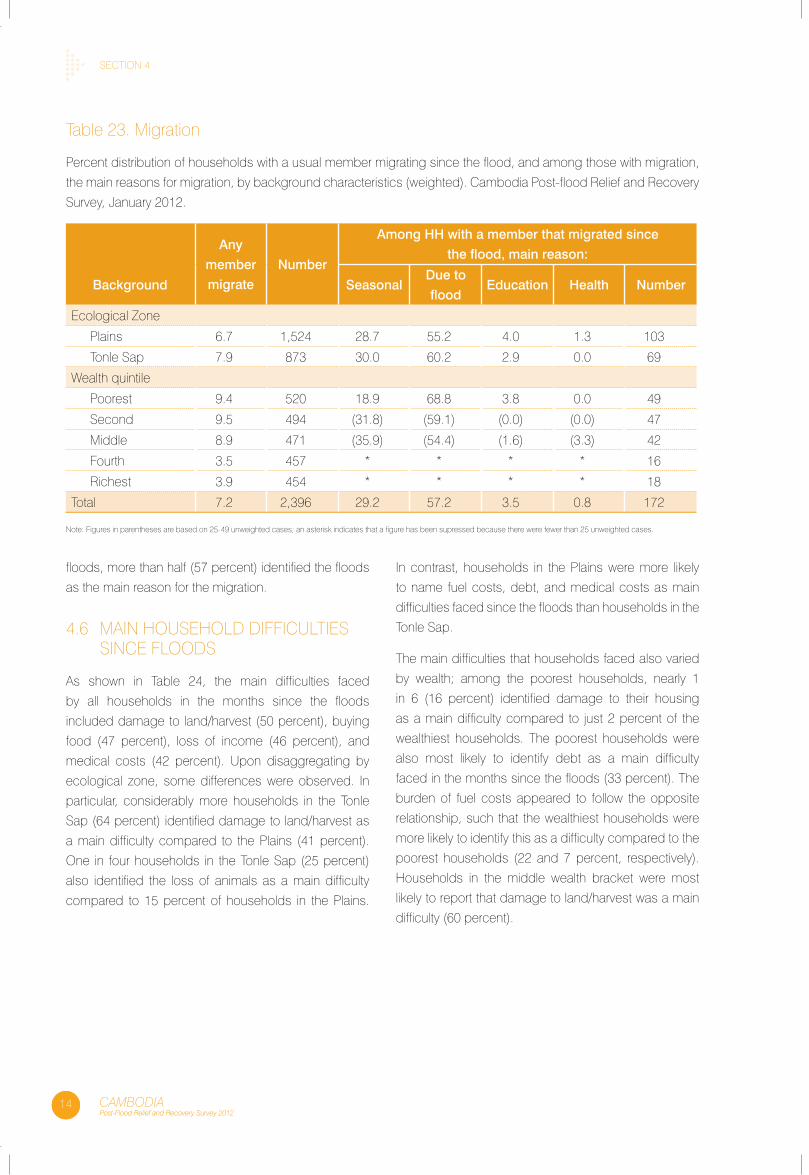
floods, more than half (57 percent) identified the floods
as the main reason for the migration.
4.6 MaIn HoUseHolD DIffIcUltIes sInce flooDs
as shown in table 24, the main difficulties faced
by all households in the months since the floods
included damage to land/harvest (50 percent), buying
food (47 percent), loss of income (46 percent), and
medical costs (42 percent). Upon disaggregating by
ecological zone, some differences were observed. In
particular, considerably more households in the tonle
sap (64 percent) identified damage to land/harvest as
a main difficulty compared to the Plains (41 percent).
one in four households in the tonle sap (25 percent)
also identified the loss of animals as a main difficulty
compared to 15 percent of households in the Plains.
In contrast, households in the Plains were more likely
to name fuel costs, debt, and medical costs as main
difficulties faced since the floods than households in the
tonle sap.
the main difficulties that households faced also varied
by wealth; among the poorest households, nearly 1
in 6 (16 percent) identified damage to their housing
as a main difficulty compared to just 2 percent of the
wealthiest households. the poorest households were
also most likely to identify debt as a main difficulty
faced in the months since the floods (33 percent). the
burden of fuel costs appeared to follow the opposite
relationship, such that the wealthiest households were
more likely to identify this as a difficulty compared to the
poorest households (22 and 7 percent, respectively).
Households in the middle wealth bracket were most
likely to report that damage to land/harvest was a main
difficulty (60 percent).
table 23. Migration
Percent distribution of households with a usual member migrating since the flood, and among those with migration,
the main reasons for migration, by background characteristics (weighted). cambodia Post-flood Relief and Recovery
survey, January 2012.
any
member
migrate
Number
among HH with a member that migrated since
the flood, main reason:
Background SeasonalDue to
floodeducation Health Number
ecological Zone
Plains 6.7 1,524 28.7 55.2 4.0 1.3 103
tonle sap 7.9 873 30.0 60.2 2.9 0.0 69
Wealth quintile
Poorest 9.4 520 18.9 68.8 3.8 0.0 49
second 9.5 494 (31.8) (59.1) (0.0) (0.0) 47
Middle 8.9 471 (35.9) (54.4) (1.6) (3.3) 42
fourth 3.5 457 * * * * 16
Richest 3.9 454 * * * * 18
total 7.2 2,396 29.2 57.2 3.5 0.8 172
note: figures in parentheses are based on 25-49 unweighted cases; an asterisk indicates that a figure has been supressed because there were fewer than 25 unweighted cases.
15CAMBODIAPost-Flood Relief and Recovery Survey 2012
sectIon 4
15CAMBODIAPost-Flood Relief and Recovery Survey 2012
sectIon 4
6 see section 11.1 for a more comprehensive background on the affect Index created for the Post-flood survey.7 note: throughout the report the phrase “most vulnerable” households is used to denote those households identified as severely affected by the affect Index.
see section 11.1 for more information on the affect Index.
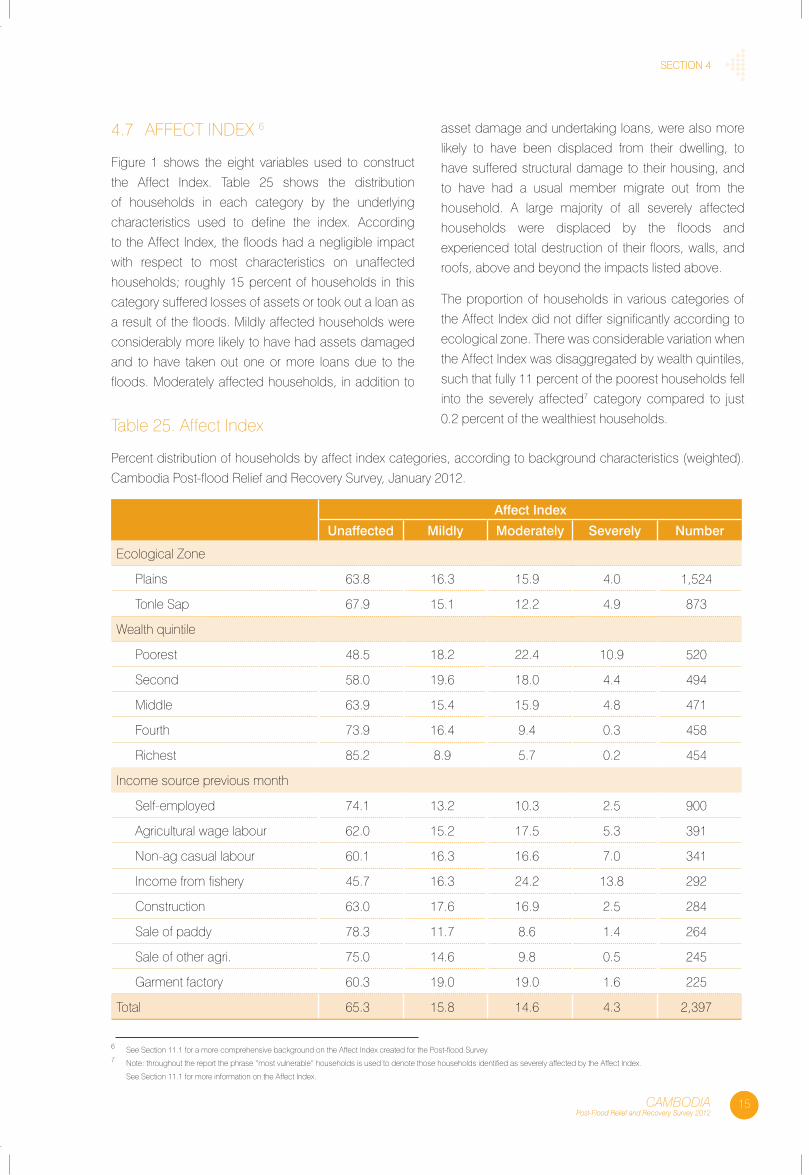
4.7 affect InDeX 6
figure 1 shows the eight variables used to construct
the affect Index. table 25 shows the distribution
of households in each category by the underlying
characteristics used to define the index. according
to the affect Index, the floods had a negligible impact
with respect to most characteristics on unaffected
households; roughly 15 percent of households in this
category suffered losses of assets or took out a loan as
a result of the floods. Mildly affected households were
considerably more likely to have had assets damaged
and to have taken out one or more loans due to the
floods. Moderately affected households, in addition to
asset damage and undertaking loans, were also more
likely to have been displaced from their dwelling, to
have suffered structural damage to their housing, and
to have had a usual member migrate out from the
household. a large majority of all severely affected
households were displaced by the floods and
experienced total destruction of their floors, walls, and
roofs, above and beyond the impacts listed above.
the proportion of households in various categories of
the affect Index did not differ significantly according to
ecological zone. there was considerable variation when
the affect Index was disaggregated by wealth quintiles,
such that fully 11 percent of the poorest households fell
into the severely affected7 category compared to just
0.2 percent of the wealthiest households.table 25. affect Index
Percent distribution of households by affect index categories, according to background characteristics (weighted).
cambodia Post-flood Relief and Recovery survey, January 2012.
affect Index
Unaffected Mildly Moderately Severely Number
ecological Zone
Plains 63.8 16.3 15.9 4.0 1,524
tonle sap 67.9 15.1 12.2 4.9 873
Wealth quintile
Poorest 48.5 18.2 22.4 10.9 520
second 58.0 19.6 18.0 4.4 494
Middle 63.9 15.4 15.9 4.8 471
fourth 73.9 16.4 9.4 0.3 458
Richest 85.2 8.9 5.7 0.2 454
Income source previous month
self-employed 74.1 13.2 10.3 2.5 900
agricultural wage labour 62.0 15.2 17.5 5.3 391
non-ag casual labour 60.1 16.3 16.6 7.0 341
Income from fishery 45.7 16.3 24.2 13.8 292
construction 63.0 17.6 16.9 2.5 284
sale of paddy 78.3 11.7 8.6 1.4 264
sale of other agri. 75.0 14.6 9.8 0.5 245
Garment factory 60.3 19.0 19.0 1.6 225
total 65.3 15.8 14.6 4.3 2,397
16 CAMBODIAPost-Flood Relief and Recovery Survey 2012
5.1 IncoMe soURces
Number of Income Earners
the number of current members earning an income
was collected to further understand households’
income generating potential and absorption capacity
for work-related recovery programmes. as shown in
table 26, just over a third of households (38 percent)
had one or fewer members earning an income at the
time of the survey; about 1 in 6 households (17 percent)
had more than two members earning an income. the
number of income earners did not vary much according
to ecological zone, but considerable differences were
observed when disaggregated by wealth quintiles
and affect Index. Half of the poorest households (50
percent) had one or fewer members earning an income
compared to 23 percent of the wealthiest households.
among households identified as severely affected by
the affect Index, 64 percent had one or fewer members
earning an income.
Compare Number of Earners
Households were also asked about the number
of members earning an income before the floods
to gain, after comparing to the number of earners
after the floods, additional insight into households’
response to the floods. While little discrepancy in the
distribution pattern of income earners before and after
the floods was observed between the two ecological
zones, considerable differences were observed when
disaggregating by the affect Index (table 27). among
the households identified as severely affected by the
floods, 10 percent had fewer income earners at the time
of the survey compared to before the floods. an almost
equal number (8 percent) had more income earners
at the time of the survey; households considered
unaffected by the floods had very little change in their
number of income earners.
Main Income Sources
the ways in which a household generated cash income
was used as an indicator of its coping and resilience
strategies in the aftermath of the floods. Households
were asked to identify their two main sources of income
in the month prior to the survey. table 28 shows the
cumulative response from all households. the most
common type of cash income source reported by
households in both zones was coded as self-employed
(38 percent), which constituted a host of activities,
including reselling market goods in the village, making
breads and cakes for school children, and repairing
motorbikes, among others. one in six households (16
percent) reported doing agricultural wage labour for
others; fourteen percent reported another form of causal
labour that was not agriculture-related. about twice as
many households in the tonle sap reported generating
income in the month prior to the survey from fishing
than in the Plains (18 and 9 percent, respectively);
households in the Plains area were considerably more
likely to have generated cash income from garment
factory work (13 percent).
Change in Income since Floods
In addition to the sources of income and the number
of members earning income, the Post-flood survey
also asked households to report whether the relative
amount of their income had changed as compared to
before the floods. Roughly two-thirds of households
(64 percent) had seen their income decrease since
before the floods (table 29). Households in the poorest
wealth quintile, those considered severely affected by
the affect Index, and those with fewer income earners
compared to before the floods were most likely to report
that they had seen their income decrease (78, 74, and
75 percent, respectively).
sectIon
econoMIc IMPact5
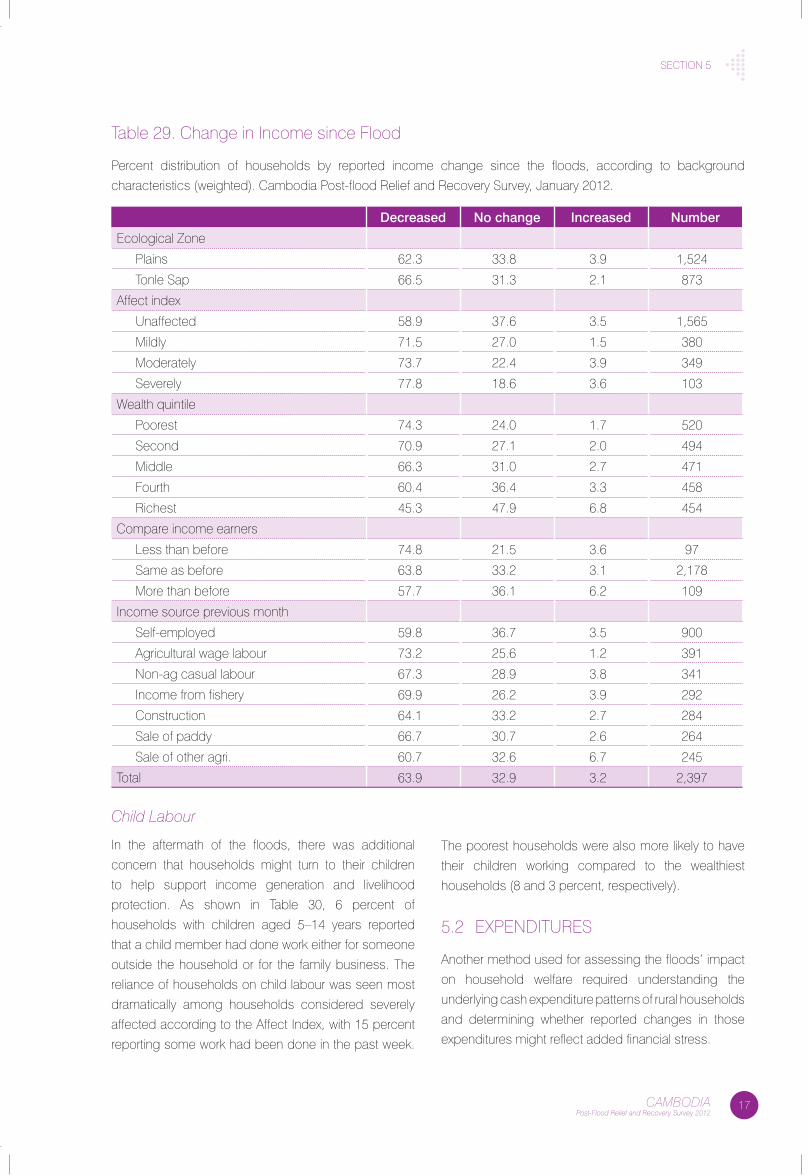
17CAMBODIAPost-Flood Relief and Recovery Survey 2012
sectIon 5
table 29. change in Income since flood
Percent distribution of households by reported income change since the floods, according to background
characteristics (weighted). cambodia Post-flood Relief and Recovery survey, January 2012.
Decreased No change Increased Number
ecological Zone
Plains 62.3 33.8 3.9 1,524
tonle sap 66.5 31.3 2.1 873
affect index
Unaffected 58.9 37.6 3.5 1,565
Mildly 71.5 27.0 1.5 380
Moderately 73.7 22.4 3.9 349
severely 77.8 18.6 3.6 103
Wealth quintile
Poorest 74.3 24.0 1.7 520
second 70.9 27.1 2.0 494
Middle 66.3 31.0 2.7 471
fourth 60.4 36.4 3.3 458
Richest 45.3 47.9 6.8 454
compare income earners
less than before 74.8 21.5 3.6 97
same as before 63.8 33.2 3.1 2,178
More than before 57.7 36.1 6.2 109
Income source previous month
self-employed 59.8 36.7 3.5 900
agricultural wage labour 73.2 25.6 1.2 391
non-ag casual labour 67.3 28.9 3.8 341
Income from fishery 69.9 26.2 3.9 292
construction 64.1 33.2 2.7 284
sale of paddy 66.7 30.7 2.6 264
sale of other agri. 60.7 32.6 6.7 245
total 63.9 32.9 3.2 2,397
Child Labour
In the aftermath of the floods, there was additional
concern that households might turn to their children
to help support income generation and livelihood
protection. as shown in table 30, 6 percent of
households with children aged 5–14 years reported
that a child member had done work either for someone
outside the household or for the family business. the
reliance of households on child labour was seen most
dramatically among households considered severely
affected according to the affect Index, with 15 percent
reporting some work had been done in the past week.
the poorest households were also more likely to have
their children working compared to the wealthiest
households (8 and 3 percent, respectively).
5.2 eXPenDItURes
another method used for assessing the floods’ impact
on household welfare required understanding the
underlying cash expenditure patterns of rural households
and determining whether reported changes in those
expenditures might reflect added financial stress.
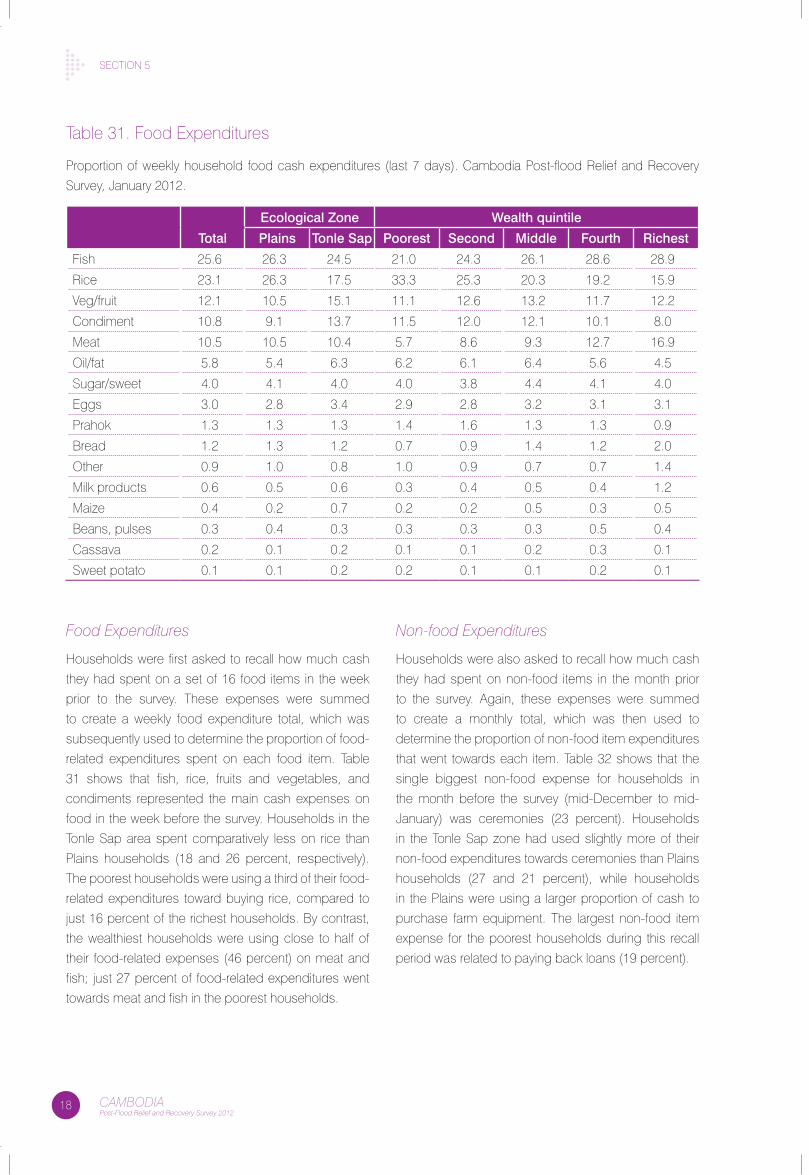
18 CAMBODIAPost-Flood Relief and Recovery Survey 2012
sectIon 5
Food Expenditures
Households were first asked to recall how much cash
they had spent on a set of 16 food items in the week
prior to the survey. these expenses were summed
to create a weekly food expenditure total, which was
subsequently used to determine the proportion of food-
related expenditures spent on each food item. table
31 shows that fish, rice, fruits and vegetables, and
condiments represented the main cash expenses on
food in the week before the survey. Households in the
tonle sap area spent comparatively less on rice than
Plains households (18 and 26 percent, respectively).
the poorest households were using a third of their food-
related expenditures toward buying rice, compared to
just 16 percent of the richest households. by contrast,
the wealthiest households were using close to half of
their food-related expenses (46 percent) on meat and
fish; just 27 percent of food-related expenditures went
towards meat and fish in the poorest households.
Non-food Expenditures
Households were also asked to recall how much cash
they had spent on non-food items in the month prior
to the survey. again, these expenses were summed
to create a monthly total, which was then used to
determine the proportion of non-food item expenditures
that went towards each item. table 32 shows that the
single biggest non-food expense for households in
the month before the survey (mid-December to mid-
January) was ceremonies (23 percent). Households
in the tonle sap zone had used slightly more of their
non-food expenditures towards ceremonies than Plains
households (27 and 21 percent), while households
in the Plains were using a larger proportion of cash to
purchase farm equipment. the largest non-food item
expense for the poorest households during this recall
period was related to paying back loans (19 percent).
table 31. food expenditures
Proportion of weekly household food cash expenditures (last 7 days). cambodia Post-flood Relief and Recovery
survey, January 2012.
ecological Zone Wealth quintile
Total Plains Tonle Sap Poorest Second Middle Fourth Richest
fish 25.6 26.3 24.5 21.0 24.3 26.1 28.6 28.9
Rice 23.1 26.3 17.5 33.3 25.3 20.3 19.2 15.9
Veg/fruit 12.1 10.5 15.1 11.1 12.6 13.2 11.7 12.2
condiment 10.8 9.1 13.7 11.5 12.0 12.1 10.1 8.0
Meat 10.5 10.5 10.4 5.7 8.6 9.3 12.7 16.9
oil/fat 5.8 5.4 6.3 6.2 6.1 6.4 5.6 4.5
sugar/sweet 4.0 4.1 4.0 4.0 3.8 4.4 4.1 4.0
eggs 3.0 2.8 3.4 2.9 2.8 3.2 3.1 3.1
Prahok 1.3 1.3 1.3 1.4 1.6 1.3 1.3 0.9
bread 1.2 1.3 1.2 0.7 0.9 1.4 1.2 2.0
other 0.9 1.0 0.8 1.0 0.9 0.7 0.7 1.4
Milk products 0.6 0.5 0.6 0.3 0.4 0.5 0.4 1.2
Maize 0.4 0.2 0.7 0.2 0.2 0.5 0.3 0.5
beans, pulses 0.3 0.4 0.3 0.3 0.3 0.3 0.5 0.4
cassava 0.2 0.1 0.2 0.1 0.1 0.2 0.3 0.1
sweet potato 0.1 0.1 0.2 0.2 0.1 0.1 0.2 0.1
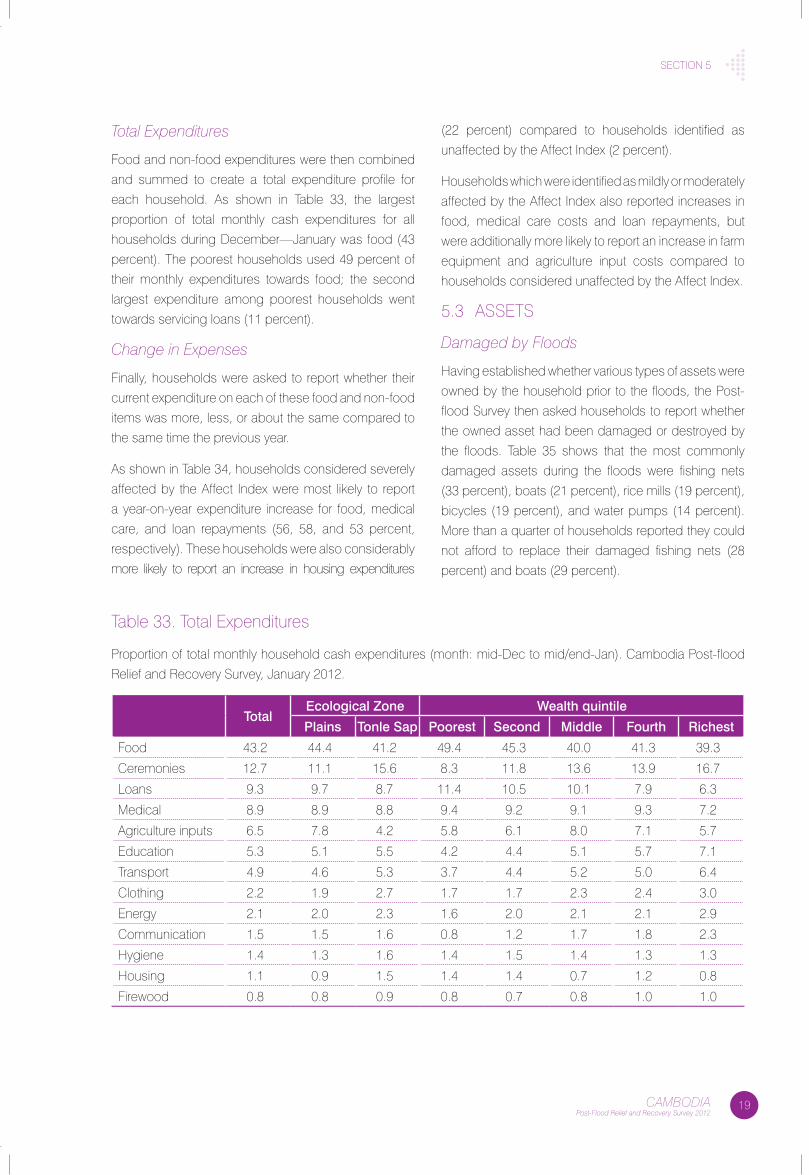
19CAMBODIAPost-Flood Relief and Recovery Survey 2012
sectIon 5
Total Expenditures
food and non-food expenditures were then combined
and summed to create a total expenditure profile for
each household. as shown in table 33, the largest
proportion of total monthly cash expenditures for all
households during December—January was food (43
percent). the poorest households used 49 percent of
their monthly expenditures towards food; the second
largest expenditure among poorest households went
towards servicing loans (11 percent).
Change in Expenses
finally, households were asked to report whether their
current expenditure on each of these food and non-food
items was more, less, or about the same compared to
the same time the previous year.
as shown in table 34, households considered severely
affected by the affect Index were most likely to report
a year-on-year expenditure increase for food, medical
care, and loan repayments (56, 58, and 53 percent,
respectively). these households were also considerably
more likely to report an increase in housing expenditures
(22 percent) compared to households identified as
unaffected by the affect Index (2 percent).
Households which were identified as mildly or moderately
affected by the affect Index also reported increases in
food, medical care costs and loan repayments, but
were additionally more likely to report an increase in farm
equipment and agriculture input costs compared to
households considered unaffected by the affect Index.
5.3 assets
Damaged by Floods
Having established whether various types of assets were
owned by the household prior to the floods, the Post-
flood survey then asked households to report whether
the owned asset had been damaged or destroyed by
the floods. table 35 shows that the most commonly
damaged assets during the floods were fishing nets
(33 percent), boats (21 percent), rice mills (19 percent),
bicycles (19 percent), and water pumps (14 percent).
More than a quarter of households reported they could
not afford to replace their damaged fishing nets (28
percent) and boats (29 percent).
table 33. total expenditures
Proportion of total monthly household cash expenditures (month: mid-Dec to mid/end-Jan). cambodia Post-flood
Relief and Recovery survey, January 2012.
Totalecological Zone Wealth quintile
Plains Tonle Sap Poorest Second Middle Fourth Richest
food 43.2 44.4 41.2 49.4 45.3 40.0 41.3 39.3
ceremonies 12.7 11.1 15.6 8.3 11.8 13.6 13.9 16.7
loans 9.3 9.7 8.7 11.4 10.5 10.1 7.9 6.3
Medical 8.9 8.9 8.8 9.4 9.2 9.1 9.3 7.2
agriculture inputs 6.5 7.8 4.2 5.8 6.1 8.0 7.1 5.7
education 5.3 5.1 5.5 4.2 4.4 5.1 5.7 7.1
transport 4.9 4.6 5.3 3.7 4.4 5.2 5.0 6.4
clothing 2.2 1.9 2.7 1.7 1.7 2.3 2.4 3.0
energy 2.1 2.0 2.3 1.6 2.0 2.1 2.1 2.9
communication 1.5 1.5 1.6 0.8 1.2 1.7 1.8 2.3
Hygiene 1.4 1.3 1.6 1.4 1.5 1.4 1.3 1.3
Housing 1.1 0.9 1.5 1.4 1.4 0.7 1.2 0.8
firewood 0.8 0.8 0.9 0.8 0.7 0.8 1.0 1.0
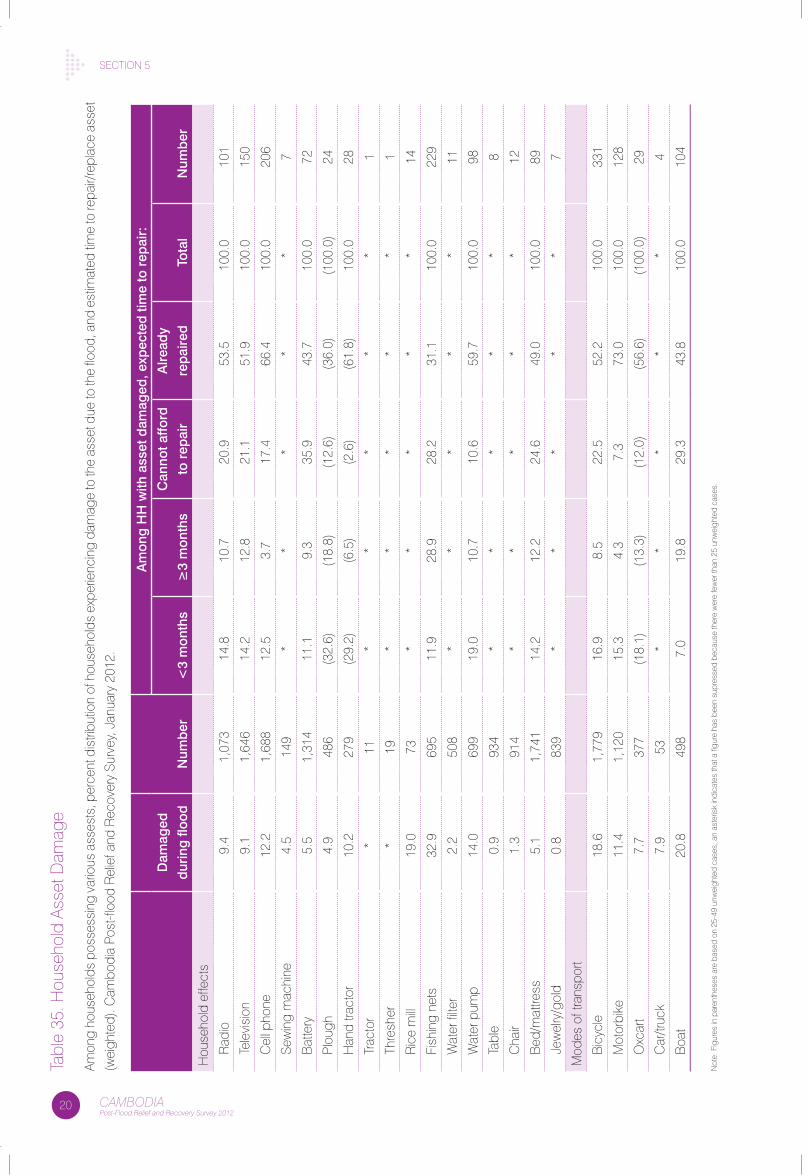
20 CAMBODIAPost-Flood Relief and Recovery Survey 2012
sectIon 5ta
ble
35. H
ouse
hold
ass
et D
amag
e
amon
g ho
useh
olds
pos
sess
ing
vario
us a
sses
ts, p
erce
nt d
istri
butio
n of
hou
seho
lds
expe
rienc
ing
dam
age
to th
e as
set d
ue to
the
flood
, and
est
imat
ed ti
me
to re
pair/
repl
ace
asse
t
(wei
ghte
d). c
ambo
dia
Post
-floo
d R
elie
f and
Rec
over
y su
rvey
, Jan
uary
201
2.
Dam
aged
dur
ing
floo
dN
umb
er
am
ong
HH
with
ass
et d
amag
ed, e
xpec
ted
tim
e to
rep
air:
<3
mon
ths
≥3
mon
ths
Can
not a
fford
to r
epai
r
alr
ead
y
rep
aire
dTo
tal
Num
ber
Hou
seho
ld e
ffect
s
Rad
io9.
41,
073
14.8
10.7
20.9
53.5
100.
010
1
tele
visi
on9.
11,
646
14.2
12.8
21.1
51.9
100.
015
0
cel
l pho
ne12
.21,
688
12.5
3.7
17.4
66.4
100.
020
6
sew
ing
mac
hine
4.5
149
**
**
*7
bat
tery
5.5
1,31
411
.19.
335
.943
.710
0.0
72
Plou
gh4.
948
6(3
2.6)
(18.
8)(1
2.6)
(36.
0)(1
00.0
)24
Han
d tra
ctor
10.2
279
(29.
2)(6
.5)
(2.6
)(6
1.8)
100.
0 28
trac
tor
*11
**
**
*1
thre
sher
*19
**
**
*1
Ric
e m
ill19
.073
**
**
*14
fish
ing
nets
32.9
695
11.9
28.9
28.2
31.1
100.
022
9
Wat
er fi
lter
2.2
508
**
**
*11
Wat
er p
ump
14.0
699
19.0
10.7
10.6
59.7
100.
098
tabl
e0.
993
4*
**
**
8
cha
ir1.
391
4*
**
**
12
bed
/mat
tress
5.1
1,74
114
.212
.224
.649
.010
0.0
89
Jew
elry
/gol
d0.
883
9*
**
**
7
Mod
es o
f tra
nspo
rt
bic
ycle
18.6
1,77
916
.98.
522
.552
.210
0.0
331
Mot
orbi
ke11
.41,
120
15.3
4.3
7.3
73.0
100.
012
8
oxc
art
7.7
377
(18.
1)(1
3.3)
(12.
0)(5
6.6)
(100
.0)
29
car
/truc
k7.
953
**
**
*4
boa
t20
.849
87.
019
.829
.343
.810
0.0
104
not
e: f
igur
es in
par
enth
eses
are
bas
ed o
n 25
-49
unw
eigh
ted
case
s; a
n as
teris
k in
dica
tes
that
a fi
gure
has
bee
n su
pres
sed
beca
use
ther
e w
ere
few
er th
an 2
5 un
wei
ghte
d ca
ses.
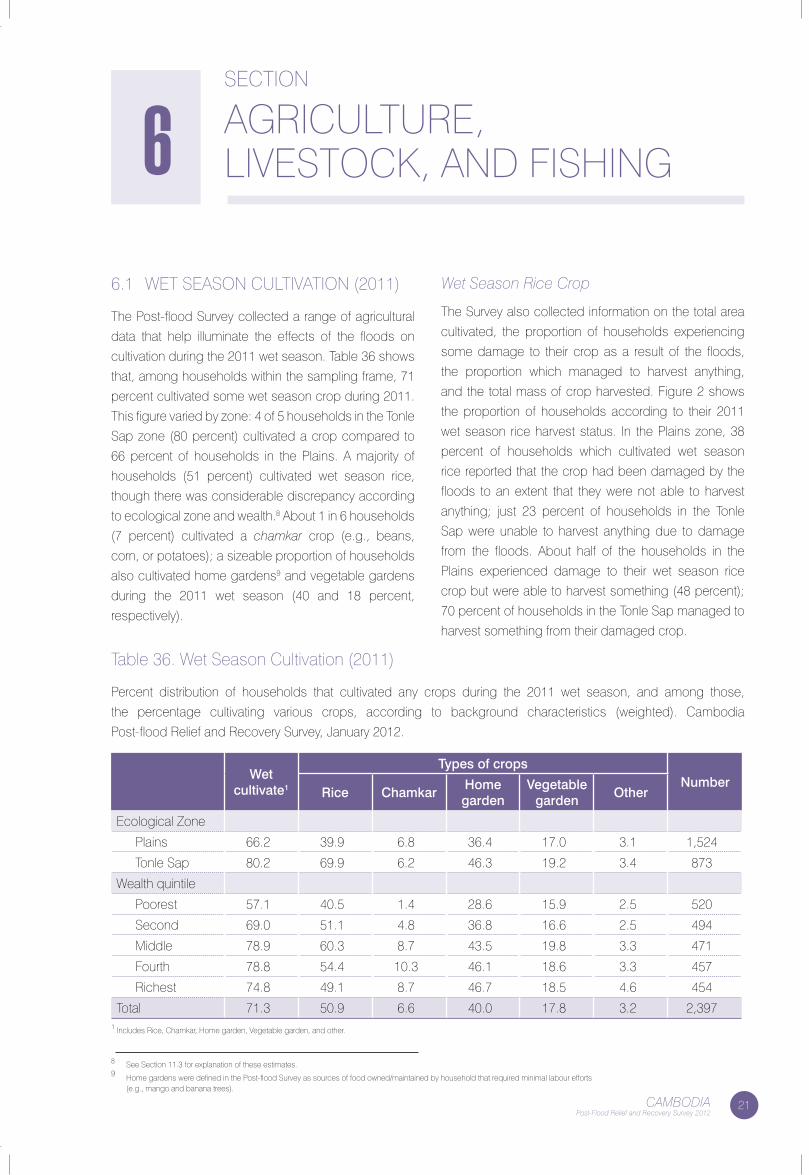
21CAMBODIAPost-Flood Relief and Recovery Survey 2012
6.1 Wet season cUltIVatIon (2011)
the Post-flood survey collected a range of agricultural
data that help illuminate the effects of the floods on
cultivation during the 2011 wet season. table 36 shows
that, among households within the sampling frame, 71
percent cultivated some wet season crop during 2011.
this figure varied by zone: 4 of 5 households in the tonle
sap zone (80 percent) cultivated a crop compared to
66 percent of households in the Plains. a majority of
households (51 percent) cultivated wet season rice,
though there was considerable discrepancy according
to ecological zone and wealth.8 about 1 in 6 households
(7 percent) cultivated a chamkar crop (e.g., beans,
corn, or potatoes); a sizeable proportion of households
also cultivated home gardens9 and vegetable gardens
during the 2011 wet season (40 and 18 percent,
respectively).
Wet Season Rice Crop
the survey also collected information on the total area
cultivated, the proportion of households experiencing
some damage to their crop as a result of the floods,
the proportion which managed to harvest anything,
and the total mass of crop harvested. figure 2 shows
the proportion of households according to their 2011
wet season rice harvest status. In the Plains zone, 38
percent of households which cultivated wet season
rice reported that the crop had been damaged by the
floods to an extent that they were not able to harvest
anything; just 23 percent of households in the tonle
sap were unable to harvest anything due to damage
from the floods. about half of the households in the
Plains experienced damage to their wet season rice
crop but were able to harvest something (48 percent);
70 percent of households in the tonle sap managed to
harvest something from their damaged crop.
sectIon
aGRIcUltURe, lIVestocK, anD fIsHInG6
table 36. Wet season cultivation (2011)
Percent distribution of households that cultivated any crops during the 2011 wet season, and among those,
the percentage cultivating various crops, according to background characteristics (weighted). cambodia
Post-flood Relief and Recovery survey, January 2012.
Wet cultivate1
Types of cropsNumber
Rice ChamkarHome garden
Vegetable garden
Other
ecological Zone
Plains 66.2 39.9 6.8 36.4 17.0 3.1 1,524
tonle sap 80.2 69.9 6.2 46.3 19.2 3.4 873
Wealth quintile
Poorest 57.1 40.5 1.4 28.6 15.9 2.5 520
second 69.0 51.1 4.8 36.8 16.6 2.5 494
Middle 78.9 60.3 8.7 43.5 19.8 3.3 471
fourth 78.8 54.4 10.3 46.1 18.6 3.3 457
Richest 74.8 49.1 8.7 46.7 18.5 4.6 454
total 71.3 50.9 6.6 40.0 17.8 3.2 2,3971 Includes Rice, chamkar, Home garden, Vegetable garden, and other.
8 see section 11.3 for explanation of these estimates.9 Home gardens were defined in the Post-flood survey as sources of food owned/maintained by household that required minimal labour efforts (e.g., mango and banana trees).
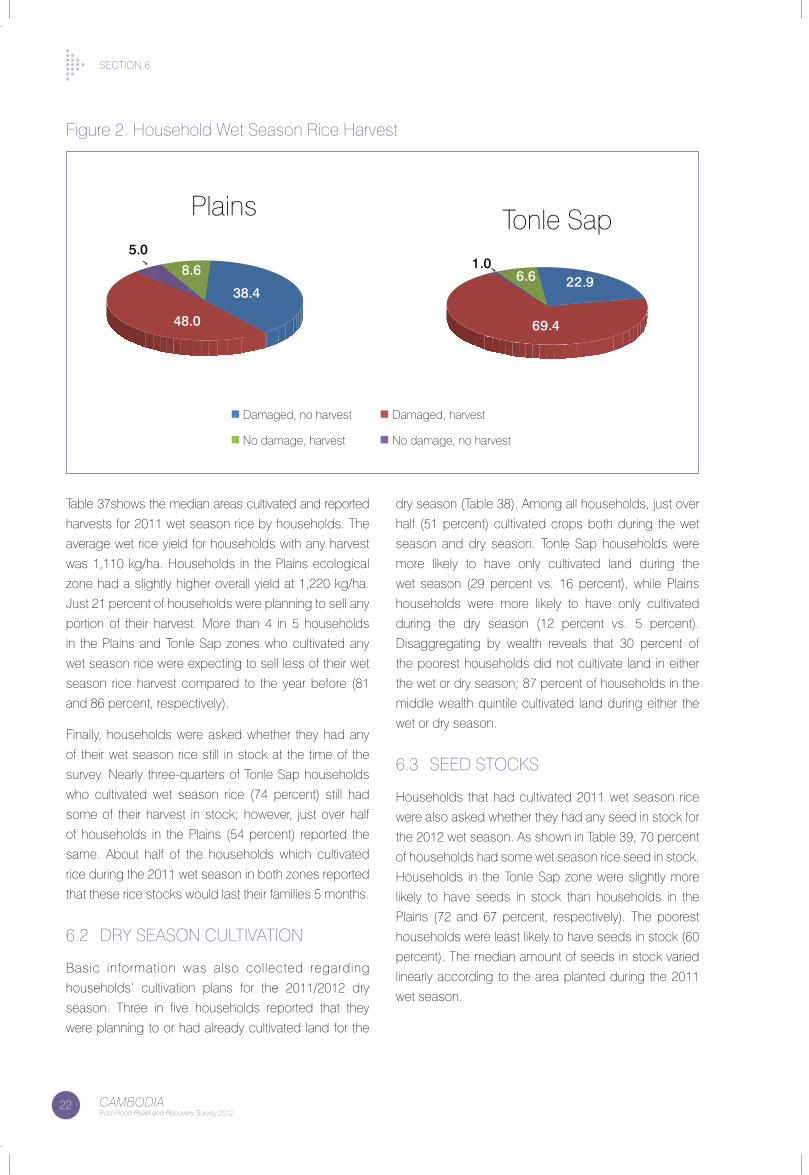
sectIon 6
22 CAMBODIAPost-Flood Relief and Recovery Survey 2012
table 37shows the median areas cultivated and reported
harvests for 2011 wet season rice by households. the
average wet rice yield for households with any harvest
was 1,110 kg/ha. Households in the Plains ecological
zone had a slightly higher overall yield at 1,220 kg/ha.
Just 21 percent of households were planning to sell any
portion of their harvest. More than 4 in 5 households
in the Plains and tonle sap zones who cultivated any
wet season rice were expecting to sell less of their wet
season rice harvest compared to the year before (81
and 86 percent, respectively).
finally, households were asked whether they had any
of their wet season rice still in stock at the time of the
survey. nearly three-quarters of tonle sap households
who cultivated wet season rice (74 percent) still had
some of their harvest in stock; however, just over half
of households in the Plains (54 percent) reported the
same. about half of the households which cultivated
rice during the 2011 wet season in both zones reported
that these rice stocks would last their families 5 months.
6.2 DRy season cUltIVatIon
basic information was also collected regarding
households’ cultivation plans for the 2011/2012 dry
season. three in five households reported that they
were planning to or had already cultivated land for the
dry season (table 38). among all households, just over
half (51 percent) cultivated crops both during the wet
season and dry season. tonle sap households were
more likely to have only cultivated land during the
wet season (29 percent vs. 16 percent), while Plains
households were more likely to have only cultivated
during the dry season (12 percent vs. 5 percent).
Disaggregating by wealth reveals that 30 percent of
the poorest households did not cultivate land in either
the wet or dry season; 87 percent of households in the
middle wealth quintile cultivated land during either the
wet or dry season.
6.3 seeD stocKs
Households that had cultivated 2011 wet season rice
were also asked whether they had any seed in stock for
the 2012 wet season. as shown in table 39, 70 percent
of households had some wet season rice seed in stock.
Households in the tonle sap zone were slightly more
likely to have seeds in stock than households in the
Plains (72 and 67 percent, respectively). the poorest
households were least likely to have seeds in stock (60
percent). the median amount of seeds in stock varied
linearly according to the area planted during the 2011
wet season.
Tonle Sap
22.9
69.4
6.61.0
Plains
Damaged, no harvest Damaged, harvest
No damage, harvest No damage, no harvest
38.4
48.0
8.65.0
figure 2. Household Wet season Rice Harvest
sectIon 6
23CAMBODIAPost-Flood Relief and Recovery Survey 2012
When asked how the amount of seed in stock compared
to previous years, roughly 28 percent of households
reported their stock was less than normal. there was
minimal variation according to ecological zone; 38
percent of the poorest households reported the amount
of seed in their stock was less than normal.
6.4 IRRIGatIon
a series of questions were asked to better understand
household access to irrigation for the current dry
season, as well as the previous wet season. among all
households, 32 percent had access to irrigation at the
time of the survey (table 40). there was a considerable
difference in access to irrigation according to ecological
zone, such that 39 percent of households in the Plains
had access at the time of the survey compared to just 20
percent of tonle sap households. a smaller percentage
of households reported having access to an irrigation
source before the floods (29 percent); the biggest
differences in reported access were in the Plains zone
and among the middle wealth quintile.10
the sources of irrigation to which households had
access prior to the floods were also queried: the most
common source reported was irrigation canals (39
percent). Households in the lowest two wealth quintiles
were more likely to report access to community ponds
(10 percent), while those in the upper wealth quintiles
more frequently reported using the river as a source of
irrigation (23 percent). Wells also served as a source
of irrigation for many households, though this was
captured in the “other” category. among households
with access to irrigation prior to the floods, about 1
in 4 (25 percent) reported that the source had been
damaged during the floods.
6.5 lIVestocK
Questions were also asked to gather information on
the floods’ effect on household livestock situation.
table 41 shows that 75 percent of households in the
sampling frame owned animals before the floods;
the most common animals owned were chickens (68
percent) and cows (34 percent). animal ownership
was fairly consistent between the ecological zones;
households in the middle wealth quintile were most
likely to own animals before the floods (82 percent).
nearly two-thirds of households owning animals before
the floods reported that they had lost any animals as a
result of flooding (68 percent); the poorest households
appeared most likely to have lost animals as a result of
the floods (74 percent).
6.6 fIsHInG
the Post-flood survey also sought to determine whether
the floods had any measureable effect on the fishing
situation for households. table 42 shows that more
than a third of all households (34 percent) reported
catching wild fish before the floods. a larger proportion
of households in the tonle sap reported fishing for
wild fish before the floods compared to the Plains
(42 and 30 percent, respectively). Households in the
poorest wealth quintile were most likely to have been
fishing for wild fish prior to the floods (47 percent). the
proportion fishing for wild fish at the time of the survey
was somewhat lower at 26 percent. When households
that were currently fishing for wild fish were asked how
the catch compared, half reported that the amount was
less than that from the same time the previous year.
few households reported having raised fish before the
floods or that they were raising fish at the time of the
survey (6 and 4 percent, respectively).
10 Due to the sequence and wording of these questions, it is difficult to ascertain whether households with access to irrigation before the flood and at the time of the survey were actually using it for their crops.
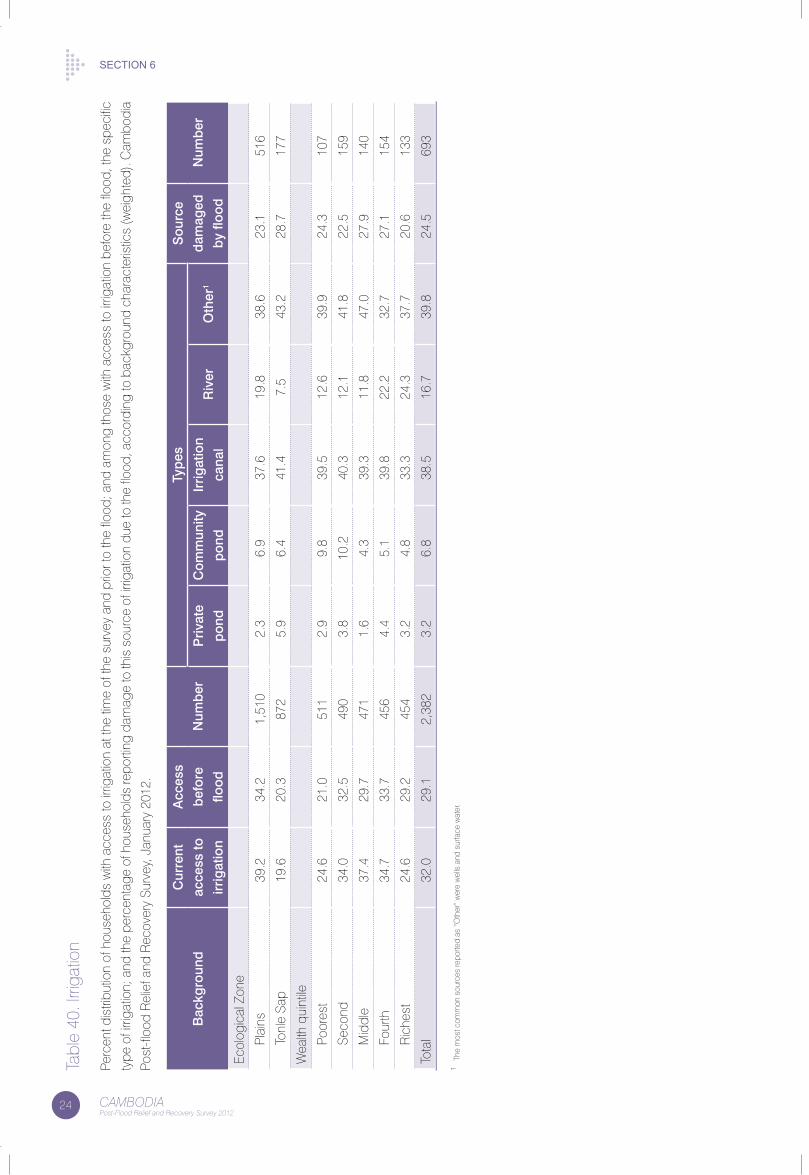
24 CAMBODIAPost-Flood Relief and Recovery Survey 2012
Section 6ta
ble
40. I
rriga
tion
Perc
ent d
istri
butio
n of
hou
seho
lds
with
acc
ess
to ir
rigat
ion
at th
e tim
e of
the
surv
ey a
nd p
rior t
o th
e flo
od; a
nd a
mon
g th
ose
with
acc
ess
to ir
rigat
ion
befo
re th
e flo
od, t
he s
peci
fic
type
of i
rriga
tion;
and
the
perc
enta
ge o
f hou
seho
lds
repo
rting
dam
age
to th
is s
ourc
e of
irrig
atio
n du
e to
the
flood
, acc
ordi
ng to
bac
kgro
und
char
acte
ristic
s (w
eigh
ted)
. cam
bodi
a
Post
-floo
d R
elie
f and
Rec
over
y su
rvey
, Jan
uary
201
2.
Bac
kgro
und
Cur
rent
acce
ss to
irrig
atio
n
acc
ess
bef
ore
flood
Num
ber
Typ
esS
ourc
e
dam
aged
by
flood
Num
ber
Priv
ate
pon
d
Com
mun
ity
pon
d
Irrig
atio
n
cana
lR
iver
Oth
er1
ecol
ogic
al Z
one
Plai
ns39
.2
34.2
1,
510
2.3
6.9
37.6
19
.8
38.6
23
.1
516
tonl
e sa
p19
.6
20.3
87
25.
9 6.
4 41
.4
7.5
43.2
28
.7
177
Wea
lth q
uint
ile
Poor
est
24.6
21
.0
511
2.9
9.8
39.5
12
.6
39.9
24
.3
107
seco
nd34
.0
32.5
49
03.
8 10
.2
40.3
12
.1
41.8
22
.5
159
Mid
dle
37.4
29
.7
471
1.6
4.3
39.3
11
.8
47.0
27
.9
140
four
th34
.7
33.7
45
64.
4 5.
1 39
.8
22.2
32
.7
27.1
15
4
Ric
hest
24.6
29
.2
454
3.2
4.8
33.3
24
.3
37.7
20
.6
133
tota
l32
.0
29.1
2,
382
3.2
6.8
38.5
16
.7
39.8
24
.5
693
1 th
e m
ost c
omm
on s
ourc
es re
porte
d as
“o
ther
” w
ere
wel
ls a
nd s
urfa
ce w
ater
.
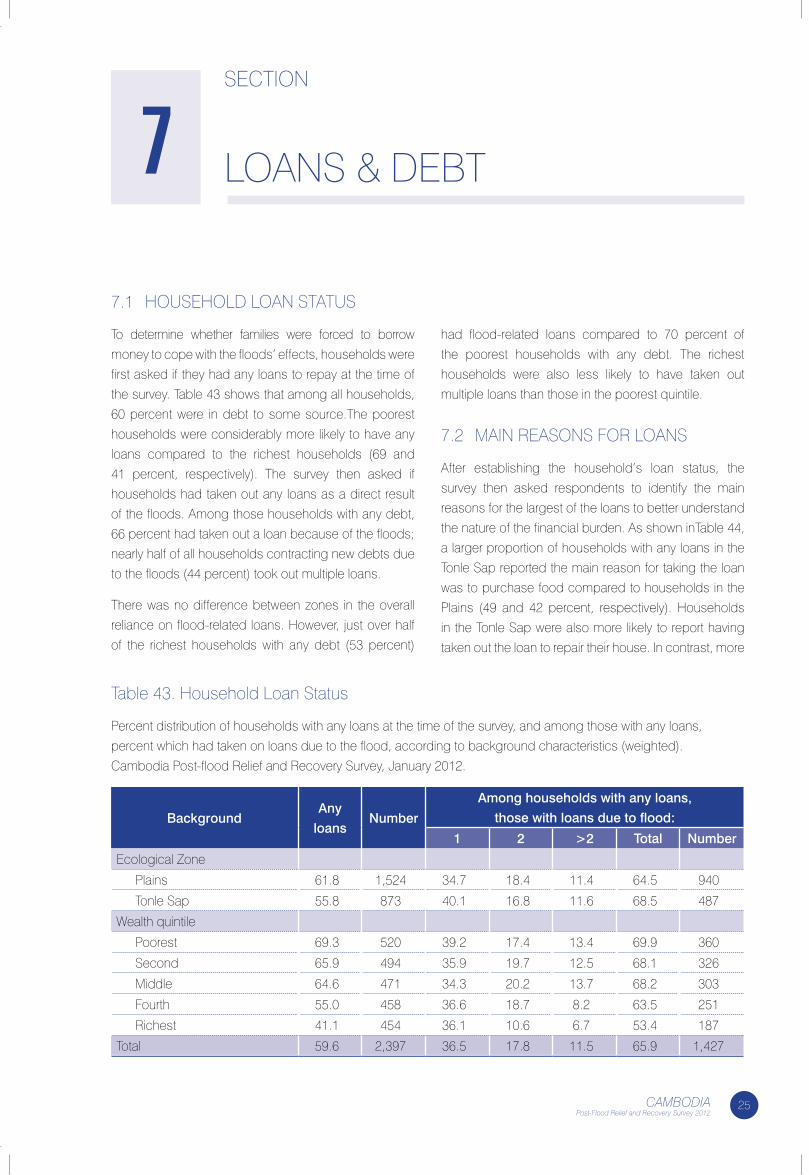
25CAMBODIAPost-Flood Relief and Recovery Survey 2012
7.1 HoUseHolD loan statUs
to determine whether families were forced to borrow
money to cope with the floods’ effects, households were
first asked if they had any loans to repay at the time of
the survey. table 43 shows that among all households,
60 percent were in debt to some source.the poorest
households were considerably more likely to have any
loans compared to the richest households (69 and
41 percent, respectively). the survey then asked if
households had taken out any loans as a direct result
of the floods. among those households with any debt,
66 percent had taken out a loan because of the floods;
nearly half of all households contracting new debts due
to the floods (44 percent) took out multiple loans.
there was no difference between zones in the overall
reliance on flood-related loans. However, just over half
of the richest households with any debt (53 percent)
had flood-related loans compared to 70 percent of
the poorest households with any debt. the richest
households were also less likely to have taken out
multiple loans than those in the poorest quintile.
7.2 MaIn Reasons foR loans
after establishing the household’s loan status, the
survey then asked respondents to identify the main
reasons for the largest of the loans to better understand
the nature of the financial burden. as shown intable 44,
a larger proportion of households with any loans in the
tonle sap reported the main reason for taking the loan
was to purchase food compared to households in the
Plains (49 and 42 percent, respectively). Households
in the tonle sap were also more likely to report having
taken out the loan to repair their house. In contrast, more
sectIon
loans & Debt7
table 43. Household loan status
Percent distribution of households with any loans at the time of the survey, and among those with any loans,
percent which had taken on loans due to the flood, according to background characteristics (weighted).
cambodia Post-flood Relief and Recovery survey, January 2012.
Backgroundany
loansNumber
among households with any loans,
those with loans due to flood:
1 2 >2 Total Number
ecological Zone
Plains 61.8 1,524 34.7 18.4 11.4 64.5 940
tonle sap 55.8 873 40.1 16.8 11.6 68.5 487
Wealth quintile
Poorest 69.3 520 39.2 17.4 13.4 69.9 360
second 65.9 494 35.9 19.7 12.5 68.1 326
Middle 64.6 471 34.3 20.2 13.7 68.2 303
fourth 55.0 458 36.6 18.7 8.2 63.5 251
Richest 41.1 454 36.1 10.6 6.7 53.4 187
total 59.6 2,397 36.5 17.8 11.5 65.9 1,427
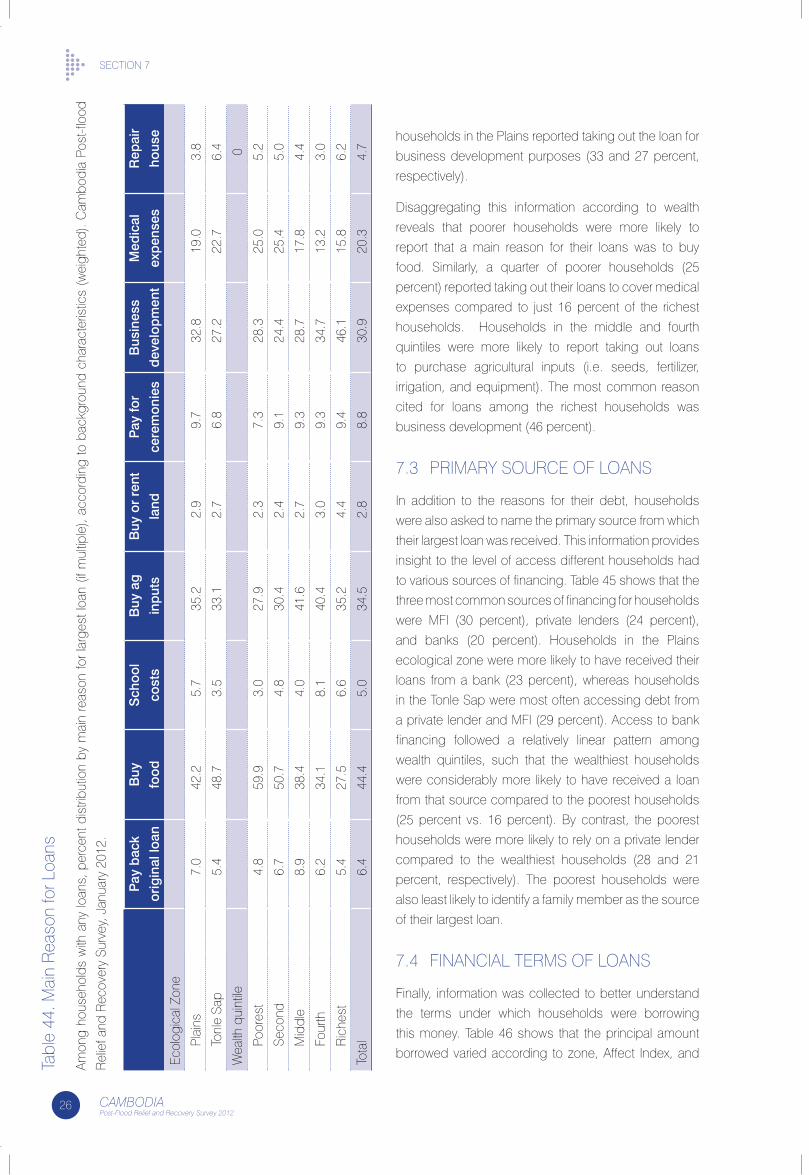
sectIon 7
26 CAMBODIAPost-Flood Relief and Recovery Survey 2012
households in the Plains reported taking out the loan for
business development purposes (33 and 27 percent,
respectively).
Disaggregating this information according to wealth
reveals that poorer households were more likely to
report that a main reason for their loans was to buy
food. similarly, a quarter of poorer households (25
percent) reported taking out their loans to cover medical
expenses compared to just 16 percent of the richest
households. Households in the middle and fourth
quintiles were more likely to report taking out loans
to purchase agricultural inputs (i.e. seeds, fertilizer,
irrigation, and equipment). the most common reason
cited for loans among the richest households was
business development (46 percent).
7.3 PRIMaRy soURce of loans
In addition to the reasons for their debt, households
were also asked to name the primary source from which
their largest loan was received. this information provides
insight to the level of access different households had
to various sources of financing. table 45 shows that the
three most common sources of financing for households
were MfI (30 percent), private lenders (24 percent),
and banks (20 percent). Households in the Plains
ecological zone were more likely to have received their
loans from a bank (23 percent), whereas households
in the tonle sap were most often accessing debt from
a private lender and MfI (29 percent). access to bank
financing followed a relatively linear pattern among
wealth quintiles, such that the wealthiest households
were considerably more likely to have received a loan
from that source compared to the poorest households
(25 percent vs. 16 percent). by contrast, the poorest
households were more likely to rely on a private lender
compared to the wealthiest households (28 and 21
percent, respectively). the poorest households were
also least likely to identify a family member as the source
of their largest loan.
7.4 fInancIal teRMs of loans
finally, information was collected to better understand
the terms under which households were borrowing
this money. table 46 shows that the principal amount
borrowed varied according to zone, affect Index, and
tabl
e 44
. Mai
n R
easo
n fo
r loa
ns
amon
g ho
useh
olds
with
any
loan
s, p
erce
nt d
istri
butio
n by
mai
n re
ason
for l
arge
st lo
an (
if m
ultip
le),
acco
rdin
g to
bac
kgro
und
char
acte
ristic
s (w
eigh
ted)
. cam
bodi
a Po
st-fl
ood
Rel
ief a
nd R
ecov
ery
surv
ey, J
anua
ry 2
012.
Pay
bac
k
orig
inal
loan
Buy
food
Sch
ool
cost
s
Buy
ag
inp
uts
Buy
or
rent
land
Pay
for
cere
mon
ies
Bus
ines
s
dev
elop
men
t
Med
ical
exp
ense
s
Rep
air
hous
e
ecol
ogic
al Z
one
Plai
ns7.
042
.25.
735
.22.
99.
732
.819
.03.
8
tonl
e sa
p5.
448
.73.
533
.12.
76.
827
.222
.76.
4
Wea
lth q
uint
ile0
Poor
est
4.8
59.9
3.0
27.9
2.3
7.3
28.3
25.0
5.2
seco
nd6.
750
.74.
830
.42.
49.
124
.425
.45.
0
Mid
dle
8.9
38.4
4.0
41.6
2.7
9.3
28.7
17.8
4.4
four
th6.
234
.18.
140
.43.
09.
334
.713
.23.
0
Ric
hest
5.4
27.5
6.6
35.2
4.4
9.4
46.1
15.8
6.2
tota
l6.
444
.45.
034
.52.
88.
830
.920
.34.
7
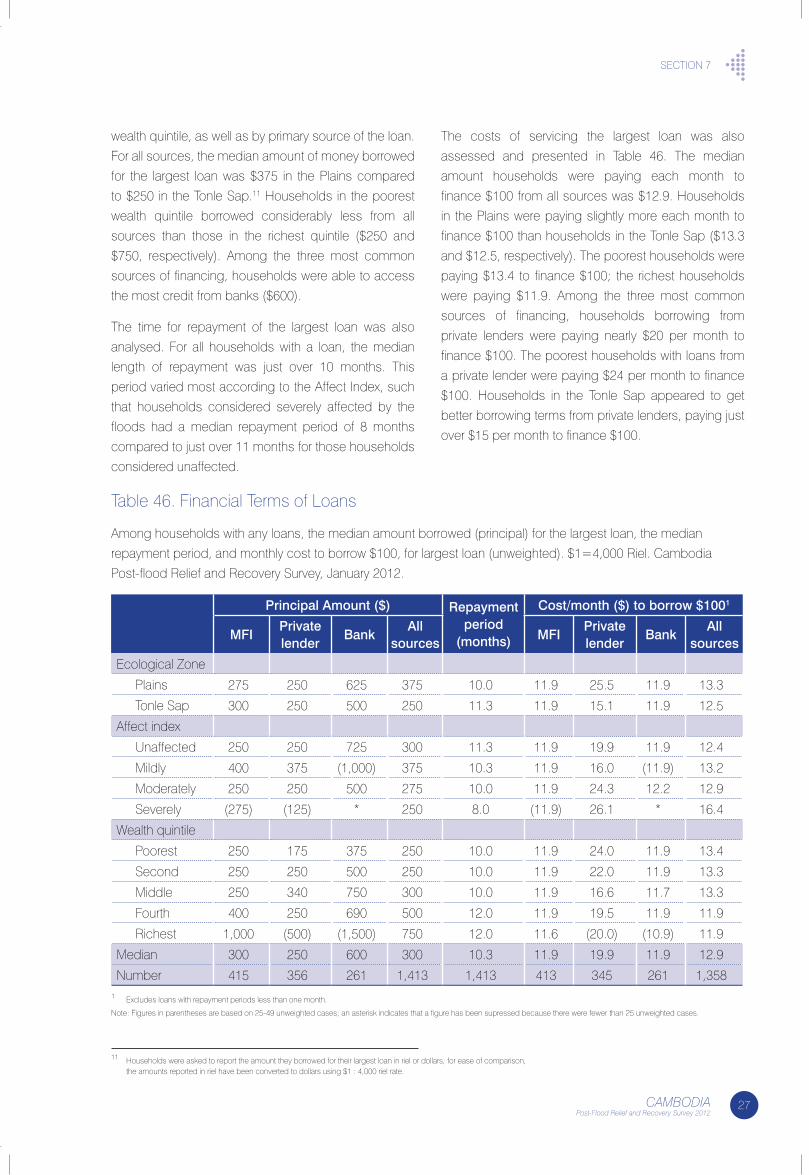
sectIon 7
27CAMBODIAPost-Flood Relief and Recovery Survey 2012
wealth quintile, as well as by primary source of the loan.
for all sources, the median amount of money borrowed
for the largest loan was $375 in the Plains compared
to $250 in the tonle sap.11 Households in the poorest
wealth quintile borrowed considerably less from all
sources than those in the richest quintile ($250 and
$750, respectively). among the three most common
sources of financing, households were able to access
the most credit from banks ($600).
the time for repayment of the largest loan was also
analysed. for all households with a loan, the median
length of repayment was just over 10 months. this
period varied most according to the affect Index, such
that households considered severely affected by the
floods had a median repayment period of 8 months
compared to just over 11 months for those households
considered unaffected.
the costs of servicing the largest loan was also
assessed and presented in table 46. the median
amount households were paying each month to
finance $100 from all sources was $12.9. Households
in the Plains were paying slightly more each month to
finance $100 than households in the tonle sap ($13.3
and $12.5, respectively). the poorest households were
paying $13.4 to finance $100; the richest households
were paying $11.9. among the three most common
sources of financing, households borrowing from
private lenders were paying nearly $20 per month to
finance $100. the poorest households with loans from
a private lender were paying $24 per month to finance
$100. Households in the tonle sap appeared to get
better borrowing terms from private lenders, paying just
over $15 per month to finance $100.
table 46. financial terms of loans
among households with any loans, the median amount borrowed (principal) for the largest loan, the median
repayment period, and monthly cost to borrow $100, for largest loan (unweighted). $1=4,000 Riel. cambodia
Post-flood Relief and Recovery survey, January 2012.
Principal amount ($) Repayment period
(months)
Cost/month ($) to borrow $1001
MFIPrivate lender
Bankall
sourcesMFI
Private lender
Bankall
sources
ecological Zone
Plains 275 250 625 375 10.0 11.9 25.5 11.9 13.3
tonle sap 300 250 500 250 11.3 11.9 15.1 11.9 12.5
affect index
Unaffected 250 250 725 300 11.3 11.9 19.9 11.9 12.4
Mildly 400 375 (1,000) 375 10.3 11.9 16.0 (11.9) 13.2
Moderately 250 250 500 275 10.0 11.9 24.3 12.2 12.9
severely (275) (125) * 250 8.0 (11.9) 26.1 * 16.4
Wealth quintile
Poorest 250 175 375 250 10.0 11.9 24.0 11.9 13.4
second 250 250 500 250 10.0 11.9 22.0 11.9 13.3
Middle 250 340 750 300 10.0 11.9 16.6 11.7 13.3
fourth 400 250 690 500 12.0 11.9 19.5 11.9 11.9
Richest 1,000 (500) (1,500) 750 12.0 11.6 (20.0) (10.9) 11.9
Median 300 250 600 300 10.3 11.9 19.9 11.9 12.9
number 415 356 261 1,413 1,413 413 345 261 1,3581 excludes loans with repayment periods less than one month.
note: figures in parentheses are based on 25-49 unweighted cases; an asterisk indicates that a figure has been supressed because there were fewer than 25 unweighted cases.
11 Households were asked to report the amount they borrowed for their largest loan in riel or dollars; for ease of comparison, the amounts reported in riel have been converted to dollars using $1 : 4,000 riel rate.
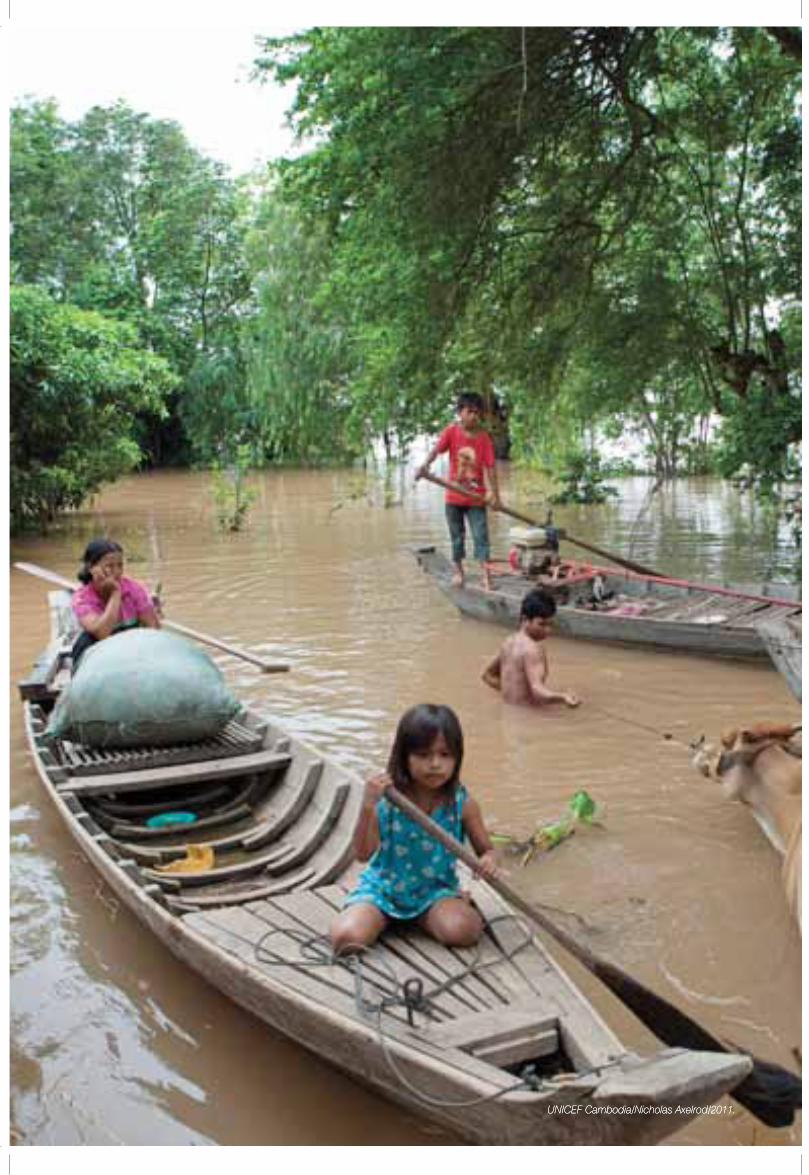
UNICEF Cambodia/Nicholas Axelrod/2011.UNICEF Cambodia/Nicholas Axelrod/2011.UNICEF Cambodia/Nicholas Axelrod/2011.
29CAMBODIAPost-Flood Relief and Recovery Survey 2012
8.1 nUMbeR of Meals
a general measure for assessing the food security of
a household is the number of daily meals eaten by
adults and children under-5. Households were asked
to identify the number of meals eaten the previous day,
as well as how the numbers of meals eaten and how
the quantity eaten at each meal compared to the same
time the previous year. table 47 shows that the mean
number of meals eaten by adults in all households was
2.5. adults in households considered severely affected
by the floods according to the affect Index and those
in the poorest households had eaten fewer meals, on
average, than households considered unaffected and
those in the wealthiest quintile. the mean number of
meals eaten by children under-5 the day prior to the
survey was 2.8; those children living in the poorest
households had eaten just 2.6 meals the day prior to
the survey.
8.2 fooD consUMPtIon scoRe
the Post-flood survey also assessed household food
security using a method that relies on a simple 7-day
food-frequency recall. Households were asked how
many days in the previous week they had consumed
various foods from a set of pre-identified food groups.
their responses, which ranged from 0–7 days, were
weighted and summed to construct a food consumption
score (fcs) that was used to compare households’
dietary quality and diversity across sub-groups.
Households were asked to report their consumption
of 18 food items that were subsequently regrouped
into seven distinct food groups: staples (rice, maize,
bread, cassava, and sweet potatoes), pulses (beans,
groundnuts, and other legumes), meats (fish, other
aquatic species, beef, pork, poultry, and eggs),
vegetables, fruits, sugar products, oils and fats, and
dairy products. specific weights were applied to these
food groups to emphasize their relative nutritive value, so
that, for example, meats (weight = 4.0) counted more
towards a quality and diverse diet than sugar products
(weight = 0.5). the maximum fcs possible was 127.
the mean food consumption score for all households
was 50.8. the mean fcs for households in the poorest
wealth quintile was 47.7, while the richest households
had a mean fcs of 55.5. according to the common cut-
offs used in cambodia, just 0.4 percent of households
had a poor diet, which typically consists of just rice and
some vegetables every day (table 48). four percent
of households had a borderline diet and 96 percent
had an adequate diet. the proportion of households in
each fcs group did not vary considerably according
to affect Index, however there was a substantial
difference observed according to wealth status. ninety-
nine percent of households in the richest quintile had
an adequate diet compared to just 91 percent of
households in the poorest quintile.
sectIon
fooD secURIty8
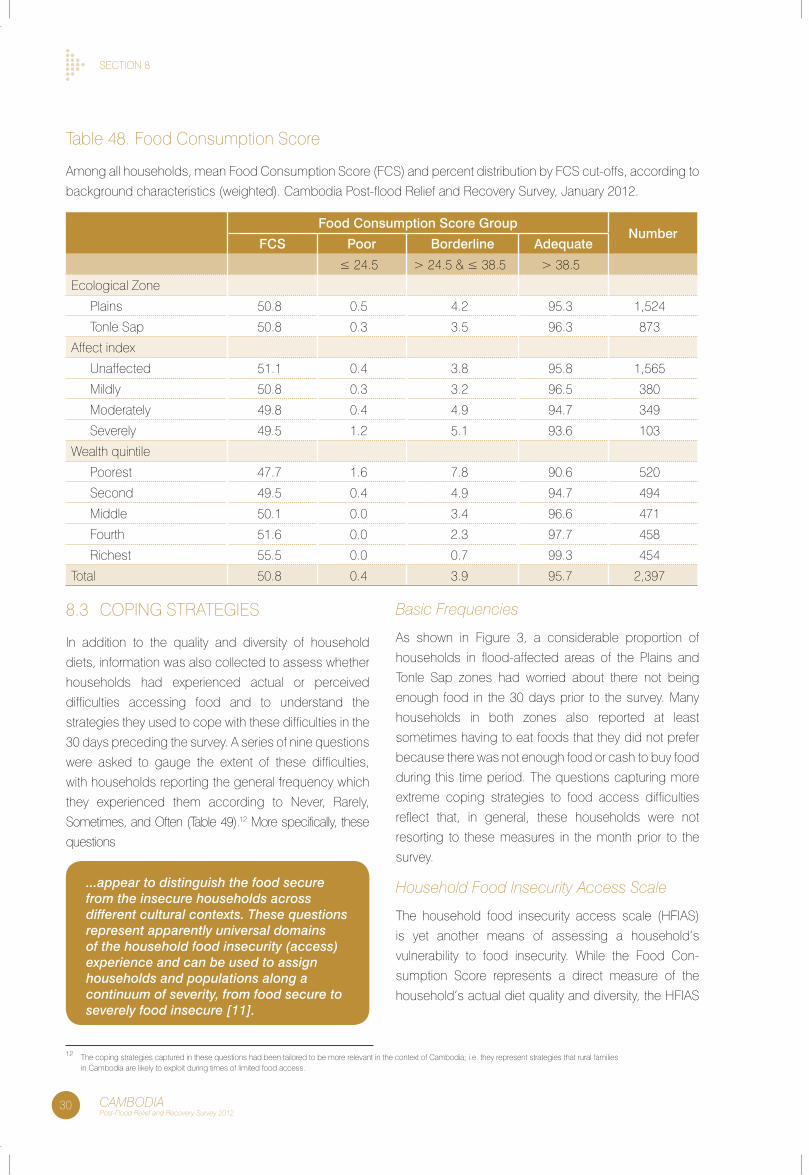
sectIon 8
30 CAMBODIAPost-Flood Relief and Recovery Survey 2012
table 48. food consumption score
among all households, mean food consumption score (fcs) and percent distribution by fcs cut-offs, according to
background characteristics (weighted). cambodia Post-flood Relief and Recovery survey, January 2012.
Food Consumption Score groupNumber
FCS Poor Borderline adequate
≤ 24.5 > 24.5 & ≤ 38.5 > 38.5
ecological Zone
Plains 50.8 0.5 4.2 95.3 1,524
tonle sap 50.8 0.3 3.5 96.3 873
affect index
Unaffected 51.1 0.4 3.8 95.8 1,565
Mildly 50.8 0.3 3.2 96.5 380
Moderately 49.8 0.4 4.9 94.7 349
severely 49.5 1.2 5.1 93.6 103
Wealth quintile
Poorest 47.7 1.6 7.8 90.6 520
second 49.5 0.4 4.9 94.7 494
Middle 50.1 0.0 3.4 96.6 471
fourth 51.6 0.0 2.3 97.7 458
Richest 55.5 0.0 0.7 99.3 454
total 50.8 0.4 3.9 95.7 2,397
8.3 coPInG stRateGIes
In addition to the quality and diversity of household
diets, information was also collected to assess whether
households had experienced actual or perceived
difficulties accessing food and to understand the
strategies they used to cope with these difficulties in the
30 days preceding the survey. a series of nine questions
were asked to gauge the extent of these difficulties,
with households reporting the general frequency which
they experienced them according to never, Rarely,
sometimes, and often (table 49).12 More specifically, these
questions
Basic Frequencies
as shown in figure 3, a considerable proportion of
households in flood-affected areas of the Plains and
tonle sap zones had worried about there not being
enough food in the 30 days prior to the survey. Many
households in both zones also reported at least
sometimes having to eat foods that they did not prefer
because there was not enough food or cash to buy food
during this time period. the questions capturing more
extreme coping strategies to food access difficulties
reflect that, in general, these households were not
resorting to these measures in the month prior to the
survey.
Household Food Insecurity Access Scale
the household food insecurity access scale (HfIas)
is yet another means of assessing a household’s
vulnerability to food insecurity. While the food con-
sumption score represents a direct measure of the
household’s actual diet quality and diversity, the HfIas
...appear to distinguish the food secure from the insecure households across different cultural contexts. These questions represent apparently universal domains of the household food insecurity (access) experience and can be used to assign households and populations along a continuum of severity, from food secure to severely food insecure [11].
12 the coping strategies captured in these questions had been tailored to be more relevant in the context of cambodia; i.e. they represent strategies that rural families in cambodia are likely to exploit during times of limited food access.
sectIon 8
31CAMBODIAPost-Flood Relief and Recovery Survey 2012
The acquisition of food and the provision of adequate nutrition to one’s children are among the most basic of human endeavors. In general, people respond to conditions under which they do not have enough to eat, and various means of “coping” is what people have to do when they do not have enough—the more people have to cope, the less food secure they are...People generally know how much is “enough” and seek the best options for ensuring that they eat enough. People start to change their consumption habits when they anticipate a problem [12].
better depicts the access component of food insecurity.
the HfIas was created by summing the individual
responses to the same nine questions reported in table
49. the responses were weighted equally—a response
of “Rarely” for any question was given a weight of 1,
while “often” was given a weight of 3—to construct the
raw HfIas for each household. the responses to these
questions were then grouped according to their severity
to determine the Household food Insecurity access
Prevalence (HfIaP). for this indicator, households who
only reported worrying about not having enough food
were considered food secure, while those reporting
adults skipping meals or going to bed hungry were
defined as severely food Insecure (see appendix 4).
table 50 shows the mean HfIas results for all
households from the Post-flood survey, as well as
the proportion of households falling into each food
(access) insecurity group. among all households, 8
percent were identified to be food secure according
to the HfIaP, meaning they had experienced virtually
no food insecurity access conditions in the 30 days
prior to the survey. More than a third of households
(40 percent) were found to be mildly food insecure;
a further 37 percent were moderately food insecure,
meaning the household resorted to eating undesirable
foods frequently or had reduced the quantity of foods
consumed. fifteen percent of households in the survey
were identified as severely food (access) insecure,
having limited the number of meals eaten or gone to
bed hungry.
Coping Strategies Index (Reduced)
the coping strategies Index (csI) is another indicator
uses to assess the level of food insecurity within a
population, which it accomplishes by measuring
peoples’ behaviors since:
the mean reduced13 csI for all households in the survey
was 8.7 (table 51). Households considered severely
affected by the floods according to the affect Index had
a mean csI of 27.1 and the poorest households had a
mean csI of 17.0.
Household Hunger Scale
finally, the Household Hunger scale (HHs) is a relatively
new indicator developed to “...measure household
hunger in food-insecure areas. the [Household
Hunger scale] is different from other household food
insecurity indicators in that it has been specifically
developed and validated for cross-cultural use.this
means that the HHs produces valid and comparable
results across cultures and settings so that the status
of different population groups can be described in a
meaningful and comparable way...”[13]. the indicator
is created by weighting the three most extreme coping
strategies captured in the nine questions discussed
above. table 52 shows the median HHs for households
as well as those falling into the three hunger sub-
categories. Households considered severely affected
by the floods according to the affect Index were most
likely to have been experiencing moderate and severe
hunger conditions (22 percent). Just over 13 percent
of households in the poorest quintile were reportedly
experiencing moderate to severe hunger conditions in
the 30 days prior to the survey.
13 a reduced version of the original csI has been used here; according to the methods manual, “the reduced csI...is a sub-set of the context-specific csI, but is calculated using a specific set of behaviors with a universal set of severity weightings for each behavior...extensive research has demonstrated that the “reduced” csI reflects food insecurity nearly as well as the “full” or context-specific csI...” [12].
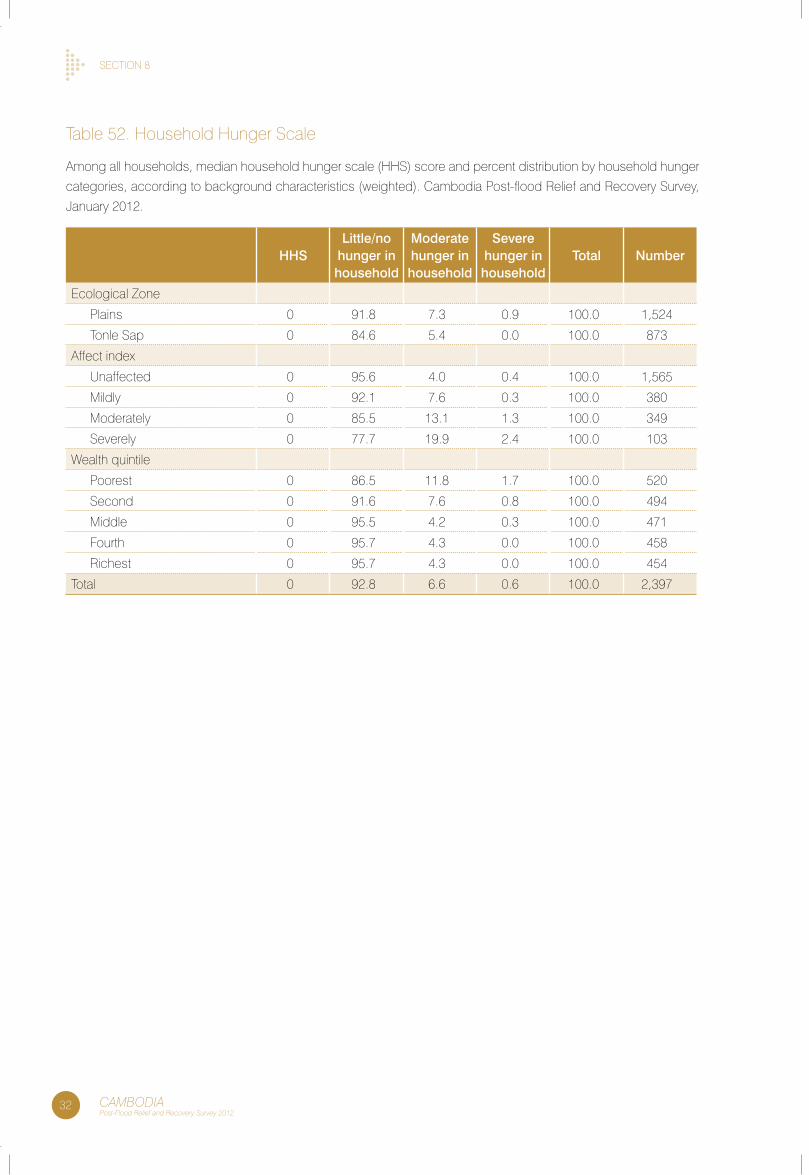
sectIon 8
32 CAMBODIAPost-Flood Relief and Recovery Survey 2012
table 52. Household Hunger scale
among all households, median household hunger scale (HHs) score and percent distribution by household hunger
categories, according to background characteristics (weighted). cambodia Post-flood Relief and Recovery survey,
January 2012.
HHSLittle/no
hunger in household
Moderate hunger in household
Severe hunger in household
Total Number
ecological Zone
Plains 0 91.8 7.3 0.9 100.0 1,524
tonle sap 0 84.6 5.4 0.0 100.0 873
affect index
Unaffected 0 95.6 4.0 0.4 100.0 1,565
Mildly 0 92.1 7.6 0.3 100.0 380
Moderately 0 85.5 13.1 1.3 100.0 349
severely 0 77.7 19.9 2.4 100.0 103
Wealth quintile
Poorest 0 86.5 11.8 1.7 100.0 520
second 0 91.6 7.6 0.8 100.0 494
Middle 0 95.5 4.2 0.3 100.0 471
fourth 0 95.7 4.3 0.0 100.0 458
Richest 0 95.7 4.3 0.0 100.0 454
total 0 92.8 6.6 0.6 100.0 2,397
UNICEF Cambodia/Nicholas Axelrod/2011.UNICEF Cambodia/Nicholas Axelrod/2011.UNICEF Cambodia/Nicholas Axelrod/2011.
34 CAMBODIAPost-Flood Relief and Recovery Survey 2012
In the aftermath of the floods, a primary concern and
uncertainty was the extent to which they had impacted
the health and nutritional status of the population.
In a fundamental sense, the overall well-being of a
community is reflected in the health of its women
and children, and indicators related to economic,
agricultural, and food security conditions are captured
to help explain this overall measure. the health and
nutrition indicators presented in this section were
chosen because they represent standard, comparable
measures of well-being for these groups.
9.1 nUtRItIonal statUs of MotHeRs
In addition to what a woman’s poor nutritional status
says directly about the environment in which she
is living, it also has a considerable bearing on the
likelihood of anthropometric failure of her child [14]. to
better understand the floods’ cumulative effect on the
nutritional well-being of women, the Post-flood survey
collected height and weight measurements from the
mothers of eligible children aged 0–59 months.14
Body Mass Index (BMI)
table 53 shows that for all mothers included in the survey,
6 percent were recorded with heights less than 145 cm.
among non-pregnant mothers, 70 percent had a body
mass index (weight/height2) within the normal range15.
Just more than 1 in 8 women (13 percent) had a bMI
that identified them as underweight. Most of these
were mildly thin, though 3 percent had a bMI less than
17.0. seventeen percent of mothers were classified as
overweight. the mean bMI for all non-pregnant mothers
was 21.8.
9.2 HealtH statUs of cHIlDRen UnDeR fIVe
children afflicted by disease are at risk of becoming
malnourished due to their bodies’ increased nutrient
requirements to fight the disease and a reduced ability
to absorb these nutrients from their diet during the
disease. furthermore, malnourished children are more
susceptible to diseases than their well-nourished peers,
often creating a cycle of sickness and malnutrition from
which they are unable to recuperate completely, thereby
permanently reducing their growth potential.
Measles Immunization
Immunization is an extremely effective public health
measure to reduce the incidence of preventable
childhood illnesses. Mothers of surveyed children
were asked to show the child’s vaccination card in
order to assess the immunization status of their child.
among children aged 12–23 months, 77 percent had a
vaccination card that was seen by an enumerator (table
54). there was no significant difference for vaccination
card ownership according to child sex or ecological
zone. there was minor variation according to household
wealth quintile, such that children living in the poorest
households were less likely to have a vaccination card
that was seen by survey enumerators compared to
those in the wealthiest quintiles.
Mothers were subsequently asked whether their child
had ever received a measles immunization. among all
children aged 12–23 months, 72 percent had received
a measles vaccination according to vaccination card at
some time before the survey. there was no observed
difference for measles immunization status according
to child sex, ecological zone, or wealth quintiles.
sectIon
HealtH & nUtRItIon9
14 the weight and height of pregnant women and those who had given birth in the two months prior to the survey were also assessed but have been removed from the bMI calculations.15 the women’s bMI data from the Post-flood survey appears skewed rightward when compared to the 2010 cDHs; one potential explanation for this pattern is that the cDHs includes all women 15-49 in its bMI calculations, while the Post-flood survey only captured height and weight data of women with a living child under-five.
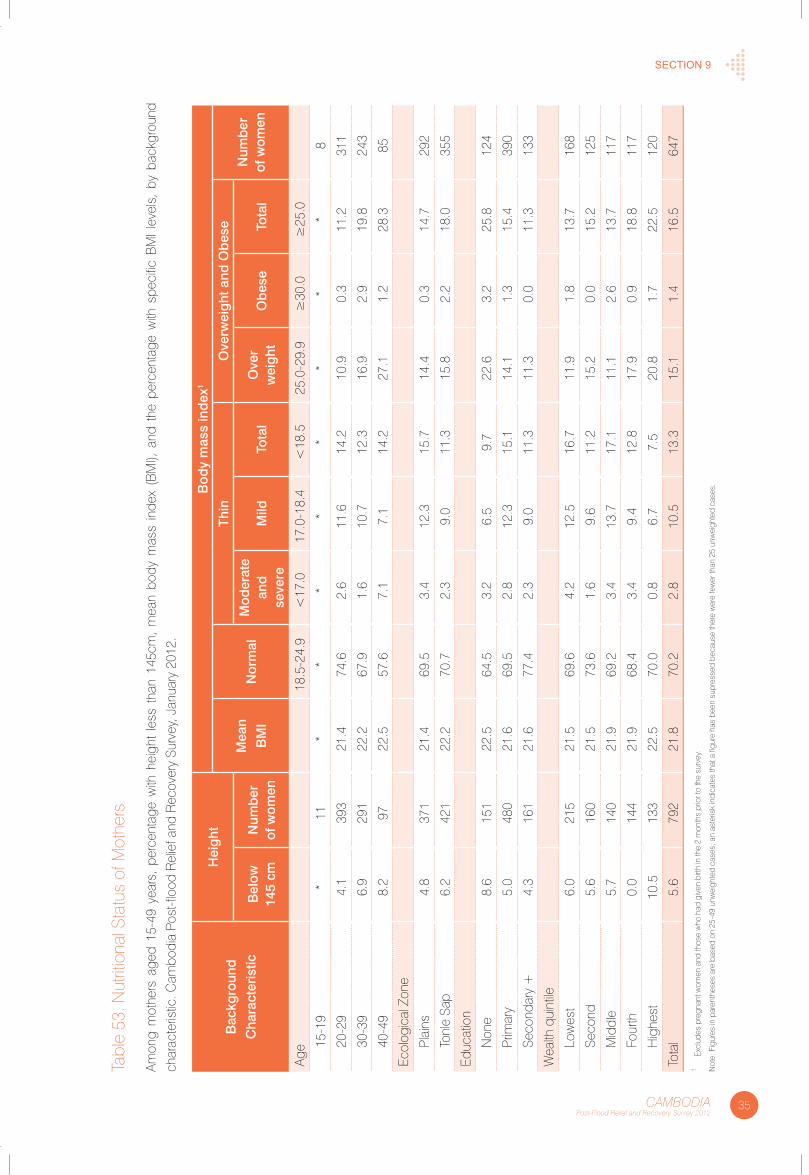
35CAMBODIAPost-Flood Relief and Recovery Survey 2012
Section 9
tabl
e 53
. nut
ritio
nal s
tatu
s of
Mot
hers
amon
g m
othe
rs a
ged
15-4
9 ye
ars,
per
cent
age
with
hei
ght
less
tha
n 14
5cm
, m
ean
body
mas
s in
dex
(bM
I), a
nd t
he p
erce
ntag
e w
ith s
peci
fic b
MI
leve
ls,
by b
ackg
roun
d
char
acte
ristic
. cam
bodi
a Po
st-fl
ood
Rel
ief a
nd R
ecov
ery
surv
ey, J
anua
ry 2
012.
Bac
kgro
und
Cha
ract
eris
tic
Hei
ght
Bod
y m
ass
ind
ex1
Mea
n
BM
IN
orm
al
Thin
Ove
rwei
ght
and
Ob
ese
Num
ber
of
wom
enB
elow
14
5 cm
Num
ber
of
wom
en
Mod
erat
e an
d
seve
reM
ildTo
tal
Ove
r w
eig
htO
bes
eTo
tal
age
18.5
-24.
9<
17.0
17.0
-18.
4<
18.5
25.0
-29.
9≥
30.0
≥25
.0
15-1
9*
11*
**
**
**
*8
20-2
94.
139
321
.474
.62.
611
.614
.210
.90.
311
.231
1
30-3
96.
929
122
.267
.91.
610
.712
.316
.92.
919
.824
3
40-4
98.
297
22.5
57.6
7.1
7.1
14.2
27.1
1.2
28.3
85
ecol
ogic
al Z
one
Plai
ns4.
837
121
.469
.53.
412
.315
.714
.40.
314
.729
2
tonl
e sa
p6.
242
122
.270
.72.
39.
011
.315
.82.
218
.035
5
educ
atio
n
non
e8.
615
122
.564
.53.
26.
59.
722
.63.
225
.812
4
Prim
ary
5.0
480
21.6
69.5
2.8
12.3
15.1
14.1
1.3
15.4
390
seco
ndar
y +
4.3
161
21.6
77.4
2.3
9.0
11.3
11.3
0.0
11.3
133
Wea
lth q
uint
ile
low
est
6.0
215
21.5
69.6
4.2
12.5
16.7
11.9
1.8
13.7
168
seco
nd5.
616
021
.573
.61.
69.
611
.215
.20.
015
.212
5
Mid
dle
5.7
140
21.9
69.2
3.4
13.7
17.1
11.1
2.6
13.7
117
four
th0.
014
421
.968
.43.
49.
412
.817
.90.
918
.811
7
Hig
hest
10.5
133
22.5
70.0
0.8
6.7
7.5
20.8
1.7
22.5
120
tota
l5.
679
221
.870
.22.
810
.513
.315
.11.
416
.564
71
excl
udes
pre
gnan
t wom
en a
nd th
ose
who
had
giv
en b
irth
in th
e 2
mon
ths
prio
r to
the
surv
ey.
not
e: f
igur
es in
par
enth
eses
are
bas
ed o
n 25
-49
unw
eigh
ted
case
s; a
n as
teris
k in
dica
tes
that
a fi
gure
has
bee
n su
pres
sed
beca
use
ther
e w
ere
few
er th
an 2
5 un
wei
ghte
d ca
ses.
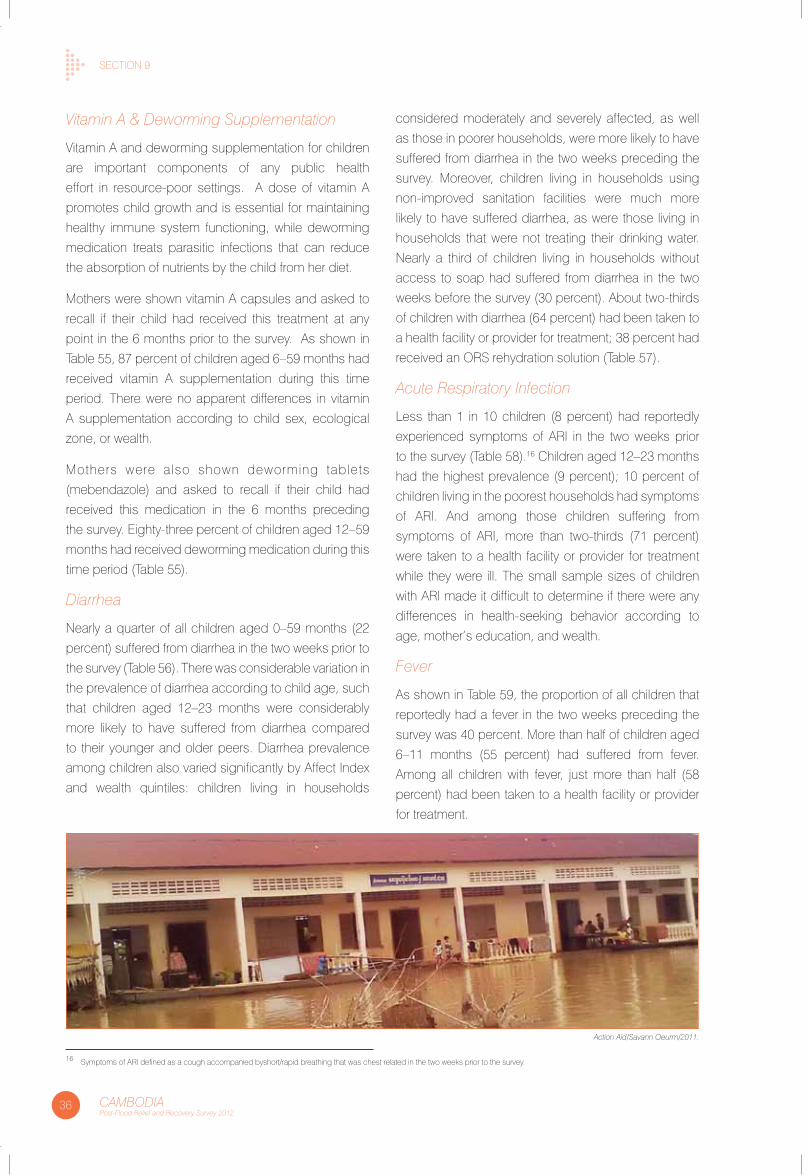
sectIon 9
36 CAMBODIAPost-Flood Relief and Recovery Survey 2012
Vitamin A & Deworming Supplementation
Vitamin a and deworming supplementation for children
are important components of any public health
effort in resource-poor settings. a dose of vitamin a
promotes child growth and is essential for maintaining
healthy immune system functioning, while deworming
medication treats parasitic infections that can reduce
the absorption of nutrients by the child from her diet.
Mothers were shown vitamin a capsules and asked to
recall if their child had received this treatment at any
point in the 6 months prior to the survey. as shown in
table 55, 87 percent of children aged 6–59 months had
received vitamin a supplementation during this time
period. there were no apparent differences in vitamin
a supplementation according to child sex, ecological
zone, or wealth.
Mothers were also shown deworming tablets
(mebendazole) and asked to recall if their child had
received this medication in the 6 months preceding
the survey. eighty-three percent of children aged 12–59
months had received deworming medication during this
time period (table 55).
Diarrhea
nearly a quarter of all children aged 0–59 months (22
percent) suffered from diarrhea in the two weeks prior to
the survey (table 56). there was considerable variation in
the prevalence of diarrhea according to child age, such
that children aged 12–23 months were considerably
more likely to have suffered from diarrhea compared
to their younger and older peers. Diarrhea prevalence
among children also varied significantly by affect Index
and wealth quintiles: children living in households
considered moderately and severely affected, as well
as those in poorer households, were more likely to have
suffered from diarrhea in the two weeks preceding the
survey. Moreover, children living in households using
non-improved sanitation facilities were much more
likely to have suffered diarrhea, as were those living in
households that were not treating their drinking water.
nearly a third of children living in households without
access to soap had suffered from diarrhea in the two
weeks before the survey (30 percent). about two-thirds
of children with diarrhea (64 percent) had been taken to
a health facility or provider for treatment; 38 percent had
received an oRs rehydration solution (table 57).
Acute Respiratory Infection
less than 1 in 10 children (8 percent) had reportedly
experienced symptoms of aRI in the two weeks prior
to the survey (table 58).16 children aged 12–23 months
had the highest prevalence (9 percent); 10 percent of
children living in the poorest households had symptoms
of aRI. and among those children suffering from
symptoms of aRI, more than two-thirds (71 percent)
were taken to a health facility or provider for treatment
while they were ill. the small sample sizes of children
with aRI made it difficult to determine if there were any
differences in health-seeking behavior according to
age, mother’s education, and wealth.
Fever
as shown in table 59, the proportion of all children that
reportedly had a fever in the two weeks preceding the
survey was 40 percent. More than half of children aged
6–11 months (55 percent) had suffered from fever.
among all children with fever, just more than half (58
percent) had been taken to a health facility or provider
for treatment.
16 symptoms of aRI defined as a cough accompanied byshort/rapid breathing that was chest related in the two weeks prior to the survey.
Action Aid/Savann Oeurm/2011.
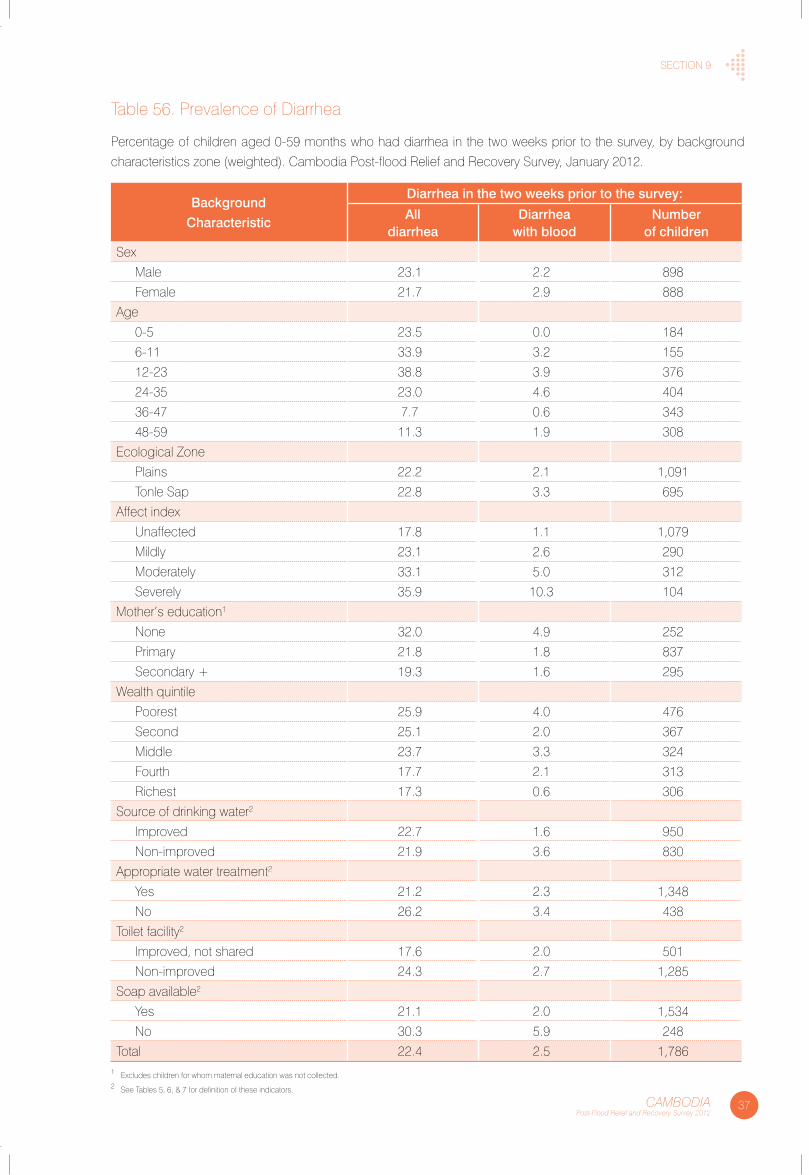
sectIon 9
37CAMBODIAPost-Flood Relief and Recovery Survey 2012
table 56. Prevalence of Diarrhea
Percentage of children aged 0-59 months who had diarrhea in the two weeks prior to the survey, by background
characteristics zone (weighted). cambodia Post-flood Relief and Recovery survey, January 2012.
Background
Characteristic
Diarrhea in the two weeks prior to the survey:
all diarrhea
Diarrhea with blood
Number of children
sex
Male 23.1 2.2 898
female 21.7 2.9 888
age
0-5 23.5 0.0 184
6-11 33.9 3.2 155
12-23 38.8 3.9 376
24-35 23.0 4.6 404
36-47 7.7 0.6 343
48-59 11.3 1.9 308
ecological Zone
Plains 22.2 2.1 1,091
tonle sap 22.8 3.3 695
affect index
Unaffected 17.8 1.1 1,079
Mildly 23.1 2.6 290
Moderately 33.1 5.0 312
severely 35.9 10.3 104
Mother’s education1
none 32.0 4.9 252
Primary 21.8 1.8 837
secondary + 19.3 1.6 295
Wealth quintile
Poorest 25.9 4.0 476
second 25.1 2.0 367
Middle 23.7 3.3 324
fourth 17.7 2.1 313
Richest 17.3 0.6 306
source of drinking water2
Improved 22.7 1.6 950
non-improved 21.9 3.6 830
appropriate water treatment2
yes 21.2 2.3 1,348
no 26.2 3.4 438
toilet facility2
Improved, not shared 17.6 2.0 501
non-improved 24.3 2.7 1,285
soap available2
yes 21.1 2.0 1,534
no 30.3 5.9 248
total 22.4 2.5 1,7861 excludes children for whom maternal education was not collected.2 see tables 5, 6, & 7 for definition of these indicators.
sectIon 9
38 CAMBODIAPost-Flood Relief and Recovery Survey 2012
9.3 nUtRItIonal statUs of cHIlDRen 6–59 MontHs
the nutritional status of children is a comprehensive
measure that reflects the general health of the
community and the specific household context within
which the child is living. Inadequate nutrition is a direct
result of insufficient or inappropriate food intake by the
child, repeated diseases, or a combination of both.
the Post-flood survey collected height and weight
measurements from 1,116 children aged 6–59 months.
Using these measurements and a child’s sex and age
in months, a set of anthropometric z-scores using the
2006 WHo Growth standards were calculated [15]. all
z-scores outside a predetermined range (–3 sD, +3
sD) were flagged and the paper-based questionnaires
for these cases were checked to ascertain whether a
recording error had been made in the field. after this
cleaning, there were a total of 1,100 children with
plausible WHZ scores; 1,085 children with plasubile
HaZ scores; and 1,095 children with plasubile WaZ
scores.
Wasting
table 60 shows that the prevalence of wasting among
all children aged 6–59 months was 5.6 percent (95%
cI: 4.0–7.2). children aged 18–23 months and those
with thin mothers (according to bMI) had the highest
rates of wasting (10.8 and 11.6 percent, respectively).
the weight-for-height z-scores varied considerably
according to maternal bMI and household wealth. Just
0.3 percent of children were severely wasted.
Stunting
as shown in table 61, the prevalence of stunting
among children aged 6–59 months was 37.1 percent
(95% cI: 33.9–40.3). the prevalence of stunting varied
considerably with age; just 14 percent of children aged
6–11 months were stunted compared to nearly half of
all children aged 24–35 months (45 percent). children
living in the poorest households were also more likely to
be stunted than those in the wealthiest households (47
percent vs. 27 percent).
Underweight
table 62 shows the prevalence of children aged 6–59
months that were classified as underweight according
to the WHo 2006 Growth standards. In all, 23.3
percent of children were underweight (95% cI: 20.4–
26.1); 4 percent were severely underweight. as with
acute malnutrition, children aged 18–23 months had
the highest prevalence of underweight (32 percent).
Underweight was also considerably higher among
children living in the poorest households and those
whose mother had a low bMI.
Management of Acute Malnutrition
the national nutrition Programme within the Ministry
of Health, in conjunction with various development
partners, have developed and are implementing
guidelines for the facility-based management of
moderate and severe acute malnutrition [16]. according
to these guidelines, children aged 6–59 months with
MUac measurements less than 11.5 cm should be
admitted to a health center for outpatient treatment of
severe acute malnutrition. children of the same age with
MUac measurements between 11.5 cm and 12.5 cm
are eligible for targeted supplementary feeding from a
health center.
MUac measurements were taken for all children
aged 6–59 months in the Post-flood survey. table
63 shows that no children were found to have MUac
measurements less than 11.5 cm; 1.5 percent of
children aged 6–59 months had measurements
between 11.5 cm and 12.5 cm.
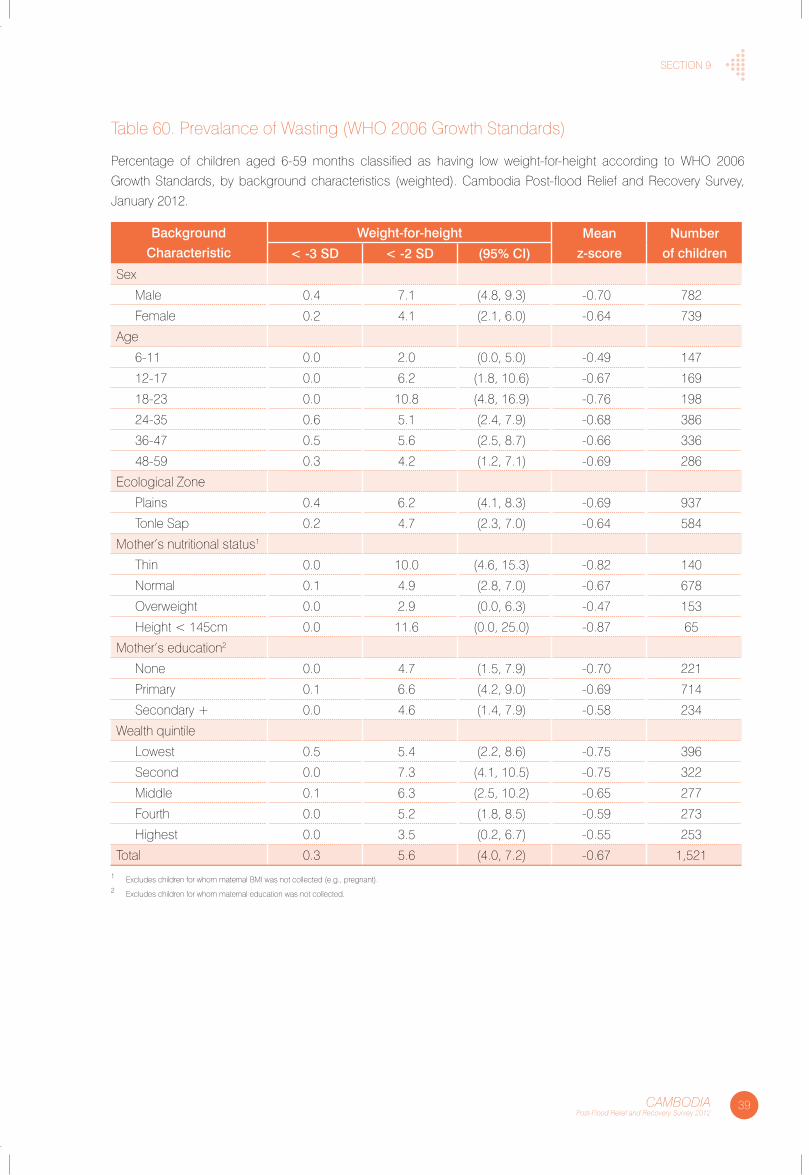
sectIon 9
39CAMBODIAPost-Flood Relief and Recovery Survey 2012
table 60. Prevalance of Wasting (WHo 2006 Growth standards)
Percentage of children aged 6-59 months classified as having low weight-for-height according to WHo 2006
Growth standards, by background characteristics (weighted). cambodia Post-flood Relief and Recovery survey,
January 2012.
Background
Characteristic
Weight-for-height Mean
z-score
Number
of children< -3 SD < -2 SD (95% CI)
sex
Male 0.4 7.1 (4.8, 9.3) -0.70 782
female 0.2 4.1 (2.1, 6.0) -0.64 739
age
6-11 0.0 2.0 (0.0, 5.0) -0.49 147
12-17 0.0 6.2 (1.8, 10.6) -0.67 169
18-23 0.0 10.8 (4.8, 16.9) -0.76 198
24-35 0.6 5.1 (2.4, 7.9) -0.68 386
36-47 0.5 5.6 (2.5, 8.7) -0.66 336
48-59 0.3 4.2 (1.2, 7.1) -0.69 286
ecological Zone
Plains 0.4 6.2 (4.1, 8.3) -0.69 937
tonle sap 0.2 4.7 (2.3, 7.0) -0.64 584
Mother’s nutritional status1
thin 0.0 10.0 (4.6, 15.3) -0.82 140
normal 0.1 4.9 (2.8, 7.0) -0.67 678
overweight 0.0 2.9 (0.0, 6.3) -0.47 153
Height < 145cm 0.0 11.6 (0.0, 25.0) -0.87 65
Mother’s education2
none 0.0 4.7 (1.5, 7.9) -0.70 221
Primary 0.1 6.6 (4.2, 9.0) -0.69 714
secondary + 0.0 4.6 (1.4, 7.9) -0.58 234
Wealth quintile
lowest 0.5 5.4 (2.2, 8.6) -0.75 396
second 0.0 7.3 (4.1, 10.5) -0.75 322
Middle 0.1 6.3 (2.5, 10.2) -0.65 277
fourth 0.0 5.2 (1.8, 8.5) -0.59 273
Highest 0.0 3.5 (0.2, 6.7) -0.55 253
total 0.3 5.6 (4.0, 7.2) -0.67 1,5211 excludes children for whom maternal bMI was not collected (e.g., pregnant).2 excludes children for whom maternal education was not collected.
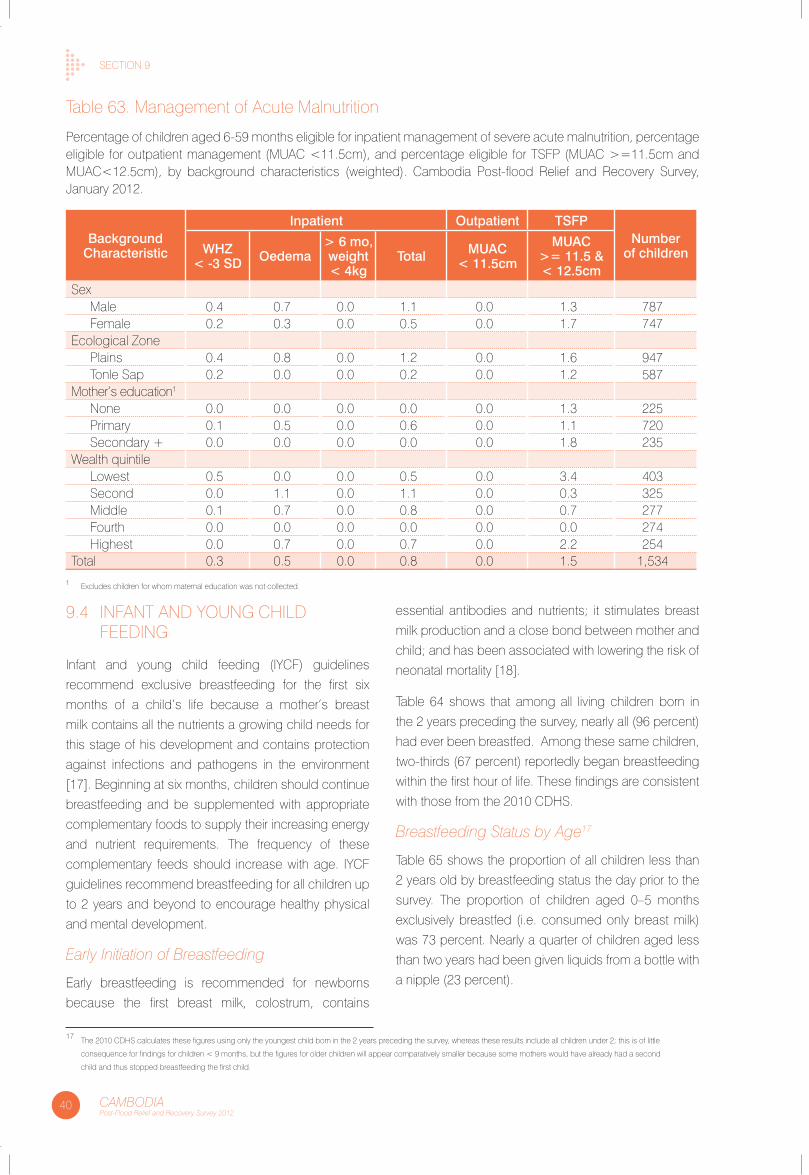
40 CAMBODIAPost-Flood Relief and Recovery Survey 2012
sectIon 9
9.4 Infant anD yoUnG cHIlD feeDInG
Infant and young child feeding (Iycf) guidelines
recommend exclusive breastfeeding for the first six
months of a child’s life because a mother’s breast
milk contains all the nutrients a growing child needs for
this stage of his development and contains protection
against infections and pathogens in the environment
[17]. beginning at six months, children should continue
breastfeeding and be supplemented with appropriate
complementary foods to supply their increasing energy
and nutrient requirements. the frequency of these
complementary feeds should increase with age. Iycf
guidelines recommend breastfeeding for all children up
to 2 years and beyond to encourage healthy physical
and mental development.
Early Initiation of Breastfeeding
early breastfeeding is recommended for newborns
because the first breast milk, colostrum, contains
essential antibodies and nutrients; it stimulates breast
milk production and a close bond between mother and
child; and has been associated with lowering the risk of
neonatal mortality [18].
table 64 shows that among all living children born in
the 2 years preceding the survey, nearly all (96 percent)
had ever been breastfed. among these same children,
two-thirds (67 percent) reportedly began breastfeeding
within the first hour of life. these findings are consistent
with those from the 2010 cDHs.
Breastfeeding Status by Age17
table 65 shows the proportion of all children less than
2 years old by breastfeeding status the day prior to the
survey. the proportion of children aged 0–5 months
exclusively breastfed (i.e. consumed only breast milk)
was 73 percent. nearly a quarter of children aged less
than two years had been given liquids from a bottle with
a nipple (23 percent).
table 63. Management of acute Malnutrition
Percentage of children aged 6-59 months eligible for inpatient management of severe acute malnutrition, percentage eligible for outpatient management (MUac <11.5cm), and percentage eligible for tsfP (MUac >=11.5cm and MUac<12.5cm), by background characteristics (weighted). cambodia Post-flood Relief and Recovery survey, January 2012.
Background Characteristic
Inpatient Outpatient TSFPNumber
of childrenWHZ < -3 SD Oedema
> 6 mo, weight < 4kg
Total MUaC < 11.5cm
MUaC >= 11.5 & < 12.5cm
sexMale 0.4 0.7 0.0 1.1 0.0 1.3 787female 0.2 0.3 0.0 0.5 0.0 1.7 747
ecological ZonePlains 0.4 0.8 0.0 1.2 0.0 1.6 947tonle sap 0.2 0.0 0.0 0.2 0.0 1.2 587
Mother’s education1
none 0.0 0.0 0.0 0.0 0.0 1.3 225Primary 0.1 0.5 0.0 0.6 0.0 1.1 720secondary + 0.0 0.0 0.0 0.0 0.0 1.8 235
Wealth quintilelowest 0.5 0.0 0.0 0.5 0.0 3.4 403second 0.0 1.1 0.0 1.1 0.0 0.3 325Middle 0.1 0.7 0.0 0.8 0.0 0.7 277fourth 0.0 0.0 0.0 0.0 0.0 0.0 274Highest 0.0 0.7 0.0 0.7 0.0 2.2 254
total 0.3 0.5 0.0 0.8 0.0 1.5 1,5341 excludes children for whom maternal education was not collected.
17 the 2010 cDHs calculates these figures using only the youngest child born in the 2 years preceding the survey, whereas these results include all children under 2; this is of little
consequence for findings for children < 9 months, but the figures for older children will appear comparatively smaller because some mothers would have already had a second
child and thus stopped breastfeeding the first child.
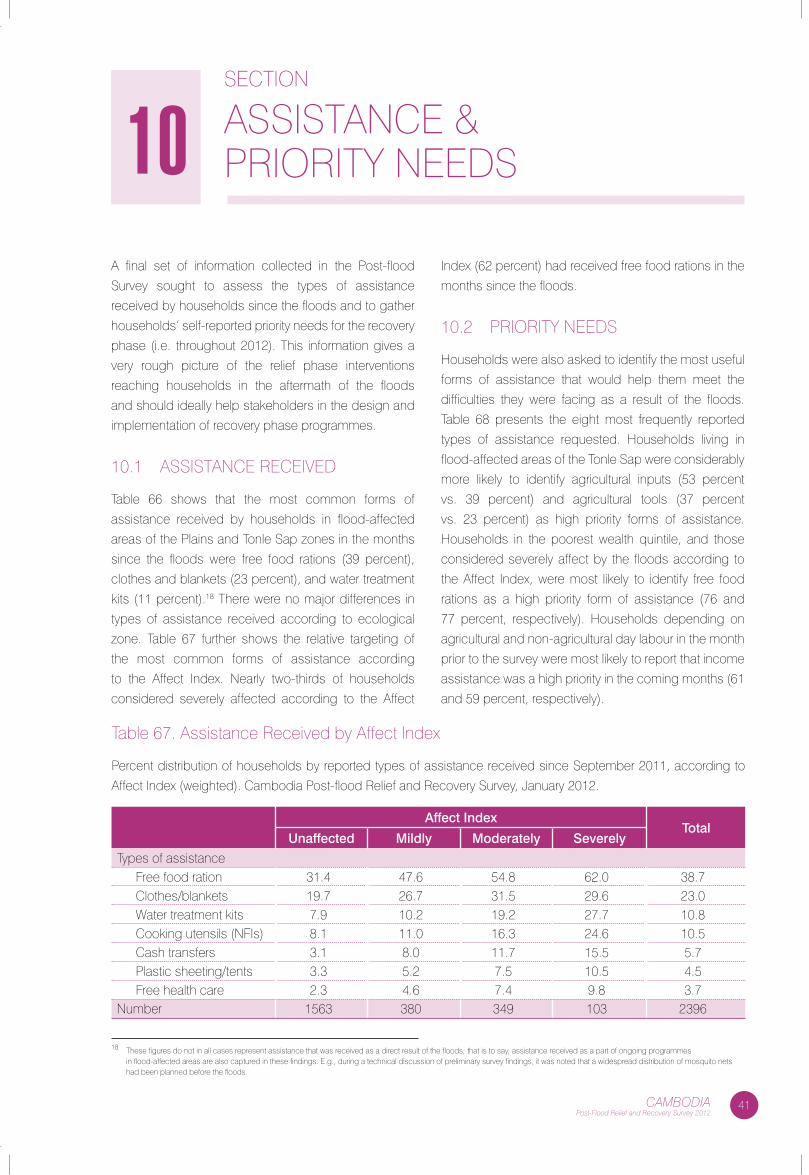
41CAMBODIAPost-Flood Relief and Recovery Survey 2012
a final set of information collected in the Post-flood
survey sought to assess the types of assistance
received by households since the floods and to gather
households’ self-reported priority needs for the recovery
phase (i.e. throughout 2012). this information gives a
very rough picture of the relief phase interventions
reaching households in the aftermath of the floods
and should ideally help stakeholders in the design and
implementation of recovery phase programmes.
10.1 assIstance ReceIVeD
table 66 shows that the most common forms of
assistance received by households in flood-affected
areas of the Plains and tonle sap zones in the months
since the floods were free food rations (39 percent),
clothes and blankets (23 percent), and water treatment
kits (11 percent).18 there were no major differences in
types of assistance received according to ecological
zone. table 67 further shows the relative targeting of
the most common forms of assistance according
to the affect Index. nearly two-thirds of households
considered severely affected according to the affect
Index (62 percent) had received free food rations in the
months since the floods.
10.2 PRIoRIty neeDs
Households were also asked to identify the most useful
forms of assistance that would help them meet the
difficulties they were facing as a result of the floods.
table 68 presents the eight most frequently reported
types of assistance requested. Households living in
flood-affected areas of the tonle sap were considerably
more likely to identify agricultural inputs (53 percent
vs. 39 percent) and agricultural tools (37 percent
vs. 23 percent) as high priority forms of assistance.
Households in the poorest wealth quintile, and those
considered severely affect by the floods according to
the affect Index, were most likely to identify free food
rations as a high priority form of assistance (76 and
77 percent, respectively). Households depending on
agricultural and non-agricultural day labour in the month
prior to the survey were most likely to report that income
assistance was a high priority in the coming months (61
and 59 percent, respectively).
sectIon
assIstance & PRIoRIty neeDs10
18 these figures do not in all cases represent assistance that was received as a direct result of the floods; that is to say, assistance received as a part of ongoing programmes in flood-affected areas are also captured in these findings. e.g., during a technical discussion of preliminary survey findings, it was noted that a widespread distribution of mosquito nets had been planned before the floods.
table 67. assistance Received by affect Index
Percent distribution of households by reported types of assistance received since september 2011, according to
affect Index (weighted). cambodia Post-flood Relief and Recovery survey, January 2012.
affect IndexTotal
Unaffected Mildly Moderately Severelytypes of assistance
free food ration 31.4 47.6 54.8 62.0 38.7clothes/blankets 19.7 26.7 31.5 29.6 23.0Water treatment kits 7.9 10.2 19.2 27.7 10.8cooking utensils (nfIs) 8.1 11.0 16.3 24.6 10.5cash transfers 3.1 8.0 11.7 15.5 5.7Plastic sheeting/tents 3.3 5.2 7.5 10.5 4.5free health care 2.3 4.6 7.4 9.8 3.7
number 1563 380 349 103 2396
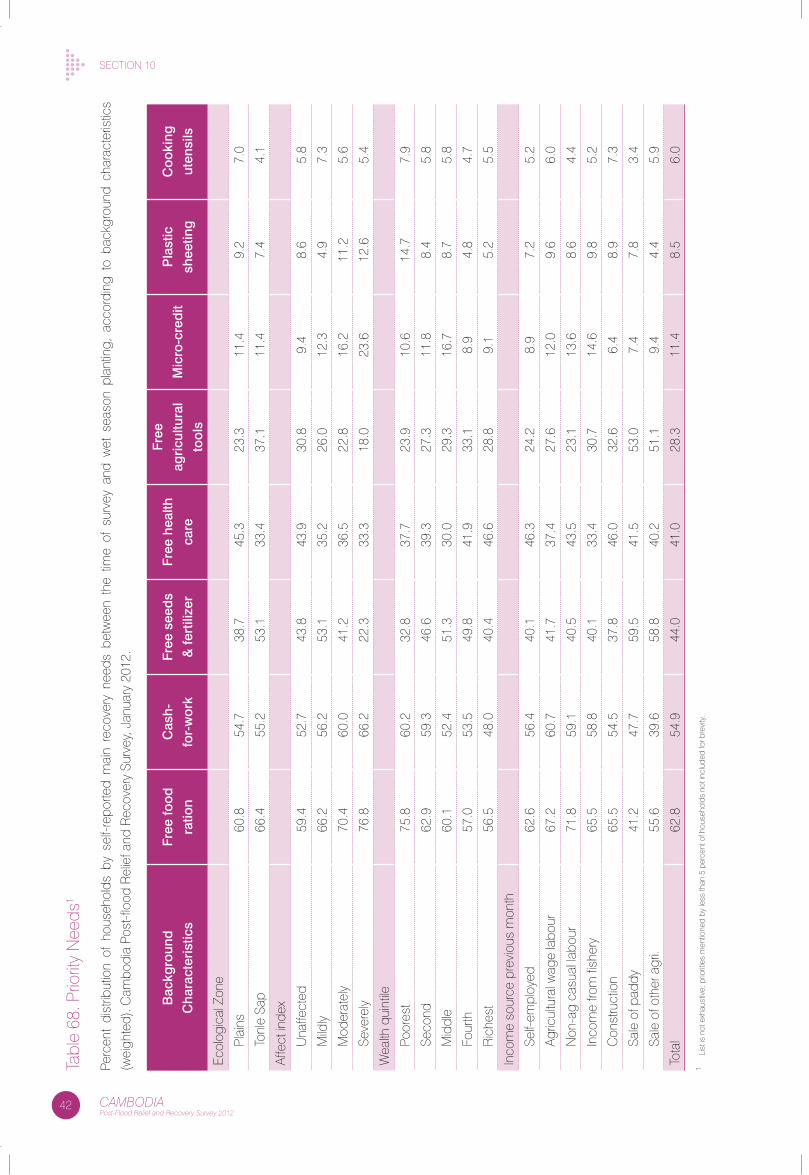
sectIon 10
42 CAMBODIAPost-Flood Relief and Recovery Survey 2012
tabl
e 68
. Prio
rity
nee
ds1
Perc
ent
dist
ribut
ion
of h
ouse
hold
s by
sel
f-rep
orte
d m
ain
reco
very
nee
ds b
etw
een
the
time
of s
urve
y an
d w
et s
easo
n pl
antin
g, a
ccor
ding
to
back
grou
nd c
hara
cter
istic
s
(wei
ghte
d). c
ambo
dia
Post
-floo
d R
elie
f and
Rec
over
y su
rvey
, Jan
uary
201
2.
Bac
kgro
und
Cha
ract
eris
tics
Free
food
ratio
n
Cas
h-
for-
wor
k
Free
see
ds
& fe
rtili
zer
Free
hea
lth
care
Free
agric
ultu
ral
tool
s
Mic
ro-c
red
itP
last
ic
shee
ting
Coo
king
uten
sils
ecol
ogic
al Z
one
Plai
ns60
.854
.738
.745
.323
.311
.49.
27.
0
tonl
e sa
p66
.455
.253
.133
.437
.111
.47.
44.
1
affe
ct in
dex
Una
ffect
ed59
.452
.743
.843
.930
.89.
48.
65.
8
Mild
ly66
.256
.253
.135
.226
.012
.34.
97.
3
Mod
erat
ely
70.4
60.0
41.2
36.5
22.8
16.2
11.2
5.6
seve
rely
76.8
66.2
22.3
33.3
18.0
23.6
12.6
5.4
Wea
lth q
uint
ile
Poor
est
75.8
60.2
32.8
37.7
23.9
10.6
14.7
7.9
seco
nd62
.959
.346
.639
.327
.311
.88.
45.
8
Mid
dle
60.1
52.4
51.3
30.0
29.3
16.7
8.7
5.8
four
th57
.053
.549
.841
.933
.18.
94.
84.
7
Ric
hest
56.5
48.0
40.4
46.6
28.8
9.1
5.2
5.5
Inco
me
sour
ce p
revi
ous
mon
th
self-
empl
oyed
62.6
56.4
40.1
46.3
24.2
8.9
7.2
5.2
agric
ultu
ral w
age
labo
ur67
.260
.741
.737
.427
.612
.09.
66.
0
non
-ag
casu
al la
bour
71.8
59.1
40.5
43.5
23.1
13.6
8.6
4.4
Inco
me
from
fish
ery
65.5
58.8
40.1
33.4
30.7
14.6
9.8
5.2
con
stru
ctio
n65
.554
.537
.846
.032
.66.
48.
97.
3
sale
of p
addy
41.2
47.7
59.5
41.5
53.0
7.4
7.8
3.4
sale
of o
ther
agr
i.55
.639
.658
.840
.251
.19.
44.
45.
9
tota
l62
.854
.944
.041
.028
.311
.48.
56.
0
1 li
st is
not
exh
aust
ive;
prio
ritie
s m
entio
ned
by le
ss th
an 5
per
cent
of h
ouse
hold
s no
t inc
lude
d fo
r bre
vity
.
UNICEF Cambodia/Nicholas Axelrod/2011UNICEF Cambodia/Nicholas Axelrod/2011
44 CAMBODIAPost-Flood Relief and Recovery Survey 2012
11.1 GeneRal effects
findings from the Post-flood survey related to the
types of information received by households indicate
a relatively high penetration of flood-related commu-
nications during and after the floods. that television
was the primary medium through which households
received these messages, and the preferred source
of communication in the event of a future emergency,
is consistent with its high level of ownership in general.
but poorer households, which were less likely to own
a television, depended more upon and preferred other
sources for communication, especially word-of-mouth
via neighbors, relatives, and other community members.
since the effective communication of information to
households is vital during emergencies, these results
suggest that emergency communication plans should
avoid relying upon a single medium for information
dissemination (e.g., television) as this would very
likely fail to reach some populations, especially the
poorest households, who would have been the primary
audience for such messages during the 2011 floods.
therefore, existing emergency communication plans
are recommended to test and strengthen, or implement
if they do not already have, a word-of-mouth system
to ensure optimal coverage and saturation (e.g., from
commune chief to village chief/VHV or someone
else within the village dedicated for such a purpose).
Moreover, that so few households reported receiving
flood-related communications via a mobile phone while
a relatively large proportion actually own them suggests
that this medium was grossly underutilized in 2011
information dissemination strategies.
the Post-flood survey found that nearly 10 percent of
households had been displaced from their home by
the floods for at least one night [2]. because the survey
only sampled areas within 250 meters of the peak-flood
boundary in the Plains and tonle sap ecological zones,
this largely confirms the assumption that households
within affected provinces were at higher risk of the
floods’ effects according to their proximity to the lake
and rivers. In addition, though most of the villages
visited during the survey experienced some level of
flooding, a relatively small percentage of households
were actually displaced outside their community; most
of the displaced relocated within the community. and
because the poorest households were most likely
to have been displaced and to have experienced
damage to their housing infrastructure, it appears that
much of the displacement resulted from the destruction
of homes built from low-quality materials (e.g., thatch). It
is unlikely that households, particularly the poorest, have
been or will be able to invest in major improvements to
their housing materials. In fact, 42 percent of households
with damaged walls reported that they could not afford
to repair them. therefore, partners interested in helping
the poorest households and reducing the impact of
future natural disasters (e.g., household displacement
and its associated economic losses) are encouraged
to consider the large effect that interventions supporting
the poorest households’ ability to improve their housing
structures are likely to have.
there was some concern among various stakeholders
that the floods might have disrupted households’
access to their traditional sources of drinking water
and toilet facilities. However, the water and sanitation
findings from the survey do not support, at least some
months after the floods, this scenario. according to
the 2010 cDHs, the most common source of drinking
water for rural households during the dry season is a
borehole (36 percent). of the households privately
owning water pumps in the Post-flood survey, just 14
percent reported it had been damaged by the floods.
and by the time the survey was conducted, 60 percent of
these households had already repaired their damaged
water pumps. While the survey did not ask households
sectIon
DIscUssIon11
45CAMBODIAPost-Flood Relief and Recovery Survey 2012
sectIon 11
whether the floods had any effect on the quality of their
drinking water (contamination, turbidity, etc.), nearly
80 percent of all households reported treating their
water using appropriate methods and 87 percent had
access to soap, both of which were associated with
a significantly lower prevalence of diarrhea among
children under 5. Moreover, the absence of any large-
scale outbreak of diarrhea in these areas suggests
that any of the floods’ effects on water and sanitation
did not manifest as a worst-case scenario. More
worrisome, however, given that 22 percent of children
under 5 had recently suffered from diarrhea, was that
so few households seemed to identify water as a
potential culprit. these findings suggest that WasH-
related preparedness and recovery efforts might best
be directed towards hygiene education, as well as
strategic prepositioning and continued distribution of
soap and water treatment materials in high-risk and
flood-affected areas.19
the affect Index was created to provide a standard
measure for comparing the floods’ impact on
households within the peak-flood boundary. Its design
and scope were necessarily limited because all
households could not experience similar flood-related
hardships: only half of all households surveyed had
planted wet season rice in 2011, which, for comparability
reasons, eliminated “damage to crops” as an indicator
for the index. thus, when using the affect Index to
interpret the survey’s findings, it is important to do so
in conjunction with the other underlying characteristics
(i.e. ecological zone, wealth, and income sources) to
allow a more nuanced understanding of their meaning.
What the affect Index seems to have identified,
however, is important: its categories represent an
increasing vulnerability to external shocks.20 In point,
while some households lost considerable portions of
their wet season crops due to the floods,it was also
these households that, by the very nature of having
been able to grow wet season crops (having access
to land, financial resources, etc.), were more capable of
responding to such losses.
as evidence of the different response options available
to households, the pattern of migration from households
after the floods—those in the lowest three wealth quintiles
were more than twice as likely to have had a member
migrate out, for which the floods were the primary reason
cited—suggests that it was largely driven by economic
considerations. further supporting this narrative are the
findings that 1) 10 percent of households considered
severely affected by the floods had fewer income
earners at the time of the survey compared to before
the floods; and 2) at least 60 percent of the poorest
households reported being directly dependent on the
labour market for cash income, both of which imply
that these households were being forced to generate
income wherever and however they could find it.
Given the above findings, it is not surprising that the
self-reported difficulties faced by the poorest and most
vulnerable households differed considerably from those
in wealthier quintiles.In addition to medical care and food
costs, the poorest and most vulnerable households
were disproportionately struggling with their debt load
and the physical damage to their homes. In contrast,
households in the middle wealth categories—those
most likely to have grown wet season crops—most
frequently reported damage to their land as the primary
difficulty they had faced in the months since the floods.
11.2 econoMIc IMPact
as discussed above, the survey findings suggest that
the floods created increased economic pressures for
many households, especially the poorest and most
vulnerable. two-thirds of all households reported
experiencing a decrease in their income in the months
since the floods; among the poorest and most
vulnerable this figure was even higher. therefore,
generating new and complementary sources of
income represents, for these households, an important
(and positive) means of coping with the floods negative
effects.
Useful to a deeper understanding of the floods’
potential economic impact, and for the design of
recovery programmes, was the finding that the diversity
of income activities for poorer households was much
more limited compared to that of wealthier households.
19 one might assume that, particularly in the immediate stages of a flood, access to wood for boiling water would be difficult to obtain, making the availability of water treatment kits
for households at-risk of flooding an even higher priority.
20 as a result, throughout section 11 the phrase “most vulnerable” is used frequently to denote those households identified as severely affected by the floods according to the affect Index.
46 CAMBODIAPost-Flood Relief and Recovery Survey 2012
sectIon 11
four income activities (self-employed, agricultural and
non-agricultural wage labour, and fishing) were identified
by at least 20 percent of the poorest households as a
primary means of generating cash in the month before
the survey. In contrast, just one activity (self-employed)
was identified by at least 20 percent of households in
the middle, fourth, and richest wealth quintiles.
It should be noted that there was some evidence the
labour market, particularly in the agricultural sector,
experienced an increase in demand due to above
normal dry season planting. conversations in various
communities during survey fieldwork revealed that the
floods’ damage to crops had forced many farmers
who did not normally cultivate dry season crops to do
so. and data from the district and commune market
assessments (see appendix 5) show that the terms of
trade for agricultural day labourers, particularly in the
Plains ecological zone, were better than historical trends
would have predicted, implying an improvement in the
supply/demand labour ratio. combined, these findings
suggest that, as a way of coping with the floods’ effects,
more farmers cultivated land during the dry season and,
as a result, provided additional labour opportunities
that may have served to buffer some poor households
from the worst of economic possibilities immediately
following the floods.
However, given that such a large proportion of the
poorest and most vulnerable households were
experiencing increased financial pressures due to
the floods, and that the agricultural labour market will
likely normalize during the 2012 planting season,
there are and will be considerable need for income
generating activities for these households throughout
2012. further supporting this conclusion are the
findings that, even at the time of the survey, when the
agricultural labour market was presumably quite strong,
between 10 and 15 percent of the poorest and most
vulnerable households with school-aged children were
depending on their children to help cope with their
economic burdens.
these findings underscore that the 2011 floods created
additional opportunities for, and likely increased the
potential effectiveness of, recovery programmes that
aim to alleviate those financial pressures—by directing
assistance through the labour market, such as public
works programmes—the poorest and most vulnerable
households are experiencing. Given the wide range of
vulnerabilities faced by households living near the lake
and rivers, and the high dependency by many of these
households on daily wages, recovery public works
programmes are encouraged to explore multi-faceted
channels and more frequent disbursement modalities
for this assistance.
furthermore, recovery programmes designed to
protect children and to improve school attendance
must consider the economic context within which these
households, particularly those affected by the floods,
are being forced to rely upon child labour.
11.3 aGRIcUltURe, lIVestocK, & fIsHInG
the Post-flood survey findings indicate that many
households cultivating crops during the 2011 wet
season within 250 meters of the peak-flood boundary
suffered serious negative effects. before considering
the extent of these losses, it should be noted that
conversations with village chiefs and community
members revealed that many households living in very
close proximity to the lake and rivers did not traditionally
cultivate wet season rice; the reason primarily cited
being that, even during normal years, these fields
were sometimes inundated with water to some extent.
Indeed, the Post-flood survey found that just 40 percent
of households in flood-affected areas of the Plains zone
had cultivated rice during the 2011 wet season. Without
these precautionary planting habits—established in
response to historical weather and environmental
conditions—the 2011 floods could have damaged
the crops of many more households.In addition, that
the cultivation patterns of households living in areas
most likely affected by the floods differ somewhat
from the population as a whole serves to remind
that extrapolations of the floods’ impact to the entire
agricultural sector in these ecological zones should
be avoided.
even allowing that the scale of crop damage in
these areas could have been worse, the floods still
dramatically impacted the 70 percent of households
21 the 2011/2012 agricultural report from Maff largely confirms these findings; overall dry season production was up 22% compared to 2010/2011 [3].
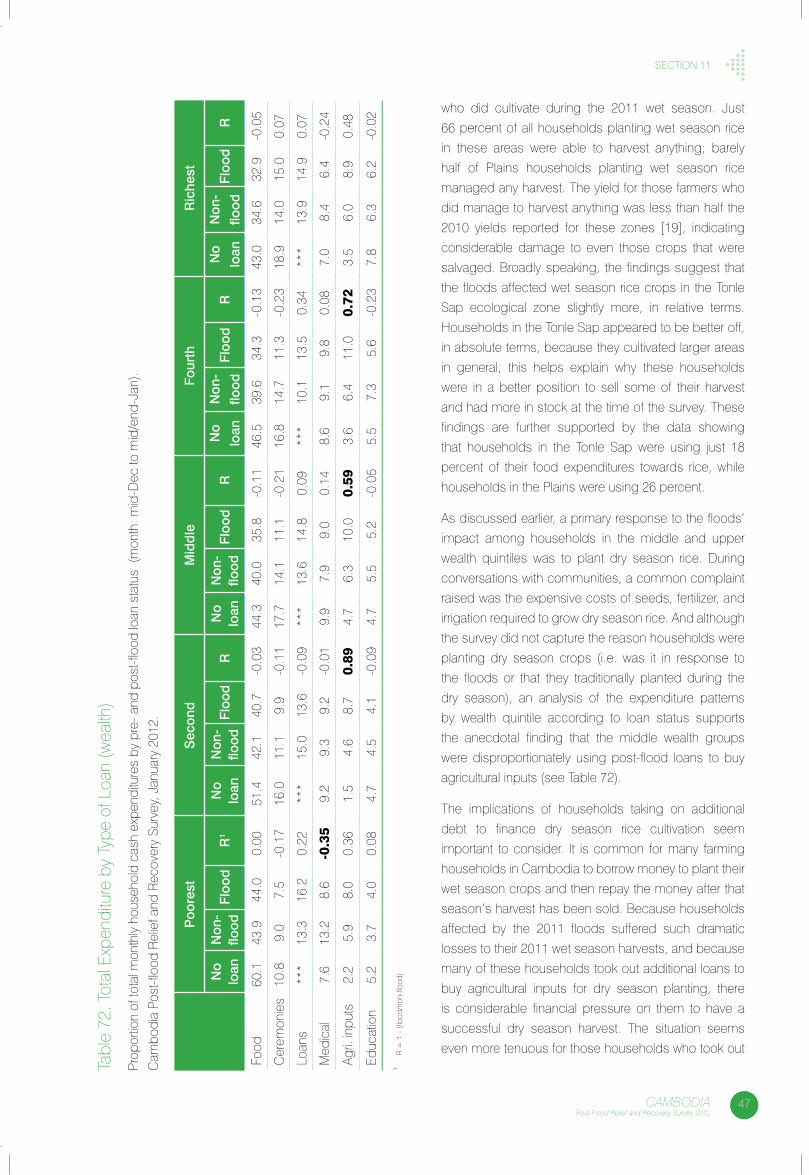
47CAMBODIAPost-Flood Relief and Recovery Survey 2012
sectIon 11
who did cultivate during the 2011 wet season. Just
66 percent of all households planting wet season rice
in these areas were able to harvest anything; barely
half of Plains households planting wet season rice
managed any harvest. the yield for those farmers who
did manage to harvest anything was less than half the
2010 yields reported for these zones [19], indicating
considerable damage to even those crops that were
salvaged. broadly speaking, the findings suggest that
the floods affected wet season rice crops in the tonle
sap ecological zone slightly more, in relative terms.
Households in the tonle sap appeared to be better off,
in absolute terms, because they cultivated larger areas
in general; this helps explain why these households
were in a better position to sell some of their harvest
and had more in stock at the time of the survey. these
findings are further supported by the data showing
that households in the tonle sap were using just 18
percent of their food expenditures towards rice, while
households in the Plains were using 26 percent.
as discussed earlier, a primary response to the floods’
impact among households in the middle and upper
wealth quintiles was to plant dry season rice. During
conversations with communities, a common complaint
raised was the expensive costs of seeds, fertilizer, and
irrigation required to grow dry season rice. and although
the survey did not capture the reason households were
planting dry season crops (i.e. was it in response to
the floods or that they traditionally planted during the
dry season), an analysis of the expenditure patterns
by wealth quintile according to loan status supports
the anecdotal finding that the middle wealth groups
were disproportionately using post-flood loans to buy
agricultural inputs (see table 72).
the implications of households taking on additional
debt to finance dry season rice cultivation seem
important to consider. It is common for many farming
households in cambodia to borrow money to plant their
wet season crops and then repay the money after that
season’s harvest has been sold. because households
affected by the 2011 floods suffered such dramatic
losses to their 2011 wet season harvests, and because
many of these households took out additional loans to
buy agricultural inputs for dry season planting, there
is considerable financial pressure on them to have a
successful dry season harvest. the situation seems
even more tenuous for those households who took out
tabl
e 72
. tot
al e
xpen
ditu
re b
y ty
pe o
f loa
n (w
ealth
)
Prop
ortio
n of
tota
l mon
thly
hou
seho
ld c
ash
expe
nditu
res
by p
re-
and
post
-floo
d lo
an s
tatu
s (m
onth
: mid
-Dec
to m
id/e
nd-J
an).
cam
bodi
a Po
st-fl
ood
Rel
ief a
nd R
ecov
ery
surv
ey, J
anua
ry 2
012.
Poo
rest
Sec
ond
Mid
dle
Four
thR
iche
st
No
lo
anN
on-
flood
Floo
dR
1N
o
loan
Non
-flo
odFl
ood
RN
o
loan
Non
-flo
odFl
ood
RN
o
loan
Non
-
flood
Floo
dR
No
loan
Non
-
flood
Floo
dR
food
60.1
43.9
44.0
0.00
51.4
42.1
40.7
-0.0
344
.340
.035
.8-0
.11
46.5
39.6
34.3
-0.1
343
.034
.632
.9-0
.05
cer
emon
ies
10.8
9.0
7.5
-0.1
716
.011
.19.
9-0
.11
17.7
14.1
11.1
-0.2
116
.814
.711
.3-0
.23
18.9
14.0
15.0
0.07
loan
s**
*13
.316
.20.
22**
*15
.013
.6-0
.09
***
13.6
14.8
0.09
***
10.1
13.5
0.34
***
13.9
14.9
0.07
Med
ical
7.6
13.2
8.6
-0.3
59.
29.
39.
2-0
.01
9.9
7.9
9.0
0.14
8.6
9.1
9.8
0.08
7.0
8.4
6.4
-0.2
4
agri.
inpu
ts2.
25.
98.
00.
361.
54.
68.
70.
894.
76.
310
.00.
593.
66.
411
.00.
723.
56.
08.
90.
48
educ
atio
n5.
23.
74.
00.
084.
74.
54.
1-0
.09
4.7
5.5
5.2
-0.0
55.
57.
35.
6-0
.23
7.8
6.3
6.2
-0.0
2
1 R
= 1
- (f
lood
/non
-floo
d).
48 CAMBODIAPost-Flood Relief and Recovery Survey 2012
sectIon 11
loans for dry season planting in spite of not normally
cultivating during this time. It is unclear what effect the
(presumably) increased amount of dry season rice
coming onto the market will have on the price paid
to farmers for paddy rice. Recent policies in thailand
and sub-national differences in production may or may
not influence the price paid as well. It was clear from
conversations with farmers during the survey, however,
that they are depending on prices at least similar to those
offered the previous year to help compensate for their
increased financial burden. In the short-term, therefore,
it is important to monitor the prices paid for dry season
paddy rice; substantial deviations from historical prices
will undoubtedly affect these farmers’ ability to meet
their increased financial obligations. In the medium- to
long-term, the coping strategies employed by farmers
in response to (or anticipation of) the floods—taking out
loans to finance dry season planting, being risk-averse
in locations near the lake and rivers—emphasize the
need for more robust protection mechanisms for small-
scale farmers.
11.4 loans & Debt
the information on household debt and expenditure
patterns allows a more complete understanding of the
ways that households responded to the floods’ effects.
Half of the poorest households (48 percent) had at least
one flood-related loan compared to less than a quarter
of the richest households (22 percent). this finding
is consistent with that showing that nearly 75 percent
of the poorest households reported their income had
decreased since the floods.
More informative still were the patterns that emerged
after analysing the reasons households gave for taking
on their largest loan and the ways in which they were
directing their expenditures based upon their loan
status. When households with any loans were asked
why they had borrowed the money, the most common
responses were to buy food and agricultural inputs,
and to support the development of their businesses
(table 44). furthermore, when the same responses
were analyzed by the type of loan households had
(i.e. flood-related or only pre-flood), it emerged that
households with flood-related loans—across both
zones and all wealth quintiles—were significantly more
likely to report that the main reason for the loan was to
buy food. Households in the upper wealth quintiles with
flood-related loans were also significantly more likely to
report that their loan was for agricultural inputs and to
support the development of their businesses than those
with only pre-flood loans. these findings support a
narrative that the primary reason households were taking
on debt after the floods was to buy food; a secondary
purpose was to enable wealthier households to support
their productive agricultural and business activities.
additional patterns emerged after analysing the
proportion of monthly cash expenditures households
were directing to various food and non-food items
according to their loan status. Households which had
taken out any loans were significantly more likely to use
a smaller proportion of their cash expenditures on food,
ceremonies, energy, communication, and personal
hygiene; instead, they were using a larger proportion
of their expenditures towards agricultural inputs (see
table 69, 70). the proportion of spending on productive
agricultural inputs increased the most for households in
the second and poorest quintiles (2.4 and 4.0 times),
suggesting that the marginal effects of any loan (or,
by extension, financial assistance via cash transfers
or public works programmes) on productive activities
is greatest for poorer households. that is to say, when
poorer households have extra cash, they commit less,
proportionally, to food and invest the additional money
into productive activities; and the benefit of this additional
cash on productive activities is greatest, proportionally,
for the poorest households.22
after analysing the expenditure data more fully, they
reveal that households with flood-related loans were
using smaller proportions of their expenditures on
ceremonies and larger proportions on agricultural
inputs; households in the tonle sap appeared slightly
more capable of directing their flood-related loan
money into agricultural inputs than those in the Plains
(0.8 vs. 0.5 times), though this likely results from the
fact that households without loans in the tonle sap
were spending less on food (rice) in general (table 71,
72). the difference in agricultural expenditure patterns
appears mainly among the second, middle, and
fourth wealth quintiles, which is largely consistent with
the self-reported reasons for their loans. there is also
22 the survey did not collect expenditure data for other productive activities, such as expenses that might be related to small businesses or activities of the “self-employed”, but one suspects
that the tendency to convert extra cash into productive investment would also apply to those activities as well.
49CAMBODIAPost-Flood Relief and Recovery Survey 2012
sectIon 11
weaker evidence to suggest that households with flood-
related loans were directing a larger proportion of their
expenditures towards repairing their homes than those
with only pre-flood loans; this difference appears to be
most pronounced in the Plains zone.
the expenditure findings suggest there are additional
implications for programmes designed to financially
assist households during the recovery phase.they
imply that households, especially the poorest, will first
direct additional income towards covering inelastic
costs (which in cambodia appear to include, for all but
the poorest households, ceremonies). It is conceivable
that households’ expenditure behavior with grants
(i.e. money they do not repay) could differ from that
predicted by their use of loans—they might be more
likely, for example, to buy a higher quality diet with the
extra cash. nevertheless, the findings appear to confirm
that the poorest and most vulnerable households’
economic behavior is largely rational, making them most
likely to direct cash towards investment in productive
activities. therefore, recovery programmes that seek to
improve households’ investment in productive activities
(agricultural as well as self-employment/small business)
with financial assistance will see the greatest marginal
benefits from the poorest households.
11.5 fooD secURIty
standardized indicators collected during the survey
suggest that food insecurity was most associated with
the poorest and most vulnerable households, though
the overall food security situation in flood-affected areas
appeared stable. the four primary indicators (fcs,
HfIas, csI, and HHs) were significantly associated
with wealth, the measure of vulnerability implied by the
affect Index, and various maternal and child nutritional
status indicators (table 77, 78). In absolute terms, the
food consumption score suggests that the overall
quality and diversity of diet among households was not
alarming. even as poor households directed a greater
proportion of their food expenditures towards rice, they
were still managing more than 25 percent on fish and
meat. the HfIas, which better identifies the access
component of food security, is also consistent with
the total proportion of all expenses households within
different wealth groups directed towards food; poorer
households were using a larger proportion of their
money to cover food expenses, and these households
were also the most likely to be, from a food access
definition, moderately and severely food insecure. the
csI findings further reveal the increased vulnerability
of labour market-dependent households to external
shocks while the proportion of households reporting
their income had decreased since the floods was
similar among “self-employed” and “agricultural wage
labour”(≥ 60 percent for each group), the mean CSI for
the latter was more than three times that of the former.
figure 4 shows the total amount households spent on
all food during the week prior to the survey according
to their loan status. the data suggest that households
spent around 60,000 riel on a basic diet, not including
own production.23 that a basic diet is, in an economic
sense, inelastic is perhaps not surprising, but it has
implications for recovery programme design, as it
suggests that once the poorest and most vulnerable
households reach a certain minimum caloric threshold,
they are able to redirect their money and energy
towards other productive activities. In addition, that the
mean fcs was not different according to loans status
within wealth quintiles, and the mean HfIas was greater
among middle and upper wealth groups with loans,
further supports the narrative that loans were taken out
by those with reduced access to food (e.g. as a result of
crop destruction), and also produced diets comparable
in quality and diversity to those eaten by households
without loans (figures 5 and 6).
More surprising, perhaps, was the finding that households
were not using a significantly different proportion of their
expenditures on food according to the type of loan they
had (table 71, 72).at first this appears to contradict
the findings discussed earlier, whereby households
with flood-related loans were more likely to report the
main reason was to buy food than those with only pre-
flood loans. figure 7 helps reconcile these seemingly
incongruous findings. outside of the top wealth
quintile, households receiving flood-related loans were
spending more money on rice than households with
only pre-flood loans. the difference in rice expenditures
can probably be interpreted as compensation for the
23 that households in both the second and middle quintiles matched this threshold without loans supports the idea of a basic food basket; also supporting the idea is the finding that
households with loans use progressively smaller proportions of their expenditures on food as wealth increases (see table 70).
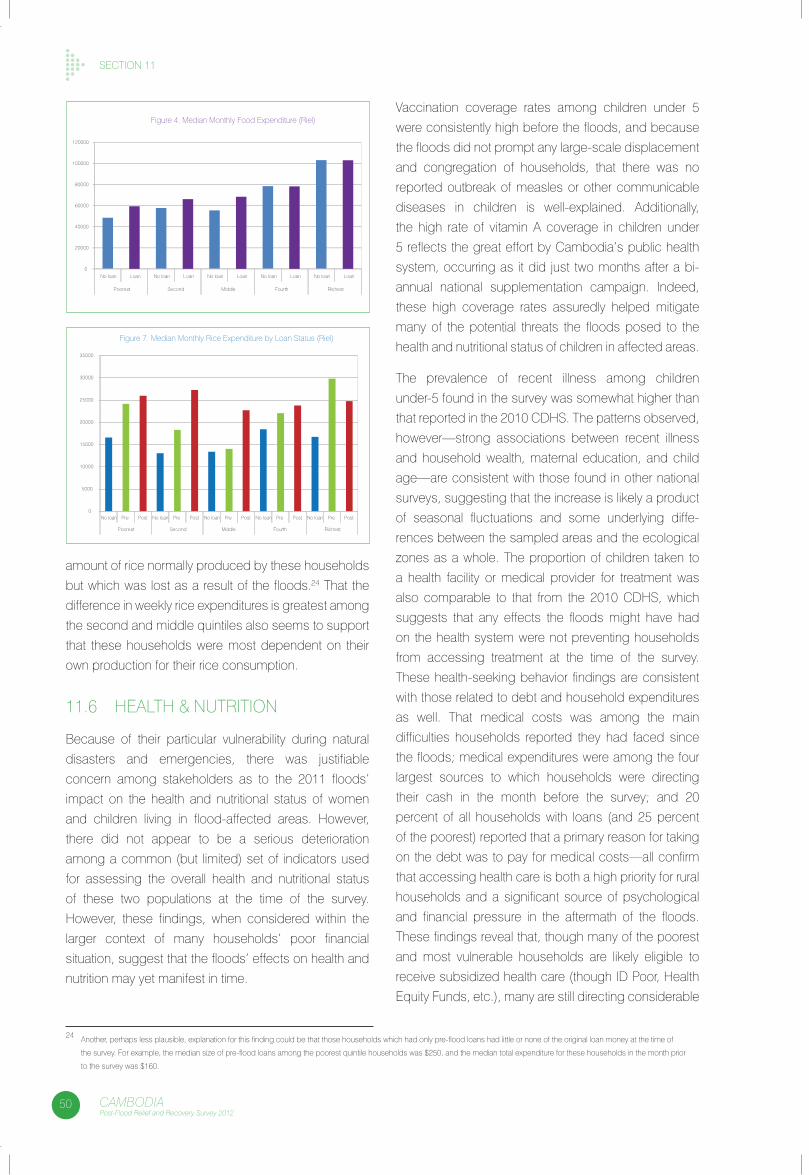
50 CAMBODIAPost-Flood Relief and Recovery Survey 2012
sectIon 11
amount of rice normally produced by these households
but which was lost as a result of the floods.24 that the
difference in weekly rice expenditures is greatest among
the second and middle quintiles also seems to support
that these households were most dependent on their
own production for their rice consumption.
11.6 HealtH & nUtRItIon
because of their particular vulnerability during natural
disasters and emergencies, there was justifiable
concern among stakeholders as to the 2011 floods’
impact on the health and nutritional status of women
and children living in flood-affected areas. However,
there did not appear to be a serious deterioration
among a common (but limited) set of indicators used
for assessing the overall health and nutritional status
of these two populations at the time of the survey.
However, these findings, when considered within the
larger context of many households’ poor financial
situation, suggest that the floods’ effects on health and
nutrition may yet manifest in time.
Vaccination coverage rates among children under 5
were consistently high before the floods, and because
the floods did not prompt any large-scale displacement
and congregation of households, that there was no
reported outbreak of measles or other communicable
diseases in children is well-explained. additionally,
the high rate of vitamin a coverage in children under
5 reflects the great effort by cambodia’s public health
system, occurring as it did just two months after a bi-
annual national supplementation campaign. Indeed,
these high coverage rates assuredly helped mitigate
many of the potential threats the floods posed to the
health and nutritional status of children in affected areas.
the prevalence of recent illness among children
under-5 found in the survey was somewhat higher than
that reported in the 2010 cDHs. the patterns observed,
however—strong associations between recent illness
and household wealth, maternal education, and child
age—are consistent with those found in other national
surveys, suggesting that the increase is likely a product
of seasonal fluctuations and some underlying diffe-
rences between the sampled areas and the ecological
zones as a whole. the proportion of children taken to
a health facility or medical provider for treatment was
also comparable to that from the 2010 cDHs, which
suggests that any effects the floods might have had
on the health system were not preventing households
from accessing treatment at the time of the survey.
these health-seeking behavior findings are consistent
with those related to debt and household expenditures
as well. that medical costs was among the main
difficulties households reported they had faced since
the floods; medical expenditures were among the four
largest sources to which households were directing
their cash in the month before the survey; and 20
percent of all households with loans (and 25 percent
of the poorest) reported that a primary reason for taking
on the debt was to pay for medical costs—all confirm
that accessing health care is both a high priority for rural
households and a significant source of psychological
and financial pressure in the aftermath of the floods.
these findings reveal that, though many of the poorest
and most vulnerable households are likely eligible to
receive subsidized health care (though ID Poor, Health
equity funds, etc.), many are still directing considerable
0
20000
40000
60000
80000
100000
120000
No loan Loan No loan Loan No loan Loan No loan Loan No loan Loan
Poorest Second Middle Fourth Richest
Figure 4. Median Monthly Food Expenditure (Riel)
0
5000
10000
15000
20000
25000
30000
35000
No loan Pre Post No loan Pre Post No loan Pre Post No loan Pre Post No loan Pre Post
Poorest Second Middle Fourth Richest
Figure 7. Median Monthly Rice Expenditure by Loan Status (Riel)
24 another, perhaps less plausible, explanation for this finding could be that those households which had only pre-flood loans had little or none of the original loan money at the time of
the survey. for example, the median size of pre-flood loans among the poorest quintile households was $250, and the median total expenditure for these households in the month prior
to the survey was $160.
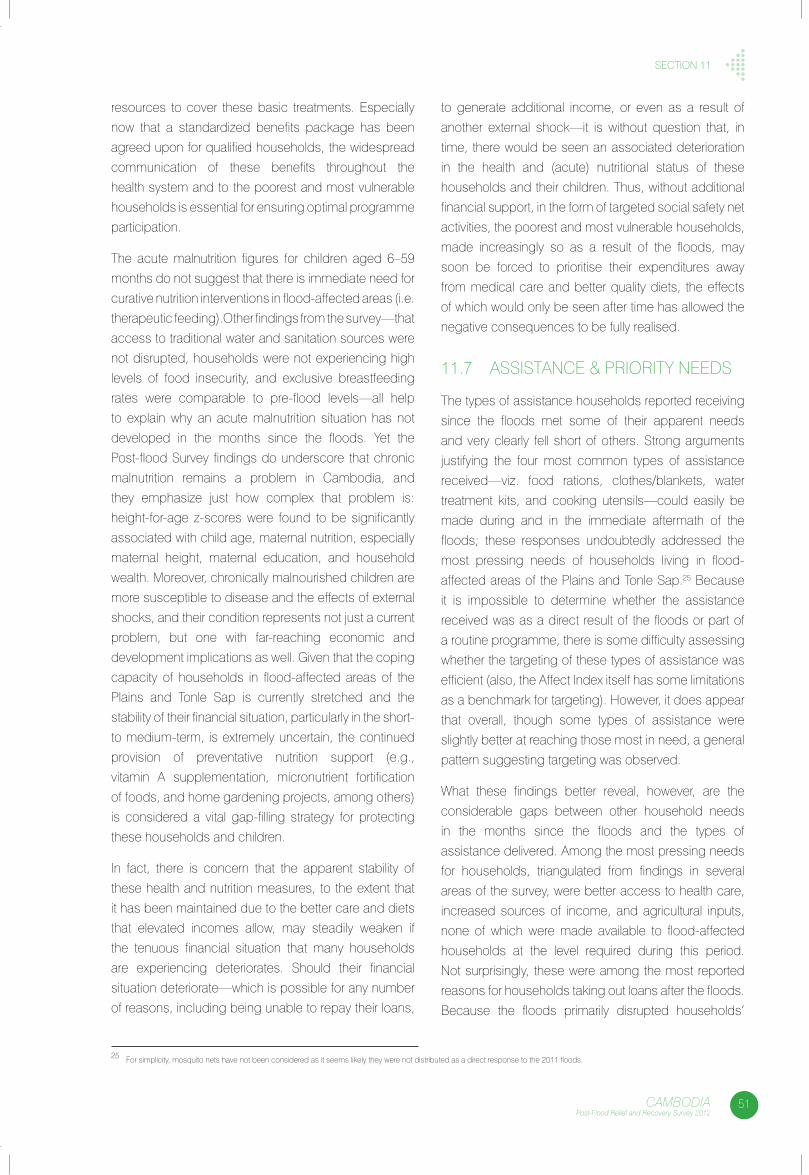
51CAMBODIAPost-Flood Relief and Recovery Survey 2012
sectIon 11
resources to cover these basic treatments. especially
now that a standardized benefits package has been
agreed upon for qualified households, the widespread
communication of these benefits throughout the
health system and to the poorest and most vulnerable
households is essential for ensuring optimal programme
participation.
the acute malnutrition figures for children aged 6–59
months do not suggest that there is immediate need for
curative nutrition interventions in flood-affected areas (i.e.
therapeutic feeding).other findings from the survey—that
access to traditional water and sanitation sources were
not disrupted, households were not experiencing high
levels of food insecurity, and exclusive breastfeeding
rates were comparable to pre-flood levels—all help
to explain why an acute malnutrition situation has not
developed in the months since the floods. yet the
Post-flood survey findings do underscore that chronic
malnutrition remains a problem in cambodia, and
they emphasize just how complex that problem is:
height-for-age z-scores were found to be significantly
associated with child age, maternal nutrition, especially
maternal height, maternal education, and household
wealth. Moreover, chronically malnourished children are
more susceptible to disease and the effects of external
shocks, and their condition represents not just a current
problem, but one with far-reaching economic and
development implications as well. Given that the coping
capacity of households in flood-affected areas of the
Plains and tonle sap is currently stretched and the
stability of their financial situation, particularly in the short-
to medium-term, is extremely uncertain, the continued
provision of preventative nutrition support (e.g.,
vitamin a supplementation, micronutrient fortification
of foods, and home gardening projects, among others)
is considered a vital gap-filling strategy for protecting
these households and children.
In fact, there is concern that the apparent stability of
these health and nutrition measures, to the extent that
it has been maintained due to the better care and diets
that elevated incomes allow, may steadily weaken if
the tenuous financial situation that many households
are experiencing deteriorates. should their financial
situation deteriorate—which is possible for any number
of reasons, including being unable to repay their loans,
to generate additional income, or even as a result of
another external shock—it is without question that, in
time, there would be seen an associated deterioration
in the health and (acute) nutritional status of these
households and their children. thus, without additional
financial support, in the form of targeted social safety net
activities, the poorest and most vulnerable households,
made increasingly so as a result of the floods, may
soon be forced to prioritise their expenditures away
from medical care and better quality diets, the effects
of which would only be seen after time has allowed the
negative consequences to be fully realised.
11.7 assIstance & PRIoRIty neeDs
the types of assistance households reported receiving
since the floods met some of their apparent needs
and very clearly fell short of others. strong arguments
justifying the four most common types of assistance
received—viz. food rations, clothes/blankets, water
treatment kits, and cooking utensils—could easily be
made during and in the immediate aftermath of the
floods; these responses undoubtedly addressed the
most pressing needs of households living in flood-
affected areas of the Plains and tonle sap.25 because
it is impossible to determine whether the assistance
received was as a direct result of the floods or part of
a routine programme, there is some difficulty assessing
whether the targeting of these types of assistance was
efficient (also, the affect Index itself has some limitations
as a benchmark for targeting). However, it does appear
that overall, though some types of assistance were
slightly better at reaching those most in need, a general
pattern suggesting targeting was observed.
What these findings better reveal, however, are the
considerable gaps between other household needs
in the months since the floods and the types of
assistance delivered. among the most pressing needs
for households, triangulated from findings in several
areas of the survey, were better access to health care,
increased sources of income, and agricultural inputs,
none of which were made available to flood-affected
households at the level required during this period.
not surprisingly, these were among the most reported
reasons for households taking out loans after the floods.
because the floods primarily disrupted households’
25 for simplicity, mosquito nets have not been considered as it seems likely they were not distributed as a direct response to the 2011 floods.
52 CAMBODIAPost-Flood Relief and Recovery Survey 2012
sectIon 11
livelihoods (i.e. their crops and other sources of income),
their main response was to take measures to repair
these livelihoods (specifically by replanting wet or
cultivating dry season rice) and to replace their lost
cash income to cover their biggest monthly expenses
(food, medical care, and loans). therefore, disaster
preparedness plans, and future relief phase responses
in general, will do well by aiming to mitigate an external
shock’s impact on livelihoods and incomes through
targeted supports (agricultural inputs, credit for self-
employed, etc.) and financial assistance26 for large
monthly expenses.27
11.8 lIMItatIons
all exercises in household data collection are subject
to known and unknown deficiencies—which cannot
always be accounted for during the design, fieldwork,
cleaning and analysis stages—that could potentially
bias the findings. a primary limitation of the Post-
flood Relief and Recovery survey was that there were
some areas affected by the 2011 floods that could
not be surveyed. some areas in Kratie and stung
treng reportedly faced very serious effects from the
floods, but given the logistical, budgetary, and time
implications associated with including these areas, it
was not considered possible to visit households there.
as a result, and as mentioned in separate sections
of this report, the findings presented herein are only
representative for households living within 250 meters of
the peak-flood boundary as photographed by satellite
in late september 2011. therefore, extrapolating these
findings to areas not considered part of the survey
sampling frame will result in specious results.
another limitation of the Post-flood survey was that
enumerators used a variation of the ePI method for
sampling households within sampled villages. a more
ideal sampling method would have required listing all
households in the village (or from a segment of the
village) and then randomly or systematically choosing
them from the list generated. While the improved ePI
method used was practiced extensively, monitored,
and universally followed by enumerators, it does not
represent the “gold standard” for household selection
within the village and can possibly bias the survey
results to some extent because it is more likely to
sample households living close to one another.
It is also likely that the time-specific nature of some
questions in the survey—several asked respondents to
recall events three or more months in the past—could
have resulted in recall bias, whereby actual conditions
and events were not remembered correctly. the impact
of this bias is generally considered less problematic
than the selection bias mentioned immediately above,
but because some indicators were created using this
recalled information, it nonetheless warrants mentioning.
a fourth limitation that was only realised after survey
teams were in the field was that the types of crops
households were growing in the 2011/2012 dry season
were not captured; only the amount of land cultivated.
as a result, it was not possible to determine the amount
of dry season rice that was being planted and whether
this represented a change for households from the
2011 wet season.
finally, questions related to household debt were largely
borrowed from a survey being conducted concurrently
by the access to finance consortium for reasons
of comparability. that more extensive questionnaire
was condensed for time considerations, and as a
result, only information about a household’s largest
loan was collected in the Post-flood survey. that is to
say, households were not specifically asked how they
were spending their flood-related loan money. a fairly
strong attempt was made to break down household
expenditure patterns by loan type to better understand
spending behaviours, but flood-loan-specific questions
would have made these results, presented in the
section 11.4, more robust.
26 It is quite clear from the survey’s findings that households universally sought credit as a primary means of coping with the floods’ effects. It is also clear that, while the cost of borrowing
from MfI was fairly consistent across wealth quintiles, the poorest households, who were most likely to borrow money, were also least likely to borrow from banks, and most likely to borrow
from private lenders, which charged considerably higher rates to finance all loans. therefore better access to affordable financing/income replacement for the poorest households, through
cash transfers, community savings groups, and/or stronger protections and regulations in the private lending sector, is needed. What is not clear is how much the reliance on expensive
sources of financing is simply normative, and how much is a result of these households not having alternative sources of financing.
27 as discussed above, another potentially powerful means of addressing the burden of medical expenses is the standardization and communication of benefits to households eligible for
social safety net programmes. another consideration for future relief phase responses is to enable a time-bound expansion of eligibility for households demonstrating need
(i.e. for households who were not eligible pre-shock).
53CAMBODIAPost-Flood Relief and Recovery Survey 2012
conclUsIons
the effects of the 2011 floods on households in
cambodia living within 250 meters of the peak-flood
boundary were extensive in scope and depth. the
findings from the 2012 Post-flood Relief and Recovery
survey contained herein provide the most comprehensive
picture yet available of the extent to which these
households were affected. In particular, these findings
suggest that households experienced the floods’
effects quite differently, though in many ways just as
painfully, depending on various underlying factors,
the most notable of these being household wealth
and source of livelihood and income. the overall
measures indicative of community well-being suggest
that, in the months since the waters began receding,
most households have found ways of coping with the
additional, in some cases substantial, burdens with
which they have been saddled by the floods. What is
also apparent is that the coping strategies that many
of these households turned to as a result of the
floods—especially the poorest but also those in the
middle wealth groups as well—have placed them in a
more tenuous financial situation. their ability to escape
from this situation, and indeed the likelihood that they
will be able to effectively endure a future shock, will
depend in large part on whether 1) they receive the
external support that is needed (the rationale for which
is delineated within this report), and 2) government
and development partners use and learn from the
experiences provided by the 2011 floods to scale-up
their emergency preparations and tailor their current and
future response activities to match the specific needs
of broad, but fundamentally different, cross-sections of
the affected population.
conclUsIons
Action Aid/Savann Oeurm/2011.Action Aid/Savann Oeurm/2011.Action Aid/Savann Oeurm/2011.Action Aid/Savann Oeurm/2011.
54 CAMBODIAPost-Flood Relief and Recovery Survey 2012
RecoMMenDatIons
1) because the effective communication of infor-
mation to households is vital during emergencies,
emergency communication plans should avoid
relying upon a single medium for information
dissemination (e.g., television). existing emergency
communication plans should test and strengthen,
or implement if they do not already have, a word-
of-mouth system to ensure optimal coverage
and saturation (e.g., from commune chief to
village chief/VHV or someone else within the
village dedicated for such a purpose). Moreover,
emergency partners should consider adding and
testing an sMs system that takes advantage of
households’ high ownership of mobile phones.
2) Partners interested in helping the poorest house-
holds and reducing the impact of future natural
disasters (e.g., household displacement and
its associated economic losses) are encouraged
to support the poorest households’ ability to
improve their housing structures.
3) WasH-related preparedness and recovery efforts
will best be directed towards hygiene education,
as well as strategic prepositioning and continued
distribution of soap and water treatment materials
in high-risk and flood-affected areas.
4) survey findings underscore that the 2011 floods
created additional opportunities for, and likely
increased the potential effectiveness of, recovery
programmes that aim to alleviate financial
pressures—by directing assistance through the
labour market, such as public works pro-
grammes—the poorest and most vulnerable
households are experiencing. Given the wide
range of vulnerabilities faced by households
living near the lake and rivers, and the high
dependency by many of these households on
daily wages, recovery public works programmes
are encouraged to explore multi-faceted channels
and more frequent disbursement modalities for
this assistance.
5) the price paid to farmers for dry season
paddy should be closely monitored: substantial
deviations from historical prices will undoubtedly
affect farmers’ ability to meet their increased
financial burdens resulting from the floods.
6) In the medium- to long-term, the coping strategies
employed by farmers in response to (or
anticipation of) the floods—taking out loans to
finance dry season planting, being risk-averse in
locations near the lake and rivers—emphasize
the need for more robust protection mechanisms
for small-scale farmers.
7) survey findings reveal that, though many of the
poorest and most vulnerable households
are likely eligible to receive subsidized health
care (though IDPoor, Health equity funds, etc.),
many are still directing considerable resources
to cover these basic treatments. especially
now that a standardized benefits package has
been agreed upon for qualified households,
the widespread communication of these benefits
throughout the health system and to the poorest
and most vulnerable households is essential for
ensuring optimal programme participation.
8) Recovery programmes that seek to protect
children and to improve school attendance
should be designed in ways that recognize the
economic context within which households,
particularly those affected by the floods, are being
forced to rely upon child labour.
RecoMMenDatIons
55CAMBODIAPost-Flood Relief and Recovery Survey 2012
RecoMMenDatIons
9) Recovery programmes that seek to improve
households’ investment in productive activities
(agricultural as well as self-employment/small
business) with financial assistance will see the
greatest marginal benefits from the poorest
households.
10) additional financial support, in the form of targeted
social safety net activities, is needed by the
poorest and most vulnerable households to
protect against the deterioration of the health
and nutritional status of their families, particularly
children under 5.
11) Given that the coping capacity of households
in flood-affected areas of the Plains and tonle
sap is currently stretched and the stability of
their financial situation, particularly in the short-
to medium-term, is extremely uncertain, the
continued provision of preventative nutrition
support (e.g., vitamin a supplementation, micro-
nutrient fortification of foods, and home gardening
projects, among others) is considered a vital
gap-filling strategy for protecting these households
and children.
12) Disaster preparedness plans, and future relief
phase responses in general, will do well by aiming
to mitigate an external shock’s impact on
livelihoods and incomes through targeted
supports (agricultural inputs, credit for self-
employed, etc.) and financial assistance for large
monthly expenses.
UNICEF Cambodia/Nicholas Axelrod/2011UNICEF Cambodia/Nicholas Axelrod/2011UNICEF Cambodia/Nicholas Axelrod/2011
56 CAMBODIAPost-Flood Relief and Recovery Survey 2012
RefeRences
RefeRences
1. council for agricultural and Rural Development
[cambodia], December 2011. cambodia food
security and nutrition Quarterly bulletin: Issue #5,
october–December 2011. Phnom Penh, cambodia.
2. national committee on Disaster Management
[cambodia], october 2011. affected Data of flash
flood and Mekong River flood. Phnom Penh,
cambodia.
3. Ministry of agriculture, forestry, and fisheries
[cambodia], april 2012. annual Report for agriculture,
forestry, and fisheries 2011-2012. Phnom Penh,
cambodia.
4. United nations office for the coordination of
Humanitarian affairs, December 2011.Kingdom of
cambodia: evaluation of Post-flood needs ass-
essment Data.Phnom Penh, cambodia.
5. “Identification of Poor Households Programme,”
http://www.mop.gov.kh/Projects/IDPoor/tabid/
154/Default.aspx.
6. Measuring Mortality, nutritional status, and food
security in crisis situations: sMaRt Methodology,
Version 1. 2006.
7. sPss for Windows, Release 17.0.0. 2001. chicago:
sPss Inc.
8. statacorp. 2009. stata statistical software: Release
11. college station, tX: statacorp lP.
9. national Institute of statistics, Directorate General for
Health, and Icf Macro, 2011. cambodia Demographic
and Health survey 2010. Phnom Penh, cambodia
and calverton, Maryland, Usa: national Institute of
statistics, Directorate General for Health, and Icf
Macro.
10. Rutstein so, Johnson, K. the DHs Wealth Index.
DHs comparative Reports no. 6. calverton, Maryland:
oRc Macro. 2004.
11. coates, Jennifer, anne swindale and Paula bilinsky.
Household food Insecurity access scale (HfIas)
for Measurement of Household food access:
Indicator Guide (v. 3).Washington, D.c.: food and
nutrition technical assistance Project, academy for
educational Development, august 2007.
12. Maxwell Daniel, caldwell Richard. csI field Methods
Manual, second edit ion, copyright © 2008.
cooperative for assistance and Relief everywhere,
Inc. (caRe). Used by Permission.
13. ballard, terri; coates, Jennifer; swindale, anne; and
Deitchler, Megan. Household Hunger scale: Indicator
Definition and Measurement Guide. Washington,
Dc: fanta-2 bridge, fHI 360.
14. subramanian sV, ackerson lK, Davey smith G, John
na. association of maternal height with child
mortality, anthropometric failure, and anemia in India.
JaMa. 2009 apr 22;301(16):1691-701.
15. WHoMulticentre Growth Reference study Group.
WHo child Growth standards: length/height-for-
age, weight-for-age, weight-for-length, weight-for-
height and body mass index-for-age: Methods and
development. Geneva: World Health organization,
2006 (312 pages).
16. national nutrition Programme, national Maternal
and child Health center [cambodia], December
2011. national Interim Guidelines for the Management
of acute Malnutrition. Phnom Penh, cambodia.
17. World Health organization. Global strategy for Infant
and young child feeding. Geneva: World Health
organization, 2003.
18. edmond KM, Zandoh c, Quigley Ma, amenga-etego
s, owusu-agyei s, Kirkwood bR. Delayed breast-
feeding initiation increases risk of neonatal mortality.
Pediatrics. 2006 Mar;117(3):e380-6.
19. Ministry of agriculture, forestry, and fisheries
[cambodia], april 2011. annual Report for agriculture,
forestry, and fisheries 2010-2011. Phnom Penh,
cambodia.
57CAMBODIAPost-Flood Relief and Recovery Survey 2012
aPPenDIX I
aPPenDIX
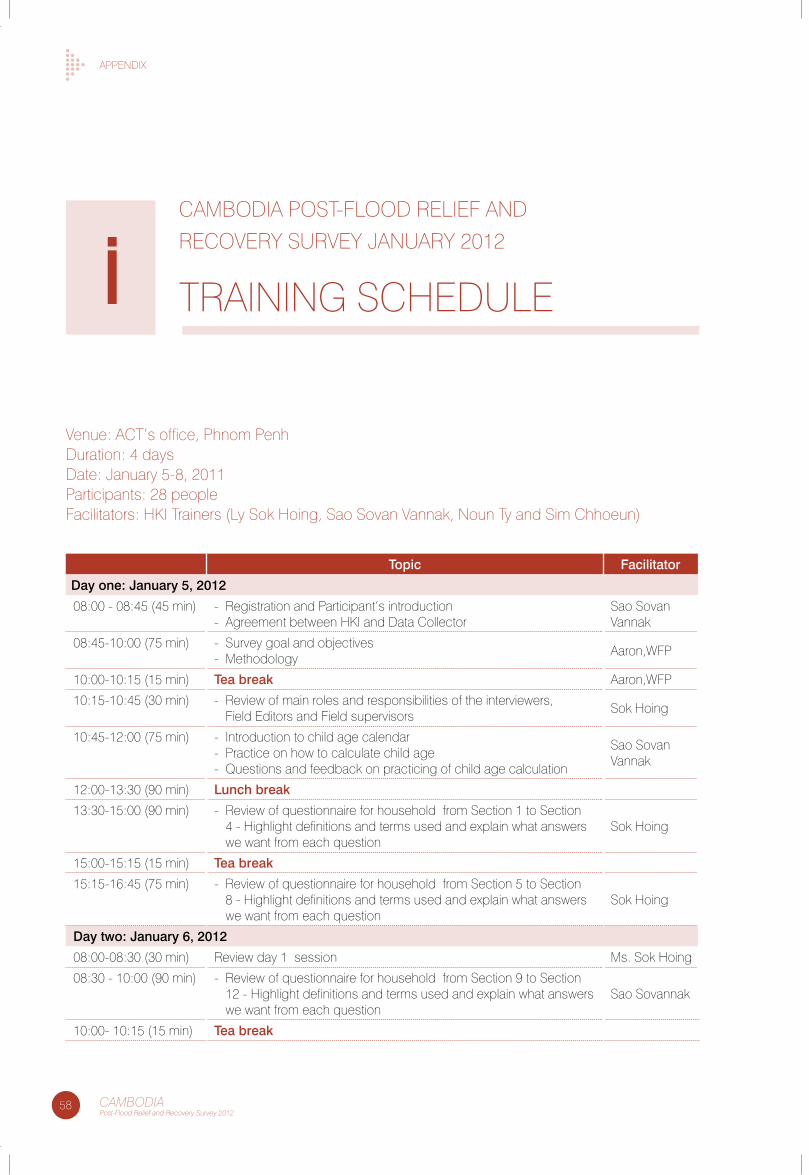
58 CAMBODIAPost-Flood Relief and Recovery Survey 2012
aPPenDIX
caMboDIa Post-flooD RelIef anD
RecoVeRy sURVey JanUaRy 2012
tRaInInG scHeDUle
Venue: act’s office, Phnom PenhDuration: 4 daysDate: January 5-8, 2011Participants: 28 peoplefacilitators: HKI trainers (ly sok Hoing, sao sovan Vannak, noun ty and sim chhoeun)
Topic Facilitator
Day one: January 5, 2012
08:00 - 08:45 (45 min) - Registration and Participant’s introduction - agreement between HKI and Data collector
sao sovan Vannak
08:45-10:00 (75 min) - survey goal and objectives- Methodology
aaron,WfP
10:00-10:15 (15 min) Tea break aaron,WfP
10:15-10:45 (30 min) - Review of main roles and responsibilities of the interviewers, field editors and field supervisors
sok Hoing
10:45-12:00 (75 min) - Introduction to child age calendar - Practice on how to calculate child age - Questions and feedback on practicing of child age calculation
sao sovan Vannak
12:00-13:30 (90 min) Lunch break
13:30-15:00 (90 min) - Review of questionnaire for household from section 1 to section 4 - Highlight definitions and terms used and explain what answers we want from each question
sok Hoing
15:00-15:15 (15 min) Tea break
15:15-16:45 (75 min) - Review of questionnaire for household from section 5 to section 8 - Highlight definitions and terms used and explain what answers we want from each question
sok Hoing
Day two: January 6, 2012
08:00-08:30 (30 min) Review day 1 session Ms. sok Hoing
08:30 - 10:00 (90 min) - Review of questionnaire for household from section 9 to section 12 - Highlight definitions and terms used and explain what answers we want from each question
sao sovannak
10:00- 10:15 (15 min) Tea break
i
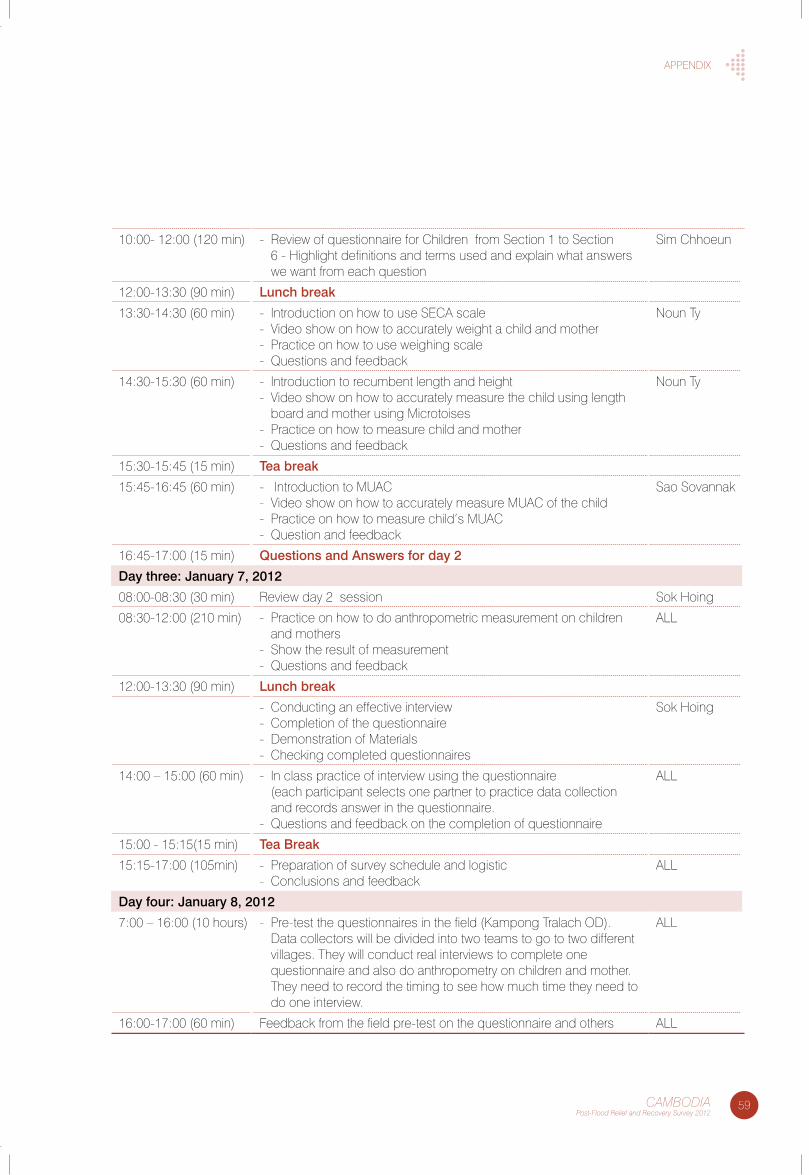
59CAMBODIAPost-Flood Relief and Recovery Survey 2012
aPPenDIX
10:00- 12:00 (120 min) - Review of questionnaire for children from section 1 to section 6 - Highlight definitions and terms used and explain what answers we want from each question
sim chhoeun
12:00-13:30 (90 min) Lunch break
13:30-14:30 (60 min) - Introduction on how to use seca scale - Video show on how to accurately weight a child and mother - Practice on how to use weighing scale- Questions and feedback
noun ty
14:30-15:30 (60 min) - Introduction to recumbent length and height- Video show on how to accurately measure the child using length
board and mother using Microtoises - Practice on how to measure child and mother- Questions and feedback
noun ty
15:30-15:45 (15 min) Tea break
15:45-16:45 (60 min) - Introduction to MUac- Video show on how to accurately measure MUac of the child- Practice on how to measure child’s MUac- Question and feedback
sao sovannak
16:45-17:00 (15 min) Questions and answers for day 2
Day three: January 7, 2012
08:00-08:30 (30 min) Review day 2 session sok Hoing
08:30-12:00 (210 min) - Practice on how to do anthropometric measurement on children and mothers
- show the result of measurement - Questions and feedback
all
12:00-13:30 (90 min) Lunch break
- conducting an effective interview- completion of the questionnaire- Demonstration of Materials- checking completed questionnaires
sok Hoing
14:00 – 15:00 (60 min) - In class practice of interview using the questionnaire (each participant selects one partner to practice data collection and records answer in the questionnaire.
- Questions and feedback on the completion of questionnaire
all
15:00 - 15:15(15 min) Tea Break
15:15-17:00 (105min) - Preparation of survey schedule and logistic- conclusions and feedback
all
Day four: January 8, 2012
7:00 – 16:00 (10 hours) - Pre-test the questionnaires in the field (Kampong tralach oD). Data collectors will be divided into two teams to go to two different villages. they will conduct real interviews to complete one questionnaire and also do anthropometry on children and mother. they need to record the timing to see how much time they need to do one interview.
all
16:00-17:00 (60 min) feedback from the field pre-test on the questionnaire and others all
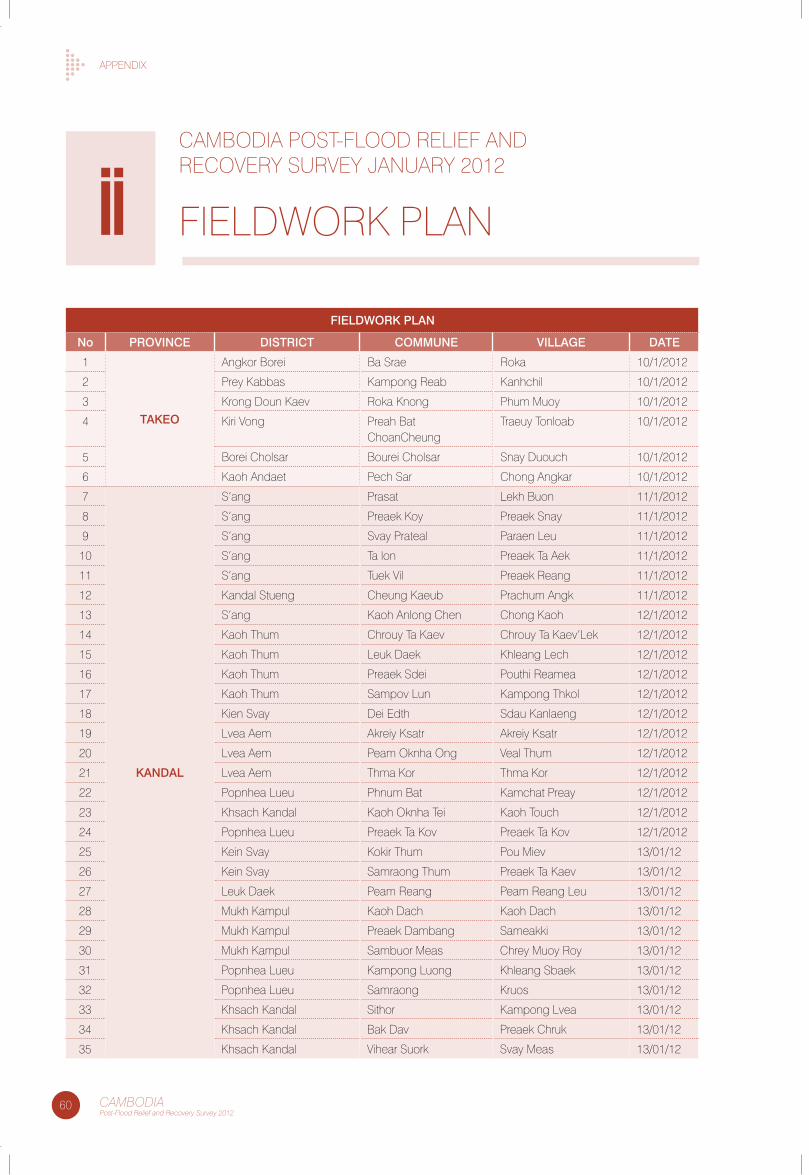
60 CAMBODIAPost-Flood Relief and Recovery Survey 2012
aPPenDIX
caMboDIa Post-flooD RelIef anD RecoVeRy sURVey JanUaRy 2012
fIelDWoRK PlaniiFIeLDWORK PLaN
No PROVINCe DISTRICT COMMUNe VILLage DaTe
1
TaKeO
angkor borei ba srae Roka 10/1/2012
2 Prey Kabbas Kampong Reab Kanhchil 10/1/2012
3 Krong Doun Kaev Roka Knong Phum Muoy 10/1/2012
4 Kiri Vong Preah bat choancheung
traeuy tonloab 10/1/2012
5 borei cholsar bourei cholsar snay Duouch 10/1/2012
6 Kaoh andaet Pech sar chong angkar 10/1/2012
7
KaNDaL
s’ang Prasat lekh buon 11/1/2012
8 s’ang Preaek Koy Preaek snay 11/1/2012
9 s’ang svay Prateal Paraen leu 11/1/2012
10 s’ang ta lon Preaek ta aek 11/1/2012
11 s’ang tuek Vil Preaek Reang 11/1/2012
12 Kandal stueng cheung Kaeub Prachum angk 11/1/2012
13 s’ang Kaoh anlong chen chong Kaoh 12/1/2012
14 Kaoh thum chrouy ta Kaev chrouy ta Kaev’lek 12/1/2012
15 Kaoh thum leuk Daek Khleang lech 12/1/2012
16 Kaoh thum Preaek sdei Pouthi Reamea 12/1/2012
17 Kaoh thum sampov lun Kampong thkol 12/1/2012
18 Kien svay Dei edth sdau Kanlaeng 12/1/2012
19 lvea aem akreiy Ksatr akreiy Ksatr 12/1/2012
20 lvea aem Peam oknha ong Veal thum 12/1/2012
21 lvea aem thma Kor thma Kor 12/1/2012
22 Popnhea lueu Phnum bat Kamchat Preay 12/1/2012
23 Khsach Kandal Kaoh oknha tei Kaoh touch 12/1/2012
24 Popnhea lueu Preaek ta Kov Preaek ta Kov 12/1/2012
25 Kein svay Kokir thum Pou Miev 13/01/12
26 Kein svay samraong thum Preaek ta Kaev 13/01/12
27 leuk Daek Peam Reang Peam Reang leu 13/01/12
28 Mukh Kampul Kaoh Dach Kaoh Dach 13/01/12
29 Mukh Kampul Preaek Dambang sameakki 13/01/12
30 Mukh Kampul sambuor Meas chrey Muoy Roy 13/01/12
31 Popnhea lueu Kampong luong Khleang sbaek 13/01/12
32 Popnhea lueu samraong Kruos 13/01/12
33 Khsach Kandal sithor Kampong lvea 13/01/12
34 Khsach Kandal bak Dav Preaek chruk 13/01/12
35 Khsach Kandal Vihear suork svay Meas 13/01/12
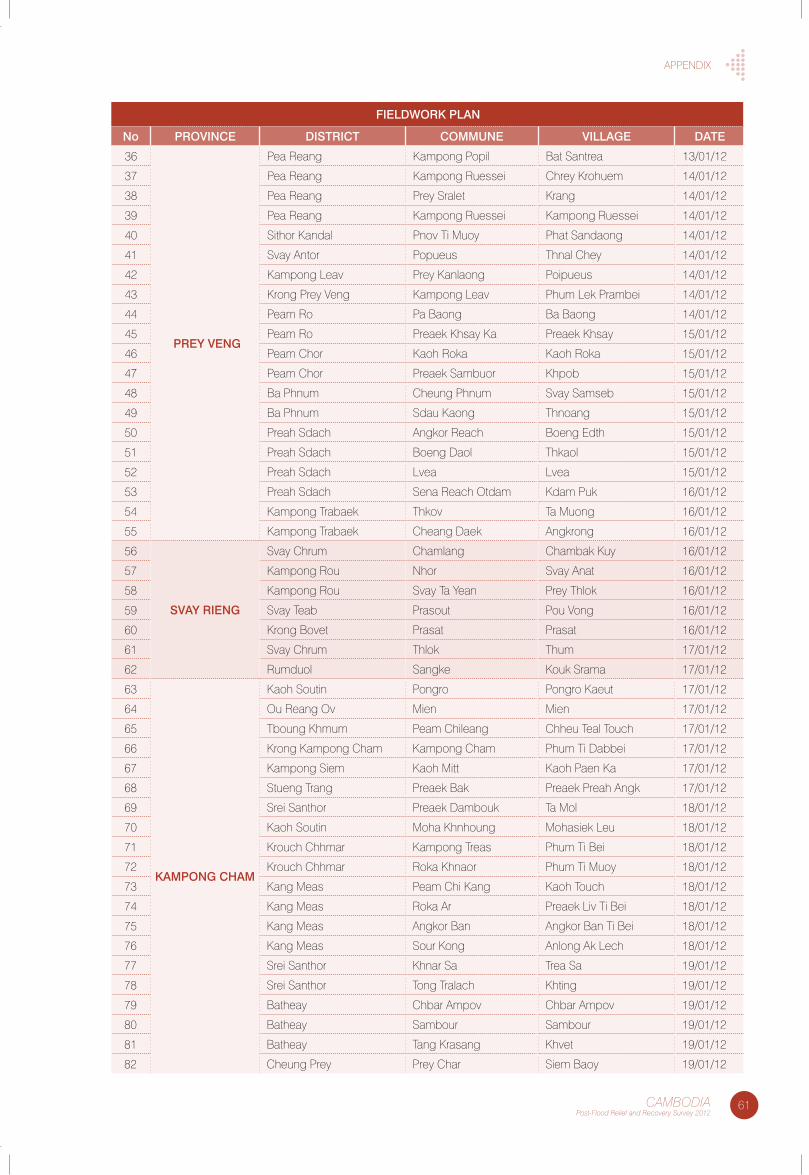
61CAMBODIAPost-Flood Relief and Recovery Survey 2012
aPPenDIX
FIeLDWORK PLaN
No PROVINCe DISTRICT COMMUNe VILLage DaTe
36
PReY VeNg
Pea Reang Kampong Popil bat santrea 13/01/12
37 Pea Reang Kampong Ruessei chrey Krohuem 14/01/12
38 Pea Reang Prey sralet Krang 14/01/12
39 Pea Reang Kampong Ruessei Kampong Ruessei 14/01/12
40 sithor Kandal Pnov ti Muoy Phat sandaong 14/01/12
41 svay antor Popueus thnal chey 14/01/12
42 Kampong leav Prey Kanlaong Poipueus 14/01/12
43 Krong Prey Veng Kampong leav Phum lek Prambei 14/01/12
44 Peam Ro Pa baong ba baong 14/01/12
45 Peam Ro Preaek Khsay Ka Preaek Khsay 15/01/12
46 Peam chor Kaoh Roka Kaoh Roka 15/01/12
47 Peam chor Preaek sambuor Khpob 15/01/12
48 ba Phnum cheung Phnum svay samseb 15/01/12
49 ba Phnum sdau Kaong thnoang 15/01/12
50 Preah sdach angkor Reach boeng edth 15/01/12
51 Preah sdach boeng Daol thkaol 15/01/12
52 Preah sdach lvea lvea 15/01/12
53 Preah sdach sena Reach otdam Kdam Puk 16/01/12
54 Kampong trabaek thkov ta Muong 16/01/12
55 Kampong trabaek cheang Daek angkrong 16/01/12
56
SVaY RIeNg
svay chrum chamlang chambak Kuy 16/01/12
57 Kampong Rou nhor svay anat 16/01/12
58 Kampong Rou svay ta yean Prey thlok 16/01/12
59 svay teab Prasout Pou Vong 16/01/12
60 Krong bovet Prasat Prasat 16/01/12
61 svay chrum thlok thum 17/01/12
62 Rumduol sangke Kouk srama 17/01/12
63
KaMPONg CHaM
Kaoh soutin Pongro Pongro Kaeut 17/01/12
64 ou Reang ov Mien Mien 17/01/12
65 tboung Khmum Peam chileang chheu teal touch 17/01/12
66 Krong Kampong cham Kampong cham Phum ti Dabbei 17/01/12
67 Kampong siem Kaoh Mitt Kaoh Paen Ka 17/01/12
68 stueng trang Preaek bak Preaek Preah angk 17/01/12
69 srei santhor Preaek Dambouk ta Mol 18/01/12
70 Kaoh soutin Moha Khnhoung Mohasiek leu 18/01/12
71 Krouch chhmar Kampong treas Phum ti bei 18/01/12
72 Krouch chhmar Roka Khnaor Phum ti Muoy 18/01/12
73 Kang Meas Peam chi Kang Kaoh touch 18/01/12
74 Kang Meas Roka ar Preaek liv ti bei 18/01/12
75 Kang Meas angkor ban angkor ban ti bei 18/01/12
76 Kang Meas sour Kong anlong ak lech 18/01/12
77 srei santhor Khnar sa trea sa 19/01/12
78 srei santhor tong tralach Khting 19/01/12
79 batheay chbar ampov chbar ampov 19/01/12
80 batheay sambour sambour 19/01/12
81 batheay tang Krasang Khvet 19/01/12
82 cheung Prey Prey char siem baoy 19/01/12
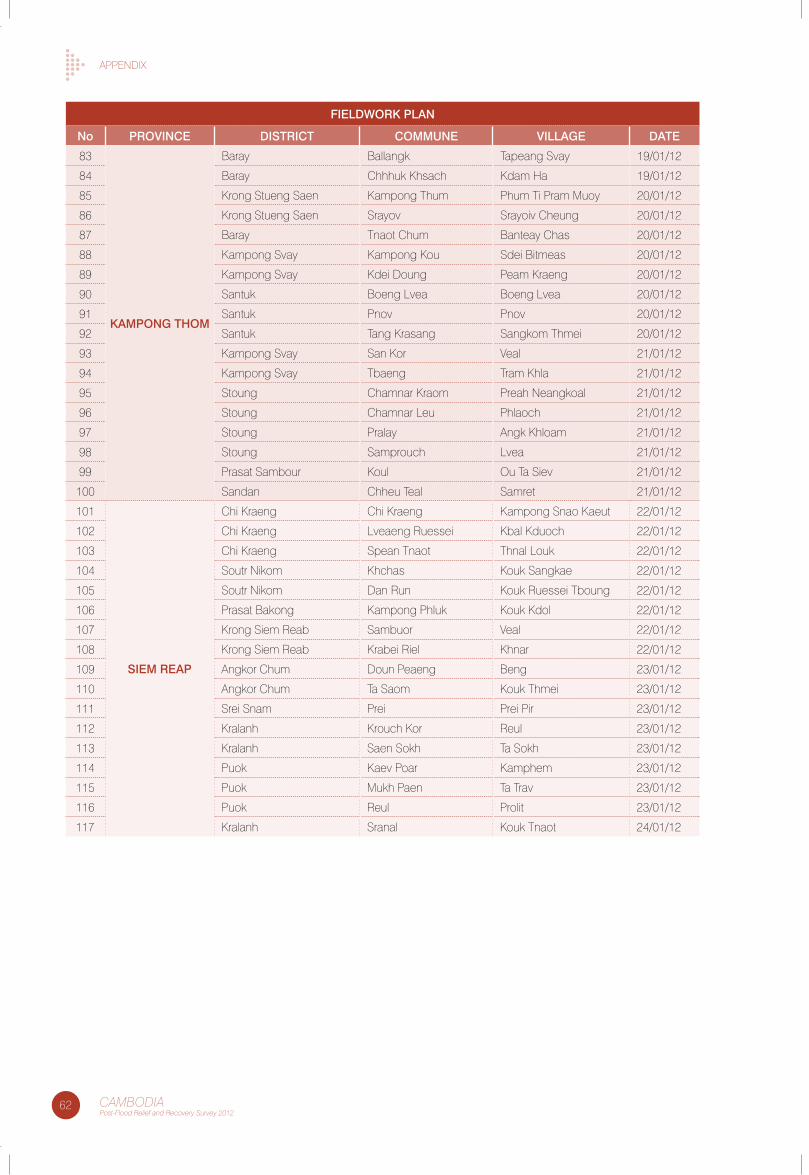
62 CAMBODIAPost-Flood Relief and Recovery Survey 2012
aPPenDIX
FIeLDWORK PLaN
No PROVINCe DISTRICT COMMUNe VILLage DaTe
83
KaMPONg THOM
baray ballangk tapeang svay 19/01/12
84 baray chhhuk Khsach Kdam Ha 19/01/12
85 Krong stueng saen Kampong thum Phum ti Pram Muoy 20/01/12
86 Krong stueng saen srayov srayoiv cheung 20/01/12
87 baray tnaot chum banteay chas 20/01/12
88 Kampong svay Kampong Kou sdei bitmeas 20/01/12
89 Kampong svay Kdei Doung Peam Kraeng 20/01/12
90 santuk boeng lvea boeng lvea 20/01/12
91 santuk Pnov Pnov 20/01/12
92 santuk tang Krasang sangkom thmei 20/01/12
93 Kampong svay san Kor Veal 21/01/12
94 Kampong svay tbaeng tram Khla 21/01/12
95 stoung chamnar Kraom Preah neangkoal 21/01/12
96 stoung chamnar leu Phlaoch 21/01/12
97 stoung Pralay angk Khloam 21/01/12
98 stoung samprouch lvea 21/01/12
99 Prasat sambour Koul ou ta siev 21/01/12
100 sandan chheu teal samret 21/01/12
101
SIeM ReaP
chi Kraeng chi Kraeng Kampong snao Kaeut 22/01/12
102 chi Kraeng lveaeng Ruessei Kbal Kduoch 22/01/12
103 chi Kraeng spean tnaot thnal louk 22/01/12
104 soutr nikom Khchas Kouk sangkae 22/01/12
105 soutr nikom Dan Run Kouk Ruessei tboung 22/01/12
106 Prasat bakong Kampong Phluk Kouk Kdol 22/01/12
107 Krong siem Reab sambuor Veal 22/01/12
108 Krong siem Reab Krabei Riel Khnar 22/01/12
109 angkor chum Doun Peaeng beng 23/01/12
110 angkor chum ta saom Kouk thmei 23/01/12
111 srei snam Prei Prei Pir 23/01/12
112 Kralanh Krouch Kor Reul 23/01/12
113 Kralanh saen sokh ta sokh 23/01/12
114 Puok Kaev Poar Kamphem 23/01/12
115 Puok Mukh Paen ta trav 23/01/12
116 Puok Reul Prolit 23/01/12
117 Kralanh sranal Kouk tnaot 24/01/12
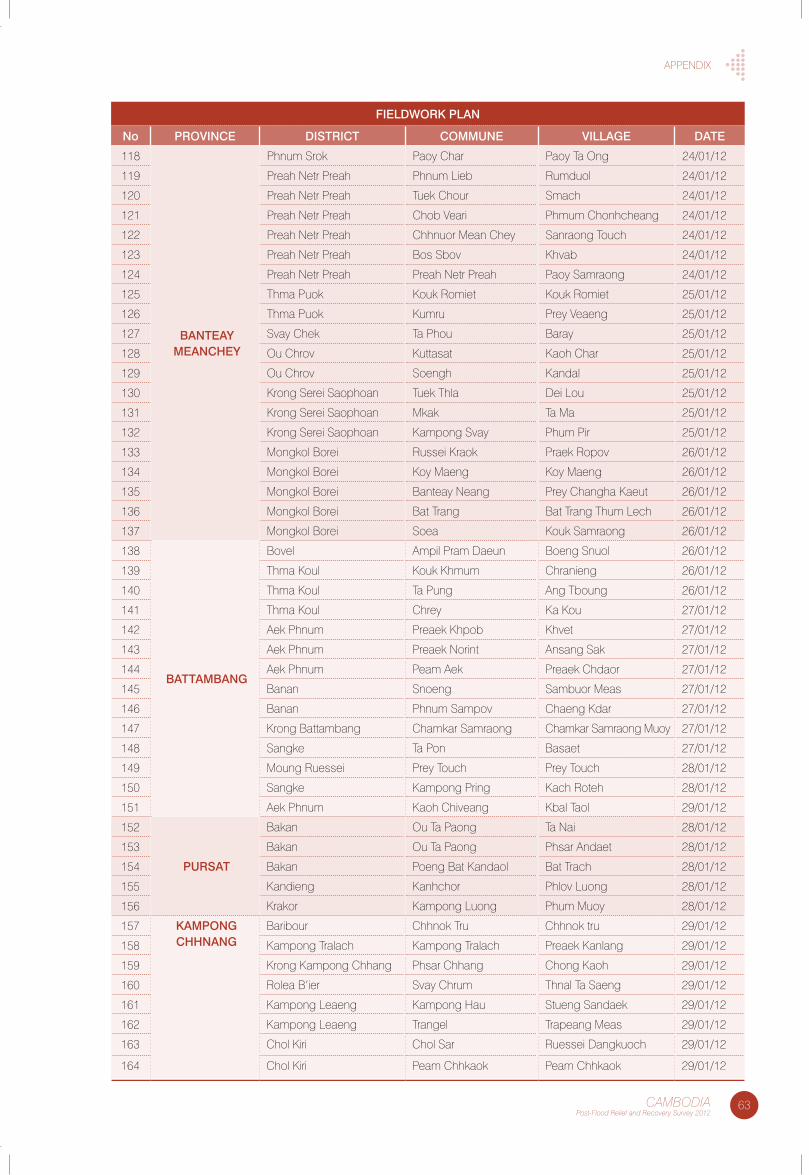
63CAMBODIAPost-Flood Relief and Recovery Survey 2012
aPPenDIX
FIeLDWORK PLaN
No PROVINCe DISTRICT COMMUNe VILLage DaTe
118
BaNTeaYMeaNCHeY
Phnum srok Paoy char Paoy ta ong 24/01/12
119 Preah netr Preah Phnum lieb Rumduol 24/01/12
120 Preah netr Preah tuek chour smach 24/01/12
121 Preah netr Preah chob Veari Phmum chonhcheang 24/01/12
122 Preah netr Preah chhnuor Mean chey sanraong touch 24/01/12
123 Preah netr Preah bos sbov Khvab 24/01/12
124 Preah netr Preah Preah netr Preah Paoy samraong 24/01/12
125 thma Puok Kouk Romiet Kouk Romiet 25/01/12
126 thma Puok Kumru Prey Veaeng 25/01/12
127 svay chek ta Phou baray 25/01/12
128 ou chrov Kuttasat Kaoh char 25/01/12
129 ou chrov soengh Kandal 25/01/12
130 Krong serei saophoan tuek thla Dei lou 25/01/12
131 Krong serei saophoan Mkak ta Ma 25/01/12
132 Krong serei saophoan Kampong svay Phum Pir 25/01/12
133 Mongkol borei Russei Kraok Praek Ropov 26/01/12
134 Mongkol borei Koy Maeng Koy Maeng 26/01/12
135 Mongkol borei banteay neang Prey changha Kaeut 26/01/12
136 Mongkol borei bat trang bat trang thum lech 26/01/12
137 Mongkol borei soea Kouk samraong 26/01/12
138
BaTTaMBaNg
bovel ampil Pram Daeun boeng snuol 26/01/12
139 thma Koul Kouk Khmum chranieng 26/01/12
140 thma Koul ta Pung ang tboung 26/01/12
141 thma Koul chrey Ka Kou 27/01/12
142 aek Phnum Preaek Khpob Khvet 27/01/12
143 aek Phnum Preaek norint ansang sak 27/01/12
144 aek Phnum Peam aek Preaek chdaor 27/01/12
145 banan snoeng sambuor Meas 27/01/12
146 banan Phnum sampov chaeng Kdar 27/01/12
147 Krong battambang chamkar samraong chamkar samraong Muoy 27/01/12
148 sangke ta Pon basaet 27/01/12
149 Moung Ruessei Prey touch Prey touch 28/01/12
150 sangke Kampong Pring Kach Roteh 28/01/12
151 aek Phnum Kaoh chiveang Kbal taol 29/01/12
152
PURSaT
bakan ou ta Paong ta nai 28/01/12
153 bakan ou ta Paong Phsar andaet 28/01/12
154 bakan Poeng bat Kandaol bat trach 28/01/12
155 Kandieng Kanhchor Phlov luong 28/01/12
156 Krakor Kampong luong Phum Muoy 28/01/12
157 KaMPONgCHHNaNg
baribour chhnok tru chhnok tru 29/01/12
158 Kampong tralach Kampong tralach Preaek Kanlang 29/01/12
159 Krong Kampong chhang Phsar chhang chong Kaoh 29/01/12
160 Rolea b’ier svay chrum thnal ta saeng 29/01/12
161 Kampong leaeng Kampong Hau stueng sandaek 29/01/12
162 Kampong leaeng trangel trapeang Meas 29/01/12
163 chol Kiri chol sar Ruessei Dangkuoch 29/01/12
164 chol Kiri Peam chhkaok Peam chhkaok 29/01/12
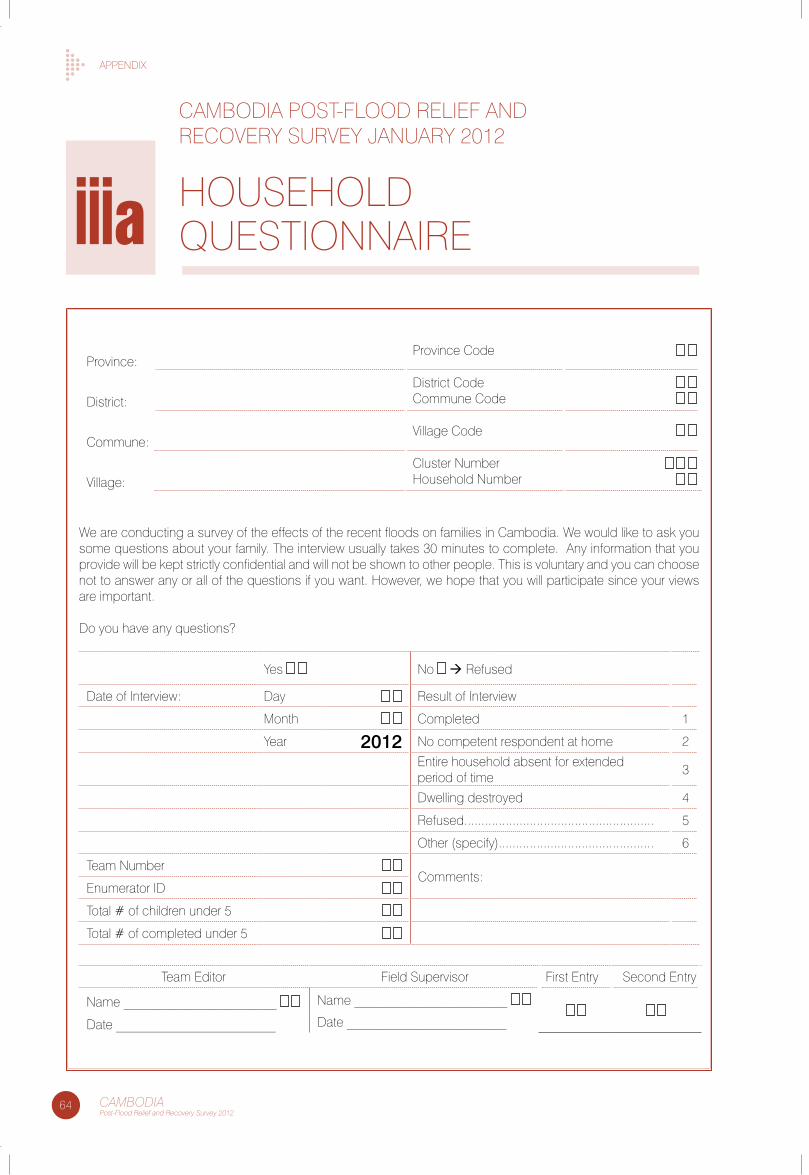
64 CAMBODIAPost-Flood Relief and Recovery Survey 2012
aPPenDIX
caMboDIa Post-flooD RelIef anD RecoVeRy sURVey JanUaRy 2012
HoUseHolD QUestIonnaIRe
Province:Province code
District:District code commune code
commune:Village code
Village:cluster numberHousehold number
yes no Refused
Date of Interview: Day Result of Interview
Month completed 1
year 2012 no competent respondent at home 2
entire household absent for extended period of time
3
Dwelling destroyed 4
Refused....................................................... 5
other (specify)............................................. 6
team number comments:
enumerator ID
total # of children under 5
total # of completed under 5
We are conducting a survey of the effects of the recent floods on families in cambodia. We would like to ask you some questions about your family. the interview usually takes 30 minutes to complete. any information that you provide will be kept strictly confidential and will not be shown to other people. this is voluntary and you can choose not to answer any or all of the questions if you want. However, we hope that you will participate since your views are important.
Do you have any questions?
team editor field supervisor first entry second entry
name _______________________ name _______________________
Date ________________________ Date ________________________
iiia
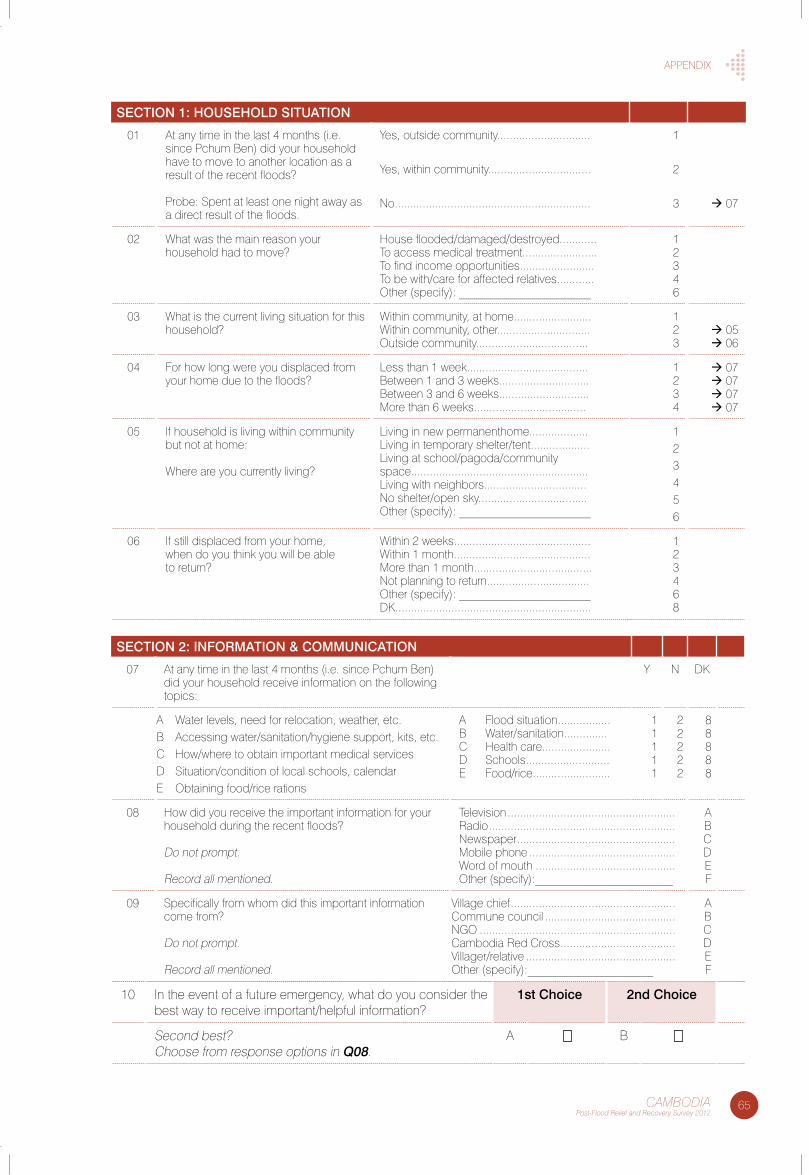
65CAMBODIAPost-Flood Relief and Recovery Survey 2012
aPPenDIX
SeCTION 1: HOUSeHOLD SITUaTION
01 at any time in the last 4 months (i.e. since Pchum ben) did your household have to move to another location as a result of the recent floods?
Probe: spent at least one night away as a direct result of the floods.
yes, outside community..............................
yes, within community.................................
no...............................................................
1
2
3 07
02 What was the main reason your household had to move?
House flooded/damaged/destroyed............to access medical treatment........................to find income opportunities........................to be with/care for affected relatives............other (specify): ______________________
12346
03 What is the current living situation for this household?
Within community, at home.........................Within community, other..............................outside community....................................
123
05 06
04 for how long were you displaced from your home due to the floods?
less than 1 week.......................................between 1 and 3 weeks.............................between 3 and 6 weeks.............................More than 6 weeks....................................
1234
07 07 07 07
05 If household is living within community but not at home:
Where are you currently living?
living in new permanenthome...................living in temporary shelter/tent...................living at school/pagoda/community space.........................................................living with neighbors.................................no shelter/open sky...................................other (specify): ______________________
123456
06 If still displaced from your home, when do you think you will be able to return?
Within 2 weeks............................................Within 1 month............................................More than 1 month......................................not planning to return.................................other (specify): ______________________DK...............................................................
123468
SeCTION 2: INFORMaTION & COMMUNICaTION
07 at any time in the last 4 months (i.e. since Pchum ben) did your household receive information on the following topics:
y n DK
a Water levels, need for relocation, weather, etc.b accessing water/sanitation/hygiene support, kits, etc.c How/where to obtain important medical servicesD situation/condition of local schools, calendare obtaining food/rice rations
a flood situation.................b Water/sanitation..............c Health care......................D schools...........................e food/rice.........................
11111
22222
88888
08 How did you receive the important information for your household during the recent floods?
Do not prompt.
Record all mentioned.
television ......................................................Radio ............................................................newspaper ...................................................Mobile phone ...............................................Word of mouth .............................................other (specify): _______________________
abcDef
09 specifically from whom did this important information come from?
Do not prompt.
Record all mentioned.
Village chief .....................................................commune council ..........................................nGo ...............................................................cambodia Red cross .....................................Villager/relative ................................................other (specify):_____________________
abcDef
10 In the event of a future emergency, what do you consider the best way to receive important/helpful information?
1st Choice 2nd Choice
second best?choose from response options in Q08.
a b
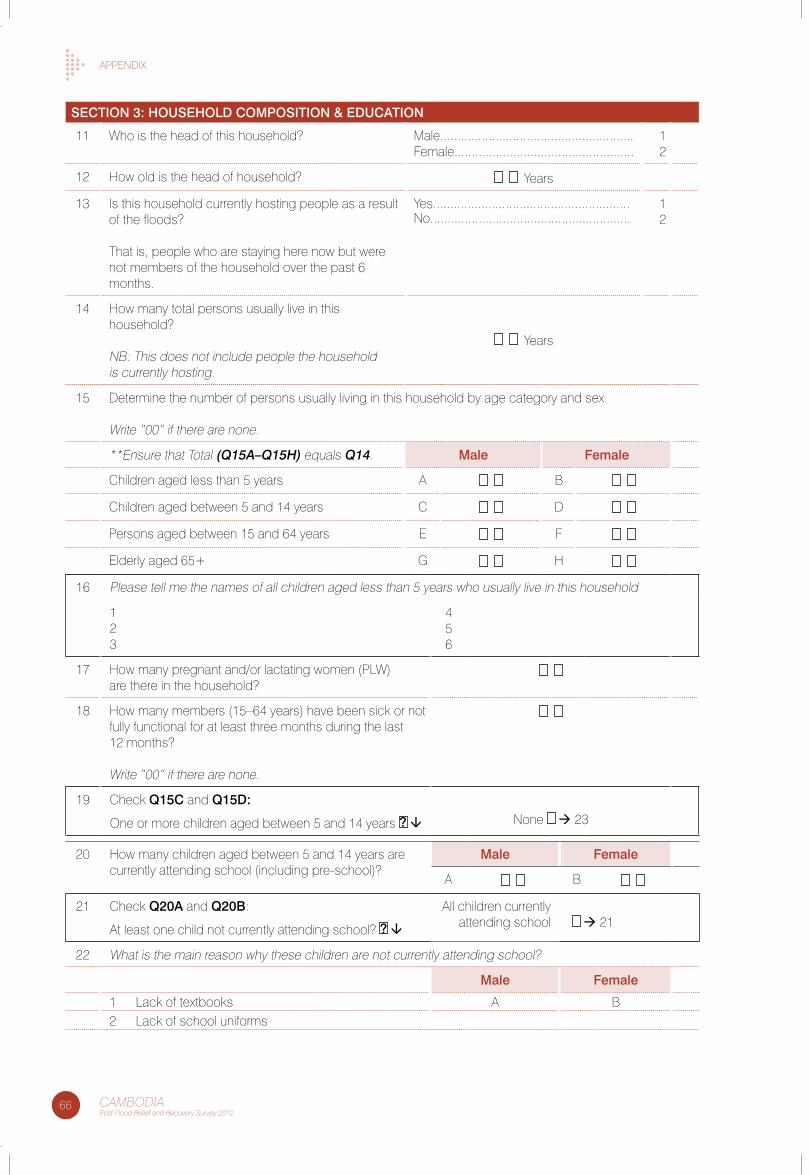
66 CAMBODIAPost-Flood Relief and Recovery Survey 2012
aPPenDIX
SeCTION 3: HOUSeHOLD COMPOSITION & eDUCaTION
11 Who is the head of this household? Male........................................................female....................................................
12
12 How old is the head of household? years
13 Is this household currently hosting people as a result of the floods?
that is, people who are staying here now but were not members of the household over the past 6 months.
yes.........................................................no..........................................................
12
14 How many total persons usually live in this household?
nb: this does not include people the household is currently hosting.
years
15 Determine the number of persons usually living in this household by age category and sex.
Write “00” if there are none.
**ensure that total (Q15a–Q15H) equals Q14. Male Female
children aged less than 5 years a b
children aged between 5 and 14 years c D
Persons aged between 15 and 64 years e f
elderly aged 65+ G H
16 Please tell me the names of all children aged less than 5 years who usually live in this household
123
456
17 How many pregnant and/or lactating women (PlW) are there in the household?
18 How many members (15–64 years) have been sick or not fully functional for at least three months during the last 12 months?
Write “00” if there are none.
19 check Q15C and Q15D:
one or more children aged between 5 and 14 years ? none 23
20 How many children aged between 5 and 14 years are currently attending school (including pre-school)?
Male Female
a b
21 check Q20a and Q20B:
at least one child not currently attending school? ?
all children currently attending school 21
22 What is the main reason why these children are not currently attending school?
Male Female
1 lack of textbooks a b2 lack of school uniforms
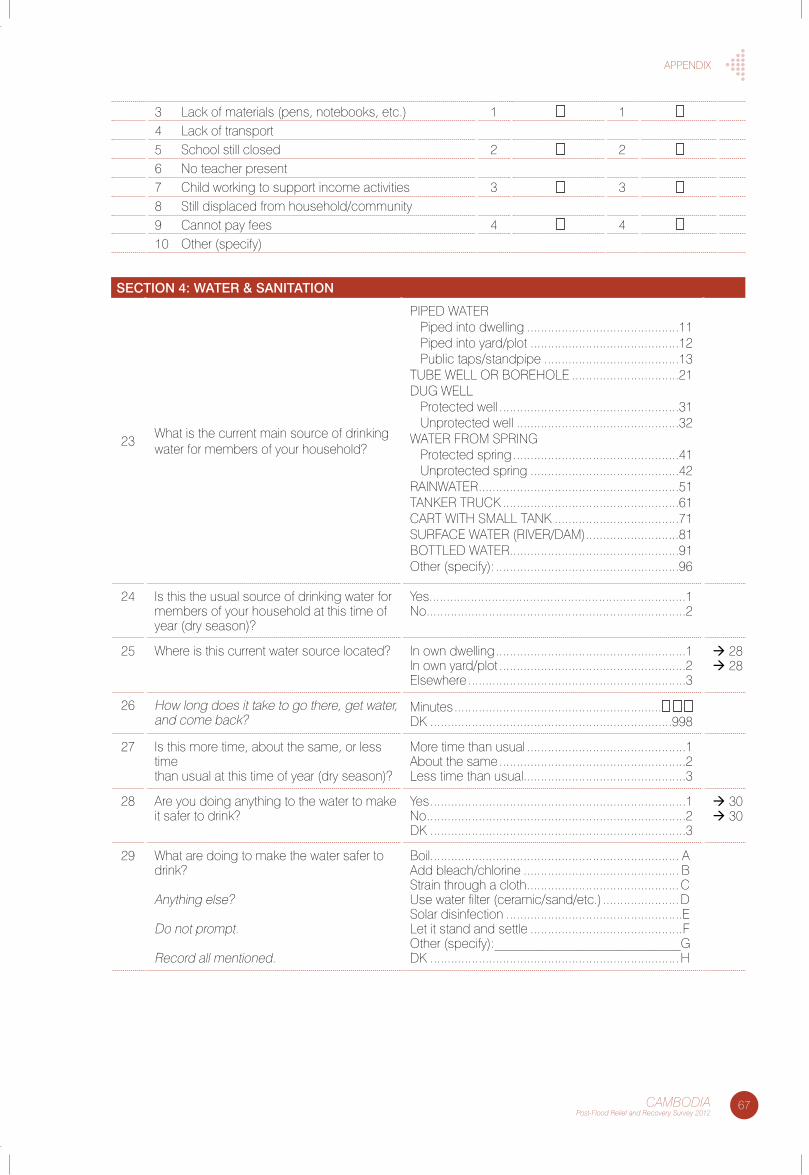
67CAMBODIAPost-Flood Relief and Recovery Survey 2012
aPPenDIX
3 lack of materials (pens, notebooks, etc.) 1 1 4 lack of transport5 school still closed 2 2 6 no teacher present7 child working to support income activities 3 3 8 still displaced from household/community9 cannot pay fees 4 4 10 other (specify)
SeCTION 4: WaTeR & SaNITaTION
23What is the current main source of drinking water for members of your household?
PIPeD WateR Piped into dwelling ............................................11 Piped into yard/plot ...........................................12 Public taps/standpipe .......................................13tUbe Well oR boReHole ...............................21DUG Well Protected well ....................................................31 Unprotected well ...............................................32WateR fRoM sPRInG Protected spring ................................................41 Unprotected spring ...........................................42RaInWateR ..........................................................51tanKeR tRUcK ...................................................61caRt WItH sMall tanK ....................................71sURface WateR (RIVeR/DaM) ...........................81bottleD WateR.................................................91other (specify): .....................................................96
24 Is this the usual source of drinking water for members of your household at this time of year (dry season)?
yes............................................................ ..............1no.......................................................... .................2
25 Where is this current water source located? In own dwelling .......................................................1In own yard/plot ......................................................2elsewhere ...............................................................3
28 28
26 How long does it take to go there, get water, and come back?
Minutes ............................................................ DK ......................................................................998
27 Is this more time, about the same, or less time than usual at this time of year (dry season)?
More time than usual ..............................................1about the same ......................................................2less time than usual...............................................3
28 are you doing anything to the water to make it safer to drink?
yes ..........................................................................1no ...........................................................................2DK ..........................................................................3
30 30
29 What are doing to make the water safer to drink?
anything else?
Do not prompt.
Record all mentioned.
boil........................................................................ aadd bleach/chlorine ............................................. bstrain through a cloth ............................................ cUse water filter (ceramic/sand/etc.) ......................Dsolar disinfection ...................................................elet it stand and settle ............................................fother (specify):____________________________GDK ........................................................................H
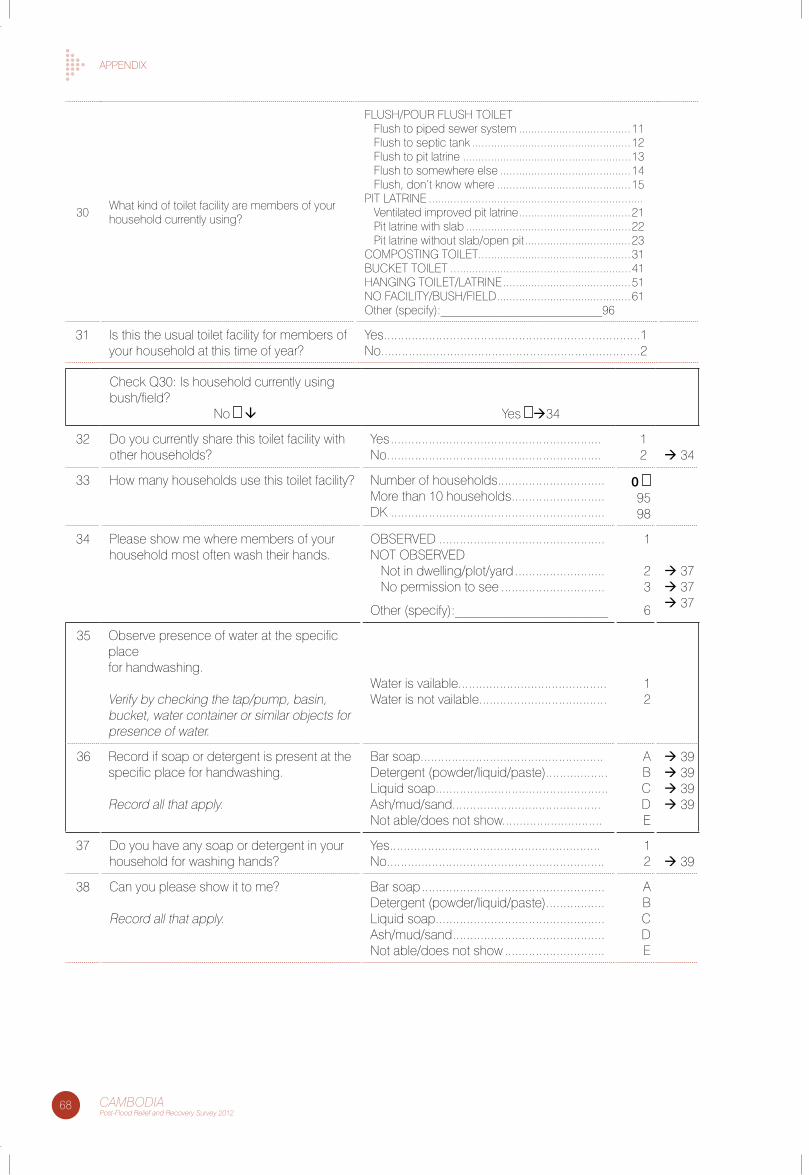
68 CAMBODIAPost-Flood Relief and Recovery Survey 2012
aPPenDIX
30 What kind of toilet facility are members of your household currently using?
flUsH/PoUR flUsH toIlet flush to piped sewer system ....................................11 flush to septic tank ...................................................12 flush to pit latrine ......................................................13 flush to somewhere else ..........................................14 flush, don’t know where ...........................................15PIt latRIne ..................................................................... Ventilated improved pit latrine ....................................21 Pit latrine with slab .....................................................22 Pit latrine without slab/open pit ..................................23coMPostInG toIlet .................................................31bUcKet toIlet ..........................................................41HanGInG toIlet/latRIne .........................................51no facIlIty/bUsH/fIelD ...........................................61other (specify):___________________________96
31 Is this the usual toilet facility for members of your household at this time of year?
yes............................................................ ..............1no.......................................................... .................2
check Q30: Is household currently using bush/field?
no yes 34
32 Do you currently share this toilet facility with other households?
yes .............................................................no ..............................................................
12 34
33 How many households use this toilet facility? number of households...............................More than 10 households ...........................DK ..............................................................
0 9598
34 Please show me where members of your household most often wash their hands.
obseRVeD ................................................not obseRVeD not in dwelling/plot/yard .......................... no permission to see ..............................
other (specify):_______________________
1
23
6
37 37 37
35 observe presence of water at the specific place for handwashing.
Verify by checking the tap/pump, basin, bucket, water container or similar objects for presence of water.
Water is vailable...........................................Water is not vailable.....................................
12
36 Record if soap or detergent is present at the specific place for handwashing.
Record all that apply.
bar soap.....................................................Detergent (powder/liquid/paste)..................liquid soap..................................................ash/mud/sand...........................................not able/does not show.............................
abcDe
39 39 39 39
37 Do you have any soap or detergent in your household for washing hands?
yes.............................................................no...............................................................
12 39
38 can you please show it to me?
Record all that apply.
bar soap .....................................................Detergent (powder/liquid/paste) .................liquid soap .................................................ash/mud/sand ............................................not able/does not show .............................
abcDe
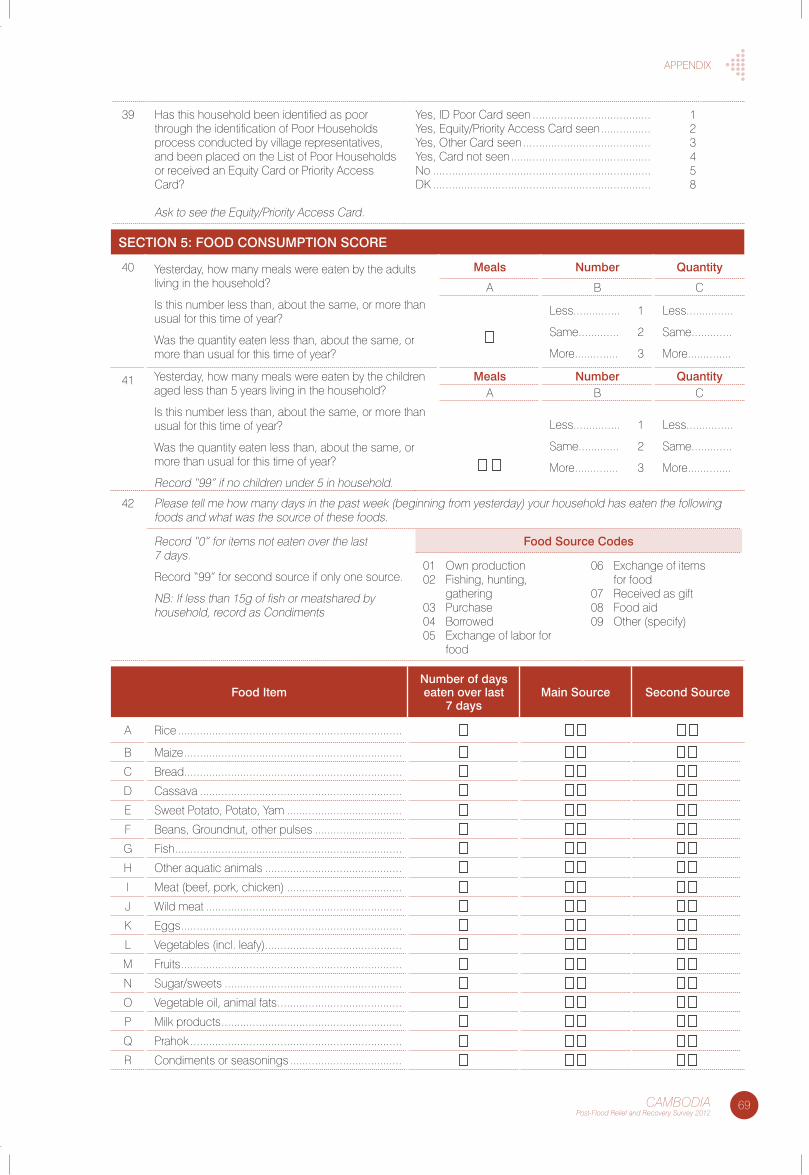
69CAMBODIAPost-Flood Relief and Recovery Survey 2012
aPPenDIX
39 Has this household been identified as poor through the identification of Poor Households process conducted by village representatives, and been placed on the list of Poor Households or received an equity card or Priority access card?
ask to see the equity/Priority access card.
yes, ID Poor card seen ......................................yes, equity/Priority access card seen ................yes, other card seen .........................................yes, card not seen .............................................no ......................................................................DK ......................................................................
123458
SeCTION 5: FOOD CONSUMPTION SCORe
40 yesterday, how many meals were eaten by the adults living in the household?
Is this number less than, about the same, or more than usual for this time of year?
Was the quantity eaten less than, about the same, or more than usual for this time of year?
Meals Number Quantity
a b c
less............... 1
same............. 2
More.............. 3
less...............
same.............
More..............
41 yesterday, how many meals were eaten by the children aged less than 5 years living in the household?
Is this number less than, about the same, or more than usual for this time of year?
Was the quantity eaten less than, about the same, or more than usual for this time of year?
Record “99” if no children under 5 in household.
Meals Number Quantitya b c
less............... 1
same............. 2
More.............. 3
less...............
same.............
More..............
42 Please tell me how many days in the past week (beginning from yesterday) your household has eaten the following foods and what was the source of these foods.
Record “0” for items not eaten over the last 7 days.
Record “99” for second source if only one source.
nb: If less than 15g of fish or meatshared by household, record as condiments
Food Source Codes
01 own production02 fishing, hunting,
gathering03 Purchase04 borrowed05 exchange of labor for
food
06 exchange of items for food
07 Received as gift08 food aid09 other (specify)
Food ItemNumber of days eaten over last
7 daysMain Source Second Source
a Rice ........................................................................
b Maize ...................................................................... c bread ...................................................................... D cassava ................................................................. e sweet Potato, Potato, yam ..................................... f beans, Groundnut, other pulses ............................ G fish ......................................................................... H other aquatic animals ............................................ I Meat (beef, pork, chicken) ..................................... J Wild meat ............................................................... K eggs ....................................................................... l Vegetables (incl. leafy) ............................................ M fruits ....................................................................... n sugar/sweets ......................................................... o Vegetable oil, animal fats ........................................ P Milk products .......................................................... Q Prahok .................................................................... R condiments or seasonings ....................................
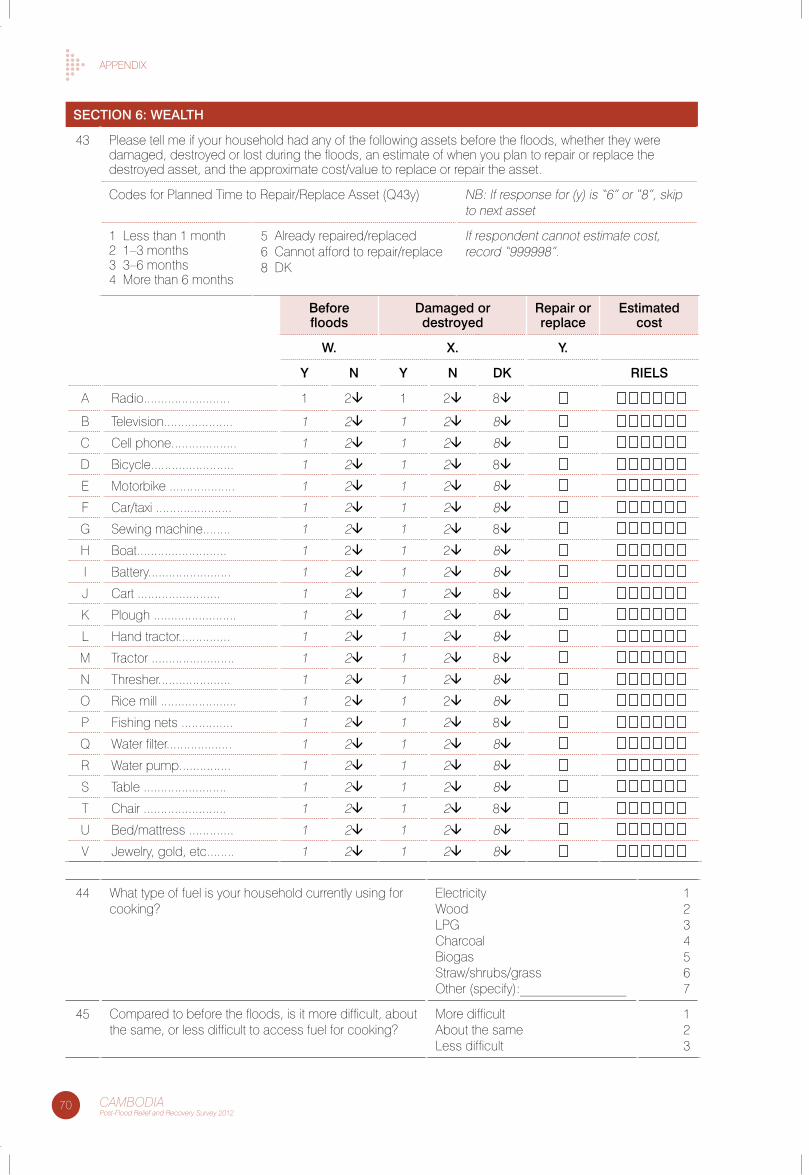
70 CAMBODIAPost-Flood Relief and Recovery Survey 2012
aPPenDIX
Before floods
Damaged or destroyed
Repair or replace
estimated cost
W. X. Y.
Y N Y N DK RIeLS
a Radio......................... 1 2 1 2 8
b television.................... 1 2 1 2 8
c cell phone................... 1 2 1 2 8
D bicycle........................ 1 2 1 2 8
e Motorbike ................... 1 2 1 2 8
f car/taxi ...................... 1 2 1 2 8
G sewing machine........ 1 2 1 2 8
H boat.......................... 1 2 1 2 8
I battery........................ 1 2 1 2 8
J cart ........................ 1 2 1 2 8
K Plough ........................ 1 2 1 2 8
l Hand tractor............... 1 2 1 2 8
M tractor ........................ 1 2 1 2 8
n thresher..................... 1 2 1 2 8
o Rice mill ...................... 1 2 1 2 8
P fishing nets ............... 1 2 1 2 8
Q Water filter................... 1 2 1 2 8
R Water pump............... 1 2 1 2 8
s table ........................ 1 2 1 2 8
t chair ........................ 1 2 1 2 8
U bed/mattress ............. 1 2 1 2 8
V Jewelry, gold, etc........ 1 2 1 2 8
SeCTION 6: WeaLTH
43 Please tell me if your household had any of the following assets before the floods, whether they were damaged, destroyed or lost during the floods, an estimate of when you plan to repair or replace the destroyed asset, and the approximate cost/value to replace or repair the asset.
codes for Planned time to Repair/Replace asset (Q43y) nb: If response for (y) is “6” or “8”, skip to next asset
1 less than 1 month2 1–3 months3 3–6 months4 More than 6 months
5 already repaired/replaced6 cannot afford to repair/replace8 DK
If respondent cannot estimate cost, record “999998”.
44 What type of fuel is your household currently using for cooking?
electricityWoodlPGcharcoalbiogasstraw/shrubs/grassother (specify):________________
1234567
45 compared to before the floods, is it more difficult, about the same, or less difficult to access fuel for cooking?
More difficultabout the sameless difficult
123
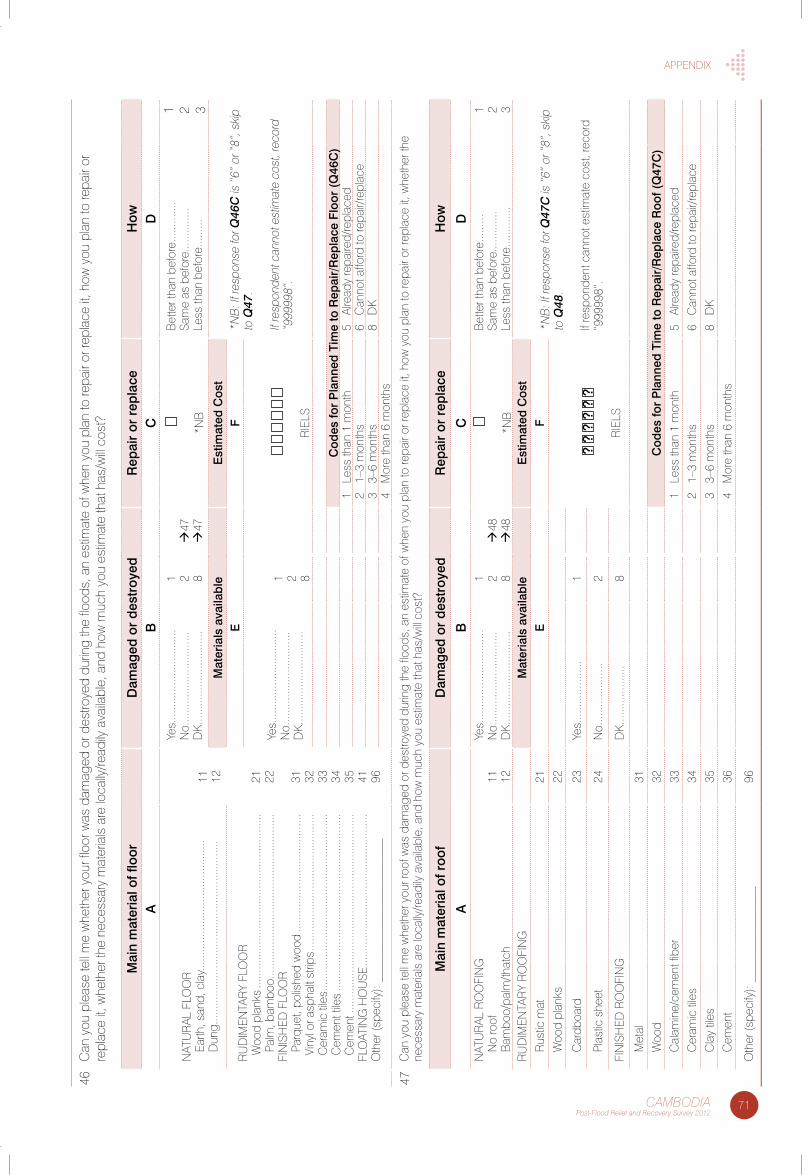
71CAMBODIAPost-Flood Relief and Recovery Survey 2012
aPPenDIX
46c
an y
ou p
leas
e te
ll m
e w
heth
er y
our f
loor
was
dam
aged
or d
estro
yed
durin
g th
e flo
ods,
an
estim
ate
of w
hen
you
plan
to re
pair
or re
plac
e it,
how
you
pla
n to
repa
ir or
re
plac
e it,
whe
ther
the
nece
ssar
y m
ater
ials
are
loca
lly/re
adily
ava
ilabl
e, a
nd h
ow m
uch
you
estim
ate
that
has
/will
cost
?
Mai
n m
ater
ial o
f flo
orD
amag
ed o
r d
estr
oyed
Rep
air
or r
epla
ceH
owa
BC
D
nat
UR
al f
loo
R
earth
, san
d, c
lay.
......
......
......
......
......
......
.....
D
ung.
......
......
......
......
......
......
......
......
......
....
11 12 21 22 31 32 33 34 35 41 96
yes.
......
......
......
......
.....
no.
......
......
......
......
.....
DK
......
......
......
......
......
1 2 8
47
47
*nb
bet
ter t
han
befo
re...
......
....
sam
e as
bef
ore.
......
......
.le
ss th
an b
efor
e....
.....
1 2 3M
ater
ials
ava
ilab
lee
stim
ated
Cos
t*n
b: I
f res
pons
e fo
r Q46
C is
“6”
or “
8”, s
kip
to Q
47.
If re
spon
dent
can
not e
stim
ate
cost
, rec
ord
“999
998”
.
RU
DIM
enta
Ry
flo
oR
Woo
d pl
anks
.....
......
......
......
......
......
......
......
......
...
Palm
, bam
boo .
......
......
......
......
......
......
......
......
....
fIn
IsH
eD f
loo
R
Parq
uet,
polis
hed
woo
d ...
......
......
......
......
......
.....
Vin
yl o
r asp
halt
strip
s ....
......
......
......
......
......
......
....
cer
amic
tile
s ....
......
......
......
......
......
......
......
......
.....
cem
ent t
iles
......
......
......
......
......
......
......
......
......
... c
emen
t ....
......
......
......
......
......
......
......
......
......
......
flo
atIn
G H
oU
se ...
......
......
......
......
......
......
......
....
oth
er (s
peci
fy):
____
____
____
____
____
____
eF
yes.
......
......
......
......
.....
no.
......
......
......
......
.....
DK
......
......
......
......
......
1 2 8
RIe
ls
Cod
es fo
r P
lann
ed T
ime
to R
epai
r/R
epla
ce F
loor
(Q
46C
)1
les
s th
an 1
mon
th5
alre
ady
repa
ired/
repl
aced
2 1
–3 m
onth
s6
can
not a
fford
to re
pair/
repl
ace
3 3
–6 m
onth
s8
DK
4 M
ore
than
6 m
onth
s
47c
an y
ou p
leas
e te
ll m
e w
heth
er y
our r
oof w
as d
amag
ed o
r des
troye
d du
ring
the
flood
s, a
n es
timat
e of
whe
n yo
u pl
an to
repa
ir or
repl
ace
it, h
ow y
ou p
lan
to re
pair
or re
plac
e it,
whe
ther
the
nece
ssar
y m
ater
ials
are
loca
lly/re
adily
ava
ilabl
e, a
nd h
ow m
uch
you
estim
ate
that
has
/will
cost
?
Mai
n m
ater
ial o
f roo
fD
amag
ed o
r d
estr
oyed
Rep
air
or r
epla
ceH
ow
aB
CD
nat
UR
al R
oo
fIn
G
no
roof
b
ambo
o/pa
lm/th
atch
11 12
yes.
......
......
......
......
.....
no.
......
......
......
......
.....
DK
......
......
......
......
......
1 2 8
48
48
*nb
bet
ter t
han
befo
re...
......
sam
e as
bef
ore.
......
......
less
than
bef
ore.
......
......
1 2 3R
UD
IMen
taR
y R
oo
fIn
GM
ater
ials
ava
ilab
lee
stim
ated
Cos
t
*nb
: If r
espo
nse
for Q
47C
is “
6” o
r “8”
, ski
p to
Q48
.
If re
spon
dent
can
not e
stim
ate
cost
, rec
ord
“999
998”
.
R
ustic
mat
21e
F
Woo
d pl
anks
22
? ?
? ?
? ?
RIe
ls
c
ardb
oard
23ye
s....
......
......
....
1
Pl
astic
she
et24
no.
......
......
......
.2
fIn
IsH
eD R
oo
fIn
GD
K...
......
......
....
8
M
etal
31
Woo
d32
Cod
es fo
r P
lann
ed T
ime
to R
epai
r/R
epla
ce R
oof (
Q47
C)
c
alam
ine/
cem
ent f
iber
331
les
s th
an 1
mon
th5
alre
ady
repa
ired/
repl
aced
c
eram
ic ti
les
342
1–3
mon
ths
6 c
anno
t affo
rd to
repa
ir/re
plac
e
cla
y tile
s35
3 3
–6 m
onth
s8
DK
c
emen
t36
4 M
ore
than
6 m
onth
s
oth
er (s
peci
fy):
____
____
____
____
96
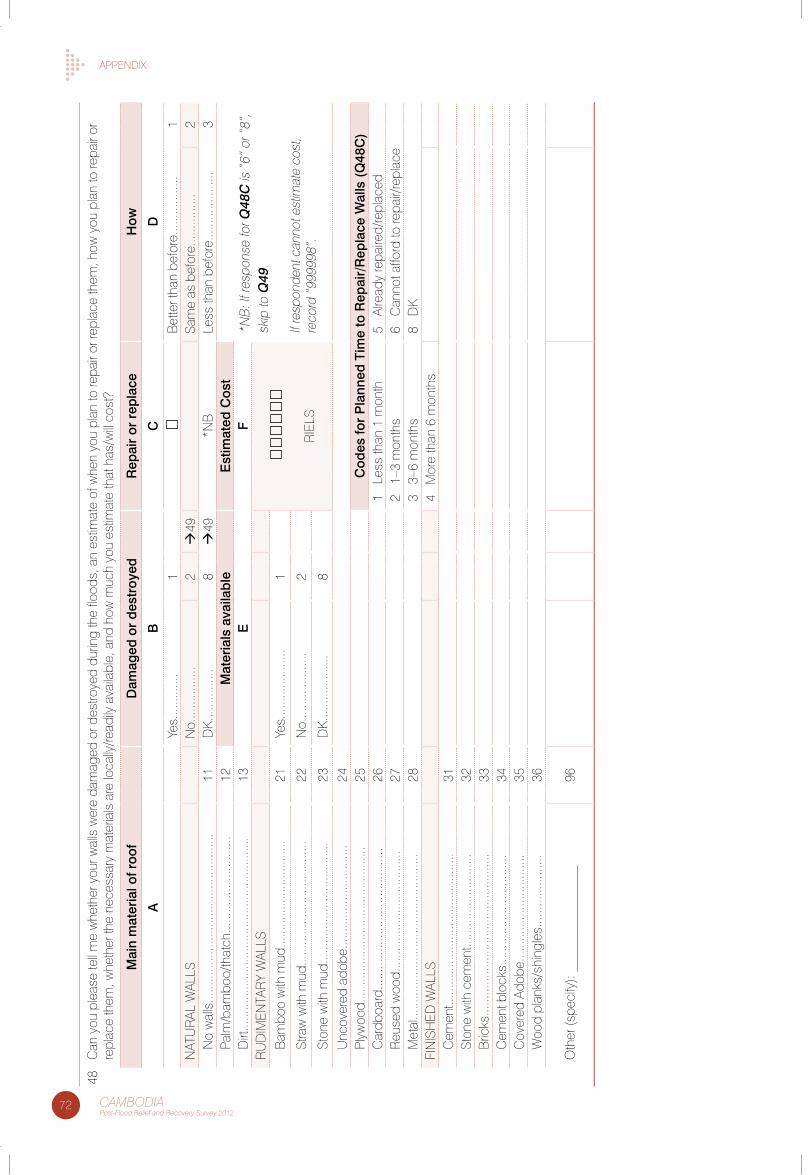
72 CAMBODIAPost-Flood Relief and Recovery Survey 2012
aPPenDIX
48c
an y
ou p
leas
e te
ll m
e w
heth
er y
our w
alls
wer
e da
mag
ed o
r des
troye
d du
ring
the
flood
s, a
n es
timat
e of
whe
n yo
u pl
an to
repa
ir or
repl
ace
them
, how
you
pla
n to
repa
ir or
re
plac
e th
em, w
heth
er th
e ne
cess
ary
mat
eria
ls a
re lo
cally
/read
ily a
vaila
ble,
and
how
muc
h yo
u es
timat
e th
at h
as/w
ill co
st?
Mai
n m
ater
ial o
f roo
fD
amag
ed o
r d
estr
oyed
Rep
air
or r
epla
ceH
ow
aB
CD
yes.
......
......
1
bet
ter t
han
befo
re...
......
......
..1
nat
UR
al W
alls
no.
......
......
...2
49
sam
e as
bef
ore.
......
......
..2
n
o w
alls
......
......
......
......
......
......
......
......
.11
DK
......
......
...8
49
*nb
less
than
bef
ore.
......
......
......
.3
Pa
lm/b
ambo
o/th
atch
......
......
......
......
....
12M
ater
ials
ava
ilab
lee
stim
ated
Cos
t*n
b: I
f res
pons
e fo
r Q48
C is
“6”
or “
8”,
skip
to Q
49.
If re
spon
dent
can
not e
stim
ate
cost
, re
cord
“99
9998
”.
D
irt...
......
......
......
......
......
......
......
......
.....
13e
FR
UD
IMen
taR
y W
alls
RIe
ls
b
ambo
o w
ith m
ud...
......
......
......
......
....
21ye
s....
......
......
....
1
st
raw
with
mud
......
......
......
......
......
......
22n
o....
......
......
....
2
st
one
with
mud
......
......
......
......
......
.....
23D
K...
......
......
....
8
Unc
over
ed a
dobe
......
......
......
......
......
24
Plyw
ood.
......
......
......
......
......
......
......
..25
Cod
es fo
r P
lann
ed T
ime
to R
epai
r/R
epla
ce W
alls
(Q
48C
)
car
dboa
rd...
......
......
......
......
......
......
..26
1 l
ess
than
1 m
onth
5 a
lread
y re
paire
d/re
plac
ed
Reu
sed
woo
d....
......
......
......
......
......
.27
2 1
–3 m
onth
s6
can
not a
fford
to re
pair/
repl
ace
M
etal
......
......
......
......
......
......
......
......
283
3–6
mon
ths
8 D
KfI
nIs
HeD
Wal
ls4
Mor
e th
an 6
mon
ths
c
emen
t.....
......
......
......
......
......
......
...31
st
one
with
cem
ent..
......
......
......
......
.32
b
ricks
......
......
......
......
......
......
......
.....
33
cem
ent b
lock
s....
......
......
......
......
....
34
cov
ered
ado
be...
......
......
......
......
....
35
Woo
d pl
anks
/shi
ngle
s....
......
......
.....
36
oth
er (s
peci
fy):
____
____
____
____
96
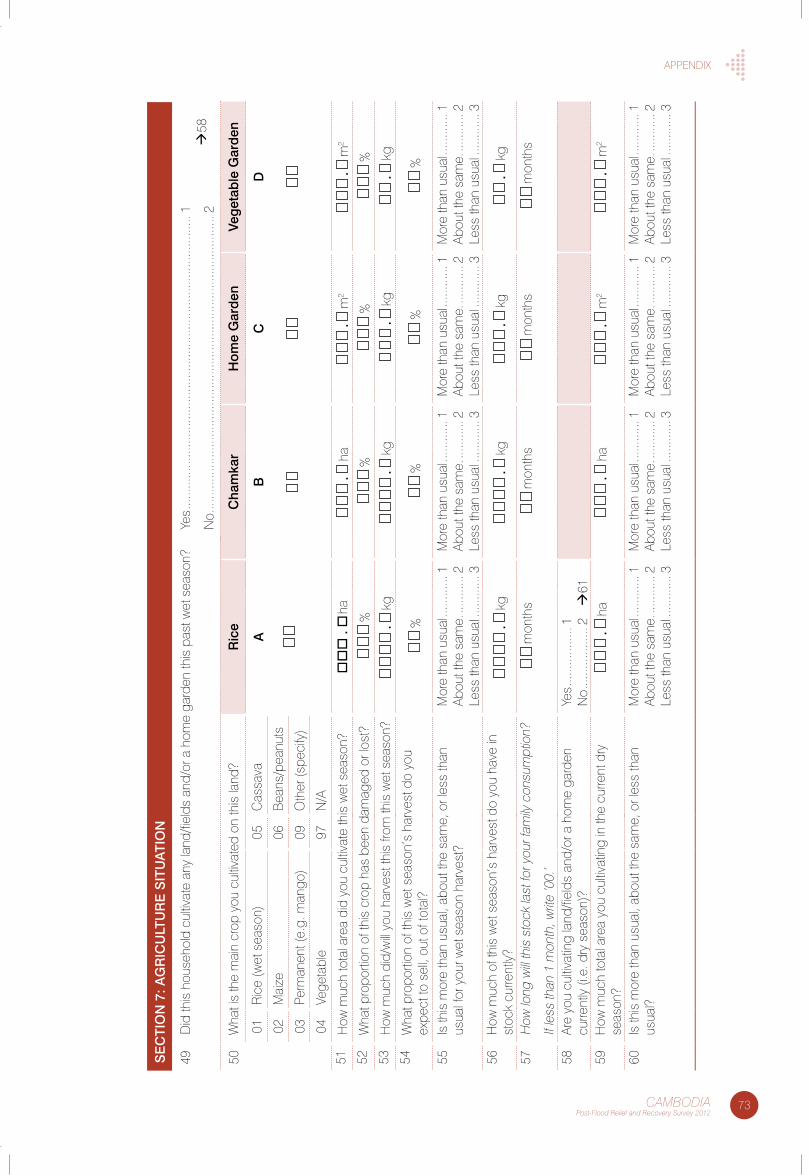
73CAMBODIAPost-Flood Relief and Recovery Survey 2012
aPPenDIX
50W
hat i
s th
e m
ain
crop
you
cul
tivat
ed o
n th
is la
nd?
Ric
eC
ham
kar
Hom
e g
ard
enVe
get
able
gar
den
01R
ice
(wet
sea
son)
05c
assa
vaa
B
C
D
02M
aize
06b
eans
/pea
nuts
03Pe
rman
ent (
e.g.
man
go)
09o
ther
(spe
cify
)
04Ve
geta
ble
97n
/a51
How
muc
h to
tal a
rea
did
you
cultiv
ate
this
wet
sea
son?
.
ha
.
ha
.
m2
.
m
2
52W
hat p
ropo
rtion
of t
his
crop
has
bee
n da
mag
ed o
r los
t?
%
%
%
%53
How
muc
h di
d/w
ill yo
u ha
rves
t thi
s fro
m th
is w
et s
easo
n?
.
kg
.
kg
.
kg
.
kg
54W
hat p
ropo
rtion
of t
his
wet
sea
son’
s ha
rves
t do
you
expe
ct to
sel
l, ou
t of t
otal
?
%
%
%
%
55Is
this
mor
e th
an u
sual
, abo
ut th
e sa
me,
or l
ess
than
us
ual f
or y
our w
et s
easo
n ha
rves
t?M
ore
than
usu
al ..
......
....1
abou
t the
sam
e. ..
......
...2
less
than
usu
al ..
......
....3
Mor
e th
an u
sual
.....
......
.1ab
out t
he s
ame.
.....
......
2le
ss th
an u
sual
.....
......
.3
Mor
e th
an u
sual
.....
......
.1ab
out t
he s
ame.
.....
......
2le
ss th
an u
sual
.....
......
.3
Mor
e th
an u
sual
.....
......
.1ab
out t
he s
ame.
.....
......
2le
ss th
an u
sual
.....
......
.356
How
muc
h of
this
wet
sea
son’
s ha
rves
t do
you
have
in
stoc
k cu
rrent
ly?
.
kg
.
kg
.
kg
.
kg
57H
ow lo
ng w
ill th
is s
tock
last
for y
our f
amily
con
sum
ptio
n?
If le
ss th
an 1
mon
th, w
rite
’00.
’
mon
ths
mon
ths
mon
ths
mon
ths
58ar
e yo
u cu
ltivat
ing
land
/fiel
ds a
nd/o
r a h
ome
gard
en
curre
ntly
(i.e
. dry
sea
son)
?ye
s ....
......
......
.1n
o ....
......
......
..2
6159
How
muc
h to
tal a
rea
you
cultiv
atin
g in
the
curre
nt d
ry
seas
on?
.
ha
.
ha
.
m
2
.
m2
60Is
this
mor
e th
an u
sual
, abo
ut th
e sa
me,
or l
ess
than
us
ual?
Mor
e th
an u
sual
.....
......
.1ab
out t
he s
ame.
.....
......
2le
ss th
an u
sual
.....
......
.3
Mor
e th
an u
sual
.....
......
.1ab
out t
he s
ame.
.....
......
2le
ss th
an u
sual
.....
......
.3
Mor
e th
an u
sual
.....
......
.1ab
out t
he s
ame.
.....
......
2le
ss th
an u
sual
.....
......
.3
Mor
e th
an u
sual
.....
......
.1ab
out t
he s
ame.
.....
......
2le
ss th
an u
sual
.....
......
.3
Se
CTI
ON
7: a
gR
ICU
LTU
Re
SIT
Ua
TIO
N
49D
id th
is h
ouse
hold
cul
tivat
e an
y la
nd/fi
elds
and
/or a
hom
e ga
rden
this
pas
t wet
sea
son?
yes .
......
......
......
......
......
......
......
......
......
......
......
......
......
......
1
no .
......
......
......
......
......
......
......
......
......
......
......
......
......
......
.2
58
74 CAMBODIAPost-Flood Relief and Recovery Survey 2012
aPPenDIX
61 How much of stock rice seed do you have for next wet season?
. kg
62 Is this more than usual, about the same, or less than usual?
More than usual..............................about the same............................less than usual...................................
123
63 What kind of seed storage system was this household using before the floods?
traditional........................................Plastic bags....................................Plastic container with lid......................Metallic silo.......................................none....................................................
12345
64 Did you have access to water for irrigation before the floods?
yes........................................................no...........................................................
12 67
65 What kinds did you have access to?
Do not prompt. Record all mentioned.
Private ponds........................................community ponds...................................Irrigation canals.......................................River.....................................................other (specify): ______________________
abcDe
66 Were these irrigation sources damaged or destroyed during the floods?
yes........................................................no.....................................................DK........................................................
128
67 Do you currently have access to water for irrigation?
yes........................................................no.....................................................DK........................................................
128
Action Aid/Savann Oeurm/2011.
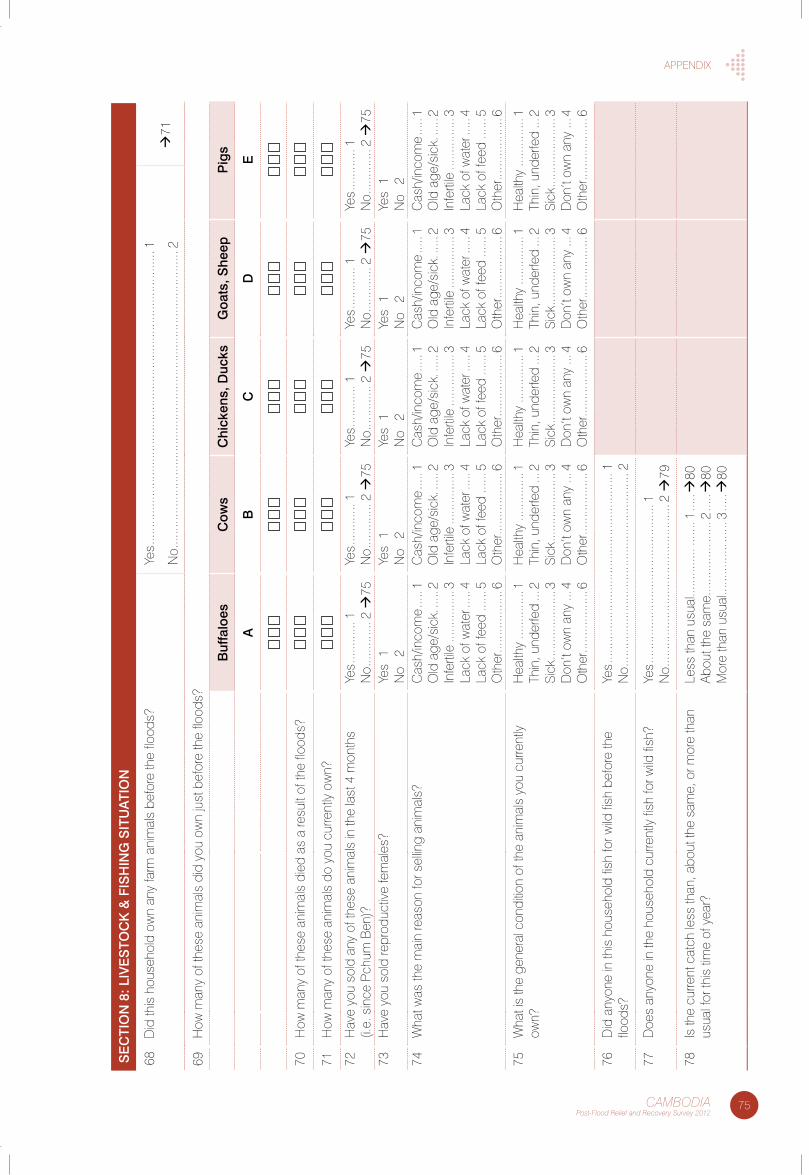
75CAMBODIAPost-Flood Relief and Recovery Survey 2012
aPPenDIX
Se
CTI
ON
8: L
IVe
STO
CK
& F
ISH
INg
SIT
Ua
TIO
N
68D
id th
is h
ouse
hold
ow
n an
y fa
rm a
nim
als
befo
re th
e flo
ods?
yes .
......
......
......
......
......
......
......
......
......
......
......
......
......
......
1
no .
......
......
......
......
......
......
......
......
......
......
......
......
......
......
.2
71
69H
ow m
any
of th
ese
anim
als
did
you
own
just
bef
ore
the
flood
s?
Buf
falo
esC
ows
Chi
cken
s, D
ucks
goa
ts, S
heep
Pig
s
aB
CD
e
70H
ow m
any
of th
ese
anim
als
died
as
a re
sult
of th
e flo
ods?
71H
ow m
any
of th
ese
anim
als
do y
ou c
urre
ntly
ow
n?
72H
ave
you
sold
any
of t
hese
ani
mal
s in
the
last
4 m
onth
s
(i.e.
sin
ce P
chum
ben
)?ye
s ....
......
..1
no .
......
......
2
75ye
s ....
......
..1
no .
......
......
2
75ye
s ....
......
..1
no .
......
......
2
75ye
s ....
......
..1
no .
......
......
2
75ye
s ....
......
..1
no .
......
......
2
7573
Hav
e yo
u so
ld re
prod
uctiv
e fe
mal
es?
yes
1 n
o 2
yes
1 n
o 2
yes
1 n
o 2
yes
1 n
o 2
yes
1 n
o 2
74W
hat w
as th
e m
ain
reas
on fo
r sel
ling
anim
als?
cas
h/in
com
e ...
..1
old
age
/sic
k. ..
...2
Infe
rtile
.....
......
....3
lack
of w
ater
.....
4la
ck o
f fee
d ...
...5
oth
er...
......
......
...6
cas
h/in
com
e ...
..1
old
age
/sic
k. ..
...2
Infe
rtile
.....
......
....3
lack
of w
ater
.....
4la
ck o
f fee
d ...
...5
oth
er...
......
......
...6
cas
h/in
com
e ...
..1
old
age
/sic
k. ..
...2
Infe
rtile
.....
......
....3
lack
of w
ater
.....
4la
ck o
f fee
d ...
...5
oth
er...
......
......
...6
cas
h/in
com
e ...
..1
old
age
/sic
k. ..
...2
Infe
rtile
.....
......
....3
lack
of w
ater
.....
4la
ck o
f fee
d ...
...5
oth
er...
......
......
...6
cas
h/in
com
e ...
..1
old
age
/sic
k. ..
...2
Infe
rtile
.....
......
....3
lack
of w
ater
.....
4la
ck o
f fee
d ...
...5
oth
er...
......
......
...6
75W
hat i
s th
e ge
nera
l con
ditio
n of
the
anim
als
you
curre
ntly
ow
n?H
ealth
y ...
......
.....
1th
in, u
nder
fed
...2
sick
......
......
......
..3
Don
’t ow
n an
y ...
4o
ther
......
......
......
6
Hea
lthy
......
......
..1
thin
, und
erfe
d ...
2si
ck ...
......
......
.....
3D
on’t
own
any
...4
oth
er...
......
......
...6
Hea
lthy
......
......
..1
thin
, und
erfe
d ...
2si
ck ...
......
......
.....
3D
on’t
own
any
...4
oth
er...
......
......
...6
Hea
lthy
......
......
..1
thin
, und
erfe
d ...
2si
ck ...
......
......
.....
3D
on’t
own
any
...4
oth
er...
......
......
...6
Hea
lthy
......
......
..1
thin
, und
erfe
d ...
2si
ck ...
......
......
.....
3D
on’t
own
any
...4
oth
er...
......
......
...6
76D
id a
nyon
e in
this
hou
seho
ld fi
sh fo
r wild
fish
bef
ore
the
flood
s?ye
s ....
......
......
......
......
......
......
......
......
...1
no .
......
......
......
......
......
......
......
......
......
.2
77D
oes
anyo
ne in
the
hous
ehol
d cu
rrent
ly fi
sh fo
r wild
fish
?ye
s ....
......
......
......
......
......
......
......
1n
o ....
......
......
......
......
......
......
......
.2
79
78Is
the
curre
nt c
atch
less
than
, abo
ut th
e sa
me,
or m
ore
than
us
ual f
or th
is ti
me
of y
ear?
less
than
usu
al...
......
.....
......
.1 ..
...
80ab
out t
he s
ame.
......
......
.. ...
...2
.....
80M
ore
than
usu
al...
......
......
.....
.3 ..
...
80
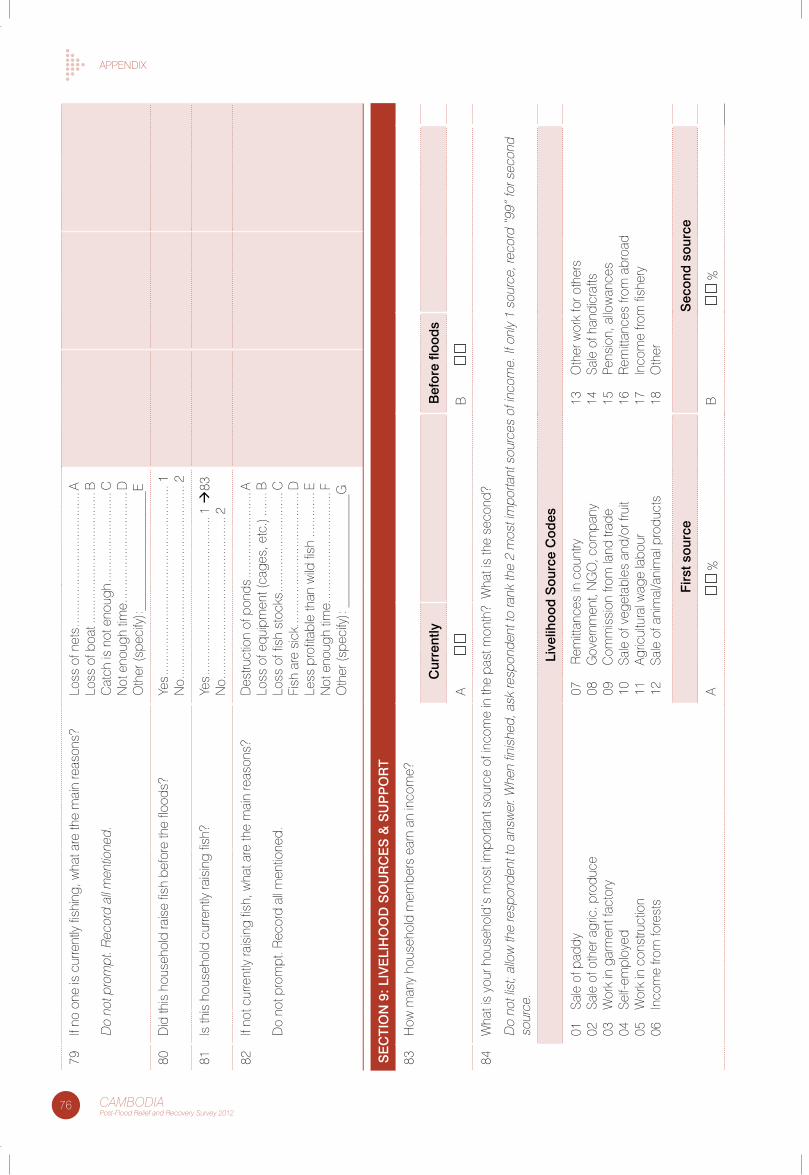
76 CAMBODIAPost-Flood Relief and Recovery Survey 2012
aPPenDIX79
If no
one
is c
urre
ntly
fish
ing,
wha
t are
the
mai
n re
ason
s?
Do
not p
rom
pt. R
ecor
d al
l men
tione
d.
loss
of n
ets .
......
......
......
......
......
......
..a
loss
of b
oat .
......
......
......
......
......
......
.bc
atch
is n
ot e
noug
h ...
......
......
......
.....
cn
ot e
noug
h tim
e ....
......
......
......
......
....D
oth
er (s
peci
fy):_
____
____
____
____
_e
80D
id th
is h
ouse
hold
rais
e fis
h be
fore
the
flood
s?ye
s ....
......
......
......
......
......
......
......
......
...1
no .
......
......
......
......
......
......
......
......
......
.2
81Is
this
hou
seho
ld c
urre
ntly
rais
ing
fish?
yes .
......
......
......
......
......
......
......
...1
83n
o ....
......
......
......
......
......
......
......
.2
82If
not c
urre
ntly
rais
ing
fish,
wha
t are
the
mai
n re
ason
s?
Do
not p
rom
pt. R
ecor
d al
l men
tione
d.
Des
truct
ion
of p
onds
......
......
......
......
.alo
ss o
f equ
ipm
ent (
cage
s, e
tc.)
......
.blo
ss o
f fis
h st
ocks
......
......
......
......
.....
cfi
sh a
re s
ick .
......
......
......
......
......
......
..D
less
pro
fitab
le th
an w
ild fi
sh ..
......
.....
en
ot e
noug
h tim
e. ...
......
......
......
......
....f
oth
er (s
peci
fy):
____
____
____
____
_G
Se
CTI
ON
9: L
IVe
LIH
OO
D S
OU
RC
eS
& S
UP
PO
RT
83H
ow m
any
hous
ehol
d m
embe
rs e
arn
an in
com
e?
Cur
rent
lyB
efor
e flo
ods
a
b
84W
hat i
s yo
ur h
ouse
hold
’s m
ost i
mpo
rtant
sou
rce
of in
com
e in
the
past
mon
th?
Wha
t is
the
seco
nd?
Do
not l
ist;
allo
w th
e re
spon
dent
to a
nsw
er. W
hen
finis
hed,
ask
resp
onde
nt to
rank
the
2 m
ost i
mpo
rtant
sou
rces
of i
ncom
e. If
onl
y 1
sour
ce, r
ecor
d “9
9” fo
r sec
ond
sour
ce.
Live
lihoo
d S
ourc
e C
odes
01
sale
of p
addy
02
sale
of o
ther
agr
ic. p
rodu
ce03
W
ork
in g
arm
ent f
acto
ry04
se
lf-em
ploy
ed05
W
ork
in c
onst
ruct
ion
06
Inco
me
from
fore
sts
07
Rem
ittan
ces
in c
ount
ry08
G
over
nmen
t, n
Go
, com
pany
09
com
mis
sion
from
land
trad
e10
sa
le o
f veg
etab
les
and/
or fr
uit
11
agric
ultu
ral w
age
labo
ur12
sa
le o
f ani
mal
/ani
mal
pro
duct
s
13
oth
er w
ork
for o
ther
s14
sa
le o
f han
dicr
afts
15
Pens
ion,
allo
wan
ces
16
Rem
ittan
ces
from
abr
oad
17
Inco
me
from
fish
ery
18
oth
er
Firs
t sou
rce
Sec
ond
sou
rce
a
%
b
%
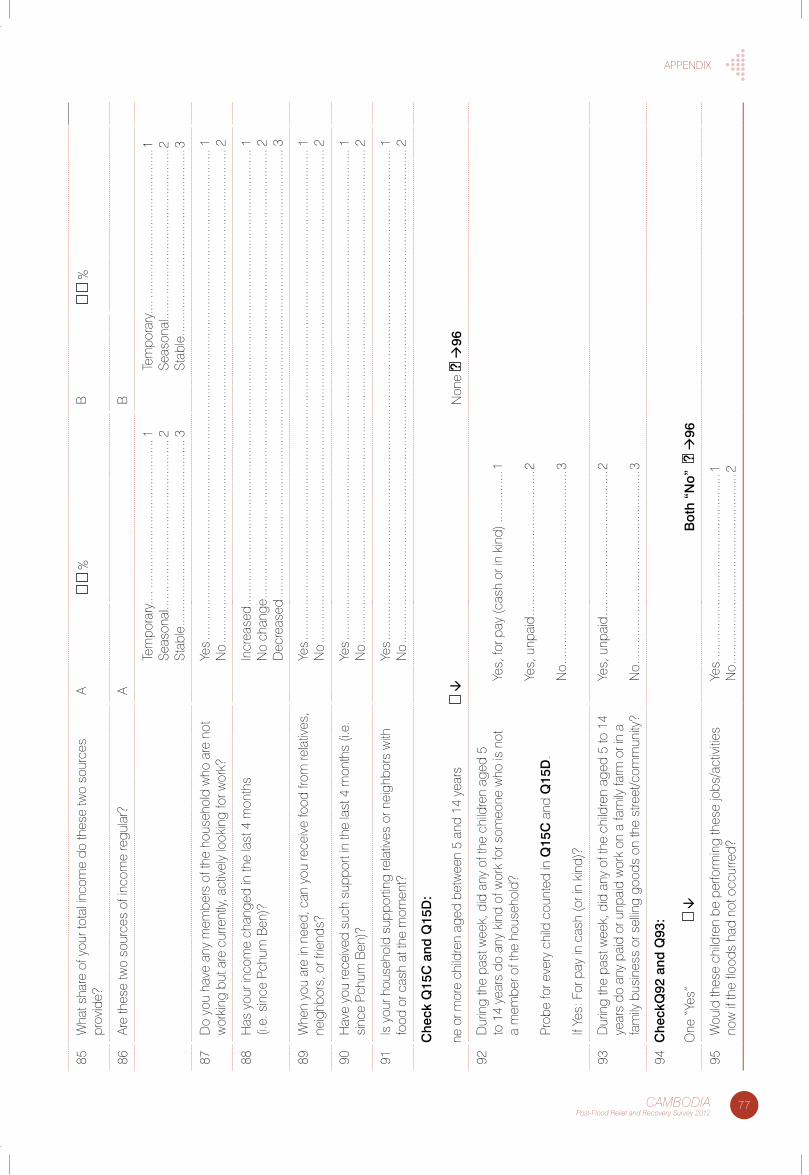
77CAMBODIAPost-Flood Relief and Recovery Survey 2012
aPPenDIX85
Wha
t sha
re o
f you
r tot
al in
com
e do
thes
e tw
o so
urce
s pr
ovid
e?a
%b
%
86ar
e th
ese
two
sour
ces
of in
com
e re
gula
r?a
b
tem
pora
ry...
. ....
......
......
......
......
......
......
...1
seas
onal
......
. .....
......
......
......
......
......
......
.2st
able
......
......
......
......
......
......
......
......
......
3
tem
pora
ry...
. ....
......
......
......
......
......
......
...1
seas
onal
......
. .....
......
......
......
......
......
......
.2st
able
......
......
......
......
......
......
......
......
......
3
87D
o yo
u ha
ve a
ny m
embe
rs o
f the
hou
seho
ld w
ho a
re n
ot
wor
king
but
are
cur
rent
ly, a
ctiv
ely
look
ing
for w
ork?
yes .
......
......
......
......
......
......
......
......
......
......
......
......
......
......
......
......
......
......
......
......
......
......
......
...1
no
......
......
......
......
......
......
......
......
......
......
......
......
......
......
......
......
......
......
......
......
......
......
......
.....
2
88H
as y
our i
ncom
e ch
ange
d in
the
last
4 m
onth
s (i.
e. s
ince
Pch
um b
en)?
Incr
ease
d ...
......
......
......
......
......
......
......
......
......
......
......
......
......
......
......
......
......
......
......
......
......
...1
no
chan
ge ...
......
......
......
......
......
......
......
......
......
......
......
......
......
......
......
......
......
......
......
......
......
.2D
ecre
ased
......
......
......
......
......
......
......
......
......
......
......
......
......
......
......
......
......
......
......
......
......
....3
89W
hen
you
are
in n
eed,
can
you
rece
ive
food
from
rela
tives
, ne
ighb
ors,
or f
riend
s?ye
s ....
......
......
......
......
......
......
......
......
......
......
......
......
......
......
......
......
......
......
......
......
......
......
......
1n
o ...
......
......
......
......
......
......
......
......
......
......
......
......
......
......
......
......
......
......
......
......
......
......
......
..2
90H
ave
you
rece
ived
suc
h su
ppor
t in
the
last
4 m
onth
s (i.
e.
sinc
e Pc
hum
ben
)?ye
s ....
......
......
......
......
......
......
......
......
......
......
......
......
......
......
......
......
......
......
......
......
......
......
......
1n
o ...
......
......
......
......
......
......
......
......
......
......
......
......
......
......
......
......
......
......
......
......
......
......
......
..2
91Is
you
r hou
seho
ld s
uppo
rting
rela
tives
or n
eigh
bors
with
fo
od o
r cas
h at
the
mom
ent?
yes .
......
......
......
......
......
......
......
......
......
......
......
......
......
......
......
......
......
......
......
......
......
......
......
...1
no
......
......
......
......
......
......
......
......
......
......
......
......
......
......
......
......
......
......
......
......
......
......
......
.....
2
Che
ck Q
15C
and
Q15
D:
ne o
r mor
e ch
ildre
n ag
ed b
etw
een
5 an
d 14
yea
rs
non
e ?
96
92D
urin
g th
e pa
st w
eek,
did
any
of t
he c
hild
ren
aged
5
to 1
4 ye
ars
do a
ny k
ind
of w
ork
for s
omeo
ne w
ho is
not
a
mem
ber o
f the
hou
seho
ld?
Prob
e fo
r eve
ry c
hild
cou
nted
in Q
15C
and
Q15
D.
If ye
s: f
or p
ay in
cas
h (o
r in
kind
)?
yes,
for p
ay (c
ash
or in
kin
d) ..
......
......
.1
yes,
unp
aid
......
......
......
......
......
......
......
2
no .
......
......
......
......
......
......
......
......
......
.3
93D
urin
g th
e pa
st w
eek,
did
any
of t
he c
hild
ren
aged
5 to
14
year
s do
any
pai
d or
unp
aid
wor
k on
a fa
mily
farm
or i
n a
fam
ily b
usin
ess
or s
ellin
g go
ods
on th
e st
reet
/com
mun
ity?
yes,
unp
aid
......
......
......
......
......
......
......
2
no .
......
......
......
......
......
......
......
......
......
.3
94C
heck
Q92
and
Q93
:
one
“ye
s”
B
oth
“No”
?
96
95W
ould
thes
e ch
ildre
n be
per
form
ing
thes
e jo
bs/a
ctiv
ities
now
if th
e flo
ods
had
not o
ccur
red?
yes .
......
......
......
......
......
......
......
......
.....
1n
o ....
......
......
......
......
......
......
......
......
...2
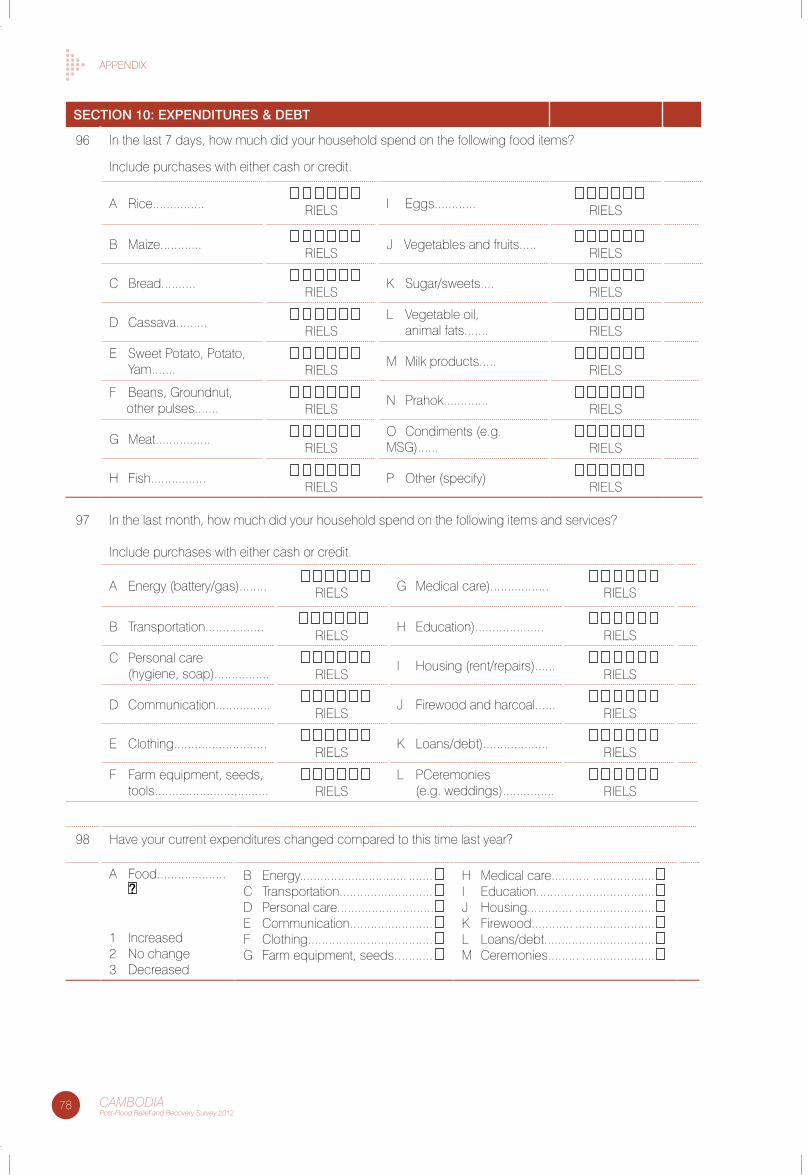
78 CAMBODIAPost-Flood Relief and Recovery Survey 2012
aPPenDIX
SeCTION 10: eXPeNDITUReS & DeBT
96 In the last 7 days, how much did your household spend on the following food items?
Include purchases with either cash or credit.
a Rice...............
RIels I eggs............
RIels
b Maize............ RIels
J Vegetables and fruits..... RIels
c bread.......... RIels
K sugar/sweets.... RIels
D cassava......... RIels
l Vegetable oil, animal fats.......
RIels
e sweet Potato, Potato, yam.......
RIels
M Milk products..... RIels
f beans, Groundnut, other pulses.......
RIels
n Prahok............. RIels
G Meat................ RIels
o condiments (e.g. MsG)......
RIels
H fish................ RIels
P other (specify) RIels
97 In the last month, how much did your household spend on the following items and services?
Include purchases with either cash or credit.
a energy (battery/gas)........
RIels G Medical care).................
RIels
b transportation................. RIels
H education).................... RIels
c Personal care (hygiene, soap)................
RIels
I Housing (rent/repairs)...... RIels
D communication................ RIels
J firewood and harcoal...... RIels
e clothing........................... RIels
K loans/debt)................... RIels
f farm equipment, seeds, tools.................................
RIels
l Pceremonies (e.g. weddings)...............
RIels
98 Have your current expenditures changed compared to this time last year?
a food.................... ?
1 Increased2 no change3 Decreased
b energy............................... ....... c transportation.............. ............. D Personal care............................ e communication......... ............... f clothing.................. .................. G farm equipment, seeds.. .........
H Medical care........... .................. I education........... ....................... J Housing............. ....................... K firewood............ ....................... l loans/debt......... ....................... M ceremonies......... .....................
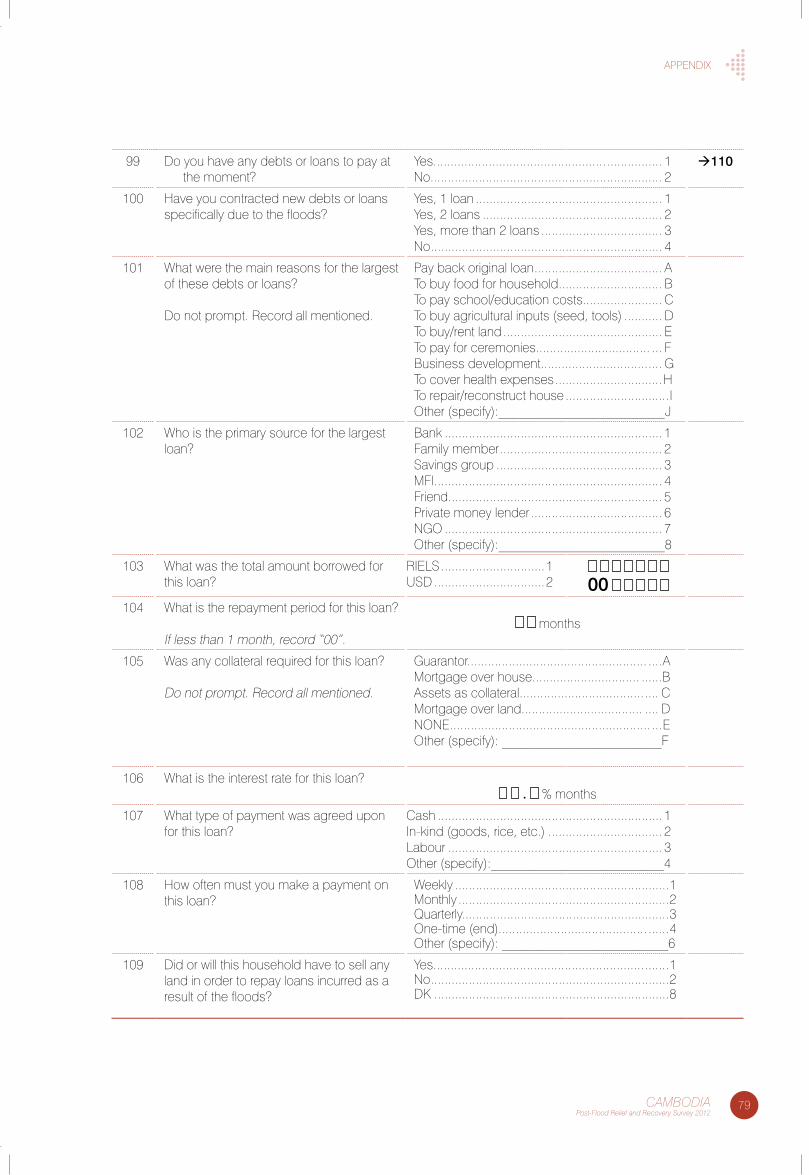
79CAMBODIAPost-Flood Relief and Recovery Survey 2012
aPPenDIX
99 Do you have any debts or loans to pay at the moment?
yes.................................................. ................ 1no....................................................... ............ 2
110
100 Have you contracted new debts or loans specifically due to the floods?
yes, 1 loan ...................................................... 1yes, 2 loans .................................................... 2yes, more than 2 loans ................................... 3no ................................................................... 4
101 What were the main reasons for the largest of these debts or loans?
Do not prompt. Record all mentioned.
Pay back original loan ..................................... ato buy food for household .............................. bto pay school/education costs....................... cto buy agricultural inputs (seed, tools) ........... Dto buy/rent land .............................................. eto pay for ceremonies................................. ... fbusiness development............................... .... Gto cover health expenses ...............................Hto repair/reconstruct house ..............................Iother (specify):_________________________J
102 Who is the primary source for the largest loan?
bank ............................................................... 1family member ............................................... 2savings group ................................................ 3MfI.......................................................... ........ 4friend.............................................................. 5Private money lender ...................................... 6nGo ............................................................... 7other (specify):_________________________8
103 What was the total amount borrowed for this loan?
RIels ..............................1UsD ................................2
00
104 What is the repayment period for this loan?
If less than 1 month, record “00”. months
105 Was any collateral required for this loan?
Do not prompt. Record all mentioned.
Guarantor.................................................... ....aMortgage over house............................... ......bassets as collateral.................................... .... cMortgage over land................................... .... Dnone.......................................................... ...eother (specify): ________________________f
106 What is the interest rate for this loan? . % months
107 What type of payment was agreed upon for this loan?
cash ................................................................. 1In-kind (goods, rice, etc.) ................................. 2labour .............................................................. 3other (specify):__________________________4
108 How often must you make a payment on this loan?
Weekly ..............................................................1Monthly .............................................................2Quarterly............................................................3one-time (end)........................................... ......4other (specify): _________________________6
109 Did or will this household have to sell any land in order to repay loans incurred as a result of the floods?
yes............................................................. .......1no .....................................................................2DK ....................................................................8
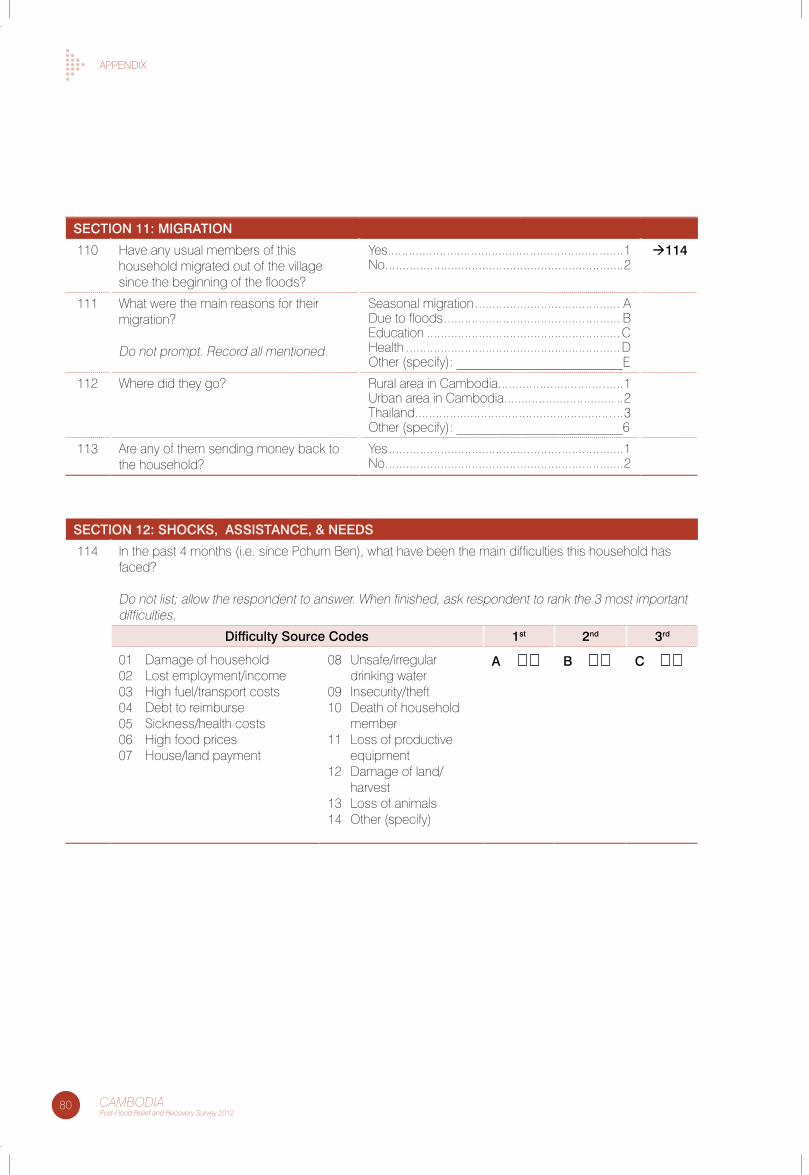
80 CAMBODIAPost-Flood Relief and Recovery Survey 2012
aPPenDIX
SeCTION 11: MIgRaTION
110 Have any usual members of this household migrated out of the village since the beginning of the floods?
yes............................................................. .......1no .....................................................................2
114
111 What were the main reasons for their migration?
Do not prompt. Record all mentioned.
seasonal migration .......................................... aDue to floods ................................................... beducation ........................................................cHealth ..............................................................Dother (specify): _________________________e
112 Where did they go? Rural area in cambodia.............................. ......1Urban area in cambodia................................ ..2thailand......................................................... ...3other (specify): _________________________6
113 are any of them sending money back to the household?
yes ....................................................................1no .....................................................................2
SeCTION 12: SHOCKS, aSSISTaNCe, & NeeDS
114 In the past 4 months (i.e. since Pchum ben), what have been the main difficulties this household has faced?
Do not list; allow the respondent to answer. When finished, ask respondent to rank the 3 most important difficulties.
Difficulty Source Codes 1st 2nd 3rd
01 Damage of household02 lost employment/income03 High fuel/transport costs04 Debt to reimburse05 sickness/health costs06 High food prices07 House/land payment
08 Unsafe/irregular drinking water
09 Insecurity/theft10 Death of household
member11 loss of productive
equipment12 Damage of land/
harvest13 loss of animals14 other (specify)
a B C
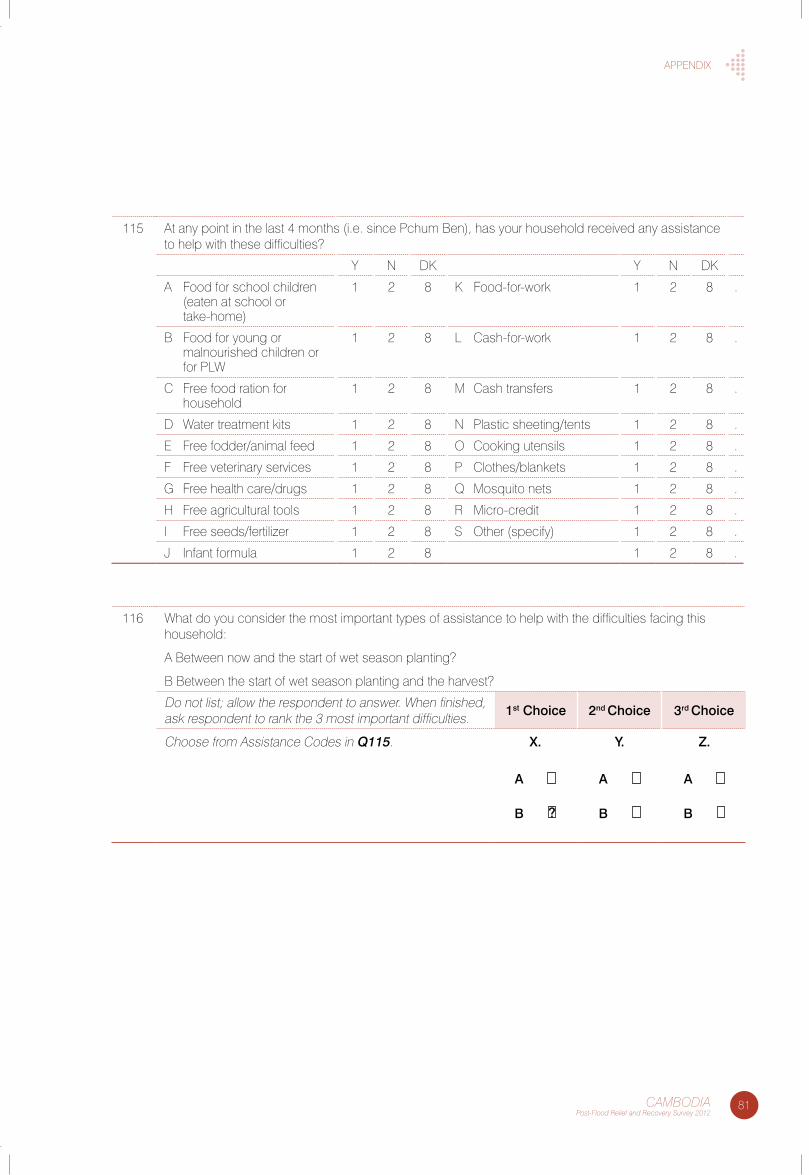
81CAMBODIAPost-Flood Relief and Recovery Survey 2012
aPPenDIX
115 at any point in the last 4 months (i.e. since Pchum ben), has your household received any assistance to help with these difficulties?
y n DK y n DK
a food for school children (eaten at school or take-home)
1 2 8 K food-for-work 1 2 8 .
b food for young or malnourished children or for PlW
1 2 8 l cash-for-work 1 2 8 .
c free food ration for household
1 2 8 M cash transfers 1 2 8 .
D Water treatment kits 1 2 8 n Plastic sheeting/tents 1 2 8 .
e free fodder/animal feed 1 2 8 o cooking utensils 1 2 8 .
f free veterinary services 1 2 8 P clothes/blankets 1 2 8 .
G free health care/drugs 1 2 8 Q Mosquito nets 1 2 8 .
H free agricultural tools 1 2 8 R Micro-credit 1 2 8 .
I free seeds/fertilizer 1 2 8 s other (specify) 1 2 8 .
J Infant formula 1 2 8 1 2 8 .
116 What do you consider the most important types of assistance to help with the difficulties facing this household:
a between now and the start of wet season planting?
b between the start of wet season planting and the harvest?
Do not list; allow the respondent to answer. When finished, ask respondent to rank the 3 most important difficulties. 1st Choice 2nd Choice 3rd Choice
choose from assistance codes in Q115. X.
a
B ?
Y.
a
B
Z.
a
B
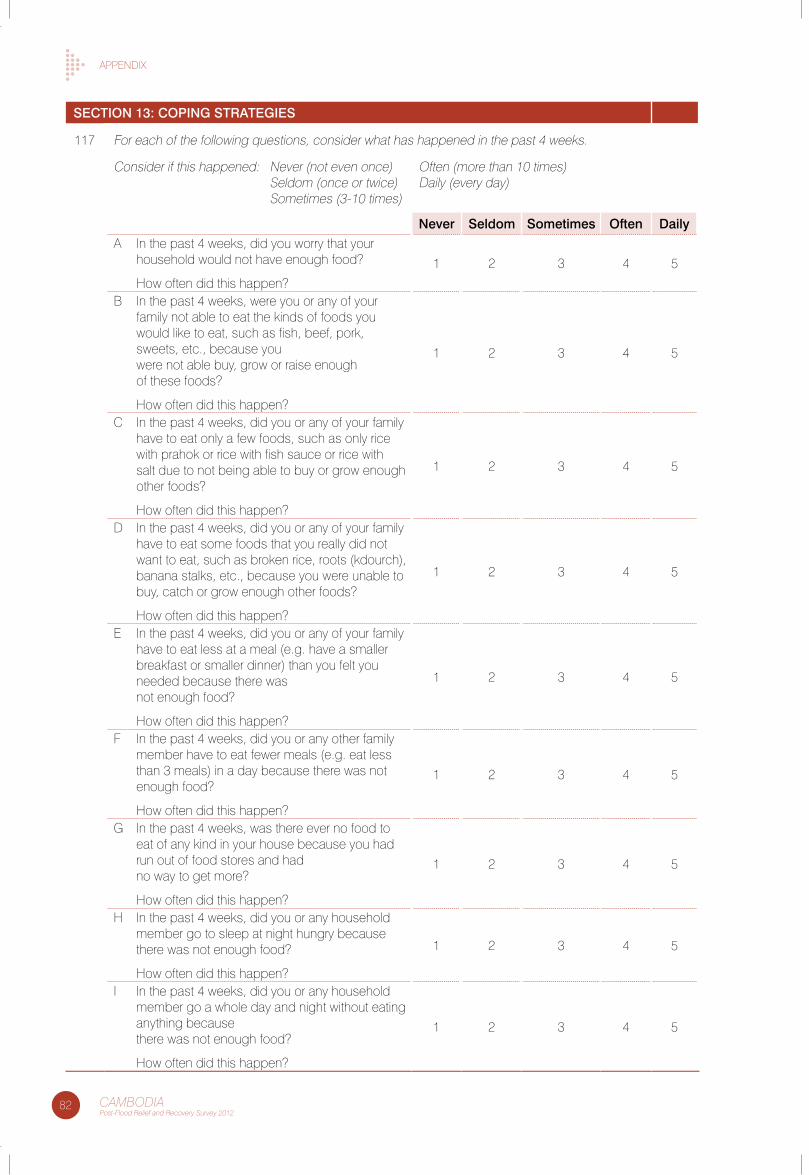
82 CAMBODIAPost-Flood Relief and Recovery Survey 2012
aPPenDIX
SeCTION 13: COPINg STRaTegIeS
117 for each of the following questions, consider what has happened in the past 4 weeks.
consider if this happened: never (not even once) often (more than 10 times) seldom (once or twice) Daily (every day) sometimes (3-10 times)
Never Seldom Sometimes Often Dailya In the past 4 weeks, did you worry that your
household would not have enough food?
How often did this happen?
1 2 3 4 5
b In the past 4 weeks, were you or any of your family not able to eat the kinds of foods you would like to eat, such as fish, beef, pork, sweets, etc., because you were not able buy, grow or raise enough of these foods?
How often did this happen?
1 2 3 4 5
c In the past 4 weeks, did you or any of your family have to eat only a few foods, such as only rice with prahok or rice with fish sauce or rice with salt due to not being able to buy or grow enough other foods?
How often did this happen?
1 2 3 4 5
D In the past 4 weeks, did you or any of your family have to eat some foods that you really did not want to eat, such as broken rice, roots (kdourch), banana stalks, etc., because you were unable to buy, catch or grow enough other foods?
How often did this happen?
1 2 3 4 5
e In the past 4 weeks, did you or any of your family have to eat less at a meal (e.g. have a smaller breakfast or smaller dinner) than you felt you needed because there was not enough food?
How often did this happen?
1 2 3 4 5
f In the past 4 weeks, did you or any other family member have to eat fewer meals (e.g. eat less than 3 meals) in a day because there was not enough food?
How often did this happen?
1 2 3 4 5
G In the past 4 weeks, was there ever no food to eat of any kind in your house because you had run out of food stores and had no way to get more?
How often did this happen?
1 2 3 4 5
H In the past 4 weeks, did you or any household member go to sleep at night hungry because there was not enough food?
How often did this happen?
1 2 3 4 5
I In the past 4 weeks, did you or any household member go a whole day and night without eating anything because there was not enough food?
How often did this happen?
1 2 3 4 5
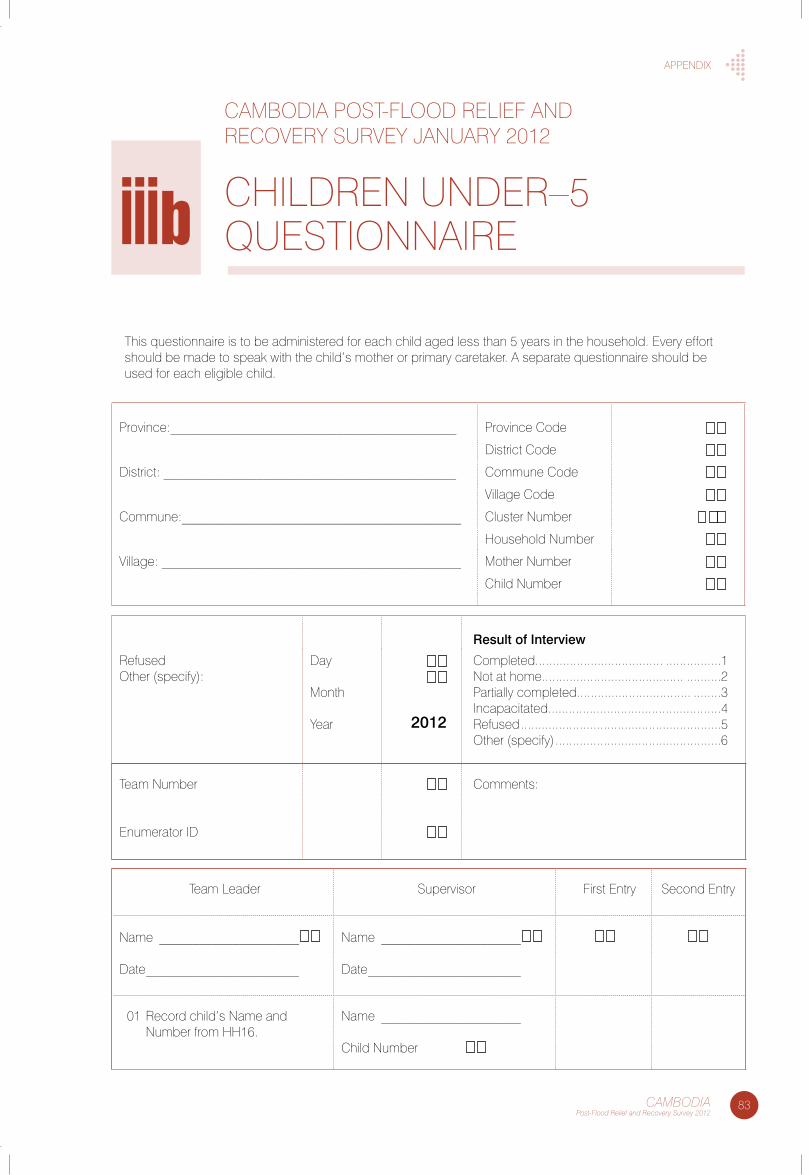
83CAMBODIAPost-Flood Relief and Recovery Survey 2012
aPPenDIX
caMboDIa Post-flooD RelIef anD RecoVeRy sURVey JanUaRy 2012
cHIlDRen UnDeR–5 QUestIonnaIRe iiib
this questionnaire is to be administered for each child aged less than 5 years in the household. every effort should be made to speak with the child’s mother or primary caretaker. a separate questionnaire should be used for each eligible child.
Province:___________________________________________ Province code
District code
District: ____________________________________________ commune code
Village code
commune:__________________________________________ cluster number
Household number
Village: _____________________________________________ Mother number
child number
Result of Interview
Refusedother (specify):
Day
Month
year
2012
completed..................................... ................1not at home......................................... ..........2Partially completed................................. ........3Incapacitated............................................. .....4Refused ..........................................................5other (specify) ................................................6
team number
enumerator ID
comments:
team leader supervisor first entry second entry
name _____________________
Date _______________________
name _____________________
Date _______________________
01 Record child’s name and number from HH16.
name _____________________
child number
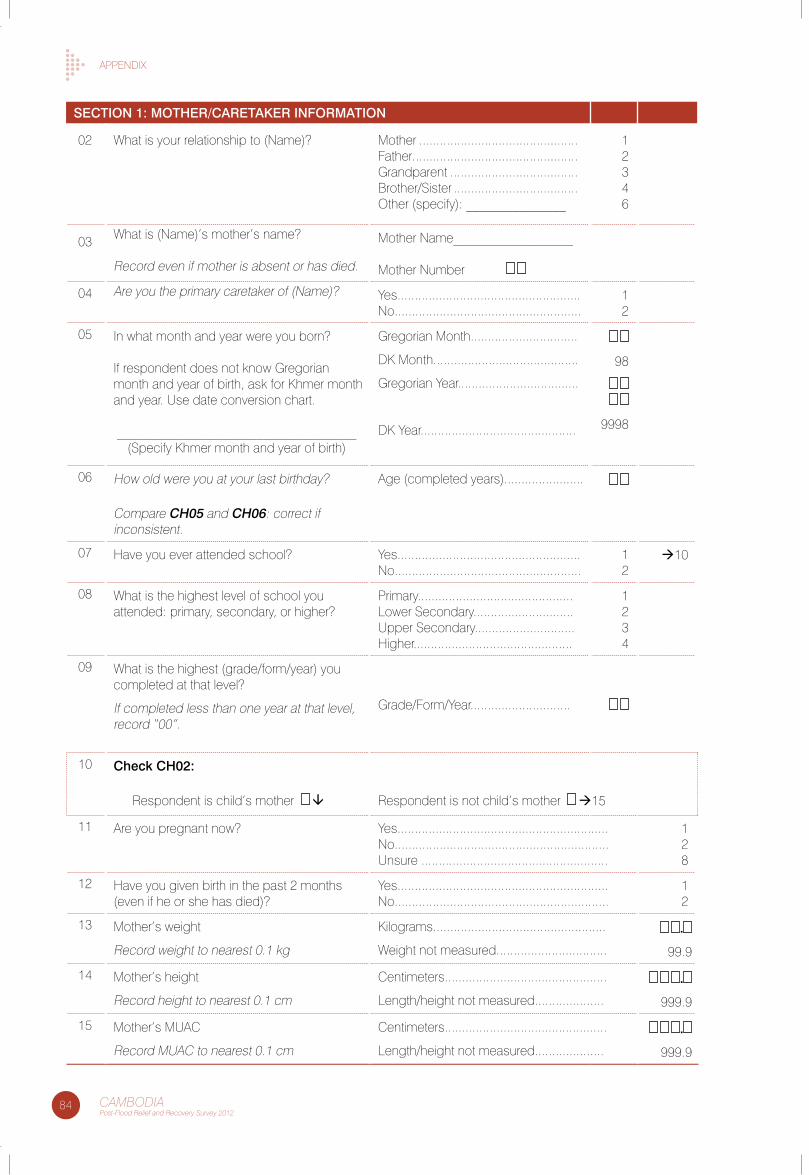
84 CAMBODIAPost-Flood Relief and Recovery Survey 2012
aPPenDIX
SeCTION 1: MOTHeR/CaReTaKeR INFORMaTION
02 What is your relationship to (name)? Mother ..............................................father................................................Grandparent .....................................brother/sister ....................................other (specify): _______________
12346
03 What is (name)’s mother’s name?
Record even if mother is absent or has died.
Mother name__________________
Mother number
04 are you the primary caretaker of (name)? yes.....................................................no......................................................
12
05 In what month and year were you born?
If respondent does not know Gregorian month and year of birth, ask for Khmer month and year. Use date conversion chart.
____________________________________ (specify Khmer month and year of birth)
Gregorian Month...............................
DK Month..........................................
Gregorian year...................................
DK year.............................................
98
9998
06 How old were you at your last birthday?
compare CH05 and CH06: correct if inconsistent.
age (completed years).......................
07 Have you ever attended school? yes.....................................................no......................................................
12
10
08 What is the highest level of school you attended: primary, secondary, or higher?
Primary.............................................lower secondary.............................Upper secondary.............................Higher..............................................
1234
09 What is the highest (grade/form/year) you completed at that level?
If completed less than one year at that level, record “00”.
Grade/form/year.............................
10 Check CH02:
Respondent is child’s mother Respondent is not child’s mother 15
11 are you pregnant now? yes.............................................................no..............................................................Unsure ......................................................
128
12 Have you given birth in the past 2 months (even if he or she has died)?
yes.............................................................no..............................................................
12
13 Mother’s weight
Record weight to nearest 0.1 kg
Kilograms..................................................
Weight not measured................................
.
99.9
14 Mother’s height
Record height to nearest 0.1 cm
centimeters...............................................
length/height not measured....................
.
999.9
15 Mother’s MUac
Record MUac to nearest 0.1 cm
centimeters...............................................
length/height not measured....................
.
999.9
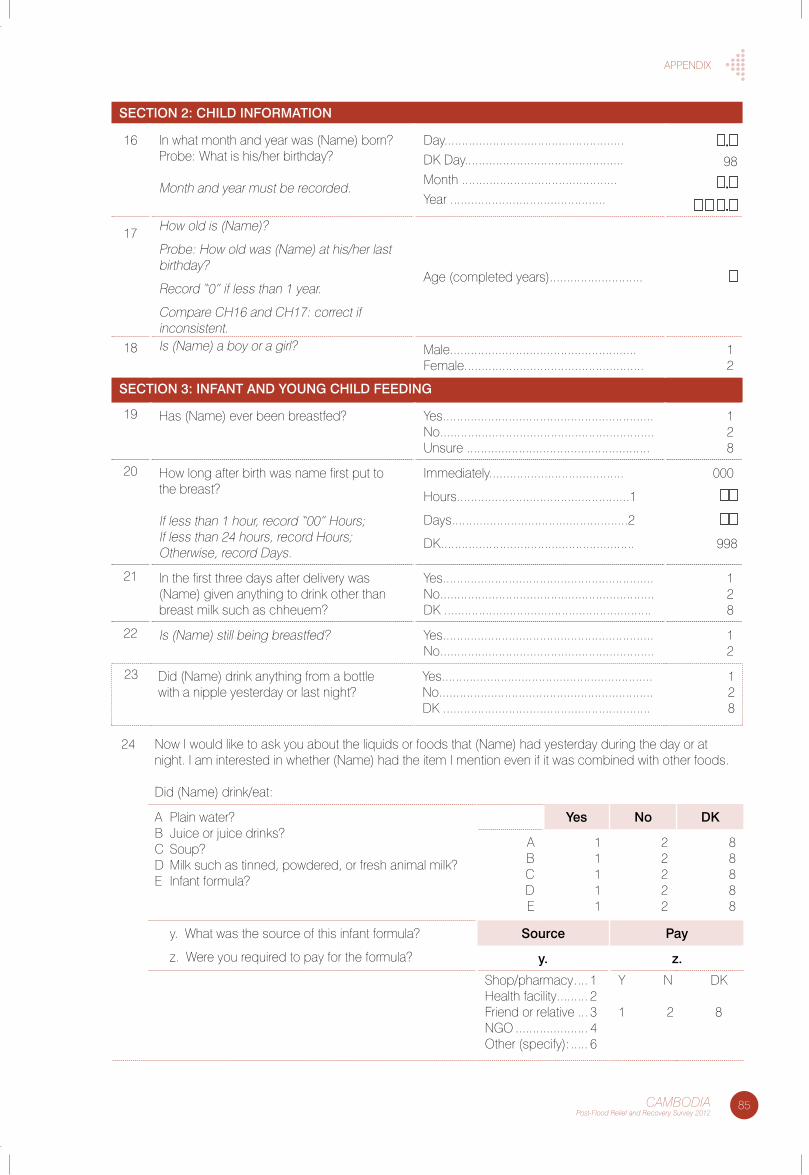
85CAMBODIAPost-Flood Relief and Recovery Survey 2012
aPPenDIX
SeCTION 2: CHILD INFORMaTION
16 In what month and year was (name) born?Probe: What is his/her birthday?
Month and year must be recorded.
Day....................................................DK Day..............................................Month .............................................year .............................................
.
98
.
.
17 How old is (name)?
Probe: How old was (name) at his/her last birthday?
Record “0” if less than 1 year.
compare cH16 and cH17: correct if inconsistent.
age (completed years)...........................
18 Is (name) a boy or a girl? Male......................................................female....................................................
12
SeCTION 3: INFaNT aND YOUNg CHILD FeeDINg
19 Has (name) ever been breastfed? yes.............................................................no..............................................................Unsure .....................................................
128
20 How long after birth was name first put to the breast?
If less than 1 hour, record “00” Hours;If less than 24 hours, record Hours;otherwise, record Days.
Immediately.......................................
Hours..................................................1
Days...................................................2
DK........................................................
000
998
21 In the first three days after delivery was (name) given anything to drink other than breast milk such as chheuem?
yes.............................................................no..............................................................DK ............................................................
128
22 Is (name) still being breastfed? yes.............................................................no..............................................................
12
23 Did (name) drink anything from a bottle with a nipple yesterday or last night?
yes.............................................................no..............................................................DK ............................................................
128
24 now I would like to ask you about the liquids or foods that (name) had yesterday during the day or at night. I am interested in whether (name) had the item I mention even if it was combined with other foods.
Did (name) drink/eat:
a Plain water?b Juice or juice drinks?c soup?D Milk such as tinned, powdered, or fresh animal milk?e Infant formula?
Yes No DK
abcDe
11111
22222
88888
y. What was the source of this infant formula?
z. Were you required to pay for the formula?
Source Pay
y. z.
shop/pharmacy .... 1Health facility ......... 2friend or relative ... 3nGo ..................... 4other (specify): ..... 6
y n DK
1 2 8
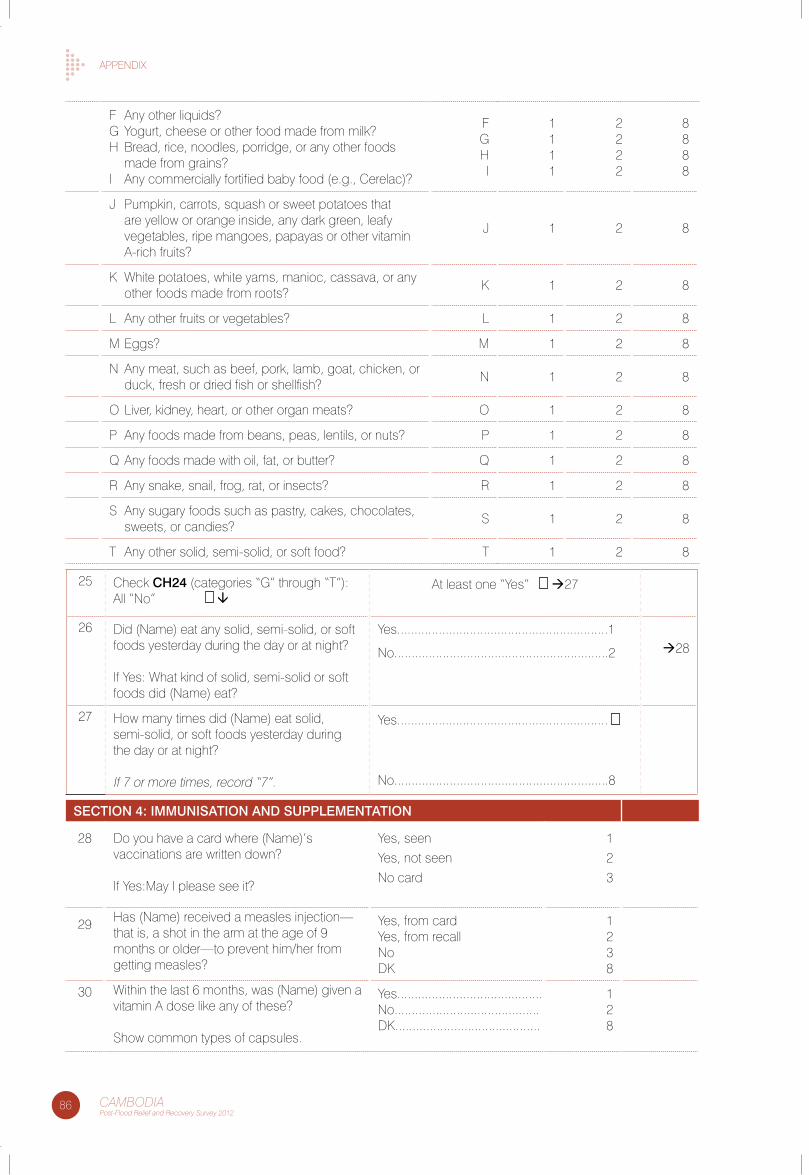
86 CAMBODIAPost-Flood Relief and Recovery Survey 2012
aPPenDIX
f any other liquids?G yogurt, cheese or other food made from milk?H bread, rice, noodles, porridge, or any other foods
made from grains?I any commercially fortified baby food (e.g., cerelac)?
fGHI
1111
2222
8888
J Pumpkin, carrots, squash or sweet potatoes that are yellow or orange inside, any dark green, leafy vegetables, ripe mangoes, papayas or other vitamin a-rich fruits?
J 1 2 8
K White potatoes, white yams, manioc, cassava, or any other foods made from roots?
K 1 2 8
l any other fruits or vegetables? l 1 2 8
M eggs? M 1 2 8
n any meat, such as beef, pork, lamb, goat, chicken, or duck, fresh or dried fish or shellfish?
n 1 2 8
o liver, kidney, heart, or other organ meats? o 1 2 8
P any foods made from beans, peas, lentils, or nuts? P 1 2 8
Q any foods made with oil, fat, or butter? Q 1 2 8
R any snake, snail, frog, rat, or insects? R 1 2 8
s any sugary foods such as pastry, cakes, chocolates, sweets, or candies?
s 1 2 8
t any other solid, semi-solid, or soft food? t 1 2 8
25 check CH24 (categories “G” through “t”):all “no”
at least one “yes” 27
26 Did (name) eat any solid, semi-solid, or soft foods yesterday during the day or at night?
If yes: What kind of solid, semi-solid or soft foods did (name) eat?
yes.............................................................1
no..............................................................2 28
27 How many times did (name) eat solid, semi-solid, or soft foods yesterday during the day or at night?
If 7 or more times, record “7”.
yes.............................................................
no..............................................................8
SeCTION 4: IMMUNISaTION aND SUPPLeMeNTaTION
28 Do you have a card where (name)’s vaccinations are written down?
If yes:May I please see it?
yes, seenyes, not seenno card
123
29 Has (name) received a measles injection—that is, a shot in the arm at the age of 9 months or older—to prevent him/her from getting measles?
yes, from cardyes, from recallnoDK
1238
30 Within the last 6 months, was (name) given a vitamin a dose like any of these?
show common types of capsules.
yes..........................................no..........................................DK..........................................
128
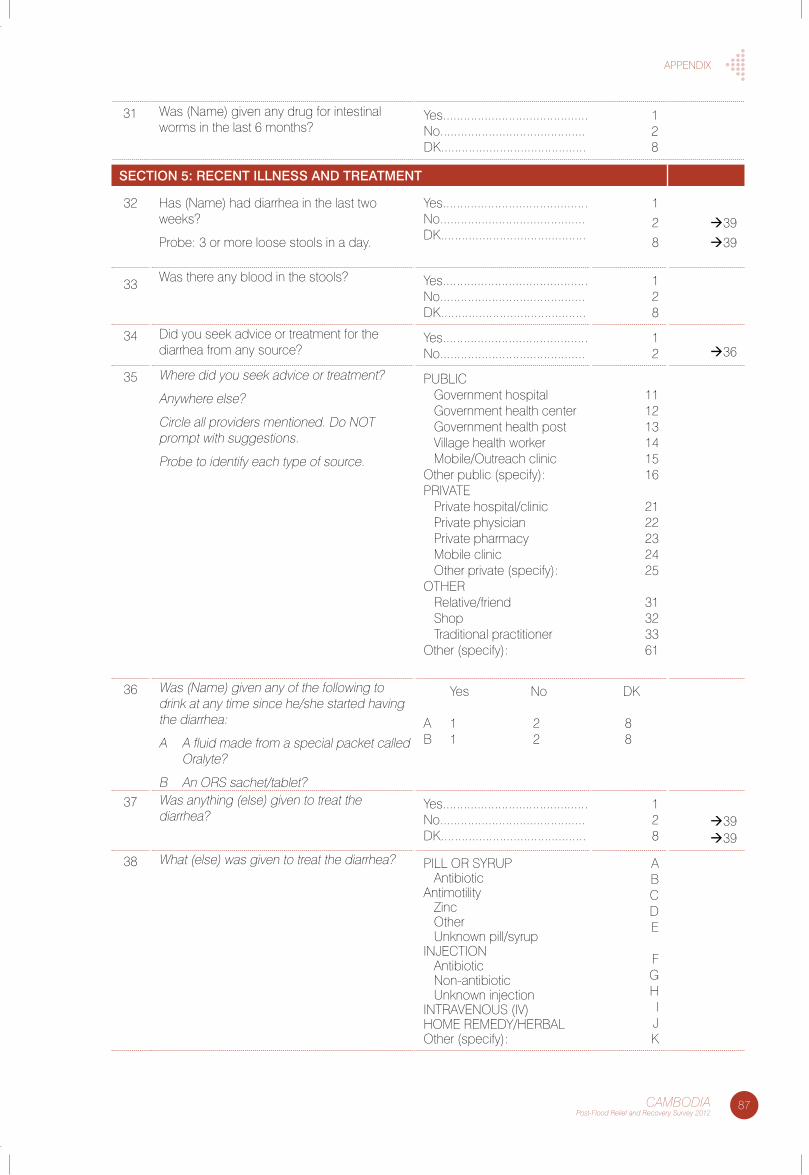
87CAMBODIAPost-Flood Relief and Recovery Survey 2012
aPPenDIX
31 Was (name) given any drug for intestinal worms in the last 6 months?
yes..........................................no..........................................DK..........................................
128
SeCTION 5: ReCeNT ILLNeSS aND TReaTMeNT
32 Has (name) had diarrhea in the last two weeks?
Probe: 3 or more loose stools in a day.
yes..........................................no..........................................DK..........................................
128
3939
33 Was there any blood in the stools? yes..........................................no..........................................DK..........................................
128
34 Did you seek advice or treatment for the diarrhea from any source?
yes..........................................no..........................................
12 36
35 Where did you seek advice or treatment?
anywhere else?
circle all providers mentioned. Do not prompt with suggestions.
Probe to identify each type of source.
PUblIc Government hospital Government health center Government health post Village health worker Mobile/outreach clinicother public (specify):PRIVate Private hospital/clinic Private physician Private pharmacy Mobile clinic other private (specify):otHeR Relative/friend shop traditional practitionerother (specify):
111213141516
2122232425
31323361
36 Was (name) given any of the following to drink at any time since he/she started having the diarrhea:
a a fluid made from a special packet called oralyte?
b an oRs sachet/tablet?
yes no DK
a 1 2 8b 1 2 8
37 Was anything (else) given to treat the diarrhea?
yes..........................................no..........................................DK..........................................
128
3939
38 What (else) was given to treat the diarrhea? PIll oR syRUP antibioticantimotility Zinc other Unknown pill/syrupInJectIon antibiotic non-antibiotic Unknown injectionIntRaVenoUs (IV)HoMe ReMeDy/HeRbalother (specify):
abcDe
fGHI
JK
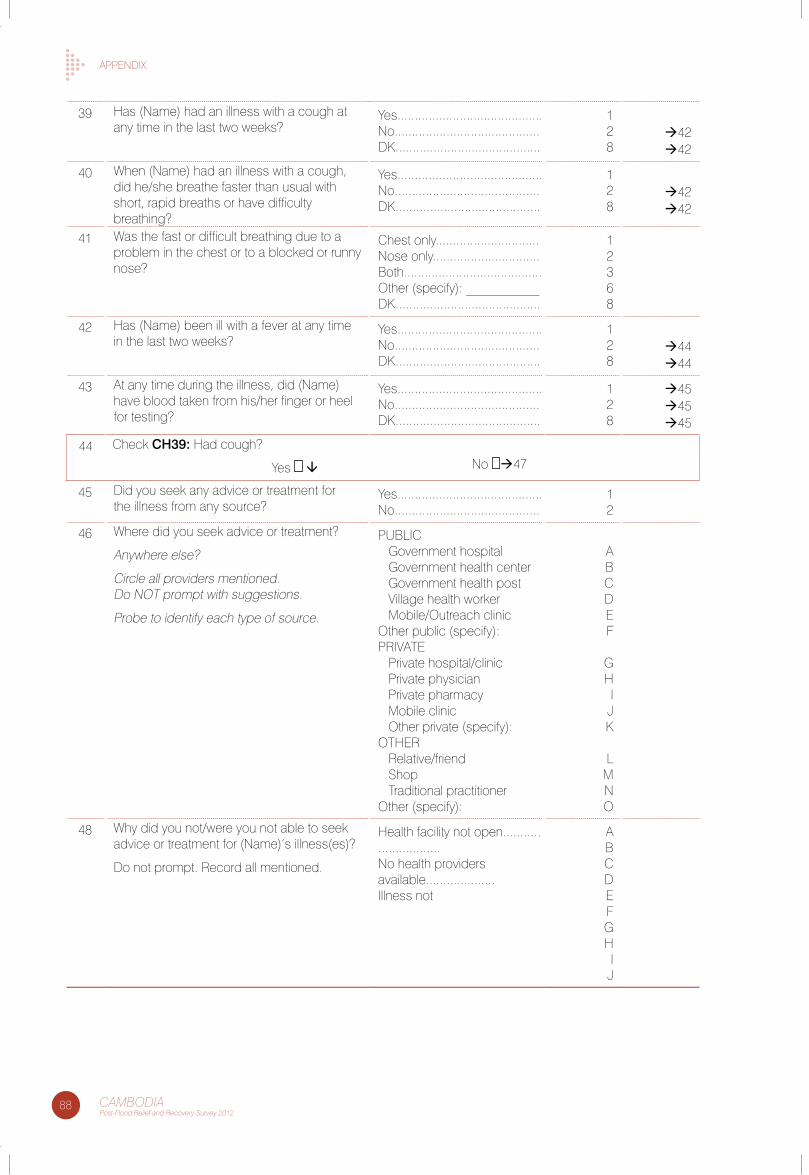
88 CAMBODIAPost-Flood Relief and Recovery Survey 2012
aPPenDIX
39 Has (name) had an illness with a cough at any time in the last two weeks?
yes..........................................no..........................................DK..........................................
128
4242
40 When (name) had an illness with a cough, did he/she breathe faster than usual with short, rapid breaths or have difficulty breathing?
yes..........................................no..........................................DK..........................................
128
4242
41 Was the fast or difficult breathing due to a problem in the chest or to a blocked or runny nose?
chest only..............................nose only...............................both........................................other (specify): ___________DK..........................................
12368
42 Has (name) been ill with a fever at any time in the last two weeks?
yes..........................................no..........................................DK..........................................
128
4444
43 at any time during the illness, did (name) have blood taken from his/her finger or heel for testing?
yes..........................................no..........................................DK..........................................
128
454545
44 check CH39: Had cough?
yes no 47
45 Did you seek any advice or treatment for the illness from any source?
yes..........................................no..........................................
12
46 Where did you seek advice or treatment?
anywhere else?
circle all providers mentioned. Do not prompt with suggestions.
Probe to identify each type of source.
PUblIc Government hospital Government health center Government health post Village health worker Mobile/outreach clinicother public (specify):PRIVate Private hospital/clinic Private physician Private pharmacy Mobile clinic other private (specify):otHeR Relative/friend shop traditional practitionerother (specify):
abcDef
GHI
JK
lMno
48 Why did you not/were you not able to seek advice or treatment for (name)’s illness(es)?
Do not prompt. Record all mentioned.
Health facility not open.............................no health providers available....................Illness not
abcDefGHI
J
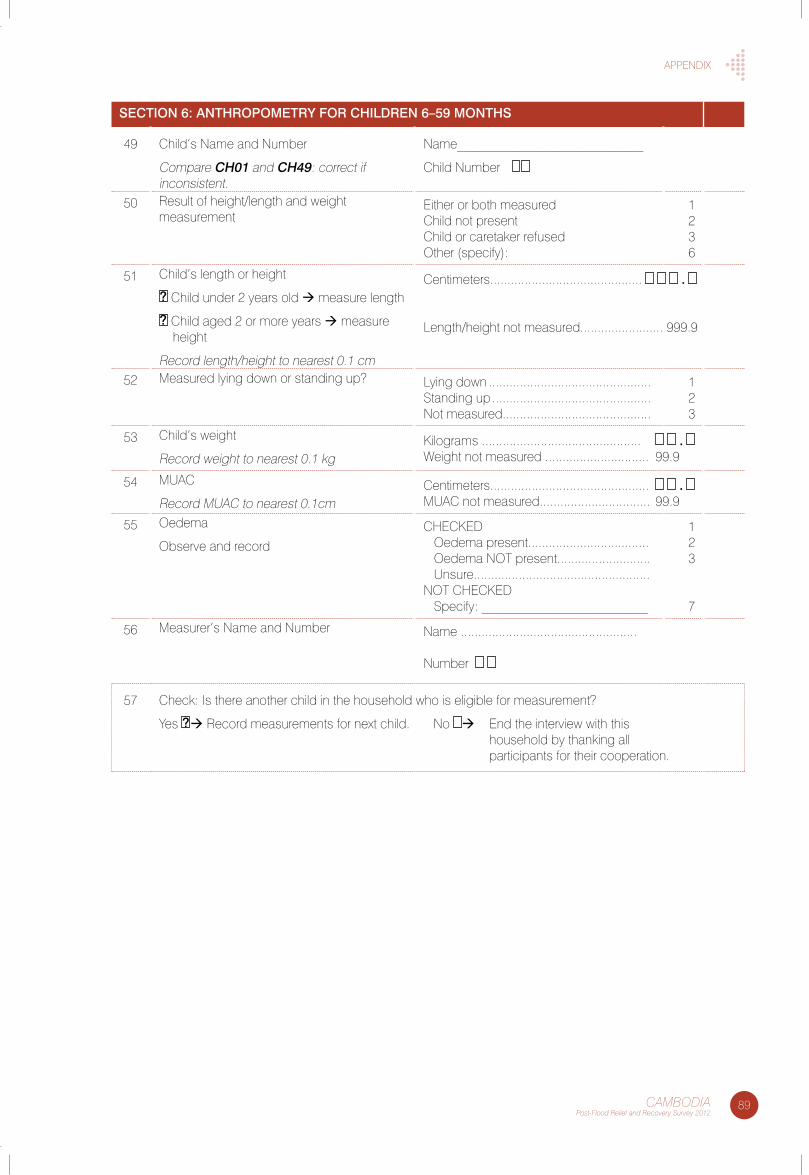
89CAMBODIAPost-Flood Relief and Recovery Survey 2012
aPPenDIX
SeCTION 6: aNTHROPOMeTRY FOR CHILDReN 6–59 MONTHS
49 child’s name and number
compare CH01 and CH49: correct if inconsistent.
name____________________________
child number
50 Result of height/length and weight measurement
either or both measuredchild not presentchild or caretaker refusedother (specify):
1236
51 child’s length or height
? child under 2 years old measure length
? child aged 2 or more years measure height
Record length/height to nearest 0.1 cm
centimeters............................................ .
length/height not measured........................ 999.9
52 Measured lying down or standing up? lying down ...............................................standing up ..............................................not measured...........................................
123
53 child’s weight
Record weight to nearest 0.1 kgKilograms .............................................. . Weight not measured .............................. 99.9
54 MUac
Record MUac to nearest 0.1cmcentimeters.............................................. . MUac not measured................................ 99.9
55 oedema
observe and recordcHecKeD oedema present................................... oedema not present........................... Unsure...................................................not cHecKeD specify: _________________________
123
7
56 Measurer’s name and number name ...................................................
number
57 check: Is there another child in the household who is eligible for measurement?
yes ? Record measurements for next child. no end the interview with this household by thanking all participants for their cooperation.
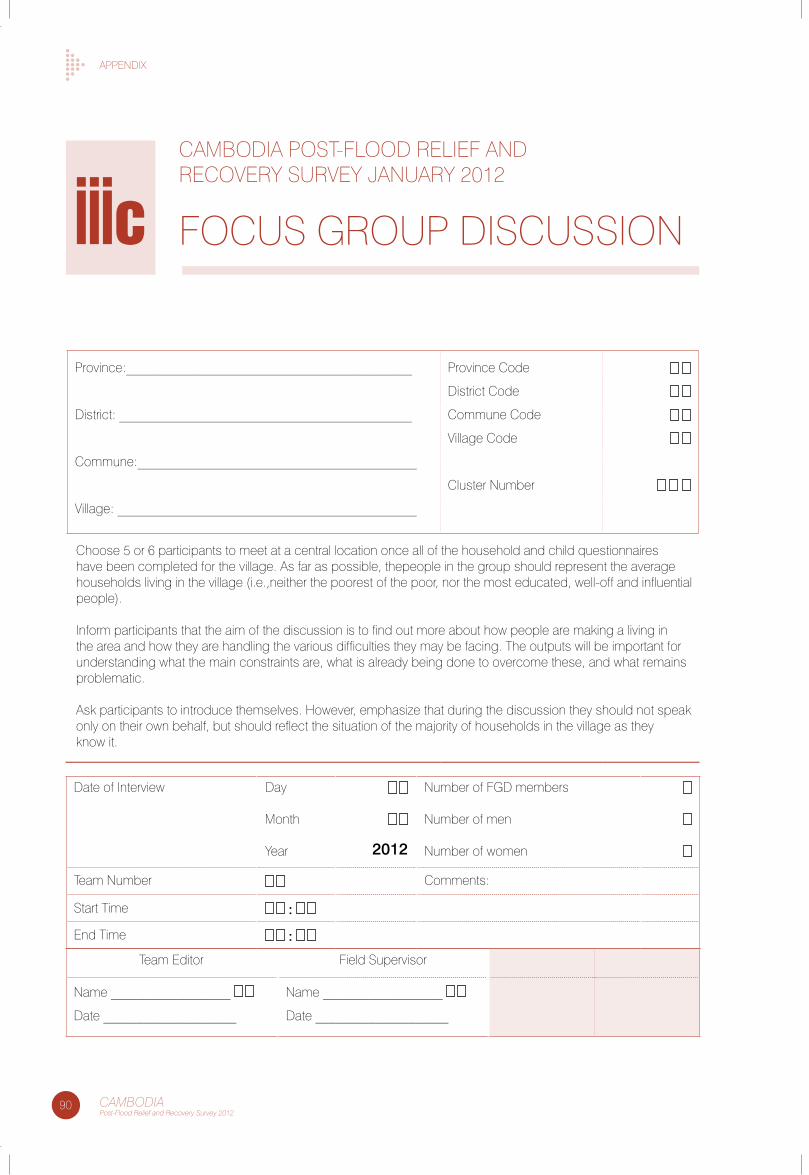
90 CAMBODIAPost-Flood Relief and Recovery Survey 2012
aPPenDIX
caMboDIa Post-flooD RelIef anD RecoVeRy sURVey JanUaRy 2012
focUs GRoUP DIscUssIon
Province:___________________________________________
District: ____________________________________________
commune:__________________________________________
Village: _____________________________________________
Province code
District code
commune code
Village code
cluster number
choose 5 or 6 participants to meet at a central location once all of the household and child questionnaires have been completed for the village. as far as possible, thepeople in the group should represent the average households living in the village (i.e.,neither the poorest of the poor, nor the most educated, well-off and influential people).
Inform participants that the aim of the discussion is to find out more about how people are making a living in the area and how they are handling the various difficulties they may be facing. the outputs will be important for understanding what the main constraints are, what is already being done to overcome these, and what remains problematic.
ask participants to introduce themselves. However, emphasize that during the discussion they should not speak only on their own behalf, but should reflect the situation of the majority of households in the village as they know it.
Date of Interview Day
Month
year
2012
number of fGD members
number of men
number of women
team number comments:
start time :
end time :
team editor field supervisor
name __________________
Date ____________________
name __________________
Date ____________________
iiic
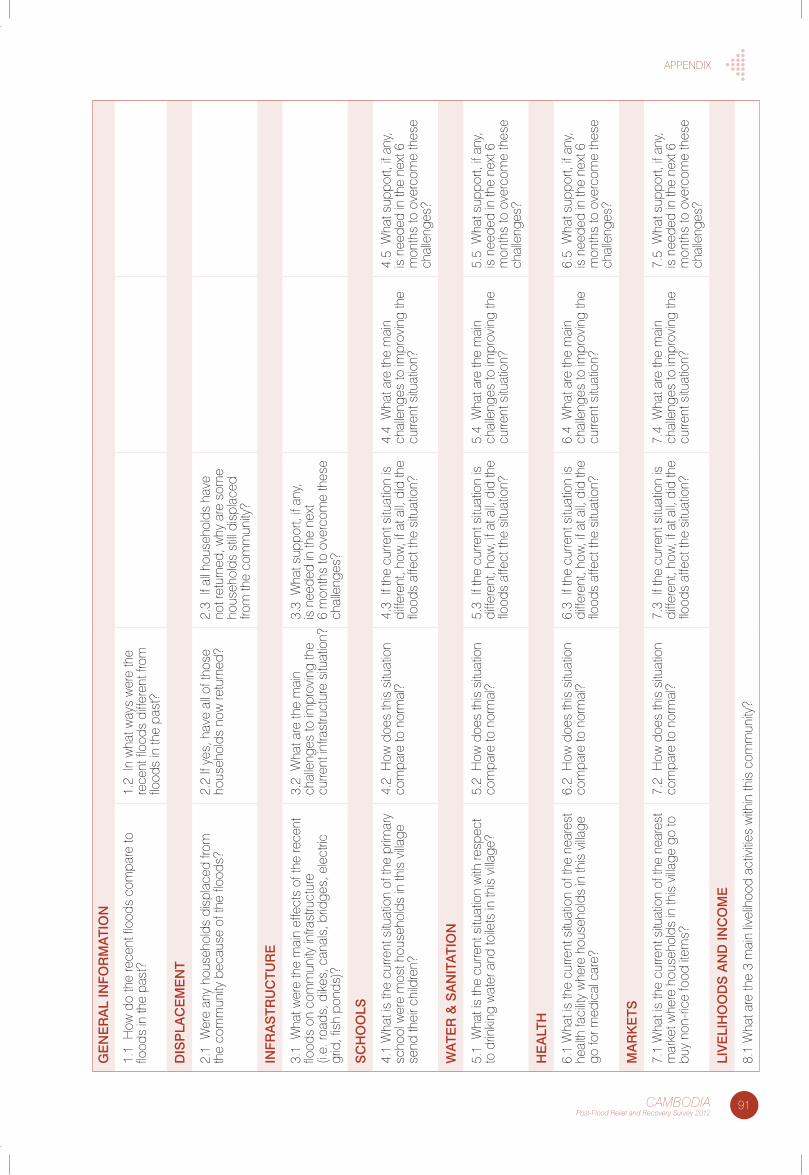
91CAMBODIAPost-Flood Relief and Recovery Survey 2012
aPPenDIX
ge
Ne
Ra
L IN
FOR
Ma
TIO
N
1.1
How
do
the
rece
nt fl
oods
com
pare
to
flood
s in
the
past
?1.
2 In
wha
t way
s w
ere
the
rece
nt fl
oods
diff
eren
t fro
m
flood
s in
the
past
?
DIS
PLa
Ce
Me
NT
2.1
Wer
e an
y ho
useh
olds
dis
plac
ed fr
om
the
com
mun
ity b
ecau
se o
f the
floo
ds?
2.2
If ye
s, h
ave
all o
f tho
se
hous
ehol
ds n
ow re
turn
ed?
2.3
If a
ll ho
useh
olds
hav
e no
t ret
urne
d, w
hy a
re s
ome
hous
ehol
ds s
till d
ispl
aced
fro
m th
e co
mm
unity
?
INFR
aS
TRU
CTU
Re
3.1
Wha
t wer
e th
e m
ain
effe
cts
of th
e re
cent
flo
ods
on c
omm
unity
infra
stru
ctur
e
(i.e.
road
s, d
ikes
, can
als,
brid
ges,
ele
ctric
gr
id, f
ish
pond
s)?
3.2
Wha
t are
the
mai
n ch
alle
nges
to im
prov
ing
the
curre
nt in
frast
ruct
ure
situ
atio
n?
3.3
Wha
t sup
port,
if a
ny,
is n
eede
d in
the
next
6
mon
ths
to o
verc
ome
thes
e ch
alle
nges
?
SC
HO
OLS
4.1
Wha
t is
the
curre
nt s
ituat
ion
of th
e pr
imar
y sc
hool
wer
e m
ost h
ouse
hold
s in
this
villa
ge
send
thei
r chi
ldre
n?
4.2
How
doe
s th
is s
ituat
ion
com
pare
to n
orm
al?
4.3
If th
e cu
rrent
situ
atio
n is
di
ffere
nt, h
ow, i
f at a
ll, d
id th
e flo
ods
affe
ct th
e si
tuat
ion?
4.4
Wha
t are
the
mai
n ch
alle
nges
to im
prov
ing
the
curre
nt s
ituat
ion?
4.5
Wha
t sup
port,
if a
ny,
is n
eede
d in
the
next
6
mon
ths
to o
verc
ome
thes
e ch
alle
nges
?
Wa
TeR
& S
aN
ITa
TIO
N
5.1
Wha
t is
the
curre
nt s
ituat
ion
with
resp
ect
to d
rinki
ng w
ater
and
toile
ts in
this
villa
ge?
5.2
How
doe
s th
is s
ituat
ion
com
pare
to n
orm
al?
5.3
If th
e cu
rrent
situ
atio
n is
di
ffere
nt, h
ow, i
f at a
ll, d
id th
e flo
ods
affe
ct th
e si
tuat
ion?
5.4
Wha
t are
the
mai
n ch
alle
nges
to im
prov
ing
the
curre
nt s
ituat
ion?
5.5
Wha
t sup
port,
if a
ny,
is n
eede
d in
the
next
6
mon
ths
to o
verc
ome
thes
e ch
alle
nges
?
He
aLT
H
6.1
Wha
t is
the
curre
nt s
ituat
ion
of th
e ne
ares
t he
alth
faci
lity w
here
hou
seho
lds
in th
is v
illage
go
for m
edic
al c
are?
6.2
How
doe
s th
is s
ituat
ion
com
pare
to n
orm
al?
6.3
If th
e cu
rrent
situ
atio
n is
di
ffere
nt, h
ow, i
f at a
ll, d
id th
e flo
ods
affe
ct th
e si
tuat
ion?
6.4
Wha
t are
the
mai
n ch
alle
nges
to im
prov
ing
the
curre
nt s
ituat
ion?
6.5
Wha
t sup
port,
if a
ny,
is n
eede
d in
the
next
6
mon
ths
to o
verc
ome
thes
e ch
alle
nges
?
Ma
RK
eTS
7.1
Wha
t is
the
curre
nt s
ituat
ion
of th
e ne
ares
t m
arke
t whe
re h
ouse
hold
s in
this
villa
ge g
o to
bu
y no
n-ric
e fo
od it
ems?
7.2
How
doe
s th
is s
ituat
ion
com
pare
to n
orm
al?
7.3
If th
e cu
rrent
situ
atio
n is
di
ffere
nt, h
ow, i
f at a
ll, d
id th
e flo
ods
affe
ct th
e si
tuat
ion?
7.4
Wha
t are
the
mai
n ch
alle
nges
to im
prov
ing
the
curre
nt s
ituat
ion?
7.5
Wha
t sup
port,
if a
ny,
is n
eede
d in
the
next
6
mon
ths
to o
verc
ome
thes
e ch
alle
nges
?
LIV
eLI
HO
OD
S a
ND
INC
OM
e
8.1
Wha
t are
the
3 m
ain
livel
ihoo
d ac
tivitie
s w
ithin
this
com
mun
ity?
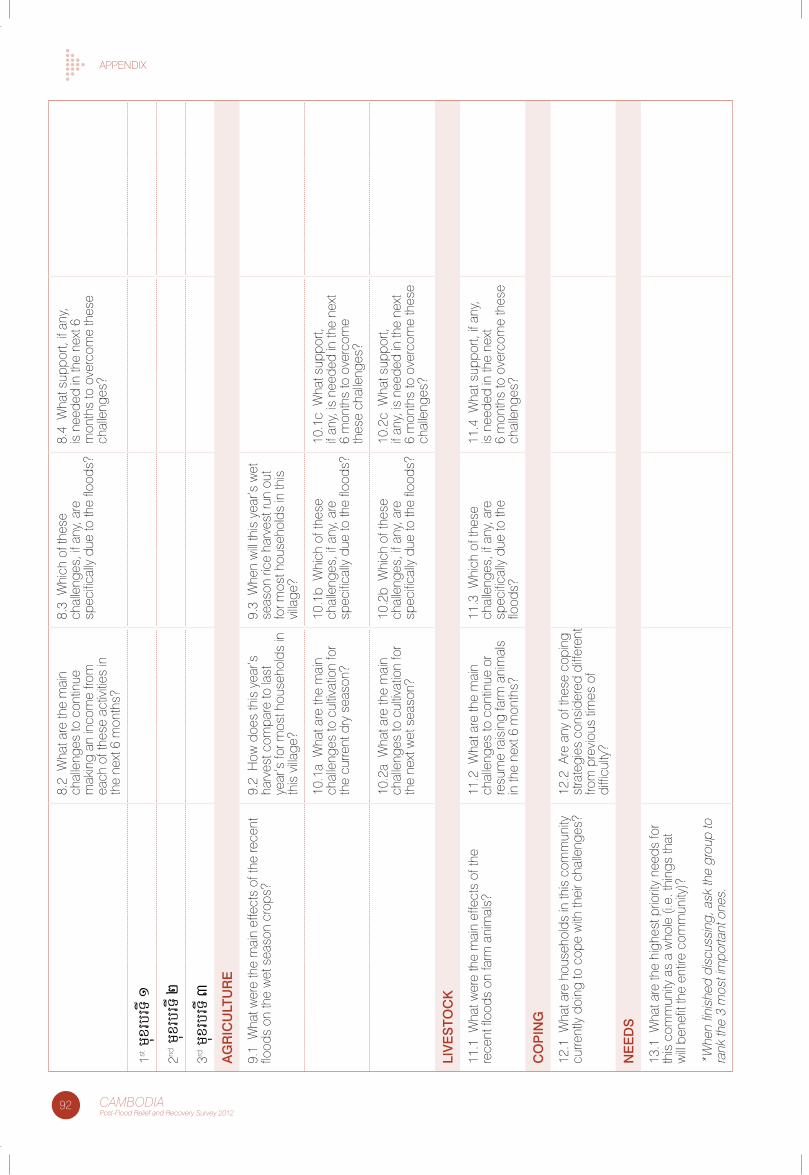
92 CAMBODIAPost-Flood Relief and Recovery Survey 2012
aPPenDIX8.
2 W
hat a
re th
e m
ain
chal
leng
es to
con
tinue
m
akin
g an
inco
me
from
ea
ch o
f the
se a
ctiv
ities
in
the
next
6 m
onth
s?
8.3
Whi
ch o
f the
se
chal
leng
es, i
f any
, are
sp
ecific
ally
due
to th
e flo
ods?
8.4
Wha
t sup
port,
if a
ny,
is n
eede
d in
the
next
6
mon
ths
to o
verc
ome
thes
e ch
alle
nges
?
1st m
uxrb
rTI 1
2nd m
uxrb
rTI 2
3rd m
uxrb
rTI 3
ag
RIC
ULT
UR
e
9.1
Wha
t wer
e th
e m
ain
effe
cts
of th
e re
cent
flo
ods
on th
e w
et s
easo
n cr
ops?
9.2
How
doe
s th
is y
ear’s
ha
rves
t com
pare
to la
st
year
’s fo
r mos
t hou
seho
lds
in
this
villa
ge?
9.3
Whe
n w
ill th
is y
ear’s
wet
se
ason
rice
har
vest
run
out
for m
ost h
ouse
hold
s in
this
vi
llage
?
10.1
a W
hat a
re th
e m
ain
chal
leng
es to
cul
tivat
ion
for
the
curre
nt d
ry s
easo
n?
10.1
b W
hich
of t
hese
ch
alle
nges
, if a
ny, a
re
spec
ifical
ly d
ue to
the
flood
s?
10.1
c W
hat s
uppo
rt,
if an
y, is
nee
ded
in th
e ne
xt
6 m
onth
s to
ove
rcom
e
thes
e ch
alle
nges
?
10.2
a W
hat a
re th
e m
ain
chal
leng
es to
cul
tivat
ion
for
the
next
wet
sea
son?
10.2
b W
hich
of t
hese
ch
alle
nges
, if a
ny, a
re
spec
ifical
ly d
ue to
the
flood
s?
10.2
c W
hat s
uppo
rt,
if an
y, is
nee
ded
in th
e ne
xt
6 m
onth
s to
ove
rcom
e th
ese
chal
leng
es?
LIV
eS
TOC
K
11.1
Wha
t wer
e th
e m
ain
effe
cts
of th
e
rece
nt fl
oods
on
farm
ani
mal
s?11
.2 W
hat a
re th
e m
ain
chal
leng
es to
con
tinue
or
resu
me
rais
ing
farm
ani
mal
s in
the
next
6 m
onth
s?
11.3
Whi
ch o
f the
se
chal
leng
es, i
f any
, are
sp
ecific
ally
due
to th
e
flood
s?
11.4
Wha
t sup
port,
if a
ny,
is n
eede
d in
the
next
6
mon
ths
to o
verc
ome
thes
e ch
alle
nges
?
CO
PIN
g
12.1
Wha
t are
hou
seho
lds
in th
is c
omm
unity
cu
rrent
ly d
oing
to c
ope
with
thei
r cha
lleng
es?
12.2
are
any
of t
hese
cop
ing
stra
tegi
es c
onsi
dere
d di
ffere
nt
from
pre
viou
s tim
es o
f di
fficu
lty?
Ne
eD
S
13.1
Wha
t are
the
high
est p
riorit
y ne
eds
for
this
com
mun
ity a
s a
who
le (i
.e. t
hing
s th
at
will
bene
fit th
e en
tire
com
mun
ity)?
*Whe
n fin
ishe
d di
scus
sing
, ask
the
grou
p to
ra
nk th
e 3
mos
t im
porta
nt o
nes.
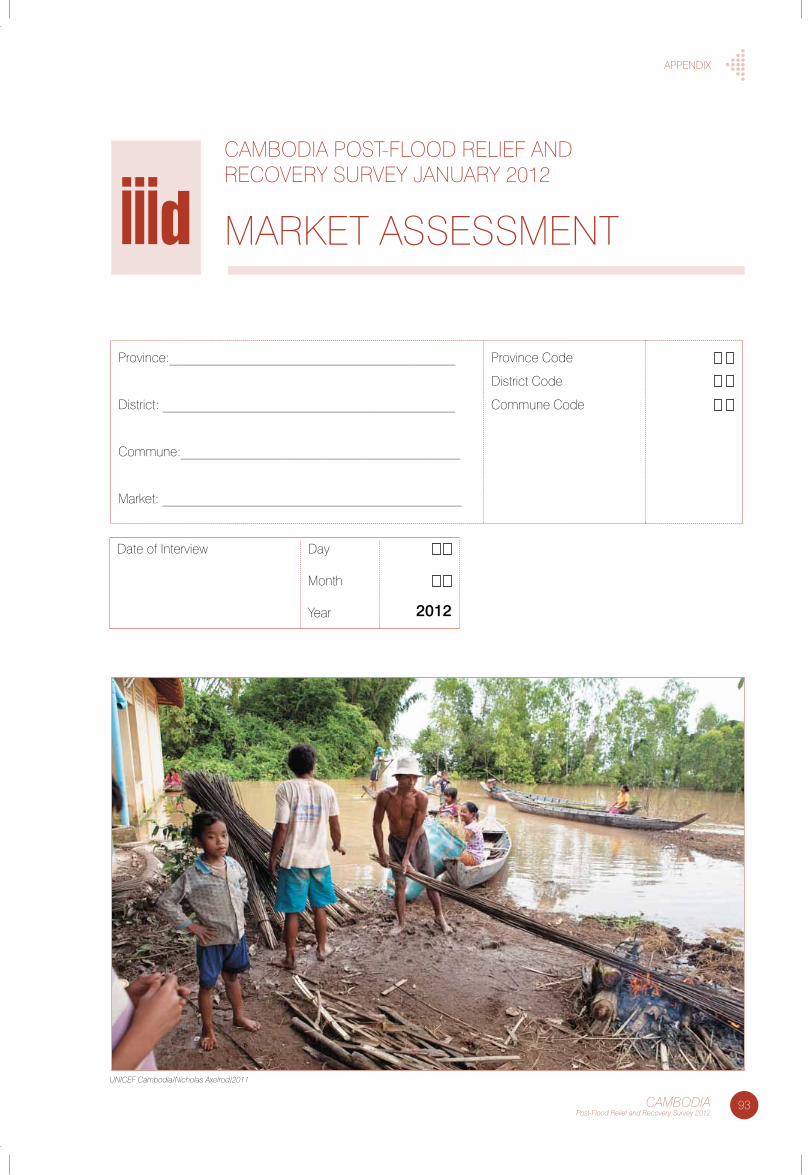
93CAMBODIAPost-Flood Relief and Recovery Survey 2012
aPPenDIX
caMboDIa Post-flooD RelIef anD RecoVeRy sURVey JanUaRy 2012
MaRKet assessMent
Province:___________________________________________
District: ____________________________________________
commune:__________________________________________
Market: _____________________________________________
Province code
District code
commune code
Date of Interview Day
Month
year
2012
iiid
UNICEF Cambodia/Nicholas Axelrod/2011
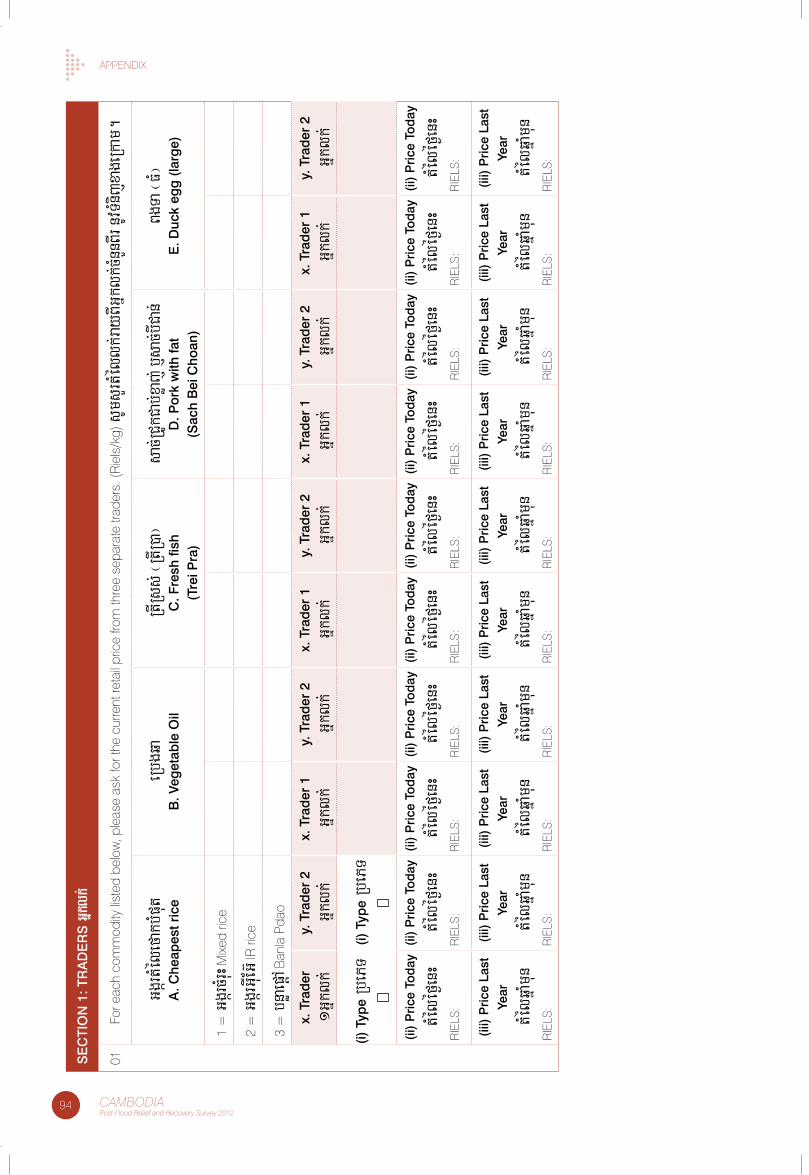
94 CAMBODIAPost-Flood Relief and Recovery Survey 2012
aPPenDIX
Se
CTI
ON
1: T
Ra
De
RS
Gñklk;
01fo
r eac
h co
mm
odity
list
ed b
elow
, ple
ase
ask
for t
he c
urre
nt re
tail
pric
e fro
m th
ree
sepa
rate
trad
ers.
(Rie
ls/k
g) s
Ums
YrtMél
lk;r
ayBIG
ñklk;c
MnYnBIr
nUvT
Mnijxa
geRk
am.
Ggár
tMél
efak
bMpu
ta
. Che
apes
t ric
eeR
bgq
a B
. Veg
etab
le O
ilRt
IRss
; ¬Rt
IR)a¦
C. F
resh
fish
(Tre
i Pra
)
sac
;RCUkC
ab;xøa
j; b
Jsac
;bICa
n; D
. Por
k w
ith fa
t(S
ach
Bei
Cho
an)
BgTa
¬F
M¦e
. Duc
k eg
g (
larg
e)
1 =
Ggár
cMruH
Mixe
d ric
e
2 =
Ggár
GIuEG
‘ IR ri
ce
3 =
bnøa
epþA b
anla
Pda
o
x. T
rad
er
1G
ñklk;
y. T
rad
er 2
Gñkl
k;x.
Tra
der
1
Gñkl
k;y.
Tra
der
2
Gñkl
k;x.
Tra
der
1
Gñkl
k;y.
Tra
der
2
Gñkl
k;x.
Tra
der
1
Gñkl
k;y.
Tra
der
2
Gñkl
k;x.
Tra
der
1
Gñkl
k;y.
Tra
der
2
Gñkl
k;
(i) T
ype
RbeP
T
(i) T
ype
RbeP
T
(ii)
Pric
e To
day
tMél
éf¶en
HR
Iels
:
(ii)
Pric
e To
day
tMél
éf¶en
HR
Iels
:
(ii)
Pric
e To
day
tMél
éf¶en
HR
Iels
:
(ii)
Pric
e To
day
tMél
éf¶en
HR
Iels
:
(ii)
Pric
e To
day
tMél
éf¶en
HR
Iels
:
(ii)
Pric
e To
day
tMél
éf¶en
HR
Iels
:
(ii)
Pric
e To
day
tMél
éf¶en
HR
Iels
:
(ii)
Pric
e To
day
tMél
éf¶en
HR
Iels
:
(ii)
Pric
e To
day
tMél
éf¶en
HR
Iels
:
(ii)
Pric
e To
day
tMél
éf¶en
HR
Iels
:
(iii)
Pric
e La
st
Year
tMél
qñaMm
unR
Iels
:
(iii)
Pric
e La
st
Year
tMél
qñaMm
unR
Iels
:
(iii)
Pric
e La
st
Year
tMél
qñaMm
unR
Iels
:
(iii)
Pric
e La
st
Year
tMél
qñaMm
unR
Iels
:
(iii)
Pric
e La
st
Year
tMél
qñaMm
unR
Iels
:
(iii)
Pric
e La
st
Year
tMél
qñaMm
unR
Iels
:
(iii)
Pric
e La
st
Year
tMél
qñaMm
unR
Iels
:
(iii)
Pric
e La
st
Year
tMél
qñaMm
unR
Iels
:
(iii)
Pric
e La
st
Year
tMél
qñaMm
unR
Iels
:
(iii)
Pric
e La
st
Year
tMél
qñaMm
unR
Iels
:
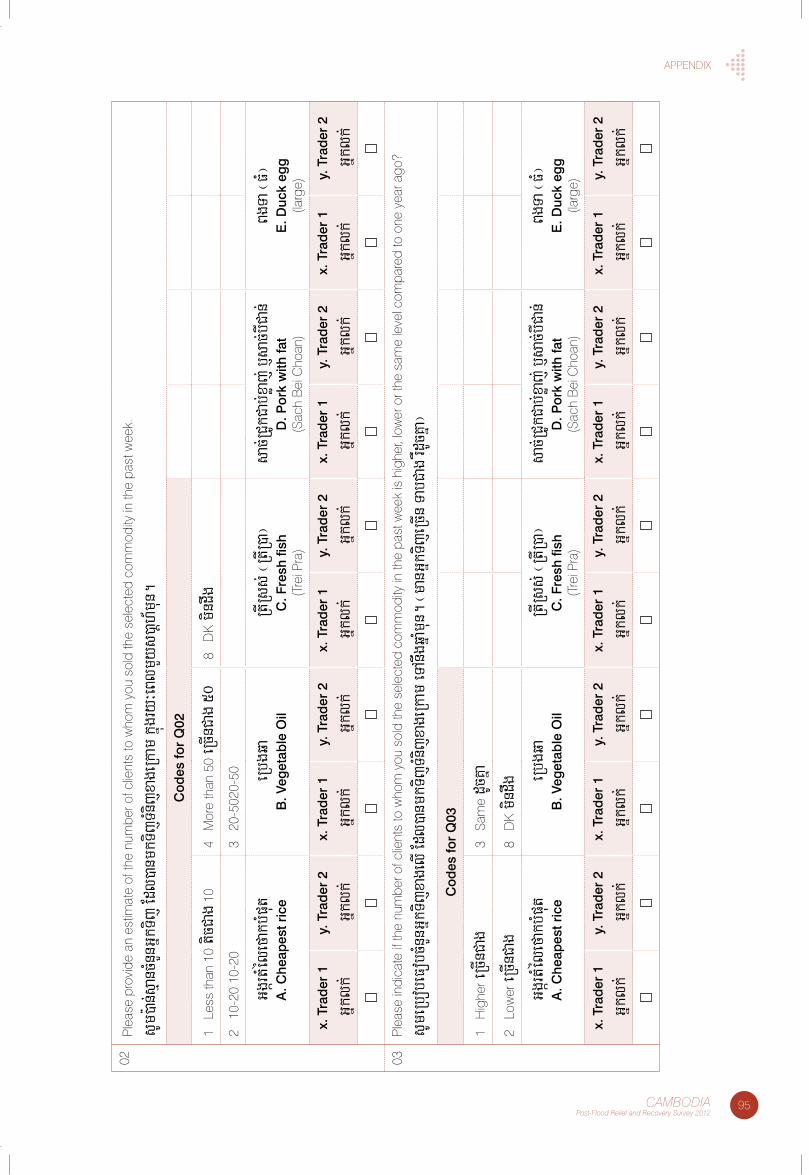
95CAMBODIAPost-Flood Relief and Recovery Survey 2012
aPPenDIX
02Pl
ease
pro
vide
an
estim
ate
of th
e nu
mbe
r of c
lient
s to
who
m y
ou s
old
the
sele
cted
com
mod
ity in
the
past
wee
k.
sUm
):an;s
µancMn
YnGñkT
ij E
dl)a
nmkT
ijTMn
ijxa
geRk
am k
ñúgry
³eBl
mYy
s)a
þh_m
un.
Cod
es fo
r Q
02
1 l
ess
than
10
ticCa
g 10
4 M
ore
than
50
eRcIn
Cag
508
DK
mind
wg
2 1
0-20
10-
203
20-
5020
-50
Ggár
tMél
efak
bMpu
ta
. Che
apes
t ric
eeR
bgq
a B
. Veg
etab
le O
ilRt
IRss
; ¬Rt
IR)a¦
C. F
resh
fish
(tre
i Pra
)
sac
;RCUkC
ab;xøa
j; b
Jsac
;bICa
n; D
. Por
k w
ith fa
t(s
ach
bei
cho
an)
BgTa
¬F
M¦e
. Duc
k eg
g
(larg
e)
x. T
rad
er 1
Gñkl
k;
y. T
rad
er 2
Gñkl
k;
x. T
rad
er 1
Gñkl
k;
y. T
rad
er 2
Gñkl
k;
x. T
rad
er 1
Gñkl
k;
y. T
rad
er 2
Gñkl
k;
x. T
rad
er 1
Gñkl
k;
y. T
rad
er 2
Gñkl
k;
x. T
rad
er 1
Gñkl
k;
y. T
rad
er 2
Gñkl
k;
03Pl
ease
indi
cate
if th
e nu
mbe
r of c
lient
s to
who
m y
ou s
old
the
sele
cted
com
mod
ity in
the
past
wee
k is
hig
her,
low
er o
r the
sam
e le
vel c
ompa
red
to o
ne y
ear a
go?
sUm
eRb
obeF
obcMn
YnGñkT
ijxa
gel
I Edl
)anm
kTij
TMnij
xage
Rkam
eTA
nwgq
ñaMmun.
¬m
anG
ñkTij
eRcIn
Tab
Cag
rWdUcK
ña¦
Cod
es fo
r Q
03
1 H
ighe
r eRc
InCag
3 s
ame
dUcKña
2 l
ower
eRcIn
Cag
8 D
K m
indwg
Ggár
tMél
efak
bMpu
ta
. Che
apes
t ric
eeR
bgq
a B
. Veg
etab
le O
ilRt
IRss
; ¬Rt
IR)a¦
C. F
resh
fish
(tre
i Pra
)
sac
;RCUkC
ab;xøa
j; b
Jsac
;bICa
n; D
. Por
k w
ith fa
t(s
ach
bei
cho
an)
BgTa
¬F
M¦e
. Duc
k eg
g
(larg
e)
x. T
rad
er 1
Gñkl
k;
y. T
rad
er 2
Gñkl
k;
x. T
rad
er 1
Gñkl
k;
y. T
rad
er 2
Gñkl
k;
x. T
rad
er 1
Gñkl
k;
y. T
rad
er 2
Gñkl
k;
x. T
rad
er 1
Gñkl
k;
y. T
rad
er 2
Gñkl
k;
x. T
rad
er 1
Gñkl
k;
y. T
rad
er 2
Gñkl
k;
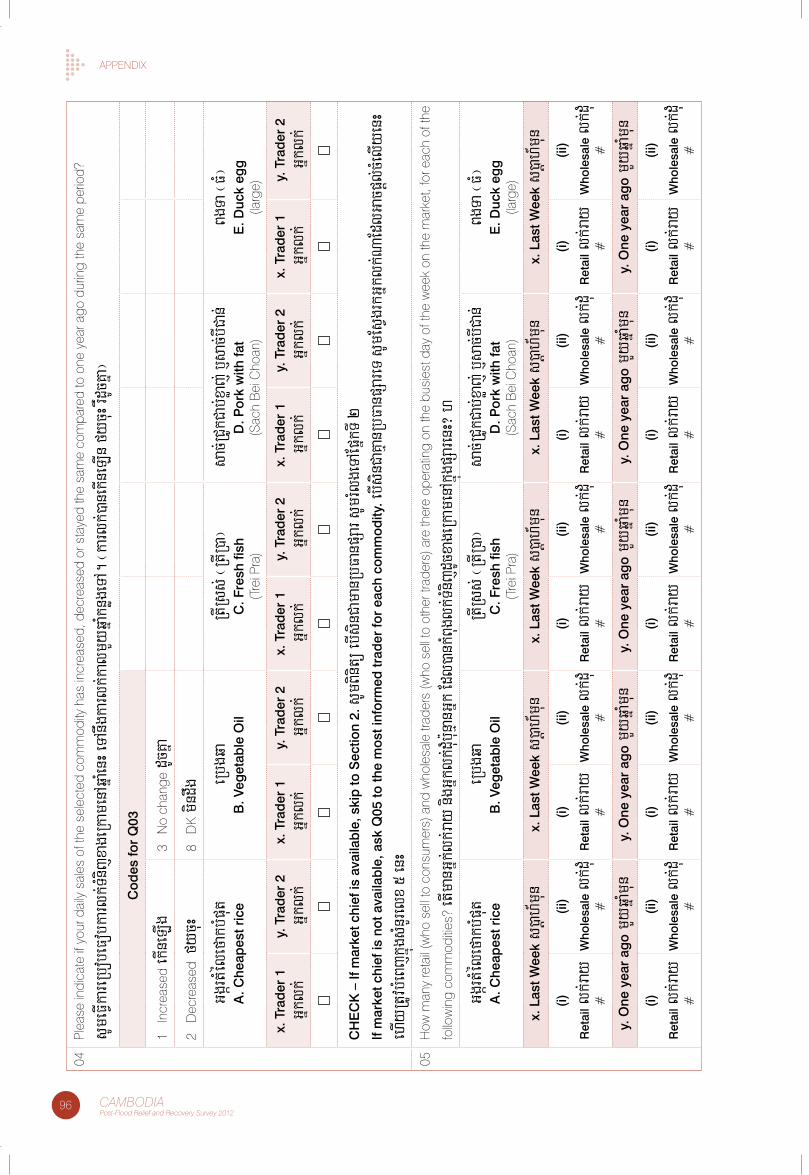
96 CAMBODIAPost-Flood Relief and Recovery Survey 2012
aPPenDIX04
Plea
se in
dica
te if
you
r dai
ly s
ales
of t
he s
elec
ted
com
mod
ity h
as in
crea
sed,
dec
reas
ed o
r sta
yed
the
sam
e co
mpa
red
to o
ne y
ear a
go d
urin
g th
e sa
me
perio
d?
sUm
eFVIk
areR
bob
eFob
karl
k;TMnij
xage
Rkam
enAq
ñaMenH
eTA
nwgka
rlk;k
alm
Yyq
ñaMknøg
eTA.
¬ka
rlk;)
anek
IneL
In fy
cuH r
WdUcKña
¦
Cod
es fo
r Q
03
1 I
ncre
ased
ekIne
LIg
3 n
o ch
ange
dUcK
ña
2 D
ecre
ased
fy
cuH8
DK
mind
wg
Ggár
tMél
efak
bMpu
ta
. Che
apes
t ric
eeR
bgq
a B
. Veg
etab
le O
ilRt
IRss
; ¬Rt
IR)a¦
C. F
resh
fish
(tre
i Pra
)
sac
;RCUkC
ab;xøa
j; b
Jsac
;bICa
n; D
. Por
k w
ith fa
t(s
ach
bei
cho
an)
BgTa
¬F
M¦e
. Duc
k eg
g
(larg
e)
x. T
rad
er 1
Gñkl
k;y.
Tra
der
2G
ñklk;
x. T
rad
er 1
Gñkl
k;y.
Tra
der
2G
ñklk;
x. T
rad
er 1
Gñkl
k;y.
Tra
der
2G
ñklk;
x. T
rad
er 1
Gñkl
k;y.
Tra
der
2G
ñklk;
x. T
rad
er 1
Gñkl
k;y.
Tra
der
2G
ñklk;
CH
eC
K –
If m
arke
t chi
ef is
ava
ilab
le, s
kip
to S
ectio
n 2.
sUm
Binitü
eb
IsinC
aman
RbF
anpS
ar s
UmrMl
geTA
EpñkT
I 2
If m
arke
t chi
ef is
not
ava
ilab
le, a
sk Q
05 to
the
mos
t inf
orm
ed tr
ader
for
each
com
mod
ity. e
bIs
inCaK
µanRb
Fan
pSar
eT s
UmEs
VgrkG
ñklk;N
aEdl
Gac
pþl;cMe
lIy
enH
ehIy
RtUvb
MeBj
kñúgs
MnYrel
x 5
enH
05H
ow m
any
reta
il (w
ho s
ell t
o co
nsum
ers)
and
who
lesa
le tr
ader
s (w
ho s
ell t
o ot
her t
rade
rs) a
re th
ere
oper
atin
g on
the
busi
est d
ay o
f the
wee
k on
the
mar
ket,
for e
ach
of th
e
follo
win
g co
mm
oditie
s? et
Iman
Gñk;
lk;r
ay n
igGñkl
k;dMub
:unµanG
ñk Ed
l)a
nkMBug
lk;T
MnijdUc
xage
Rkam
enAk
ñúgpSa
renH
? h
Ggár
tMél
efak
bMpu
ta
. Che
apes
t ric
eeR
bgq
a B
. Veg
etab
le O
ilRt
IRss
; ¬Rt
IR)a¦
C. F
resh
fish
(tre
i Pra
)
sac
;RCUkC
ab;xøa
j; b
Jsac
;bICa
n; D
. Por
k w
ith fa
t(s
ach
bei
cho
an)
BgTa
¬F
M¦e
. Duc
k eg
g
(larg
e)
x. L
ast W
eek
s)þa
h_m
unx.
Las
t Wee
k s
)þah
_mun
x. L
ast W
eek
s)þa
h_m
unx.
Las
t Wee
k s
)þah
_mun
x. L
ast W
eek
s)þa
h_m
un
(i)
Ret
ail l
k;ray
#
(ii)
Who
lesa
le l
k;dMu
#
(i)
Ret
ail l
k;ray
#
(ii)
Who
lesa
le l
k;dMu
#
(i)
Ret
ail l
k;ray
#
(ii)
Who
lesa
le l
k;dMu
#
(i)
Ret
ail l
k;ray
#
(ii)
Who
lesa
le l
k;dMu
#
(i)
Ret
ail l
k;ray
#
(ii)
Who
lesa
le l
k;dMu
#
y. O
ne y
ear
ago
mYy
qñaMm
uny.
One
yea
r ag
o m
Yyq
ñaMmun
y. O
ne y
ear
ago
mYy
qñaMm
uny.
One
yea
r ag
o m
Yyq
ñaMmun
y. O
ne y
ear
ago
mYy
qñaMm
un
(i)
Ret
ail l
k;ray
#
(ii)
Who
lesa
le l
k;dMu
#
(i)
Ret
ail l
k;ray
#
(ii)
Who
lesa
le l
k;dMu
#
(i)
Ret
ail l
k;ray
#
(ii)
Who
lesa
le l
k;dMu
#
(i)
Ret
ail l
k;ray
#
(ii)
Who
lesa
le l
k;dMu
#
(i)
Ret
ail l
k;ray
#
(ii)
Who
lesa
le l
k;dMu
#
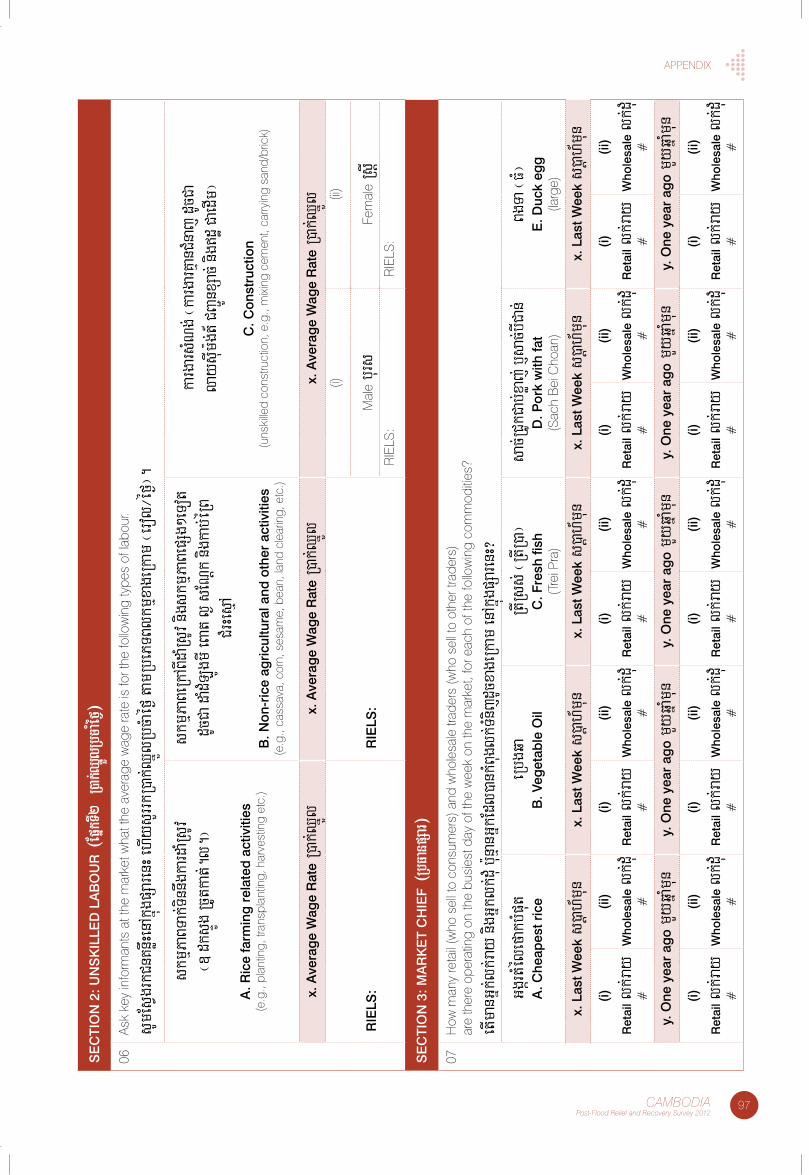
97CAMBODIAPost-Flood Relief and Recovery Survey 2012
aPPenDIX
Se
CTI
ON
2: U
NS
KIL
LeD
La
BO
UR
¬EpñkTI2 R)ak;QñÜlRbcaMéf¶¦
06as
k ke
y in
form
ants
at t
he m
arke
t wha
t the
ave
rage
wag
e ra
te is
for t
he fo
llow
ing
type
s of
labo
ur.
sUm
EsVgr
kCnK
nøwHen
Akñúgp
Sare
nH e
hIy
sYrr
kR)a
k;QñÜl
RbcMa
éf¶ t
amRb
ePTB
lkm
µxage
Rkam
¬er
ol¼é
f¶¦.
skm
µPaB
Tak;T
innwgk
arda
MRsUv
¬] d
ksÞÚg
RcUtk
at;.
l.
¦
a. R
ice
farm
ing
rel
ated
act
iviti
es(e
.g.,
plan
ting,
tran
spla
ntin
g, h
arve
stin
g et
c.)
skm
µPaB
eRkA
BIdaMR
sUv
nigs
kmµP
aBep
Sg²e
Tot
dUcCa
daMd
MLÚgm
I eBa
t l
¶ sEN
þk nig
kab
;éRB
CMrHe
sµA
B. N
on-r
ice
agric
ultu
ral a
nd o
ther
act
iviti
es(e
.g.,
cass
ava,
cor
n, s
esam
e, b
ean,
land
cle
arin
g, e
tc.)
karg
ars
MNg;
¬kar
garK
µanCMn
aj d
UcCa
lay
sIum
:g;t_ C
Ba¢Únx
Sac;
nig\d
æ Cae
dIm¦
C. C
onst
ruct
ion
(uns
kille
d co
nstru
ctio
n, e
.g.,
mixi
ng c
emen
t, ca
rryin
g sa
nd/b
rick)
x. a
vera
ge
Wag
e R
ate
R)ak
;QñÜl
x. a
vera
ge
Wag
e R
ate
R)ak
;QñÜl
x. a
vera
ge
Wag
e R
ate
R)ak
;QñÜl
RIe
LS:
RIe
LS:
(i)(ii
)
Mal
e b
ursfe
mal
e Rs
þIR
Iels
:R
Iels
:
Se
CTI
ON
3: M
aR
Ke
T C
HIe
F ¬RbFanpSar¦
07H
ow m
any
reta
il (w
ho s
ell t
o co
nsum
ers)
and
who
lesa
le tr
ader
s (w
ho s
ell t
o ot
her t
rade
rs)
are
ther
e op
erat
ing
on th
e bu
sies
t day
of t
he w
eek
on th
e m
arke
t, fo
r eac
h of
the
follo
win
g co
mm
oditie
s?
etIm
anG
ñk;l
k;ray
nigG
ñklk;d
Mu b:unµa
nGñkE
dl)a
nkMBug
lk;T
MnijdUc
xage
Rkam
enA
kñúgp
Sare
nH?
Ggár
tMél
efak
bMpu
ta
. Che
apes
t ric
eeR
bgq
a B
. Veg
etab
le O
ilRt
IRss
; ¬Rt
IR)a¦
C. F
resh
fish
(tre
i Pra
)
sac
;RCUkC
ab;xøa
j; b
Jsac
;bICa
n; D
. Por
k w
ith fa
t(s
ach
bei
cho
an)
BgTa
¬F
M¦e
. Duc
k eg
g
(larg
e)
x. L
ast W
eek
s)þa
h_m
unx.
Las
t Wee
k s
)þah
_mun
x. L
ast W
eek
s)þa
h_m
unx.
Las
t Wee
k s
)þah
_mun
x. L
ast W
eek
s)þa
h_m
un
(i)
Ret
ail l
k;ray
#
(ii)
Who
lesa
le l
k;dMu
#
(i)
Ret
ail l
k;ray
#
(ii)
Who
lesa
le l
k;dMu
#
(i)
Ret
ail l
k;ray
#
(ii)
Who
lesa
le l
k;dMu
#
(i)
Ret
ail l
k;ray
#
(ii)
Who
lesa
le l
k;dMu
#
(i)
Ret
ail l
k;ray
#
(ii)
Who
lesa
le l
k;dMu
#
y. O
ne y
ear
ago
mYy
qñaMm
uny.
One
yea
r ag
o m
Yyq
ñaMmun
y. O
ne y
ear
ago
mYy
qñaMm
uny.
One
yea
r ag
o m
Yyq
ñaMmun
y. O
ne y
ear
ago
mYy
qñaMm
un
(i)
Ret
ail l
k;ray
#
(ii)
Who
lesa
le l
k;dMu
#
(i)
Ret
ail l
k;ray
#
(ii)
Who
lesa
le l
k;dMu
#
(i)
Ret
ail l
k;ray
#
(ii)
Who
lesa
le l
k;dMu
#
(i)
Ret
ail l
k;ray
#
(ii)
Who
lesa
le l
k;dMu
#
(i)
Ret
ail l
k;ray
#
(ii)
Who
lesa
le l
k;dMu
#
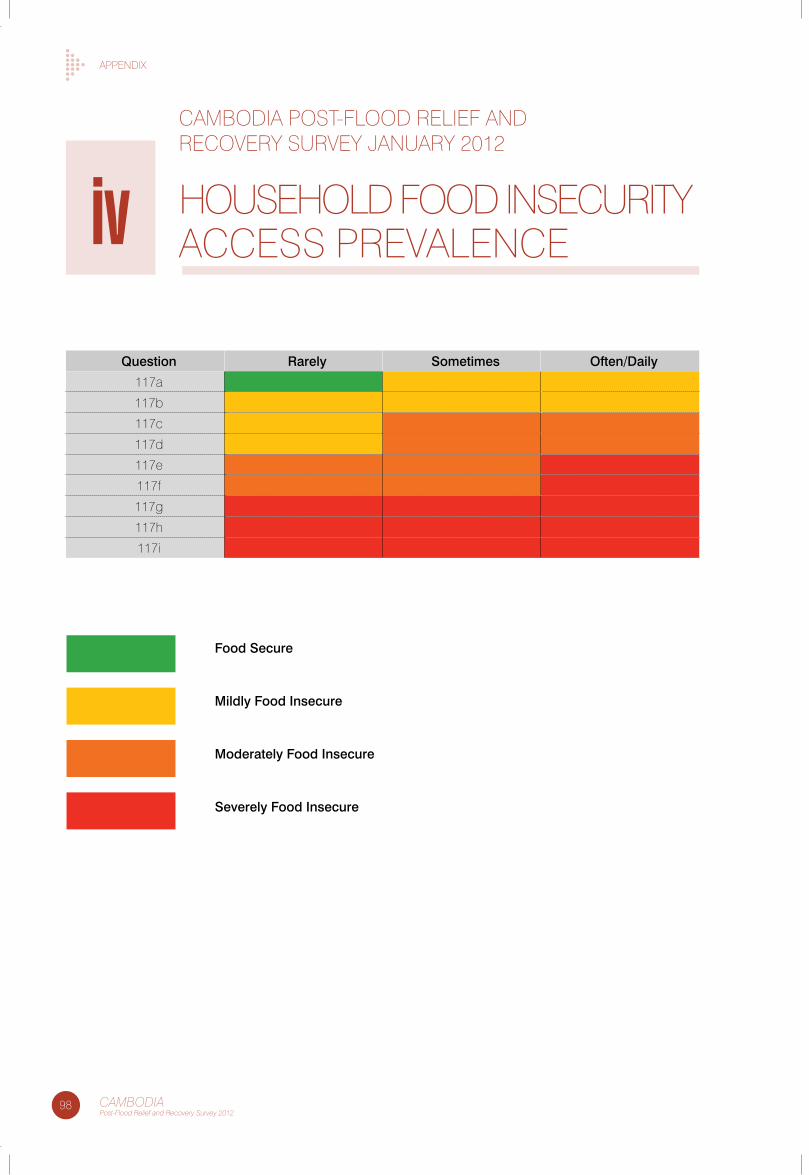
98 CAMBODIAPost-Flood Relief and Recovery Survey 2012
aPPenDIX
caMboDIa Post-flooD RelIef anD RecoVeRy sURVey JanUaRy 2012
HoUseHolD fooD InsecURIty access PReValenceiv
Question Rarely Sometimes Often/Daily
117a
117b
117c
117d
117e
117f
117g
117h
117i
Food Secure
Mildly Food Insecure
Moderately Food Insecure
Severely Food Insecure
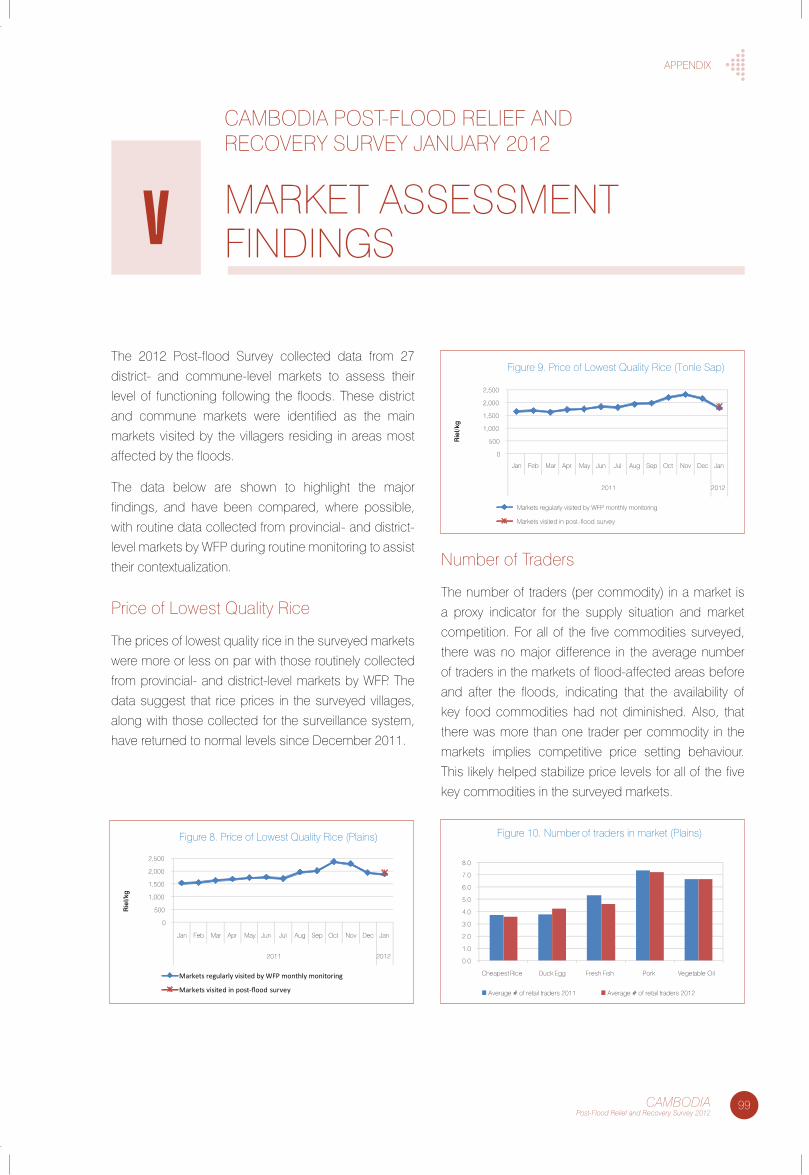
99CAMBODIAPost-Flood Relief and Recovery Survey 2012
aPPenDIX
caMboDIa Post-flooD RelIef anD RecoVeRy sURVey JanUaRy 2012
MaRKet assessMent fInDInGsv
the 2012 Post-flood survey collected data from 27
district- and commune-level markets to assess their
level of functioning following the floods. these district
and commune markets were identified as the main
markets visited by the villagers residing in areas most
affected by the floods.
the data below are shown to highlight the major
findings, and have been compared, where possible,
with routine data collected from provincial- and district-
level markets by WfP during routine monitoring to assist
their contextualization.
Price of lowest Quality Rice
the prices of lowest quality rice in the surveyed markets
were more or less on par with those routinely collected
from provincial- and district-level markets by WfP. the
data suggest that rice prices in the surveyed villages,
along with those collected for the surveillance system,
have returned to normal levels since December 2011.
number of traders
the number of traders (per commodity) in a market is
a proxy indicator for the supply situation and market
competition. for all of the five commodities surveyed,
there was no major difference in the average number
of traders in the markets of flood-affected areas before
and after the floods, indicating that the availability of
key food commodities had not diminished. also, that
there was more than one trader per commodity in the
markets implies competitive price setting behaviour.
this likely helped stabilize price levels for all of the five
key commodities in the surveyed markets.
Jan Feb Mar Apr May Jun Jul Aug Sep Oct Nov Dec Jan
Figure 8. Price of Lowest Quality Rice (Plains)
Rie
l/kg
0
500
1,000
1,500
2,000
2,500
2011 2012
Markets regularly visited by WFP monthly monitoring
Markets visited in post-flood survey
Jan Feb Mar Apr May Jun Jul Aug Sep Oct Nov Dec Jan
Figure 9. Price of Lowest Quality Rice (Tonle Sap)
Rie
l/kg
0
500
1,000
1,500
2,000
2,500
2011 2012
Markets regularly visited by WFP monthly monitoring
Markets visited in post-flood survey
Figure 10. Number of traders in market (Plains)
0.0
1.0
2.0
3.0
4.0
5.0
6.0
7.0
8.0
Cheapest Rice Duck Egg Fresh Fish Pork Vegetable Oil
Average # of retail traders 2011 Average # of retail traders 2012
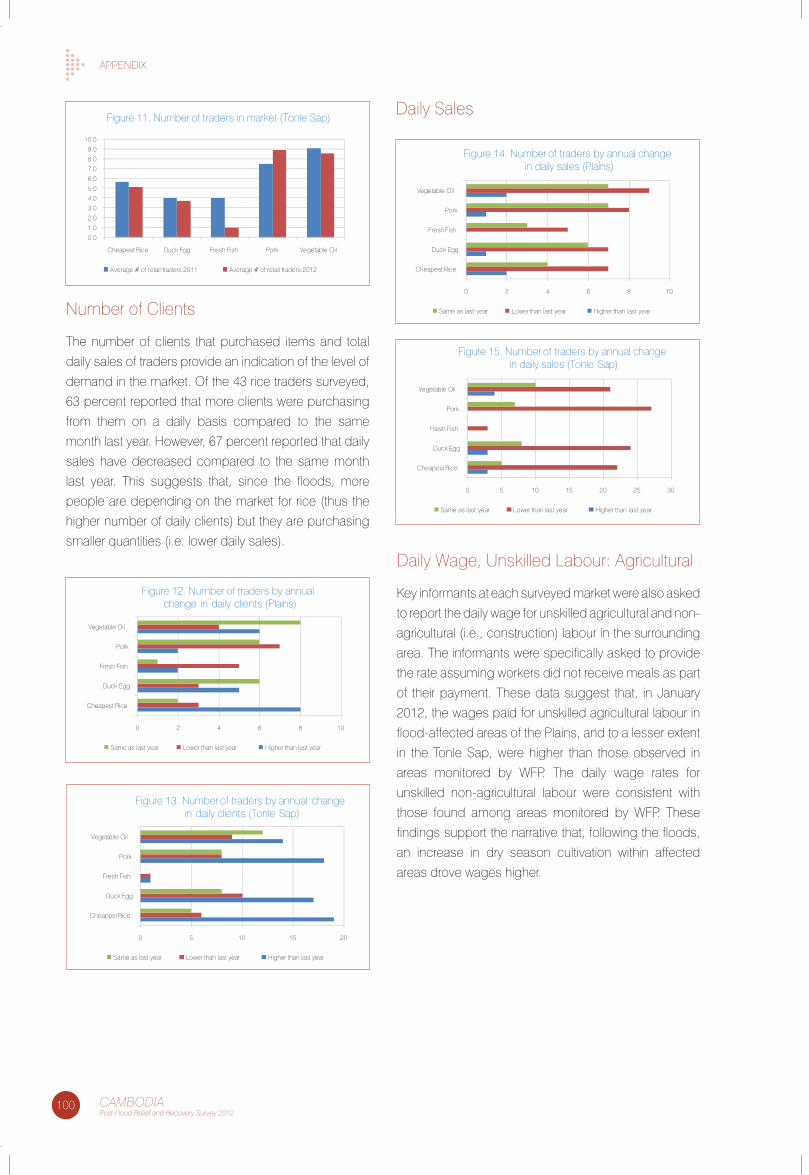
100 CAMBODIAPost-Flood Relief and Recovery Survey 2012
aPPenDIX
Figure 11. Number of traders in market (Tonle Sap)
0.01.02.03.04.05.06.07.08.09.0
10.0
Cheapest Rice Duck Egg Fresh Fish Pork Vegetable Oil
Average # of retail traders 2011 Average # of retail traders 2012
Daily sales
number of clients
the number of clients that purchased items and total
daily sales of traders provide an indication of the level of
demand in the market. of the 43 rice traders surveyed,
63 percent reported that more clients were purchasing
from them on a daily basis compared to the same
month last year. However, 67 percent reported that daily
sales have decreased compared to the same month
last year. this suggests that, since the floods, more
people are depending on the market for rice (thus the
higher number of daily clients) but they are purchasing
smaller quantities (i.e. lower daily sales).
Daily Wage, Unskilled labour: agricultural
Key informants at each surveyed market were also asked
to report the daily wage for unskilled agricultural and non-
agricultural (i.e., construction) labour in the surrounding
area. the informants were specifically asked to provide
the rate assuming workers did not receive meals as part
of their payment. these data suggest that, in January
2012, the wages paid for unskilled agricultural labour in
flood-affected areas of the Plains, and to a lesser extent
in the tonle sap, were higher than those observed in
areas monitored by WfP. the daily wage rates for
unskilled non-agricultural labour were consistent with
those found among areas monitored by WfP. these
findings support the narrative that, following the floods,
an increase in dry season cultivation within affected
areas drove wages higher.
0 2 4 6 8 10
Cheapest Rice
Duck Egg
Fresh Fish
Pork
Vegetable Oil
Figure 12. Number of traders by annual change in daily clients (Plains)
Same as last year Lower than last year Higher than last year
0 5 10 15 20
Cheapest Rice
Duck Egg
Fresh Fish
Pork
Vegetable Oil
Figure 13. Number of traders by annual change in daily clients (Tonle Sap)
Same as last year Lower than last year Higher than last year
0 2 4 6 8 10
Cheapest Rice
Duck Egg
Fresh Fish
Pork
Vegetable Oil
Figure 14. Number of traders by annual change in daily sales (Plains)
Same as last year Lower than last year Higher than last year
0 5 10 15 20 25 30
Cheapest Rice
Duck Egg
Fresh Fish
Pork
Vegetable Oil
Figure 15. Number of traders by annual change in daily sales (Tonle Sap)
Same as last year Lower than last year Higher than last year
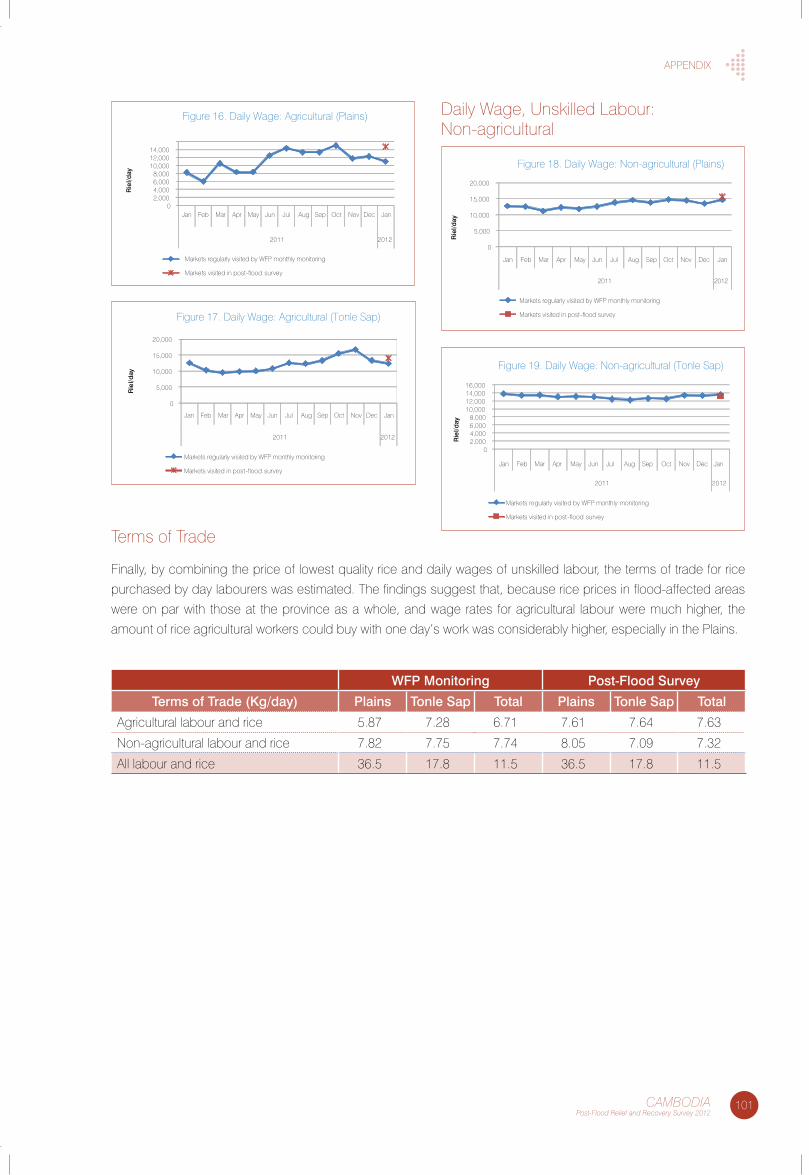
101CAMBODIAPost-Flood Relief and Recovery Survey 2012
aPPenDIX
Daily Wage, Unskilled labour: non-agricultural
terms of trade
finally, by combining the price of lowest quality rice and daily wages of unskilled labour, the terms of trade for rice
purchased by day labourers was estimated. the findings suggest that, because rice prices in flood-affected areas
were on par with those at the province as a whole, and wage rates for agricultural labour were much higher, the
amount of rice agricultural workers could buy with one day’s work was considerably higher, especially in the Plains.
Jan Feb Mar Apr May Jun Jul Aug Sep Oct Nov Dec Jan
Figure 17. Daily Wage: Agricultural (Tonle Sap)
Rie
l/day
0
5,000
10,000
15,000
20,000
2011 2012
Markets regularly visited by WFP monthly monitoring
Markets visited in post-flood survey
Jan Feb Mar Apr May Jun Jul Aug Sep Oct Nov Dec Jan
Figure 16. Daily Wage: Agricultural (Plains)R
iel/d
ay
02,0004,0006,0008,000
10,00012,00014,000
2011 2012
Markets regularly visited by WFP monthly monitoring
Markets visited in post-flood survey
0
5,000
10,000
15,000
20,000
Jan Feb Mar Apr May Jun Jul Aug Sep Oct Nov Dec Jan
2011 2012
Figure 18. Daily Wage: Non-agricultural (Plains)
Markets regularly visited by WFP monthly monitoring
Markets visited in post-flood survey
Rie
l/day
Jan Feb Mar Apr May Jun Jul Aug Sep Oct Nov Dec Jan
Figure 19. Daily Wage: Non-agricultural (Tonle Sap)
02,0004,0006,0008,000
10,00012,00014,00016,000
2011 2012
Rie
l/day
Markets regularly visited by WFP monthly monitoring
Markets visited in post-flood survey
WFP Monitoring Post-Flood Survey
Terms of Trade (Kg/day) Plains Tonle Sap Total Plains Tonle Sap Total
agricultural labour and rice 5.87 7.28 6.71 7.61 7.64 7.63
non-agricultural labour and rice 7.82 7.75 7.74 8.05 7.09 7.32
all labour and rice 36.5 17.8 11.5 36.5 17.8 11.5
102 CAMBODIAPost-Flood Relief and Recovery Survey 2012
aPPenDIX
caMboDIa Post-flooD RelIef anD RecoVeRy sURVey JanUaRy 2012
saMPlInG fRaMevi
Action Aid/Savann Oeurm/2011.
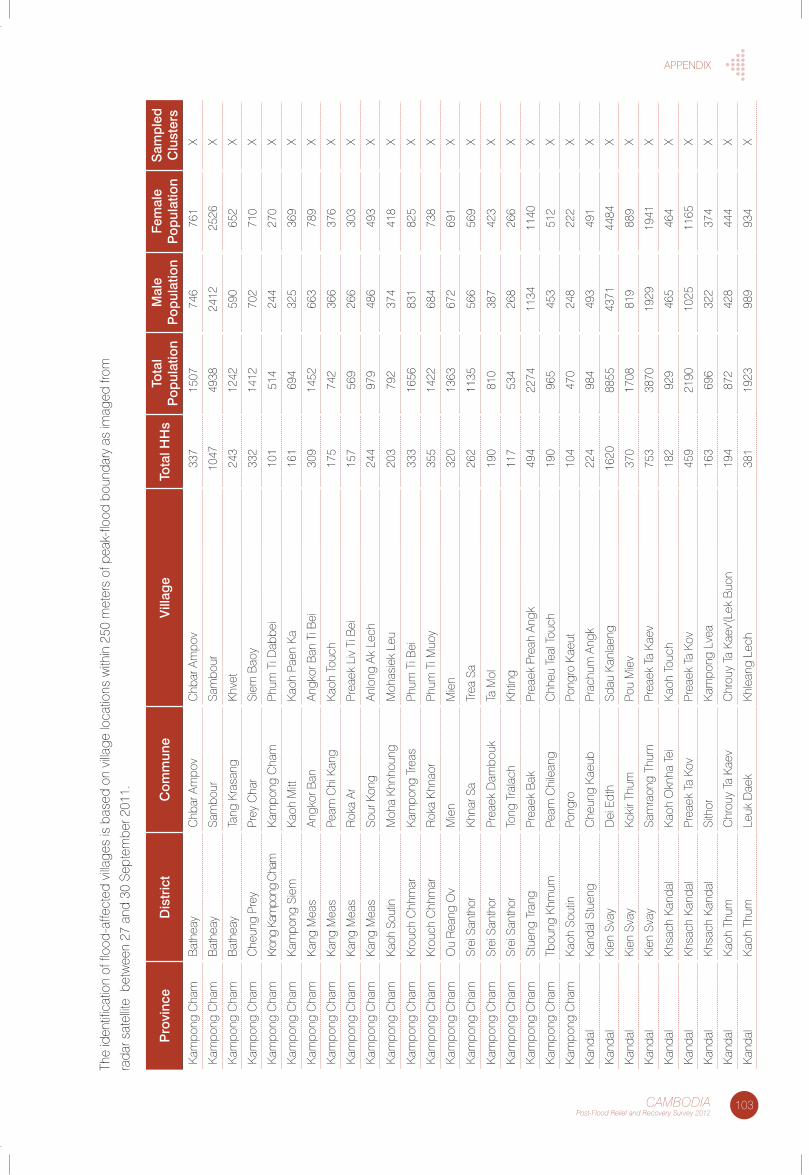
103CAMBODIAPost-Flood Relief and Recovery Survey 2012
aPPenDIX
the
iden
tific
atio
n of
floo
d-af
fect
ed v
illage
s is
bas
ed o
n vi
llage
loca
tions
with
in 2
50 m
eter
s of
pea
k-flo
od b
ound
ary
as im
aged
from
rada
r sat
ellite
bet
wee
n 27
and
30
sept
embe
r 201
1.
Pro
vinc
eD
istr
ict
Com
mun
eV
illag
eTo
tal H
Hs
Tota
l P
opul
atio
nM
ale
Pop
ulat
ion
Fem
ale
Pop
ulat
ion
Sam
ple
d
Clu
ster
sK
ampo
ng c
ham
bat
heay
chb
ar a
mpo
vc
hbar
am
pov
337
1507
746
761
X
Kam
pong
cha
mb
athe
aysa
mbo
ursa
mbo
ur10
4749
3824
1225
26X
Kam
pong
cha
mb
athe
ayta
ng K
rasa
ngKh
vet
243
1242
590
652
X
Kam
pong
cha
mc
heun
g Pr
eyPr
ey c
har
siem
bao
y33
214
1270
271
0X
Kam
pong
cha
mKr
ong
Kam
pong
cha
mK
ampo
ng c
ham
Phum
ti D
abbe
i10
151
424
427
0X
Kam
pong
cha
mK
ampo
ng s
iem
Kao
h M
ittK
aoh
Paen
Ka
161
694
325
369
X
Kam
pong
cha
mK
ang
Mea
san
gkor
ban
angk
or b
an t
i bei
309
1452
663
789
X
Kam
pong
cha
mK
ang
Mea
sPe
am c
hi K
ang
Kao
h to
uch
175
742
366
376
X
Kam
pong
cha
mK
ang
Mea
sR
oka
arPr
eaek
liv
ti b
ei15
756
926
630
3X
Kam
pong
cha
mK
ang
Mea
sso
ur K
ong
anlo
ng a
k le
ch24
497
948
649
3X
Kam
pong
cha
mKa
oh s
outin
Moh
a Kh
nhou
ngM
ohas
iek
leu
203
792
374
418
X
Kam
pong
cha
mKr
ouch
chh
mar
Kam
pong
tre
asPh
um t
i bei
333
1656
831
825
X
Kam
pong
cha
mKr
ouch
chh
mar
Rok
a Kh
naor
Phum
ti M
uoy
355
1422
684
738
X
Kam
pong
cha
mo
u R
eang
ov
Mie
nM
ien
320
1363
672
691
X
Kam
pong
cha
msr
ei s
anth
orKh
nar s
atr
ea s
a26
211
3556
656
9X
Kam
pong
cha
msr
ei s
anth
orPr
eaek
Dam
bouk
ta M
ol19
081
038
742
3X
Kam
pong
cha
msr
ei s
anth
orto
ng t
rala
chKh
ting
117
534
268
266
X
Kam
pong
cha
mst
ueng
tra
ngPr
eaek
bak
Prea
ek P
reah
ang
k49
422
7411
3411
40X
Kam
pong
cha
mtb
oung
Khm
umPe
am c
hile
ang
chh
eu t
eal t
ouch
190
965
453
512
X
Kam
pong
cha
mK
aoh
sout
inPo
ngro
Pong
ro K
aeut
104
470
248
222
X
Kan
dal
Kan
dal s
tuen
gc
heun
g K
aeub
Prac
hum
ang
k22
498
449
349
1X
Kan
dal
Kien
sva
yD
ei e
dth
sdau
Kan
laen
g16
2088
5543
7144
84X
Kan
dal
Kien
sva
yKo
kir t
hum
Pou
Mie
v37
017
0881
988
9X
Kan
dal
Kien
sva
ysa
mra
ong
thum
Prea
ek t
a K
aev
753
3870
1929
1941
X
Kan
dal
Khsa
ch K
anda
lK
aoh
okn
ha t
eiK
aoh
touc
h18
292
946
546
4X
Kan
dal
Khsa
ch K
anda
lPr
eaek
ta
Kov
Prea
ek t
a Ko
v45
921
9010
2511
65X
Kan
dal
Khsa
ch K
anda
lsi
thor
Kam
pong
lve
a16
369
632
237
4X
Kan
dal
Kao
h th
umc
hrou
y ta
Kae
vc
hrou
y ta
Kae
v'(le
k b
uon
194
872
428
444
X
Kan
dal
Kao
h th
umle
uk D
aek
Khle
ang
lech
381
1923
989
934
X
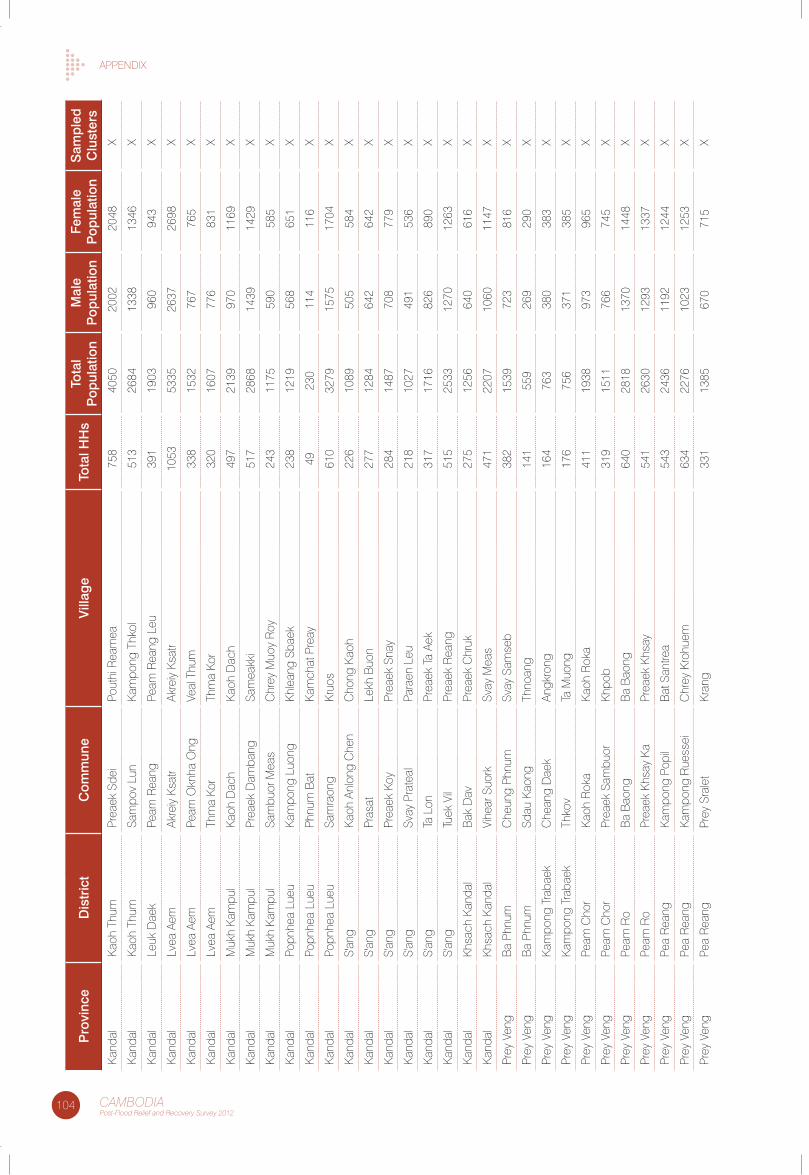
104 CAMBODIAPost-Flood Relief and Recovery Survey 2012
aPPenDIX
Pro
vinc
eD
istr
ict
Com
mun
eV
illag
eTo
tal H
Hs
Tota
l P
opul
atio
nM
ale
Pop
ulat
ion
Fem
ale
Pop
ulat
ion
Sam
ple
d
Clu
ster
sK
anda
lK
aoh
thum
Prea
ek s
dei
Pout
hi R
eam
ea75
840
5020
0220
48X
Kan
dal
Kao
h th
umsa
mpo
v lu
nK
ampo
ng t
hkol
513
2684
1338
1346
X
Kan
dal
leuk
Dae
kPe
am R
eang
Peam
Rea
ng l
eu39
119
0396
094
3X
Kan
dal
lvea
aem
akre
iy K
satr
akre
iy K
satr
1053
5335
2637
2698
X
Kan
dal
lvea
aem
Peam
okn
ha o
ngVe
al t
hum
338
1532
767
765
X
Kan
dal
lvea
aem
thm
a Ko
rth
ma
Kor
320
1607
776
831
X
Kan
dal
Muk
h K
ampu
lK
aoh
Dac
hK
aoh
Dac
h49
721
3997
011
69X
Kan
dal
Muk
h K
ampu
lPr
eaek
Dam
bang
sam
eakk
i51
728
6814
3914
29X
Kan
dal
Muk
h K
ampu
lsa
mbu
or M
eas
chr
ey M
uoy
Roy
243
1175
590
585
X
Kan
dal
Popn
hea
lueu
Kam
pong
luo
ngKh
lean
g sb
aek
238
1219
568
651
X
Kan
dal
Popn
hea
lueu
Phnu
m b
atK
amch
at P
reay
4923
011
411
6X
Kan
dal
Popn
hea
lueu
sam
raon
gKr
uos
610
3279
1575
1704
X
Kan
dal
s'an
gK
aoh
anlo
ng c
hen
cho
ng K
aoh
226
1089
505
584
X
Kan
dal
s'an
gPr
asat
lekh
buo
n27
712
8464
264
2X
Kan
dal
s'an
gPr
eaek
Koy
Prea
ek s
nay
284
1487
708
779
X
Kan
dal
s'an
gsv
ay P
rate
alPa
raen
leu
218
1027
491
536
X
Kan
dal
s'an
gta
lon
Prea
ek t
a ae
k31
717
1682
689
0X
Kan
dal
s'an
gtu
ek V
ilPr
eaek
Rea
ng51
525
3312
7012
63X
Kan
dal
Khsa
ch K
anda
lb
ak D
avPr
eaek
chr
uk27
512
5664
061
6X
Kan
dal
Khsa
ch K
anda
lVi
hear
suo
rksv
ay M
eas
471
2207
1060
1147
X
Prey
Ven
gb
a Ph
num
che
ung
Phnu
msv
ay s
amse
b38
215
3972
381
6X
Prey
Ven
gb
a Ph
num
sdau
Kao
ngth
noan
g14
155
926
929
0X
Prey
Ven
gK
ampo
ng t
raba
ekc
hean
g D
aek
angk
rong
164
763
380
383
X
Prey
Ven
gK
ampo
ng t
raba
ekth
kov
ta M
uong
176
756
371
385
X
Prey
Ven
gPe
am c
hor
Kao
h R
oka
Kao
h R
oka
411
1938
973
965
X
Prey
Ven
gPe
am c
hor
Prea
ek s
ambu
orKh
pob
319
1511
766
745
X
Prey
Ven
gPe
am R
ob
a b
aong
ba
bao
ng64
028
1813
7014
48X
Prey
Ven
gPe
am R
oPr
eaek
Khs
ay K
aPr
eaek
Khs
ay54
126
3012
9313
37X
Prey
Ven
gPe
a R
eang
Kam
pong
Pop
ilb
at s
antre
a54
324
3611
9212
44X
Prey
Ven
gPe
a R
eang
Kam
pong
Rue
ssei
chr
ey K
rohu
em63
422
7610
2312
53X
Prey
Ven
gPe
a R
eang
Prey
sra
let
Kran
g33
113
8567
071
5X
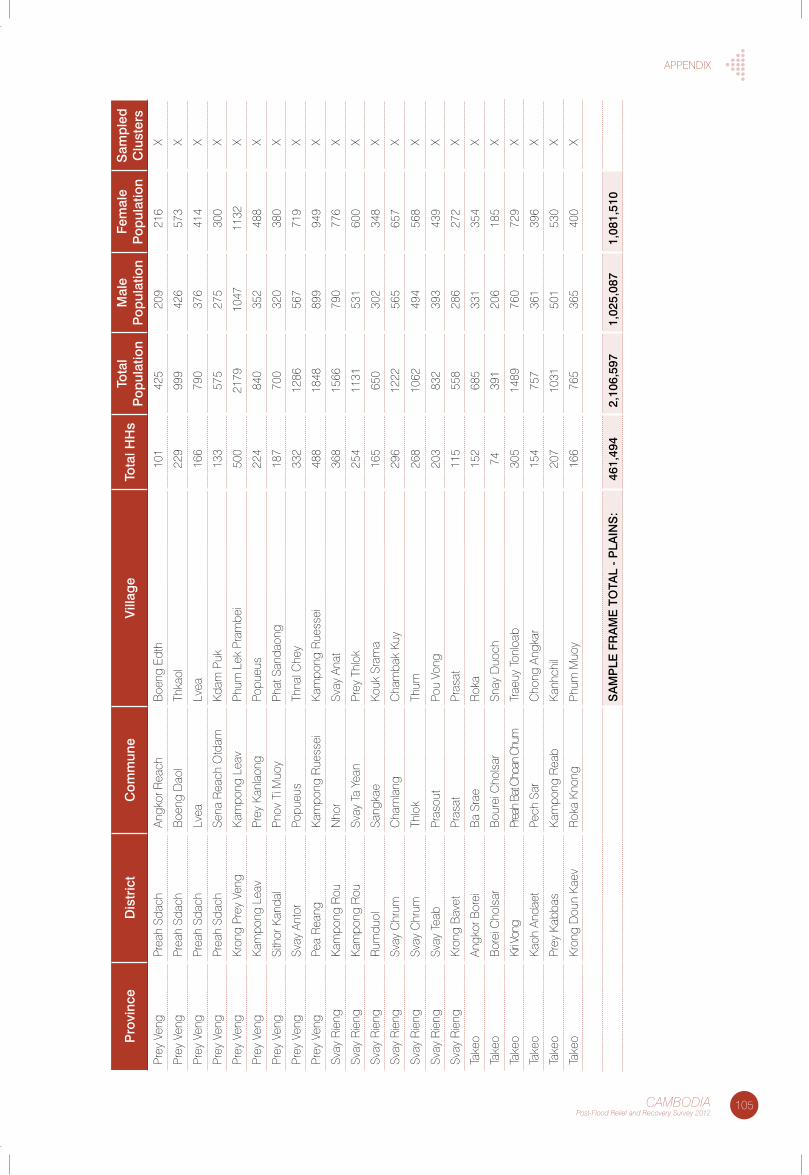
105CAMBODIAPost-Flood Relief and Recovery Survey 2012
aPPenDIX
Pro
vinc
eD
istr
ict
Com
mun
eV
illag
eTo
tal H
Hs
Tota
l P
opul
atio
nM
ale
Pop
ulat
ion
Fem
ale
Pop
ulat
ion
Sam
ple
d
Clu
ster
sPr
ey V
eng
Prea
h sd
ach
angk
or R
each
boe
ng e
dth
101
425
209
216
X
Prey
Ven
gPr
eah
sdac
hb
oeng
Dao
lth
kaol
229
999
426
573
X
Prey
Ven
gPr
eah
sdac
hlv
ealv
ea16
679
037
641
4X
Prey
Ven
gPr
eah
sdac
hse
na R
each
otd
amKd
am P
uk13
357
527
530
0X
Prey
Ven
gKr
ong
Prey
Ven
gK
ampo
ng l
eav
Phum
lek
Pra
mbe
i50
021
7910
4711
32X
Prey
Ven
gK
ampo
ng l
eav
Prey
Kan
laon
gPo
pueu
s22
484
035
248
8X
Prey
Ven
gsi
thor
Kan
dal
Pnov
ti M
uoy
Phat
san
daon
g18
770
032
038
0X
Prey
Ven
gsv
ay a
ntor
Popu
eus
thna
l che
y33
212
8656
771
9X
Prey
Ven
gPe
a R
eang
Kam
pong
Rue
ssei
Kam
pong
Rue
ssei
488
1848
899
949
X
svay
Rie
ngK
ampo
ng R
oun
hor
svay
ana
t36
815
6679
077
6X
svay
Rie
ngK
ampo
ng R
ousv
ay t
a ye
anPr
ey t
hlok
254
1131
531
600
X
svay
Rie
ngR
umdu
olsa
ngka
eKo
uk s
ram
a16
565
030
234
8X
svay
Rie
ngsv
ay c
hrum
cha
mla
ngc
ham
bak
Kuy
296
1222
565
657
X
svay
Rie
ngsv
ay c
hrum
thlo
kth
um26
810
6249
456
8X
svay
Rie
ngsv
ay t
eab
Pras
out
Pou
Vong
203
832
393
439
X
svay
Rie
ngKr
ong
bav
etPr
asat
Pras
at11
555
828
627
2X
take
oan
gkor
bor
eib
a sr
aeR
oka
152
685
331
354
X
take
ob
orei
cho
lsar
bou
rei c
hols
arsn
ay D
uoch
7439
120
618
5X
take
oKi
ri Von
gPr
eah
bat c
hoan
chu
mtr
aeuy
ton
loab
305
1489
760
729
X
take
oK
aoh
anda
etPe
ch s
arc
hong
ang
kar
154
757
361
396
X
take
oPr
ey K
abba
sK
ampo
ng R
eab
Kan
hchi
l20
710
3150
153
0X
take
oKr
ong
Dou
n K
aev
Rok
a Kn
ong
Phum
Muo
y16
676
536
540
0X
Sa
MP
Le F
Ra
Me
TO
TaL
- P
LaIN
S:
461,
494
2,10
6,59
71,
025,
087
1,08
1,51
0
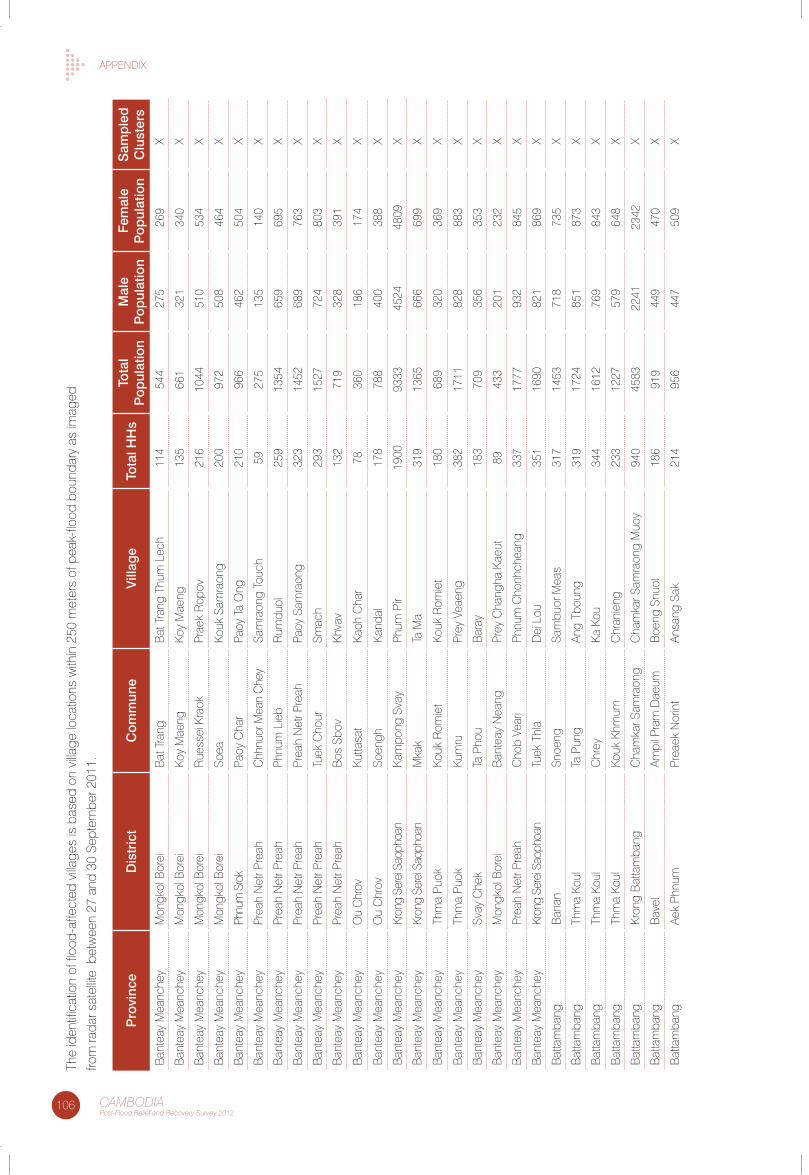
106 CAMBODIAPost-Flood Relief and Recovery Survey 2012
aPPenDIXth
e id
entif
icat
ion
of fl
ood-
affe
cted
villa
ges
is b
ased
on
villa
ge lo
catio
ns w
ithin
250
met
ers
of p
eak-
flood
bou
ndar
y as
imag
ed
from
rada
r sat
ellite
bet
wee
n 27
and
30
sept
embe
r 201
1.
Pro
vinc
eD
istr
ict
Com
mun
eV
illag
eTo
tal H
Hs
Tota
l P
opul
atio
nM
ale
Pop
ulat
ion
Fem
ale
Pop
ulat
ion
Sam
ple
d
Clu
ster
sb
ante
ay M
eanc
hey
Mon
gkol
bor
eib
at t
rang
bat
tra
ng t
hum
lec
h11
454
427
526
9X
ban
teay
Mea
nche
yM
ongk
ol b
orei
Koy
Mae
ngKo
y M
aeng
135
661
321
340
X
ban
teay
Mea
nche
yM
ongk
ol b
orei
Rue
ssei
Kra
okPr
aek
Rop
ov21
610
4451
053
4X
ban
teay
Mea
nche
yM
ongk
ol b
orei
soea
Kouk
sam
raon
g20
097
250
846
4X
ban
teay
Mea
nche
yPh
num
sro
kPa
oy c
har
Paoy
ta
ong
210
966
462
504
X
ban
teay
Mea
nche
yPr
eah
net
r Pre
ahc
hhnu
or M
ean
che
ysa
mra
ong
touc
h59
275
135
140
X
ban
teay
Mea
nche
yPr
eah
net
r Pre
ahPh
num
lie
bR
umdu
ol25
913
5465
969
5X
ban
teay
Mea
nche
yPr
eah
net
r Pre
ahPr
eah
net
r Pre
ahPa
oy s
amra
ong
323
1452
689
763
X
ban
teay
Mea
nche
yPr
eah
net
r Pre
ahtu
ek c
hour
smac
h29
315
2772
480
3X
ban
teay
Mea
nche
yPr
eah
net
r Pre
ahb
os s
bov
Khva
v13
271
932
839
1X
ban
teay
Mea
nche
yo
u c
hrov
Kutta
sat
Kao
h c
har
7836
018
617
4X
ban
teay
Mea
nche
yo
u c
hrov
soen
ghK
anda
l17
878
840
038
8X
ban
teay
Mea
nche
yKr
ong
sere
i sao
phoa
nK
ampo
ng s
vay
Phum
Pir
1900
9333
4524
4809
X
ban
teay
Mea
nche
yKr
ong
sere
i sao
phoa
nM
kak
ta M
a31
913
6566
669
9X
ban
teay
Mea
nche
yth
ma
Puok
Kouk
Rom
iet
Kouk
Rom
iet
180
689
320
369
X
ban
teay
Mea
nche
yth
ma
Puok
Kum
ruPr
ey V
eaen
g38
217
1182
888
3X
ban
teay
Mea
nche
ysv
ay c
hek
ta P
hou
bar
ay18
370
935
635
3X
ban
teay
Mea
nche
yM
ongk
ol b
orei
ban
teay
nea
ngPr
ey c
hang
ha K
aeut
8943
320
123
2X
ban
teay
Mea
nche
yPr
eah
net
r Pre
ahc
hob
Vear
iPh
num
cho
nhch
eang
337
1777
932
845
X
ban
teay
Mea
nche
yKr
ong
sere
i sao
phoa
ntu
ek t
hla
Dei
lou
351
1690
821
869
X
bat
tam
bang
ban
ansn
oeng
sam
buor
Mea
s31
714
5371
873
5X
bat
tam
bang
thm
a Ko
ulta
Pun
gan
g tb
oung
319
1724
851
873
X
bat
tam
bang
thm
a Ko
ulc
hrey
Ka
Kou
344
1612
769
843
X
bat
tam
bang
thm
a Ko
ulKo
uk K
hmum
chr
anie
ng23
312
2757
964
8X
bat
tam
bang
Kron
g b
atta
mba
ngc
ham
kar s
amra
ong
cha
mka
r sam
raon
g M
uoy
940
4583
2241
2342
X
bat
tam
bang
bav
elam
pil P
ram
Dae
umb
oeng
snu
ol18
691
944
947
0X
bat
tam
bang
aek
Phnu
mPr
eaek
nor
int
ansa
ng s
ak21
495
644
750
9X
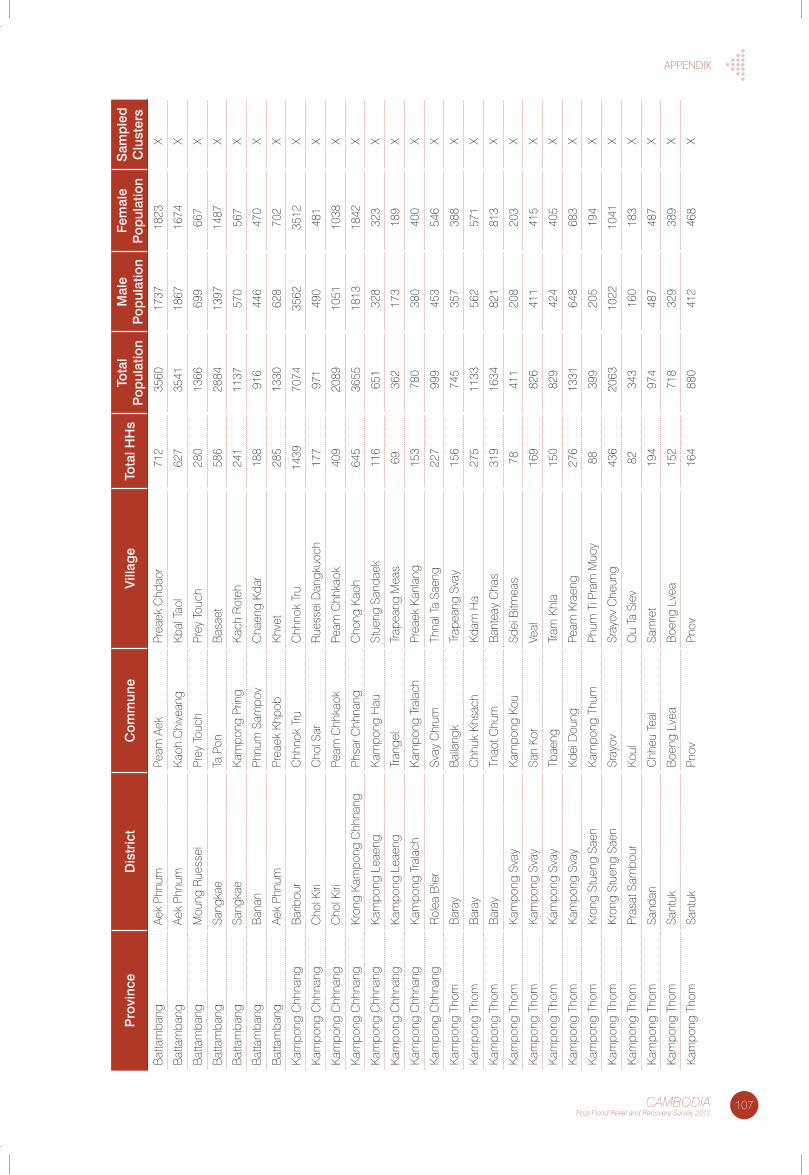
107CAMBODIAPost-Flood Relief and Recovery Survey 2012
aPPenDIX
Pro
vinc
eD
istr
ict
Com
mun
eV
illag
eTo
tal H
Hs
Tota
l P
opul
atio
nM
ale
Pop
ulat
ion
Fem
ale
Pop
ulat
ion
Sam
ple
d
Clu
ster
sb
atta
mba
ngae
k Ph
num
Peam
aek
Prea
ek c
hdao
r71
235
6017
3718
23X
bat
tam
bang
aek
Phnu
mK
aoh
chi
vean
gKb
al t
aol
627
3541
1867
1674
X
bat
tam
bang
Mou
ng R
uess
eiPr
ey t
ouch
Prey
tou
ch28
013
6669
966
7X
bat
tam
bang
sang
kae
ta P
onb
asae
t58
628
8413
9714
87X
bat
tam
bang
sang
kae
Kam
pong
Prin
gK
ach
Rot
eh24
111
3757
056
7X
bat
tam
bang
ban
anPh
num
sam
pov
cha
eng
Kdar
188
916
446
470
X
bat
tam
bang
aek
Phnu
mPr
eaek
Khp
obKh
vet
285
1330
628
702
X
Kam
pong
chh
nang
bar
ibou
rc
hhno
k tr
uc
hhno
k tr
u14
3970
7435
6235
12X
Kam
pong
chh
nang
cho
l Kiri
cho
l sar
Rue
ssei
Dan
gkuo
ch17
797
149
048
1X
Kam
pong
chh
nang
cho
l Kiri
Peam
chh
kaok
Peam
chh
kaok
409
2089
1051
1038
X
Kam
pong
chh
nang
Kron
g K
ampo
ng c
hhna
ngPh
sar c
hhna
ngc
hong
Kao
h64
536
5518
1318
42X
Kam
pong
chh
nang
Kam
pong
lea
eng
Kam
pong
Hau
stue
ng s
anda
ek11
665
132
832
3X
Kam
pong
chh
nang
Kam
pong
lea
eng
tran
gel
trap
eang
Mea
s69
362
173
189
X
Kam
pong
chh
nang
Kam
pong
tra
lach
Kam
pong
tra
lach
Prea
ek K
anla
ng15
378
038
040
0X
Kam
pong
chh
nang
Rol
ea b
'ier
svay
chr
umth
nal t
a sa
eng
227
999
453
546
X
Kam
pong
tho
mb
aray
bal
lang
ktr
apea
ng s
vay
156
745
357
388
X
Kam
pong
tho
mb
aray
chh
uk K
hsac
hKd
am H
a27
511
3356
257
1X
Kam
pong
tho
mb
aray
tnao
t chu
mb
ante
ay c
has
319
1634
821
813
X
Kam
pong
tho
mK
ampo
ng s
vay
Kam
pong
Kou
sdei
bitm
eas
7841
120
820
3X
Kam
pong
tho
mK
ampo
ng s
vay
san
Kor
Veal
169
826
411
415
X
Kam
pong
tho
mK
ampo
ng s
vay
tbae
ngtr
am K
hla
150
829
424
405
X
Kam
pong
tho
mK
ampo
ng s
vay
Kdei
Dou
ngPe
am K
raen
g27
613
3164
868
3X
Kam
pong
tho
mKr
ong
stue
ng s
aen
Kam
pong
thu
mPh
um t
i Pra
m M
uoy
8839
920
519
4X
Kam
pong
tho
mKr
ong
stue
ng s
aen
sray
ovsr
ayov
che
ung
436
2063
1022
1041
X
Kam
pong
tho
mPr
asat
sam
bour
Koul
ou
ta s
iev
8234
316
018
3X
Kam
pong
tho
msa
ndan
chh
eu t
eal
sam
ret
194
974
487
487
X
Kam
pong
tho
msa
ntuk
boe
ng l
vea
boe
ng l
vea
152
718
329
389
X
Kam
pong
tho
msa
ntuk
Pnov
Pnov
164
880
412
468
X
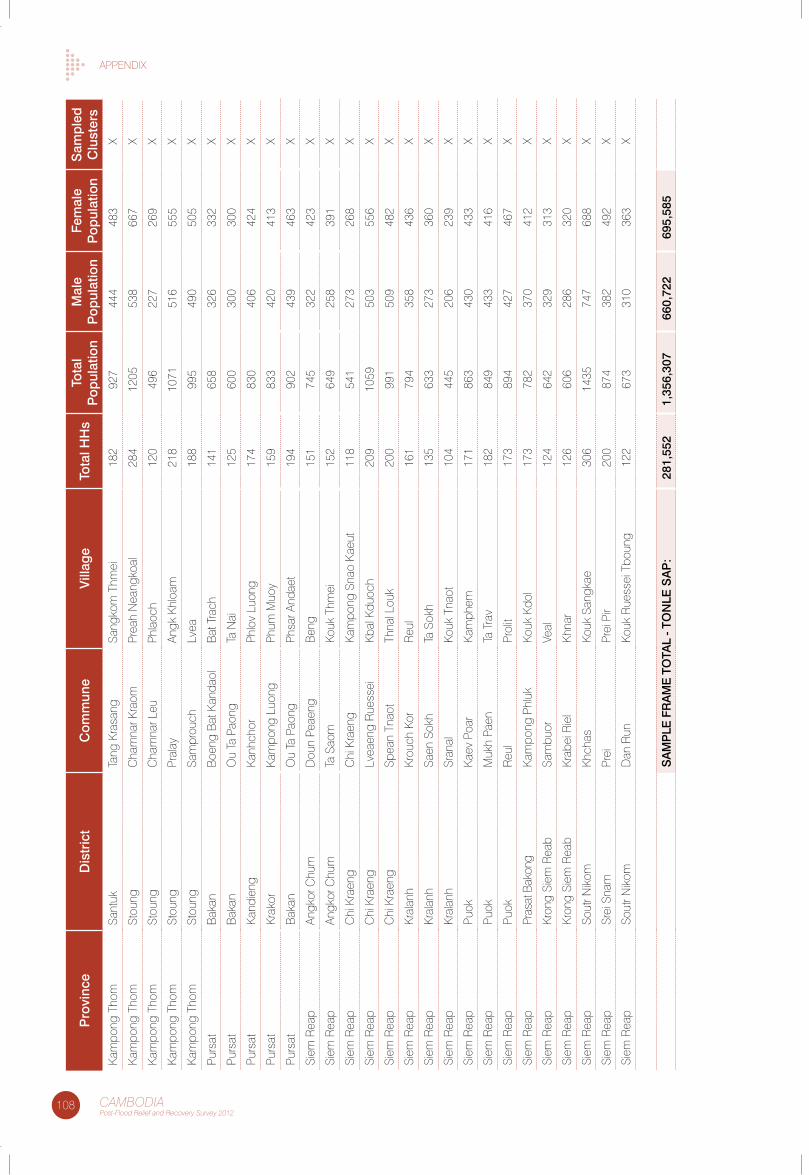
108 CAMBODIAPost-Flood Relief and Recovery Survey 2012
aPPenDIX
Pro
vinc
eD
istr
ict
Com
mun
eV
illag
eTo
tal H
Hs
Tota
l P
opul
atio
nM
ale
Pop
ulat
ion
Fem
ale
Pop
ulat
ion
Sam
ple
d
Clu
ster
sK
ampo
ng t
hom
sant
ukta
ng K
rasa
ngsa
ngko
m t
hmei
182
927
444
483
X
Kam
pong
tho
mst
oung
cha
mna
r Kra
omPr
eah
nea
ngko
al28
412
0553
866
7X
Kam
pong
tho
mst
oung
cha
mna
r leu
Phla
och
120
496
227
269
X
Kam
pong
tho
mst
oung
Pral
ayan
gk K
hloa
m21
810
7151
655
5X
Kam
pong
tho
mst
oung
sam
prou
chlv
ea18
899
549
050
5X
Purs
atb
akan
boe
ng b
at K
anda
olb
at t
rach
141
658
326
332
X
Purs
atb
akan
ou
ta P
aong
ta n
ai12
560
030
030
0X
Purs
atK
andi
eng
Kan
hcho
rPh
lov
luon
g17
483
040
642
4X
Purs
atKr
akor
Kam
pong
luo
ngPh
um M
uoy
159
833
420
413
X
Purs
atb
akan
ou
ta P
aong
Phsa
r and
aet
194
902
439
463
X
siem
Rea
pan
gkor
chu
mD
oun
Peae
ngb
eng
151
745
322
423
X
siem
Rea
pan
gkor
chu
mta
sao
mKo
uk t
hmei
152
649
258
391
X
siem
Rea
pc
hi K
raen
gc
hi K
raen
gK
ampo
ng s
nao
Kaeu
t11
854
127
326
8X
siem
Rea
pc
hi K
raen
glv
eaen
g R
uess
eiKb
al K
duoc
h20
910
5950
355
6X
siem
Rea
pc
hi K
raen
gsp
ean
tnao
tth
nal l
ouk
200
991
509
482
X
siem
Rea
pKr
alan
hKr
ouch
Kor
Reu
l16
179
435
843
6X
siem
Rea
pKr
alan
hsa
en s
okh
ta s
okh
135
633
273
360
X
siem
Rea
pKr
alan
hsr
anal
Kouk
tna
ot10
444
520
623
9X
siem
Rea
pPu
okK
aev
Poar
Kam
phem
171
863
430
433
X
siem
Rea
pPu
okM
ukh
Paen
ta t
rav
182
849
433
416
X
siem
Rea
pPu
okR
eul
Prol
it17
389
442
746
7X
siem
Rea
pPr
asat
bak
ong
Kam
pong
Phl
ukKo
uk K
dol
173
782
370
412
X
siem
Rea
pKr
ong
siem
Rea
bsa
mbu
orVe
al12
464
232
931
3X
siem
Rea
pKr
ong
siem
Rea
bKr
abei
Rie
lKh
nar
126
606
286
320
X
siem
Rea
pso
utr n
ikom
Khch
asKo
uk s
angk
ae30
614
3574
768
8X
siem
Rea
psr
ei s
nam
Prei
Prei
Pir
200
874
382
492
X
siem
Rea
pso
utr n
ikom
Dan
Run
Kouk
Rue
ssei
tbo
ung
122
673
310
363
X
Sa
MP
Le F
Ra
Me
TO
TaL
- TO
NLe
Sa
P:
281,
552
1,35
6,30
766
0,72
269
5,58
5
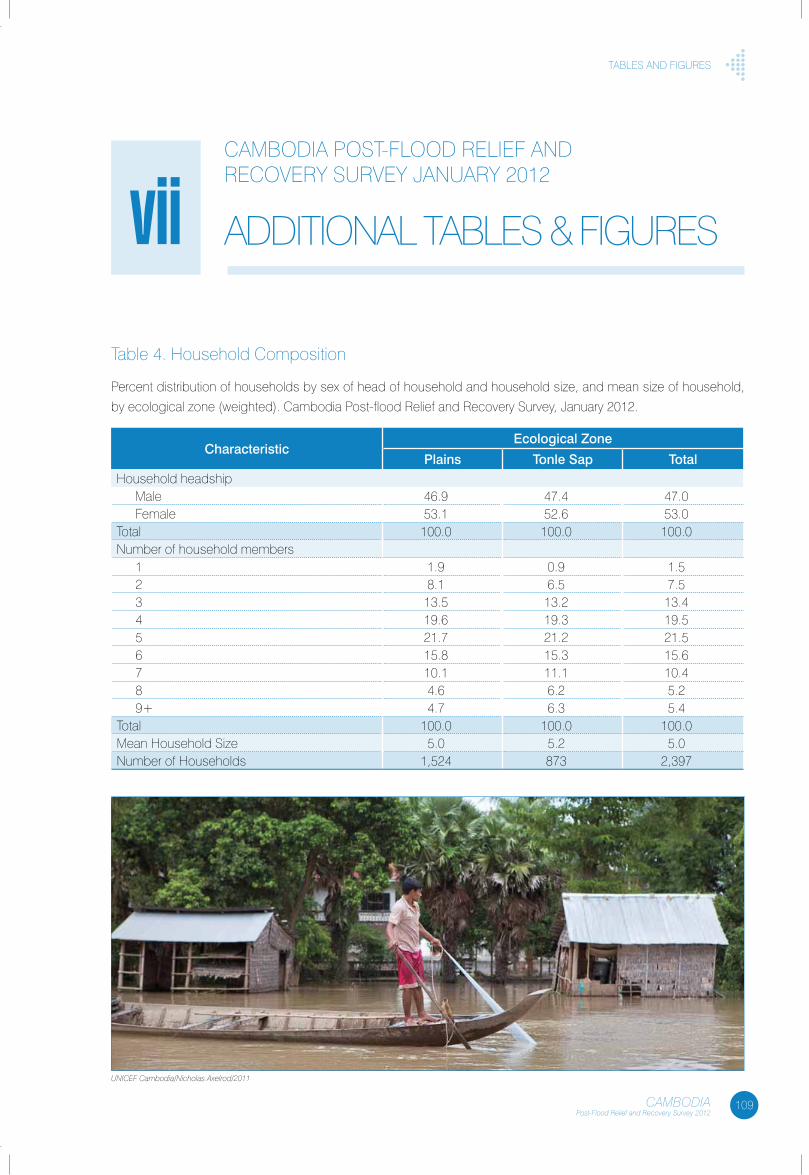
109CAMBODIAPost-Flood Relief and Recovery Survey 2012
tables anD fIGURes
table 4. Household composition
Percent distribution of households by sex of head of household and household size, and mean size of household,
by ecological zone (weighted). cambodia Post-flood Relief and Recovery survey, January 2012.
Characteristicecological Zone
Plains Tonle Sap TotalHousehold headship
Male 46.9 47.4 47.0female 53.1 52.6 53.0
total 100.0 100.0 100.0number of household members
1 1.9 0.9 1.52 8.1 6.5 7.53 13.5 13.2 13.44 19.6 19.3 19.55 21.7 21.2 21.56 15.8 15.3 15.67 10.1 11.1 10.48 4.6 6.2 5.29+ 4.7 6.3 5.4
total 100.0 100.0 100.0Mean Household size 5.0 5.2 5.0number of Households 1,524 873 2,397
caMboDIa Post-flooD RelIef anD RecoVeRy sURVey JanUaRy 2012
aDDItIonal tables & fIGUResvii
UNICEF Cambodia/Nicholas Axelrod/2011
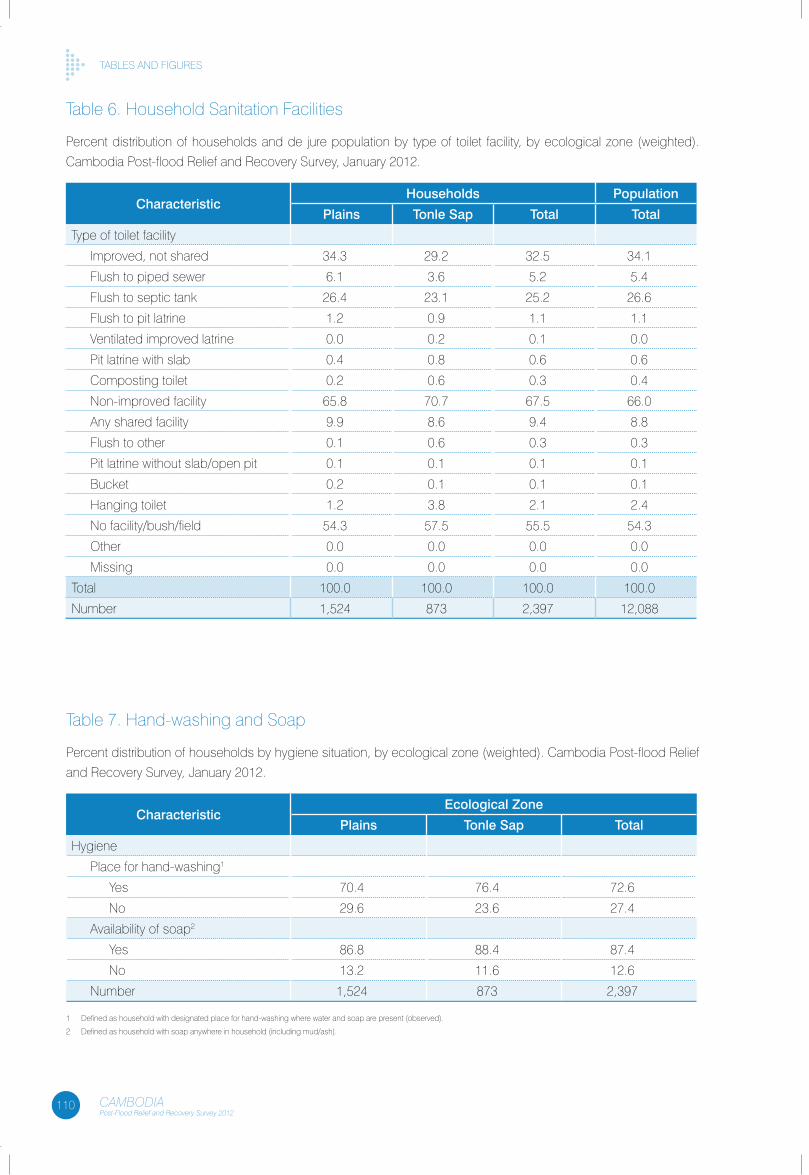
110 CAMBODIAPost-Flood Relief and Recovery Survey 2012
tables anD fIGURes
table 6. Household sanitation facilities
Percent distribution of households and de jure population by type of toilet facility, by ecological zone (weighted).
cambodia Post-flood Relief and Recovery survey, January 2012.
CharacteristicHouseholds Population
Plains Tonle Sap Total Total
type of toilet facility
Improved, not shared 34.3 29.2 32.5 34.1
flush to piped sewer 6.1 3.6 5.2 5.4
flush to septic tank 26.4 23.1 25.2 26.6
flush to pit latrine 1.2 0.9 1.1 1.1
Ventilated improved latrine 0.0 0.2 0.1 0.0
Pit latrine with slab 0.4 0.8 0.6 0.6
composting toilet 0.2 0.6 0.3 0.4
non-improved facility 65.8 70.7 67.5 66.0
any shared facility 9.9 8.6 9.4 8.8
flush to other 0.1 0.6 0.3 0.3
Pit latrine without slab/open pit 0.1 0.1 0.1 0.1
bucket 0.2 0.1 0.1 0.1
Hanging toilet 1.2 3.8 2.1 2.4
no facility/bush/field 54.3 57.5 55.5 54.3
other 0.0 0.0 0.0 0.0
Missing 0.0 0.0 0.0 0.0
total 100.0 100.0 100.0 100.0
number 1,524 873 2,397 12,088
table 7. Hand-washing and soap
Percent distribution of households by hygiene situation, by ecological zone (weighted). cambodia Post-flood Relief
and Recovery survey, January 2012.
Characteristicecological Zone
Plains Tonle Sap Total
Hygiene
Place for hand-washing1
yes 70.4 76.4 72.6
no 29.6 23.6 27.4
availability of soap2
yes 86.8 88.4 87.4
no 13.2 11.6 12.6
number 1,524 873 2,397
1 Defined as household with designated place for hand-washing where water and soap are present (observed).
2 Defined as household with soap anywhere in household (including mud/ash).
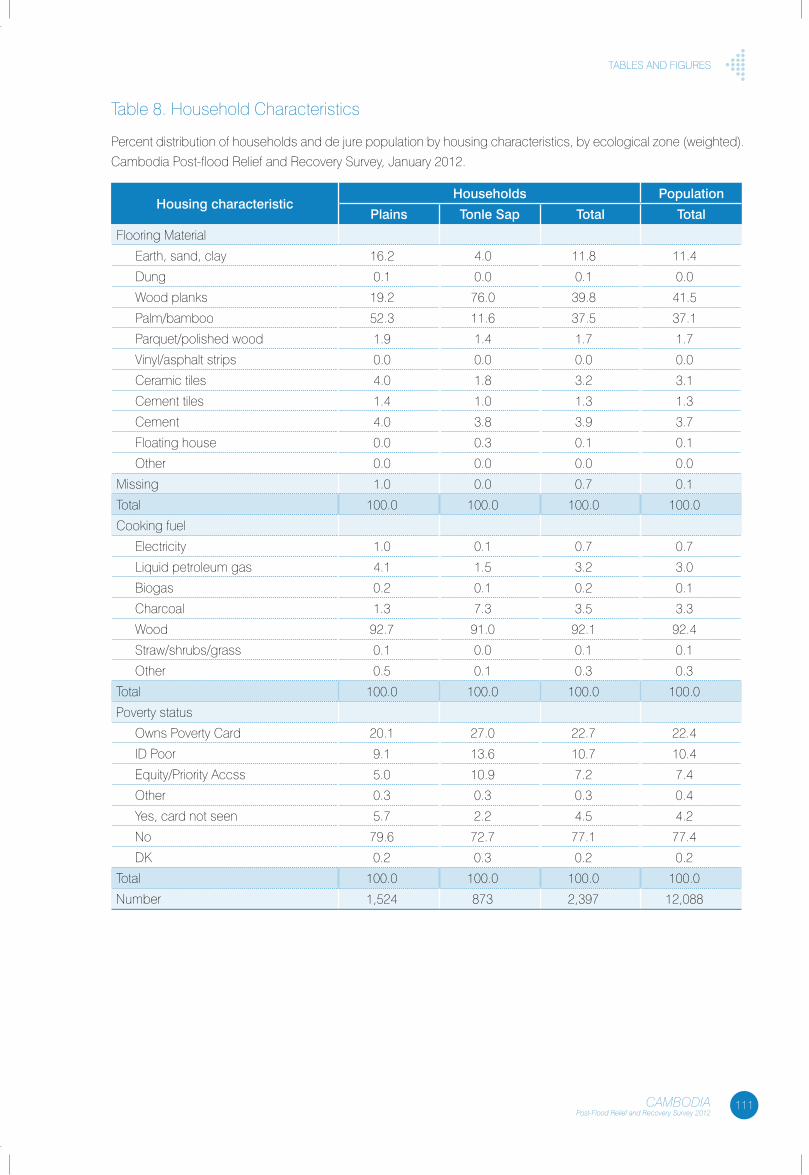
111CAMBODIAPost-Flood Relief and Recovery Survey 2012
tables anD fIGURes
table 8. Household characteristics
Percent distribution of households and de jure population by housing characteristics, by ecological zone (weighted).
cambodia Post-flood Relief and Recovery survey, January 2012.
Housing characteristicHouseholds Population
Plains Tonle Sap Total Total
flooring Material
earth, sand, clay 16.2 4.0 11.8 11.4
Dung 0.1 0.0 0.1 0.0
Wood planks 19.2 76.0 39.8 41.5
Palm/bamboo 52.3 11.6 37.5 37.1
Parquet/polished wood 1.9 1.4 1.7 1.7
Vinyl/asphalt strips 0.0 0.0 0.0 0.0
ceramic tiles 4.0 1.8 3.2 3.1
cement tiles 1.4 1.0 1.3 1.3
cement 4.0 3.8 3.9 3.7
floating house 0.0 0.3 0.1 0.1
other 0.0 0.0 0.0 0.0
Missing 1.0 0.0 0.7 0.1
total 100.0 100.0 100.0 100.0
cooking fuel
electricity 1.0 0.1 0.7 0.7
liquid petroleum gas 4.1 1.5 3.2 3.0
biogas 0.2 0.1 0.2 0.1
charcoal 1.3 7.3 3.5 3.3
Wood 92.7 91.0 92.1 92.4
straw/shrubs/grass 0.1 0.0 0.1 0.1
other 0.5 0.1 0.3 0.3
total 100.0 100.0 100.0 100.0
Poverty status
owns Poverty card 20.1 27.0 22.7 22.4
ID Poor 9.1 13.6 10.7 10.4
equity/Priority accss 5.0 10.9 7.2 7.4
other 0.3 0.3 0.3 0.4
yes, card not seen 5.7 2.2 4.5 4.2
no 79.6 72.7 77.1 77.4
DK 0.2 0.3 0.2 0.2
total 100.0 100.0 100.0 100.0
number 1,524 873 2,397 12,088
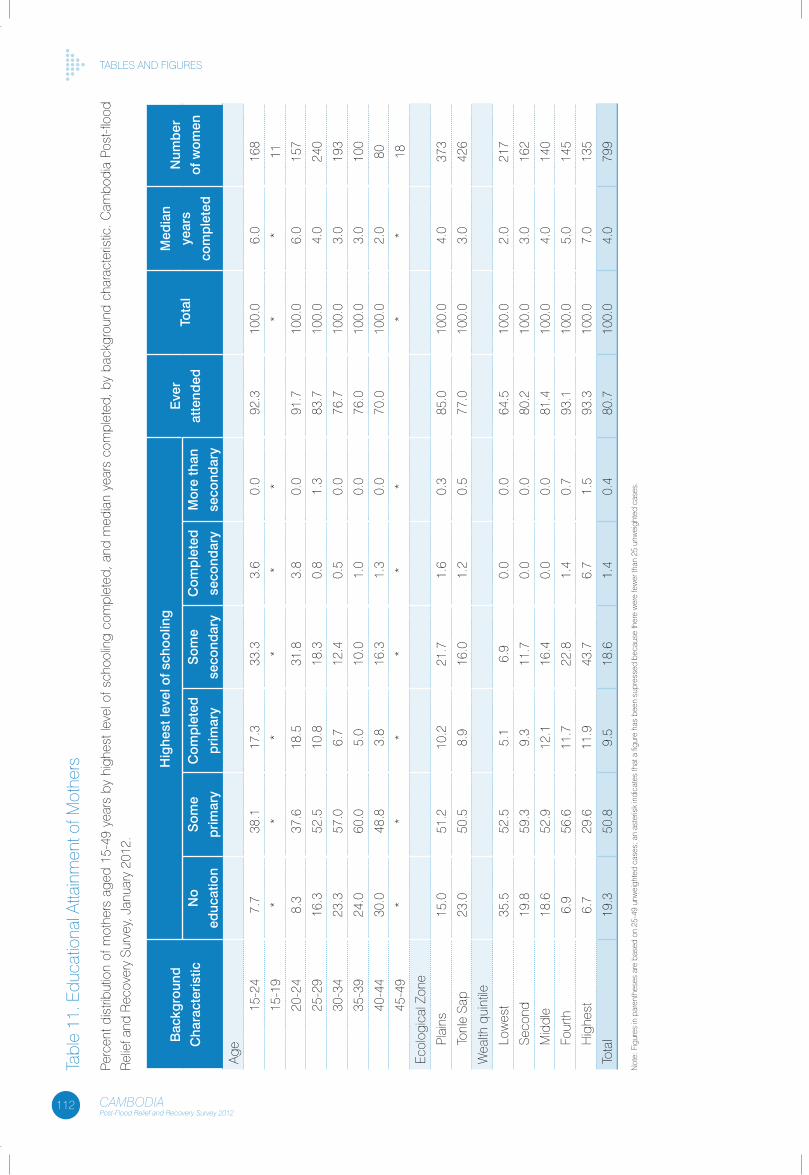
112 CAMBODIAPost-Flood Relief and Recovery Survey 2012
tables anD fIGUResta
ble
11. e
duca
tiona
l atta
inm
ent o
f Mot
hers
Perc
ent d
istri
butio
n of
mot
hers
age
d 15
-49
year
s by
hig
hest
leve
l of s
choo
ling
com
plet
ed, a
nd m
edia
n ye
ars
com
plet
ed, b
y ba
ckgr
ound
cha
ract
eris
tic. c
ambo
dia
Post
-floo
d
Rel
ief a
nd R
ecov
ery
surv
ey, J
anua
ry 2
012.
Bac
kgro
und
Cha
ract
eris
tic
Hig
hest
leve
l of s
choo
ling
eve
r
atte
nded
Tota
l
Med
ian
year
s
com
ple
ted
Num
ber
of w
omen
No
educ
atio
n
Som
e
prim
ary
Com
ple
ted
prim
ary
Som
e
seco
ndar
y
Com
ple
ted
seco
ndar
y
Mor
e th
an
seco
ndar
y
age
15-2
47.
738
.117
.333
.33.
60.
092
.310
0.0
6.0
168
15-1
9*
**
**
**
*11
20-2
48.
337
.618
.531
.83.
80.
091
.710
0.0
6.0
157
25-2
916
.352
.510
.818
.30.
81.
383
.710
0.0
4.0
240
30-3
423
.357
.06.
712
.40.
50.
076
.710
0.0
3.0
193
35-3
924
.060
.05.
010
.01.
00.
076
.010
0.0
3.0
100
40-4
430
.048
.83.
816
.31.
30.
070
.010
0.0
2.0
80
45-4
9*
**
**
**
*18
ecol
ogic
al Z
one
Plai
ns15
.051
.210
.221
.71.
60.
385
.010
0.0
4.0
373
tonl
e sa
p23
.050
.58.
916
.01.
20.
577
.010
0.0
3.0
426
Wea
lth q
uint
ile
low
est
35.5
52.5
5.1
6.9
0.0
0.0
64.5
100.
02.
021
7
seco
nd19
.859
.39.
311
.70.
00.
080
.210
0.0
3.0
162
Mid
dle
18.6
52.9
12.1
16.4
0.0
0.0
81.4
100.
04.
014
0
four
th6.
956
.611
.722
.81.
40.
793
.110
0.0
5.0
145
Hig
hest
6.7
29.6
11.9
43.7
6.7
1.5
93.3
100.
07.
013
5
tota
l19
.350
.89.
518
.61.
40.
480
.710
0.0
4.0
799
not
e: f
igur
es in
par
enth
eses
are
bas
ed o
n 25
-49
unw
eigh
ted
case
s; a
n as
teris
k in
dica
tes
that
a fi
gure
has
bee
n su
pres
sed
beca
use
ther
e w
ere
few
er th
an 2
5 un
wei
ghte
d ca
ses.
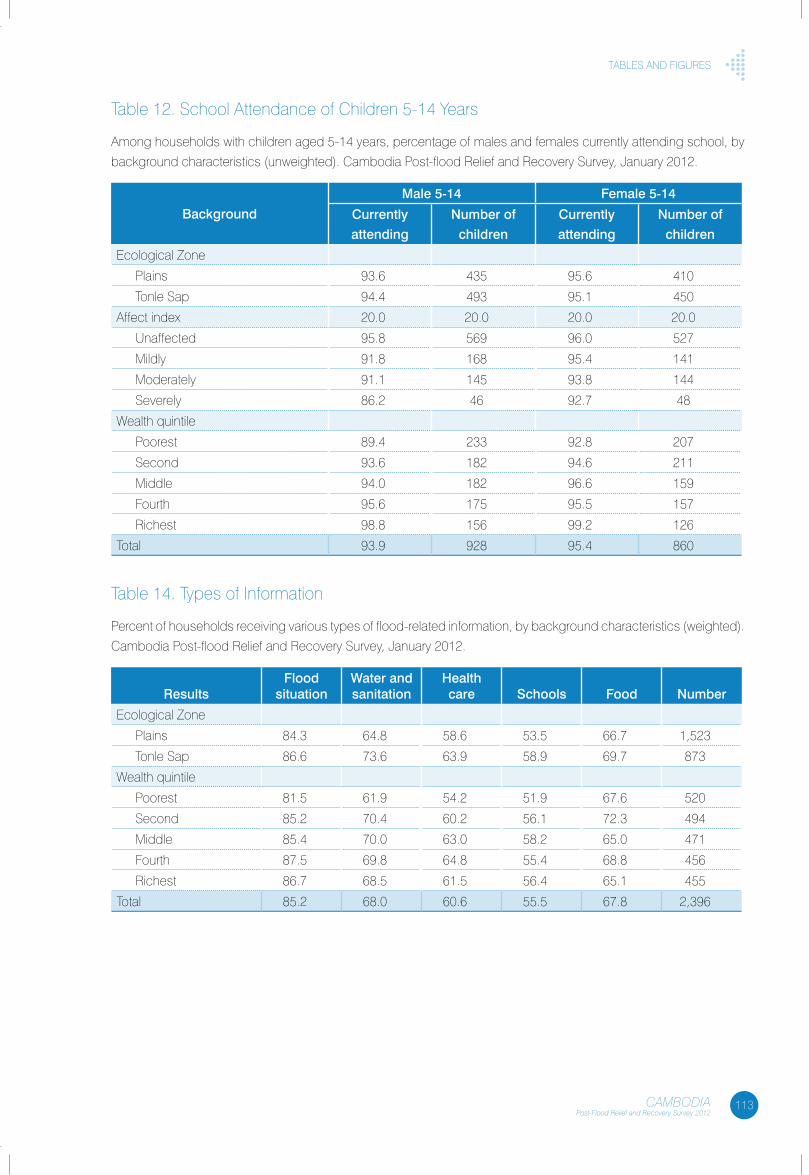
113CAMBODIAPost-Flood Relief and Recovery Survey 2012
tables anD fIGURes
table 12. school attendance of children 5-14 years
among households with children aged 5-14 years, percentage of males and females currently attending school, by
background characteristics (unweighted). cambodia Post-flood Relief and Recovery survey, January 2012.
Background
Male 5-14 Female 5-14
Currently
attending
Number of
children
Currently
attending
Number of
children
ecological Zone
Plains 93.6 435 95.6 410
tonle sap 94.4 493 95.1 450
affect index 20.0 20.0 20.0 20.0
Unaffected 95.8 569 96.0 527
Mildly 91.8 168 95.4 141
Moderately 91.1 145 93.8 144
severely 86.2 46 92.7 48
Wealth quintile
Poorest 89.4 233 92.8 207
second 93.6 182 94.6 211
Middle 94.0 182 96.6 159
fourth 95.6 175 95.5 157
Richest 98.8 156 99.2 126
total 93.9 928 95.4 860
table 14. types of Information
Percent of households receiving various types of flood-related information, by background characteristics (weighted).
cambodia Post-flood Relief and Recovery survey, January 2012.
ResultsFlood
situationWater and sanitation
Health care Schools Food Number
ecological Zone
Plains 84.3 64.8 58.6 53.5 66.7 1,523
tonle sap 86.6 73.6 63.9 58.9 69.7 873
Wealth quintile
Poorest 81.5 61.9 54.2 51.9 67.6 520
second 85.2 70.4 60.2 56.1 72.3 494
Middle 85.4 70.0 63.0 58.2 65.0 471
fourth 87.5 69.8 64.8 55.4 68.8 456
Richest 86.7 68.5 61.5 56.4 65.1 455
total 85.2 68.0 60.6 55.5 67.8 2,396
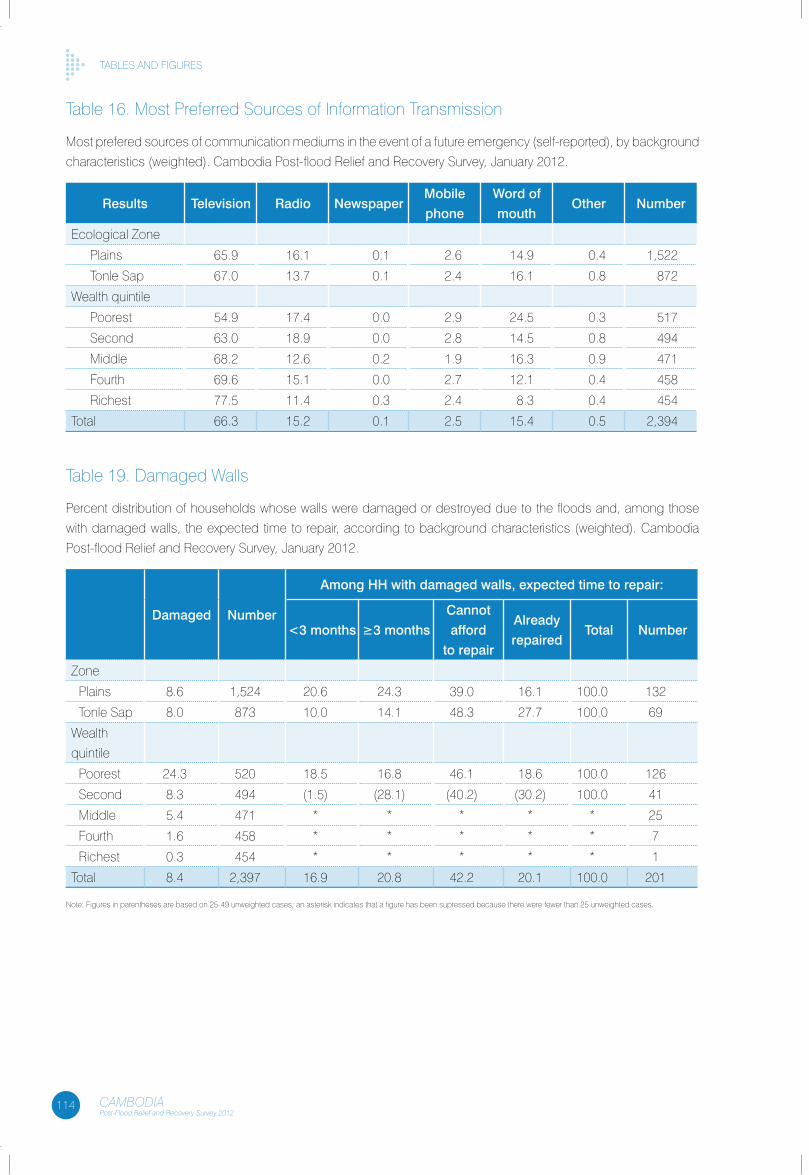
114 CAMBODIAPost-Flood Relief and Recovery Survey 2012
tables anD fIGURes
table 16. Most Preferred sources of Information transmission
Most prefered sources of communication mediums in the event of a future emergency (self-reported), by background
characteristics (weighted). cambodia Post-flood Relief and Recovery survey, January 2012.
Results Television Radio NewspaperMobile
phone
Word of
mouthOther Number
ecological Zone
Plains 65.9 16.1 0.1 2.6 14.9 0.4 1,522
tonle sap 67.0 13.7 0.1 2.4 16.1 0.8 872
Wealth quintile
Poorest 54.9 17.4 0.0 2.9 24.5 0.3 517
second 63.0 18.9 0.0 2.8 14.5 0.8 494
Middle 68.2 12.6 0.2 1.9 16.3 0.9 471
fourth 69.6 15.1 0.0 2.7 12.1 0.4 458
Richest 77.5 11.4 0.3 2.4 8.3 0.4 454
total 66.3 15.2 0.1 2.5 15.4 0.5 2,394
table 19. Damaged Walls
Percent distribution of households whose walls were damaged or destroyed due to the floods and, among those
with damaged walls, the expected time to repair, according to background characteristics (weighted). cambodia
Post-flood Relief and Recovery survey, January 2012.
Damaged Number
among HH with damaged walls, expected time to repair:
<3 months ≥3 months
Cannot
afford
to repair
already
repairedTotal Number
Zone
Plains 8.6 1,524 20.6 24.3 39.0 16.1 100.0 132
tonle sap 8.0 873 10.0 14.1 48.3 27.7 100.0 69
Wealth
quintile
Poorest 24.3 520 18.5 16.8 46.1 18.6 100.0 126
second 8.3 494 (1.5) (28.1) (40.2) (30.2) 100.0 41
Middle 5.4 471 * * * * * 25
fourth 1.6 458 * * * * * 7
Richest 0.3 454 * * * * * 1
total 8.4 2,397 16.9 20.8 42.2 20.1 100.0 201
note: figures in parentheses are based on 25-49 unweighted cases; an asterisk indicates that a figure has been supressed because there were fewer than 25 unweighted cases.
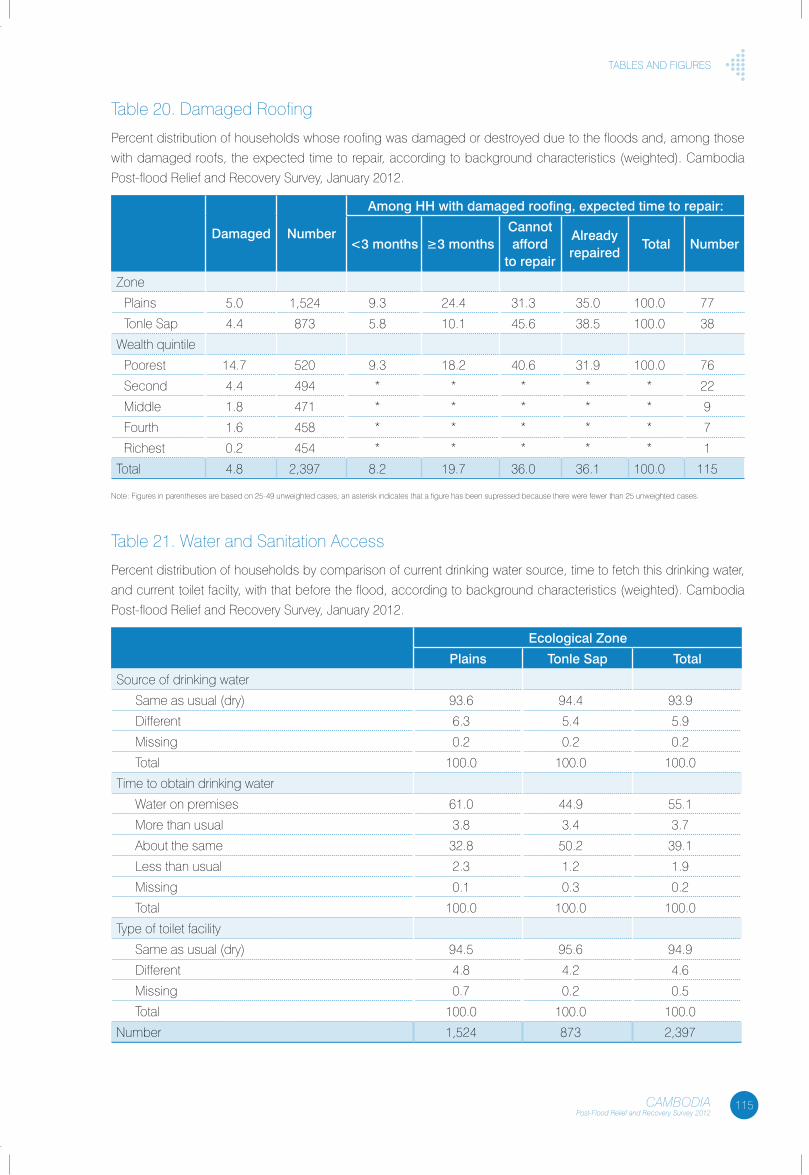
115CAMBODIAPost-Flood Relief and Recovery Survey 2012
tables anD fIGURes
table 20. Damaged Roofing
Percent distribution of households whose roofing was damaged or destroyed due to the floods and, among those
with damaged roofs, the expected time to repair, according to background characteristics (weighted). cambodia
Post-flood Relief and Recovery survey, January 2012.
Damaged Number
among HH with damaged roofing, expected time to repair:
<3 months ≥3 monthsCannot afford
to repair
already repaired
Total Number
Zone
Plains 5.0 1,524 9.3 24.4 31.3 35.0 100.0 77
tonle sap 4.4 873 5.8 10.1 45.6 38.5 100.0 38
Wealth quintile
Poorest 14.7 520 9.3 18.2 40.6 31.9 100.0 76
second 4.4 494 * * * * * 22
Middle 1.8 471 * * * * * 9
fourth 1.6 458 * * * * * 7
Richest 0.2 454 * * * * * 1
total 4.8 2,397 8.2 19.7 36.0 36.1 100.0 115
note: figures in parentheses are based on 25-49 unweighted cases; an asterisk indicates that a figure has been supressed because there were fewer than 25 unweighted cases.
table 21. Water and sanitation access
Percent distribution of households by comparison of current drinking water source, time to fetch this drinking water,
and current toilet facilty, with that before the flood, according to background characteristics (weighted). cambodia
Post-flood Relief and Recovery survey, January 2012.
ecological Zone
Plains Tonle Sap Total
source of drinking water
same as usual (dry) 93.6 94.4 93.9
Different 6.3 5.4 5.9
Missing 0.2 0.2 0.2
total 100.0 100.0 100.0
time to obtain drinking water
Water on premises 61.0 44.9 55.1
More than usual 3.8 3.4 3.7
about the same 32.8 50.2 39.1
less than usual 2.3 1.2 1.9
Missing 0.1 0.3 0.2
total 100.0 100.0 100.0
type of toilet facility
same as usual (dry) 94.5 95.6 94.9
Different 4.8 4.2 4.6
Missing 0.7 0.2 0.5
total 100.0 100.0 100.0
number 1,524 873 2,397
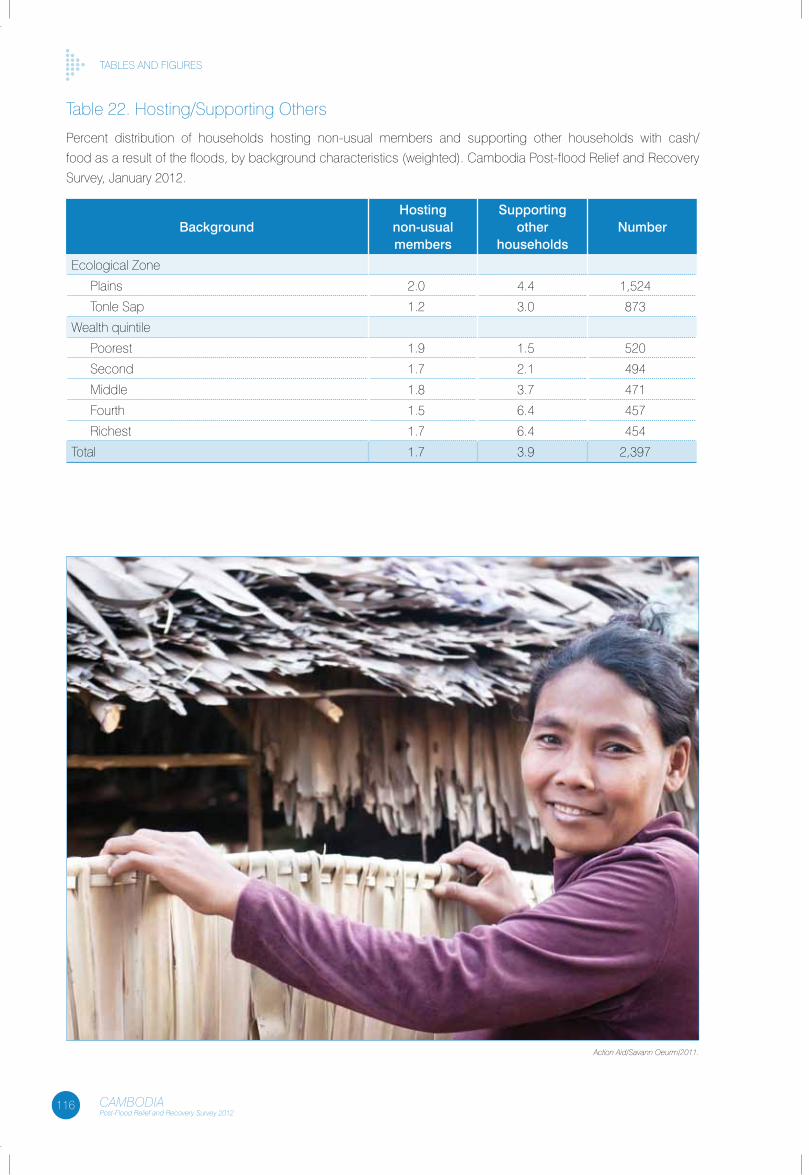
116 CAMBODIAPost-Flood Relief and Recovery Survey 2012
tables anD fIGURes
table 22. Hosting/supporting others
Percent distribution of households hosting non-usual members and supporting other households with cash/
food as a result of the floods, by background characteristics (weighted). cambodia Post-flood Relief and Recovery
survey, January 2012.
BackgroundHosting
non-usual members
Supporting other
householdsNumber
ecological Zone
Plains 2.0 4.4 1,524
tonle sap 1.2 3.0 873
Wealth quintile
Poorest 1.9 1.5 520
second 1.7 2.1 494
Middle 1.8 3.7 471
fourth 1.5 6.4 457
Richest 1.7 6.4 454
total 1.7 3.9 2,397
Action Aid/Savann Oeurm/2011.
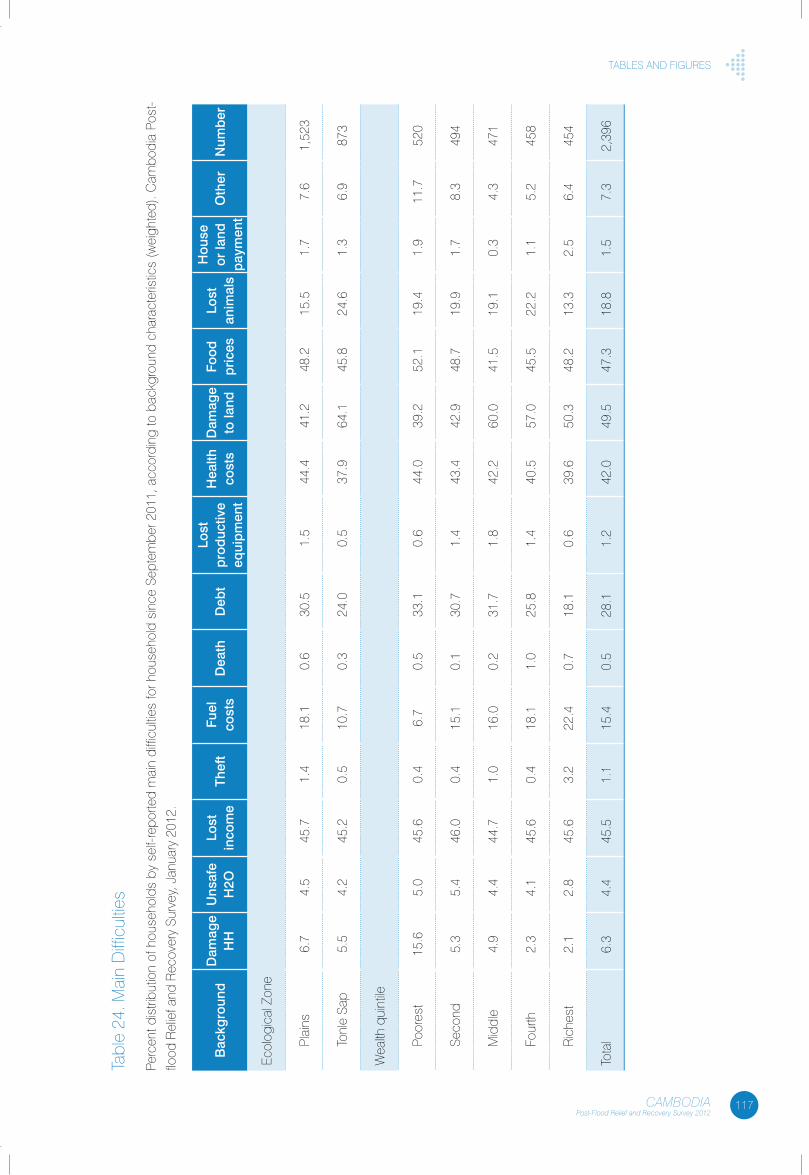
117CAMBODIAPost-Flood Relief and Recovery Survey 2012
tables anD fIGURes
tabl
e 24
. Mai
n D
iffic
ultie
s
Perc
ent d
istri
butio
n of
hou
seho
lds
by s
elf-r
epor
ted
mai
n di
fficu
lties
for h
ouse
hold
sin
ce s
epte
mbe
r 201
1, a
ccor
ding
to b
ackg
roun
d ch
arac
teris
tics
(wei
ghte
d). c
ambo
dia
Post
-
flood
Rel
ief a
nd R
ecov
ery
surv
ey, J
anua
ry 2
012.
Bac
kgro
und
Dam
age
HH
Uns
afe
H2O
Lost
in
com
eTh
eft
Fuel
co
sts
Dea
th
Deb
tLo
st
pro
duc
tive
equi
pm
ent
Hea
lth
cost
sD
amag
e to
land
Food
p
rices
Lost
an
imal
s
Hou
se
or la
nd
pay
men
tO
ther
Num
ber
ecol
ogic
al Z
one
Plai
ns6.
74.
545
.71.
418
.10.
630
.51.
544
.441
.248
.215
.51.
77.
61,
523
tonl
e sa
p5.
54.
245
.20.
510
.70.
324
.00.
537
.964
.145
.824
.61.
36.
987
3
Wea
lth q
uint
ile
Poor
est
15.6
5.0
45.6
0.4
6.7
0.5
33.1
0.6
44.0
39.2
52.1
19.4
1.9
11.7
520
seco
nd5.
35.
446
.00.
415
.10.
130
.71.
443
.442
.948
.719
.91.
78.
349
4
Mid
dle
4.9
4.4
44.7
1.0
16.0
0.2
31.7
1.8
42.2
60.0
41.5
19.1
0.3
4.3
471
four
th2.
34.
145
.60.
418
.11.
025
.81.
440
.557
.045
.522
.21.
15.
245
8
Ric
hest
2.1
2.8
45.6
3.2
22.4
0.7
18.1
0.6
39.6
50.3
48.2
13.3
2.5
6.4
454
tota
l6.
34.
445
.51.
115
.40.
528
.11.
242
.049
.547
.318
.81.
57.
32,
396
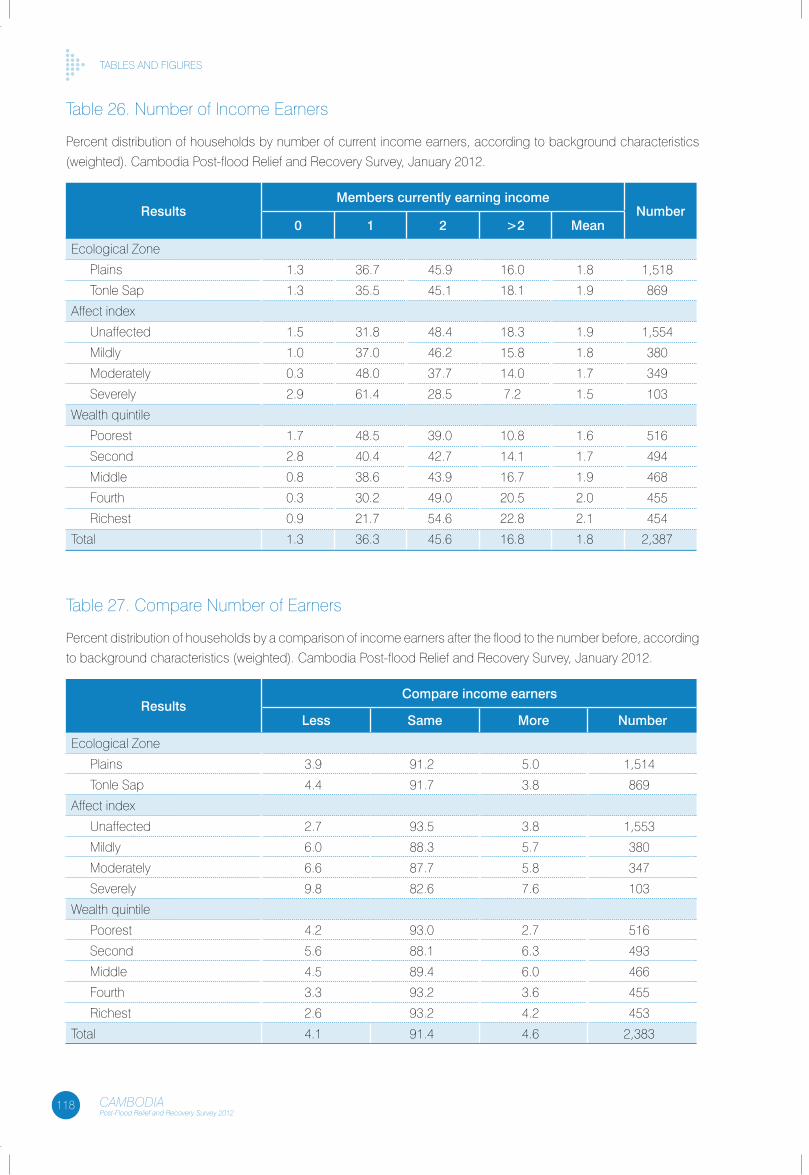
118 CAMBODIAPost-Flood Relief and Recovery Survey 2012
tables anD fIGURes
table 26. number of Income earners
Percent distribution of households by number of current income earners, according to background characteristics
(weighted). cambodia Post-flood Relief and Recovery survey, January 2012.
ResultsMembers currently earning income
Number0 1 2 >2 Mean
ecological Zone
Plains 1.3 36.7 45.9 16.0 1.8 1,518
tonle sap 1.3 35.5 45.1 18.1 1.9 869
affect index
Unaffected 1.5 31.8 48.4 18.3 1.9 1,554
Mildly 1.0 37.0 46.2 15.8 1.8 380
Moderately 0.3 48.0 37.7 14.0 1.7 349
severely 2.9 61.4 28.5 7.2 1.5 103
Wealth quintile
Poorest 1.7 48.5 39.0 10.8 1.6 516
second 2.8 40.4 42.7 14.1 1.7 494
Middle 0.8 38.6 43.9 16.7 1.9 468
fourth 0.3 30.2 49.0 20.5 2.0 455
Richest 0.9 21.7 54.6 22.8 2.1 454
total 1.3 36.3 45.6 16.8 1.8 2,387
table 27. compare number of earners
Percent distribution of households by a comparison of income earners after the flood to the number before, according
to background characteristics (weighted). cambodia Post-flood Relief and Recovery survey, January 2012.
ResultsCompare income earners
Less Same More Number
ecological Zone
Plains 3.9 91.2 5.0 1,514
tonle sap 4.4 91.7 3.8 869
affect index
Unaffected 2.7 93.5 3.8 1,553
Mildly 6.0 88.3 5.7 380
Moderately 6.6 87.7 5.8 347
severely 9.8 82.6 7.6 103
Wealth quintile
Poorest 4.2 93.0 2.7 516
second 5.6 88.1 6.3 493
Middle 4.5 89.4 6.0 466
fourth 3.3 93.2 3.6 455
Richest 2.6 93.2 4.2 453
total 4.1 91.4 4.6 2,383
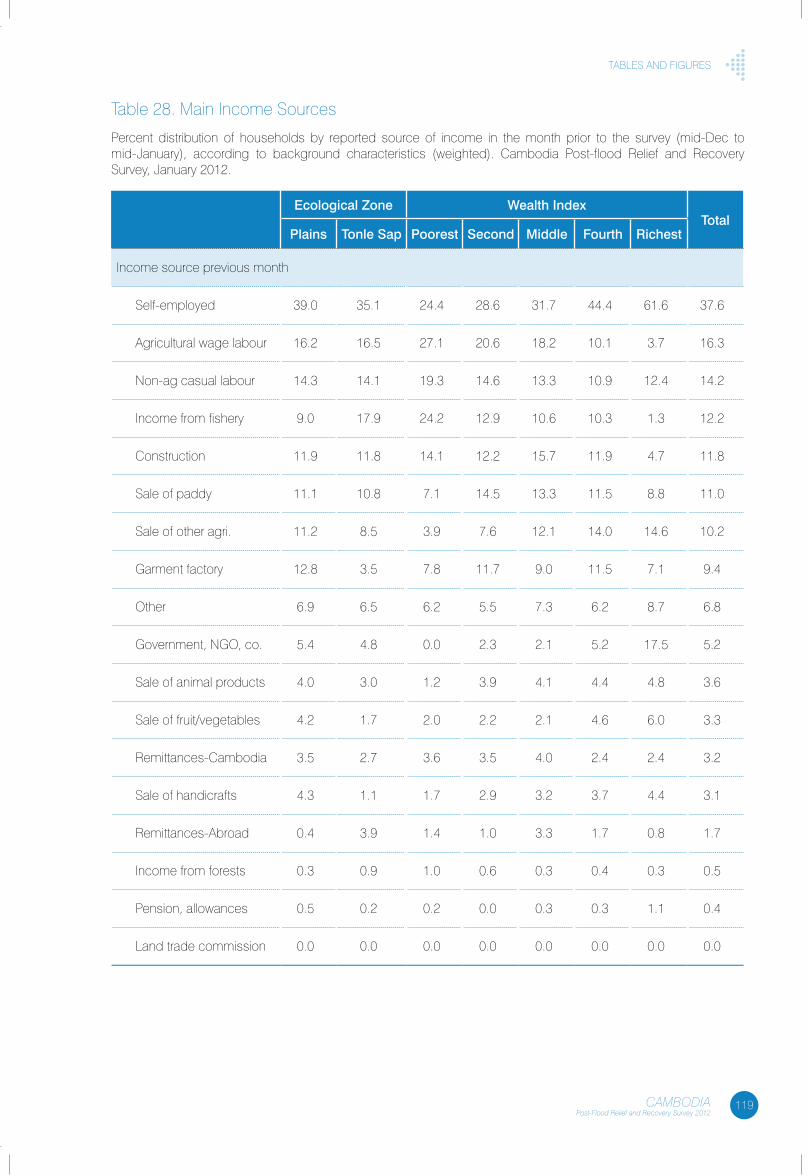
119CAMBODIAPost-Flood Relief and Recovery Survey 2012
tables anD fIGURes
table 28. Main Income sources
Percent distribution of households by reported source of income in the month prior to the survey (mid-Dec to mid-January), according to background characteristics (weighted). cambodia Post-flood Relief and Recovery survey, January 2012.
ecological Zone Wealth IndexTotal
Plains Tonle Sap Poorest Second Middle Fourth Richest
Income source previous month
self-employed 39.0 35.1 24.4 28.6 31.7 44.4 61.6 37.6
agricultural wage labour 16.2 16.5 27.1 20.6 18.2 10.1 3.7 16.3
non-ag casual labour 14.3 14.1 19.3 14.6 13.3 10.9 12.4 14.2
Income from fishery 9.0 17.9 24.2 12.9 10.6 10.3 1.3 12.2
construction 11.9 11.8 14.1 12.2 15.7 11.9 4.7 11.8
sale of paddy 11.1 10.8 7.1 14.5 13.3 11.5 8.8 11.0
sale of other agri. 11.2 8.5 3.9 7.6 12.1 14.0 14.6 10.2
Garment factory 12.8 3.5 7.8 11.7 9.0 11.5 7.1 9.4
other 6.9 6.5 6.2 5.5 7.3 6.2 8.7 6.8
Government, nGo, co. 5.4 4.8 0.0 2.3 2.1 5.2 17.5 5.2
sale of animal products 4.0 3.0 1.2 3.9 4.1 4.4 4.8 3.6
sale of fruit/vegetables 4.2 1.7 2.0 2.2 2.1 4.6 6.0 3.3
Remittances-cambodia 3.5 2.7 3.6 3.5 4.0 2.4 2.4 3.2
sale of handicrafts 4.3 1.1 1.7 2.9 3.2 3.7 4.4 3.1
Remittances-abroad 0.4 3.9 1.4 1.0 3.3 1.7 0.8 1.7
Income from forests 0.3 0.9 1.0 0.6 0.3 0.4 0.3 0.5
Pension, allowances 0.5 0.2 0.2 0.0 0.3 0.3 1.1 0.4
land trade commission 0.0 0.0 0.0 0.0 0.0 0.0 0.0 0.0
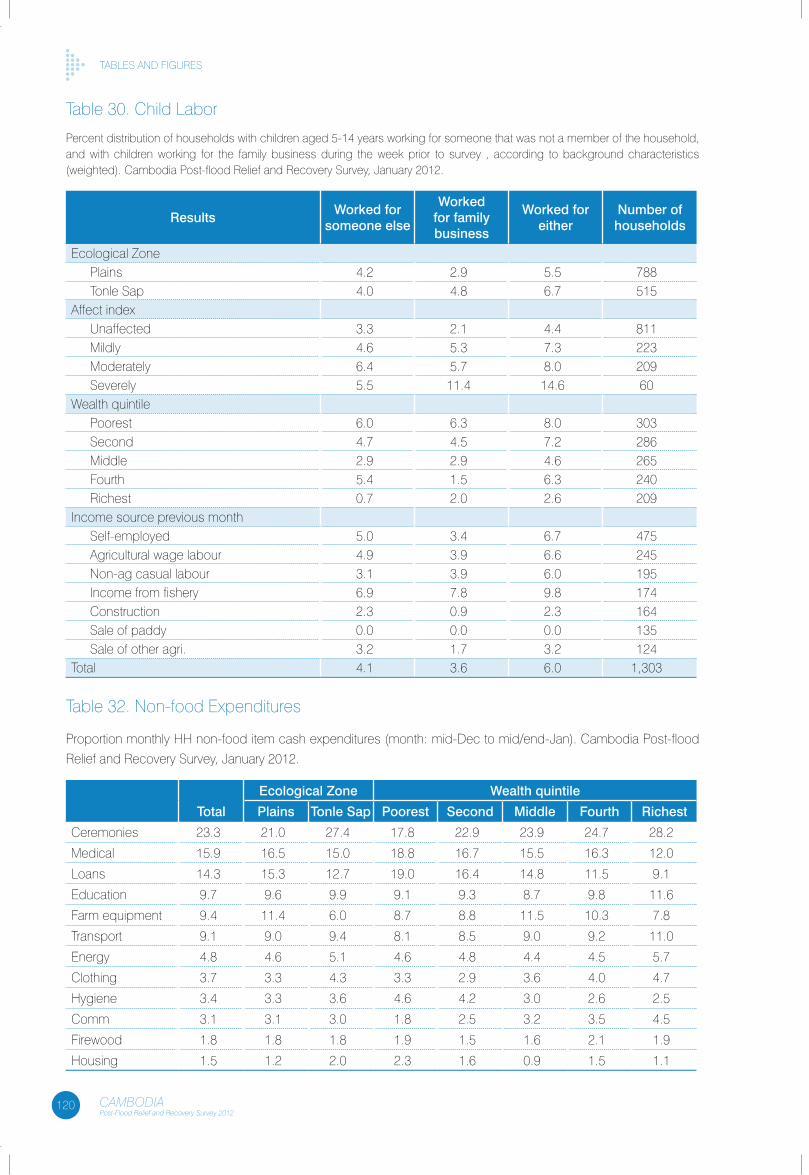
120 CAMBODIAPost-Flood Relief and Recovery Survey 2012
tables anD fIGURes
table 30. child labor
Percent distribution of households with children aged 5-14 years working for someone that was not a member of the household, and with children working for the family business during the week prior to survey , according to background characteristics (weighted). cambodia Post-flood Relief and Recovery survey, January 2012.
ResultsWorked for
someone else
Worked for family business
Worked for either
Number of households
ecological ZonePlains 4.2 2.9 5.5 788tonle sap 4.0 4.8 6.7 515
affect indexUnaffected 3.3 2.1 4.4 811Mildly 4.6 5.3 7.3 223Moderately 6.4 5.7 8.0 209severely 5.5 11.4 14.6 60
Wealth quintilePoorest 6.0 6.3 8.0 303second 4.7 4.5 7.2 286Middle 2.9 2.9 4.6 265fourth 5.4 1.5 6.3 240Richest 0.7 2.0 2.6 209
Income source previous monthself-employed 5.0 3.4 6.7 475agricultural wage labour 4.9 3.9 6.6 245non-ag casual labour 3.1 3.9 6.0 195Income from fishery 6.9 7.8 9.8 174construction 2.3 0.9 2.3 164sale of paddy 0.0 0.0 0.0 135sale of other agri. 3.2 1.7 3.2 124
total 4.1 3.6 6.0 1,303
table 32. non-food expenditures
Proportion monthly HH non-food item cash expenditures (month: mid-Dec to mid/end-Jan). cambodia Post-flood
Relief and Recovery survey, January 2012.
ecological Zone Wealth quintile
Total Plains Tonle Sap Poorest Second Middle Fourth Richest
ceremonies 23.3 21.0 27.4 17.8 22.9 23.9 24.7 28.2
Medical 15.9 16.5 15.0 18.8 16.7 15.5 16.3 12.0
loans 14.3 15.3 12.7 19.0 16.4 14.8 11.5 9.1
education 9.7 9.6 9.9 9.1 9.3 8.7 9.8 11.6
farm equipment 9.4 11.4 6.0 8.7 8.8 11.5 10.3 7.8
transport 9.1 9.0 9.4 8.1 8.5 9.0 9.2 11.0
energy 4.8 4.6 5.1 4.6 4.8 4.4 4.5 5.7
clothing 3.7 3.3 4.3 3.3 2.9 3.6 4.0 4.7
Hygiene 3.4 3.3 3.6 4.6 4.2 3.0 2.6 2.5
comm 3.1 3.1 3.0 1.8 2.5 3.2 3.5 4.5
firewood 1.8 1.8 1.8 1.9 1.5 1.6 2.1 1.9
Housing 1.5 1.2 2.0 2.3 1.6 0.9 1.5 1.1
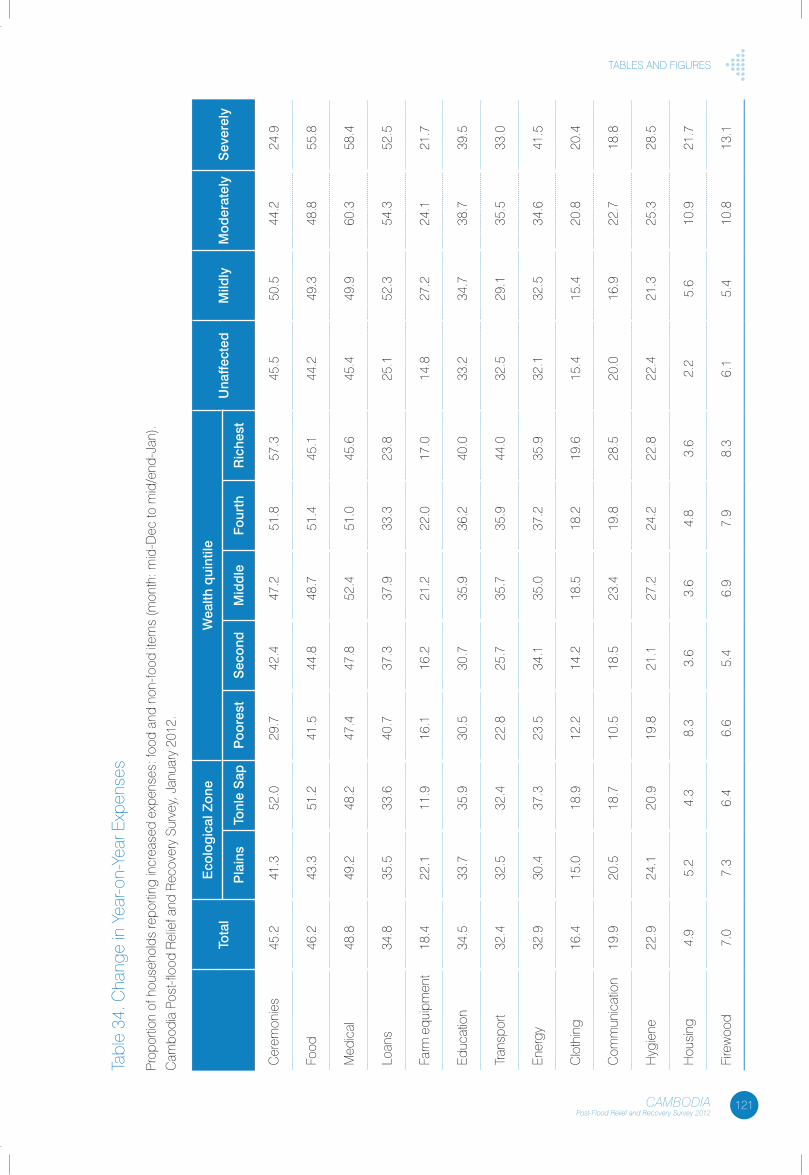
121CAMBODIAPost-Flood Relief and Recovery Survey 2012
tables anD fIGURes
tabl
e 34
. cha
nge
in y
ear-o
n-ye
ar e
xpen
ses
Prop
ortio
n of
hou
seho
lds
repo
rting
incr
ease
d ex
pens
es: f
ood
and
non-
food
item
s (m
onth
: mid
-Dec
to m
id/e
nd-J
an).
cam
bodi
a Po
st-fl
ood
Rel
ief a
nd R
ecov
ery
surv
ey, J
anua
ry 2
012.
Tota
le
colo
gic
al Z
one
Wea
lth q
uint
ileU
naffe
cted
Mild
lyM
oder
atel
yS
ever
ely
Pla
ins
Tonl
e S
apP
oore
stS
econ
dM
idd
leFo
urth
Ric
hest
cer
emon
ies
45.2
41.3
52.0
29.7
42.4
47.2
51.8
57.3
45.5
50.5
44.2
24.9
food
46.2
43.3
51.2
41.5
44.8
48.7
51.4
45.1
44.2
49.3
48.8
55.8
Med
ical
48.8
49.2
48.2
47.4
47.8
52.4
51.0
45.6
45.4
49.9
60.3
58.4
loan
s34
.835
.533
.640
.737
.337
.933
.323
.825
.152
.354
.352
.5
farm
equ
ipm
ent
18.4
22.1
11.9
16.1
16.2
21.2
22.0
17.0
14.8
27.2
24.1
21.7
educ
atio
n34
.533
.735
.930
.530
.735
.936
.240
.033
.234
.738
.739
.5
tran
spor
t32
.432
.532
.422
.825
.735
.735
.944
.032
.529
.135
.533
.0
ener
gy32
.930
.437
.323
.534
.135
.037
.235
.932
.132
.534
.641
.5
clo
thin
g16
.415
.018
.912
.214
.218
.518
.219
.615
.415
.420
.820
.4
com
mun
icat
ion
19.9
20.5
18.7
10.5
18.5
23.4
19.8
28.5
20.0
16.9
22.7
18.8
Hyg
iene
22.9
24.1
20.9
19.8
21.1
27.2
24.2
22.8
22.4
21.3
25.3
28.5
Hou
sing
4.9
5.2
4.3
8.3
3.6
3.6
4.8
3.6
2.2
5.6
10.9
21.7
fire
woo
d7.
07.
36.
46.
65.
46.
97.
98.
36.
15.
410
.813
.1
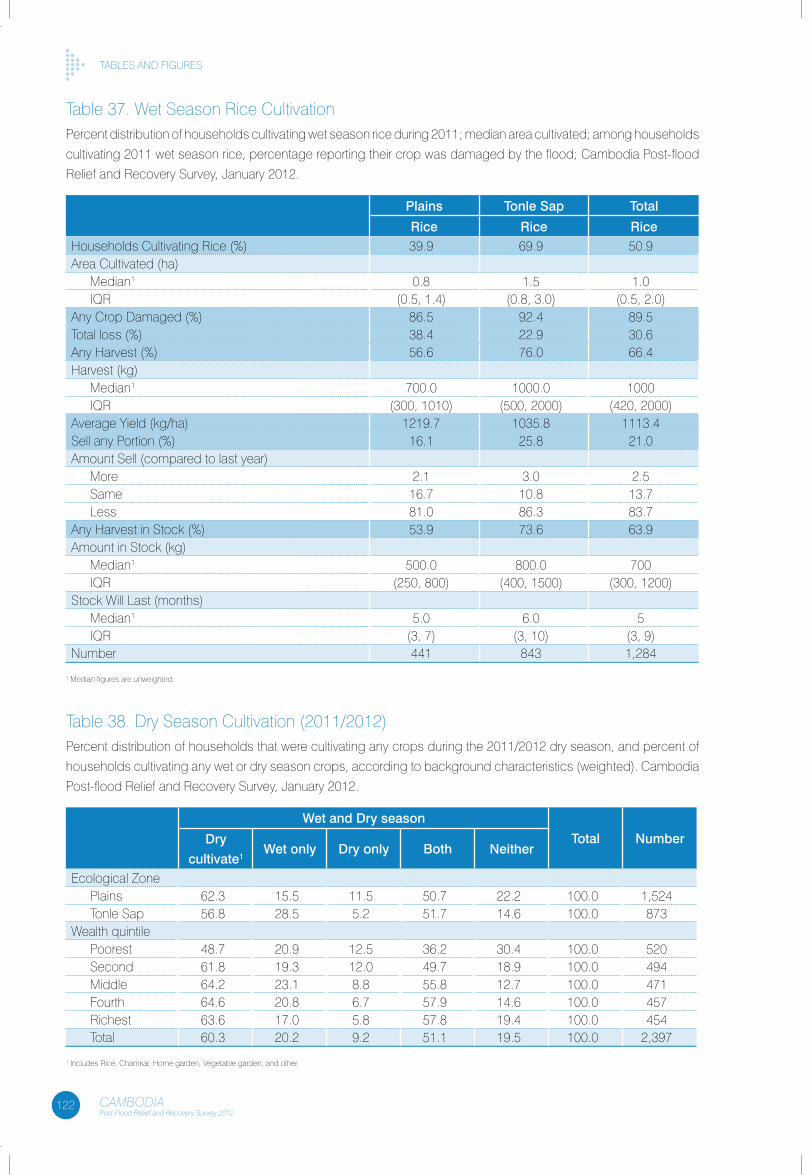
122 CAMBODIAPost-Flood Relief and Recovery Survey 2012
tables anD fIGURes
table 37. Wet season Rice cultivationPercent distribution of households cultivating wet season rice during 2011; median area cultivated; among households
cultivating 2011 wet season rice, percentage reporting their crop was damaged by the flood; cambodia Post-flood
Relief and Recovery survey, January 2012.
Plains Tonle Sap Total
Rice Rice RiceHouseholds cultivating Rice (%) 39.9 69.9 50.9area cultivated (ha)
Median1 0.8 1.5 1.0IQR (0.5, 1.4) (0.8, 3.0) (0.5, 2.0)
any crop Damaged (%) 86.5 92.4 89.5total loss (%) 38.4 22.9 30.6any Harvest (%) 56.6 76.0 66.4Harvest (kg)
Median1 700.0 1000.0 1000IQR (300, 1010) (500, 2000) (420, 2000)
average yield (kg/ha) 1219.7 1035.8 1113.4sell any Portion (%) 16.1 25.8 21.0amount sell (compared to last year)
More 2.1 3.0 2.5same 16.7 10.8 13.7less 81.0 86.3 83.7
any Harvest in stock (%) 53.9 73.6 63.9amount in stock (kg)
Median1 500.0 800.0 700IQR (250, 800) (400, 1500) (300, 1200)
stock Will last (months)Median1 5.0 6.0 5IQR (3, 7) (3, 10) (3, 9)
number 441 843 1,284
1 Median figures are unweighted.
table 38. Dry season cultivation (2011/2012) Percent distribution of households that were cultivating any crops during the 2011/2012 dry season, and percent of
households cultivating any wet or dry season crops, according to background characteristics (weighted). cambodia
Post-flood Relief and Recovery survey, January 2012.
Wet and Dry season
Total NumberDry
cultivate1Wet only Dry only Both Neither
ecological ZonePlains 62.3 15.5 11.5 50.7 22.2 100.0 1,524tonle sap 56.8 28.5 5.2 51.7 14.6 100.0 873
Wealth quintilePoorest 48.7 20.9 12.5 36.2 30.4 100.0 520second 61.8 19.3 12.0 49.7 18.9 100.0 494Middle 64.2 23.1 8.8 55.8 12.7 100.0 471fourth 64.6 20.8 6.7 57.9 14.6 100.0 457Richest 63.6 17.0 5.8 57.8 19.4 100.0 454total 60.3 20.2 9.2 51.1 19.5 100.0 2,397
1 Includes Rice, chamkar, Home garden, Vegetable garden, and other.
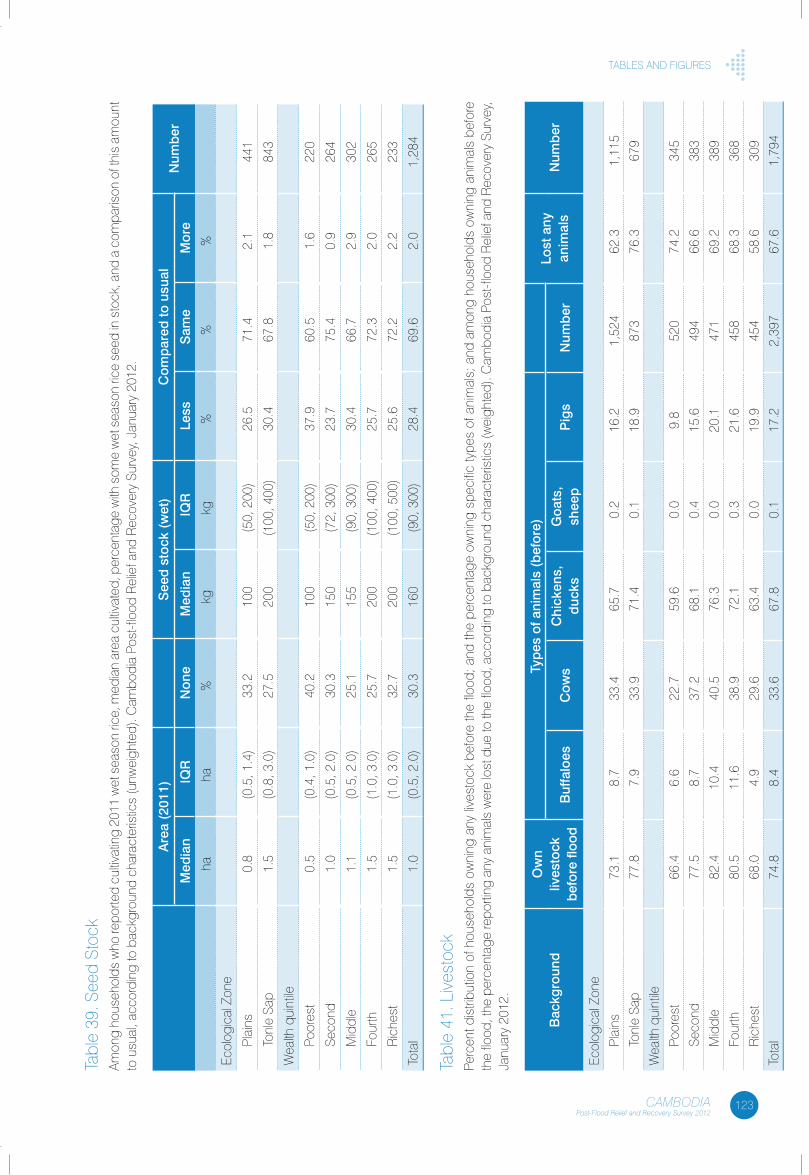
123CAMBODIAPost-Flood Relief and Recovery Survey 2012
tables anD fIGURes
tabl
e 39
. see
d st
ock
amon
g ho
useh
olds
who
repo
rted
cultiv
atin
g 20
11 w
et s
easo
n ric
e, m
edia
n ar
ea c
ultiv
ated
, per
cent
age
with
som
e w
et s
easo
n ric
e se
ed in
sto
ck, a
nd a
com
paris
on o
f thi
s am
ount
to
usu
al, a
ccor
ding
to b
ackg
roun
d ch
arac
teris
tics
(unw
eigh
ted)
. cam
bodi
a Po
st-fl
ood
Rel
ief a
nd R
ecov
ery
surv
ey, J
anua
ry 2
012.
are
a (2
011)
See
d s
tock
(w
et)
Com
par
ed to
usu
alN
umb
erM
edia
nIQ
RN
one
Med
ian
IQR
Less
Sam
eM
ore
haha
%kg
kg%
%%
ecol
ogic
al Z
one
Plai
ns0.
8(0
.5, 1
.4)
33.2
100
(50,
200
)26
.571
.42.
144
1
tonl
e sa
p1.
5(0
.8, 3
.0)
27.5
200
(100
, 400
)30
.467
.81.
884
3
Wea
lth q
uint
ile
Poor
est
0.5
(0.4
, 1.0
)40
.210
0(5
0, 2
00)
37.9
60.5
1.6
220
seco
nd1.
0(0
.5, 2
.0)
30.3
150
(72,
300
)23
.775
.40.
926
4
Mid
dle
1.1
(0.5
, 2.0
)25
.115
5(9
0, 3
00)
30.4
66.7
2.9
302
four
th1.
5(1
.0, 3
.0)
25.7
200
(100
, 400
)25
.772
.32.
026
5
Ric
hest
1.5
(1.0
, 3.0
)32
.720
0(1
00, 5
00)
25.6
72.2
2.2
233
tota
l1.
0(0
.5, 2
.0)
30.3
160
(90,
300
)28
.469
.62.
01,
284
tabl
e 41
. liv
esto
ckPe
rcen
t dis
tribu
tion
of h
ouse
hold
s ow
ning
any
live
stoc
k be
fore
the
flood
; and
the
perc
enta
ge o
wni
ng s
peci
fic ty
pes
of a
nim
als;
and
am
ong
hous
ehol
ds o
wni
ng a
nim
als
befo
re
the
flood
, the
per
cent
age
repo
rting
any
ani
mal
s w
ere
lost
due
to th
e flo
od, a
ccor
ding
to b
ackg
roun
d ch
arac
teris
tics
(wei
ghte
d). c
ambo
dia
Post
-floo
d R
elie
f and
Rec
over
y su
rvey
, Ja
nuar
y 20
12.
Bac
kgro
und
Ow
n
lives
tock
b
efor
e flo
od
Typ
es o
f ani
mal
s (b
efor
e)Lo
st a
ny
anim
als
Num
ber
Buf
falo
esC
ows
Chi
cken
s,
duc
ksg
oats
, sh
eep
Pig
sN
umb
er
ecol
ogic
al Z
one
Plai
ns73
.18.
733
.465
.70.
216
.21,
524
62.3
1,11
5
tonl
e sa
p77
.87.
933
.971
.40.
118
.987
376
.367
9
Wea
lth q
uint
ile
Poor
est
66.4
6.6
22.7
59.6
0.0
9.8
520
74.2
345
seco
nd77
.58.
737
.268
.10.
415
.649
466
.638
3
Mid
dle
82.4
10.4
40.5
76.3
0.0
20.1
471
69.2
389
four
th80
.511
.638
.972
.10.
321
.645
868
.336
8
Ric
hest
68.0
4.9
29.6
63.4
0.0
19.9
454
58.6
309
tota
l74
.88.
433
.667
.80.
117
.22,
397
67.6
1,79
4
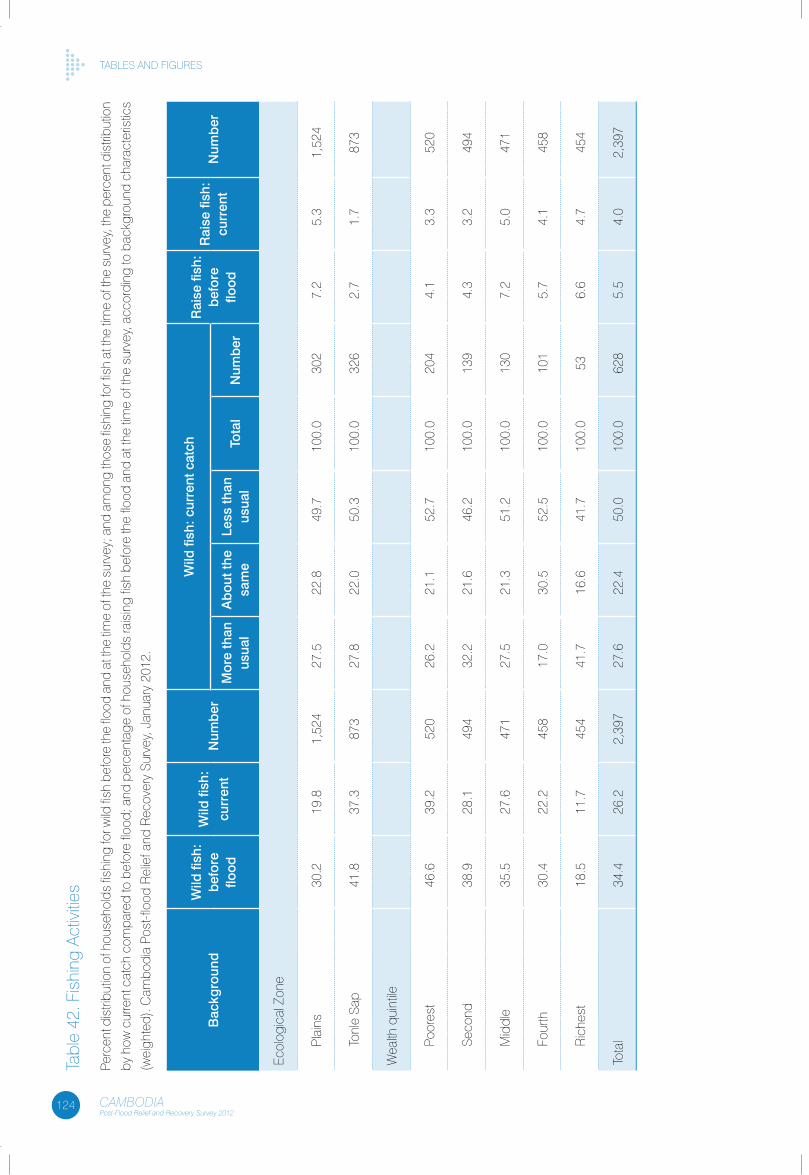
124 CAMBODIAPost-Flood Relief and Recovery Survey 2012
tables anD fIGUResta
ble
42. f
ishi
ng a
ctiv
ities
Perc
ent d
istri
butio
n of
hou
seho
lds
fishi
ng fo
r wild
fish
bef
ore
the
flood
and
at t
he ti
me
of th
e su
rvey
; and
am
ong
thos
e fis
hing
for f
ish
at th
e tim
e of
the
surv
ey, t
he p
erce
nt d
istri
butio
n
by h
ow c
urre
nt c
atch
com
pare
d to
bef
ore
flood
; and
per
cent
age
of h
ouse
hold
s ra
isin
g fis
h be
fore
the
flood
and
at t
he ti
me
of th
e su
rvey
, acc
ordi
ng to
bac
kgro
und
char
acte
ristic
s
(wei
ghte
d). c
ambo
dia
Post
-floo
d R
elie
f and
Rec
over
y su
rvey
, Jan
uary
201
2.
Bac
kgro
und
Wild
fish
: b
efor
e flo
od
Wild
fish
:
curr
ent
Num
ber
Wild
fish
: cur
rent
cat
chR
aise
fish
: b
efor
e flo
od
Rai
se fi
sh:
curr
ent
Num
ber
Mor
e th
an
usua
la
bou
t the
sa
me
Less
than
us
ual
Tota
lN
umb
er
ecol
ogic
al Z
one
Plai
ns30
.219
.81,
524
27.5
22.8
49.7
100.
030
27.
25.
31,
524
tonl
e sa
p41
.837
.387
327
.822
.050
.310
0.0
326
2.7
1.7
873
Wea
lth q
uint
ile
Poor
est
46.6
39.2
520
26.2
21.1
52.7
100.
020
44.
13.
352
0
seco
nd38
.928
.149
432
.221
.646
.210
0.0
139
4.3
3.2
494
Mid
dle
35.5
27.6
471
27.5
21.3
51.2
100.
013
07.
25.
047
1
four
th30
.422
.245
817
.030
.552
.510
0.0
101
5.7
4.1
458
Ric
hest
18.5
11.7
454
41.7
16.6
41.7
100.
053
6.6
4.7
454
tota
l34
.426
.22,
397
27.6
22.4
50.0
100.
062
85.
54.
02,
397
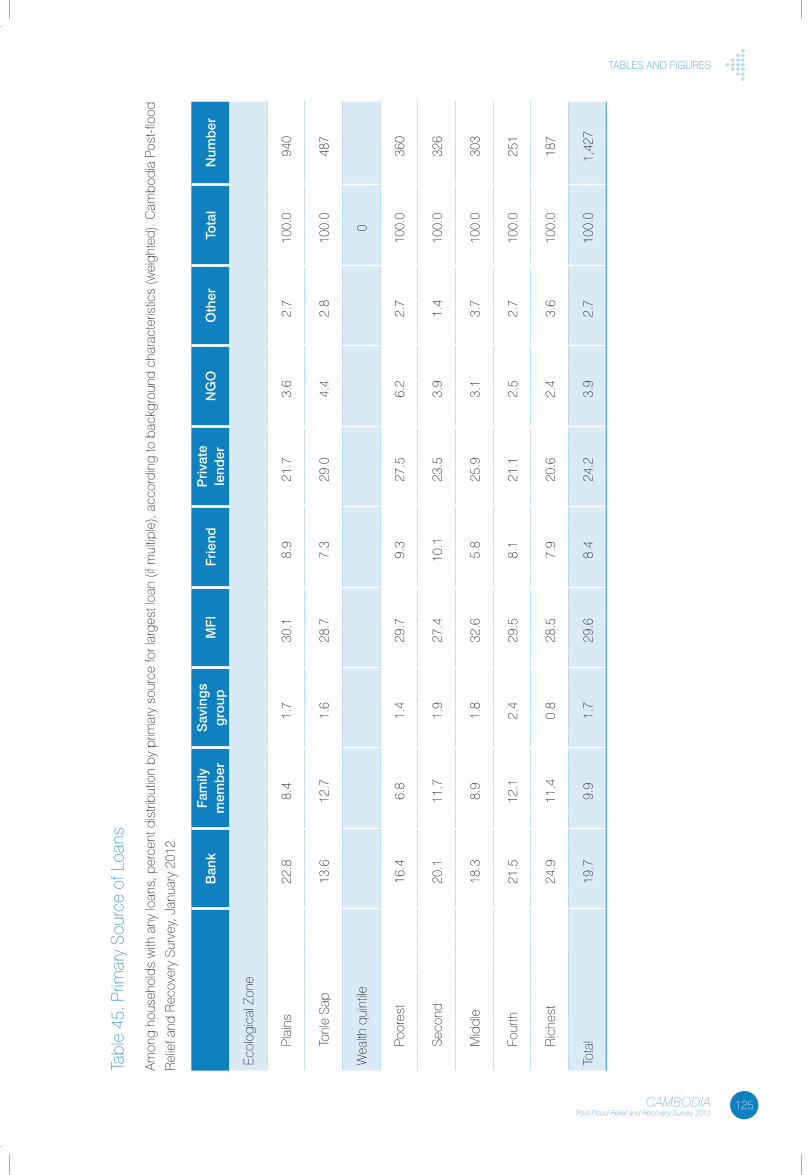
125CAMBODIAPost-Flood Relief and Recovery Survey 2012
tables anD fIGURes
tabl
e 45
. Prim
ary
sour
ce o
f loa
ns
amon
g ho
useh
olds
with
any
loan
s, p
erce
nt d
istri
butio
n by
prim
ary
sour
ce fo
r lar
gest
loan
(if m
ultip
le),
acco
rdin
g to
bac
kgro
und
char
acte
ristic
s (w
eigh
ted)
. cam
bodi
a Po
st-fl
ood
Rel
ief a
nd R
ecov
ery
surv
ey, J
anua
ry 2
012.
Ban
kFa
mily
m
emb
erS
avin
gs
gro
upM
FIFr
iend
Priv
ate
lend
erN
gO
Oth
erTo
tal
Num
ber
ecol
ogic
al Z
one
Plai
ns22
.88.
41.
730
.18.
921
.73.
62.
710
0.0
940
tonl
e sa
p13
.612
.71.
628
.77.
329
.04.
42.
810
0.0
487
Wea
lth q
uint
ile0
Poor
est
16.4
6.8
1.4
29.7
9.3
27.5
6.2
2.7
100.
036
0
seco
nd20
.111
.71.
927
.410
.123
.53.
91.
410
0.0
326
Mid
dle
18.3
8.9
1.8
32.6
5.8
25.9
3.1
3.7
100.
030
3
four
th21
.512
.12.
429
.58.
121
.12.
52.
710
0.0
251
Ric
hest
24.9
11.4
0.8
28.5
7.9
20.6
2.4
3.6
100.
018
7
tota
l19
.79.
91.
729
.68.
424
.23.
92.
710
0.0
1,42
7
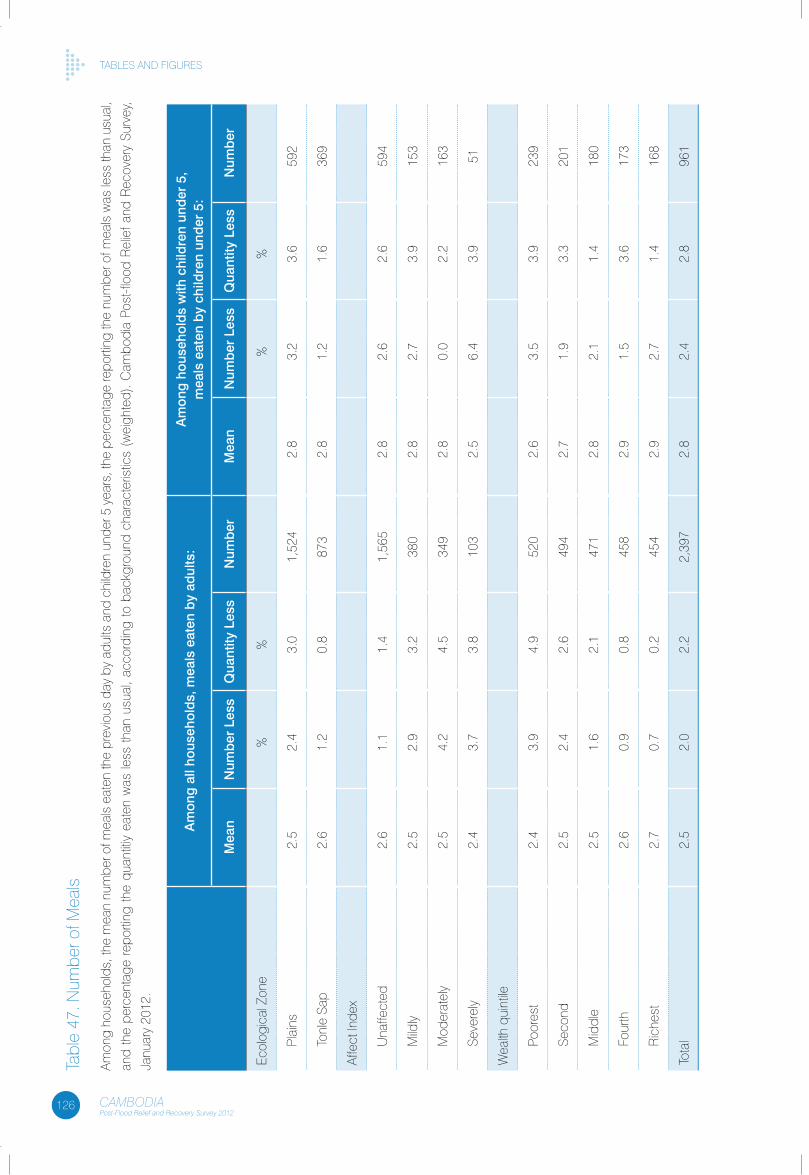
126 CAMBODIAPost-Flood Relief and Recovery Survey 2012
tables anD fIGUResta
ble
47. n
umbe
r of M
eals
amon
g ho
useh
olds
, the
mea
n nu
mbe
r of m
eals
eat
en th
e pr
evio
us d
ay b
y ad
ults
and
chi
ldre
n un
der 5
yea
rs, t
he p
erce
ntag
e re
porti
ng th
e nu
mbe
r of m
eals
was
less
than
usu
al,
and
the
perc
enta
ge re
porti
ng th
e qu
antit
iy e
aten
was
less
than
usu
al, a
ccor
ding
to b
ackg
roun
d ch
arac
teris
tics
(wei
ghte
d). c
ambo
dia
Post
-floo
d R
elie
f and
Rec
over
y su
rvey
,
Janu
ary
2012
.
am
ong
all
hous
ehol
ds,
mea
ls e
aten
by
adul
ts:
am
ong
hou
seho
lds
with
chi
ldre
n un
der
5,
mea
ls e
aten
by
child
ren
und
er 5
:
Mea
nN
umb
er L
ess
Qua
ntity
Les
sN
umb
erM
ean
Num
ber
Les
sQ
uant
ity L
ess
Num
ber
ecol
ogic
al Z
one
%%
%%
Plai
ns2.
52.
43.
01,
524
2.8
3.2
3.6
592
tonl
e sa
p2.
61.
20.
887
32.
81.
21.
636
9
affe
ct In
dex
Una
ffect
ed2.
61.
11.
41,
565
2.8
2.6
2.6
594
Mild
ly2.
52.
93.
238
02.
82.
73.
915
3
Mod
erat
ely
2.5
4.2
4.5
349
2.8
0.0
2.2
163
seve
rely
2.4
3.7
3.8
103
2.5
6.4
3.9
51
Wea
lth q
uint
ile
Poor
est
2.4
3.9
4.9
520
2.6
3.5
3.9
239
seco
nd2.
52.
42.
649
42.
71.
93.
320
1
Mid
dle
2.5
1.6
2.1
471
2.8
2.1
1.4
180
four
th2.
60.
90.
845
82.
91.
53.
617
3
Ric
hest
2.7
0.7
0.2
454
2.9
2.7
1.4
168
tota
l2.
52.
02.
22,
397
2.8
2.4
2.8
961
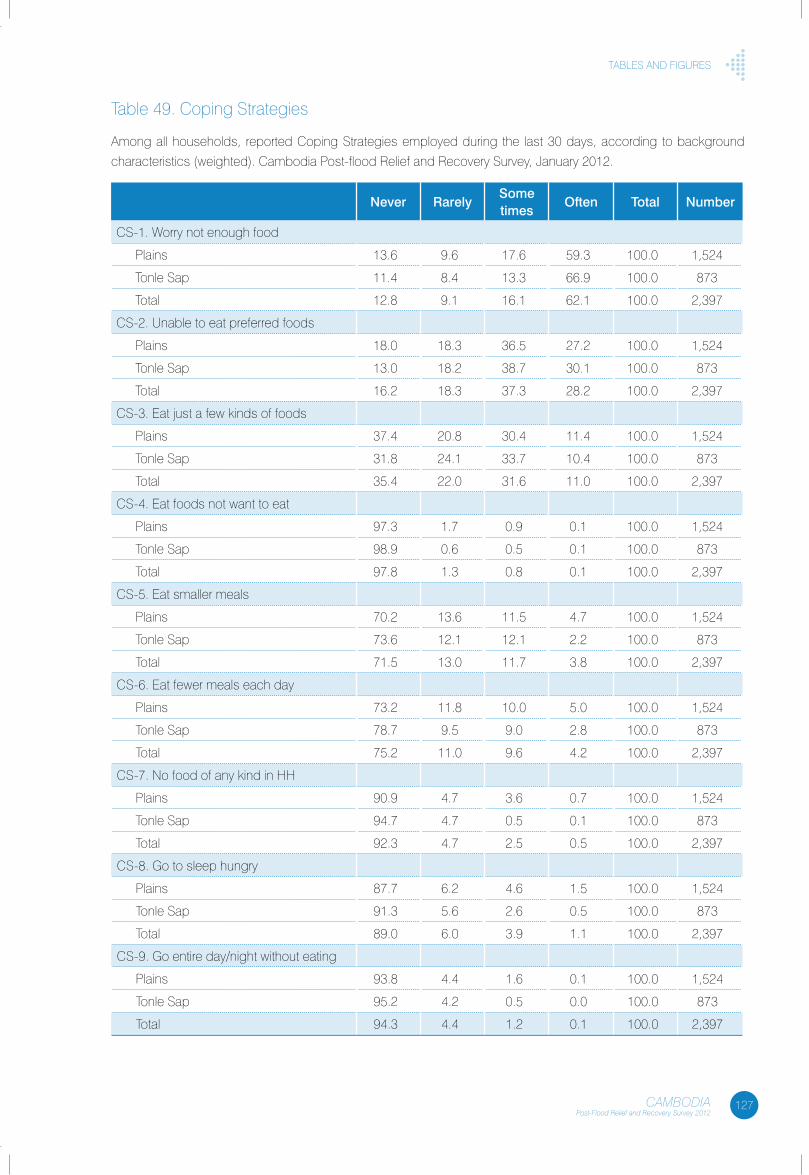
127CAMBODIAPost-Flood Relief and Recovery Survey 2012
tables anD fIGURes
table 49. coping strategies
among all households, reported coping strategies employed during the last 30 days, according to background
characteristics (weighted). cambodia Post-flood Relief and Recovery survey, January 2012.
Never RarelySome times
Often Total Number
cs-1. Worry not enough food
Plains 13.6 9.6 17.6 59.3 100.0 1,524
tonle sap 11.4 8.4 13.3 66.9 100.0 873
total 12.8 9.1 16.1 62.1 100.0 2,397
cs-2. Unable to eat preferred foods
Plains 18.0 18.3 36.5 27.2 100.0 1,524
tonle sap 13.0 18.2 38.7 30.1 100.0 873
total 16.2 18.3 37.3 28.2 100.0 2,397
cs-3. eat just a few kinds of foods
Plains 37.4 20.8 30.4 11.4 100.0 1,524
tonle sap 31.8 24.1 33.7 10.4 100.0 873
total 35.4 22.0 31.6 11.0 100.0 2,397
cs-4. eat foods not want to eat
Plains 97.3 1.7 0.9 0.1 100.0 1,524
tonle sap 98.9 0.6 0.5 0.1 100.0 873
total 97.8 1.3 0.8 0.1 100.0 2,397
cs-5. eat smaller meals
Plains 70.2 13.6 11.5 4.7 100.0 1,524
tonle sap 73.6 12.1 12.1 2.2 100.0 873
total 71.5 13.0 11.7 3.8 100.0 2,397
cs-6. eat fewer meals each day
Plains 73.2 11.8 10.0 5.0 100.0 1,524
tonle sap 78.7 9.5 9.0 2.8 100.0 873
total 75.2 11.0 9.6 4.2 100.0 2,397
cs-7. no food of any kind in HH
Plains 90.9 4.7 3.6 0.7 100.0 1,524
tonle sap 94.7 4.7 0.5 0.1 100.0 873
total 92.3 4.7 2.5 0.5 100.0 2,397
cs-8. Go to sleep hungry
Plains 87.7 6.2 4.6 1.5 100.0 1,524
tonle sap 91.3 5.6 2.6 0.5 100.0 873
total 89.0 6.0 3.9 1.1 100.0 2,397
cs-9. Go entire day/night without eating
Plains 93.8 4.4 1.6 0.1 100.0 1,524
tonle sap 95.2 4.2 0.5 0.0 100.0 873
total 94.3 4.4 1.2 0.1 100.0 2,397
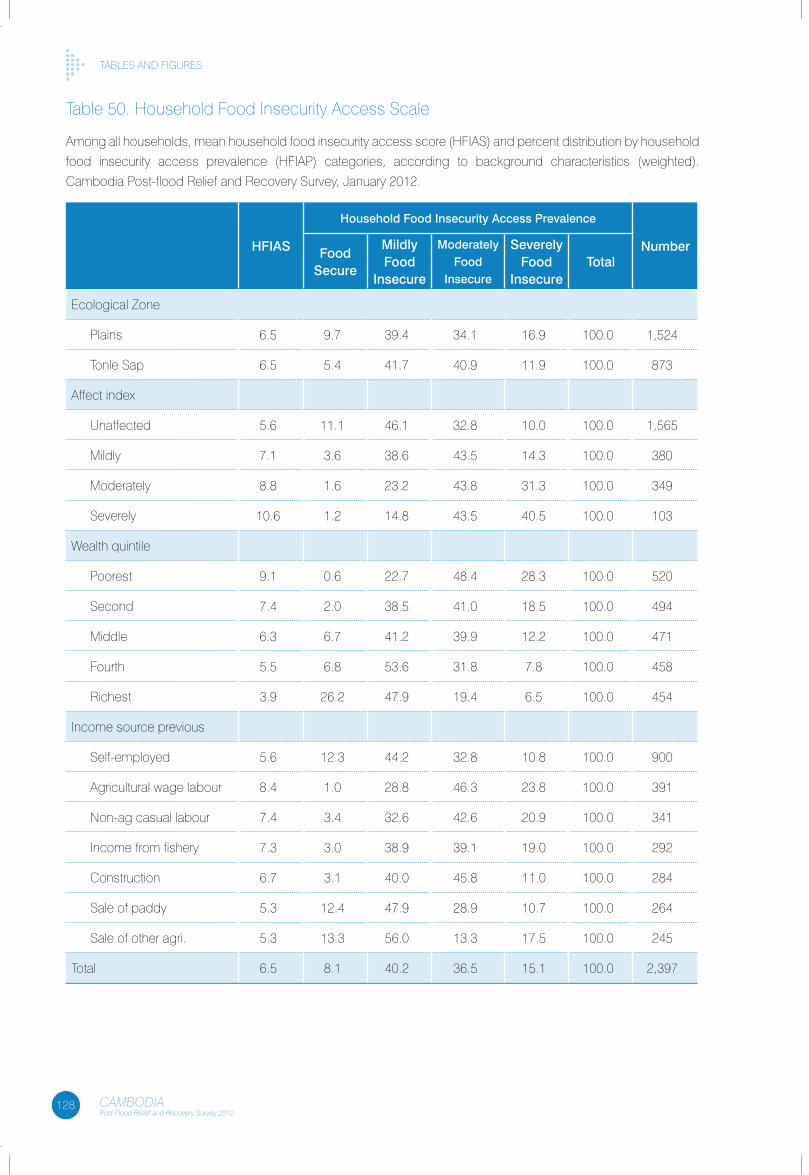
128 CAMBODIAPost-Flood Relief and Recovery Survey 2012
tables anD fIGURes
table 50. Household food Insecurity access scale
among all households, mean household food insecurity access score (HfIas) and percent distribution by household
food insecurity access prevalence (HfIaP) categories, according to background characteristics (weighted).
cambodia Post-flood Relief and Recovery survey, January 2012.
HFIaS
Household Food Insecurity access Prevalence
NumberFood Secure
Mildly Food
Insecure
Moderately Food
Insecure
Severely Food
InsecureTotal
ecological Zone
Plains 6.5 9.7 39.4 34.1 16.9 100.0 1,524
tonle sap 6.5 5.4 41.7 40.9 11.9 100.0 873
affect index
Unaffected 5.6 11.1 46.1 32.8 10.0 100.0 1,565
Mildly 7.1 3.6 38.6 43.5 14.3 100.0 380
Moderately 8.8 1.6 23.2 43.8 31.3 100.0 349
severely 10.6 1.2 14.8 43.5 40.5 100.0 103
Wealth quintile
Poorest 9.1 0.6 22.7 48.4 28.3 100.0 520
second 7.4 2.0 38.5 41.0 18.5 100.0 494
Middle 6.3 6.7 41.2 39.9 12.2 100.0 471
fourth 5.5 6.8 53.6 31.8 7.8 100.0 458
Richest 3.9 26.2 47.9 19.4 6.5 100.0 454
Income source previous
self-employed 5.6 12.3 44.2 32.8 10.8 100.0 900
agricultural wage labour 8.4 1.0 28.8 46.3 23.8 100.0 391
non-ag casual labour 7.4 3.4 32.6 42.6 20.9 100.0 341
Income from fishery 7.3 3.0 38.9 39.1 19.0 100.0 292
construction 6.7 3.1 40.0 45.8 11.0 100.0 284
sale of paddy 5.3 12.4 47.9 28.9 10.7 100.0 264
sale of other agri. 5.3 13.3 56.0 13.3 17.5 100.0 245
total 6.5 8.1 40.2 36.5 15.1 100.0 2,397
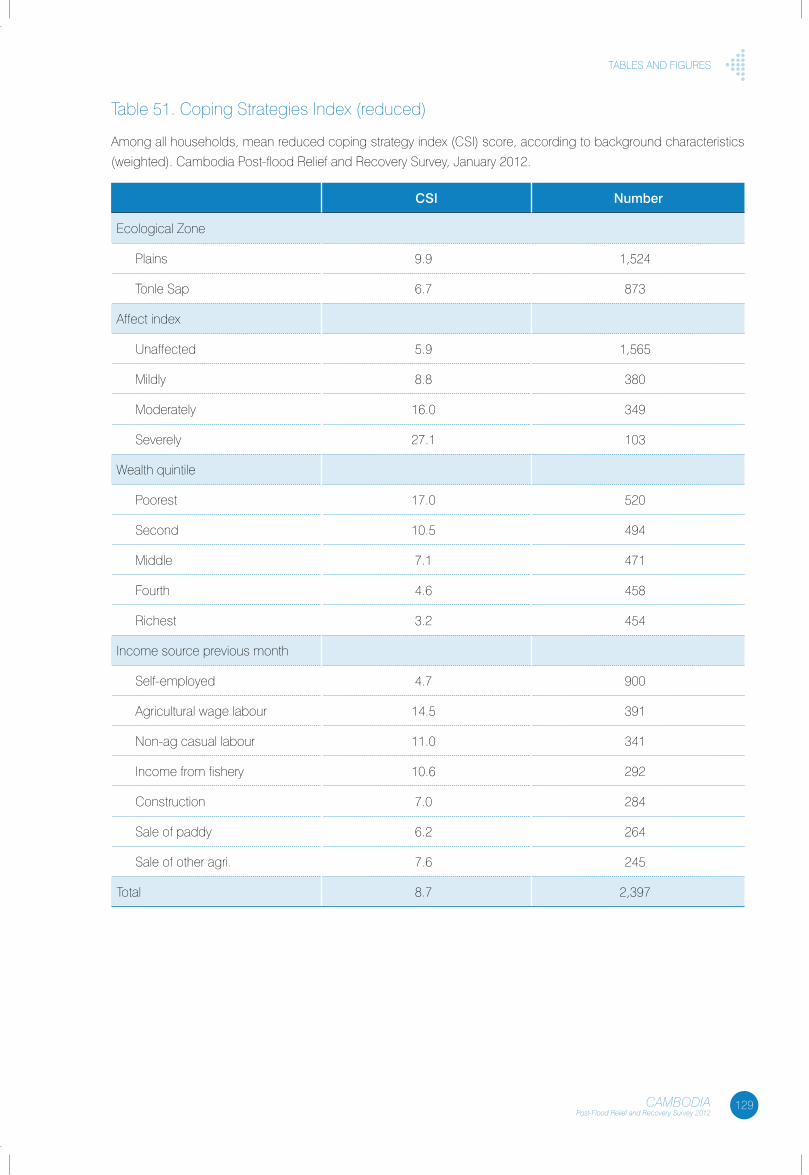
129CAMBODIAPost-Flood Relief and Recovery Survey 2012
tables anD fIGURes
table 51. coping strategies Index (reduced)
among all households, mean reduced coping strategy index (csI) score, according to background characteristics
(weighted). cambodia Post-flood Relief and Recovery survey, January 2012.
CSI Number
ecological Zone
Plains 9.9 1,524
tonle sap 6.7 873
affect index
Unaffected 5.9 1,565
Mildly 8.8 380
Moderately 16.0 349
severely 27.1 103
Wealth quintile
Poorest 17.0 520
second 10.5 494
Middle 7.1 471
fourth 4.6 458
Richest 3.2 454
Income source previous month
self-employed 4.7 900
agricultural wage labour 14.5 391
non-ag casual labour 11.0 341
Income from fishery 10.6 292
construction 7.0 284
sale of paddy 6.2 264
sale of other agri. 7.6 245
total 8.7 2,397
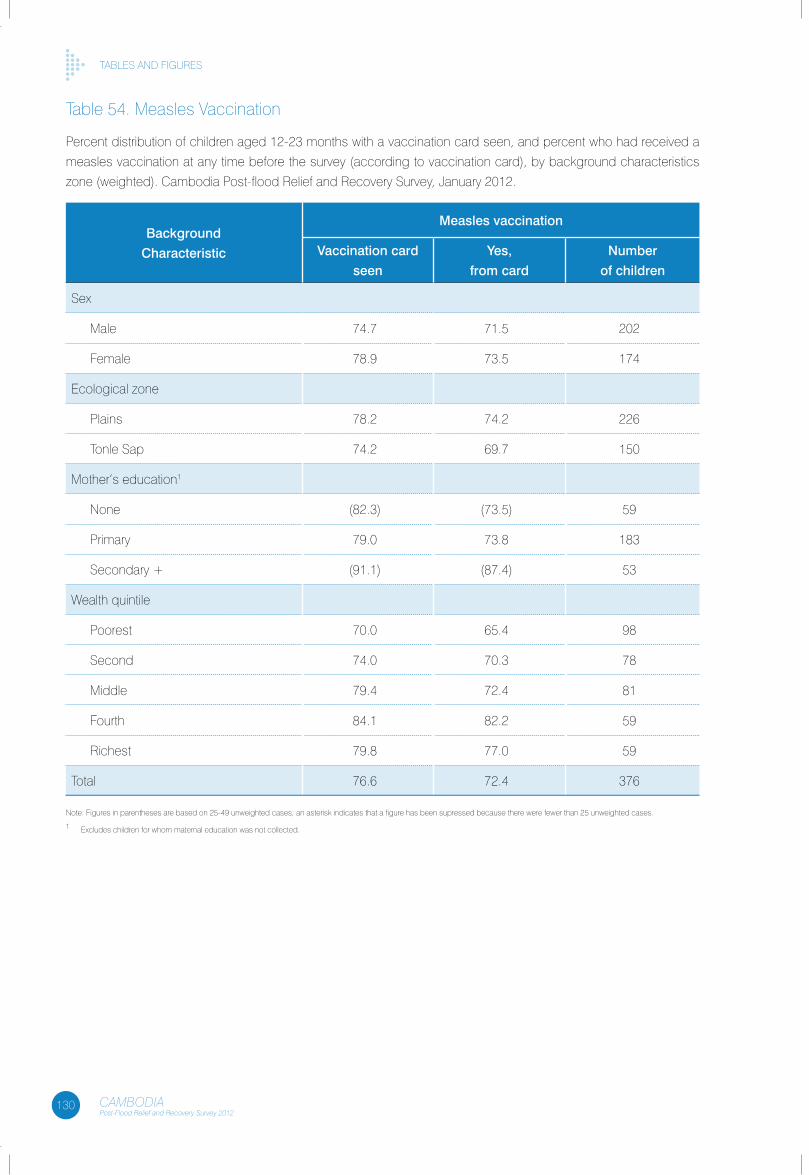
130 CAMBODIAPost-Flood Relief and Recovery Survey 2012
tables anD fIGURes
table 54. Measles Vaccination
Percent distribution of children aged 12-23 months with a vaccination card seen, and percent who had received a
measles vaccination at any time before the survey (according to vaccination card), by background characteristics
zone (weighted). cambodia Post-flood Relief and Recovery survey, January 2012.
Background
Characteristic
Measles vaccination
Vaccination card
seen
Yes,
from card
Number
of children
sex
Male 74.7 71.5 202
female 78.9 73.5 174
ecological zone
Plains 78.2 74.2 226
tonle sap 74.2 69.7 150
Mother’s education1
none (82.3) (73.5) 59
Primary 79.0 73.8 183
secondary + (91.1) (87.4) 53
Wealth quintile
Poorest 70.0 65.4 98
second 74.0 70.3 78
Middle 79.4 72.4 81
fourth 84.1 82.2 59
Richest 79.8 77.0 59
total 76.6 72.4 376
note: figures in parentheses are based on 25-49 unweighted cases; an asterisk indicates that a figure has been supressed because there were fewer than 25 unweighted cases.
1 excludes children for whom maternal education was not collected.
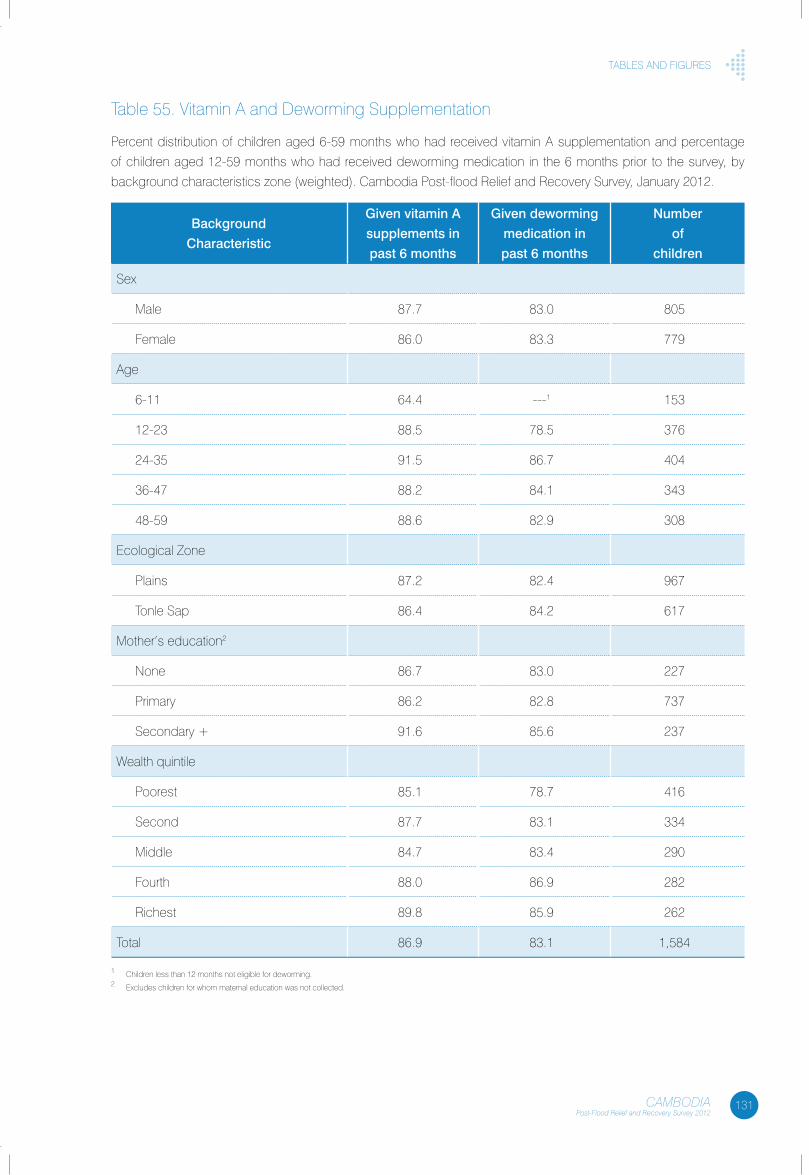
131CAMBODIAPost-Flood Relief and Recovery Survey 2012
tables anD fIGURes
table 55. Vitamin a and Deworming supplementation
Percent distribution of children aged 6-59 months who had received vitamin a supplementation and percentage
of children aged 12-59 months who had received deworming medication in the 6 months prior to the survey, by
background characteristics zone (weighted). cambodia Post-flood Relief and Recovery survey, January 2012.
Background
Characteristic
given vitamin a
supplements in
past 6 months
given deworming
medication in
past 6 months
Number
of
children
sex
Male 87.7 83.0 805
female 86.0 83.3 779
age
6-11 64.4 ---1 153
12-23 88.5 78.5 376
24-35 91.5 86.7 404
36-47 88.2 84.1 343
48-59 88.6 82.9 308
ecological Zone
Plains 87.2 82.4 967
tonle sap 86.4 84.2 617
Mother’s education2
none 86.7 83.0 227
Primary 86.2 82.8 737
secondary + 91.6 85.6 237
Wealth quintile
Poorest 85.1 78.7 416
second 87.7 83.1 334
Middle 84.7 83.4 290
fourth 88.0 86.9 282
Richest 89.8 85.9 262
total 86.9 83.1 1,584
1 children less than 12 months not eligible for deworming.2 excludes children for whom maternal education was not collected.
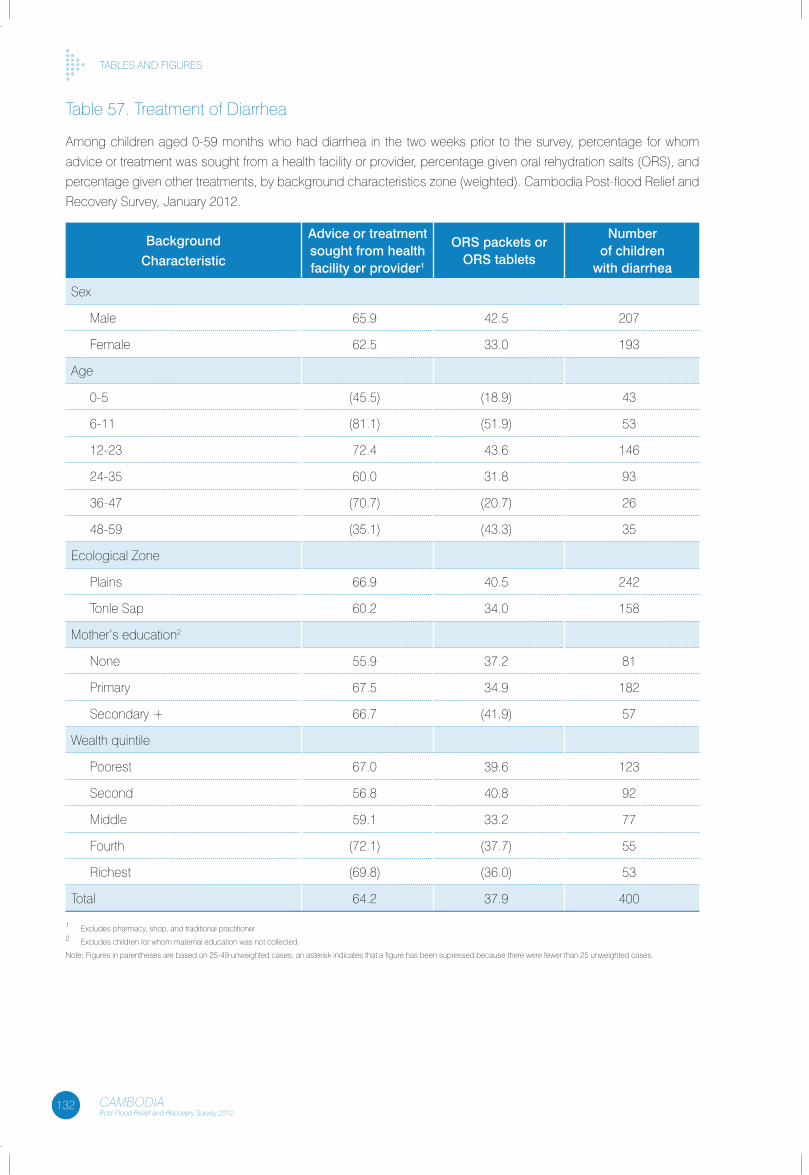
132 CAMBODIAPost-Flood Relief and Recovery Survey 2012
tables anD fIGURes
table 57. treatment of Diarrhea
among children aged 0-59 months who had diarrhea in the two weeks prior to the survey, percentage for whom
advice or treatment was sought from a health facility or provider, percentage given oral rehydration salts (oRs), and
percentage given other treatments, by background characteristics zone (weighted). cambodia Post-flood Relief and
Recovery survey, January 2012.
Background
Characteristic
advice or treatment sought from health facility or provider1
ORS packets or ORS tablets
Number of children
with diarrhea
sex
Male 65.9 42.5 207
female 62.5 33.0 193
age
0-5 (45.5) (18.9) 43
6-11 (81.1) (51.9) 53
12-23 72.4 43.6 146
24-35 60.0 31.8 93
36-47 (70.7) (20.7) 26
48-59 (35.1) (43.3) 35
ecological Zone
Plains 66.9 40.5 242
tonle sap 60.2 34.0 158
Mother’s education2
none 55.9 37.2 81
Primary 67.5 34.9 182
secondary + 66.7 (41.9) 57
Wealth quintile
Poorest 67.0 39.6 123
second 56.8 40.8 92
Middle 59.1 33.2 77
fourth (72.1) (37.7) 55
Richest (69.8) (36.0) 53
total 64.2 37.9 400
1 excludes pharmacy, shop, and traditional practitioner2 excludes children for whom maternal education was not collected.
note: figures in parentheses are based on 25-49 unweighted cases; an asterisk indicates that a figure has been supressed because there were fewer than 25 unweighted cases.
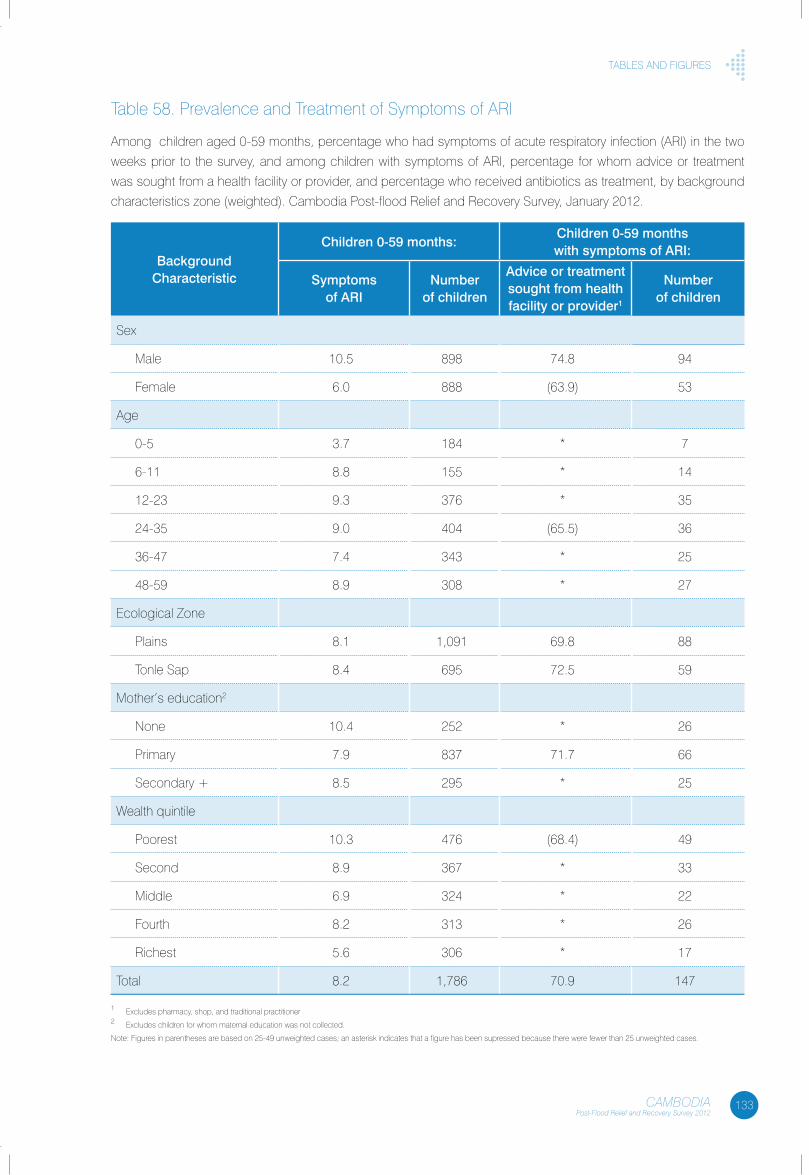
133CAMBODIAPost-Flood Relief and Recovery Survey 2012
tables anD fIGURes
table 58. Prevalence and treatment of symptoms of aRI
among children aged 0-59 months, percentage who had symptoms of acute respiratory infection (aRI) in the two
weeks prior to the survey, and among children with symptoms of aRI, percentage for whom advice or treatment
was sought from a health facility or provider, and percentage who received antibiotics as treatment, by background
characteristics zone (weighted). cambodia Post-flood Relief and Recovery survey, January 2012.
Background Characteristic
Children 0-59 months:Children 0-59 months with symptoms of aRI:
Symptoms of aRI
Number of children
advice or treatment sought from health facility or provider1
Number of children
sex
Male 10.5 898 74.8 94
female 6.0 888 (63.9) 53
age
0-5 3.7 184 * 7
6-11 8.8 155 * 14
12-23 9.3 376 * 35
24-35 9.0 404 (65.5) 36
36-47 7.4 343 * 25
48-59 8.9 308 * 27
ecological Zone
Plains 8.1 1,091 69.8 88
tonle sap 8.4 695 72.5 59
Mother’s education2
none 10.4 252 * 26
Primary 7.9 837 71.7 66
secondary + 8.5 295 * 25
Wealth quintile
Poorest 10.3 476 (68.4) 49
second 8.9 367 * 33
Middle 6.9 324 * 22
fourth 8.2 313 * 26
Richest 5.6 306 * 17
total 8.2 1,786 70.9 147
1 excludes pharmacy, shop, and traditional practitioner2 excludes children for whom maternal education was not collected.
note: figures in parentheses are based on 25-49 unweighted cases; an asterisk indicates that a figure has been supressed because there were fewer than 25 unweighted cases.
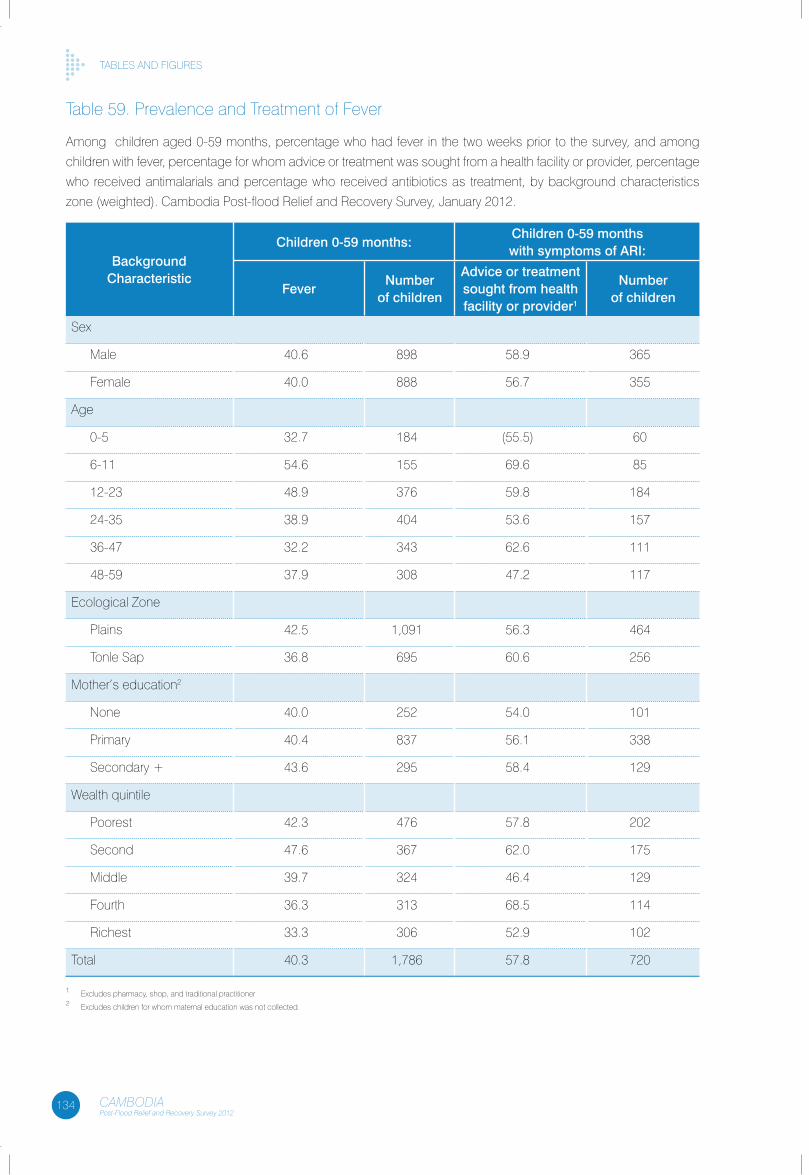
134 CAMBODIAPost-Flood Relief and Recovery Survey 2012
tables anD fIGURes
table 59. Prevalence and treatment of fever
among children aged 0-59 months, percentage who had fever in the two weeks prior to the survey, and among
children with fever, percentage for whom advice or treatment was sought from a health facility or provider, percentage
who received antimalarials and percentage who received antibiotics as treatment, by background characteristics
zone (weighted). cambodia Post-flood Relief and Recovery survey, January 2012.
Background Characteristic
Children 0-59 months:Children 0-59 months with symptoms of aRI:
FeverNumber
of children
advice or treatment sought from health facility or provider1
Number of children
sex
Male 40.6 898 58.9 365
female 40.0 888 56.7 355
age
0-5 32.7 184 (55.5) 60
6-11 54.6 155 69.6 85
12-23 48.9 376 59.8 184
24-35 38.9 404 53.6 157
36-47 32.2 343 62.6 111
48-59 37.9 308 47.2 117
ecological Zone
Plains 42.5 1,091 56.3 464
tonle sap 36.8 695 60.6 256
Mother’s education2
none 40.0 252 54.0 101
Primary 40.4 837 56.1 338
secondary + 43.6 295 58.4 129
Wealth quintile
Poorest 42.3 476 57.8 202
second 47.6 367 62.0 175
Middle 39.7 324 46.4 129
fourth 36.3 313 68.5 114
Richest 33.3 306 52.9 102
total 40.3 1,786 57.8 720
1 excludes pharmacy, shop, and traditional practitioner2 excludes children for whom maternal education was not collected.
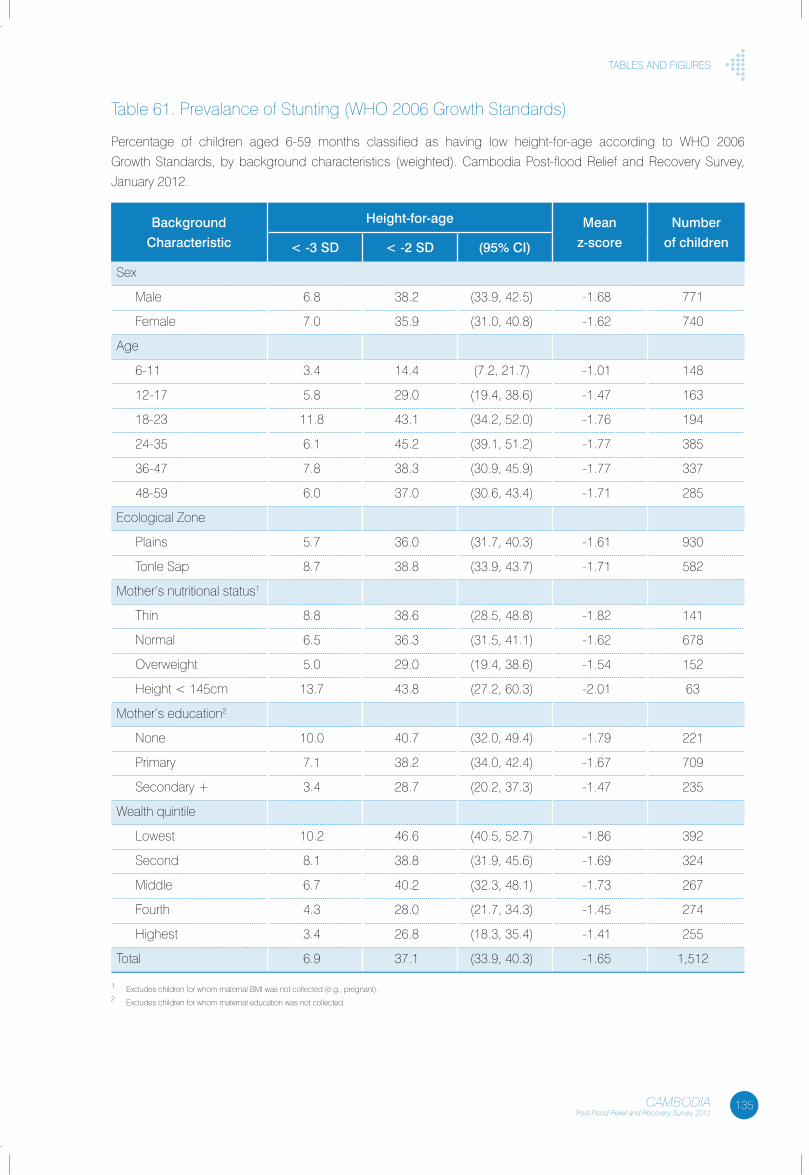
135CAMBODIAPost-Flood Relief and Recovery Survey 2012
tables anD fIGURes
table 61. Prevalance of stunting (WHo 2006 Growth standards)
Percentage of children aged 6-59 months classified as having low height-for-age according to WHo 2006
Growth standards, by background characteristics (weighted). cambodia Post-flood Relief and Recovery survey,
January 2012.
Background
Characteristic
Height-for-age Mean
z-score
Number
of children< -3 SD < -2 SD (95% CI)
sex
Male 6.8 38.2 (33.9, 42.5) -1.68 771
female 7.0 35.9 (31.0, 40.8) -1.62 740
age
6-11 3.4 14.4 (7.2, 21.7) -1.01 148
12-17 5.8 29.0 (19.4, 38.6) -1.47 163
18-23 11.8 43.1 (34.2, 52.0) -1.76 194
24-35 6.1 45.2 (39.1, 51.2) -1.77 385
36-47 7.8 38.3 (30.9, 45.9) -1.77 337
48-59 6.0 37.0 (30.6, 43.4) -1.71 285
ecological Zone
Plains 5.7 36.0 (31.7, 40.3) -1.61 930
tonle sap 8.7 38.8 (33.9, 43.7) -1.71 582
Mother’s nutritional status1
thin 8.8 38.6 (28.5, 48.8) -1.82 141
normal 6.5 36.3 (31.5, 41.1) -1.62 678
overweight 5.0 29.0 (19.4, 38.6) -1.54 152
Height < 145cm 13.7 43.8 (27.2, 60.3) -2.01 63
Mother’s education2
none 10.0 40.7 (32.0, 49.4) -1.79 221
Primary 7.1 38.2 (34.0, 42.4) -1.67 709
secondary + 3.4 28.7 (20.2, 37.3) -1.47 235
Wealth quintile
lowest 10.2 46.6 (40.5, 52.7) -1.86 392
second 8.1 38.8 (31.9, 45.6) -1.69 324
Middle 6.7 40.2 (32.3, 48.1) -1.73 267
fourth 4.3 28.0 (21.7, 34.3) -1.45 274
Highest 3.4 26.8 (18.3, 35.4) -1.41 255
total 6.9 37.1 (33.9, 40.3) -1.65 1,512
1 excludes children for whom maternal bMI was not collected (e.g., pregnant).2 excludes children for whom maternal education was not collected.
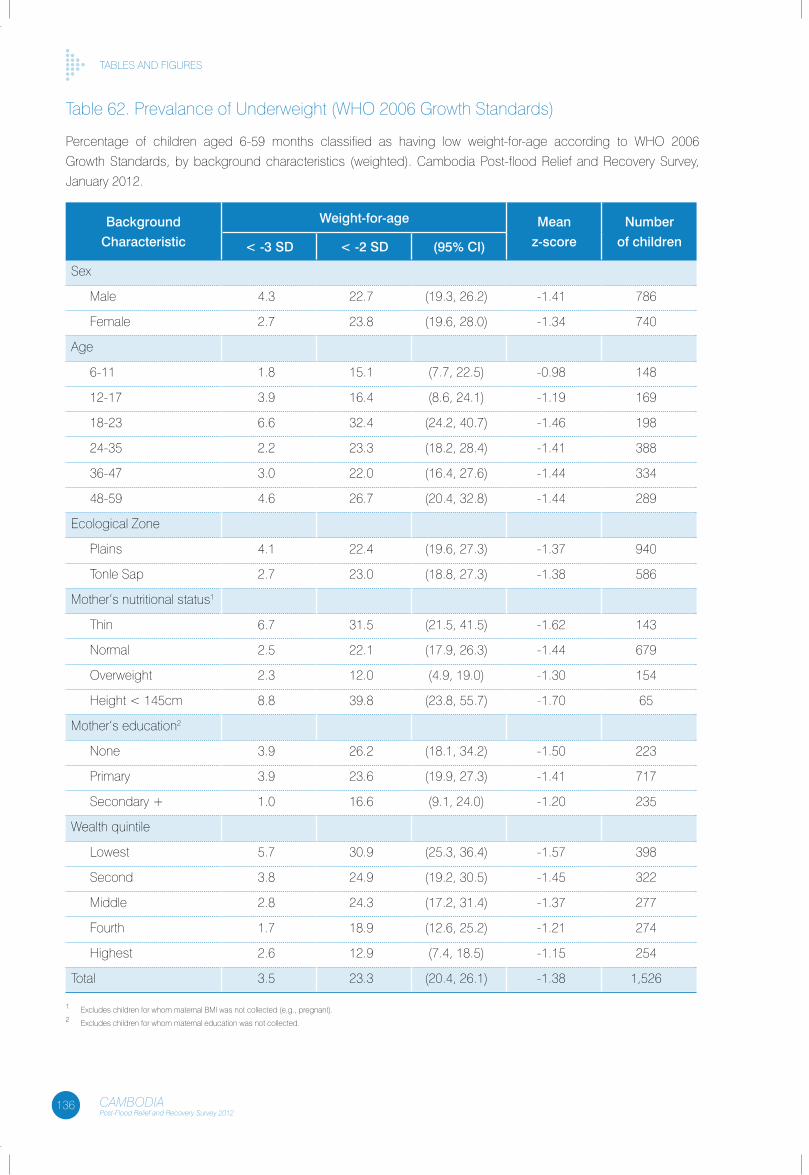
136 CAMBODIAPost-Flood Relief and Recovery Survey 2012
tables anD fIGURes
table 62. Prevalance of Underweight (WHo 2006 Growth standards)
Percentage of children aged 6-59 months classified as having low weight-for-age according to WHo 2006
Growth standards, by background characteristics (weighted). cambodia Post-flood Relief and Recovery survey,
January 2012.
Background
Characteristic
Weight-for-age Mean
z-score
Number
of children< -3 SD < -2 SD (95% CI)
sex
Male 4.3 22.7 (19.3, 26.2) -1.41 786
female 2.7 23.8 (19.6, 28.0) -1.34 740
age
6-11 1.8 15.1 (7.7, 22.5) -0.98 148
12-17 3.9 16.4 (8.6, 24.1) -1.19 169
18-23 6.6 32.4 (24.2, 40.7) -1.46 198
24-35 2.2 23.3 (18.2, 28.4) -1.41 388
36-47 3.0 22.0 (16.4, 27.6) -1.44 334
48-59 4.6 26.7 (20.4, 32.8) -1.44 289
ecological Zone
Plains 4.1 22.4 (19.6, 27.3) -1.37 940
tonle sap 2.7 23.0 (18.8, 27.3) -1.38 586
Mother’s nutritional status1
thin 6.7 31.5 (21.5, 41.5) -1.62 143
normal 2.5 22.1 (17.9, 26.3) -1.44 679
overweight 2.3 12.0 (4.9, 19.0) -1.30 154
Height < 145cm 8.8 39.8 (23.8, 55.7) -1.70 65
Mother’s education2
none 3.9 26.2 (18.1, 34.2) -1.50 223
Primary 3.9 23.6 (19.9, 27.3) -1.41 717
secondary + 1.0 16.6 (9.1, 24.0) -1.20 235
Wealth quintile
lowest 5.7 30.9 (25.3, 36.4) -1.57 398
second 3.8 24.9 (19.2, 30.5) -1.45 322
Middle 2.8 24.3 (17.2, 31.4) -1.37 277
fourth 1.7 18.9 (12.6, 25.2) -1.21 274
Highest 2.6 12.9 (7.4, 18.5) -1.15 254
total 3.5 23.3 (20.4, 26.1) -1.38 1,526
1 excludes children for whom maternal bMI was not collected (e.g., pregnant).2 excludes children for whom maternal education was not collected.
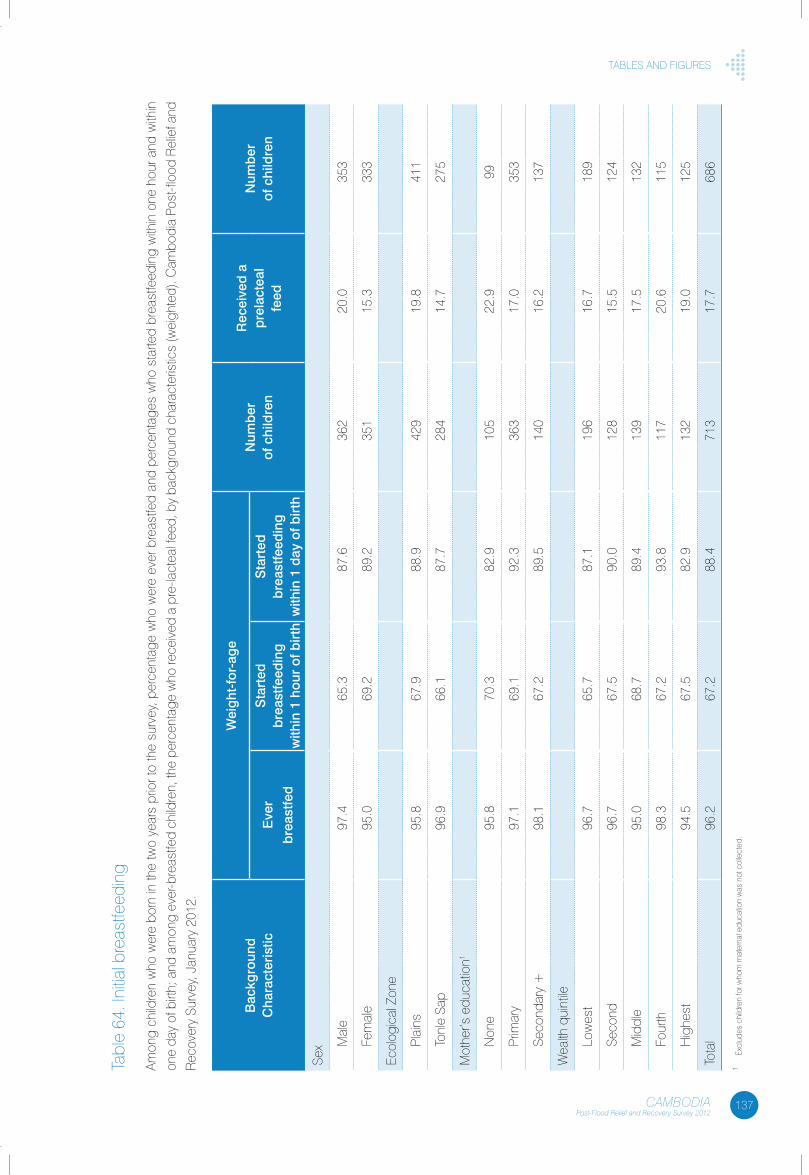
137CAMBODIAPost-Flood Relief and Recovery Survey 2012
tables anD fIGURes
tabl
e 64
. Ini
tial b
reas
tfeed
ing
amon
g ch
ildre
n w
ho w
ere
born
in th
e tw
o ye
ars
prio
r to
the
surv
ey, p
erce
ntag
e w
ho w
ere
ever
bre
astfe
d an
d pe
rcen
tage
s w
ho s
tarte
d br
east
feed
ing
with
in o
ne h
our a
nd w
ithin
one
day
of b
irth;
and
am
ong
ever
-bre
astfe
d ch
ildre
n, th
e pe
rcen
tage
who
rece
ived
a p
re-la
ctea
l fee
d, b
y ba
ckgr
ound
cha
ract
eris
tics
(wei
ghte
d). c
ambo
dia
Post
-floo
d R
elie
f and
Rec
over
y su
rvey
, Jan
uary
201
2.
Bac
kgro
und
C
hara
cter
istic
Wei
ght
-for
-ag
eN
umb
er
of c
hild
ren
Rec
eive
d a
p
rela
ctea
l fe
ed
Num
ber
of
chi
ldre
ne
ver
bre
astfe
d
Sta
rted
b
reas
tfeed
ing
w
ithin
1 h
our
of b
irth
Sta
rted
b
reas
tfeed
ing
w
ithin
1 d
ay o
f birt
h
sex M
ale
97.4
65.3
87.6
362
20.0
353
fem
ale
95.0
69.2
89.2
351
15.3
333
ecol
ogic
al Z
one
Plai
ns95
.867
.988
.942
919
.841
1
tonl
e sa
p96
.966
.187
.728
414
.727
5
Mot
her’s
edu
catio
n1
non
e95
.870
.382
.910
522
.999
Prim
ary
97.1
69.1
92.3
363
17.0
353
seco
ndar
y +
98.1
67.2
89.5
140
16.2
137
Wea
lth q
uint
ile
low
est
96.7
65.7
87.1
196
16.7
189
seco
nd96
.767
.590
.012
815
.512
4
Mid
dle
95.0
68.7
89.4
139
17.5
132
four
th98
.367
.293
.811
720
.611
5
Hig
hest
94.5
67.5
82.9
132
19.0
125
tota
l96
.267
.288
.471
317
.768
6
1 ex
clud
es c
hild
ren
for w
hom
mat
erna
l edu
catio
n w
as n
ot c
olle
cted
.
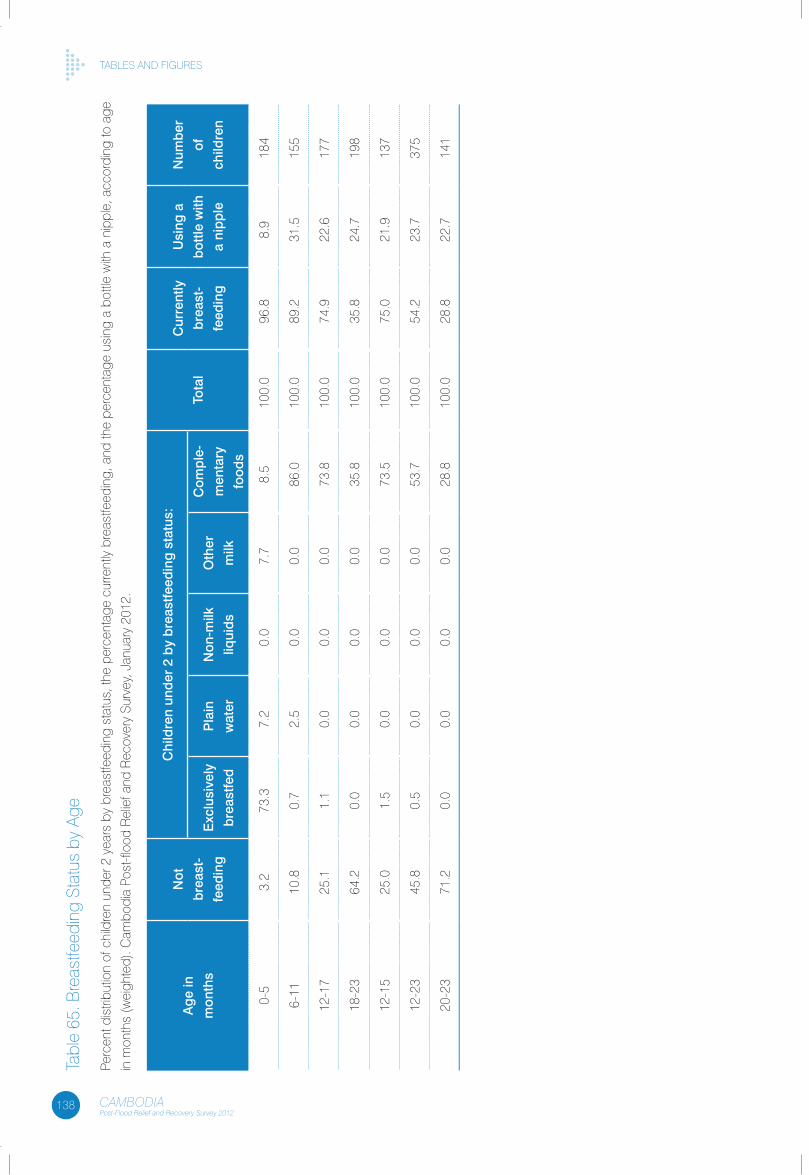
138 CAMBODIAPost-Flood Relief and Recovery Survey 2012
tables anD fIGUResta
ble
65. b
reas
tfeed
ing
stat
us b
y ag
e
Perc
ent d
istri
butio
n of
chi
ldre
n un
der 2
yea
rs b
y br
east
feed
ing
stat
us, t
he p
erce
ntag
e cu
rrent
ly b
reas
tfeed
ing,
and
the
perc
enta
ge u
sing
a b
ottle
with
a n
ippl
e, a
ccor
ding
to a
ge
in m
onth
s (w
eigh
ted)
. cam
bodi
a Po
st-fl
ood
Rel
ief a
nd R
ecov
ery
surv
ey, J
anua
ry 2
012.
ag
e in
mon
ths
Not
bre
ast-
feed
ing
Chi
ldre
n un
der
2 b
y b
reas
tfeed
ing
sta
tus:
Tota
l
Cur
rent
ly
bre
ast-
feed
ing
Usi
ng a
bot
tle w
ith
a ni
pp
le
Num
ber
of
child
ren
exc
lusi
vely
bre
astfe
d
Pla
in
wat
er
Non
-milk
liqui
ds
Oth
er
milk
Com
ple
-
men
tary
food
s
0-5
3.2
73.3
7.2
0.0
7.7
8.5
100.
096
.88.
918
4
6-11
10.8
0.7
2.5
0.0
0.0
86.0
100.
089
.231
.515
5
12-1
725
.11.
10.
00.
00.
073
.810
0.0
74.9
22.6
177
18-2
364
.20.
00.
00.
00.
035
.810
0.0
35.8
24.7
198
12-1
525
.01.
50.
00.
00.
073
.510
0.0
75.0
21.9
137
12-2
345
.80.
50.
00.
00.
053
.710
0.0
54.2
23.7
375
20-2
371
.20.
00.
00.
00.
028
.810
0.0
28.8
22.7
141

139CAMBODIAPost-Flood Relief and Recovery Survey 2012
tables anD fIGURes
table 66. assistance Received since floods
Percent distribution of households by reported types of assistance received since september 2011, by ecological
zone (weighted). cambodia Post-flood Relief and Recovery survey, January 2012.
ecological ZoneTotal
Plains Tonle Sap
types of assistance
food for school children 1.7 2.6 2.1
food for malnourished/PlW 0.7 0.4 0.6
free food ration 39.3 37.6 38.7
Water treatment kits 9.8 12.4 10.8
free animal feed 0.2 0.1 0.2
free veterinary services 0.8 0.5 0.7
free health care 3.4 4.4 3.7
free agricultural tools 0.4 0.5 0.5
free seeds/fertilizer 2.7 1.3 2.2
Infant formula 0.2 0.0 0.1
food-for-work 1.0 0.0 0.6
cash-for-work 1.1 2.8 1.7
cash transfers 5.6 5.8 5.7
Plastic sheeting/tents 3.8 5.7 4.5
cooking utensils (nfIs) 9.7 11.8 10.5
clothes/blankets 23.3 22.3 23.0
Mosquito nets 19.4 20.2 19.7
Micro-credit 2.6 1.4 2.2
number 1,523 873 2,396
table 69. total expenditure by loan status (zone)
Proportion of total monthly household cash expenditures by loan status (month: mid-Dec to mid/end-Jan). cambodia
Post-flood Relief and Recovery survey, January 2012.
ecological Zone
Plains Tonle Sap
No loan Loan R1 No loan Loan R1
food 51.3 40.5 -0.21 45.8 37.8 -0.17
ceremonies 14.2 8.9 -0.37 18.2 13.2 -0.27
Medical 7.5 9.7 0.29 9.1 8.4 -0.08
agriculture inputs 4.9 9.6 0.96 1.8 6.5 2.61
education 5.5 4.8 -0.13 6.0 5.2 -0.13
transport 5.0 4.4 -0.12 5.6 5.1 -0.09
clothing 2.2 1.7 -0.23 3.0 2.4 -0.20
energy 2.5 1.7 -0.32 2.7 2.0 -0.26
communication 1.9 1.2 -0.37 1.9 1.3 -0.32
Hygiene 1.4 1.2 -0.14 1.6 1.5 -0.06
Housing 0.7 0.9 0.29 0.9 2.0 1.22
firewood 0.9 0.7 -0.22 1.0 0.8 -0.20
1 R = 1 - (loan/no loan).
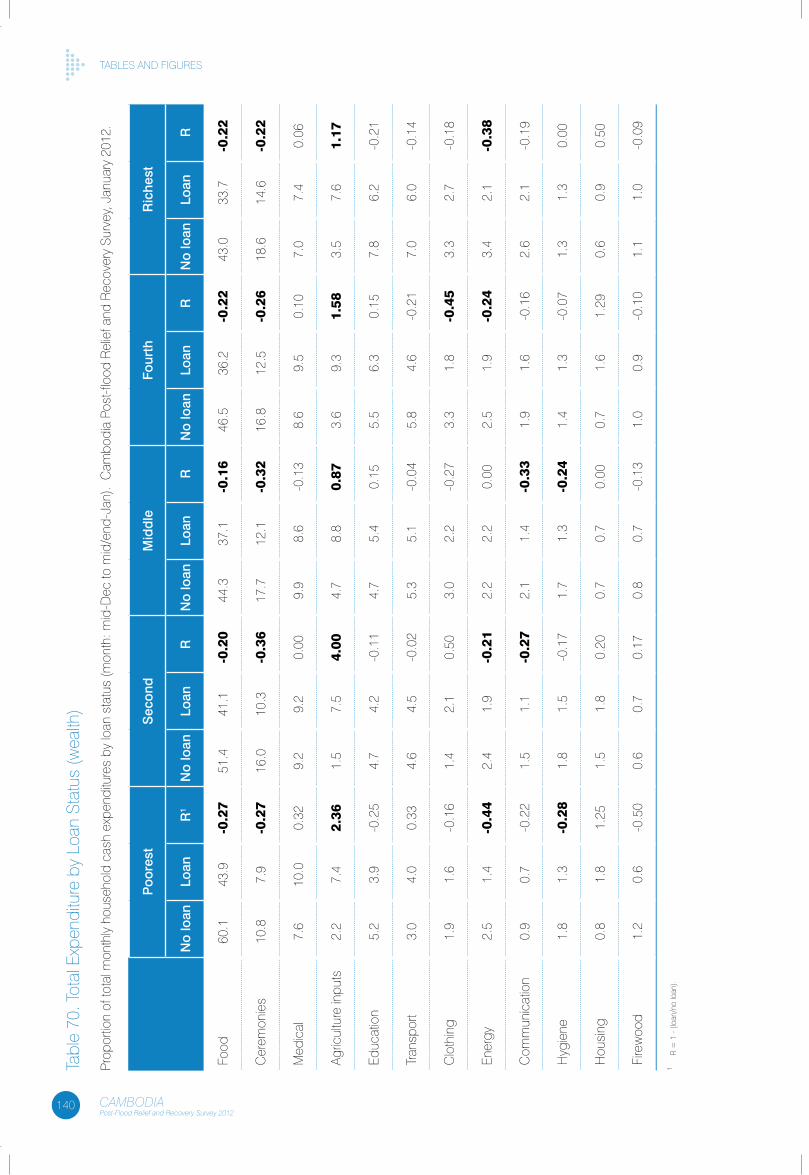
140 CAMBODIAPost-Flood Relief and Recovery Survey 2012
tables anD fIGUResta
ble
70. t
otal
exp
endi
ture
by
loan
sta
tus
(wea
lth)
Prop
ortio
n of
tota
l mon
thly
hou
seho
ld c
ash
expe
nditu
res
by lo
an s
tatu
s (m
onth
: mid
-Dec
to m
id/e
nd-J
an).
cam
bodi
a Po
st-fl
ood
Rel
ief a
nd R
ecov
ery
surv
ey, J
anua
ry 2
012.
Poo
rest
Sec
ond
Mid
dle
Four
thR
iche
st
No
loan
Loan
R1
No
loan
Loan
RN
o lo
anLo
anR
No
loan
Loan
RN
o lo
anLo
anR
food
60.1
43.9
-0.2
751
.441
.1-0
.20
44.3
37.1
-0.1
646
.536
.2-0
.22
43.0
33.7
-0.2
2
cer
emon
ies
10.8
7.9
-0.2
716
.010
.3-0
.36
17.7
12.1
-0.3
216
.812
.5-0
.26
18.6
14.6
-0.2
2
Med
ical
7.6
10.0
0.32
9.2
9.2
0.00
9.9
8.6
-0.1
38.
69.
50.
107.
07.
40.
06
agric
ultu
re in
puts
2.2
7.4
2.36
1.5
7.5
4.00
4.7
8.8
0.87
3.6
9.3
1.58
3.5
7.6
1.17
educ
atio
n5.
23.
9-0
.25
4.7
4.2
-0.1
14.
75.
40.
155.
56.
30.
157.
86.
2-0
.21
tran
spor
t3.
04.
00.
334.
64.
5-0
.02
5.3
5.1
-0.0
45.
84.
6-0
.21
7.0
6.0
-0.1
4
clo
thin
g1.
91.
6-0
.16
1.4
2.1
0.50
3.0
2.2
-0.2
73.
31.
8-0
.45
3.3
2.7
-0.1
8
ener
gy2.
51.
4-0
.44
2.4
1.9
-0.2
12.
22.
20.
002.
51.
9-0
.24
3.4
2.1
-0.3
8
com
mun
icat
ion
0.9
0.7
-0.2
21.
51.
1-0
.27
2.1
1.4
-0.3
31.
91.
6-0
.16
2.6
2.1
-0.1
9
Hyg
iene
1.8
1.3
-0.2
81.
81.
5-0
.17
1.7
1.3
-0.2
41.
41.
3-0
.07
1.3
1.3
0.00
Hou
sing
0.8
1.8
1.25
1.5
1.8
0.20
0.7
0.7
0.00
0.7
1.6
1.29
0.6
0.9
0.50
fire
woo
d1.
20.
6-0
.50
0.6
0.7
0.17
0.8
0.7
-0.1
31.
00.
9-0
.10
1.1
1.0
-0.0
9
1 R
= 1
- (l
oan/
no lo
an).
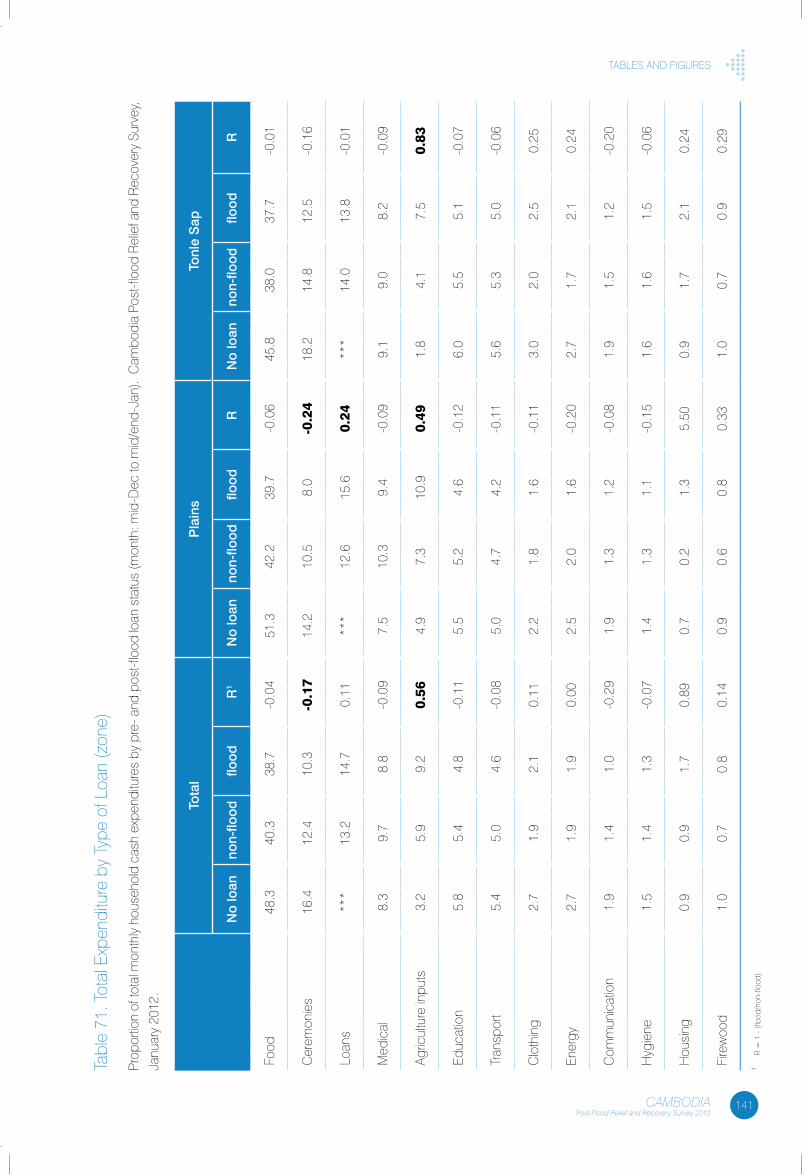
141CAMBODIAPost-Flood Relief and Recovery Survey 2012
tables anD fIGURes
tabl
e 71
. tot
al e
xpen
ditu
re b
y ty
pe o
f loa
n (z
one)
Prop
ortio
n of
tota
l mon
thly
hou
seho
ld c
ash
expe
nditu
res
by p
re- a
nd p
ost-f
lood
loan
sta
tus
(mon
th: m
id-D
ec to
mid
/end
-Jan
). c
ambo
dia
Post
-floo
d R
elie
f and
Rec
over
y su
rvey
,
Janu
ary
2012
.
Tota
lP
lain
sTo
nle
Sap
No
loan
non-
flood
flood
R1
No
loan
non-
flood
flood
RN
o lo
anno
n-flo
odflo
odR
food
48.3
40.3
38.7
-0.0
451
.342
.239
.7-0
.06
45.8
38.0
37.7
-0.0
1
cer
emon
ies
16.4
12.4
10.3
-0.1
714
.210
.58.
0-0
.24
18.2
14.8
12.5
-0.1
6
loan
s**
*13
.214
.70.
11**
*12
.615
.60.
24**
*14
.013
.8-0
.01
Med
ical
8.3
9.7
8.8
-0.0
97.
510
.39.
4-0
.09
9.1
9.0
8.2
-0.0
9
agric
ultu
re in
puts
3.2
5.9
9.2
0.56
4.9
7.3
10.9
0.49
1.8
4.1
7.5
0.83
educ
atio
n5.
85.
44.
8-0
.11
5.5
5.2
4.6
-0.1
26.
05.
55.
1-0
.07
tran
spor
t5.
45.
04.
6-0
.08
5.0
4.7
4.2
-0.1
15.
65.
35.
0-0
.06
clo
thin
g2.
71.
92.
10.
112.
21.
81.
6-0
.11
3.0
2.0
2.5
0.25
ener
gy2.
71.
91.
90.
002.
52.
01.
6-0
.20
2.7
1.7
2.1
0.24
com
mun
icat
ion
1.9
1.4
1.0
-0.2
91.
91.
31.
2-0
.08
1.9
1.5
1.2
-0.2
0
Hyg
iene
1.5
1.4
1.3
-0.0
71.
41.
31.
1-0
.15
1.6
1.6
1.5
-0.0
6
Hou
sing
0.9
0.9
1.7
0.89
0.7
0.2
1.3
5.50
0.9
1.7
2.1
0.24
fire
woo
d1.
00.
70.
80.
140.
90.
60.
80.
331.
00.
70.
90.
29
1 R
= 1
- (f
lood
/non
-floo
d).
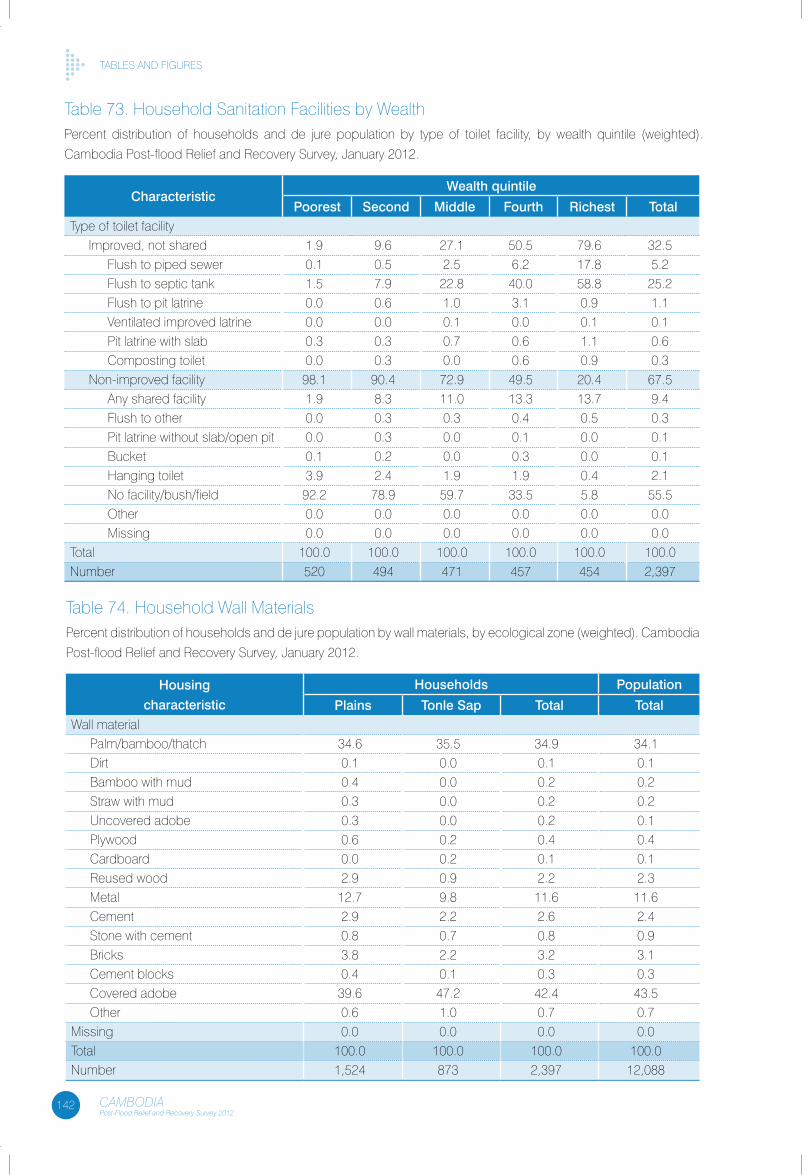
142 CAMBODIAPost-Flood Relief and Recovery Survey 2012
tables anD fIGURes
table 73. Household sanitation facilities by WealthPercent distribution of households and de jure population by type of toilet facility, by wealth quintile (weighted).
cambodia Post-flood Relief and Recovery survey, January 2012.
CharacteristicWealth quintile
Poorest Second Middle Fourth Richest Totaltype of toilet facility
Improved, not shared 1.9 9.6 27.1 50.5 79.6 32.5flush to piped sewer 0.1 0.5 2.5 6.2 17.8 5.2flush to septic tank 1.5 7.9 22.8 40.0 58.8 25.2flush to pit latrine 0.0 0.6 1.0 3.1 0.9 1.1Ventilated improved latrine 0.0 0.0 0.1 0.0 0.1 0.1Pit latrine with slab 0.3 0.3 0.7 0.6 1.1 0.6composting toilet 0.0 0.3 0.0 0.6 0.9 0.3
non-improved facility 98.1 90.4 72.9 49.5 20.4 67.5any shared facility 1.9 8.3 11.0 13.3 13.7 9.4flush to other 0.0 0.3 0.3 0.4 0.5 0.3Pit latrine without slab/open pit 0.0 0.3 0.0 0.1 0.0 0.1bucket 0.1 0.2 0.0 0.3 0.0 0.1Hanging toilet 3.9 2.4 1.9 1.9 0.4 2.1no facility/bush/field 92.2 78.9 59.7 33.5 5.8 55.5other 0.0 0.0 0.0 0.0 0.0 0.0Missing 0.0 0.0 0.0 0.0 0.0 0.0
total 100.0 100.0 100.0 100.0 100.0 100.0number 520 494 471 457 454 2,397
table 74. Household Wall MaterialsPercent distribution of households and de jure population by wall materials, by ecological zone (weighted). cambodia
Post-flood Relief and Recovery survey, January 2012.
Housing
characteristic
Households Population
Plains Tonle Sap Total TotalWall material
Palm/bamboo/thatch 34.6 35.5 34.9 34.1Dirt 0.1 0.0 0.1 0.1bamboo with mud 0.4 0.0 0.2 0.2straw with mud 0.3 0.0 0.2 0.2Uncovered adobe 0.3 0.0 0.2 0.1Plywood 0.6 0.2 0.4 0.4cardboard 0.0 0.2 0.1 0.1Reused wood 2.9 0.9 2.2 2.3Metal 12.7 9.8 11.6 11.6cement 2.9 2.2 2.6 2.4stone with cement 0.8 0.7 0.8 0.9bricks 3.8 2.2 3.2 3.1cement blocks 0.4 0.1 0.3 0.3covered adobe 39.6 47.2 42.4 43.5other 0.6 1.0 0.7 0.7
Missing 0.0 0.0 0.0 0.0total 100.0 100.0 100.0 100.0number 1,524 873 2,397 12,088
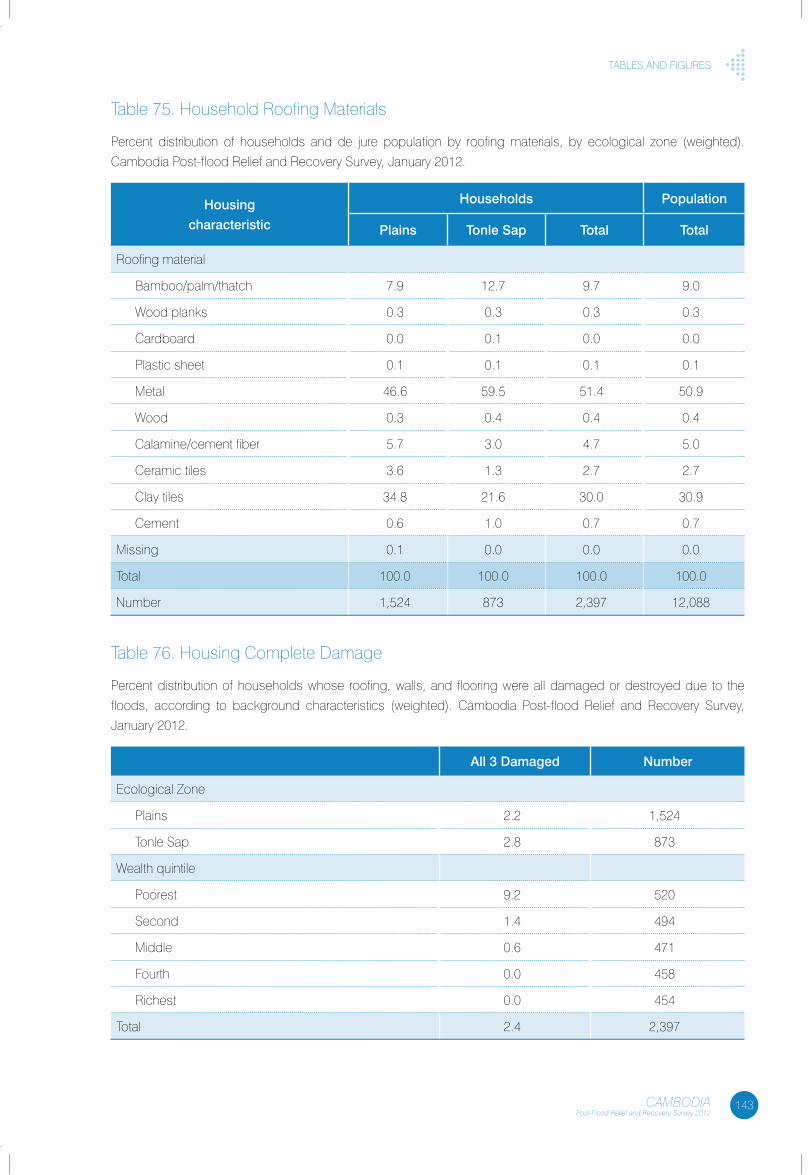
143CAMBODIAPost-Flood Relief and Recovery Survey 2012
tables anD fIGURes
table 75. Household Roofing Materials
Percent distribution of households and de jure population by roofing materials, by ecological zone (weighted).
cambodia Post-flood Relief and Recovery survey, January 2012.
Housing
characteristic
Households Population
Plains Tonle Sap Total Total
Roofing material
bamboo/palm/thatch 7.9 12.7 9.7 9.0
Wood planks 0.3 0.3 0.3 0.3
cardboard 0.0 0.1 0.0 0.0
Plastic sheet 0.1 0.1 0.1 0.1
Metal 46.6 59.5 51.4 50.9
Wood 0.3 0.4 0.4 0.4
calamine/cement fiber 5.7 3.0 4.7 5.0
ceramic tiles 3.6 1.3 2.7 2.7
clay tiles 34.8 21.6 30.0 30.9
cement 0.6 1.0 0.7 0.7
Missing 0.1 0.0 0.0 0.0
total 100.0 100.0 100.0 100.0
number 1,524 873 2,397 12,088
table 76. Housing complete Damage
Percent distribution of households whose roofing, walls, and flooring were all damaged or destroyed due to the
floods, according to background characteristics (weighted). cambodia Post-flood Relief and Recovery survey,
January 2012.
all 3 Damaged Number
ecological Zone
Plains 2.2 1,524
tonle sap 2.8 873
Wealth quintile
Poorest 9.2 520
second 1.4 494
Middle 0.6 471
fourth 0.0 458
Richest 0.0 454
total 2.4 2,397
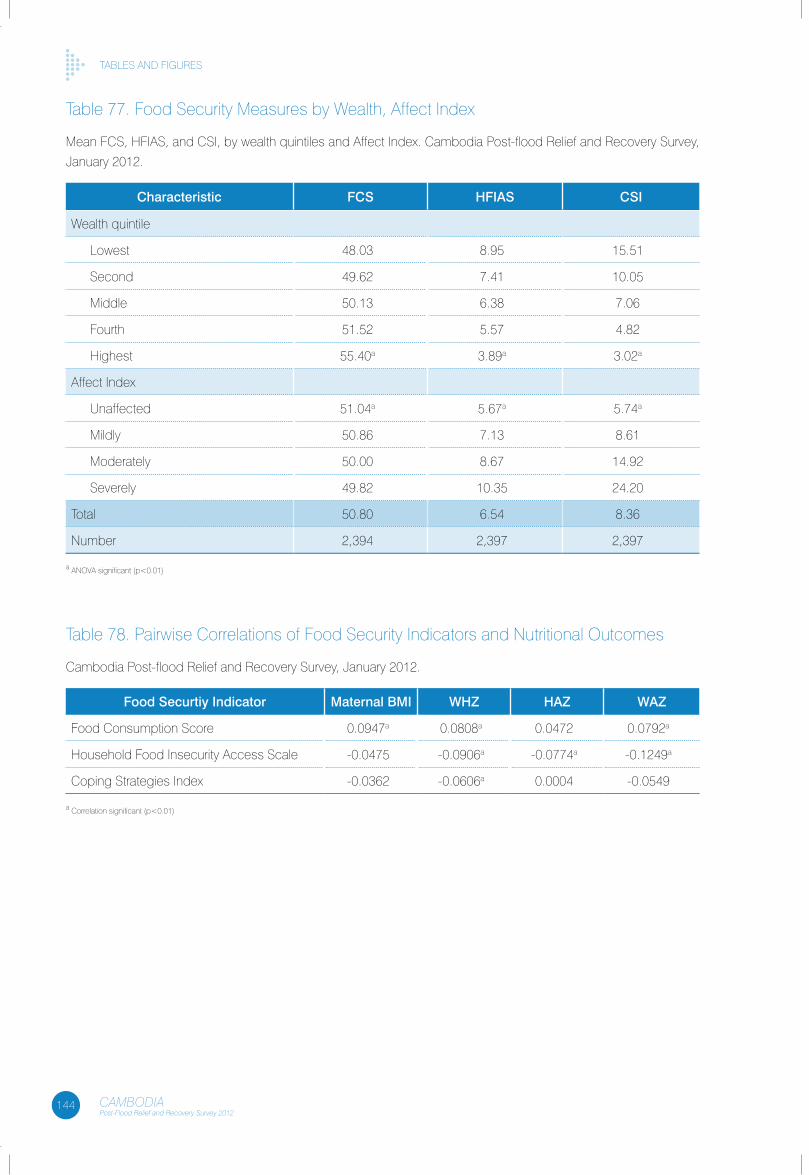
144 CAMBODIAPost-Flood Relief and Recovery Survey 2012
tables anD fIGURes
table 77. food security Measures by Wealth, affect Index
Mean fcs, HfIas, and csI, by wealth quintiles and affect Index. cambodia Post-flood Relief and Recovery survey,
January 2012.
Characteristic FCS HFIaS CSI
Wealth quintile
lowest 48.03 8.95 15.51
second 49.62 7.41 10.05
Middle 50.13 6.38 7.06
fourth 51.52 5.57 4.82
Highest 55.40a 3.89a 3.02a
affect Index
Unaffected 51.04a 5.67a 5.74a
Mildly 50.86 7.13 8.61
Moderately 50.00 8.67 14.92
severely 49.82 10.35 24.20
total 50.80 6.54 8.36
number 2,394 2,397 2,397
a anoVa significant (p<0.01)
table 78. Pairwise correlations of food security Indicators and nutritional outcomes
cambodia Post-flood Relief and Recovery survey, January 2012.
Food Securtiy Indicator Maternal BMI WHZ HaZ WaZ
food consumption score 0.0947a 0.0808a 0.0472 0.0792a
Household food Insecurity access scale -0.0475 -0.0906a -0.0774a -0.1249a
coping strategies Index -0.0362 -0.0606a 0.0004 -0.0549
a correlation significant (p<0.01)
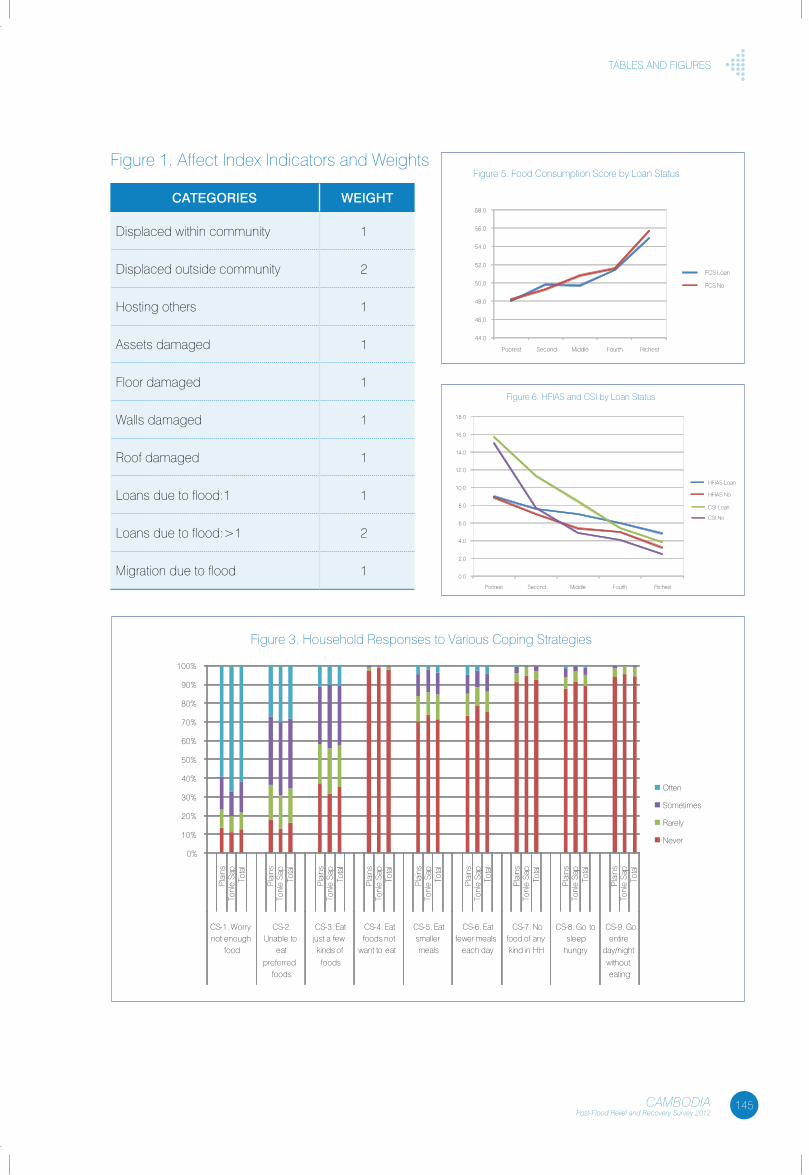
145CAMBODIAPost-Flood Relief and Recovery Survey 2012
tables anD fIGURes
Figure 3. Household Responses to Various Coping Strategies
0%
10%
20%
30%
40%
50%
60%
70%
80%
90%
100%
Tonl
e Sa
pPl
ains
Tota
l
Tonl
e Sa
pPl
ains
Tota
l
Tonl
e Sa
pPl
ains
Tota
l
Tonl
e Sa
pPl
ains
Tota
l
Tonl
e Sa
pPl
ains
Tota
l
Tonl
e Sa
pPl
ains
Tota
l
Tonl
e Sa
pPl
ains
Tota
l
Tonl
e Sa
pPl
ains
Tota
l
Tonl
e Sa
pPl
ains
Tota
l
CS-1. Worry not enough
food
CS-2. Unable to
eat
preferred foods
CS-3. Eat just a few kinds of
foods
CS-4. Eat foods not
want to eat
CS-5. Eat smaller meals
CS-6. Eat fewer meals
each day
CS-7. No food of any kind in HH
CS-8. Go to sleep
hungry
CS-9. Go entire
day/night
without eating
Often
Sometimes
Rarely
Never
0.0
2.0
4.0
6.0
8.0
10.0
12.0
14.0
16.0
18.0
Poorest Second Middle Fourth Richest
HFIAS Loan
HFIAS No
CSI Loan
CSI No
Figure 6. HFIAS and CSI by Loan Status
44.0
46.0
48.0
50.0
52.0
54.0
56.0
58.0
Poorest Second Middle Fourth Richest
FCS Loan
FCS No
Figure 5. Food Consumption Score by Loan Status
CaTegORIeS WeIgHT
Displaced within community 1
Displaced outside community 2
Hosting others 1
assets damaged 1
floor damaged 1
Walls damaged 1
Roof damaged 1
loans due to flood:1 1
loans due to flood:>1 2
Migration due to flood 1
figure 1. affect Index Indicators and Weights
Action Aid/Savann Oeurm/2011.Action Aid/Savann Oeurm/2011.Action Aid/Savann Oeurm/2011.Action Aid/Savann Oeurm/2011.
Designed by Graphic Roots: www.graphicroots.com.kh
Action Aid/Savann Oeurm/2011.Action Aid/Savann Oeurm/2011.
Photo back cover by: UNICEF Cambodia/Nicholas Axelrod/2011Photo front cover by: Action Aid/Savann Oeurm/2011.