cambridge international examinations cambridge ordinary level levels/biology...
TRANSCRIPT

This document consists of 11 printed pages and 1 blank page.
DC (LK) 143041© UCLES 2017 [Turn over
*2221977370*
BIOLOGY 5090/31Paper 3 Practical Test May/June 2017 1 hour 15 minutesCandidates answer on the Question Paper.Additional Materials: As specified in the Confidential Instructions.
READ THESE INSTRUCTIONS FIRST
Write your Centre number, candidate number and name on all the work you hand in.Write in dark blue or black pen.You may use an HB pencil for any diagrams or graphs.Do not use staples, paper clips, glue or correction fluid.DO NOT WRITE IN ANY BARCODES.
Answer all questions.Write your answers in the spaces provided on the Question Paper.
Electronic calculators may be used.You may lose marks if you do not show your working or if you do not use appropriate units.
At the end of the examination, fasten all your work securely together.The number of marks is given in brackets [ ] at the end of each question or part question.
Cambridge International ExaminationsCambridge Ordinary Level
For Examiner’s Use
1
2
3
Total

2
5090/31/M/J/17© UCLES 2017
In order to plan the best use of your time, read through all the questions on this paper carefully before starting work.
1 (a) You are going to carry out an experiment to investigate the effect of two different concentrations of sucrose solution on potato tissue.
You are provided with some potato tissue and two solutions of sucrose, labelled S1 and S2.
• Label one Petri dish S1 and the other Petri dish S2.
• Carefully cut two strips of potato tissue without skin, each measuring 80 mm × 4 mm × 4 mm.
• Place one strip into each Petri dish.
• Pour solution S1 into the dish labelled S1. Pour solution S2 into the dish labelled S2. Make sure that the strips are completely covered by the solutions.
• Leave the strips for 20 minutes. Continue with question 1(b) while you are waiting.
• After 20 minutes, remove the strip from solution S1 and carefully blot it dry.
• Insert a pin near the end of the strip from solution S1 and then attach it to the apparatus as shown in Fig. 1.1. Make sure that this end of the strip is level with the edge of the cork.
bench surface
graph paper
strip ofpotato tissue
cork
pin
specimentube filledwith water
Fig. 1.1
• Record the position of the unpinned end of the strip on the graph paper, and label it S1.
• Repeat this procedure for the strip in solution S2.
3
5090/31/M/J/17© UCLES 2017 [Turn over
(i) Carefully copy your results onto Fig. 1.2. Use a small X to show the position of the unpinned end for each strip. Label your results S1 and S2.
Fig. 1.2 [3]
(ii) Complete Table 1.1 by describing how flexible the strips are, that had been in solution S1 and in solution S2.
Table 1.1
strip covered in solution description of strip
S1
S2
[2]

4
5090/31/M/J/17© UCLES 2017
(iii) State two variables which were controlled in this experiment to ensure that the results for S1 and S2 are comparable.
1 ........................................................................................................................................
2 ........................................................................................................................................[2]
(iv) Suggest an explanation for your results.
...........................................................................................................................................
...........................................................................................................................................
...........................................................................................................................................
...........................................................................................................................................
...........................................................................................................................................
...........................................................................................................................................
.......................................................................................................................................[4]
(b) When plant cells lose water, the cytoplasm may shrink and move away from the cell wall. When this happens, the cells are plasmolysed.
Fig. 1.3 represents a group of plant cells, some of which are plasmolysed.
key
plasmolysed cell
non-plasmolysed cell
Fig. 1.3
5
5090/31/M/J/17© UCLES 2017 [Turn over
(i) Complete Table 1.2 by counting the number of plasmolysed cells and the number of non‑plasmolysed cells.
Table 1.2
number of plasmolysed cells
number of non‑plasmolysed cells
[1]
(ii) Calculate the number of plasmolysed cells as a percentage of the total number of cells.
Show your working.
.............................................................% [2]

6
5090/31/M/J/17© UCLES 2017
(c) A student carried out an investigation into the relationship between the concentration of sucrose solution and the number of plant cells which were plasmolysed.
She placed small pieces of plant tissue in sucrose solutions and counted the number of cells that were plasmolysed. She then calculated the percentage of cells that were plasmolysed in each solution.
Her results are shown in Table 1.3.
Table 1.3
concentration of sucrose solution / mol per dm3
percentage of cells that were plasmolysed
0.0 0
0.2 5
0.4 18
0.6 75
0.8 100

7
5090/31/M/J/17© UCLES 2017 [Turn over
(i) Plot a line graph of the results in Table 1.3. Join the points on your graph with ruled, straight lines.
[4]
(ii) Use your graph to find the concentration of sucrose solution in which 50% of the cells would be plasmolysed. On your graph, show how you obtained this value.
Concentration of sucrose solution in which 50% of the cells would be plasmolysed:
............................................................[2]
[Total: 20]
8
5090/31/M/J/17© UCLES 2017
Question 2 begins on page 9
9
5090/31/M/J/17© UCLES 2017 [Turn over
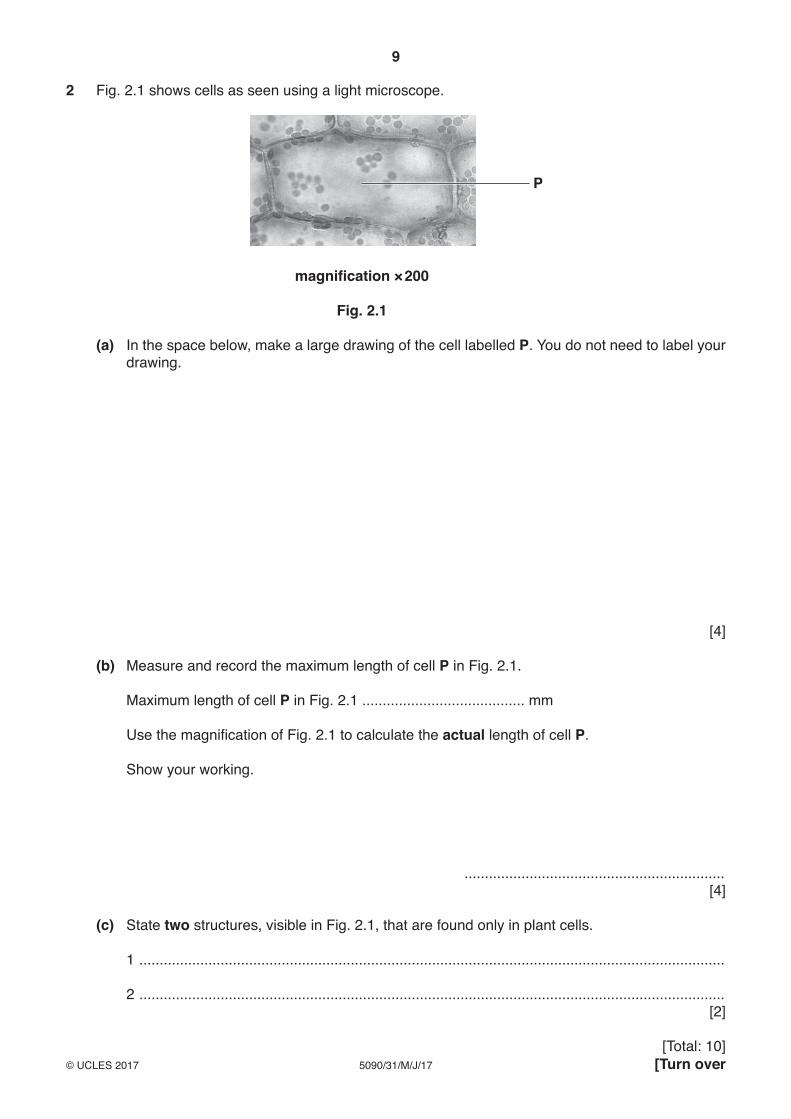
2 Fig. 2.1 shows cells as seen using a light microscope.
P
magnification × 200
Fig. 2.1
(a) In the space below, make a large drawing of the cell labelled P. You do not need to label your drawing.
[4]
(b) Measure and record the maximum length of cell P in Fig. 2.1.
Maximum length of cell P in Fig. 2.1 ........................................ mm
Use the magnification of Fig. 2.1 to calculate the actual length of cell P.
Show your working.
................................................................ [4]
(c) State two structures, visible in Fig. 2.1, that are found only in plant cells.
1 ................................................................................................................................................
2 ................................................................................................................................................[2]
[Total: 10]
10
5090/31/M/J/17© UCLES 2017
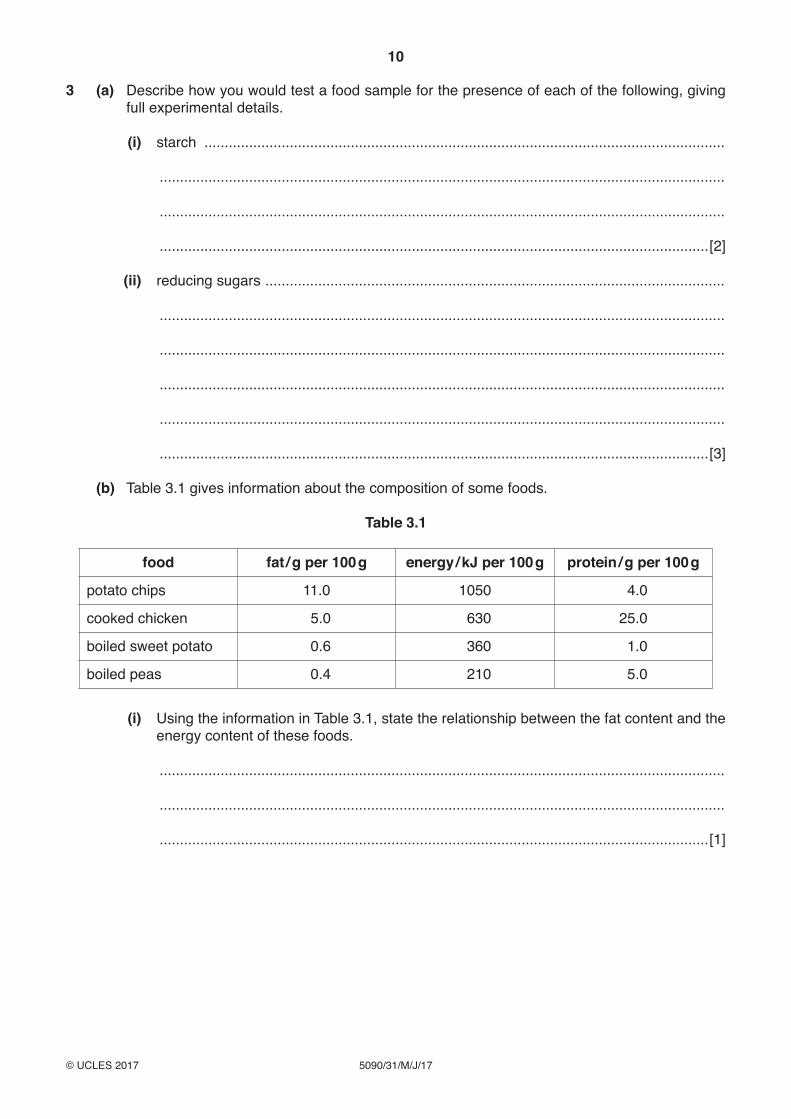
3 (a) Describe how you would test a food sample for the presence of each of the following, giving full experimental details.
(i) starch ................................................................................................................................
...........................................................................................................................................
...........................................................................................................................................
.......................................................................................................................................[2]
(ii) reducing sugars .................................................................................................................
...........................................................................................................................................
...........................................................................................................................................
...........................................................................................................................................
...........................................................................................................................................
.......................................................................................................................................[3]
(b) Table 3.1 gives information about the composition of some foods.
Table 3.1
food fat / g per 100 g energy / kJ per 100 g protein / g per 100 g
potato chips 11.0 1050 4.0
cooked chicken 5.0 630 25.0
boiled sweet potato 0.6 360 1.0
boiled peas 0.4 210 5.0
(i) Using the information in Table 3.1, state the relationship between the fat content and the energy content of these foods.
...........................................................................................................................................
...........................................................................................................................................
.......................................................................................................................................[1]
11
5090/31/M/J/17© UCLES 2017
(ii) Calculate the protein content of 250 g of cooked chicken.
Show your working.
..............................................................g [2]
(iii) Calculate the mass of boiled peas that you would need to eat to obtain the same mass of protein as in 100 g of cooked chicken.
Show your working.
..............................................................g [2]
[Total: 10]

12
5090/31/M/J/17© UCLES 2017
Permission to reproduce items where third‑party owned material protected by copyright is included has been sought and cleared where possible. Every reasonable effort has been made by the publisher (UCLES) to trace copyright holders, but if any items requiring clearance have unwittingly been included, the publisher will be pleased to make amends at the earliest possible opportunity.
To avoid the issue of disclosure of answer‑related information to candidates, all copyright acknowledgements are reproduced online in the Cambridge International Examinations Copyright Acknowledgements Booklet. This is produced for each series of examinations and is freely available to download at www.cie.org.uk after the live examination series.
Cambridge International Examinations is part of the Cambridge Assessment Group. Cambridge Assessment is the brand name of University of Cambridge Local Examinations Syndicate (UCLES), which is itself a department of the University of Cambridge.
BLANK PAGE