cambridge university press excerpt more information
TRANSCRIPT
Cambridge University Press978-1-107-61306-5 – Mathematics for the IB Diploma Standard LevelPaul Fannon Vesna Kadelburg Ben Woolley and Stephen WardExcerptMore information
© in this web service Cambridge University Press www.cambridge.org
1 Quadratic functions 1
1
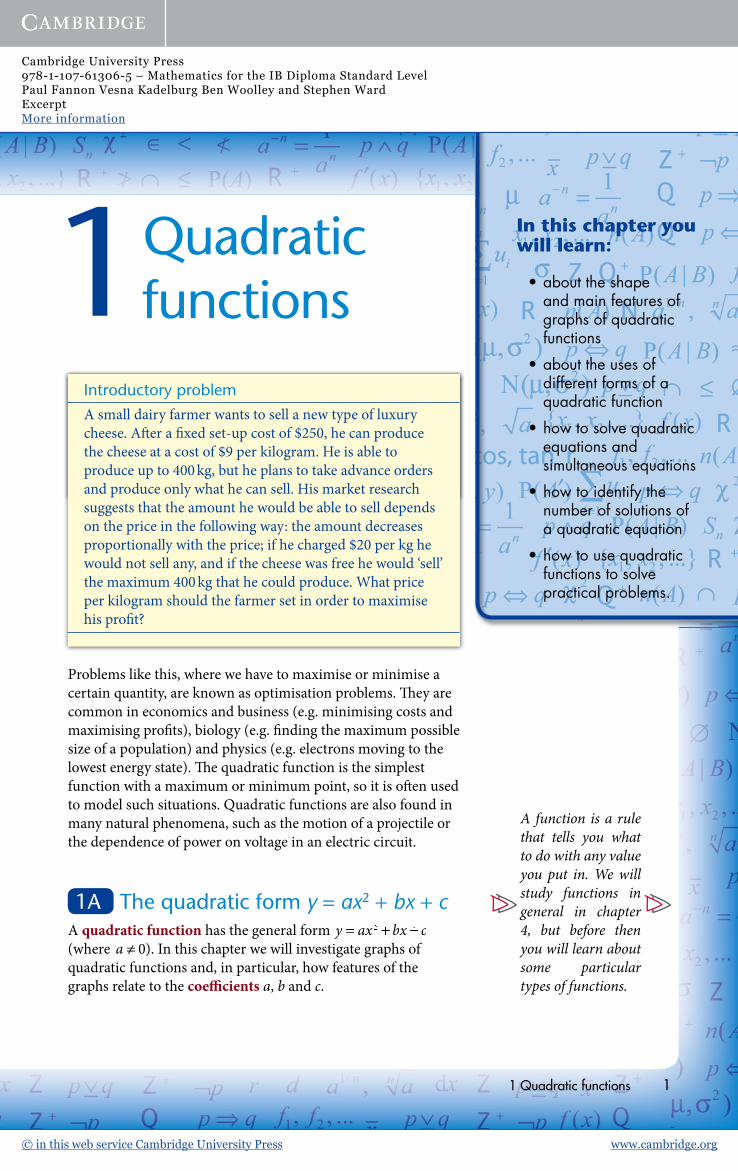
Problems like this, where we have to maximise or minimise a certain quantity, are known as optimisation problems. Th ey are common in economics and business (e.g. minimising costs and maximising profi ts), biology (e.g. fi nding the maximum possible size of a population) and physics (e.g. electrons moving to the lowest energy state). Th e quadratic function is the simplest function with a maximum or minimum point, so it is oft en used to model such situations. Quadratic functions are also found in many natural phenomena, such as the motion of a projectile or the dependence of power on voltage in an electric circuit.
1A The quadratic form y = ax2 + bx + cA quadratic function has the general form y ax bx c= ax + (where a ≠ 0). In this chapter we will investigate graphs of quadratic functions and, in particular, how features of the graphs relate to the coeffi cients a, b and c.
A function is a rule that tells you what to do with any value you put in. We will study functions in general in chapter 4, but before then you will learn about some particular types of functions.
Quadratic functions
Introductory problem
A small dairy farmer wants to sell a new type of luxury cheese. Aft er a fi xed set-up cost of $250, he can produce the cheese at a cost of $9 per kilogram. He is able to produce up to 400 kg, but he plans to take advance orders and produce only what he can sell. His market research suggests that the amount he would be able to sell depends on the price in the following way: the amount decreases proportionally with the price; if he charged $20 per kg he would not sell any, and if the cheese was free he would ‘sell’ the maximum 400 kg that he could produce. What price per kilogram should the farmer set in order to maximise his profi t?
In this chapter you will learn:
about the shape • and main features of graphs of quadratic functions
about the uses of • different forms of a quadratic function
how to solve quadratic • equations and simultaneous equations
how to identify the • number of solutions of a quadratic equation
how to use quadratic • functions to solve practical problems.

Cambridge University Press978-1-107-61306-5 – Mathematics for the IB Diploma Standard LevelPaul Fannon Vesna Kadelburg Ben Woolley and Stephen WardExcerptMore information
© in this web service Cambridge University Press www.cambridge.org
2 Topic 2: Functions and equations
Let us look at two examples of quadratic functions:
y x x22 2x2 4x2 − and y x2 4 3x+ 4x x ∈( )R
See Calculator Skills sheets 2 and 4 on the CD-ROM for how to sketch and analyse graphs on a graphic display calculator.
exam hint
You can use your calculator to plot the two graphs:
y
x
y1 = 2x2 − 2x − 4
y
x
y2 = −x2 + 4x − 3
Th ese two graphs have a similar shape, called a parabola. A parabola has a single turning point (called its vertex) and a vertical line of symmetry passing through the vertex. Th e most obvious diff erence between the two graphs above is that the fi rst one has a minimum point whereas the second has a maximum point. Th is is due to the diff erent signs of the x2 term in y1 and in y2.
You can use your calculator to fi nd the position of the vertex of a parabola. For the graphs above you should fi nd that the coordinates of the vertices are (0.5, −4.5 ) and (2, 1); the lines of symmetry therefore have equations x = 0.5 and x = 2.
KEY POINT 1.1KEY POINT 1.1
For a quadratic function f(x) = ax2 + bx + c:If a > 0, f(x) is a positive quadratic. Th e graph has a minimum point and goes up on both sides.If a < 0, f(x) is a negative quadratic. Th e graph has a maximum point and goes down on both sides.
The word ‘quadratic’ indicates that the term with the highest power in the equation is x 2. It comes from the Latin quadratus, meaning ‘square’.
Line ofSymmetry
Vertex
x ∈R means that x can be any real number.See Prior Learning section G on the CD-ROM for the meaning of such statements.
Cambridge University Press978-1-107-61306-5 – Mathematics for the IB Diploma Standard LevelPaul Fannon Vesna Kadelburg Ben Woolley and Stephen WardExcerptMore information
© in this web service Cambridge University Press www.cambridge.org
1 Quadratic functions 3
Th e constant coeffi cient (denoted by c here) gives the position of the y-intercept of the graph, that is, where the curve crosses the y-axis.
Worked example 1.1
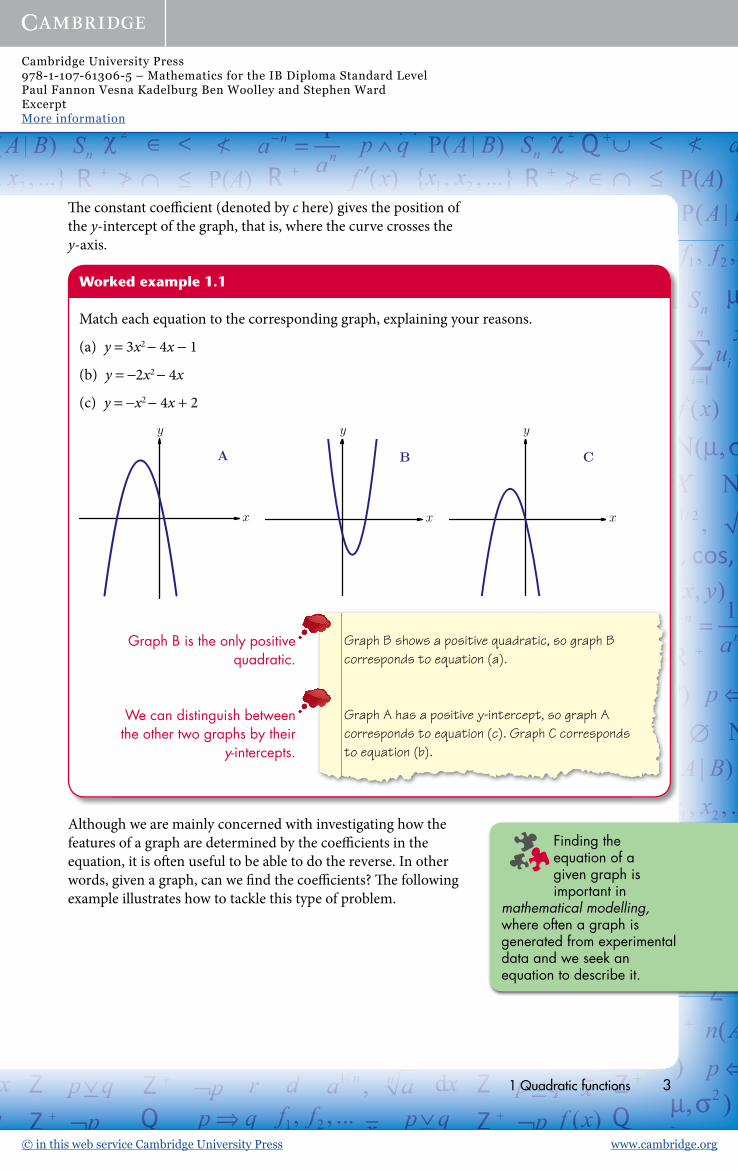
Match each equation to the corresponding graph, explaining your reasons.
(a) y = 3x2 − 4x − 1
(b) y = −2x2 − 4x
(c) y = −x2 − 4x + 2
y
x
A
y
x
B
y
x
C
Graph B is the only positive quadratic.
Graph B shows a positive quadratic, so graph B corresponds to equation (a).
We can distinguish between the other two graphs by their
y-intercepts.
Graph A has a positive y-intercept, so graph A corresponds to equation (c). Graph C corresponds to equation (b).
Although we are mainly concerned with investigating how the features of a graph are determined by the coeffi cients in the equation, it is oft en useful to be able to do the reverse. In other words, given a graph, can we fi nd the coeffi cients? Th e following example illustrates how to tackle this type of problem.
Finding the equation of a given graph is important in
mathematical modelling, where often a graph is generated from experimental data and we seek an equation to describe it.

Cambridge University Press978-1-107-61306-5 – Mathematics for the IB Diploma Standard LevelPaul Fannon Vesna Kadelburg Ben Woolley and Stephen WardExcerptMore information
© in this web service Cambridge University Press www.cambridge.org
4 Topic 2: Functions and equations
Worked example 1.2
Th e graph shown below has the equation y = ax2 − 6x + c.
y
x
(0, 2)
(1, −1)
Find the values of c and a.
c is the y-intercept. The y-intercept of the graph is (0, 2), so c = 2
The coordinates of the vertex need to satisfy the equation of
the graph.
The vertex is at x = 1 and y = −1, so
−1 = a(1)2 − 6(1) + 2−1 = a − 4 a = 3
Th e shape of the graph and the position of the y-intercept are the only two features we can read directly from the quadratic equation. We may also be interested in other properties, such as
• the position of the line of symmetry
• the coordinates of the vertex
• the x-intercepts.
In the next two sections we will see how rewriting the equation of the graph in diff erent forms allows us to identify these features. In some of the questions below you will need to fi nd them using your calculator.

Cambridge University Press978-1-107-61306-5 – Mathematics for the IB Diploma Standard LevelPaul Fannon Vesna Kadelburg Ben Woolley and Stephen WardExcerptMore information
© in this web service Cambridge University Press www.cambridge.org
1 Quadratic functions 5
Exercise 1A1. Match the equations to their corresponding graphs.
(i) A: y x −2 3 6x +x B: y x x +2 3x −x 32 C: y x −x2 3 6x +y
x
6
1
y
x
6
2
y
x
3
3
(ii) A: y x +2 2 3x −x B: y x +2 2 3x +x C: y x= +x2 2 3x +y
x
3
1y
x
3
2
y
x
−3
3
2. Write the following quadratic expressions in the form ax bx c2 + +bx .
(a) (i) 2 1x 1( )( )5x + (ii) 5 1x 1( )( )3x − (b) (i) − ( )4 2+(x )2+ ( )4 x−4 (ii) −( )1− )x))( )2 x−2 (c) (i) 3 1 32( ) + (ii) 4 2 52x( ) − (d) (i) − ( ) −4 1−( 12x (ii) −2 2 32x( ) −
3. Find the y-intercept of the graph of each equation. (a) (i) y x(( )1x −x2( ( )x + 3 (ii) y x(( )1x +x3( ( )x −1 (b) (i) y x3x( )2x − (ii) y x5x( )1x − (c) (i) y x −( )1)( )x 2x + (ii) y x( )3 1x −( ( )x + 2 (d) (i) y x(( ) +2 3x −x( 12
(ii) y x(( ) −5 1x −x( 32
See Prior Learning section K on the CD-ROM if you need to review the technique of expanding brackets.

Cambridge University Press978-1-107-61306-5 – Mathematics for the IB Diploma Standard LevelPaul Fannon Vesna Kadelburg Ben Woolley and Stephen WardExcerptMore information
© in this web service Cambridge University Press www.cambridge.org
6 Topic 2: Functions and equations
4. Th e diagrams show quadratic graphs and their equations. Find the value of c in each case.
(a) (i) y
x
5
y = x2 − 3x + c
(ii) y
x
2
y = x2 − x + c
(b) (i) y
x
−3
y = x2 − 2x + c (ii) y
x
−1
y = 2x2 − 3x + c
(c) (i) y
x
−2
y = −3x2 + c (ii) y
x
2
y = −x2 + x + c
5. Th e diagrams show quadratic graphs and their equations. Find the value of a in each case.
(a) (i) y
x
(2,−11)
y = ax2 − 12x + 1 (ii)
y = ax2 − 4x − 3y
x
(1, −5)

Cambridge University Press978-1-107-61306-5 – Mathematics for the IB Diploma Standard LevelPaul Fannon Vesna Kadelburg Ben Woolley and Stephen WardExcerptMore information
© in this web service Cambridge University Press www.cambridge.org
1 Quadratic functions 7
(b) (i) y
x−3 5
y = ax2 − 4x − 30 (ii) y
x10
y = ax2 − 5x
(c) (i) y
x3−1
y = ax2 + 6 x + 9 (ii) y
x2−1
y = ax2 + x + 2
6. Th e diagrams show graphs of quadratic functions of the form y = ax2 + bx +c. Write down the value of c and then fi nd the values of a and b.
(a) (i) y
x1
6
3
(ii) y
x−2 1
−10
(b) (i) y
x4−1
1
(ii) y
x1−1
1
In this question you may need to solve simultaneous equations. See Prior Learning section Q on the CD-ROM if you need a reminder.

Cambridge University Press978-1-107-61306-5 – Mathematics for the IB Diploma Standard LevelPaul Fannon Vesna Kadelburg Ben Woolley and Stephen WardExcerptMore information
© in this web service Cambridge University Press www.cambridge.org
8 Topic 2: Functions and equations
7. For each of the following quadratic functions, fi nd the coordinates of the vertex of the graph.
(a) (i) y x x +3 4x −x 12 (ii) y x x2 4x+x −2
(b) (i) y = −5x2 + 2x + 10 (ii) y = −x2 + 4x − 5
8. Find the x -values for which y = 0 . (a) (i) y x x −3 4x −x 32
(ii) y x4 3x x+x −2
(b) (i) y x x−4 2+x 2 (ii) y x x= +x 5 2− 2
(c) (i) y x x2 1x + 2 1−x 82 (ii) y x x +2 6x −x 4 52
9. Find the equation of the line of symmetry of the parabolas. (a) (i) y x −x2 4 6x + (ii) y x2 5x x+x +2
(b) (i) y x x−4 3+ 2 2 (ii) y x x2 3x + 2
10. Find the values of x for which (a) (i) 3 4 7 152x x4 −4x4 (ii) x x2 1 3+ −x (b) (i) 4 2 3 2x x322 (ii) 3 5 225 +x x=
1B The completed square form y = a(x − h)2 + k
It is oft en useful to write a quadratic function in a diff erent form.
Every quadratic function can be written in the form y a x h kxa( ) +2 . For example, you can check by multiplying
out the brackets that 2 2 4 2 12
92
22
x x2 x−x2 −2 x⎛⎝
⎞⎠⎞⎞ − . Th is second
form of a quadratic equation, called the completed square form, allows us to fi nd the position of the line of symmetry of the graph and the coordinates of the vertex. It can also be used to solve equations because x only appears once, in the squared term.
We know that squares are always positive, so x h( ) ≥2 0. It follows that for y a ka( )x hx +2 :
• if a > 0, then a x h−( ) ≥2 0 and so y k; moreover, y k only when x h
• if a < 0, then a x h−( ) ≤2 0 and so y k; moreover, y k only when x h.
Hence the completed square form gives the extreme (maximum or minimum) value of the quadratic function, namely k, as
Worked example 1.3 below shows how to fi nd the values of h and k.

Cambridge University Press978-1-107-61306-5 – Mathematics for the IB Diploma Standard LevelPaul Fannon Vesna Kadelburg Ben Woolley and Stephen WardExcerptMore information
© in this web service Cambridge University Press www.cambridge.org
1 Quadratic functions 9
well as the value of x at which that extreme value occurs, h. Th e point at which the extreme value occurs is called a turning point or vertex.
KEY POINT 1.2KEY POINT 1.2
A quadratic function y = a(x − h)2 + k has turning point ( , )h k, and line of symmetry x h.
For a > 0, y k for all x.
For a < 0, y k for all x.
Th e next example shows how the functions y1 and y2 from the previous section can be rearranged into completed square form.
Worked example 1.3
(a) Write 2x2 – 2x – 4 in the form a(x – h)2 + k
(b) Hence write down the coordinates of the vertex and the equation of the line of symmetry of the graph y1 = 2x2 – 2x – 4.
Expand the brackets.Compare coeffi cients with the given
expression.
(a) a(x – h)2 + k = ax2 – 2ahx + ah2 +kComparing coeffi cients of x2: a = 2Comparing coeffi cients of x: –2ah = – 2
But a = 2:
∴−
⇔ =
4 2= −12
h
h
Comparing constants: ah2 + k = – 4
But a = 2 12
, :=h
∴ + = −
⇔ = −
12
4
92
k
k
Extract information from the turning point form (h, k).
(b) Line of symmetry is x = 12
and the vertex is
12
92
, −⎛⎝⎛⎛⎛⎛⎝⎝⎛⎛⎛⎛ ⎞
⎠⎞⎞⎞⎞⎠⎠⎞⎞⎞⎞
We can also use the completed square form to solve equations. Th is is illustrated in the next example, which also shows you how to deal with negative coeffi cients.

Cambridge University Press978-1-107-61306-5 – Mathematics for the IB Diploma Standard LevelPaul Fannon Vesna Kadelburg Ben Woolley and Stephen WardExcerptMore information
© in this web service Cambridge University Press www.cambridge.org
10 Topic 2: Functions and equations
Worked example 1.4
(a) Write –x2 + 4x – 3 in the form a(x – h)2 + k
(b) Hence solve the equation y2 = – 8
Expand the required form and compare coeffi cients
(a) a(x – h)2 + k = ax2 – 2ahx + ah2 + k Comparing the coeffi cients of x2: a = –1 Comparing the coeffi cients of x:
⇔
4 24 2
2=
ahh
h Comparing constants
⇔
− =− +
=
33 4= −
1
2ah k+2
kk
Therefore − = −x +2 2+ =+ 4 3−xx 1+2( )−xx 2
Isolate the term containing x (b)
y 22
2
2
2
12
12 892
92
2 35
= − 2
− =1 −⇔ − 2
⇔⇔ −∴ =
( )2− 2( )2−
( )2− 2( )2−
x or x = −1
We can now label the lines of symmetry and the coordinates of the turning points on the graphs of y1 and y2.
y
x
x= 12
(12,−4 1
2)
y1 = 2x2 − 2x − 4
y
x
x = 2
(2, 1)
y2 = −x2 + 4x − 3
The line of symmetry (and the
x-coordinate of the
vertex) can also
be found using the
formula xba= −
2,
which is given in
the Formula booklet.
We will explain in
section 1D where
this formula comes
from.
exam hint