camera film-filter systems lecture 4 prepared by r. lathrop 9/99 updated 9/06
TRANSCRIPT
Camera Film-Filter Systems
Lecture 4
Prepared by R. Lathrop 9/99
Updated 9/06

Radiometric Characteristics of aerial photos
Film exposure at a point in a photograph is directly related to the reflectance of the object imaged at that point. Theoretically, film exposure varies linearly with object reflectance, with both being a function of wavelength.
From Lillesand & Kiefer, 1994
Film Exposure
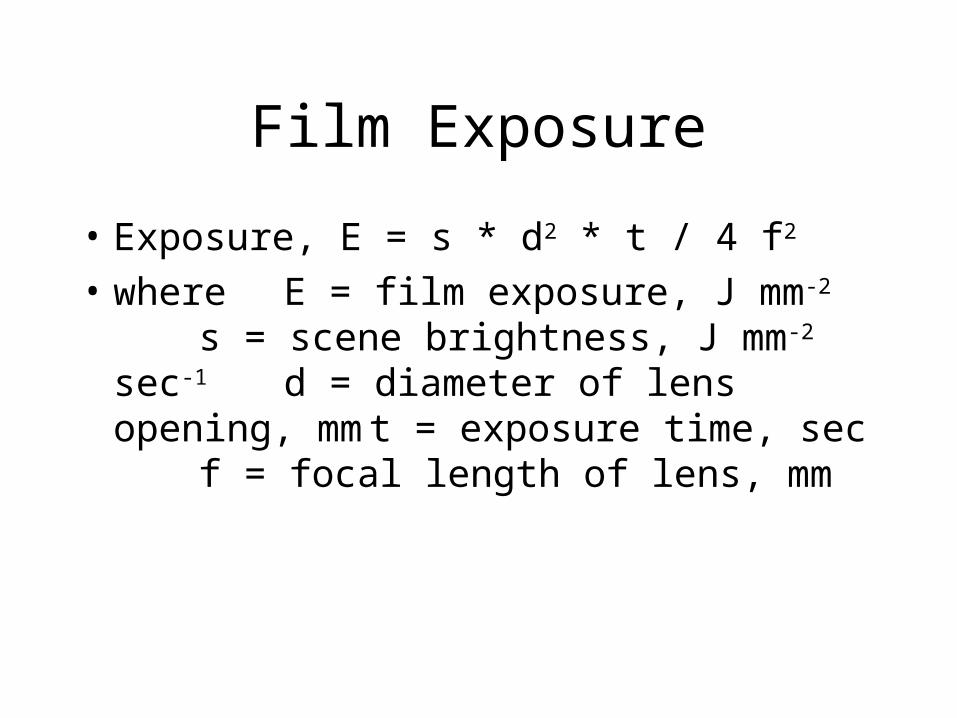
• Exposure, E = s * d2 * t / 4 f2
• whereE = film exposure, J mm-2
s = scene brightness, J mm-
2 sec-1 d = diameter of lens opening, mm t = exposure time, sec
f = focal length of lens, mm

Black & White Film
• B&W Panchromatic: sensitive to ultraviolet - blue -green - red (0.3 to 0.7 m)
• B&W Infrared: sensitive to UV to NIR (0.3 to 0.90 m)
• Ultraviolet blocked by haze filter

B&W Film Exposure process• Silver halide grains in the film emulsion absorb
light energy and are reduced to silver atoms
• During processing, the grains not exposed to light are dissolved and washed away
Emulsion
Base
light
Silver halide grains
Developed film negative with metallic silver
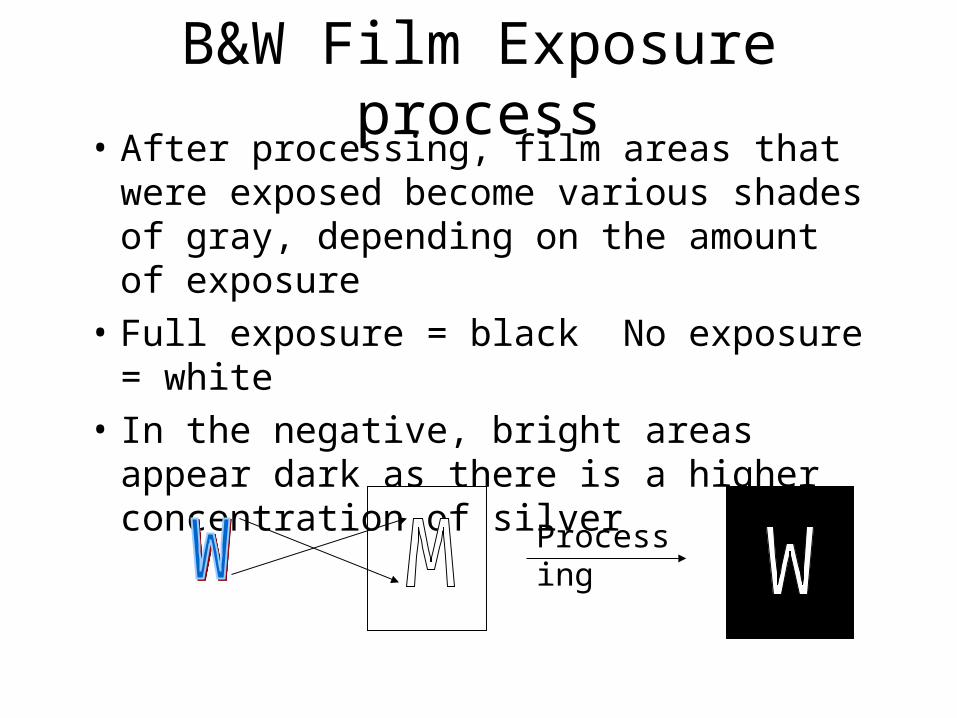
B&W Film Exposure process• After processing, film areas that were
exposed become various shades of gray, depending on the amount of exposure
• Full exposure = black No exposure = white
• In the negative, bright areas appear dark as there is a higher concentration of silver
Processing
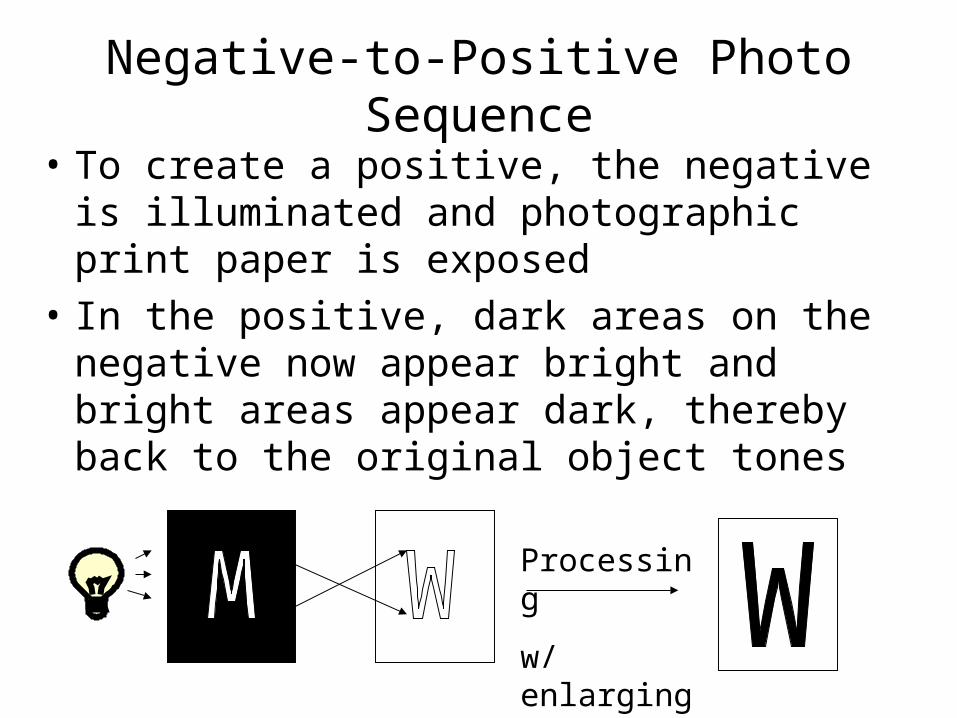
Negative-to-Positive Photo Sequence
• To create a positive, the negative is illuminated and photographic print paper is exposed
• In the positive, dark areas on the negative now appear bright and bright areas appear dark, thereby back to the original object tones
Processing
w/ enlarging

Film transmittance
• Transmittance, T, ability of a film to pass light
• Tp = light passing through film at point p total light incident upon the film at pt. p
• Opacity, O, is a measure of “darkness” of a film emulsion
• Op= 1/Tp
40 units transmitted Tp = 40/100 = 0.40
10 units transmitted Tp = 10/100 = 0.10
1 unit transmitted Tp = 1/100 = 0.01Adapted from Lillesand
& Kiefer

Film Density
• Density, Dp = log (Op) = log (1/Tp)
• Image density and visual tone vary in a nearly linear relationship
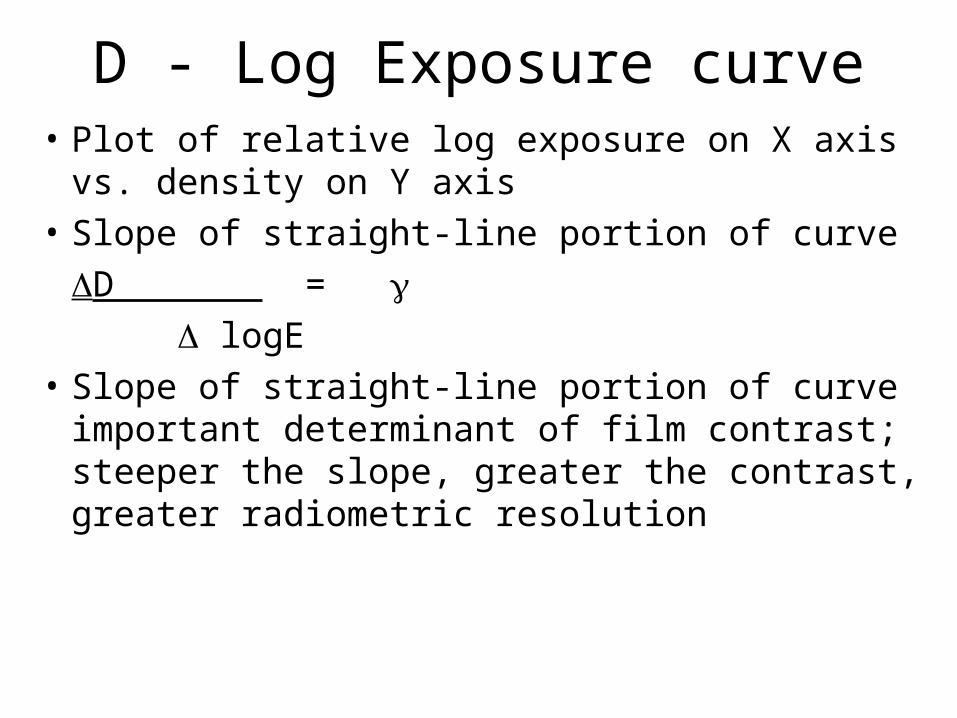
D - Log Exposure curve• Plot of relative log exposure on X axis vs. density
on Y axis• Slope of straight-line portion of curve
D = logE
• Slope of straight-line portion of curve important determinant of film contrast; steeper the slope, greater the contrast, greater radiometric resolution

D-Log E curvePlot of relative log exposure on X axis vs. density on Y axis
0 1 2 3
Dmin
Dmax
D =
logE
logE
D
Straight line portion
Density
Relative log exposure Adapted from Lillesand & Kiefer

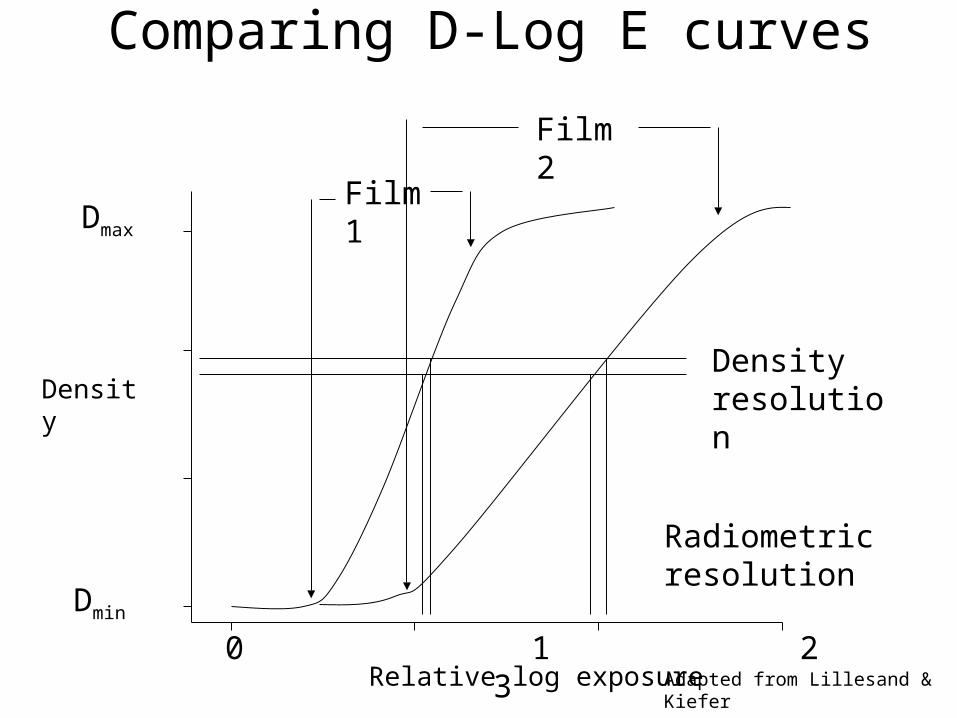
Comparing D-Log E curves
0 1 2 3
Dmin
Dmax
Density
Relative log exposure Adapted from Lillesand & Kiefer
Film 1
Film 2
Density resolution
Radiometric resolution

D - Log Exposure curve
• Slope of straight-line portion of curve, , important determinant of film contrast
• Steeper the slope, greater radiometric resolution (i.e. smallest detectable change in exposure), leads to imagery with greater contrast
• Film 1 has steeper and higher radiometric resolution, greater contrast
Comparing D-Log E curves
0 1 2 3
Dmin
Dmax
Density
Relative log exposure Adapted from Lillesand & Kiefer
Film 1
Film 2
Density resolution
Radiometric resolution

D - Log Exposure curve
• Film speed is the sensitivity of a film to light
• Fast film accommodates low exposure levels (i.e. it lies farther to the left on the log E axis)
• Film 1 is a faster film but has more limited exposure range as compared to Film 2
• Tradeoff between film speed and coarser spatial resolution (larger film grains to capture low light)
• Film 2 provides a finer grain film

Comparing D-Log E curves
0 1 2 3
Dmin
Dmax
Density
Relative log exposure Adapted from Lillesand & Kiefer
Film 1
Film 2
Density resolution
Radiometric resolution

Exposure Falloff
• Falloff: less light, lower exposure towards edge of image frame

White Light is a combination of all the visible wavelengths

400 500 600 700
wavelength (nm)
Human Color Vision3 types of cones: roughly sensitive with peaks in the
blue (445nm), green (535nm) and orange-red (575nm)

Primary Colors
Red Green
Blue

Color Additive Process
R G
B
M
Y
CW
Black background
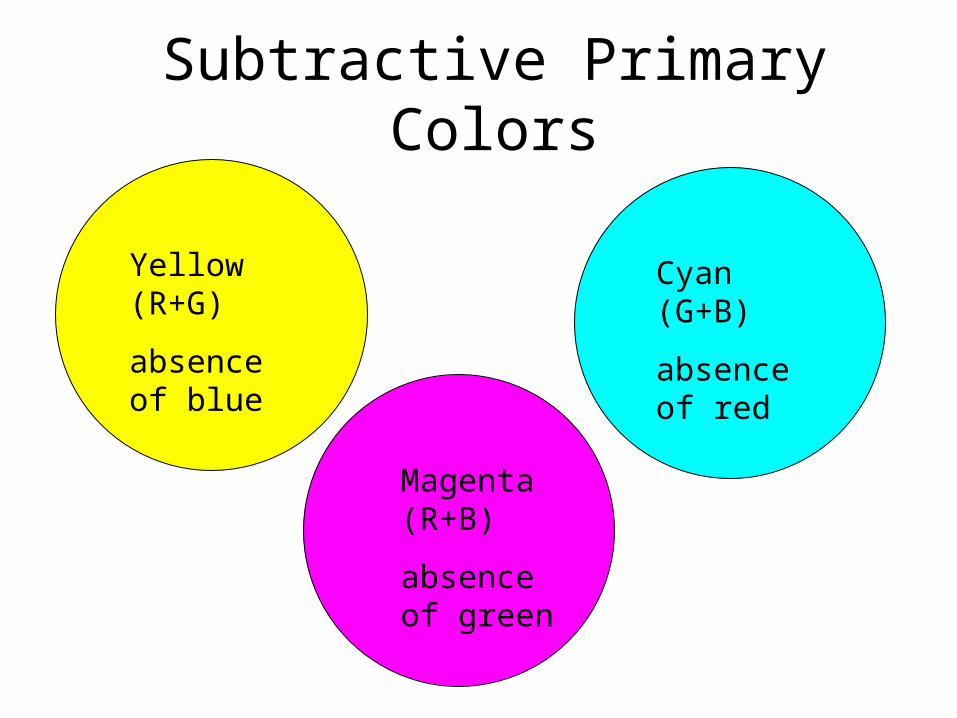
Subtractive Primary Colors
Yellow (R+G)
absence of blue
Cyan (G+B)
absence of red
Magenta (R+B)
absence of green

Y C
M
R
G
BB
Color Subtractive Process
White background

Color film• 3 dye layers sandwiched to a base
• Yellow dye layer controls blue light passing through image
• Magenta dye layer controls green light
• Cyan dye layer controls red light
Blue sensitive layer
Blue blocking filter
G (& B) sensitive layer
R (& B) sensitive layer
Base & Backing
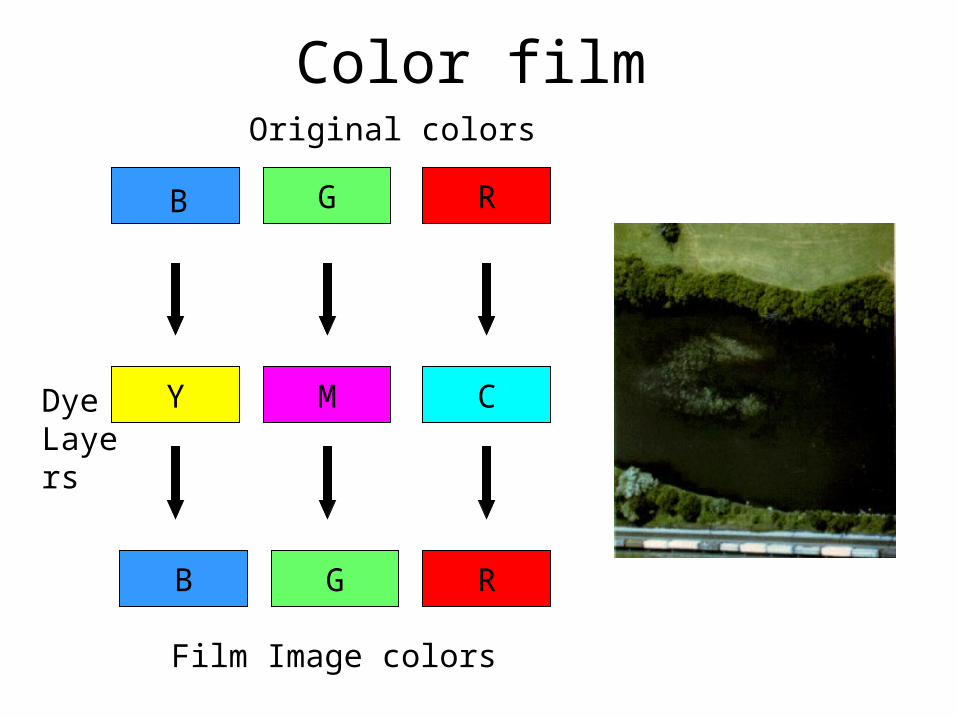
Color film
Film Image colors
G R
Original colors
Y M C
B G R
Dye Layers
B

Color Infrared (CIR) film• Blue absorbing filter • Near infrared sensitive dye layer - cyan dye which
controls red light on image• Green sensitive layer - yellow dye which controls
blue light on image• Red sensitive dye layer - magenta dye which controls
green light on image
Blue blocking filter
NIR (& B) sensitive layer
G (& B) sensitive layer
R (& B) sensitive layer
Base & Backing

Color Infrared filmOriginal colors
Film Image colors
NIR
Filter
G R
Y M C
B G R
Dye Layers
B

An example-plant leaves• Chlorophyll absorbs large % of red and
blue for photosynthesis- and strongly reflects in green (.55um) mm
• Peak reflectance in leaves in near infrared (.7-1.2mm) up to 60% of infrared energy per leaf is scattered up or down due to cell wall size, shape, leaf condition (age, stress, disease), etc.
• Reflectance in Mid IR (2-4mm) influenced by water content-water absorbs IR energy, so live leaves reduce mid IR return
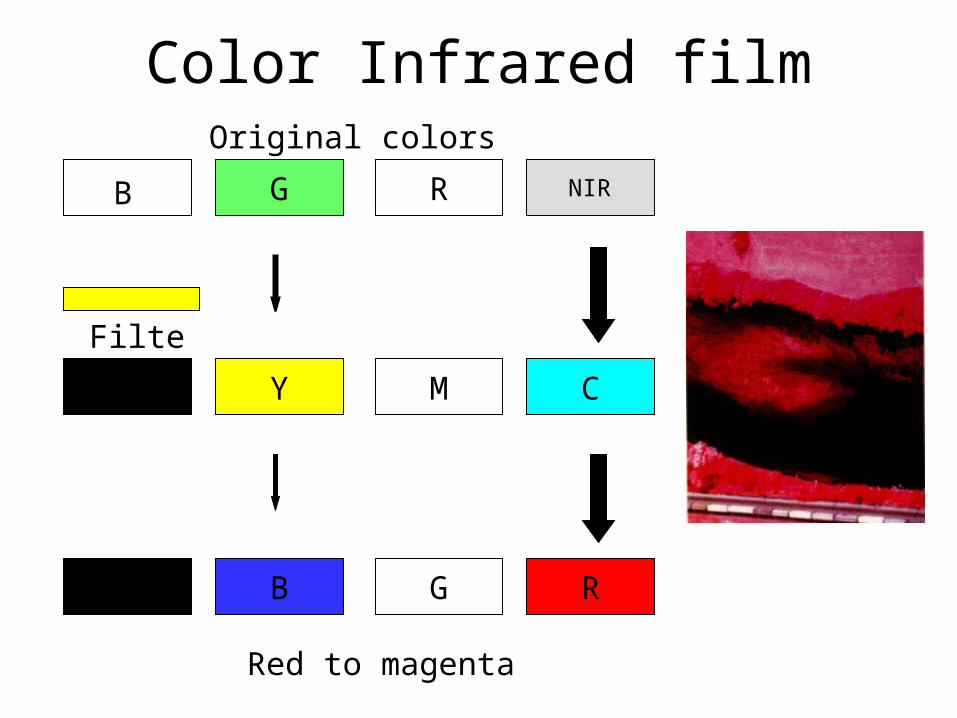
Color Infrared filmOriginal colors
Red to magenta
NIR
Filter
G R
Y M C
B G R
B

What color is it?
• What color would a green astroturf field (with low NIR reflectance) look like on Color IR film?
• What color would a field of flowering yellow mustard plant look like on Color IR film?
• What color would a magenta (purple) cow (with low NIR reflectance) look like on color IR film?
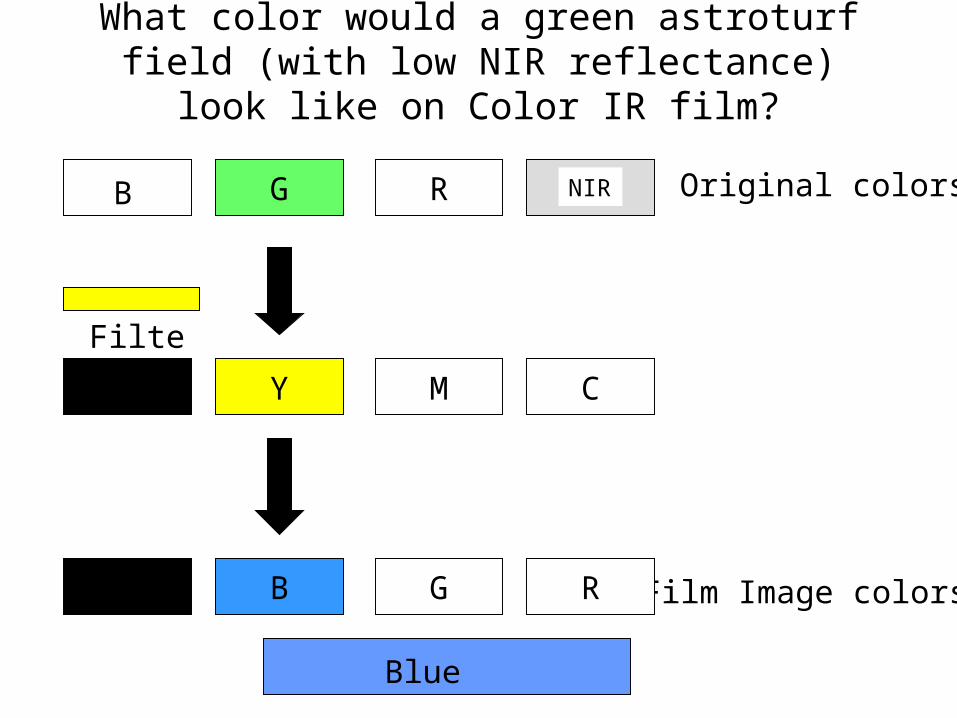
What color would a green astroturf field (with low NIR reflectance) look like on Color IR film?
Original colors
Film Image colors
NIR
Filter
G R
Y M C
B G R
B
Blue
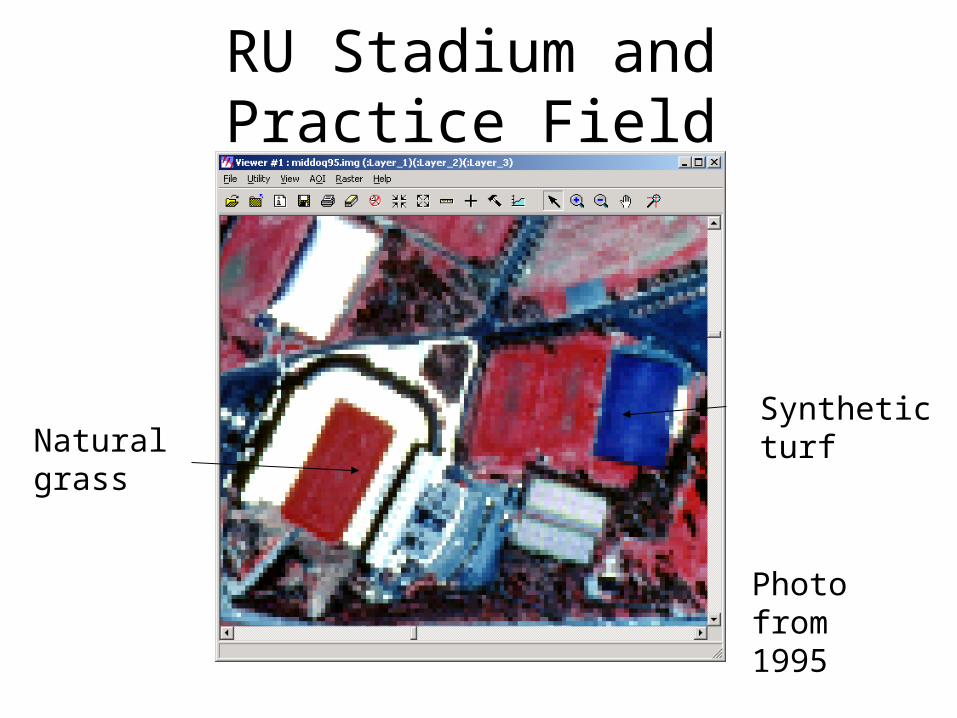
RU Stadium and Practice Field
Natural grassSynthetic turf
Photo from 1995

‘False color’ imageryOn a computer screen, can re-arrange the individual color layers or bands of a digital image can be switched around
For a CIR, normal rendition
NIR R, R G, G B
The image to the right is scrambled. Match the original wavebands to the display colors.
? R, ? G, ? B

What color would a field of flowering yellow
mustard plant look like on Color IR film?
Original colors
Film Image colors
NIR
Filter
G R
Y M C
B G R
Dye Layers
B
White to pink

What color would a magenta cow look like on
Color IR film?
Original colors
Film Image colors
NIR
Filter
G R
Y M C
B G R
Dye Layers
B
Green

Filters
• Short wavelength blocking filter (high pass) selectively absorbs energy below a certain wavelength
• Haze filters to absorb UV (<0.4 um)
• Yellow filter to absorb blue (<0.5 um)
• Bandpass filters block energy above and below a certain range of wavelengths

Computer Image Display
Computer Display Monitor has 3 color planes: R, G, B
that can display DN’s or BV’s with values between 0-255
3 layers of data can be viewed simultaneously:
1 layer in Red plane
1 layer in Green plane
1 layer in Blue plane
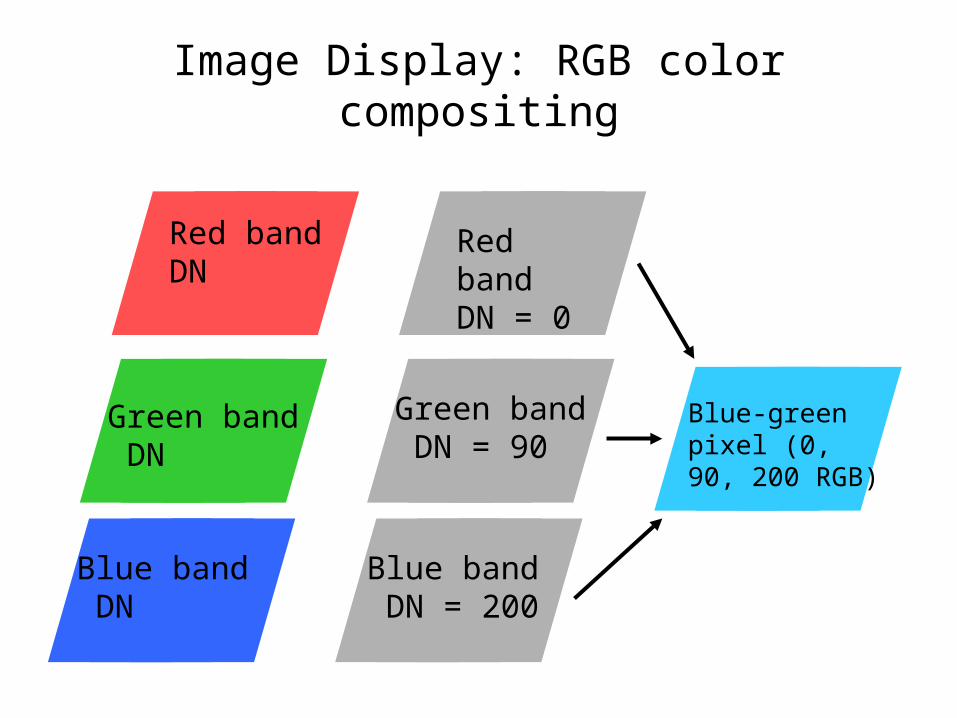
Image Display: RGB color compositing
Red band DN
Blue band DN
Red band DN = 0
Blue band DN = 200
Green band DN
Green band DN = 90
Blue-green pixel (0, 90, 200 RGB)
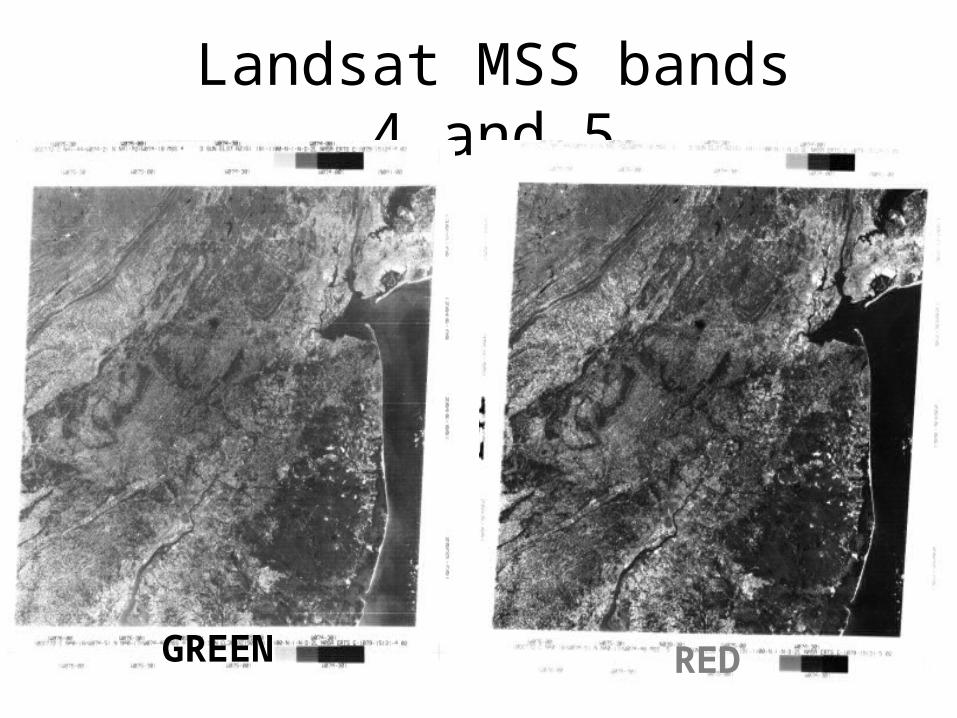
Landsat MSS bands 4 and 5
GREEN RED

Landsat MSS bands 6 and 7
INFRARED 2INFRARED 1
Note: water absorbs IR energy-no return=black

• combining bands creates a false color composite
Rutgers
Manhattan
PhiladelphiaPine barrensChesapeake BayDelaware River
MSS “false”color composite

RGB Additive Color Processcolor R G B
white 255 255 255
black 0 0 0
red 255 0 0
yellow 255 255 0
cyan 0 255 255
magenta 255 0 255
orange = ___ ___ ___

Additive color process
• Snow reflects highly in the visible and near-IR wavelengths but absorbs (low DN) in the mid-IR and thermal-IR wavelengths.
• For a 'false color' composite that consists of NIR=red, MIR=green, and RED=blue, snow is what color? __________________

Additive color process
• Stressed vegetation with chlorophyll degradation reflects more highly in the red wavelengths than healthy green vegetation.
• For a ‘true color' composite that consists of Red=red, Green=green, and Blue=blue, stressed vegetation is what color? __________________
• For a 'false color' composite that consists of NIR=red, Red=green, and Green=blue, stressed vegetation is what color? __________________
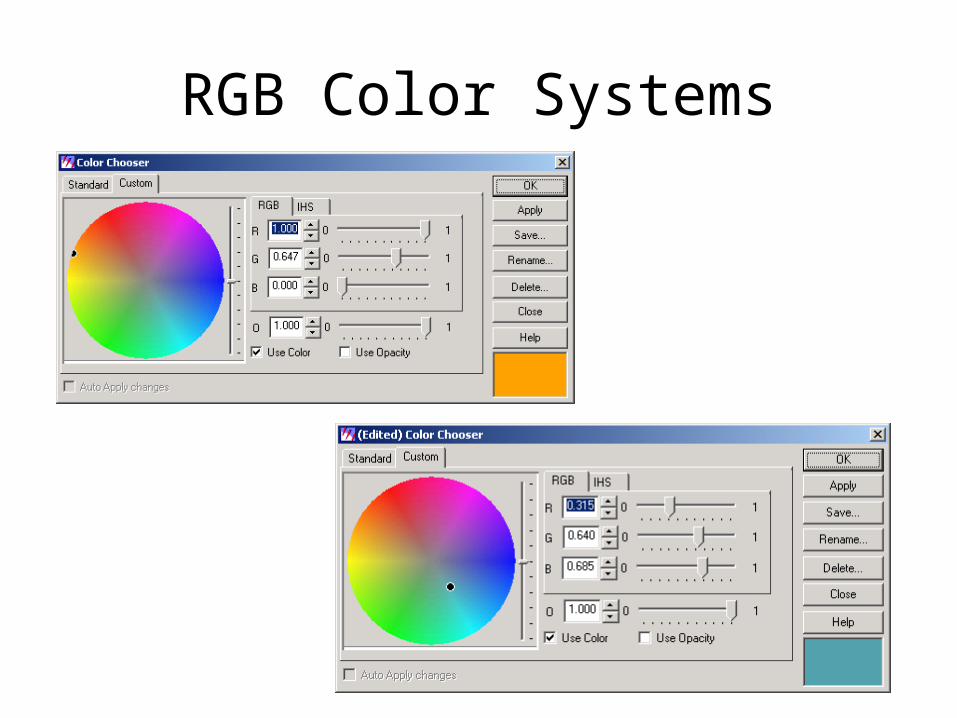
RGB Color Systems

IHS Color System• IHS: Intensity-Hue-Saturation