camp woodhaven site layout and amphitheater design · pdf filecamp woodhaven site layout and...
TRANSCRIPT

Project ID: RP12
Camp Woodhaven Site Layout and
Amphitheater Design
A Major Qualifying Project
Submitted to the Faculty of
WORCESTER POLYTECHNIC INSTITUTE In partial fulfilment of the requirements for the
Degree of Bachelor of Science
Submitted on: 4/19/2013
Submitted by:
Jenine Knibb Mark Lerret
Eric Spazzarini
Submitted to: Project Advisors: Professor Roberto Pietroforte,
Professor Suzanne LePage Professor Leffi Cewe-Malloy
i
Abstract
Camp Woodhaven is a traditional summer camp located in West Boylston, MA. The goal
of this MQP was to develop design solutions for the development of an amphitheater, stage
and pavilion for Camp Woodhaven. In addition, an analysis and proposed solution was done in
order to address traffic circulation concerns. This MQP presents layouts of amphitheater, stage,
pavilion and traffic circulation designs as well as material quantities and cost estimates.
ii
Acknowledgements
This project could not have been completed without the support from various
individuals. We would like to express gratitude to our advisors Professor Pietroforte,
Professor LePage and Professor Malloy for their continued guidance and support
throughout the course of the project. We would also like to thank George and Paula
DeTellis from Camp Woodhaven for giving us the opportunity to work on this project.
iii
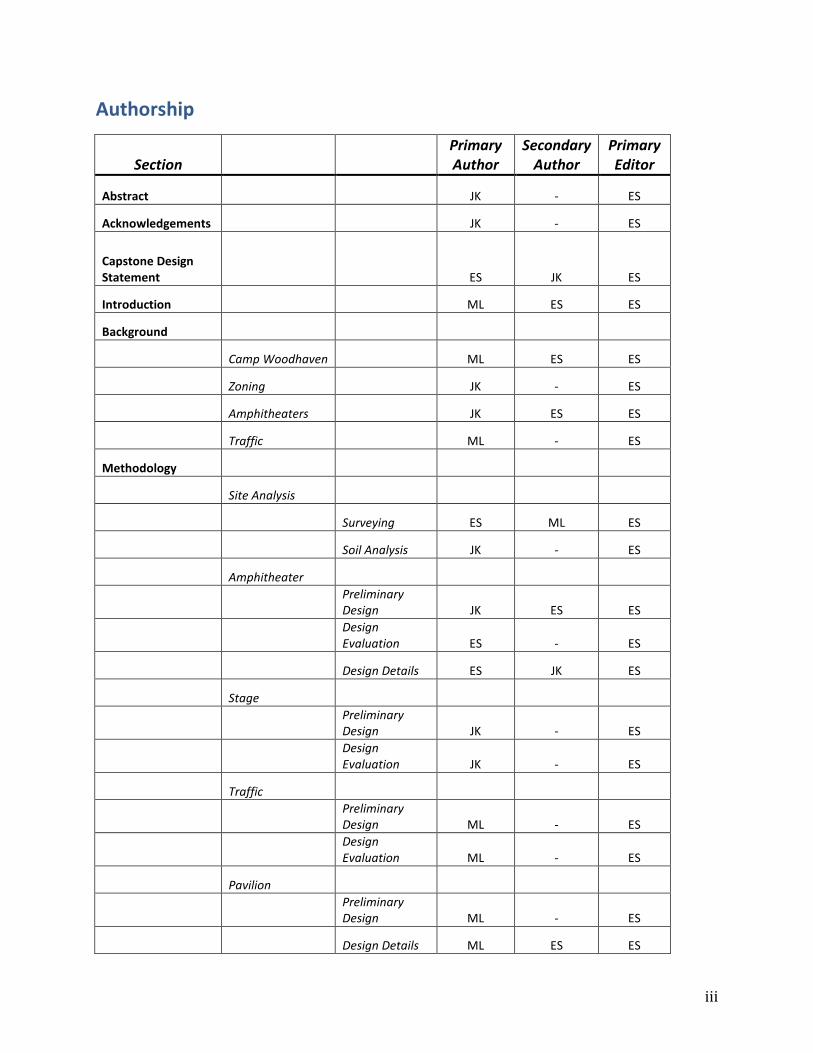
Authorship
Section
Primary Author
Secondary Author
Primary Editor
Abstract JK - ES
Acknowledgements JK - ES
Capstone Design Statement ES JK ES
Introduction ML ES ES
Background
Camp Woodhaven ML ES ES
Zoning JK - ES
Amphitheaters JK ES ES
Traffic ML - ES
Methodology
Site Analysis
Surveying ES ML ES
Soil Analysis JK - ES
Amphitheater
Preliminary Design JK ES ES
Design Evaluation ES - ES
Design Details ES JK ES
Stage
Preliminary Design JK - ES
Design Evaluation JK - ES
Traffic
Preliminary Design ML - ES
Design Evaluation ML - ES
Pavilion
Preliminary Design ML - ES
Design Details ML ES ES

iv
Results
Site Analysis
Surveying ES ML ES
Soil Analysis JK - ES
Amphitheater
Product ES - ES
Implementation ES - ES
Stage
Product JK - ES
Cost Estimate JK - ES
Traffic
Product ML - ES
Implementation ML ES ES
Pavilion
Product ML ES ES
Implementation ML ES ES
Conclusion ES - ES
v
Capstone Design Statement
Every Major Qualifying Project must meet the requirements of the capstone design
experience as defined by the Accreditation Board for Engineering and Technology (ABET). Per
ABET General Criterion 4, “students must be prepared for engineering practice through the
curriculum culminating in a major design experience based on the knowledge and skills
acquired in earlier course work and incorporating engineering standards and realistic
constraints that include most of the following consideration: economic; environmental;
sustainability; manufacturability; ethical; health and safety; social; and political.”
Economic:
Multiple designs were created for the project and cost was an important factor in
determining solutions to meet the client’s needs. Cost estimates were prepared for the design
solutions in order to ensure that the proposed solutions were well within the client’s budget.
Environmental and Sustainability:
The camp is located in a wooded area, so one of the major goals was to preserve the
natural environment that is present. The designs of this project depict structures that are
meant to be used by the client for the foreseeable future. The proposed designs were
developed with intention of requiring minimal investment on the client’s part for maintenance
and repair.
Constructability:
The designs include suggestions on what materials and processes will need to be
undertaken in order to complete the construction of the proposed structures. The ease of
constructability of an option was an evaluation criteria used in the selection of the final designs.
Ethical:
The MQP team used knowledge that has been acquired over years of classwork in order
to develop designs that will best serve the needs of the client. Consistent with the ASCE Code of

vi
Ethics, the MQP team has used said knowledge and skills to enhance the lives of the client and
the team has been honest and impartial in addressing all tasks.
Health and Safety:
The health and safety of the children using the camp, as well as parents, faculty, and
staff was a major consideration in the development of the designs. The designs are also
compliant with local and state building codes.

vii
Table of Contents
Abstract ......................................................................................................................................... i
Acknowledgements ................................................................................................................. ii
Authorship ................................................................................................................................. iii
Capstone Design Statement ................................................................................................... v
Table of Contents .................................................................................................................... vii
List of Figures ........................................................................................................................... ix
List of Tables ............................................................................................................................. xi
1. Introduction ...................................................................................................................... 1
2. Background ....................................................................................................................... 4 2.1. Camp Woodhaven ............................................................................................................................... 4 2.2. Zoning ..................................................................................................................................................... 5 2.3. Amphitheaters ..................................................................................................................................... 7 2.4. Traffic ..................................................................................................................................................... 9
3. Methodology .................................................................................................................... 13 3.1. Site Analysis ....................................................................................................................................... 13
3.1.1. Surveying ................................................................................................................................................... 13 3.1.2. Soil Analysis ............................................................................................................................................. 14
3.2. Amphitheater .................................................................................................................................... 15 3.2.1. Preliminary Design ................................................................................................................................ 15 3.2.2. Design Evaluation .................................................................................................................................. 25 3.2.3. Design Details .......................................................................................................................................... 28
3.3. Stage ..................................................................................................................................................... 37 3.3.1. Preliminary Design ................................................................................................................................ 37 3.3.2. Design Evaluation .................................................................................................................................. 42
3.4. Traffic .................................................................................................................................................. 44 3.4.1. Preliminary Design ................................................................................................................................ 44 3.4.2. Design Evaluation .................................................................................................................................. 50
3.5. Pavilion ............................................................................................................................................... 53 3.5.1. Preliminary Design ................................................................................................................................ 53 3.5.2. Design Details .......................................................................................................................................... 54
4. Results ............................................................................................................................... 58 4.1. Site Analysis ....................................................................................................................................... 58
4.1.1. Surveying ................................................................................................................................................... 58 4.1.2. Soil Analysis ............................................................................................................................................. 60
4.2. Amphitheater .................................................................................................................................... 63 4.2.1. Product ....................................................................................................................................................... 63 4.2.2. Implementation ...................................................................................................................................... 65
4.3. Stage ..................................................................................................................................................... 66 4.3.1. Product ....................................................................................................................................................... 66 4.3.2. Cost Estimate ........................................................................................................................................... 66
4.4. Traffic .................................................................................................................................................. 68
viii
4.4.1. Product ....................................................................................................................................................... 68 4.4.2. Implementation ...................................................................................................................................... 69
4.5. Pavilion ............................................................................................................................................... 70 4.5.1. Product ....................................................................................................................................................... 70 4.5.2. Cost Estimate ........................................................................................................................................... 71
5. Conclusion ........................................................................................................................ 72
6. References ........................................................................................................................ 73
Appendix A: Camp Woodhaven MQP Proposal ............................................................ 75 Introduction ..................................................................................................................................................... 75 Background ...................................................................................................................................................... 76
The Site ............................................................................................................................................................................ 76 Amphitheaters .............................................................................................................................................................. 77 Zoning .............................................................................................................................................................................. 80 Traffic Management ................................................................................................................................................... 80
Methodology .................................................................................................................................................... 81 Site Review .................................................................................................................................................................... 81 Processing and Analyzing Collected Survey Data .......................................................................................... 81 Stage and Amphitheater Design ............................................................................................................................ 82 Pavilion Design and Traffic Management ......................................................................................................... 82 Recommending a Final Design .............................................................................................................................. 83 Final Deliverables ....................................................................................................................................................... 83
Appendix B: Site Visit Write-Up 9-5-2012 ..................................................................... 85
Appendix C: As-Built Septic Plan ....................................................................................... 86
Appendix D: Survey Data Table 9-14-2012 ................................................................... 87
Appendix E: Soil Engineering Report .............................................................................. 90
Appendix F: Preliminary Site Grading Calculations ................................................... 92
Appendix G: Final Site Grading Hand Calculations ..................................................... 95
Appendix H: Bench Manufacturers & Products List ................................................... 96
Appendix I: Bench Rank by Cost per Foot ................................................................... 100
Appendix J: Stage Design Drawings .............................................................................. 102
Appendix K: Stage Design Material and Cost Estimates ........................................ 121

ix
List of Figures
Figure 1: Camp Woodhaven Aerial Photo ................................................................................................... 1 Figure 2: Current Drop-off Traffic Flow ....................................................................................................... 2 Figure 3: Camp Woodhaven Location ........................................................................................................... 4 Figure 4: Site Review Steps ............................................................................................................................... 6 Figure 5: Camden Library Amphitheater ..................................................................................................... 7 Figure 6: Quarry Amphitheater ....................................................................................................................... 8 Figure 7: Nelhalem Campground Amphitheater ....................................................................................... 8 Figure 8: Scott Outdoor Amphitheater ......................................................................................................... 9 Figure 9: Circular (Left) & Offset (Right) Cul-de-sacs .......................................................................... 11 Figure 10: Preliminary Amphitheater Dimensions .............................................................................. 15 Figure 11: Proposed Amphitheater Orientation .................................................................................... 16 Figure 12: Amphitheater Layout (Strong, 2010) ................................................................................... 16 Figure 13: Amphitheater Option I Layout ................................................................................................ 17 Figure 14: Section B Row Dimensions ....................................................................................................... 18 Figure 15: Amphitheater Option II Layout ............................................................................................... 19 Figure 16: Amphitheater Option III Layout ............................................................................................. 20 Figure 17: Viewing Curve-Graphical Method (Hertz et al, 1970) .................................................... 20 Figure 18: Viewing Curve ................................................................................................................................ 21 Figure 19: Amphitheater Cross-Section .................................................................................................... 22 Figure 20: Area Calculation Diagram ......................................................................................................... 22 Figure 21: Design & Existing Slope Profile ............................................................................................... 23 Figure 22: Option I & II Terrace Calculation............................................................................................ 23 Figure 23: Trapezoid Geometry (http://www.calculateme.com/cArea/area-of-
trapezoid.gif) .............................................................................................................................................. 23 Figure 24: Area Between Concentric Circles ........................................................................................... 24 Figure 25: Option III Design Calculation ................................................................................................... 24 Figure 26: Adjusted Amphitheater Cross-Section ................................................................................. 28 Figure 27: Surface and Plan View of Amphitheater .............................................................................. 29 Figure 28: Grading Groups ............................................................................................................................. 29 Figure 29: Section A Profile Lines ................................................................................................................ 31 Figure 30: Bench Mounting Cross-Section ............................................................................................... 34 Figure 31: Retaining Wall Base Cross-Section ........................................................................................ 35 Figure 32: Full Retaining Wall Section....................................................................................................... 36 Figure 33: Required Spacing for Choir (Ramsey, 2000) ..................................................................... 38 Figure 34: Area Visual ...................................................................................................................................... 38 Figure 35: Outdoor Theater Listening Condition (Doelle, 1972) .................................................... 39 Figure 36: Stage Design I ................................................................................................................................. 40 Figure 37: Stage Design II ............................................................................................................................... 40 Figure 38: Abacoa Amphitheater, Jupiter Fl ............................................................................................ 41 Figure 39: Stage Design III .............................................................................................................................. 41 Figure 40: Stage Design IV .............................................................................................................................. 42 Figure 41: Tree & Stone Wall Locations .................................................................................................... 45 Figure 42: Roadway Construction 1 ........................................................................................................... 46
x
Figure 43: Roadway Construction 2 ........................................................................................................... 47 Figure 44: Roadway Queue Length ............................................................................................................. 48 Figure 45: Drop-off Process 1 (Left) & Process 2 (Right) .................................................................. 49 Figure 46: Existing Covered Pavilion ......................................................................................................... 53 Figure 47: Human Area Occupancy ............................................................................................................. 53 Figure 48: Pavilion Plan View ....................................................................................................................... 55 Figure 49: Footing Design Details ................................................................................................................ 56 Figure 50: Sonotube Mold and Base (Sonoco) ........................................................................................ 56 Figure 51: Pavilion South View..................................................................................................................... 57 Figure 52: Pavilion East View ........................................................................................................................ 57 Figure 53: Campground Survey Points ...................................................................................................... 58 Figure 54: Campground Contour Lines ..................................................................................................... 59 Figure 55: Camp Woodhaven Soil Map ...................................................................................................... 61 Figure 56: Concrete Block Steps ................................................................................................................... 63 Figure 57: Rear Retaining Wall Design ...................................................................................................... 64 Figure 58: Final Amphitheater Layout....................................................................................................... 64 Figure 59: Final Stage Selection (Option IV) ........................................................................................... 66 Figure 60: Roadway Design Aerial .............................................................................................................. 68 Figure 61: Proposed Roadway Cross-Section ......................................................................................... 70 Figure 62: Rendered Pavilion Image .......................................................................................................... 70 Figure 63: Amphitheater View (Left) & Aerial View (Right) ............................................................. 72 Figure 64: Camp Woodhaven Aerial ........................................................................................................... 76 Figure 65: Camp Woodhaven Location ..................................................................................................... 77 Figure 66: Camden Library Amphitheater ............................................................................................... 78 Figure 67: Quarry Amphitheater ................................................................................................................. 79 Figure 68: Nehalem Campground Amphitheater .................................................................................. 79 Figure 69: Scott Outdoor Amphitheater.................................................................................................... 79 Figure 70: Design Process Flowchart ......................................................................................................... 82

xi
List of Tables
Table 1: Dimensional Requirements in West Boylston .......................................................................... 5 Table 2: Design Speed Ranges (Mass DOT, 2006) ................................................................................. 10 Table 3: Design Vehicle Dimensions (Mass DOT, 2006) ..................................................................... 11 Table 4: Soil Classification .............................................................................................................................. 14 Table 5: Amphitheater Design Criteria ...................................................................................................... 17 Table 6: Amphitheater Grading Criterion ................................................................................................. 26 Table 7: Amphitheater Evaluation Table .................................................................................................. 27 Table 8: Summary of Amphitheater Evaluation ..................................................................................... 27 Table 9: Civil 3D Cut & Fill Calculations .................................................................................................... 30 Table 10: Old Seating Dimensions Option I ............................................................................................. 32 Table 11: Updated Dimensions Option I ................................................................................................... 32 Table 12: Bench Calculations ........................................................................................................................ 33 Table 13: Retaining Wall Lengths ................................................................................................................ 34 Table 14: Summary of Retaining Wall Material ..................................................................................... 36 Table 15: Stage Dimensions by Intended Use (De Chiara et al, 2001) .......................................... 37 Table 16: Stage Grading Criterion ............................................................................................................... 43 Table 17: Stage Evaluation Table ................................................................................................................. 44 Table 18: Summary of Stage Evaluation ................................................................................................... 44 Table 19: Traffic Option Description Table ............................................................................................. 50 Table 20: Traffic Evaluation Criterion ....................................................................................................... 51 Table 21: Traffic Evaluation Table .............................................................................................................. 52 Table 22: Summary of Traffic Evaluation ................................................................................................. 52 Table 23: Road Width Measurements ........................................................................................................ 60 Table 24: Presumptive Load Bearing Values (International Building Code, 2009) ................. 62 Table 25: Amphitheater Materials List ...................................................................................................... 65 Table 26: Stage Design IV Cost Estimate ................................................................................................... 67 Table 27: Gravel Road Specifications (Maine DEP, 2010) .................................................................. 69 Table 28: Pavilion Materials and Cost Estimate ..................................................................................... 71 Table 29: Dimensional Requirements in West Boylston .................................................................... 80

1
1. Introduction
Camp Woodhaven is a day camp in West Boylston, Massachusetts that was founded
over sixty years ago. The same family has run it for four generations as it aims to provide
campers with a fun, safe, and traditional camp experience during the summer. Camp
Woodhaven, now run by George and Paula Detellis, currently draws over 300 children daily
during the summer. Current facilities on the campground include a swimming pool (1),
athletic fields (2), basketball court (3), archery range, sand playground, covered pavilions,
dining hall (4), and other buildings (5) designated to accommodate other areas of the camp
(Figure 1). They wish to have three new structures built on the camp property that will
address two different issues they currently face as well as augment the camp's current
functions and facilitate anticipated growth of the camp in the coming years.
Figure 1: Camp Woodhaven Aerial Photo
Every morning and evening the entire camp comes together for flag ceremonies. In
the past this has been done at the flagpole near the parking lot. Theatrical productions are
also an important part of the camp experience, as are gatherings when parents come to
2
visit. The first issue the clients want to address is the addition of a centralized gathering
place to provide a more enjoyable experience for the above-mentioned events. They have
suggested the construction of an amphitheater and stage as a solution to this problem
while maintaining the traditional camp feel they currently host.
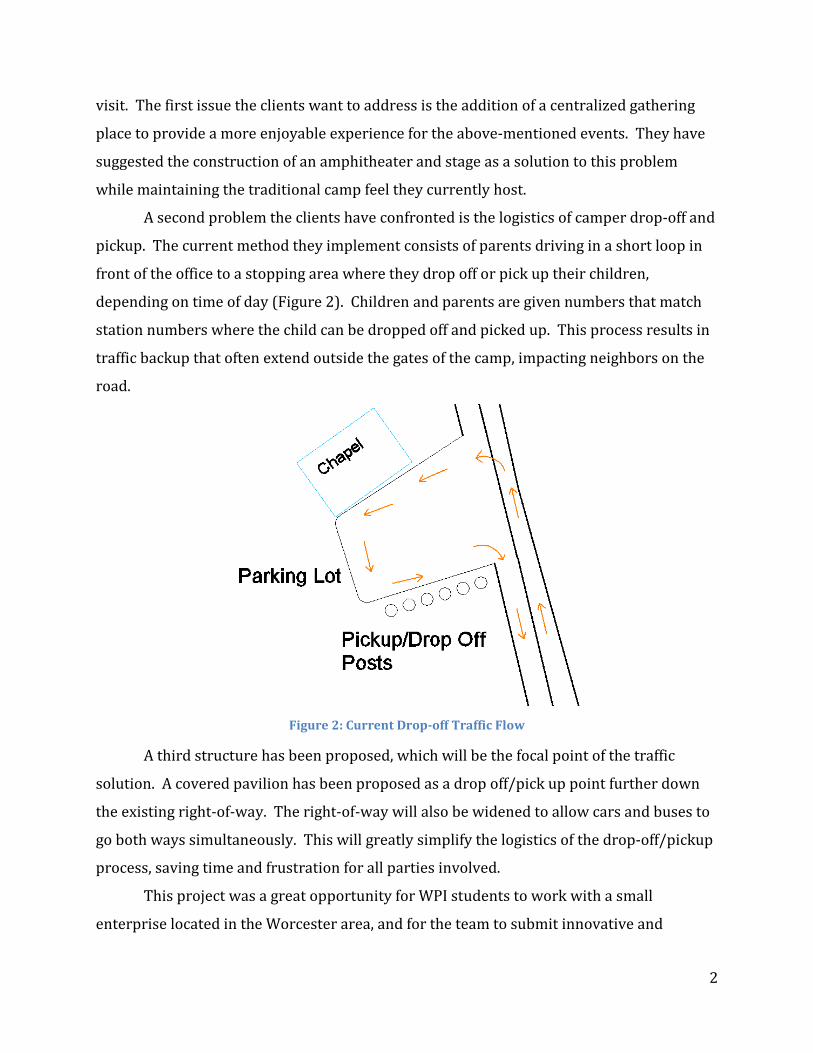
A second problem the clients have confronted is the logistics of camper drop-off and
pickup. The current method they implement consists of parents driving in a short loop in
front of the office to a stopping area where they drop off or pick up their children,
depending on time of day (Figure 2). Children and parents are given numbers that match
station numbers where the child can be dropped off and picked up. This process results in
traffic backup that often extend outside the gates of the camp, impacting neighbors on the
road.
Figure 2: Current Drop-off Traffic Flow
A third structure has been proposed, which will be the focal point of the traffic
solution. A covered pavilion has been proposed as a drop off/pick up point further down
the existing right-of-way. The right-of-way will also be widened to allow cars and buses to
go both ways simultaneously. This will greatly simplify the logistics of the drop-off/pickup
process, saving time and frustration for all parties involved.
This project was a great opportunity for WPI students to work with a small
enterprise located in the Worcester area, and for the team to submit innovative and

3
creative ideas to the owners of Camp Woodhaven. To address the concerns of the client,
the team has used combinations of design manuals and original creativity to create,
evaluate, and recommend designs for each of the structures the clients have requested.
The end product of this project consists of the design plans for a stage, amphitheater and a
new covered pavilion as well as a plan to change the current roadway to eliminate traffic
issues.
4
2. Background
2.1. Camp Woodhaven
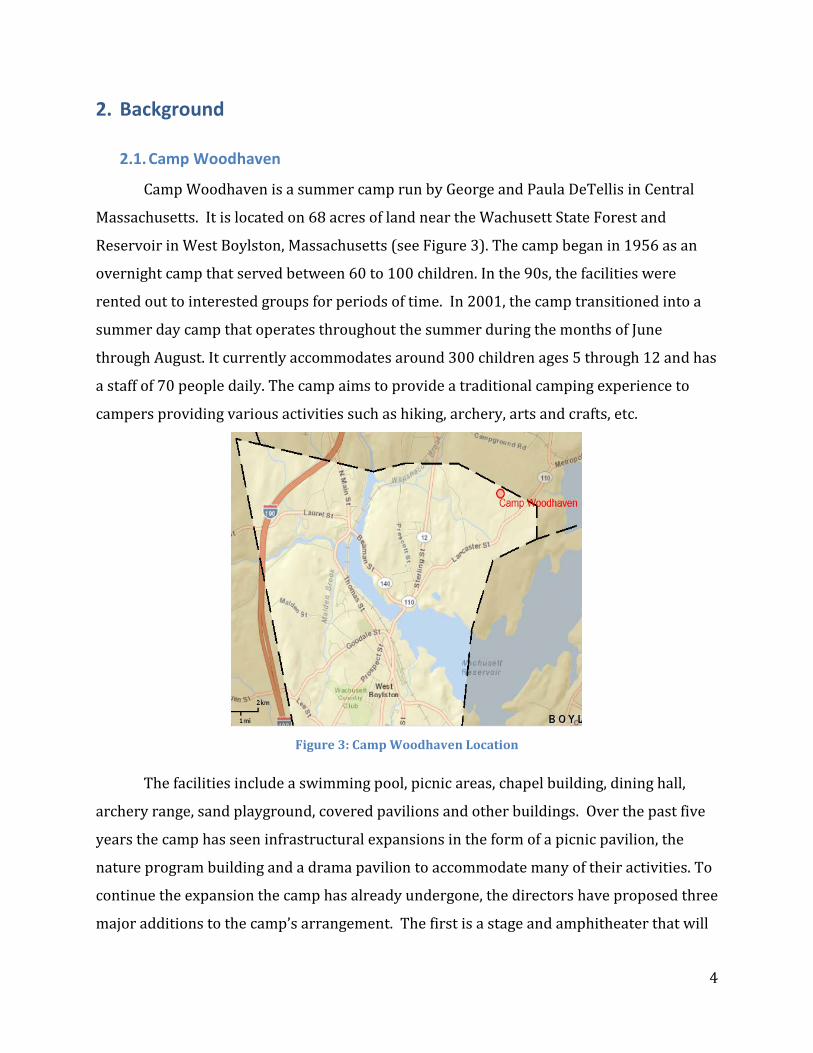
Camp Woodhaven is a summer camp run by George and Paula DeTellis in Central
Massachusetts. It is located on 68 acres of land near the Wachusett State Forest and
Reservoir in West Boylston, Massachusetts (see Figure 3). The camp began in 1956 as an
overnight camp that served between 60 to 100 children. In the 90s, the facilities were
rented out to interested groups for periods of time. In 2001, the camp transitioned into a
summer day camp that operates throughout the summer during the months of June
through August. It currently accommodates around 300 children ages 5 through 12 and has
a staff of 70 people daily. The camp aims to provide a traditional camping experience to
campers providing various activities such as hiking, archery, arts and crafts, etc.
Figure 3: Camp Woodhaven Location
The facilities include a swimming pool, picnic areas, chapel building, dining hall,
archery range, sand playground, covered pavilions and other buildings. Over the past five
years the camp has seen infrastructural expansions in the form of a picnic pavilion, the
nature program building and a drama pavilion to accommodate many of their activities. To
continue the expansion the camp has already undergone, the directors have proposed three
major additions to the camp’s arrangement. The first is a stage and amphitheater that will

5
serve as a location where the camp begins and ends every day. This space is intended to
accommodate opening/closing flag ceremonies, small concerts and other daily activities.
The second change the directors are planning is a covered pavilion that will serve as a
gathering hub for campers arriving and leaving the camp each day. Lastly, the owners seek
an improved access road to help alleviate traffic from overflowing onto the adjacent
neighborhood road.
2.2. Zoning
The proposed designs for the amphitheater and pavilion will need to be in
accordance with the Town of West Boylston Zoning By-laws. The campsite is located in the
single residence district. At this time, it is not clear whether a summer camp falls under
allowable or prohibited use in the by-laws because camp facilities are not listed specifically
in the Schedule of Use Regulations Table. If it is defined as prohibited then the camp is
designated as non-conforming use and will need to be in compliance with Section 1.4 of the
Zoning By-laws and may require the use of a special permit from the Board of Appeals of
the town. If the summer camp is defined as an allowable use then Section 3.6-B of the
Zoning By-laws applies and will require a site plan review from the planning board of the
town. Also, the designs will need to comply with the dimensional requirements for setbacks
shown in the table below (Table 1) for properties in the single residence district. In
addition, off-street parking and loading at the campsite will need to be in compliance with
Section 5.2 of the Zoning By-laws. Table 1: Dimensional Requirements in West Boylston
Minimum Yard (in feet)
District Min. Lot Size Min. Lot Frontage (in feet) Front Side Rear
Single Residence 40,000 sq ft 120 25 10 10
According to Mark Brodeur, a Building Inspector and Zoning Enforcement Officer
for the town of West Boylston, Camp Woodhaven will more than likely need to conduct a
Site Plan Review in order to construct the amphitheater. This process ensures that the

6
proposed project is a suitable development for the community and its environs. The steps
required for the procedure are shown in Figure 4.
Figure 4: Site Review Steps
The first step in the process requires a submission of the Preliminary Site Plan to
the Planning Board of the town. At this time a waiver can also be submitted. The second
step in the process is the submission of the Site Plan Review Application Form S, 12 copies
of the site plan drawn to an approved scale, fees and a list of the adjacent property owners.
Copies of the plan are then distributed by the Planning Board to the following agencies for
review and comment: Board of Health, Police Department, Sewer Department, Water
Department, Building Inspector, Conservation Commission, Superintendent of Streets and
Parks, Town Clerk, Fire Department Review Engineer, Municipal Lighting Plant and the
Planning Board. These agencies have 30 days to submit any comments to the Planning
Board. If no reply is received from these agencies then approval is assumed. The third step
in the process is the public hearing, which takes place within 65 days of the application
submission date. A final decision is made on the plan within 90 days of the hearing date.
This is done in accordance with the Massachusetts General Law Chapter 40A Sections 9 and
11. The Planning Board executes the final decision in writing, and the decision can either be
approval based on compliance with the law, disapproval based on a lack of compliance with
the standards present in the law or approval subject to certain specifications, which will
need to be adhered to. If the Planning Board does not take action within the highlighted
timeframe then approval can be assumed. At that point the Town Clerk would produce
1) Preliminary
Site Plan 2)Submittal of Site Plan
3) Public Hearing on Site Plans
7
certification stating that the Planning Board provided no action within the required
timeframe.
The Specifications for the contents of the Site Plan can be found in Section 3.6 of the
Town of West Boylston Zoning Bylaw.
2.3. Amphitheaters
Amphitheaters are structures that have been used for entertainment and
performances since the ancient Greek and Roman times. In order to develop the design of
an amphitheater, there are many factors that must be accounted for. Some of the
considerations for the amphitheater include the size, orientation, acoustics, stage, seating,
and lighting. The theater itself needs to be compact enough to account for the visual
limitations of spectators, but large enough to provide space for everyone (Waugh, 1917).
The orientation of the theater and stage needs to account for the effect of the sun on the
people on the stage and spectators. Also, because an amphitheater is situated outside, and
sound tends to dissipate in open space, acoustical considerations are very important.
Typically amphitheaters are designed with various sound amplification systems that
address this issue (Butler, 2002).
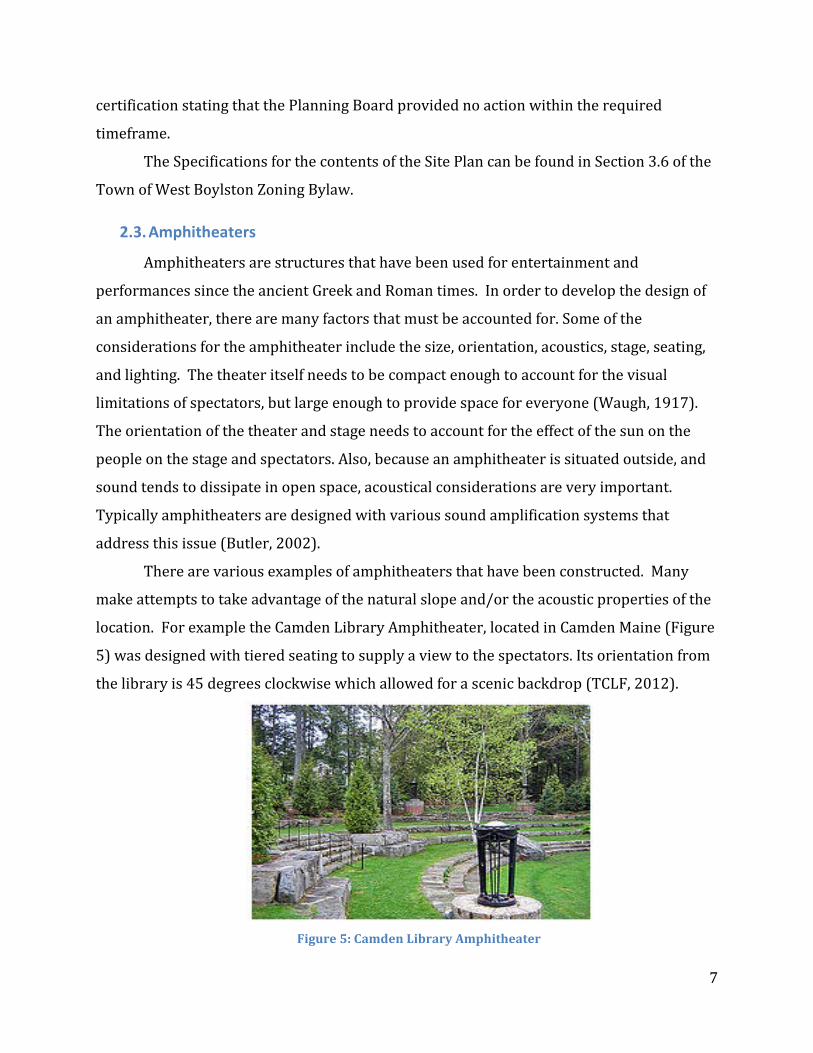
There are various examples of amphitheaters that have been constructed. Many
make attempts to take advantage of the natural slope and/or the acoustic properties of the
location. For example the Camden Library Amphitheater, located in Camden Maine (Figure
5) was designed with tiered seating to supply a view to the spectators. Its orientation from
the library is 45 degrees clockwise which allowed for a scenic backdrop (TCLF, 2012).
Figure 5: Camden Library Amphitheater

8
Another example of an amphitheater is the Quarry Amphitheater located in Cambridge,
Australia (Figure 6). It was constructed into the existing cliff using grass covered limestone
terraces to seat approximately 500 people.
Figure 6: Quarry Amphitheater
The figure shown below is the Nehalem Campground Amphitheater in the Nehalem Bay
State Park, Oregon (Figure 7). The amphitheater appears to be three seating sections that
use the existing slope of the site to provide spectators with a view of the performers on the
stage.
Figure 7: Nelhalem Campground Amphitheater
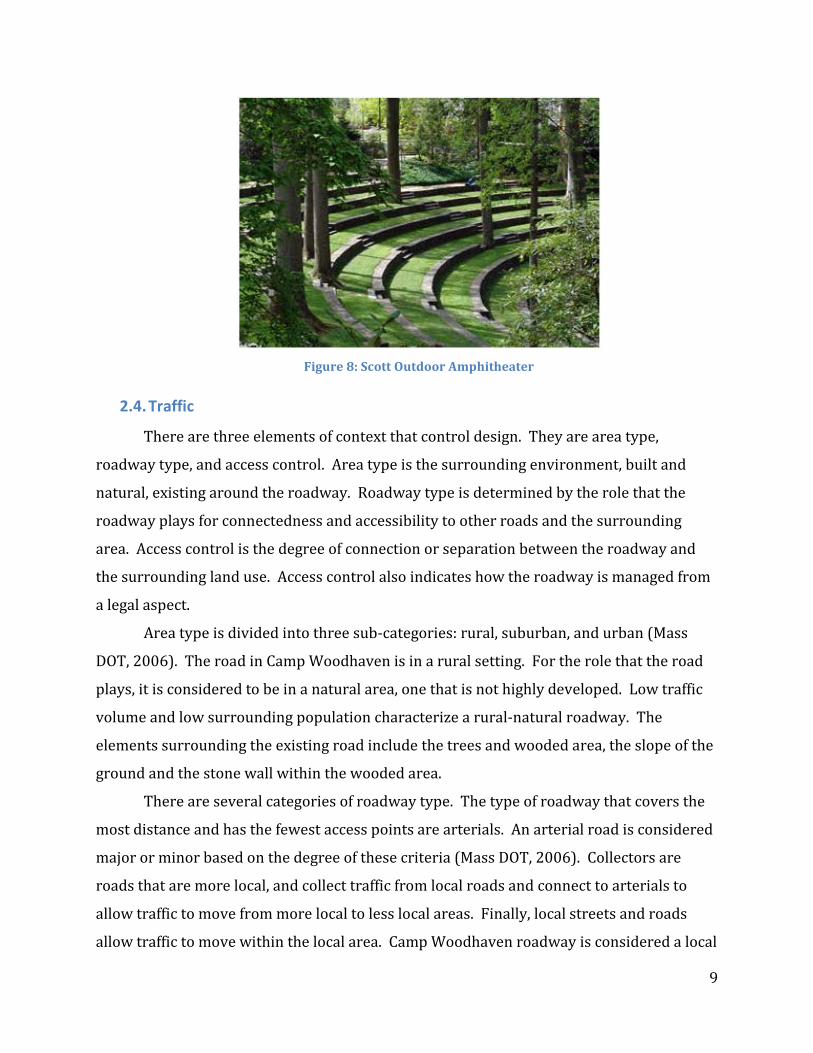
The Scott Outdoor Amphitheater at Swarthmore College shown below (Figure 8) is another
example of an amphitheater using terraces to alter the landscape and add an aesthetic
appeal to the campus.
9
Figure 8: Scott Outdoor Amphitheater
2.4. Traffic
There are three elements of context that control design. They are area type,
roadway type, and access control. Area type is the surrounding environment, built and
natural, existing around the roadway. Roadway type is determined by the role that the
roadway plays for connectedness and accessibility to other roads and the surrounding
area. Access control is the degree of connection or separation between the roadway and
the surrounding land use. Access control also indicates how the roadway is managed from
a legal aspect.
Area type is divided into three sub-categories: rural, suburban, and urban (Mass
DOT, 2006). The road in Camp Woodhaven is in a rural setting. For the role that the road
plays, it is considered to be in a natural area, one that is not highly developed. Low traffic
volume and low surrounding population characterize a rural-natural roadway. The
elements surrounding the existing road include the trees and wooded area, the slope of the
ground and the stone wall within the wooded area.
There are several categories of roadway type. The type of roadway that covers the
most distance and has the fewest access points are arterials. An arterial road is considered
major or minor based on the degree of these criteria (Mass DOT, 2006). Collectors are
roads that are more local, and collect traffic from local roads and connect to arterials to
allow traffic to move from more local to less local areas. Finally, local streets and roads
allow traffic to move within the local area. Camp Woodhaven roadway is considered a local

10
road. Low speeds and high local access determine this classification. The roadway of Camp
Woodhaven has less local circulation and access than most streets, but it is intended for
only those who are using the camp.
The area type and roadway type help determine the speed that vehicles can travel
on a given road. Table 2 shows the speeds of the types of roads. Table 2: Design Speed Ranges (Mass DOT, 2006)
Any modifications of the road must be dependent on the vehicles that will be
traveling on it. The spatial properties of average sized cars and school buses must be
considered during the design process. Table 3 displays the dimensions of common
vehicles.

11
Table 3: Design Vehicle Dimensions (Mass DOT, 2006)
The roadway of Camp Woodhaven is only open at one end so vehicles must be able to
turn around on the road. A cul-de-sac is a type of turnaround that has been common in
American suburbs in recent decades. Some organizations discourage the use of a cul-de-sac
when possible however, the conditions at Camp Woodhaven require a cul-de-sac (American
Planning Association-Massachusetts Chapter, 2011). Typically a cul-de-sac design will be
circular and symmetrical around the centerline of the street, but other designs are possible to
accommodate other conditions as seen in Figure 9 (Illinois DOT).
Figure 9: Circular (Left) & Offset (Right) Cul-de-sacs

12
The most important design constraint in this situation is that the largest vehicle that
can be anticipated must be able to use the cul-de-sac safely and comfortable. In this
situation a school bus is the largest vehicle that needs to be designed for.

13
3. Methodology
3.1. Site Analysis
3.1.1. Surveying
During the beginning stages of the project, multiple trips were taken to Camp
Woodhaven to gather information from the clients and information specific to the site. The
first trip to Camp Woodhaven consisted of our first meeting with both George and Paula
DeTellis, and included a tour of the site. From this trip the group was able to locate
benchmark points around the site for future use in surveying. A write-up of this meeting
can be found in Appendix B: Site Visit Write-Up 9-5-2012
The next week two members of the team went out to the site to perform the first
topographical survey of the hill, sections of the road, and other relevant points on the
property. Each individual shot was taken using a Trimble TS 305 total station and were
recorded in terms of horizontal distance (meters), vertical distance (meters), and reference
angle (00d00m00s). The individual benchmark reference points used were a nail in a
utility pole (BM1), a pin in the ground (BM2), the center of a manhole by the mess hall
(BM3), and the center of a manhole by the restroom (BM4). These benchmark points were
provided to the team by the client in an as-built septic field AutoCAD drawing from 1995
(see Appendix C: As-Built Septic Plan)
The survey was performed from three different locations across the site. The
purpose of the first two locations was to register the benchmark points to ensure accurate
elevations when entering the points into the computer. The other goal of these surveying
locations was to record the locations and elevations of corners of buildings and other
structures on the site to assist in the construction of a drawing of the camp. When arrived
at the third location on the hill and recorded any structures or buildings, the team surveyed
a grid of the hill to create an accurate profile of the area where the stage and amphitheater
were most likely to be located. Following the grid of the hill, the flat area further up the
right-a-way was surveyed as the potential location for the pavilion. The final task was to
survey the edges of the existing right-a-way. These measurements were done from the end
14
of the roadway to as far down the road visible from the instrument location. A complete
list of the points recorded can be seen in Appendix D: Survey Data Table 9-14-2012.
Following the survey and the organization of the recorded information, the
individual points were entered into an AutoCAD Civil 3D file and overlaid onto a pre-
existing map of the campground. After this, the points were collected in a surface using the
Civil 3D software and a set of contour lines were generated to show the elevation around
the camp.
In early November, the team made another trip to Camp Woodhaven to collect more
data from the site. This trip was focused on recording the width of the existing roadway.
The width of the roadway was measured at 50 foot intervals, and notes were made of the
locations of trees that were too close to the edge of the road, and may impede alterations.
3.1.2. Soil Analysis
In order to determine the types of soil present at Camp Woodhaven, the MQP team
utilized the ArcGIS software program. The MassGIS soils data layer for the Northeast region
of Worcester was used. The data for this soil data layer was gathered by the United States
Department of Agriculture (USDA) Natural Resources Conservation Service (NRCS) and has
been reviewed and approved by the NRCS.
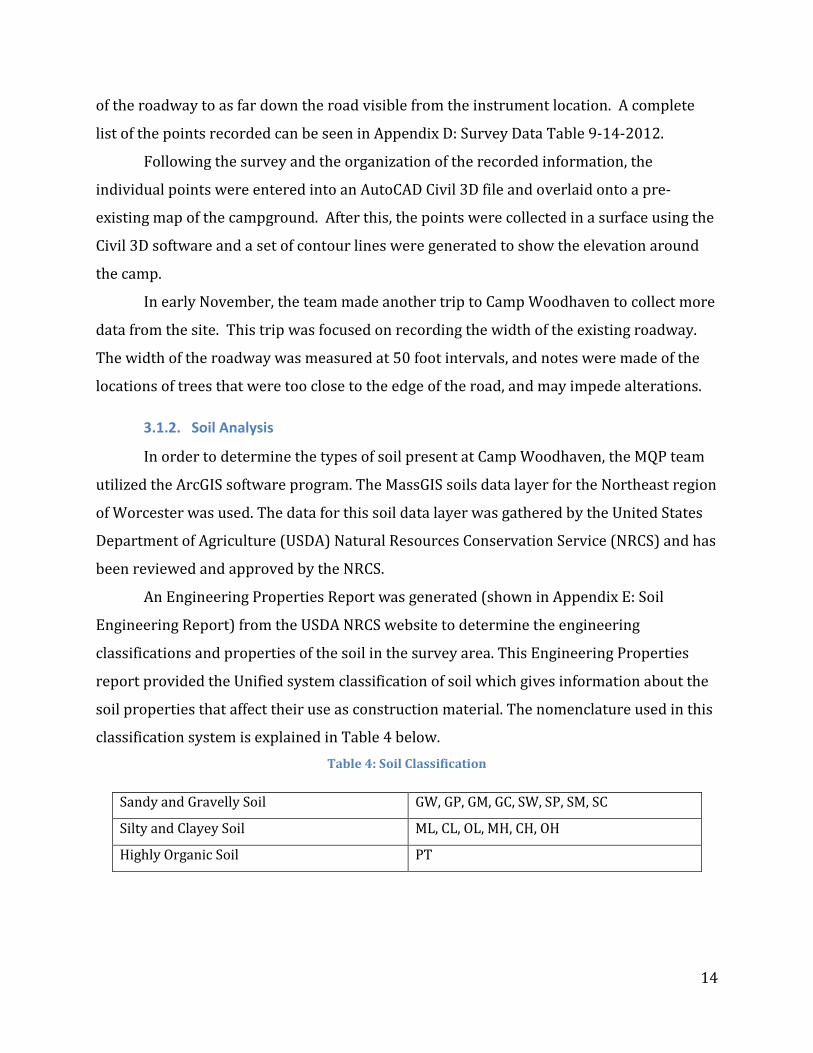
An Engineering Properties Report was generated (shown in Appendix E: Soil
Engineering Report) from the USDA NRCS website to determine the engineering
classifications and properties of the soil in the survey area. This Engineering Properties
report provided the Unified system classification of soil which gives information about the
soil properties that affect their use as construction material. The nomenclature used in this
classification system is explained in Table 4 below. Table 4: Soil Classification
Sandy and Gravelly Soil GW, GP, GM, GC, SW, SP, SM, SC
Silty and Clayey Soil ML, CL, OL, MH, CH, OH
Highly Organic Soil PT
15
3.2. Amphitheater
3.2.1. Preliminary Design
3.2.1.1. Original Layout Design
In order to develop a preliminary design of an amphitheater for Camp Woodhaven,
the site was surveyed to develop a contour map of the land. When the area surveyed was
mapped and contoured, a preliminary location for the stage and amphitheater was chosen.
With a preliminary size estimate of a 15ft by 30ft stage (derived from suggestions by the
client), a flat location for the stage was decided upon, with the amphitheater continuing up
the hill towards the existing dirt road.
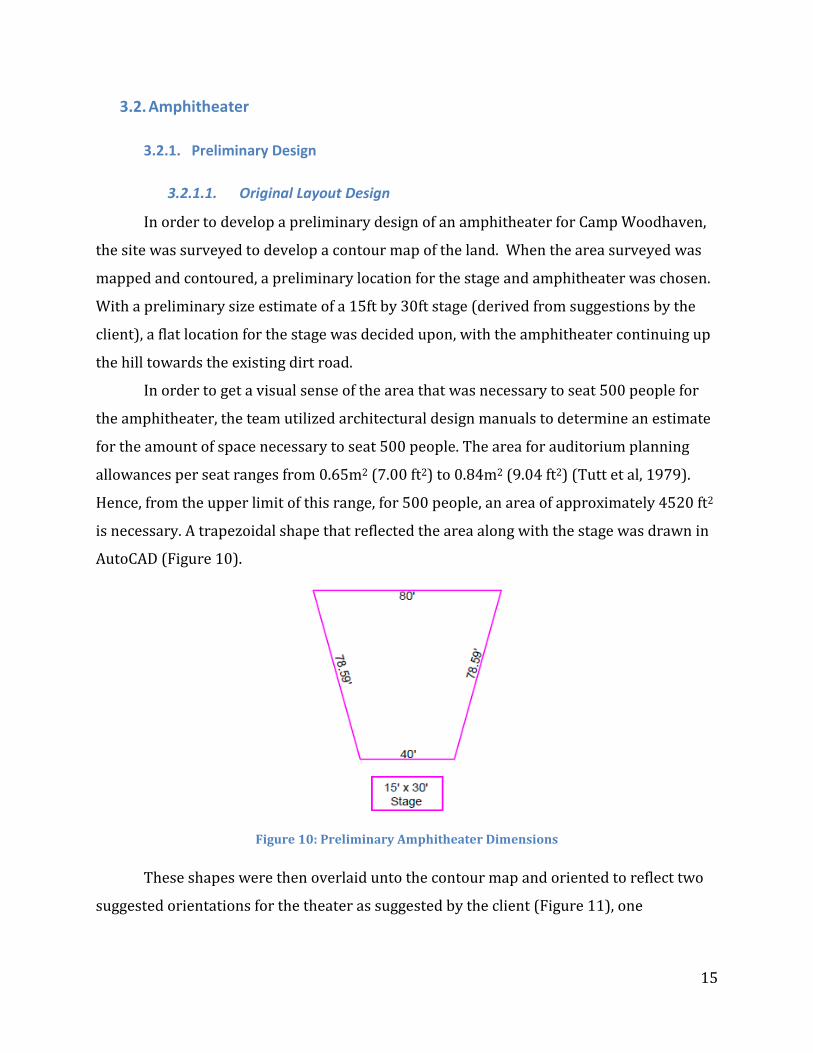
In order to get a visual sense of the area that was necessary to seat 500 people for
the amphitheater, the team utilized architectural design manuals to determine an estimate
for the amount of space necessary to seat 500 people. The area for auditorium planning
allowances per seat ranges from 0.65m2 (7.00 ft2) to 0.84m2 (9.04 ft2) (Tutt et al, 1979).
Hence, from the upper limit of this range, for 500 people, an area of approximately 4520 ft2
is necessary. A trapezoidal shape that reflected the area along with the stage was drawn in
AutoCAD (Figure 10).
Figure 10: Preliminary Amphitheater Dimensions
These shapes were then overlaid unto the contour map and oriented to reflect two
suggested orientations for the theater as suggested by the client (Figure 11), one

16
perpendicular to the road and one angled towards the rest of the existing buildings.
Orientation 1 was chosen to continue design with by group vote.
Figure 11: Proposed Amphitheater Orientation
Many assumptions were made in order to design the auditorium of the
amphitheater. The auditorium of an amphitheater is typically in a semicircular fashion
(Figure 12) with the degree of encirclement being 180° for Roman style theaters and 220°
for Greek style theaters (Strong, 2010).
Figure 12: Amphitheater Layout (Strong, 2010)
The MQP team wished to have a design with a similar format where the auditorium
encircled the stage. The design also needed to account for the sight and hearing limitations

17
for humans as well as comfort and ease of movement. The dimensional guidelines that the
team used are shown in Table 5 below. Table 5: Amphitheater Design Criteria
Design Criteria Dimension
Maximum distance for audience from the front of
the open stage (with spoken voice)
65.62ft (Strong, 2010)
Minimum width of seat without arms 1.5ft (Strong, 2010)
Minimum unobstructed aisle width 3.6ft (Strong, 2010)
Horizontal Distance on bench per person 1.5ft (Ramsey et al, 2000)
Clearance between each row 2.5ft (Ramsey et al, 2000)
These designs criteria constraints were used to develop the first amphitheater layout
shown in Figure 13.
Figure 13: Amphitheater Option I Layout
The MQP team planned a design with radial aisles, which would in turn make wedge
shaped or trapezoidal seating sections, creating the effect of encirclement around the stage.
In order to determine the number of rows, a 65.62ft limit was used (Table 5 above). This
limit is the maximum distance from the stage where a person who is seated in the audience

18
can still hear someone on the stage speaking without microphones; hence all people in the
auditorium need to be within this limit of the stage to hear properly. It was also determined
that with the row spacing limits from Table 5, 10 rows of people could be accommodated
within the above mentioned distance limit. At this point the team then needed to determine
how many people could be accommodated in each section. A trial and error approach was
used to determine the final capacity. Knowing that each person would need a horizontal
distance of 1.5ft on a bench (Table 5 above), and knowing that as the distance increased
from the stage that each row would hold more people than the previous in order to achieve
the trapezoidal shape, the capacity of each section was determined. The team decided that
each row could be designed to hold 2 more people than the previous to achieve this shape.
For example the first row of Section B can accommodate 9 people. Each subsequent row in
the section can accommodate an additional 2 people. For a total of 10 rows, this section can
hold 180 people (Figure 14).
Figure 14: Section B Row Dimensions
A similar method was used to determine the capacity of the other sections. Section
A and C were both drafted with a 10.5ft first row capable of seating 7 people. Subsequent
rows were designed to accommodate 2 additional people, resulting in a total capacity of
160 people for both sections. The three sections were rotated radially to make the stage
the focal point, with a 4ft aisle separating the sections.

19
In addition to amphitheater Option I, the team designed two other layouts so they
could be evaluated and the best design be selected for recommendation. The idea behind
Option II was to access more of the land between the proposed stage location and the
existing right-of-way. The solution was to create a layout that included two sections,
instead of three, each having more rows, extending further back up the hill. The downfall
of this design was the exceeding of the 65ft audible limit mentioned above. This would
mean an acoustic amplification device would be required if this alternative was selected.
The goal of each section was to hold 250 people. Holding constant the design constraint of
1.5ft of bench per person, the first row was designed to hold 10 people, and subsequent
rows held 1 person more than the previous row. Similarly to Option I this alternative was
designed with a 4ft aisle that turns the two sections to face the stage. The layout of Option
II can be seen below in Figure 15.
Figure 15: Amphitheater Option II Layout
The clients suggested the third layout to the team. They found appeal in photos of
round amphitheaters they had seen online so this became the idea behind the third design.
The design process began with deciding an angle of 120 degrees for the seating. The
second step was to design the first row for 20 people. Each row behind that can
accommodate 6 more people, so rows were added until the amphitheater could hold
20
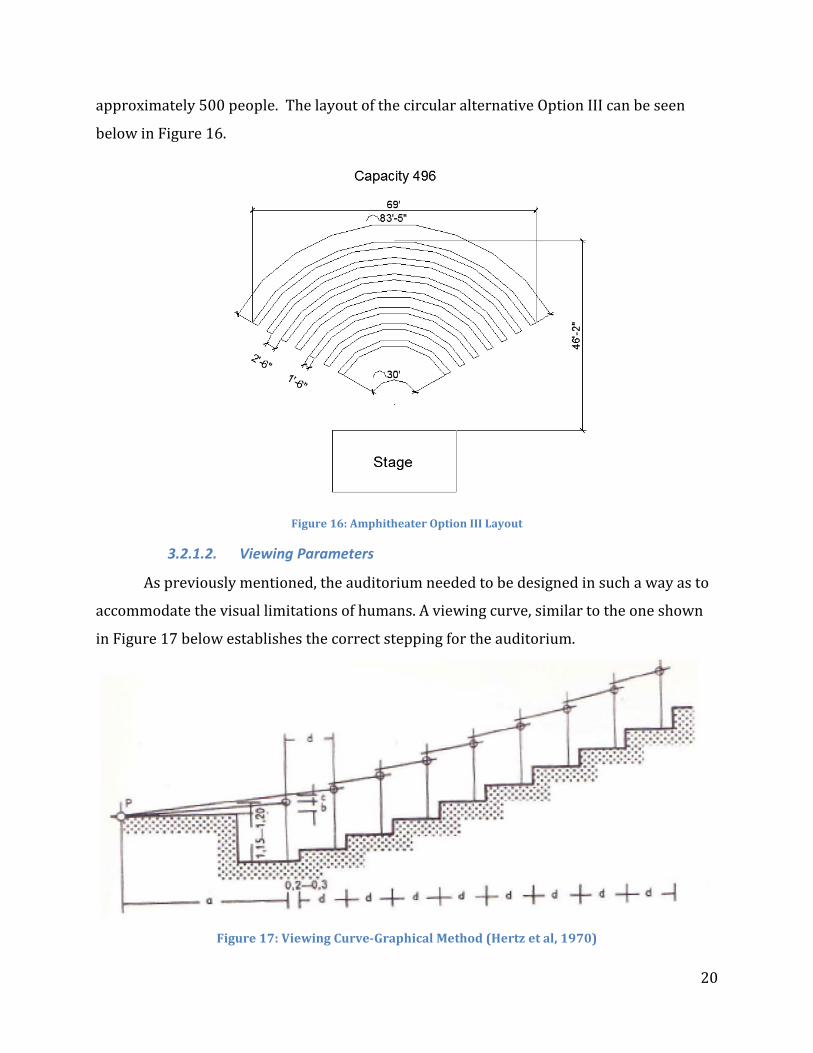
approximately 500 people. The layout of the circular alternative Option III can be seen
below in Figure 16.
Figure 16: Amphitheater Option III Layout
3.2.1.2. Viewing Parameters
As previously mentioned, the auditorium needed to be designed in such a way as to
accommodate the visual limitations of humans. A viewing curve, similar to the one shown
in Figure 17 below establishes the correct stepping for the auditorium.
Figure 17: Viewing Curve-Graphical Method (Hertz et al, 1970)

21
‘P’ in the above figure is the point of sight, the lowest point, which is to be clearly
visible on the stage by people seated in the auditorium (Strong, 2010). The distance ‘a’ is
the horizontal distance between ‘P’ and the eye of the person seated in the first row. A
typical design parameter for the distance ‘a’ is 16.5ft (Herz et al, 1970). The distance ‘d’
represents the row depth, which is typically between 2ft 8in and 3ft (Herz et al, 1970). The
‘c’ shown in the diagram represents the vertical change of the eye level between each row
and this value can range from 2.5in to 5in (Herz et al, 1970). The notation 1.15-1.20 shown
in Figure 17 above represents the eye level height above the floor level in meters (3ft 9in-
3ft 11in) of a seated person and the notation 0.2-0.3 represents the horizontal distance
between the seated person’s eye and the riser (for this amphitheater, the seat) in meters
(7.8in- 11.8in) (Herz et al, 1970).
A similar procedure was followed to determine a minimum viewing curve of Section
B of the Option I (Figure 18). A rise in eye level of 5in. for each row was plotted
continuously relative to the reference point ‘P’. Generally ‘P’ is located at the setting line 3ft
back from the proscenium in a theater (Strong, 2010). However, this amphitheater does not
have a proscenium so it was assumed that the point of sight (P) was 3ft back from the start
of the stage. It was also assumed that the horizontal distance from the eye and the riser is
11in, which is within the range mentioned above.
Figure 18: Viewing Curve
The actual height of each step used in every amphitheater layout was decided upon
at 11in. Since this height creates a higher slope to the amphitheater seating than the
minimum viewing curve discussed above, there will be ample height to provide all
22
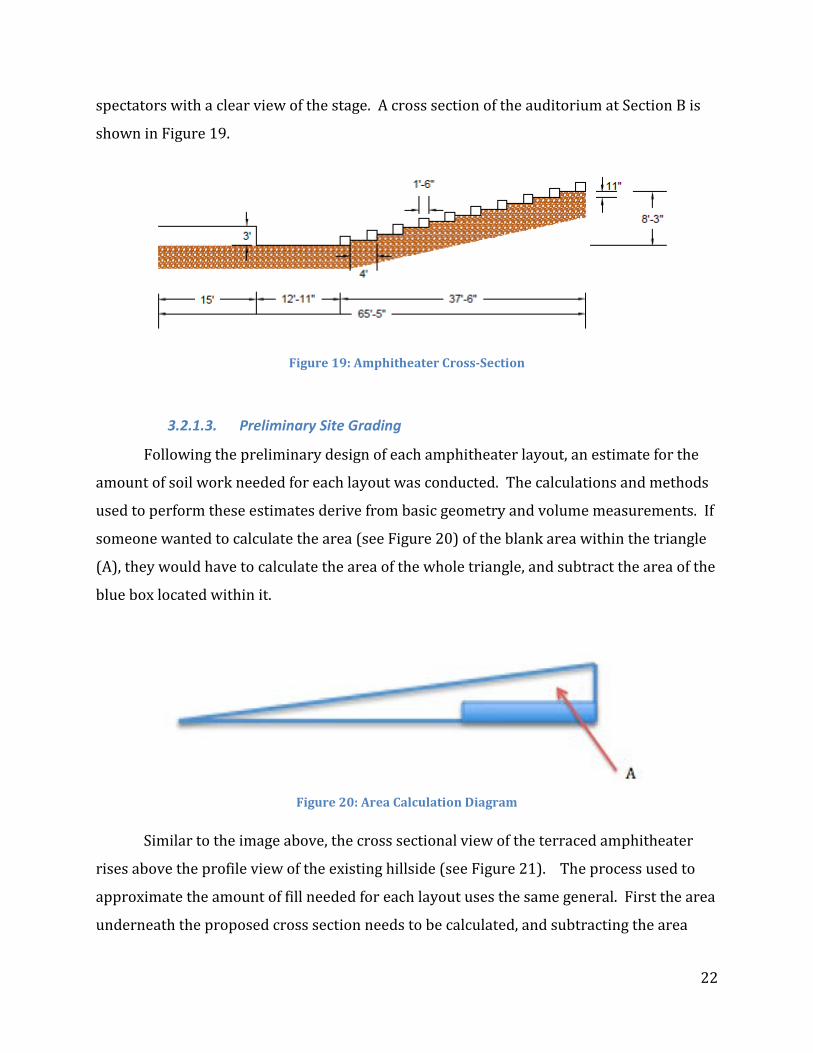
spectators with a clear view of the stage. A cross section of the auditorium at Section B is
shown in Figure 19.
Figure 19: Amphitheater Cross-Section
3.2.1.3. Preliminary Site Grading
Following the preliminary design of each amphitheater layout, an estimate for the
amount of soil work needed for each layout was conducted. The calculations and methods
used to perform these estimates derive from basic geometry and volume measurements. If
someone wanted to calculate the area (see Figure 20) of the blank area within the triangle
(A), they would have to calculate the area of the whole triangle, and subtract the area of the
blue box located within it.
Figure 20: Area Calculation Diagram
Similar to the image above, the cross sectional view of the terraced amphitheater
rises above the profile view of the existing hillside (see Figure 21). The process used to
approximate the amount of fill needed for each layout uses the same general. First the area
underneath the proposed cross section needs to be calculated, and subtracting the area

23
underneath the existing slope from this results in the required fill. The method for
calculating the fill for each section Options I and II were similar because of their trapezoidal
shape, whereas the method for Option III was different because of its circular shape.
Figure 21: Design & Existing Slope Profile
In each layout, the total area underneath the proposed design was calculated as the
sum of the depth (h) multiplied by the height (H) of each individual terrace (see Figure 22).
The volume was then found by multiplying of that area by the length of each terrace.
Figure 22: Option I & II Terrace Calculation
In Layouts A and B, each seating section is shaped like a trapezoid. The area of a trapezoid
is equivalent to half the sum of the bases (b1, b2) multiplied by the depth (h) of the
trapezoid (see Figure 23).
Figure 23: Trapezoid Geometry (http://www.calculateme.com/cArea/area-of-trapezoid.gif)
To find the volume of a section of the proposed design for Options I and II, the following
equation was used:

24
𝑉𝑜𝑙𝑢𝑚𝑒 =12∗ (𝑏1 + 𝑏2) ∗�ℎ ∗ 𝐻
The calculations for Option III were different because of its shape. In this layout the
general shape is a third of a full circle. A reoccurring portion of the calculations for Option
III dealt with the area between two concentric circles (seen in red in below Figure 24). The
equation for this area can be seen below:
𝐴𝑟𝑒𝑎 = 𝜋(𝑅2 − 𝑟2)
Figure 24: Area Between Concentric Circles
Different to Options I and II, the volume of soil underneath Option III consisted of the sum
of the area of each terrace multiplied by the respective height (see Figure 25) of each
terrace. The equation used to calculate this volume can be seen below:
𝑉𝑜𝑙𝑢𝑚𝑒 =13𝜋�[(𝑅2 − 𝑟2) ∗ 𝐻]
Figure 25: Option III Design Calculation

25
In each layout option the area underneath the existing hill (A) was calculated with
the “measure area” function in AutoCAD using a cross section from the contours generated
following the land survey.
For Options I and II the same trapezoid equation was utilized using the area (A) as a
substitute for the depth and height variables. Also since “A” covers the entire depth of the
layout, the largest and smallest base lengths were used as b1 and b2 respectively. The
volume underneath the existing hill for each section of Options I and II was calculated using
the following equation:
𝑉𝑜𝑙𝑢𝑚𝑒 =12∗ (𝑏1 + 𝑏2) ∗ 𝐴
Similarly to Options I and II, the volume of soil underneath the existing slope in
Option III was calculated by using slope profiles. To increase accuracy in Option III, two
profiles were used that divided the circular section into two equal parts. To account for the
unusual shape of this layout, it was concluded that the volume would be equivalent to the
area between the outermost edge of the last bench and the inner edge of the first bench
multiplied by an average height that acted over the depth of the design. Using the AutoCAD
“measure area” function, the area beneath the profile line was measured. To get the
average height, this measured area was divided by the depth of the layout. The final
equation to calculate the volume of soil due to the existing hill can be seen below:
𝑉𝑜𝑙𝑢𝑚𝑒 =13𝜋�[(𝑅2 − 𝑟2) ∗
𝐴𝑅 − 𝑟
]
Using this method total fill volumes of 7864cuft, 7078cuft, and 2395.78cuft were
calculated for Options I, II, and III respectively. The supporting figures, profile lines, and
calculations for all three layouts can be found in Appendix F: Preliminary Site Grading
Calculations.
3.2.2. Design Evaluation
To choose the amphitheater option that best addresses the needs of the client, the
team developed a list of criteria and graded each alternative. Each layout option was
evaluated on the following criteria: capacity of amphitheater, length of benches required,
square footage occupied by the layout (land use), estimated amount of soil needed to be
excavated, aesthetics, and constructability of each layout. Each criterion was given a

26
weight value to correspond with its importance and how the criterion addresses the needs
of the client. Total scores for each layout was determined by the sum of the grades (range
1-5) multiplied by the weight (range 1-3) for each individual criterion (Table 6 below). Table 6: Amphitheater Grading Criterion
Criteria Weight
Capacity 3
Length of benches needed 2
Land Use 1
Soil Excavation 2
Aesthetics 2
Constructability 3
Since each alternative was designed to seat close to 500 people, the capacity scores
were similar. Options I and III earned scores of 5 because they met the capacity need and
Option II missed the mark, earning a score of 3. Length of benches needed for the design is
directly related to the price of material and labor for purchasing and installing seating;
therefore a lower length earns a higher score. Option II (4 points) scored highest with
Option I (3 points) closely and Option III (2 points) scored lowest due to its complicated
shape. In the land use category, Option III (1593 sqft) scores highest with 5 points, II (2466
sqft) scores 3 points, and I (3176 sqft) scored the least with 1 point in this category.
Following a preliminary estimate of the volume of cut/fill needed, the alternatives were
scored awarding more points for less soil movement. Option III (~2500 cuft) scored 4
points, followed by II (~7000 cuft) with 3 points, and finally I (~8000 cuft) with a score of
2. The aesthetics of each alternative was evaluated by group vote, with Option III scoring 5
points, Option I scoring 4 points and II, being reminiscent of a church more than a
campground amphitheater, scoring 2 points. Options I and II earned 4 and 5 points in the
constructability category respectively because they seem straightforward to construct and
grade. The team awarded Option III one point due to the complications that could arise
from the circular layout of the design. The full evaluation table with justifications for each
grade is shown below (Table 7).

27
Table 7: Amphitheater Evaluation Table
Criteria Description Option I (Radial with 3 sections)
Option II (Radial with 2 sections)
Option III (Semi-
circular) Capacity How close to the projected
500 person capacity the design seats
500 480 496
Length of Benches Needed
Number of feet of benches required in the design
750 720 742 (curved)
Land Use Number of square feet occupied by each layout
3176.5 2465.9 1593.1
Soil Excavation Estimated amount of soil in cubic feet needed to be excavated (cubic ft)
~8000 ~7000 ~2500
Aesthetics Group’s rating of appealing visual aspects of layout
Appealing Not appealing Very appealing
Constructability Group’s rating of ease of construction of each layout
Easy Easiest Difficult
After all the scores were weighted and added together, Option I narrowly scored the
highest with 46 points, with II and III tying at 45 points (see Table 8). Even though the
margin was very slim the team has decided to continue into the final design phase with
Option I based on this evaluation and the opinion of the client. Table 8: Summary of Amphitheater Evaluation
Criteria Weight
Option I
(Radial with
3 sections)
Option II
(Radial with
2 sections)
Option III
(Semi-circular)
Capacity 3 5 3 5
Length of
benches needed 2 3 4 2
Land Use 1 1 3 5
Soil Excavation 2 1 2 4
Aesthetics 2 4 2 5
Constructability 3 4 5 1
Total 46 45 45

28
3.2.3. Design Details
After evaluating the layout alternatives, Option I was selected to continue to the
final design phase. As suggested by the group advisors, an updated cross sectional layout
was designed. An issue with the original step design included the amount of labor required
to create stable terraces. Adjusting the layout to minimize the issue, while maintaining
many of the original design parameters, it was suggested to create half the original number
of terraces. Each of these terraces would be twice as deep (8’) and also twice as tall (22”).
To keep the amount of seating provided the same, the group decided to designate the
retaining wall as a row of seats and to install benches in the middle of each terrace. The
cross-section depicting this layout can be seen in Figure 26 below.
Figure 26: Adjusted Amphitheater Cross-Section
3.2.3.1. Final Grading
In order to grade the amphitheater design that was selected, the AutoCAD Civil 3D
software program was utilized. The surveying points that were obtained from the total
station were imported into the program and used to create an existing ground surface
model. In order to create the model, the point data was placed into a text file and then
imported into the program. A point in AutoCAD Civil 3D denotes a singular location in
space with an elevation, northing and easting coordinates. These points were used to
create a surface. Surfaces in AutoCAD Civil 3D represent existing and proposed terrain
conditions. Once the surface was created, the plan view of the amphitheater was imported
into the program as seen below in Figure 27.
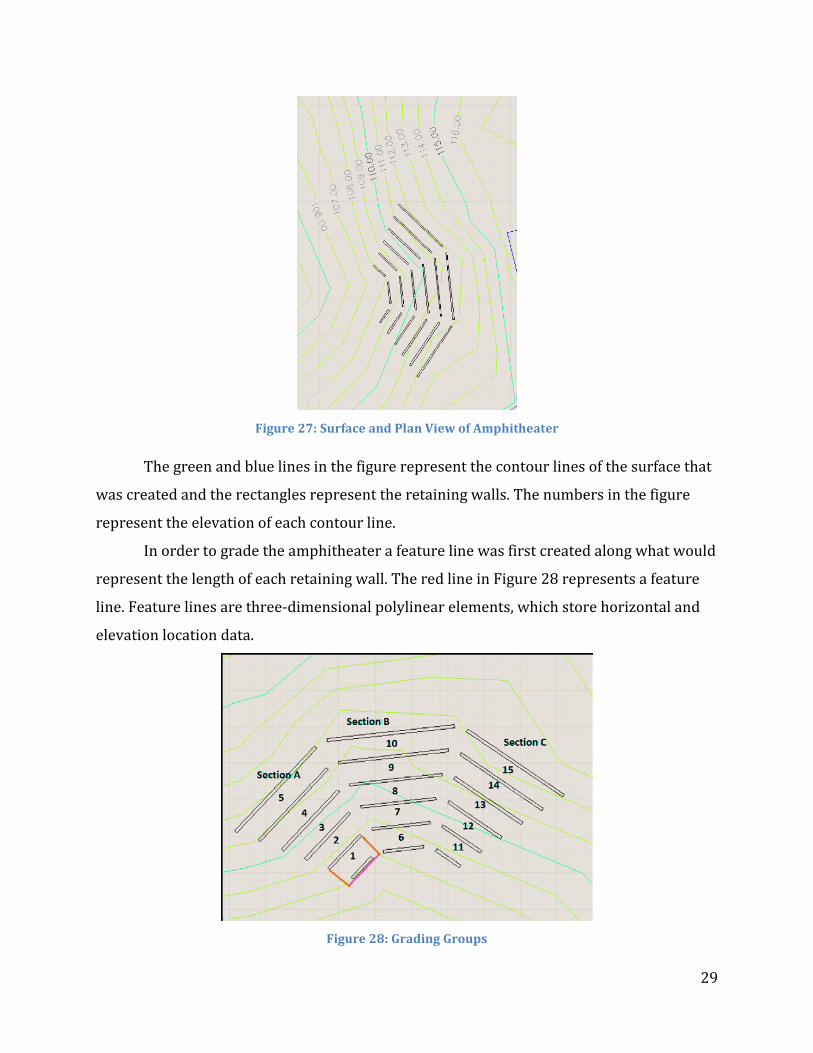
29
Figure 27: Surface and Plan View of Amphitheater
The green and blue lines in the figure represent the contour lines of the surface that
was created and the rectangles represent the retaining walls. The numbers in the figure
represent the elevation of each contour line.
In order to grade the amphitheater a feature line was first created along what would
represent the length of each retaining wall. The red line in Figure 28 represents a feature
line. Feature lines are three-dimensional polylinear elements, which store horizontal and
elevation location data.
Figure 28: Grading Groups

30
The elevation of each feature line was then edited to contain the proposed elevation
of the retaining wall. Grading objects were created from the feature lines and stored in
grading groups. The grading objects were used to specify where and how the site grading
was going to take place. In the case of the amphitheater, a flat surface needed to be created
between each retention wall. The ‘grade to distance’ tool was used to perform this
operation. The enclosed shape around the number 1 in Figure 28 represents a grading
group. The resulting cut and fill volumes that were generated from grading this flat surface
between each retaining wall was stored in a grading group. A total of 15 grading groups
were created in order to establish the cut and fill volumes. The table below shows the
results of the cut and fill volume calculations that were obtained in AutoCAD Civil 3D
(Table 9). From these calculations, the total cut volume is 0 Cu. Yd. and the total fill volume
is 455.06 Cu. Yd. Table 9: Civil 3D Cut & Fill Calculations
Section A (Cu. Yd.) Section B (Cu. Yd.) Section C (Cu. Yd.)
Grading
Group
Cut
Volume
Fill
Volume
Grading
Group
Cut
Volume
Fill
Volume
Grading
Group
Cut
Volume
Fill
Volume
1 0 6.82 6 0 5.77 11 0 3.64
2 0 16.07 7 0 10.9 12 0 13.98
3 0 23.66 8 0 34.77 13 0 29.76
4 0 51.61 9 0 52.39 14 0 47.67
5 0 26.4 10 0 69.78 15 0 61.84
Total 0 124.56 Total 0 173.61 Total 0 156.89
In addition to using the AutoCAD Civil 3D software, calculations were performed by
hand for Section A to verify the accuracy of the software. The hand calculations were
completed using a method similar to the Preliminary Grading Section. In these calculations
three profile lines were used to calculate the volume underneath the existing hill (Figure
29).
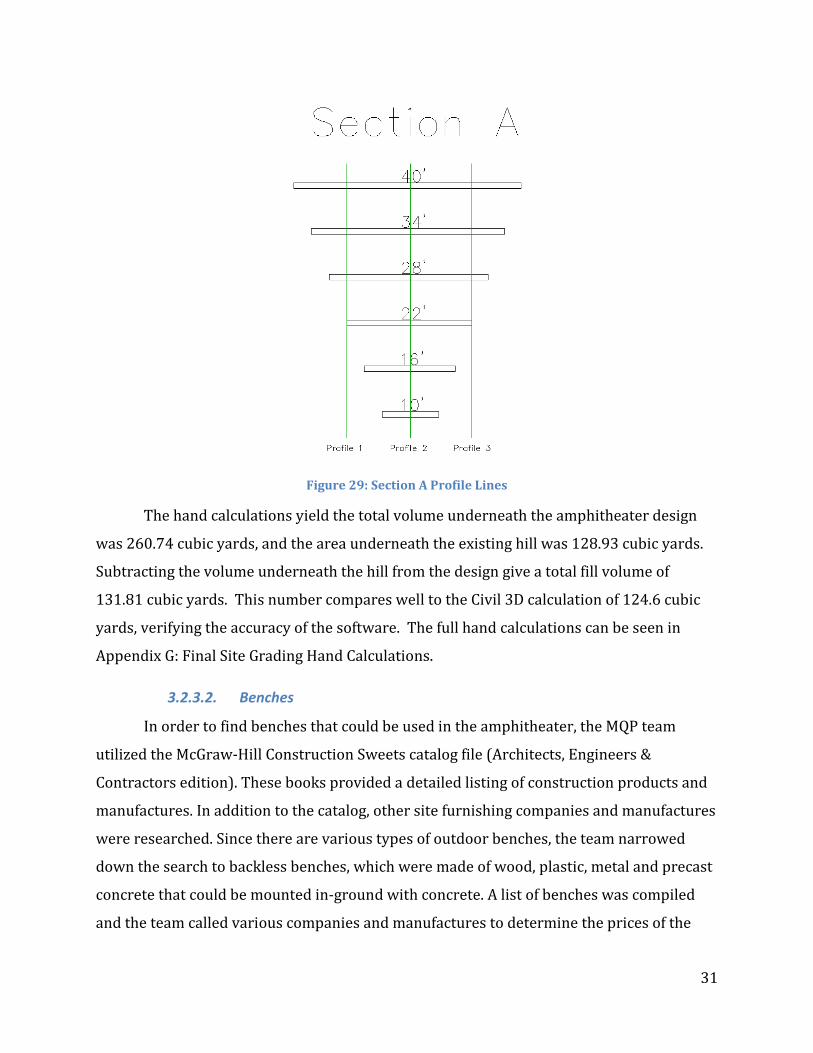
31
Figure 29: Section A Profile Lines
The hand calculations yield the total volume underneath the amphitheater design
was 260.74 cubic yards, and the area underneath the existing hill was 128.93 cubic yards.
Subtracting the volume underneath the hill from the design give a total fill volume of
131.81 cubic yards. This number compares well to the Civil 3D calculation of 124.6 cubic
yards, verifying the accuracy of the software. The full hand calculations can be seen in
Appendix G: Final Site Grading Hand Calculations.
3.2.3.2. Benches
In order to find benches that could be used in the amphitheater, the MQP team
utilized the McGraw-Hill Construction Sweets catalog file (Architects, Engineers &
Contractors edition). These books provided a detailed listing of construction products and
manufactures. In addition to the catalog, other site furnishing companies and manufactures
were researched. Since there are various types of outdoor benches, the team narrowed
down the search to backless benches, which were made of wood, plastic, metal and precast
concrete that could be mounted in-ground with concrete. A list of benches was compiled
and the team called various companies and manufactures to determine the prices of the

32
benches. The compiled list is shown in Appendix H: Bench Manufacturers & Products List.
In order to choose an economical bench, the team calculated the cost per foot for each
bench and sorted the list from the cheapest to the most expensive solution (Appendix I:
Bench Rank by Cost per Foot).
Based on this list, the most economical solution is to use the Wabash Valley
signature series benches. However, based on the original dimensions for the length of the
rows for Amphitheater A (Table 10), the length of the benches for the Wabash Valley
signature series (6ft, 10ft and 15ft) would not be suitable. Hence the MQP team decided to
modify the dimensions of the rows in the amphitheater so that the Wabash Valley benches
could be used (Table 11). Table 10: Old Seating Dimensions Option I
Row Type Section A (feet)
Section B (feet)
Section C (feet)
1 Retaining Wall 10.5 13.5 10.5
2 Bench 13.5 16.5 13.5
3 Retaining Wall 16.5 19.5 16.5
4 Bench 19.5 22.5 19.5
5 Retaining Wall 22.5 25.5 22.5
6 Bench 25.5 28.5 25.5
7 Retaining Wall 28.5 31.5 28.5
8 Bench 31.5 34.5 31.5
9 Retaining Wall 34.5 37.5 34.5
10 Bench 37.5 40.5 37.5
Table 11: Updated Dimensions Option I
Row Type Section A (feet)
Section B (feet)
Section C (feet)
1 Retaining Wall 10 14 10
2 Bench 15 16 15
3 Retaining Wall 16 20 16
33
4 Bench 20 22 20
5 Retaining Wall 22 26 22
6 Bench 26 28 26
7 Retaining Wall 28 32 28
8 Bench 32 34 32
9 Retaining Wall 34 38 34
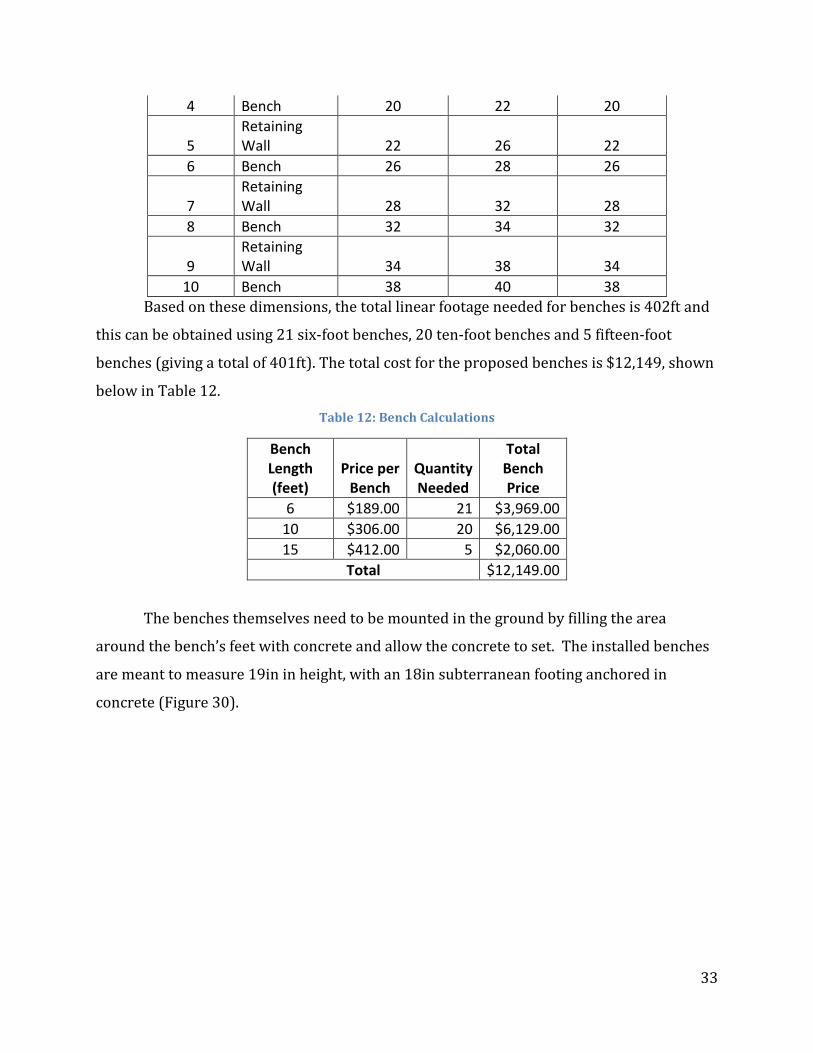
10 Bench 38 40 38 Based on these dimensions, the total linear footage needed for benches is 402ft and
this can be obtained using 21 six-foot benches, 20 ten-foot benches and 5 fifteen-foot
benches (giving a total of 401ft). The total cost for the proposed benches is $12,149, shown
below in Table 12. Table 12: Bench Calculations
Bench Length (feet)
Price per Bench
Quantity Needed
Total Bench Price
6 $189.00 21 $3,969.00 10 $306.00 20 $6,129.00 15 $412.00 5 $2,060.00
Total $12,149.00
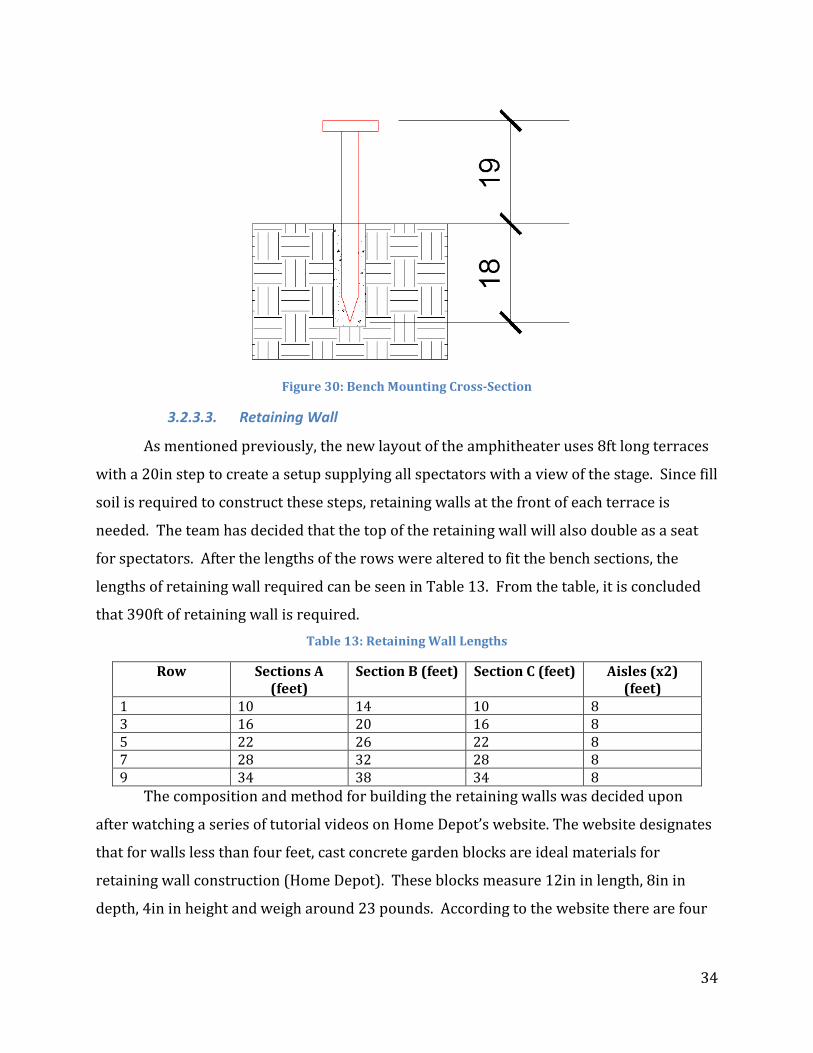
The benches themselves need to be mounted in the ground by filling the area
around the bench’s feet with concrete and allow the concrete to set. The installed benches
are meant to measure 19in in height, with an 18in subterranean footing anchored in
concrete (Figure 30).
34
Figure 30: Bench Mounting Cross-Section
3.2.3.3. Retaining Wall
As mentioned previously, the new layout of the amphitheater uses 8ft long terraces
with a 20in step to create a setup supplying all spectators with a view of the stage. Since fill
soil is required to construct these steps, retaining walls at the front of each terrace is
needed. The team has decided that the top of the retaining wall will also double as a seat
for spectators. After the lengths of the rows were altered to fit the bench sections, the
lengths of retaining wall required can be seen in Table 13. From the table, it is concluded
that 390ft of retaining wall is required. Table 13: Retaining Wall Lengths
Row Sections A (feet)
Section B (feet) Section C (feet) Aisles (x2) (feet)
1 10 14 10 8 3 16 20 16 8 5 22 26 22 8 7 28 32 28 8 9 34 38 34 8
The composition and method for building the retaining walls was decided upon
after watching a series of tutorial videos on Home Depot’s website. The website designates
that for walls less than four feet, cast concrete garden blocks are ideal materials for
retaining wall construction (Home Depot). These blocks measure 12in in length, 8in in
depth, 4in in height and weigh around 23 pounds. According to the website there are four
35
basic steps to constructing a retaining wall with cast concrete blocks: prepare site, prepare
base, lay stones and cut the stones (Home Depot).
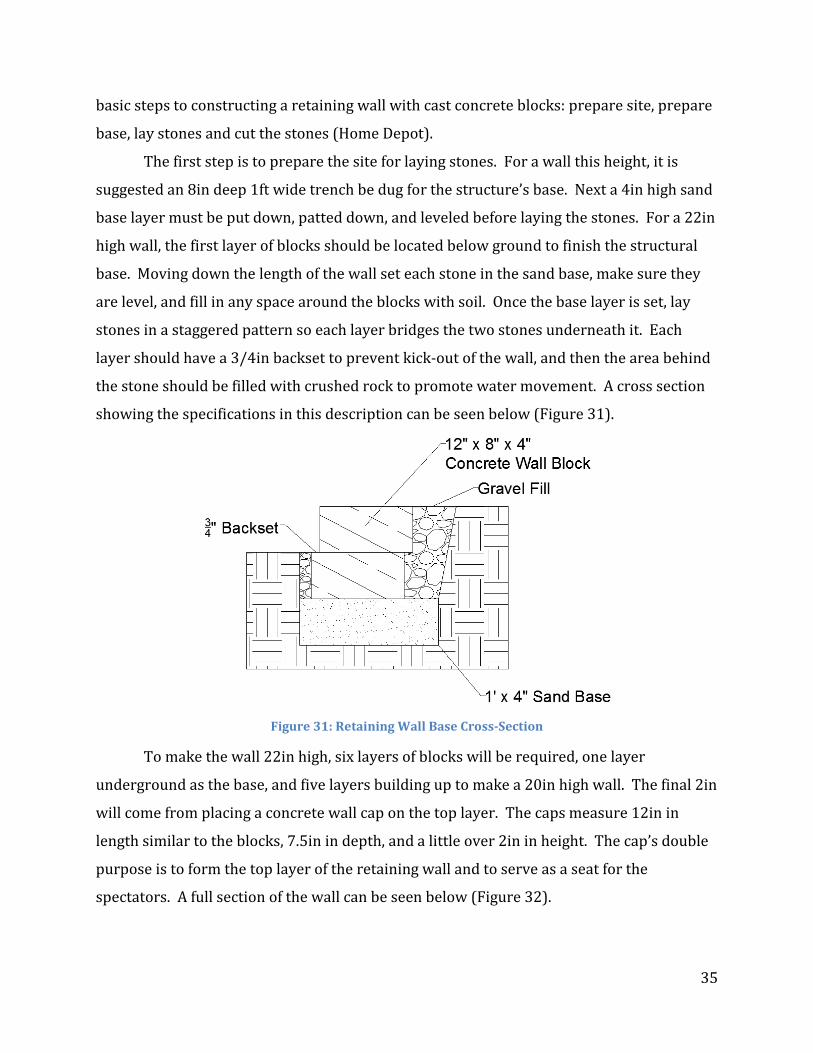
The first step is to prepare the site for laying stones. For a wall this height, it is
suggested an 8in deep 1ft wide trench be dug for the structure’s base. Next a 4in high sand
base layer must be put down, patted down, and leveled before laying the stones. For a 22in
high wall, the first layer of blocks should be located below ground to finish the structural
base. Moving down the length of the wall set each stone in the sand base, make sure they
are level, and fill in any space around the blocks with soil. Once the base layer is set, lay
stones in a staggered pattern so each layer bridges the two stones underneath it. Each
layer should have a 3/4in backset to prevent kick-out of the wall, and then the area behind
the stone should be filled with crushed rock to promote water movement. A cross section
showing the specifications in this description can be seen below (Figure 31).
Figure 31: Retaining Wall Base Cross-Section
To make the wall 22in high, six layers of blocks will be required, one layer
underground as the base, and five layers building up to make a 20in high wall. The final 2in
will come from placing a concrete wall cap on the top layer. The caps measure 12in in
length similar to the blocks, 7.5in in depth, and a little over 2in in height. The cap’s double
purpose is to form the top layer of the retaining wall and to serve as a seat for the
spectators. A full section of the wall can be seen below (Figure 32).

36
Figure 32: Full Retaining Wall Section
To construct this retaining wall there are four major materials that need to be
purchased. Starting with the base layer, 1ft wide by 4in deep of the trench needs to be
filled with sand. For a length of 390ft of wall, 130 cubic feet of sand is required. Next six
layers of concrete blocks require 2340 blocks, and one layer of concrete caps requires 390
caps. Home Depot quotes each of these items at $1.88 per item, resulting in a price of about
$4400 for blocks and $735 for caps (Home Depot). The final component for construction of
the retaining wall is the gravel used to fill behind the stones and allow water flow. For
every linear foot of wall, it is estimated an average of 0.7 cubic feet of gravel will be needed
to fill behind the stones, meaning an estimated 273 cubic feet of gravel for the entire length
of wall. A summary table containing the material information for the retaining wall can be
seen below (Table 14). Table 14: Summary of Retaining Wall Material
Material Amount Needed
Sand Base Layer 130 Cubic Feet
Concrete Blocks 2340 Blocks
Concrete Caps 390 Caps
Backfill Gravel 273 Cubic Feet

37
3.3. Stage
3.3.1. Preliminary Design
In order to develop a design that best suited the needs of the clients, a few
preliminary stage designs were developed. Before the stage designs could be developed it
was first important to establish the design criteria for the stage.
The intended purpose of the stage is to accommodate flag ceremonies, small concert
and other activities. The client has suggested that it should accommodate a maximum of 40
people. Stage dimensioning is usually determined by the intended use of the stage. These
intended uses are typically a drama, dance, music drama, and opera. The intended use of
the stage usually falls into one of these categories or can be designed to suit multiple
categories. Table 15 below shows typical dimensions for stages by the intended use. Table 15: Stage Dimensions by Intended Use (De Chiara et al, 2001)
Intended Use Dimensions Area (ft2)
Drama 35ft x 20ft (minimum), 40ft x
20ft (maximum)
700, 800
Dance 50ft x 40ft 2000
Music Drama 60ft x 50ft 3000
Opera 60ft x 50ft 3000
Since the use of the stage for the camp is not fully defined and needs to be designed
to accommodate multiple purposes, the MQP team decided that an appropriate approach
would be to determine a suitable area that could be used and develop a design based on
this area. Feedback from the client indicated that a stage size that was either 20ft by 30ft or
30ft by 40ft would be suitable. Working with these dimensions, it is clear that the stage size
for a drama as seen in Table 15 would be suitable.
In order to establish the absolute minimum size required for 40 people on stage, the
team utilized the spacing requirement for a still standing choir. According to these spacing
requirements as shown in Figure 33, a distance of 80 inches is the space required for 4
people from front to back.
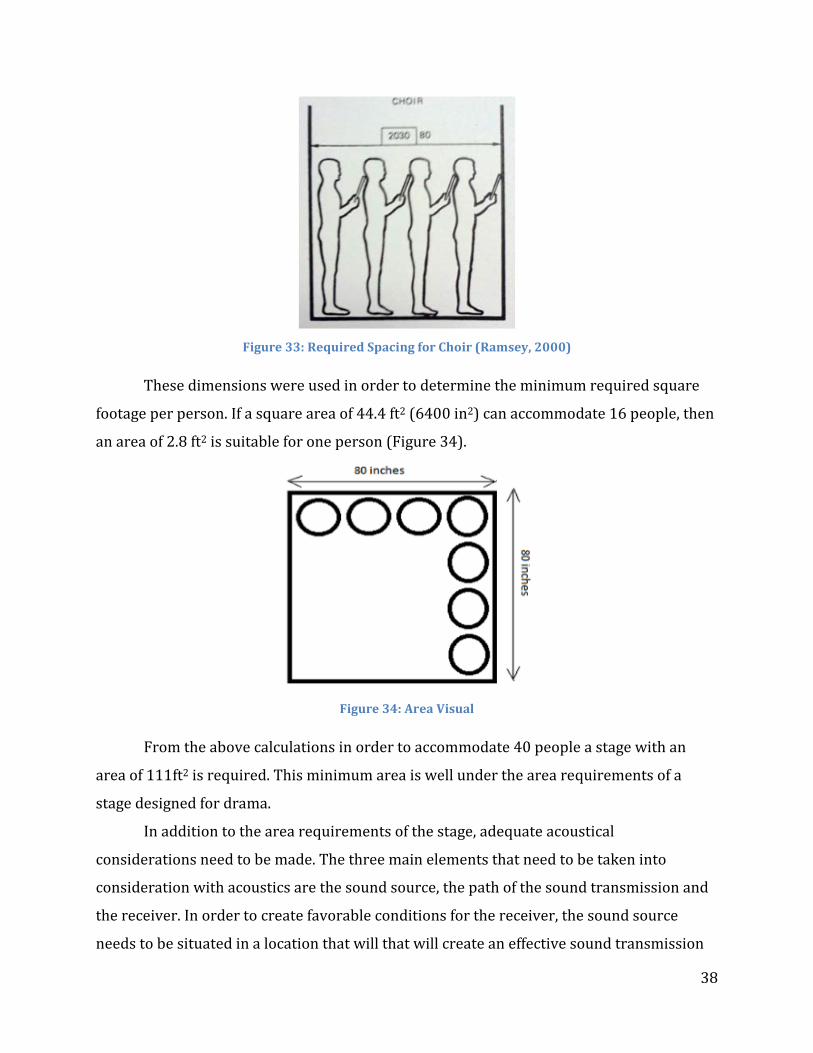
38
Figure 33: Required Spacing for Choir (Ramsey, 2000)
These dimensions were used in order to determine the minimum required square
footage per person. If a square area of 44.4 ft2 (6400 in2) can accommodate 16 people, then
an area of 2.8 ft2 is suitable for one person (Figure 34).
Figure 34: Area Visual
From the above calculations in order to accommodate 40 people a stage with an
area of 111ft2 is required. This minimum area is well under the area requirements of a
stage designed for drama.
In addition to the area requirements of the stage, adequate acoustical
considerations need to be made. The three main elements that need to be taken into
consideration with acoustics are the sound source, the path of the sound transmission and
the receiver. In order to create favorable conditions for the receiver, the sound source
needs to be situated in a location that will that will create an effective sound transmission

39
path. This can be done by utilizing reflective surfaces and placing the receiver near to the
sound source (Doelle, 1972). The amphitheater for Camp Woodhaven is situated outdoors
and is limited in terms of the reflective surfaces common with indoor theaters. Hence
provisions need to be made to accommodate these limitations. The difficulties associated
with outdoor acoustics for an auditorium stem from the fact that sound energy dissipates
and loses intensity as it leaves the source, sound absorption from the audience and
interference with other noises.
In order to combat these limitations outdoor theater should be designed with
enclosures capable of reflecting sound and the sloping of the auditorium as seen in Figure
35 (Doelle, 1972). By utilizing a reflective shell, sound waves are directed to the audience
in an efficient manner. In addition, placing another reflective surface such as a paved area
or water in front of the stage improves hearing conditions in the auditorium (Moore, 1978).
Figure 35: Outdoor Theater Listening Condition (Doelle, 1972)
Using the stage design criteria a preliminary design of the stage was developed and
drafted using AutoDesk Revit 2013. The MQP team decided that the primary material for all
stage designs would be either wood or concrete, as these materials can be easily sourced.
Working with the area requirements for a stage intended to perform a drama and
suggestions from the client, the stage size that was chosen for the preliminary design
spanned 20’ by 30’, having an area of 600 ft2. The first design that was developed utilized
wood as the primary material with a continuous concrete foundation (Figure 36).

40
Figure 36: Stage Design I
Once this design was developed, feedback from the team’s faculty advisors indicated
that a different foundation type for the stage would be a less expensive solution. The design
was updated to meet these requirements resulting in a second stage design (Figure 37).
Design II featured a foundation consisting of isolated concrete footings with structural
posts.
Figure 37: Stage Design II
Both Designs I and II featured a sloped roof with a wall at the back of the stage. Both
the roof and wall act as the reflective shell for sound. Even though the seating for the
audience is well within the distance requirements of 65.62ft for audience members to hear

41
the spoken voice without amplification, the MQP team decided to still design the stage with
a reflective shell which would improve the sound for the spectators. Both stage designs
made use of staircases to the sides of the stage that would allow for easy entrance and exit
on the stage. Railings were also placed on the sides to prevent people on stage from falling
off at the sides.
Later conversations with the client indicated that their preferred material of choice
was concrete. The client also presented an image of the Abacoa Amphitheater (Figure 38)
as an example of a concrete stage.
Figure 38: Abacoa Amphitheater, Jupiter Fl
A third stage design was developed made from concrete utilizing design elements of the
previous designs and the Abacoa Amphitheater stage (Figure 39).
Figure 39: Stage Design III

42
Design III shown above was designed primarily with concrete construction in mind.
It has a front circular staircase, a staircase and ramp to the sides. It has a back wall and a
sloped roof, similar to Designs I and II. This option is preferable due to a better acoustical
design. In addition to the back wall and roof, it uses the sidewalls as reflective surfaces.
Feedback from the group advisors indicated that this specific stage design could be
expensive and it was suggested that this third design be modified so that wood was the
primary material of construction. A fourth design was then developed to include these
suggestions. Design III shown above was designed to be constructed primarily from
concrete. It has a front circular staircase, a staircase and ramp to the sides. It has a back
wall and a sloped roof, similar to Designs I and II. The fourth design is shown below Figure
40.
Figure 40: Stage Design IV
This design features wood flooring, wood back and side walls, circular concrete
front steps and a staircase and ramp to the sides of the stage. The full drawings for each
stage design are located in Appendix J: Stage Design Drawings. The book, The Architect’s
Studio Companion: Rules of Thumb for Preliminary Design was used as a reference in
determining the appropriate sizing and spacing of many of the material elements for each
stage.
3.3.2. Design Evaluation
In order to select one stage that would meet the needs of the client, the MQP team
decided to evaluate each design alternative based on the following criteria: cost,

43
functionality and constructability and aesthetics. The functionality refers to how well the
stage will integrate with the amphitheater design as well as the ease of use of the structure.
The constructability refers to how easy the structure will be to construct. The aesthetics
refers to the visual appeal of the design.
Each of the design criterions was assigned a corresponding weighing value that
corresponded to its relevance in addressing the needs of the client. Each criterion was
scored on a scale of 1 to 5, with 5 being the best option. In some cases, the score for
different stage options are the same because the design options have similar features.
Similar to the evaluation of the amphitheaters, the total score was determined by
multiplying the weight against the itemized scores for the design alternatives (see Table
16). Table 16: Stage Grading Criterion
Criteria Weight Cost 3
Functionality 2 Constructability 3
Aesthetics 2
Before a cost estimate could be done, a material quantity estimate had to be
performed. The material estimate was done using the program AutoDesk Revit 2013. Once
the material was quantified then the cost estimate was performed for each design
alternative. The unit price costs for this estimate were obtained from the book RSMeans
Building Construction Cost Data 2011 unit pricing. See Appendix K: Stage Design Material
and Cost Estimates for the material quantities and the corresponding cost estimates.
The cost was ranked with the most expensive receiving the lowest score and the
cheapest receiving the highest score. This is so because the team is seeking to choose the
most cost-effective solution for the client. For the functionality, Option III and IV received a
higher score than Options I and II because both designs have stairs to the front of the stage
and to the sides. This provides an easy means of entrance and exit on the stage. In addition
because these stages are circular it improves the sight lines for persons in the audience.
Constructability was ranked based on how easy it would be to construct the stage. Options I
and II received higher scores than Option III and IV because it is easier to build a

44
rectangular stage than a circular stage in terms of determining the dimensions for
construction. The justifications for the numerical scores are shown in Table 17. Table 17: Stage Evaluation Table
Criteria Description
Option I (Rectangular
with continuous footing)
Option II (Rectangular with isolated
footing)
Option III (Circular
Concrete)
Option IV (Circular Wood &
Concrete) Cost The estimated cost of
each stage $14,191 $9993 $31988 $14,163
Functionality How well the stage integrates with amphitheater and ease of use of stage by children
Moderately
functional
Moderately
functional
Very
functional
Very
functional
Constructability The ease of construction of each stage
Fairly Easy Easy Difficult Moderate
Aesthetics The visual appeal of each stage design
Appealing Appealing Very appealing
Very appealing
The result of this process is shown in Table 18. Stage Option IV scored the highest,
earning 38 points, with Option II close behind. Table 18: Summary of Stage Evaluation
Criteria Weight I II III IV Cost 3 2 4 1 3
Functionality 2 2 2 5 5 Constructability 3 4 5 2 3
Aesthetics 2 3 3 5 5 Total 28 37 29 38
3.4. Traffic
3.4.1. Preliminary Design
Camp Woodhaven currently services 3-4 buses and 80-110 cars as they drop off 300
campers daily. In previous years, Camp Woodhaven has sent all cars and buses to the
parking lot in front of the chapel and has been able to complete this process in 15 minutes.
The parking lot is 150-200ft from the entrance to the camp, leaving little storage space for
the queue line within the camp. This has resulted in backups on Campground Road. In the
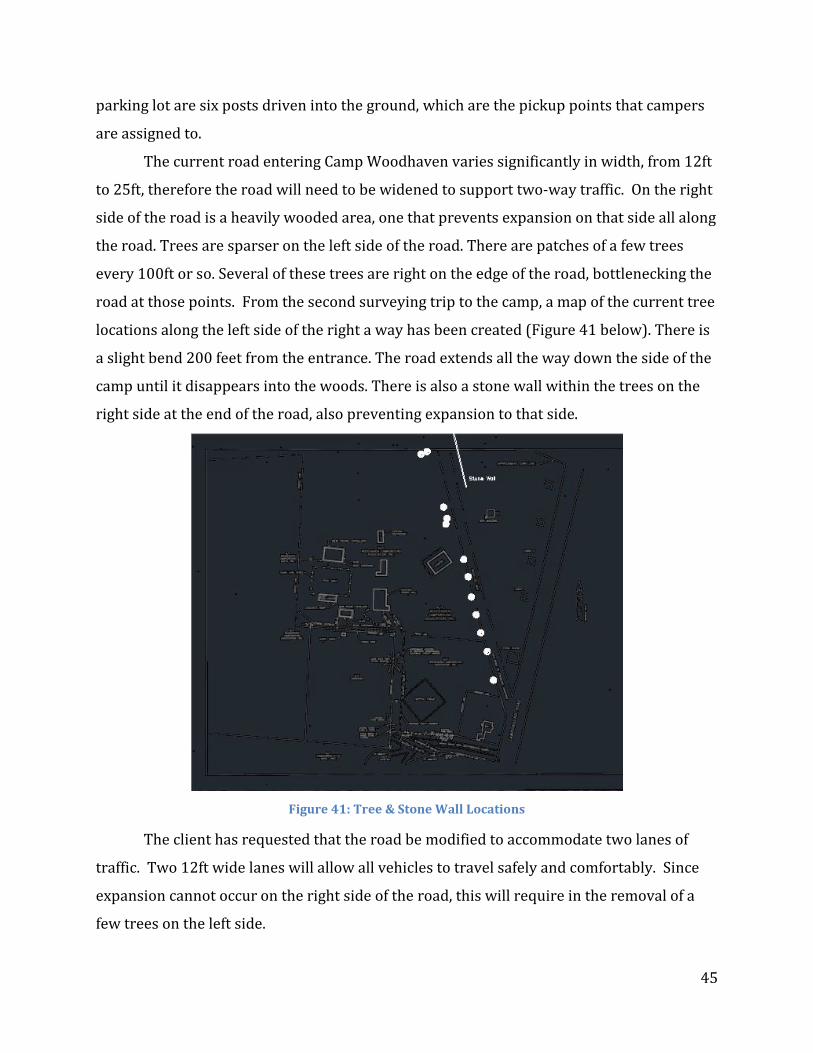
45
parking lot are six posts driven into the ground, which are the pickup points that campers
are assigned to.
The current road entering Camp Woodhaven varies significantly in width, from 12ft
to 25ft, therefore the road will need to be widened to support two-way traffic. On the right
side of the road is a heavily wooded area, one that prevents expansion on that side all along
the road. Trees are sparser on the left side of the road. There are patches of a few trees
every 100ft or so. Several of these trees are right on the edge of the road, bottlenecking the
road at those points. From the second surveying trip to the camp, a map of the current tree
locations along the left side of the right a way has been created (Figure 41 below). There is
a slight bend 200 feet from the entrance. The road extends all the way down the side of the
camp until it disappears into the woods. There is also a stone wall within the trees on the
right side at the end of the road, also preventing expansion to that side.
Figure 41: Tree & Stone Wall Locations
The client has requested that the road be modified to accommodate two lanes of
traffic. Two 12ft wide lanes will allow all vehicles to travel safely and comfortably. Since
expansion cannot occur on the right side of the road, this will require in the removal of a
few trees on the left side.

46
The next step for designing the updated roadway was creating a cul-de-sac for the
vehicles to travel. This will allow vehicles to drive the length of the road, turn around and
pull up to the new pavilion to drop off campers. The increase in space for the queue line on
the camp’s property will prevent long queues from extending into the public road.
The cul-de-sac will be placed as far back from the entrance as possible. This is to
maximize the space available for queuing, and keeps the cul-de-sac from intruding on the
other camp facilities. The cul-de-sac must also be offset to one side because the trees on
the East side of the road are so close to the edge of road.
The cul-de-sac must be at least 86ft in diameter to allow for the buses to turn
around. To allow extra space to accommodate ease of travel, the cul-de-sac will be 90ft in
diameter. The combination of the 90ft cul-de-sac with the 12ft lanes is named Construction
1 and can be seen below in Figure 42. The orange curve within the figure represents the
maximum turning radius of a school bus, and shows that a school bus will be able to use the
cul-de-sac.
Figure 42: Roadway Construction 1
Another idea of the client stated the buses could be redirected to the parking lot and
not use the cul-de-sac, therefore the cul-de-sac only would need to be large enough for cars.
A smaller cul-de-sac (Construction 2) like this would be 54ft in diameter, seen below in
Figure 43. The maximum turning radius of a car is shown by the yellow curve, which
shows that all cars will be able to use the cul-de-sac.
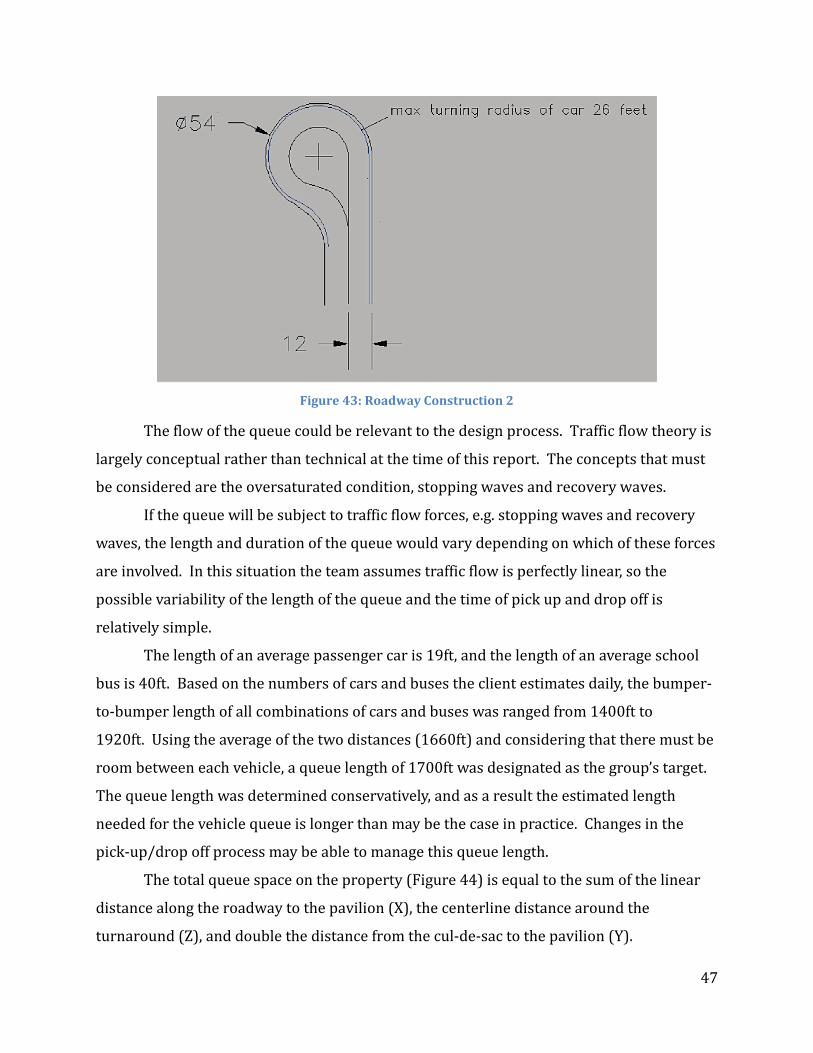
47
Figure 43: Roadway Construction 2
The flow of the queue could be relevant to the design process. Traffic flow theory is
largely conceptual rather than technical at the time of this report. The concepts that must
be considered are the oversaturated condition, stopping waves and recovery waves.
If the queue will be subject to traffic flow forces, e.g. stopping waves and recovery
waves, the length and duration of the queue would vary depending on which of these forces
are involved. In this situation the team assumes traffic flow is perfectly linear, so the
possible variability of the length of the queue and the time of pick up and drop off is
relatively simple.
The length of an average passenger car is 19ft, and the length of an average school
bus is 40ft. Based on the numbers of cars and buses the client estimates daily, the bumper-
to-bumper length of all combinations of cars and buses was ranged from 1400ft to
1920ft. Using the average of the two distances (1660ft) and considering that there must be
room between each vehicle, a queue length of 1700ft was designated as the group’s target.
The queue length was determined conservatively, and as a result the estimated length
needed for the vehicle queue is longer than may be the case in practice. Changes in the
pick-up/drop off process may be able to manage this queue length.
The total queue space on the property (Figure 44) is equal to the sum of the linear
distance along the roadway to the pavilion (X), the centerline distance around the
turnaround (Z), and double the distance from the cul-de-sac to the pavilion (Y).
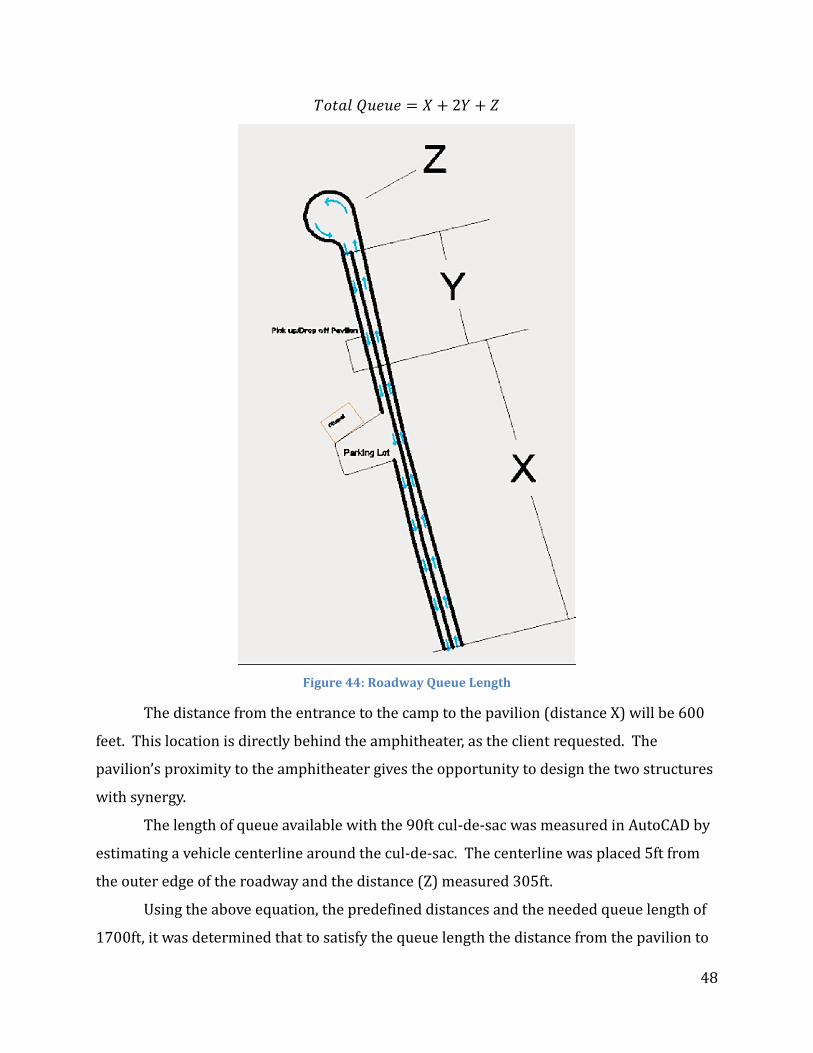
48
𝑇𝑜𝑡𝑎𝑙 𝑄𝑢𝑒𝑢𝑒 = 𝑋 + 2𝑌 + 𝑍
Figure 44: Roadway Queue Length
The distance from the entrance to the camp to the pavilion (distance X) will be 600
feet. This location is directly behind the amphitheater, as the client requested. The
pavilion’s proximity to the amphitheater gives the opportunity to design the two structures
with synergy.
The length of queue available with the 90ft cul-de-sac was measured in AutoCAD by
estimating a vehicle centerline around the cul-de-sac. The centerline was placed 5ft from
the outer edge of the roadway and the distance (Z) measured 305ft.
Using the above equation, the predefined distances and the needed queue length of
1700ft, it was determined that to satisfy the queue length the distance from the pavilion to
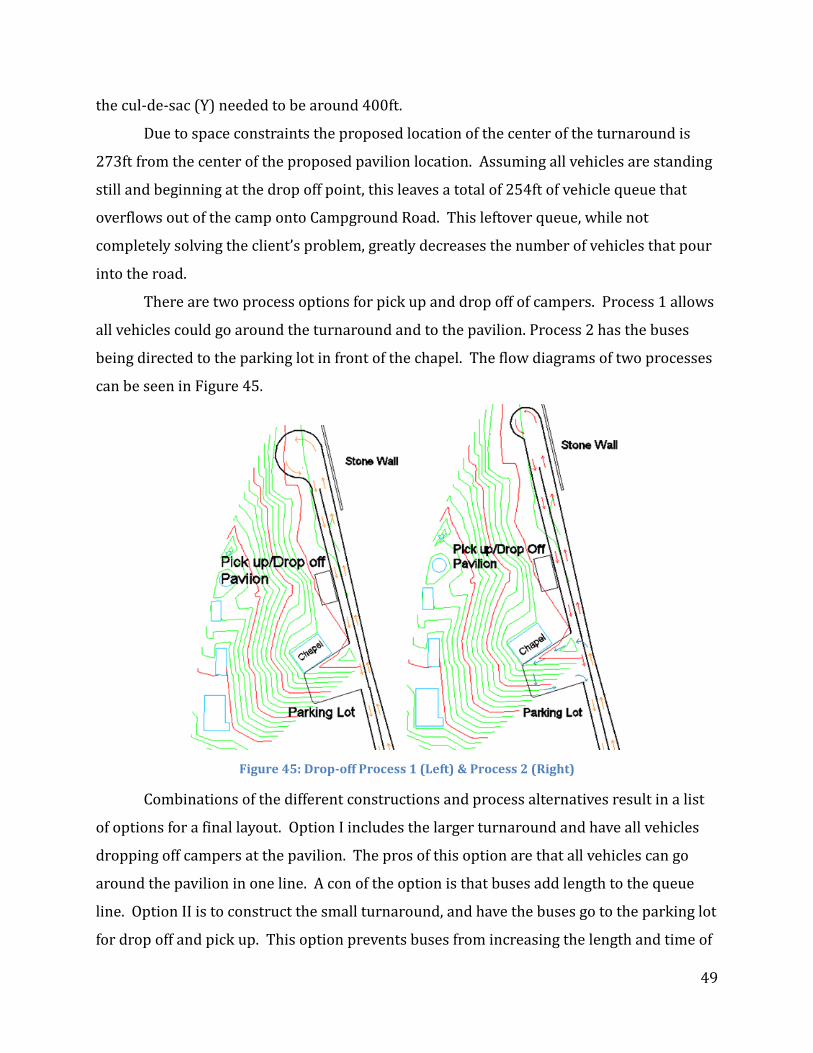
49
the cul-de-sac (Y) needed to be around 400ft.
Due to space constraints the proposed location of the center of the turnaround is
273ft from the center of the proposed pavilion location. Assuming all vehicles are standing
still and beginning at the drop off point, this leaves a total of 254ft of vehicle queue that
overflows out of the camp onto Campground Road. This leftover queue, while not
completely solving the client’s problem, greatly decreases the number of vehicles that pour
into the road.
There are two process options for pick up and drop off of campers. Process 1 allows
all vehicles could go around the turnaround and to the pavilion. Process 2 has the buses
being directed to the parking lot in front of the chapel. The flow diagrams of two processes
can be seen in Figure 45.
Figure 45: Drop-off Process 1 (Left) & Process 2 (Right)
Combinations of the different constructions and process alternatives result in a list
of options for a final layout. Option I includes the larger turnaround and have all vehicles
dropping off campers at the pavilion. The pros of this option are that all vehicles can go
around the pavilion in one line. A con of the option is that buses add length to the queue
line. Option II is to construct the small turnaround, and have the buses go to the parking lot
for drop off and pick up. This option prevents buses from increasing the length and time of

50
the queue line. However, this is a less dynamic design that does not allow the buses to
make it around the turnaround. There are also two different locations for pick up and
drop off, keeping half of the campers from using the new pavilion. Additionally, the buses
turning into the parking lot crosses the lane in which cars are coming from the
pavilion. This is a very important safety concern that cannot be overlooked when
considering sending the buses to the parking lot. Option III is to construct the large
turnaround, but send the buses to the parking lot. Although this option still divides
campers into two locations, the turnaround is constructed large enough for buses to use the
turnaround. A summary of the three options with their construction and process number
can be seen below (Table 19). Table 19: Traffic Option Description Table
3.4.2. Design Evaluation
The evaluation of the three traffic options is based on six criteria. The two
construction and process choices were not explicitly compared in this evaluation. Instead,
the criteria represent the direct effects of choosing each combination. Each criterion is
given a corresponding weight, making some have value more than others (see Table 20).
For each option each criterion can be scored from 1 to 5, 5 being the highest score,
depending on how the design meets the criteria. Two different options can have the same
score because certain options have specific features in common. The final score for each
option is the sum of each category’s score rating multiplied by the weight of the
corresponding criterion.
Option Construction Process
I 1 1
II 2 2
III 1 2
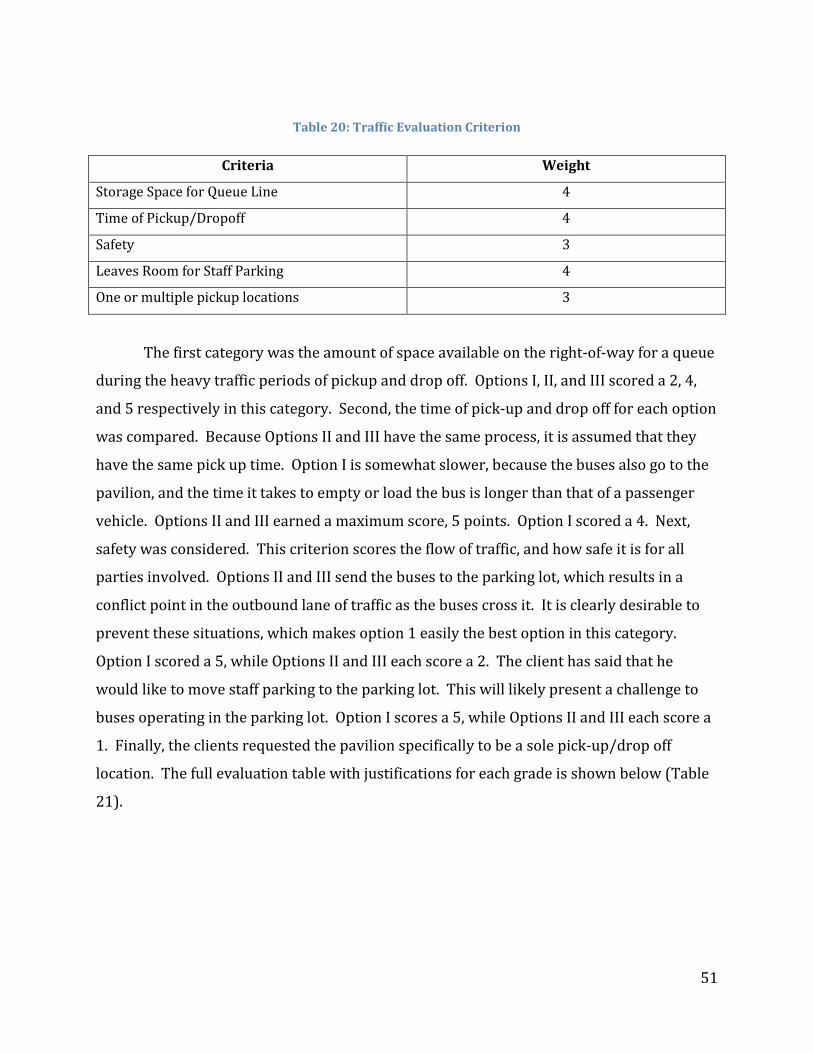
51
Table 20: Traffic Evaluation Criterion
Criteria Weight
Storage Space for Queue Line 4
Time of Pickup/Dropoff 4
Safety 3
Leaves Room for Staff Parking 4
One or multiple pickup locations 3
The first category was the amount of space available on the right-of-way for a queue
during the heavy traffic periods of pickup and drop off. Options I, II, and III scored a 2, 4,
and 5 respectively in this category. Second, the time of pick-up and drop off for each option
was compared. Because Options II and III have the same process, it is assumed that they
have the same pick up time. Option I is somewhat slower, because the buses also go to the
pavilion, and the time it takes to empty or load the bus is longer than that of a passenger
vehicle. Options II and III earned a maximum score, 5 points. Option I scored a 4. Next,
safety was considered. This criterion scores the flow of traffic, and how safe it is for all
parties involved. Options II and III send the buses to the parking lot, which results in a
conflict point in the outbound lane of traffic as the buses cross it. It is clearly desirable to
prevent these situations, which makes option 1 easily the best option in this category.
Option I scored a 5, while Options II and III each score a 2. The client has said that he
would like to move staff parking to the parking lot. This will likely present a challenge to
buses operating in the parking lot. Option I scores a 5, while Options II and III each score a
1. Finally, the clients requested the pavilion specifically to be a sole pick-up/drop off
location. The full evaluation table with justifications for each grade is shown below (Table
21).

52
Table 21: Traffic Evaluation Table
Criteria Description Option I Option II Option III Storage Space for Queue line
space available on the right-of-way for a queue during the heavy traffic
periods of pickup and drop off
All vehicles queue
together making
longer queue
Smaller turnaround
gives less space, buses
go to parking lot, more
space available
Space is saved by sending buses to parking
lot, ideal amount of
space Time of Pickup/Drop off
the time of pick-up and drop off
Slightly slower than
other options
Lowest time Lowest time
Safety Are there conflict points or other unsafe conditions?
No Yes, one collision
point
Yes, one collision
point Leaves Room for Staff Parking
Can the staff park in the main parking lot?
Yes No No
Is there one pick up/drop off location?
Yes No No
After all the scores were weighed and added together, Option I scored highest with
an overwhelming 74 points. Option III came in second with 53 points and in last, Option II
with 49 points. Based on this evaluation Option I will be continued with in the final phases
of design. A summary table of the scores can be seen below (Table 22). Table 22: Summary of Traffic Evaluation
Criteria Weight Option I Option II Option III
Storage Space for Queue Line 4 2 4 5
Time of Pickup/Dropoff 4 4 5 5
Safety 3 5 2 2
Leaves Room for Staff Parking 4 5 1 1
One or multiple pickup locations 3 5 1 1
Total 74 49 53

53
3.5. Pavilion
3.5.1. Preliminary Design
The primary design criteria for the drop-off and pickup pavilion broke down to two
major components: size of the pavilion and the location. The intent of the pavilion design is
to match the style of the pre-existing covered pavilion on the site (see Figure 46).
Figure 46: Existing Covered Pavilion
The size of the pavilion (30’ x 60’) was one of the original suggestions received from
the client. The size of the pavilion is important because it is intended to hold all the
campers comfortably. The capacity of the area underneath the covering should be able to
shelter all 350 campers and 70 staff. An average person occupies an ellipse that is 1.5’x2’
(Figure 47). For simplicity, the ellipse can be changed to a rectangle of the same size,
having an area of 3sqft. The proposed 30’x60’ rectangle has an area of 1800sqft; therefore
the pavilion should have a capacity of 600 people, well over the desired capacity.
Figure 47: Human Area Occupancy
The pavilion will be constructed from wood, with 6” x 6” columns stationed 15’ on
center. Connected to the top of the columns 2” x 8” beams will bear the weight of the

54
support structure and the roof. The roof of the pavilion will also be 10 feet high, and
include a 1ft overhang. The 32'x 62' roof will be held up by a system of trusses also built
from wood. The pavilion’s roof is designed with a 12” run per 4” rise, the standard for
roofing slopes.
The location of the pavilion will be approximately behind the amphitheater per
request of the clients. As discussed in the traffic preliminary design section, the queue line
will begin at this point and extend around the cul-de-sac and down the road.
3.5.2. Design Details
The team has divided the pavilion’s design into three sections: the roofing materials,
the wood structure, and the foundation. The roofing materials consist of the layers of
material that protect the roof of the pavilion. The lumber structure section consists of the
wood beams required to support the roof of the pavilion. The foundation contains the
concrete slab that acts as the pavilion’s floor and the column footings.
The roof was designed first so that the dead load of the materials in this section
could be determined. The roof will require plywood sheathing underneath a layer of paper
underlayment with asphalt shingles serving as the top layer. The sheathing required
consists of ¾” plywood panels. Next a layer of 15lb asphalt saturated felt underlayment is
placed on the plywood panels and finally the shingles are positioned. The total weight of
the roofing materials was determined to be 5.13 pounds per square foot (psf) (Penn State).
The next step of design was the construction of the structure supporting the roofing
materials. The total load the structure was designed to support was 60 pounds per square
foot, using the 5.13psf mentioned above in combination with a 55psf snow load. The
chosen design uses in-line trusses to hold up the gable roof. The gable roof was chosen
because it is easier to construct and less costly. The suggested member size for the trusses
is 2” x 8” boards that will span the width of the pavilion (30ft) with a 1ft overhand on each
side, for a total of 32 feet. Trusses built from 2” x 8” lumber will be capable of spanning this
distance with a load in excess of 60 psf, according to Locke Truss, a Canadian truss
manufacturer (Locke Truss). The length of the pavilion (60ft) determines the number of
trusses needed for the roof. Spacing the trusses at 3ft on center, 21 trusses are needed to
span the length of the pavilion. Horizontal bracing is necessary to connect all of the trusses
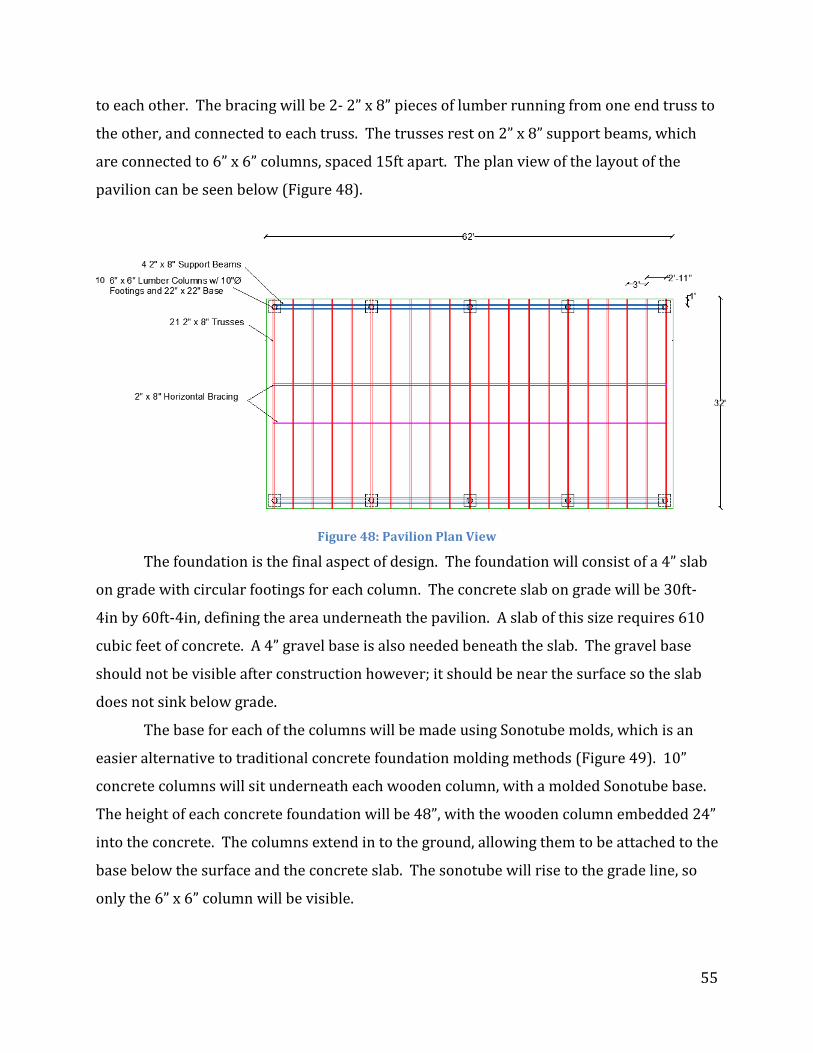
55
to each other. The bracing will be 2- 2” x 8” pieces of lumber running from one end truss to
the other, and connected to each truss. The trusses rest on 2” x 8” support beams, which
are connected to 6” x 6” columns, spaced 15ft apart. The plan view of the layout of the
pavilion can be seen below (Figure 48).
Figure 48: Pavilion Plan View
The foundation is the final aspect of design. The foundation will consist of a 4” slab
on grade with circular footings for each column. The concrete slab on grade will be 30ft-
4in by 60ft-4in, defining the area underneath the pavilion. A slab of this size requires 610
cubic feet of concrete. A 4” gravel base is also needed beneath the slab. The gravel base
should not be visible after construction however; it should be near the surface so the slab
does not sink below grade.
The base for each of the columns will be made using Sonotube molds, which is an
easier alternative to traditional concrete foundation molding methods (Figure 49). 10”
concrete columns will sit underneath each wooden column, with a molded Sonotube base.
The height of each concrete foundation will be 48”, with the wooden column embedded 24”
into the concrete. The columns extend in to the ground, allowing them to be attached to the
base below the surface and the concrete slab. The sonotube will rise to the grade line, so
only the 6” x 6” column will be visible.
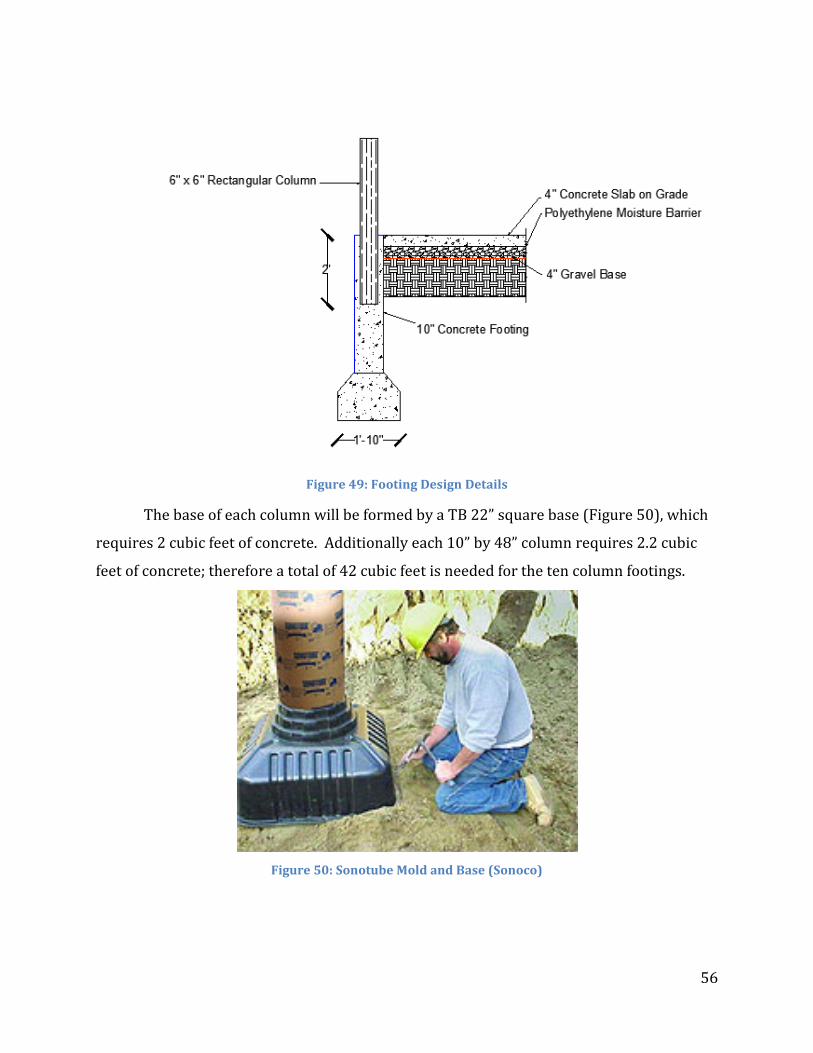
56
Figure 49: Footing Design Details
The base of each column will be formed by a TB 22” square base (Figure 50), which
requires 2 cubic feet of concrete. Additionally each 10” by 48” column requires 2.2 cubic
feet of concrete; therefore a total of 42 cubic feet is needed for the ten column footings.
Figure 50: Sonotube Mold and Base (Sonoco)

57
Two views (South and East) of the pavilion depicting the components used in each
section can be seen below (Figures 51 and 52).
Figure 51: Pavilion South View
Figure 52: Pavilion East View
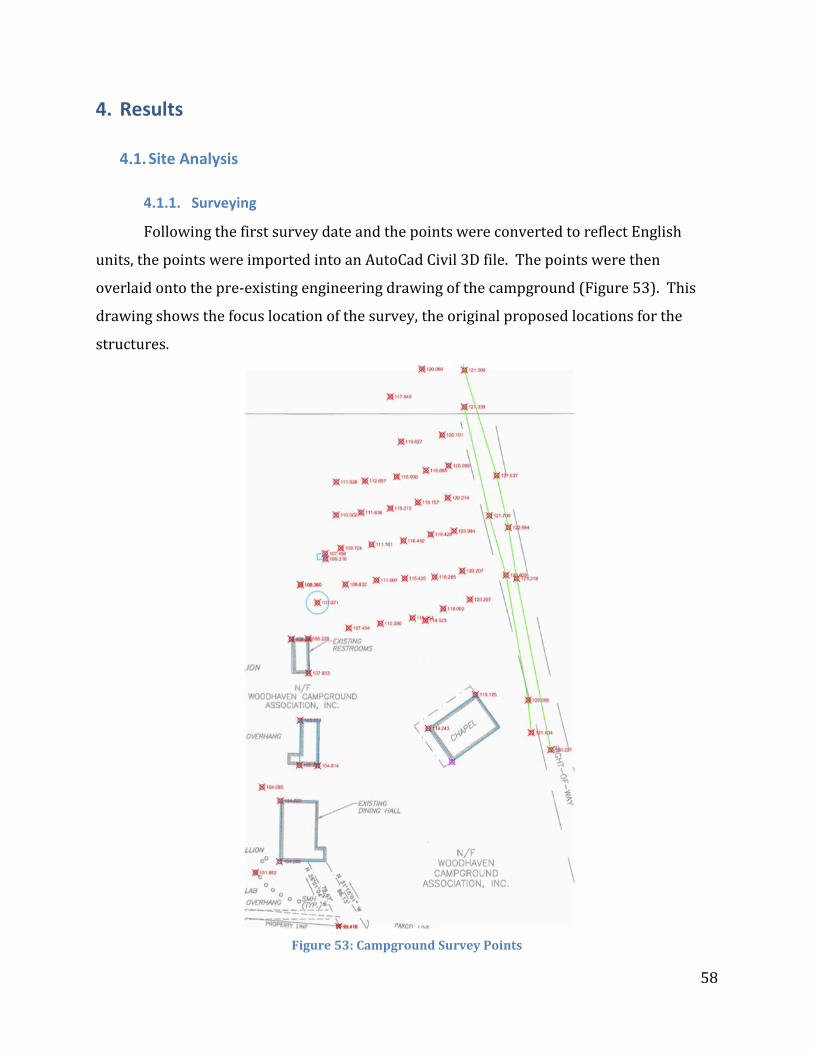
58
4. Results
4.1. Site Analysis
4.1.1. Surveying
Following the first survey date and the points were converted to reflect English
units, the points were imported into an AutoCad Civil 3D file. The points were then
overlaid onto the pre-existing engineering drawing of the campground (Figure 53). This
drawing shows the focus location of the survey, the original proposed locations for the
structures.
Figure 53: Campground Survey Points

59
Afterwards, the points were collected in a surface using the Civil 3D software and a
set of contour lines were generated to show the elevation around the camp (Figure 54).
The contours show how the elevation of the terrain changes across the recorded areas.
They are applied by generating profile views of the hill at certain points.
Figure 54: Campground Contour Lines
On the second survey trip, the width of the road was recorded at 50ft intervals,
starting at the entrance to the property. This was done to see where the road was not wide
enough to support two-way traffic, as intended by the new design plan. These
measurements were recorded and can be seen below in Table 23.

60
Table 23: Road Width Measurements
Distance from
Entrance of
Property (feet)
Width of
roadway
(feet)
0 22.2
50 23.7
100 19.6
150 17.2
200 19.8
250 17.9
300 17.4
350 18.5
400 12.5
450 11.7
500 12.3
550 13.7
600 13.5
650 14.8
700 15.8
750 18.8
800 15.9
850 14.8
4.1.2. Soil Analysis
The soil map that was developed for Camp Woodhaven shows that the two main soil
types located at the camp are the Paxton fine sandy loam (3-5% slope) and the Chartfield-
Hollis-Rock outcrop complex. Based on the Unified classification system, the soil at Camp
Woodhaven has a mixture of ML, SM, GM, SP, GC and CL (see Figure 55).

61
Figure 55: Camp Woodhaven Soil Map
Also the presumptive load-bearing values from the International Building Code the
Vertical foundation pressure for the soil at Camp Woodhaven ranges from 1500 psf to 2000
psf (Table 24 below).

62
Table 24: Presumptive Load Bearing Values (International Building Code, 2009)
CLASS OF MATERIAL
VERTICAL
FOUNDATIO
N PRESSURE
(psf)
LATERAL
BEARING
PRESSURE
(psf/ft below
natural grade)
LATERAL SLIDING
RESISTANCE
Coefficient
of frictiona
Cohesio
n (psf)b
1. Crystalline bedrock 12,000 1200 0.7 -
2. Sedimentary and
foliated rock 4000 400 0.35 -
3. Sandy gravel and/or
gravel (GW and GP) 3000 200 0.35 -
4. Sand, silty sand,
clayey sand, silty
gravel and clayey
gravel (SW, SP, SM, SC,
GM, and GC) 2000 150 0.25 -
5. Clay, sandy clay, silty
clay, clayey silt, silt and
sandy silt (CL, ML, MH,
and CH) 1500 100 - 130
For SI: 1 pound per square foot = 0.0479kPa, 1 pound per
square foot per foot = 0.157kPa/m
a. Coefficient to be
multiplied by the dead
load
b. Cohesion value to be multiplied by the contact area, as
limited by Section 1806 3.2
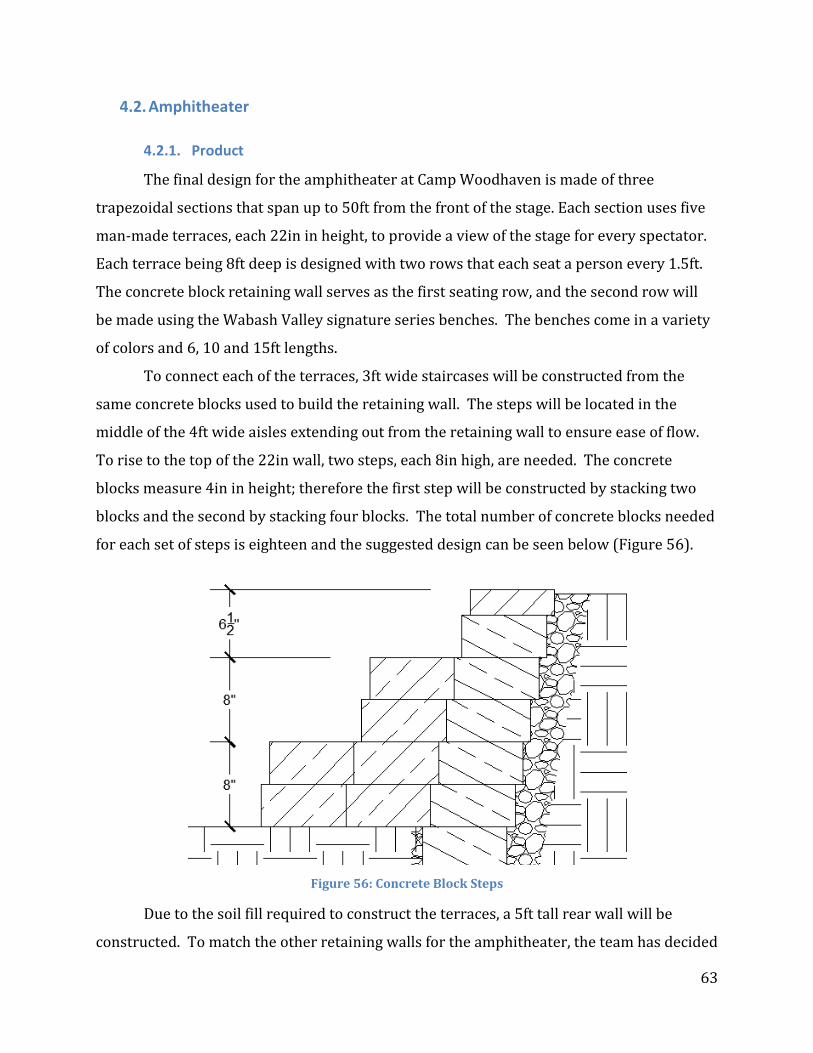
63
4.2. Amphitheater
4.2.1. Product
The final design for the amphitheater at Camp Woodhaven is made of three
trapezoidal sections that span up to 50ft from the front of the stage. Each section uses five
man-made terraces, each 22in in height, to provide a view of the stage for every spectator.
Each terrace being 8ft deep is designed with two rows that each seat a person every 1.5ft.
The concrete block retaining wall serves as the first seating row, and the second row will
be made using the Wabash Valley signature series benches. The benches come in a variety
of colors and 6, 10 and 15ft lengths.
To connect each of the terraces, 3ft wide staircases will be constructed from the
same concrete blocks used to build the retaining wall. The steps will be located in the
middle of the 4ft wide aisles extending out from the retaining wall to ensure ease of flow.
To rise to the top of the 22in wall, two steps, each 8in high, are needed. The concrete
blocks measure 4in in height; therefore the first step will be constructed by stacking two
blocks and the second by stacking four blocks. The total number of concrete blocks needed
for each set of steps is eighteen and the suggested design can be seen below (Figure 56).
Figure 56: Concrete Block Steps
Due to the soil fill required to construct the terraces, a 5ft tall rear wall will be
constructed. To match the other retaining walls for the amphitheater, the team has decided
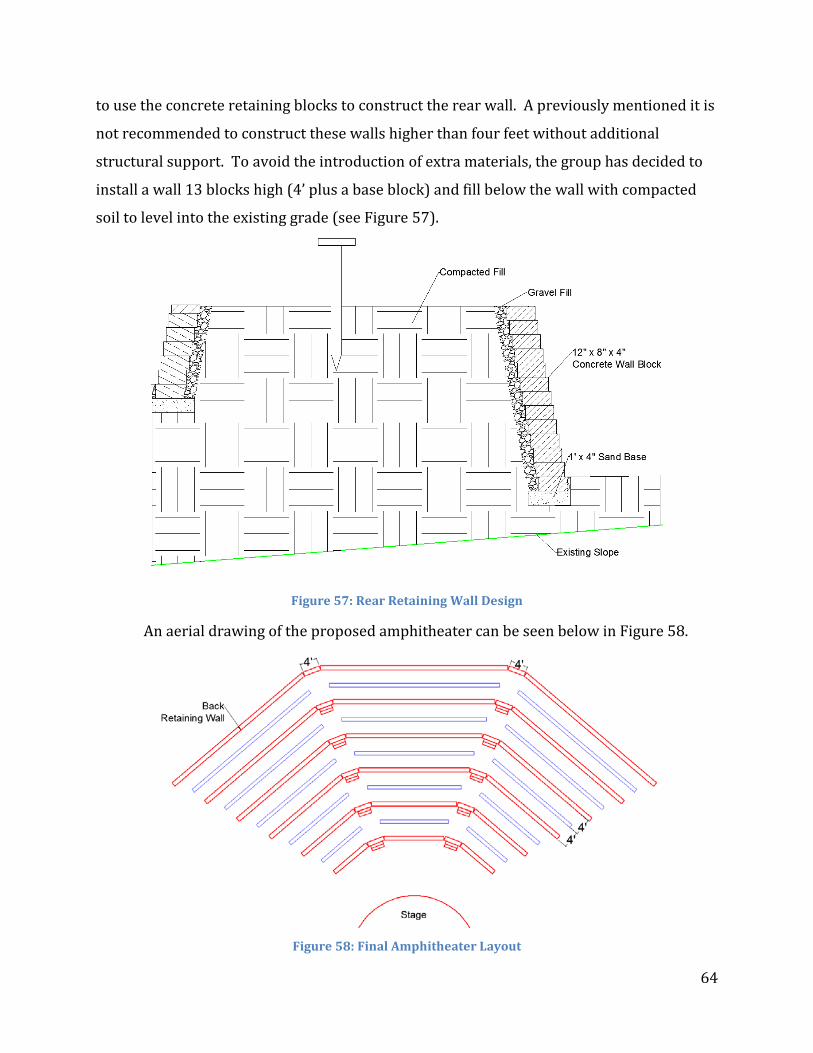
64
to use the concrete retaining blocks to construct the rear wall. A previously mentioned it is
not recommended to construct these walls higher than four feet without additional
structural support. To avoid the introduction of extra materials, the group has decided to
install a wall 13 blocks high (4’ plus a base block) and fill below the wall with compacted
soil to level into the existing grade (see Figure 57).
Figure 57: Rear Retaining Wall Design
An aerial drawing of the proposed amphitheater can be seen below in Figure 58.
Figure 58: Final Amphitheater Layout

65
4.2.2. Implementation
A list of materials has been assembled for the construction of the amphitheater. The
amphitheater consists of benches, concrete for the bench foundations, concrete blocks,
concrete caps, sand, gravel, fill soil, and grass seed to surface the terraces. The design calls
for twenty-one 6ft benches, twenty 10ft benches, and five 15ft benches. To mount the
benches in the ground, about 24 cubic feet of concrete are needed. The design needs 4164
concrete blocks and 390 concrete caps. Finally it requires 174 cubic feet of sand, 366 cubic
feet of gravel, 505 cubic yards of uncompressed soil, and 2765 square feet of grass seed.
The full table of materials required for the design can be seen below (Table 25). Table 25: Amphitheater Materials List
Materials List Benches
Benches Size Number 6 foot 21 10 foot 20 15 foot 5 Concrete Blocks
Location Number Retaining Wall 2340 Rear Wall 1716 Stairs 108 Total 4164 Concrete Caps
Location Number Retaining Wall 390 Concrete
Location Cu.Ft. Bench Foundation 24 Sand
Location Cu.Ft. Retaining Wall 130 Rear Wall 44 Total 174 Gravel
Location Cu.Ft. Retaining Wall 273 Rear Wall 92.4 Total 365.4
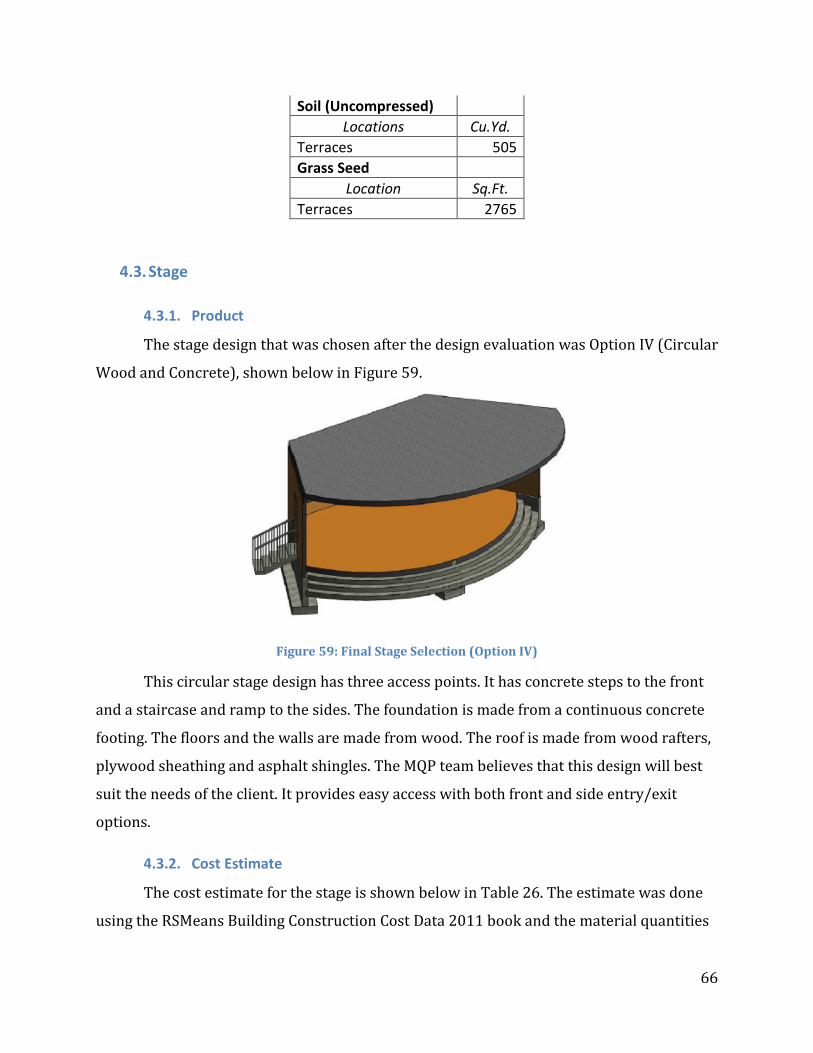
66
Soil (Uncompressed) Locations Cu.Yd.
Terraces 505 Grass Seed
Location Sq.Ft. Terraces 2765
4.3. Stage
4.3.1. Product
The stage design that was chosen after the design evaluation was Option IV (Circular
Wood and Concrete), shown below in Figure 59.
Figure 59: Final Stage Selection (Option IV)
This circular stage design has three access points. It has concrete steps to the front
and a staircase and ramp to the sides. The foundation is made from a continuous concrete
footing. The floors and the walls are made from wood. The roof is made from wood rafters,
plywood sheathing and asphalt shingles. The MQP team believes that this design will best
suit the needs of the client. It provides easy access with both front and side entry/exit
options.
4.3.2. Cost Estimate
The cost estimate for the stage is shown below in Table 26. The estimate was done
using the RSMeans Building Construction Cost Data 2011 book and the material quantities

67
from the Revit 2013 models. This total cost of $14,163 does not include time adjustments
and does not account for the cost of inflation. Table 26: Stage Design IV Cost Estimate
Design IV (Wood Circular)
RS Means Line Number
Work Description
Quantity Units Material Unit Price
Labor Unit Price
Total Material Unit Price
Total Labor Unit Price
Total Bare Costs
1) Floor 0611 10.28 0340
Joist Framing 2" x 10" at 12" o.c.
770 LF $1.33 $0.77 $1,024 $593 $1,617
0611 10.28 0420
Decking 2"x6" 486 S.F. $1.34 $1.08 $651 $525 $1,176
2) Foundation 0422 10.26 0250
Concrete Block Foundation Wall (8" thick)
282 S.F. $2.94 $3.75 $829 $1,058 $1,887
0330 53.40 3950
Concrete Strip Footing 36" x 12", reinforced
7.6 C.Y $127.00 $77.00 $965 $585 $1,550
3) Roof 0611 10.28 0340
Rafters 2"x10" @12" o.c.
600 LF $1.33 $0.77 $798 $462 $1,260
0616 36.10 0205
Plywood Sheathing 5/8" thick
819 S.F. $0.70 $0.43 $573 $352 $925
0731 13.10 0150
Asphalt Shingles
8.19 Sq. $74.00 $53.00 $606 $434 $1,040
4) Walls 0616 36.10 0605
Plywood Sheathing 1/2" thick
947 S.F. $0.58 $0.49 $549 $464 $1,013
0611 10.26 0305
Wall Studs 2" x 4" @ 2' o.c
240 L.F. $2.31 $4.59 $554 $1,102 $1,656
5) Railings and Stairs 0643 13.20 0100
Prefabricated Box Stairs, Oak Treads
5 Riser $85.00 $17.65 $425 $88 $513
0643 16.10 0020
Wood Handrails Railings
8 L.F. $9.50 $9.05 $76 $72 $148

68
0330 53.40 3825
Concrete cast-in-place stairs (footings)
4.26 C.Y $158.00 $165.00 $673 $703 $1,376
Total $14,163
4.4. Traffic
4.4.1. Product
The roadway design chosen following grading and evaluation was Option I. This
option entails the construction of the larger cul-de-sac (90ft diameter) and requires all
vehicles traveling down through the cul-de-sac, and turning around to access the pavilion
for pick up and drop off campers (Figure 60). Option I maximizes convenience and safety
for all parties involved, an ever-present priority when operating a day camp. The MQP
team feels that this option best meets the needs of the client for this section of the project.
Requiring vehicles to travel along the new roadway rather than into the parking lot is not
only a more efficient process, but frees the parking lot to be used for other purposes.
Figure 60: Roadway Design Aerial
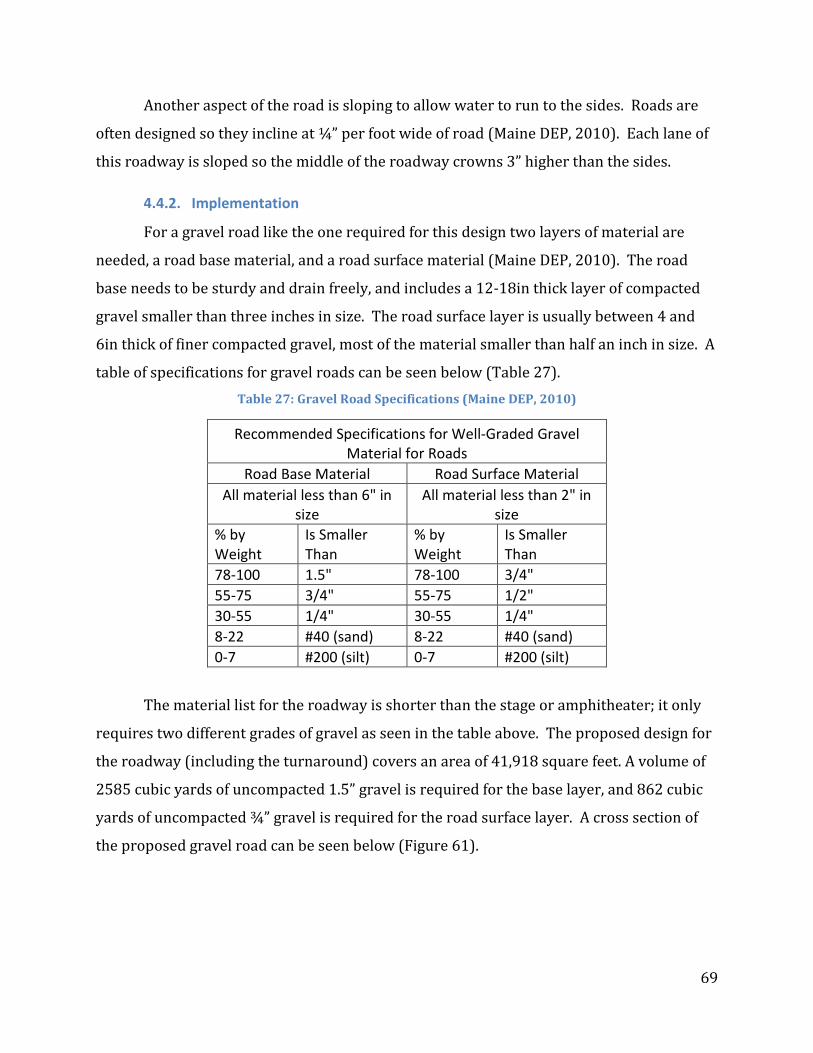
69
Another aspect of the road is sloping to allow water to run to the sides. Roads are
often designed so they incline at ¼” per foot wide of road (Maine DEP, 2010). Each lane of
this roadway is sloped so the middle of the roadway crowns 3” higher than the sides.
4.4.2. Implementation
For a gravel road like the one required for this design two layers of material are
needed, a road base material, and a road surface material (Maine DEP, 2010). The road
base needs to be sturdy and drain freely, and includes a 12-18in thick layer of compacted
gravel smaller than three inches in size. The road surface layer is usually between 4 and
6in thick of finer compacted gravel, most of the material smaller than half an inch in size. A
table of specifications for gravel roads can be seen below (Table 27). Table 27: Gravel Road Specifications (Maine DEP, 2010)
Recommended Specifications for Well-Graded Gravel Material for Roads
Road Base Material Road Surface Material All material less than 6" in
size All material less than 2" in
size % by Weight
Is Smaller Than
% by Weight
Is Smaller Than
78-100 1.5" 78-100 3/4" 55-75 3/4" 55-75 1/2" 30-55 1/4" 30-55 1/4" 8-22 #40 (sand) 8-22 #40 (sand) 0-7 #200 (silt) 0-7 #200 (silt)
The material list for the roadway is shorter than the stage or amphitheater; it only
requires two different grades of gravel as seen in the table above. The proposed design for
the roadway (including the turnaround) covers an area of 41,918 square feet. A volume of
2585 cubic yards of uncompacted 1.5” gravel is required for the base layer, and 862 cubic
yards of uncompacted ¾” gravel is required for the road surface layer. A cross section of
the proposed gravel road can be seen below (Figure 61).

70
Figure 61: Proposed Roadway Cross-Section
4.5. Pavilion
4.5.1. Product
The final design for the covered pavilion being used for the drop-off/pick-up
location was designed in three stages: the roofing materials, the lumber structure, and the
foundation materials. The roof’s bottom layer is composed of sheets of ¾“ plywood. The
plywood is covered with 15lb asphalt saturated felt, which is covered by asphalt shingles,
completing the roof design. The roofing sits on a system of 21 wooden trusses spaced at 3ft
on center, each spanning 32ft. The trusses are made of 2” x 8” lumber and are connected
by gusset plates. Ten 6x6 lumber columns and four 2x8 support beams, one on each side of
each set of columns, running the length of the pavilion support the trusses. The foundation
for the pavilion is made of two parts, a 4in thick concrete slab on grade and the concrete
base systems for the wooden columns designed by Sonotube. A 3D rendered image of the
proposed pavilion can be seen below (Figure 62).
Figure 62: Rendered Pavilion Image
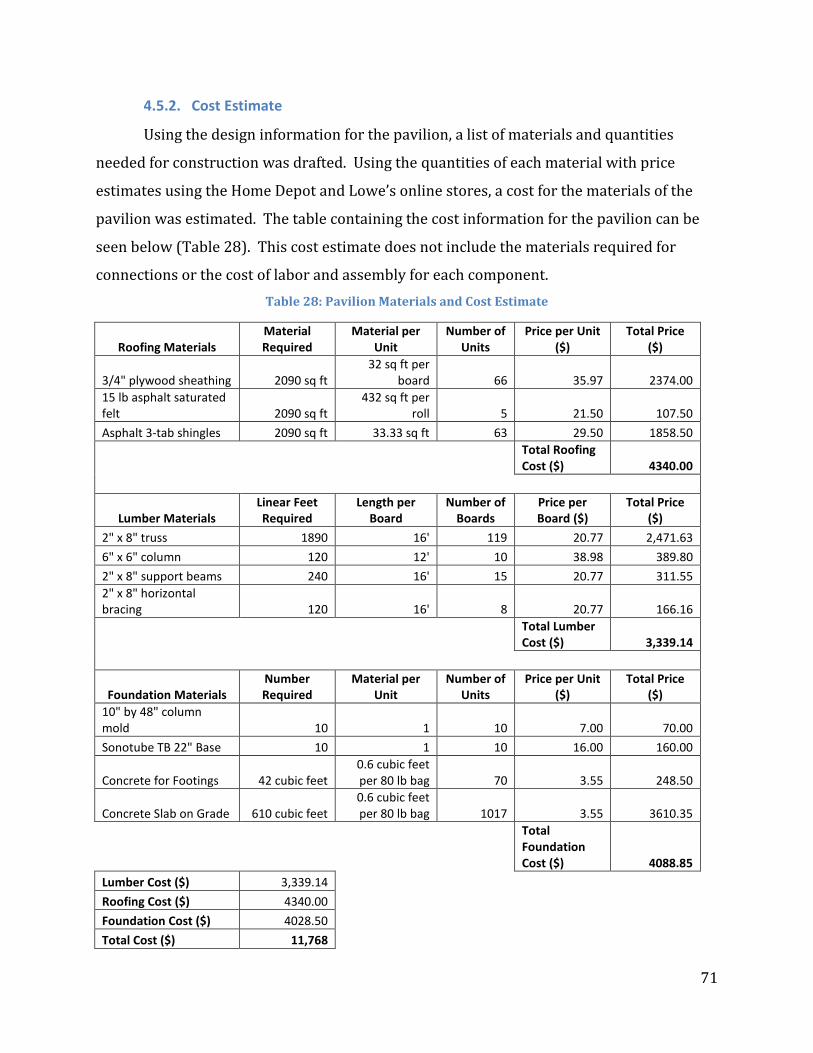
71
4.5.2. Cost Estimate
Using the design information for the pavilion, a list of materials and quantities
needed for construction was drafted. Using the quantities of each material with price
estimates using the Home Depot and Lowe’s online stores, a cost for the materials of the
pavilion was estimated. The table containing the cost information for the pavilion can be
seen below (Table 28). This cost estimate does not include the materials required for
connections or the cost of labor and assembly for each component. Table 28: Pavilion Materials and Cost Estimate
Roofing Materials Material Required
Material per Unit
Number of Units
Price per Unit ($)
Total Price ($)
3/4" plywood sheathing 2090 sq ft 32 sq ft per
board 66 35.97 2374.00 15 lb asphalt saturated felt 2090 sq ft
432 sq ft per roll 5 21.50 107.50
Asphalt 3-tab shingles 2090 sq ft 33.33 sq ft 63 29.50 1858.50
Total Roofing Cost ($) 4340.00
Lumber Materials Linear Feet Required
Length per Board
Number of Boards
Price per Board ($)
Total Price ($)
2" x 8" truss 1890 16' 119 20.77 2,471.63 6" x 6" column 120 12' 10 38.98 389.80 2" x 8" support beams 240 16' 15 20.77 311.55 2" x 8" horizontal bracing 120 16' 8 20.77 166.16
Total Lumber Cost ($) 3,339.14
Foundation Materials Number Required
Material per Unit
Number of Units
Price per Unit ($)
Total Price ($)
10" by 48" column mold 10 1 10 7.00 70.00 Sonotube TB 22" Base 10 1 10 16.00 160.00
Concrete for Footings 42 cubic feet 0.6 cubic feet per 80 lb bag 70 3.55 248.50
Concrete Slab on Grade 610 cubic feet 0.6 cubic feet per 80 lb bag 1017 3.55 3610.35
Total Foundation Cost ($) 4088.85
Lumber Cost ($) 3,339.14 Roofing Cost ($) 4340.00 Foundation Cost ($) 4028.50 Total Cost ($) 11,768

72
5. Conclusion
Over the span of this project, the MQP team has addressed several issues presented
by George and Paula DeTellis, the owners and operators of Camp Woodhaven. The process
undertaken by the team included defining the scope and possible solutions of each issue,
performing background research on each of the selected issues, creating preliminary
designs based on the results of the research, evaluating the different design alternatives,
and lastly, finalizing the details of the selected design. The team has designed a brand new
stage, amphitheater, covered pavilion, and alterations to the existing roadway to address
the needs of the client to assist in their goal of future expansion. Each section of the MQP
has been completed with three primary objectives: satisfying the desires of the client,
staying within the cost parameters outlined by the client, and the general safety of the
individuals participating in the camp’s activities. Two rendered images of the proposed
additions to Camp Woodhaven can be seen below (Figure 63). The next step for George and
Paula to take in this process is to submit a Preliminary Site Plan to the Planning Board of
the town for approval, followed by additional design consultation, and finally construction
of the designed structures.
Figure 63: Amphitheater View (Left) & Aerial View (Right)

73
6. References
AASHTO. A policy on geometric design of highways and streets - 2004. 2004. American Planning Association- Massachusetts Chapter. Sustainable Neighborhood Road
Design. May 2011. Web. De Chiara, Joseph, and Michael J. Crosbie. Time-Saver Standards for Building Types. New
York: McGraw-Hill, 2001. Print. Doelle, Leslie L. Environmental Acoustics. New York: McGraw-Hill, 1972. Print. Herz, Rudolph et al, Architects’ Data. Hamden: Archon Books, 1970. Print. Home Depot. Build a Retaining Wall by Paverstone. Web. 06 Mar. 2013.
ICC eCodes Premium Designer Collection. 2009 International Building Code., 2009. Print. Illinois Department of Transportation. Chapter 41: Special Design Elements. Jan. 2006. Web.
John Wiley & Sons, Architect's Studio Companion: Rules of Thumb for Preliminary Design
(5th Edition). 2011. Print. Locke Truss and Overhead Doors “Roof Truss Span Tables." N.p., n.d. Web.
<http://locketruss.com/roofspan.pdf>.
Maine Department of Environmental Protection "Gravel Road Maintenance Manual." N.p., Apr. 2010. Web.
Mass.Gov. MassGIS Data- NRCS SSURGO-Certified Soils 2012. Web. 7 Dec. 2012.
<http://www.mass.gov/anf/research-and-tech/it-serv-and-support/application-serv/office-of-geographic-information-massgis/datalayers/soi.html>
Moore, J. E. Design for Good Acoustics and Noise Control. London: Macmillan, 1978. Print. Neufert, Ernst, and Rudolf Herz. Architects' Data. London: Lockwood, 1970. Print.
Penn State University "Weights Of Building Materials, Agricultural Commodities, and Floor
Loads For Buildings.", n.d. Web. <http://pubs.cas.psu.edu/freepubs/pdfs/h20.pdf>.
Ramsey, Charles George, et al. Ramsey/Sleeper Architectural Graphic Standards. New York: John Wiley & Sons, 2000. Print.
Robert Snow Means Company, and R.S. Means Company. "Building Construction Cost Data."
Building construction cost data (2011)Print.

74
Sonoco Construction Products. Sonoco, 2013. Web. <http://sonotube.com/>. Strong, Judith, MyiLibrary, and Association of British Theatre Technicians. Theatre
Buildings: A Design Guide. New York, NY: Routledge, 2010. Print. Tutt, Patricia et al, VNR Metric Handbook of Architectural Standard. New York: Van Reinhold
Company, 1979. Print. United States Department of Agriculture, Natural Resources Conservation Service Soil Data
Mart.. n.d. Web. 7 Dec. 2012 <http://soildatamart.nrcs.usda.gov/Report.aspx?Survey=MA613&UseState=MA>
United States. Massachusetts Department of Transportation. Highway Division. Project
Development & Design Guide. Massachusetts Department of Transportation Highway Division, 2006. Web. 17 Feb. 2013.
West Boylston, MA, Zoning Bylaws 2011, May 16 2011. Town of West Boylston, November
13, 2012 < http://www.westboylston-ma.gov/Pages/WBoylstonMA_Bylaws/zoning_bylaws>

75
Appendix A: Camp Woodhaven MQP Proposal
Introduction
Camp Woodhaven was founded over sixty years ago, and has been led by the same
family for four generations. The camp aims to provide campers with a fun, safe, and
traditional camp experience during the summer. Camp Woodhaven, run by George and
Paula Detellis, currently draws about 350 children during the summer. They wish to have
three new structures built on the camp property that will augment the camp's current
functions as well as anticipated growth of the camp in the coming years.
Every morning and evening the entire camp comes together for flag ceremonies. In
the past this has been done at the flagpole near the parking lot. Theatrical productions are
also an important part of the camp experience, as are gatherings when parents come to
visit. The clients want a gathering place that will be more updated and provide a more
enjoyable experience. They have suggested the construction of an amphitheater and stage
to solve this problem while maintaining a traditional camp feel. Although these two
structures are separate for design purposes, they will be integrated when the final product
is recommended to the clients. The amphitheater and stage address their primary need at
this point in time. The proposed site for the amphitheater and stage is on the open hill
behind the office.
A second problem the clients have confronted is the logistics of picking up and
dropping off campers. The current plan they implement consists of parents driving in a
short loop in front of the office to a stopping area where they drop off or pick up their
children, depending on time of day. This process results in traffic queues that often extend
outside the gates of the camp, impacting neighbors on the road. Pick up and drop off is
currently an inefficient process, and can be improved drastically. A third structure has
been proposed, which will be the focal point of the traffic solution. The right-of-way cutting
through the camp will be widened to allow cars and buses to go both ways simultaneously,
and a pavilion will be erected as a drop off/pick up point. This will greatly simplify the
logistics of the camp, saving time and frustration for all parties involved. The goal of this
part of the MQP is to provide specifications and a location for the pavilion as well as a
practical and legal way to make the right-of-way more accessible.
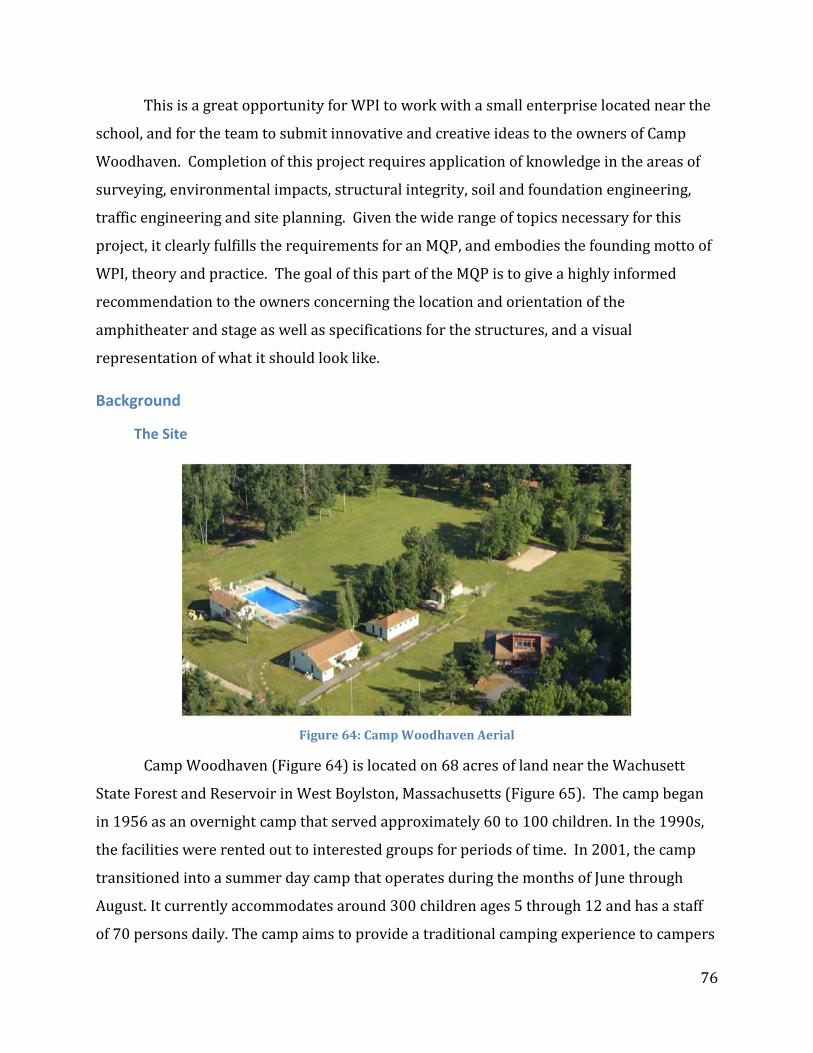
76
This is a great opportunity for WPI to work with a small enterprise located near the
school, and for the team to submit innovative and creative ideas to the owners of Camp
Woodhaven. Completion of this project requires application of knowledge in the areas of
surveying, environmental impacts, structural integrity, soil and foundation engineering,
traffic engineering and site planning. Given the wide range of topics necessary for this
project, it clearly fulfills the requirements for an MQP, and embodies the founding motto of
WPI, theory and practice. The goal of this part of the MQP is to give a highly informed
recommendation to the owners concerning the location and orientation of the
amphitheater and stage as well as specifications for the structures, and a visual
representation of what it should look like.
Background
The Site
Figure 64: Camp Woodhaven Aerial
Camp Woodhaven (Figure 64) is located on 68 acres of land near the Wachusett
State Forest and Reservoir in West Boylston, Massachusetts (Figure 65). The camp began
in 1956 as an overnight camp that served approximately 60 to 100 children. In the 1990s,
the facilities were rented out to interested groups for periods of time. In 2001, the camp
transitioned into a summer day camp that operates during the months of June through
August. It currently accommodates around 300 children ages 5 through 12 and has a staff
of 70 persons daily. The camp aims to provide a traditional camping experience to campers
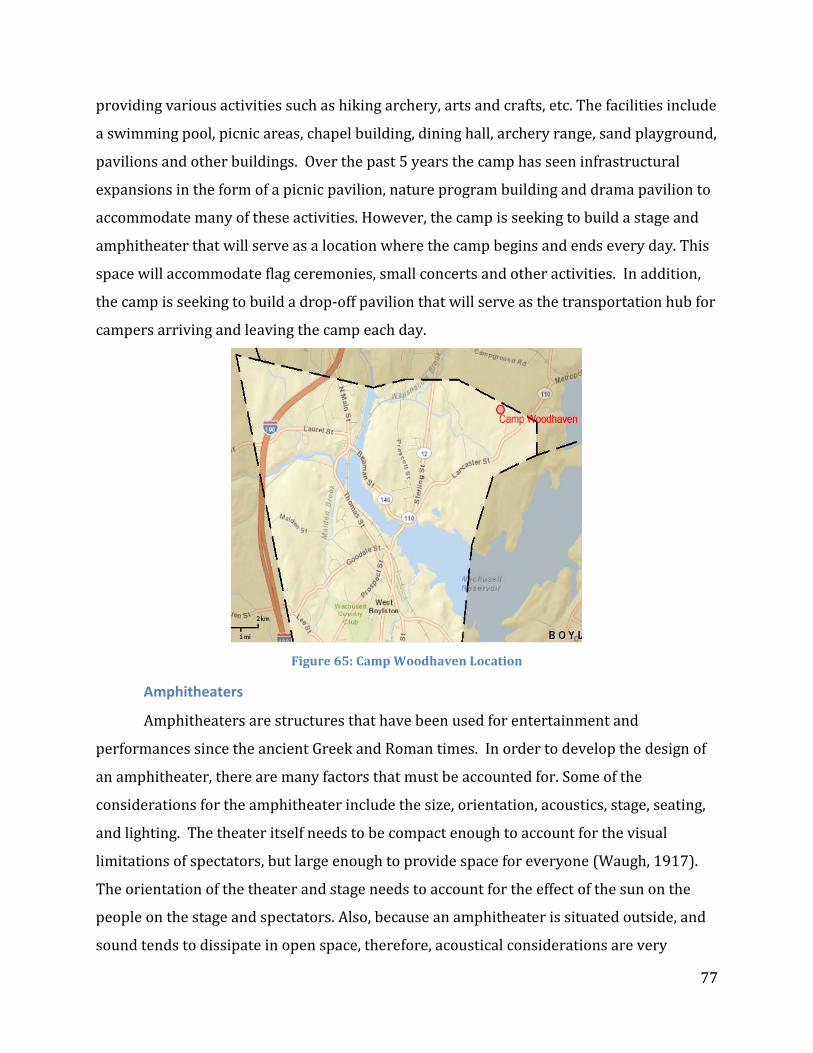
77
providing various activities such as hiking archery, arts and crafts, etc. The facilities include
a swimming pool, picnic areas, chapel building, dining hall, archery range, sand playground,
pavilions and other buildings. Over the past 5 years the camp has seen infrastructural
expansions in the form of a picnic pavilion, nature program building and drama pavilion to
accommodate many of these activities. However, the camp is seeking to build a stage and
amphitheater that will serve as a location where the camp begins and ends every day. This
space will accommodate flag ceremonies, small concerts and other activities. In addition,
the camp is seeking to build a drop-off pavilion that will serve as the transportation hub for
campers arriving and leaving the camp each day.
Figure 65: Camp Woodhaven Location
Amphitheaters
Amphitheaters are structures that have been used for entertainment and
performances since the ancient Greek and Roman times. In order to develop the design of
an amphitheater, there are many factors that must be accounted for. Some of the
considerations for the amphitheater include the size, orientation, acoustics, stage, seating,
and lighting. The theater itself needs to be compact enough to account for the visual
limitations of spectators, but large enough to provide space for everyone (Waugh, 1917).
The orientation of the theater and stage needs to account for the effect of the sun on the
people on the stage and spectators. Also, because an amphitheater is situated outside, and
sound tends to dissipate in open space, therefore, acoustical considerations are very

78
important. Typically amphitheaters are designed with various sound amplification systems
that address this issue (Butler, 2002).
There are various examples of amphitheaters that have been constructed. Many
make attempts to take advantage of the natural slope and/or the acoustic properties of the
location. For example the Camden Library Amphitheater, located in Camden Maine (Figure
66) was designed with tiered seating to supply a view to the spectators. Its orientation
from the library is 45 degrees clockwise which allowed for a scenic backdrop (TCLF, 2012).
Another example of an amphitheater is the Quarry Amphitheater located in Cambridge,
Australia (Figure 67). It was constructed into the existing cliff using grass covered
limestone terraces to seat approximately 500 people. The Nehalem Campground
Amphitheater in the Nehalem Bay State Park, Oregon (Figure 68). The amphitheater
appears to be three seating sections that use the existing slope of the site to provide
spectators with a view of the performers on the stage. The Scott Outdoor Amphitheater at
Swarthmore College shown below (Figure 69) is another example of an amphitheater using
terraces to alter the landscape and add an aesthetic appear to the campus.
Figure 66: Camden Library Amphitheater
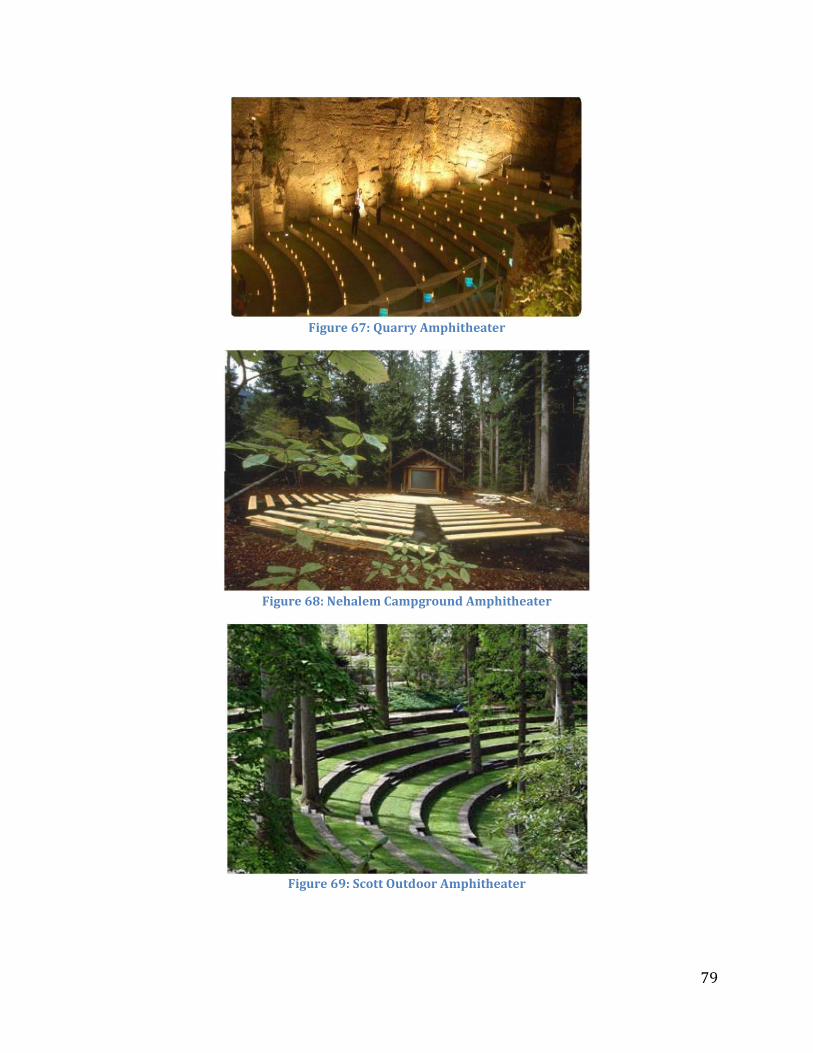
79
Figure 67: Quarry Amphitheater
Figure 68: Nehalem Campground Amphitheater
Figure 69: Scott Outdoor Amphitheater
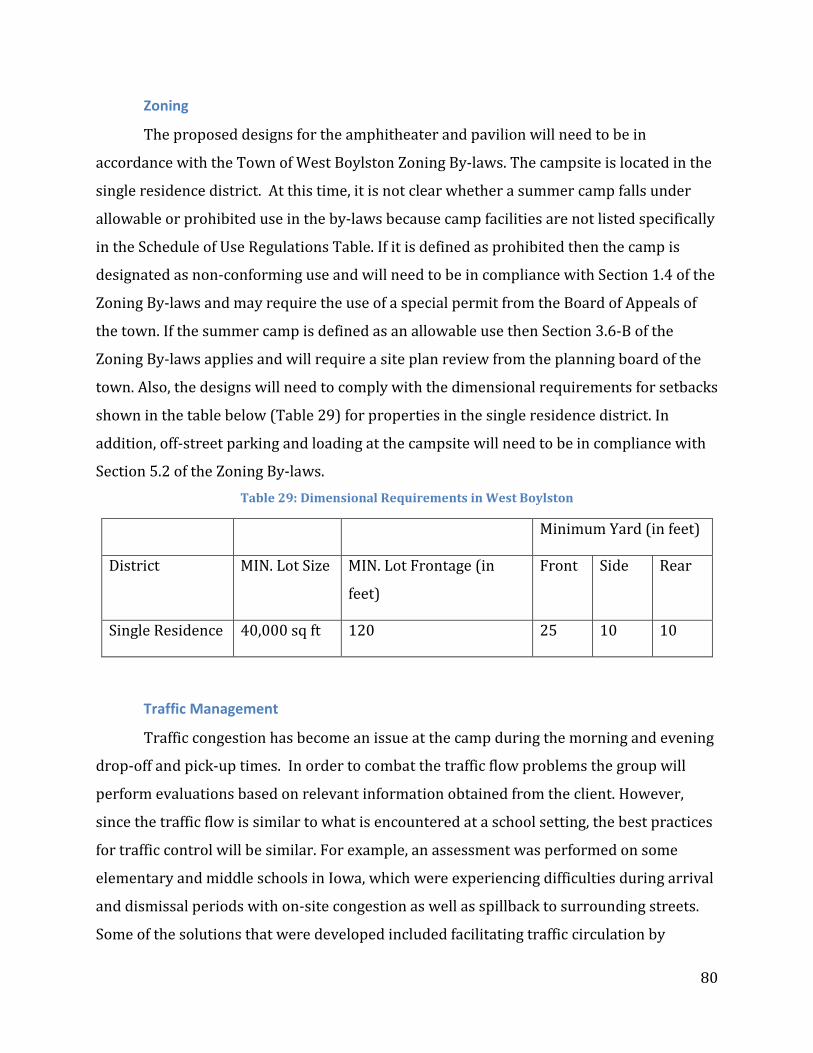
80
Zoning
The proposed designs for the amphitheater and pavilion will need to be in
accordance with the Town of West Boylston Zoning By-laws. The campsite is located in the
single residence district. At this time, it is not clear whether a summer camp falls under
allowable or prohibited use in the by-laws because camp facilities are not listed specifically
in the Schedule of Use Regulations Table. If it is defined as prohibited then the camp is
designated as non-conforming use and will need to be in compliance with Section 1.4 of the
Zoning By-laws and may require the use of a special permit from the Board of Appeals of
the town. If the summer camp is defined as an allowable use then Section 3.6-B of the
Zoning By-laws applies and will require a site plan review from the planning board of the
town. Also, the designs will need to comply with the dimensional requirements for setbacks
shown in the table below (Table 29) for properties in the single residence district. In
addition, off-street parking and loading at the campsite will need to be in compliance with
Section 5.2 of the Zoning By-laws. Table 29: Dimensional Requirements in West Boylston
Minimum Yard (in feet)
District MIN. Lot Size MIN. Lot Frontage (in
feet)
Front Side Rear
Single Residence 40,000 sq ft 120 25 10 10
Traffic Management
Traffic congestion has become an issue at the camp during the morning and evening
drop-off and pick-up times. In order to combat the traffic flow problems the group will
perform evaluations based on relevant information obtained from the client. However,
since the traffic flow is similar to what is encountered at a school setting, the best practices
for traffic control will be similar. For example, an assessment was performed on some
elementary and middle schools in Iowa, which were experiencing difficulties during arrival
and dismissal periods with on-site congestion as well as spillback to surrounding streets.
Some of the solutions that were developed included facilitating traffic circulation by
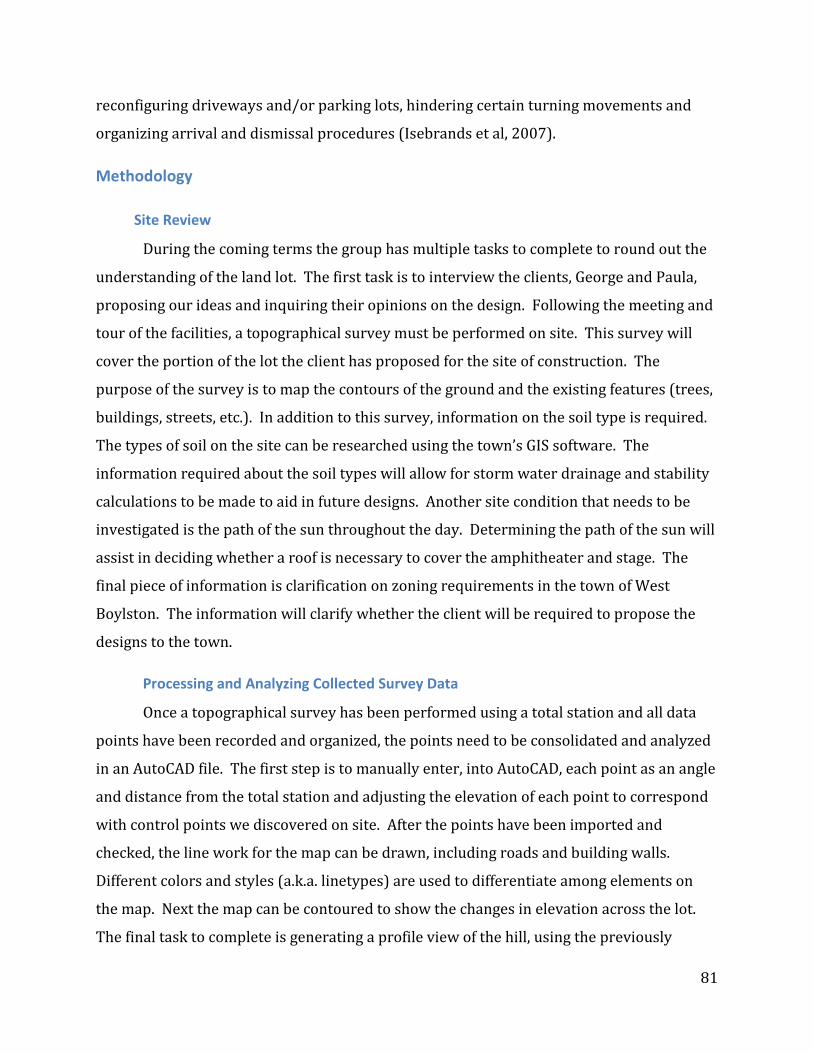
81
reconfiguring driveways and/or parking lots, hindering certain turning movements and
organizing arrival and dismissal procedures (Isebrands et al, 2007).
Methodology
Site Review
During the coming terms the group has multiple tasks to complete to round out the
understanding of the land lot. The first task is to interview the clients, George and Paula,
proposing our ideas and inquiring their opinions on the design. Following the meeting and
tour of the facilities, a topographical survey must be performed on site. This survey will
cover the portion of the lot the client has proposed for the site of construction. The
purpose of the survey is to map the contours of the ground and the existing features (trees,
buildings, streets, etc.). In addition to this survey, information on the soil type is required.
The types of soil on the site can be researched using the town’s GIS software. The
information required about the soil types will allow for storm water drainage and stability
calculations to be made to aid in future designs. Another site condition that needs to be
investigated is the path of the sun throughout the day. Determining the path of the sun will
assist in deciding whether a roof is necessary to cover the amphitheater and stage. The
final piece of information is clarification on zoning requirements in the town of West
Boylston. The information will clarify whether the client will be required to propose the
designs to the town.
Processing and Analyzing Collected Survey Data
Once a topographical survey has been performed using a total station and all data
points have been recorded and organized, the points need to be consolidated and analyzed
in an AutoCAD file. The first step is to manually enter, into AutoCAD, each point as an angle
and distance from the total station and adjusting the elevation of each point to correspond
with control points we discovered on site. After the points have been imported and
checked, the line work for the map can be drawn, including roads and building walls.
Different colors and styles (a.k.a. linetypes) are used to differentiate among elements on
the map. Next the map can be contoured to show the changes in elevation across the lot.
The final task to complete is generating a profile view of the hill, using the previously
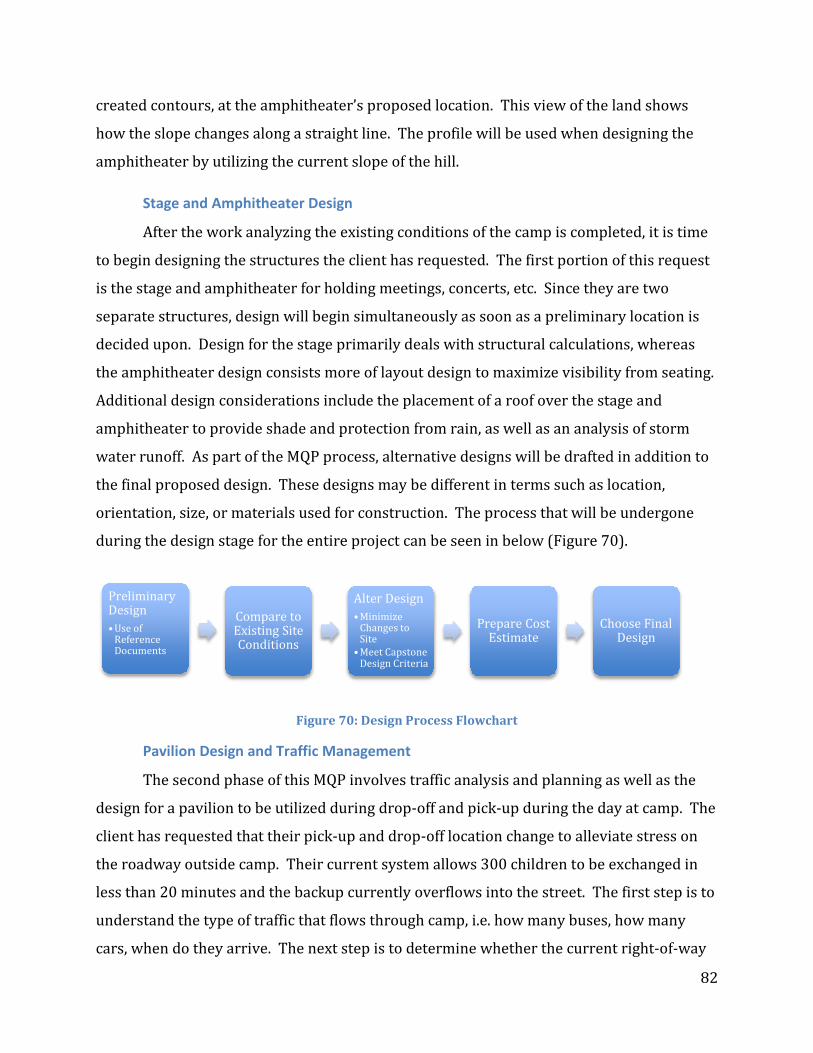
82
created contours, at the amphitheater’s proposed location. This view of the land shows
how the slope changes along a straight line. The profile will be used when designing the
amphitheater by utilizing the current slope of the hill.
Stage and Amphitheater Design
After the work analyzing the existing conditions of the camp is completed, it is time
to begin designing the structures the client has requested. The first portion of this request
is the stage and amphitheater for holding meetings, concerts, etc. Since they are two
separate structures, design will begin simultaneously as soon as a preliminary location is
decided upon. Design for the stage primarily deals with structural calculations, whereas
the amphitheater design consists more of layout design to maximize visibility from seating.
Additional design considerations include the placement of a roof over the stage and
amphitheater to provide shade and protection from rain, as well as an analysis of storm
water runoff. As part of the MQP process, alternative designs will be drafted in addition to
the final proposed design. These designs may be different in terms such as location,
orientation, size, or materials used for construction. The process that will be undergone
during the design stage for the entire project can be seen in below (Figure 70).
Figure 70: Design Process Flowchart
Pavilion Design and Traffic Management
The second phase of this MQP involves traffic analysis and planning as well as the
design for a pavilion to be utilized during drop-off and pick-up during the day at camp. The
client has requested that their pick-up and drop-off location change to alleviate stress on
the roadway outside camp. Their current system allows 300 children to be exchanged in
less than 20 minutes and the backup currently overflows into the street. The first step is to
understand the type of traffic that flows through camp, i.e. how many buses, how many
cars, when do they arrive. The next step is to determine whether the current right-of-way
Preliminary Design •Use of
Reference Documents
Compare to Existing Site Conditions
Alter Design •Minimize
Changes to Site •Meet Capstone
Design Criteria
Prepare Cost Estimate
Choose Final Design
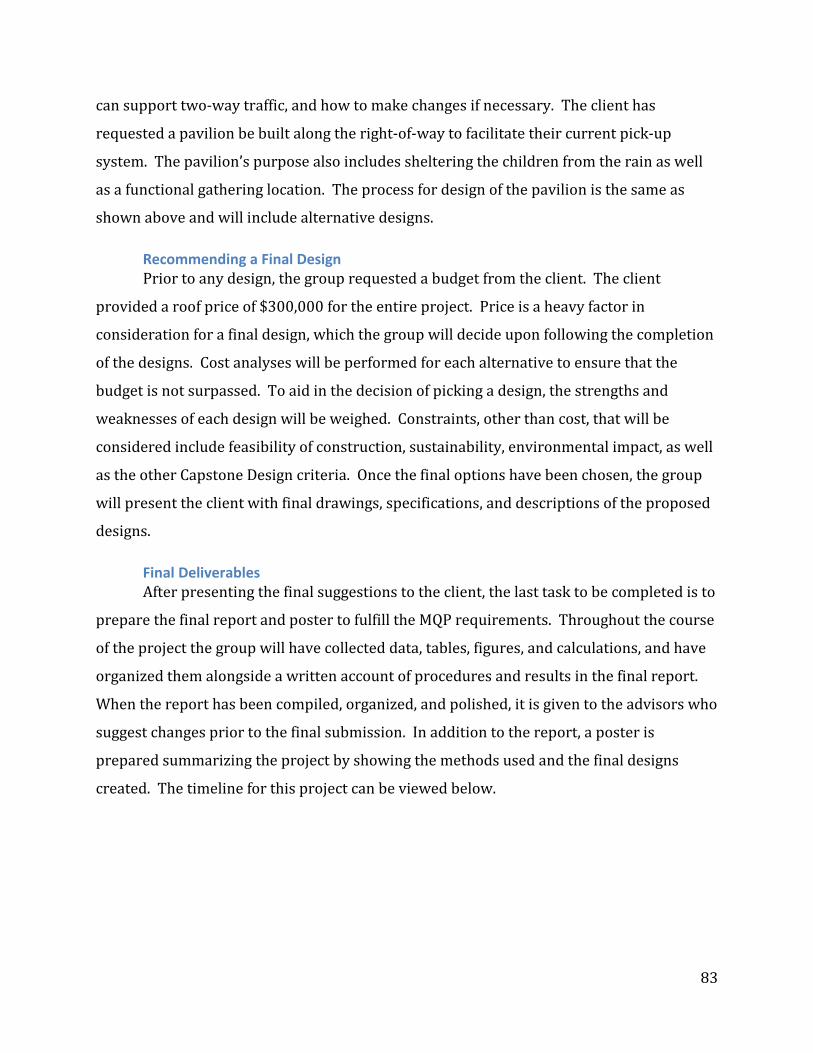
83
can support two-way traffic, and how to make changes if necessary. The client has
requested a pavilion be built along the right-of-way to facilitate their current pick-up
system. The pavilion’s purpose also includes sheltering the children from the rain as well
as a functional gathering location. The process for design of the pavilion is the same as
shown above and will include alternative designs.
Recommending a Final Design Prior to any design, the group requested a budget from the client. The client
provided a roof price of $300,000 for the entire project. Price is a heavy factor in
consideration for a final design, which the group will decide upon following the completion
of the designs. Cost analyses will be performed for each alternative to ensure that the
budget is not surpassed. To aid in the decision of picking a design, the strengths and
weaknesses of each design will be weighed. Constraints, other than cost, that will be
considered include feasibility of construction, sustainability, environmental impact, as well
as the other Capstone Design criteria. Once the final options have been chosen, the group
will present the client with final drawings, specifications, and descriptions of the proposed
designs.
Final Deliverables After presenting the final suggestions to the client, the last task to be completed is to
prepare the final report and poster to fulfill the MQP requirements. Throughout the course
of the project the group will have collected data, tables, figures, and calculations, and have
organized them alongside a written account of procedures and results in the final report.
When the report has been compiled, organized, and polished, it is given to the advisors who
suggest changes prior to the final submission. In addition to the report, a poster is
prepared summarizing the project by showing the methods used and the final designs
created. The timeline for this project can be viewed below.

84
85
Appendix B: Site Visit Write-Up 9-5-2012
After the first interaction we had with Paula, as well as our first visit to the site, we
found many of our original questions answered. We learned that the capacity of the
amphitheater would have to be larger than what we had originally expected (around 500
people to account for staff, parents, and the growth of the camp). Probably the most
important addition to our list of tasks was to determine the optimum orientation of the
amphitheater, with the goal of minimizing the suns impact on the children. Paula and
George had conflicting ideas about the orientation of the theater; one thought it should be
rotated towards the rest of the camp, while the other wanted it to be perpendicular to the
road. We will have to study the path of the sun throughout the day to determine the best
orientation for our theater’s design. If the sun cannot be avoided we will have to consider
including a temporary roof over the amphitheater.
The second task Paula has requested of us is to change the traffic flow for the camp.
Next to the amphitheater, we are requested to design a pavilion to be used for pick-up and
drop-off every day. We will need to see if traffic can be directed all the way down the right-
of-way to a turn-a-round and then back to the road. This will help alleviate traffic on the
road leading to the camp, thereby allowing neighbors to go travel easier.
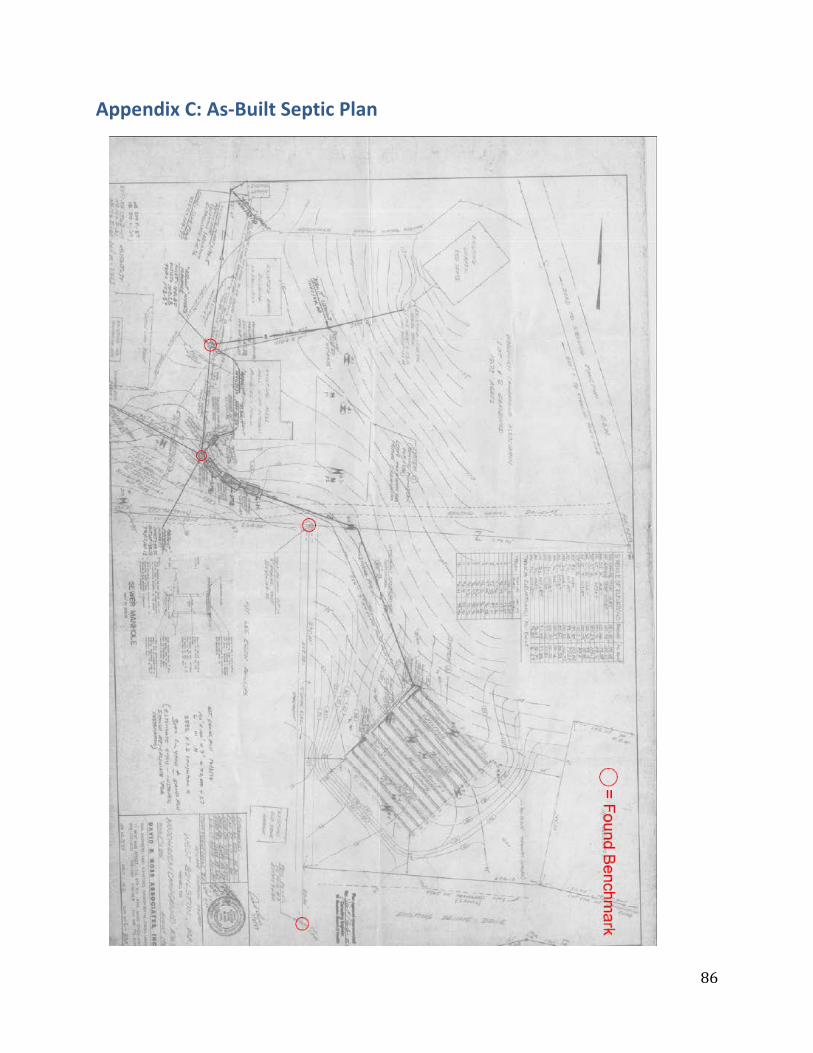
86
Appendix C: As-Built Septic Plan

87
Appendix D: Survey Data Table 9-14-2012

88
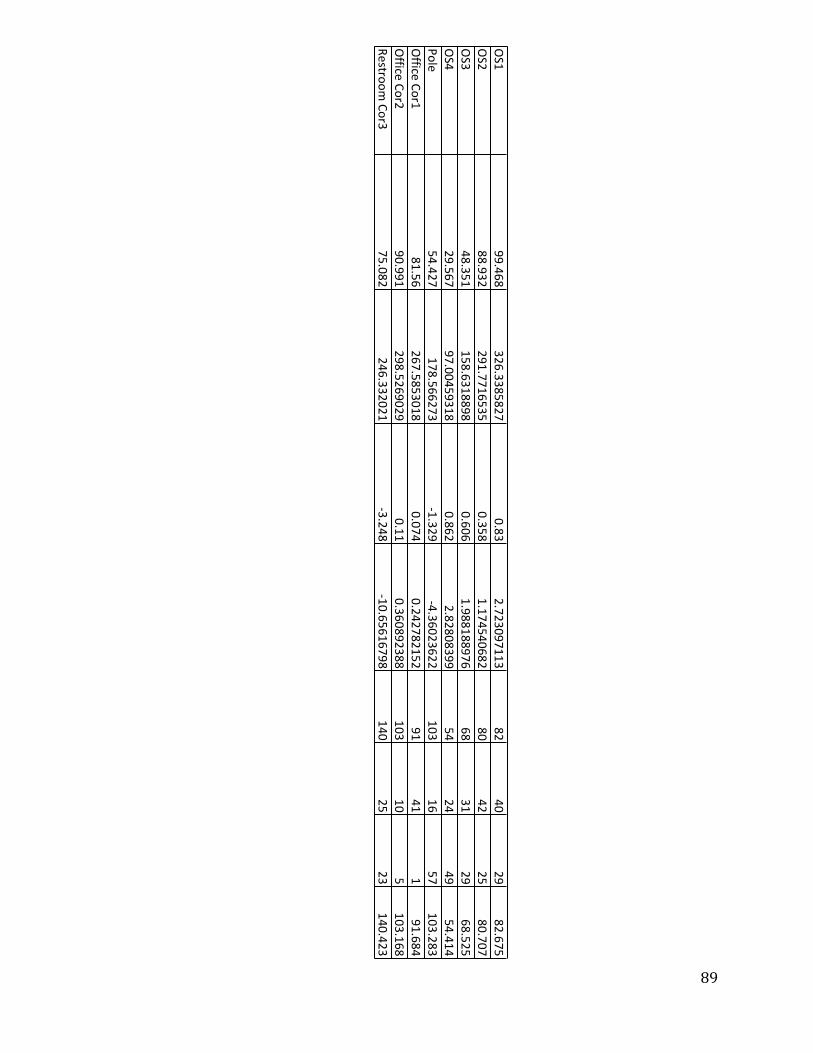
89
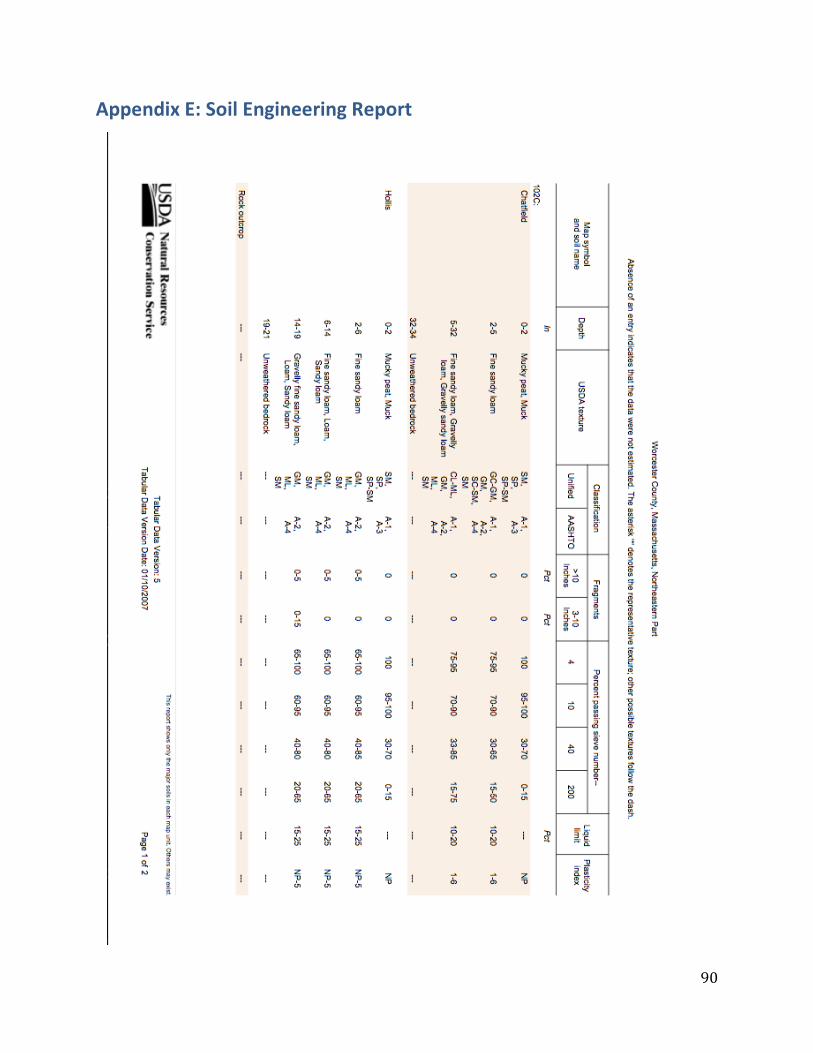
90
Appendix E: Soil Engineering Report
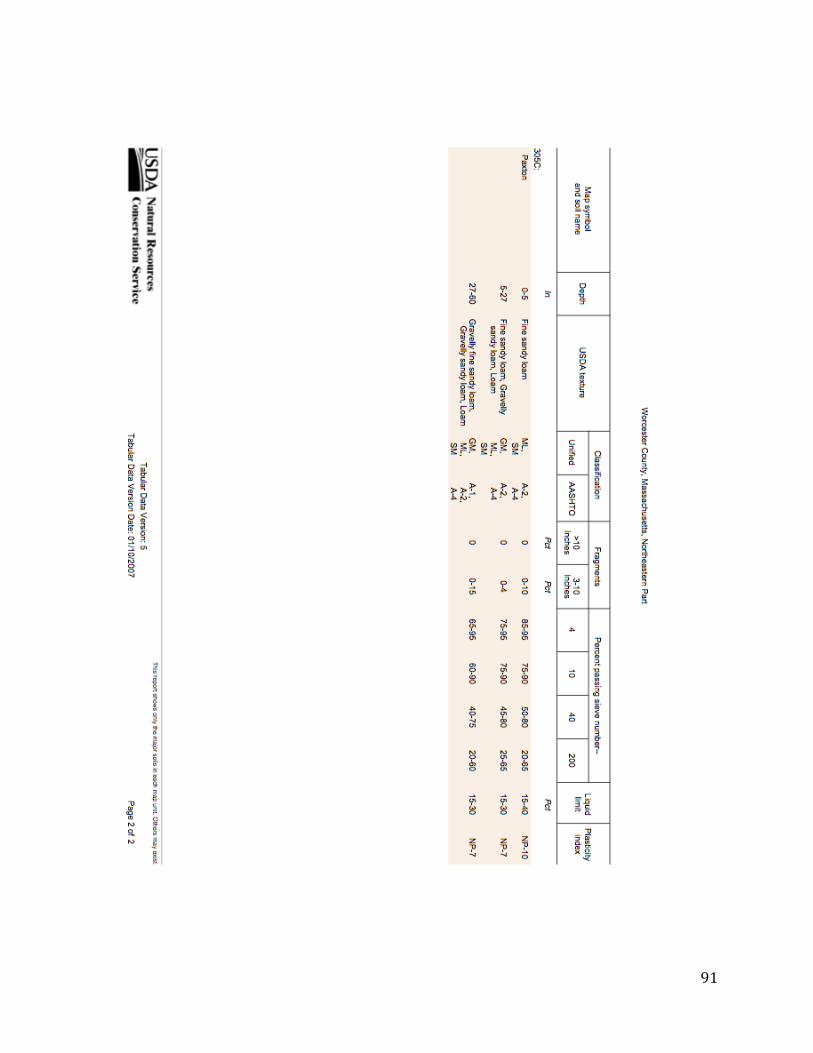
91

92
Appendix F: Preliminary Site Grading Calculations
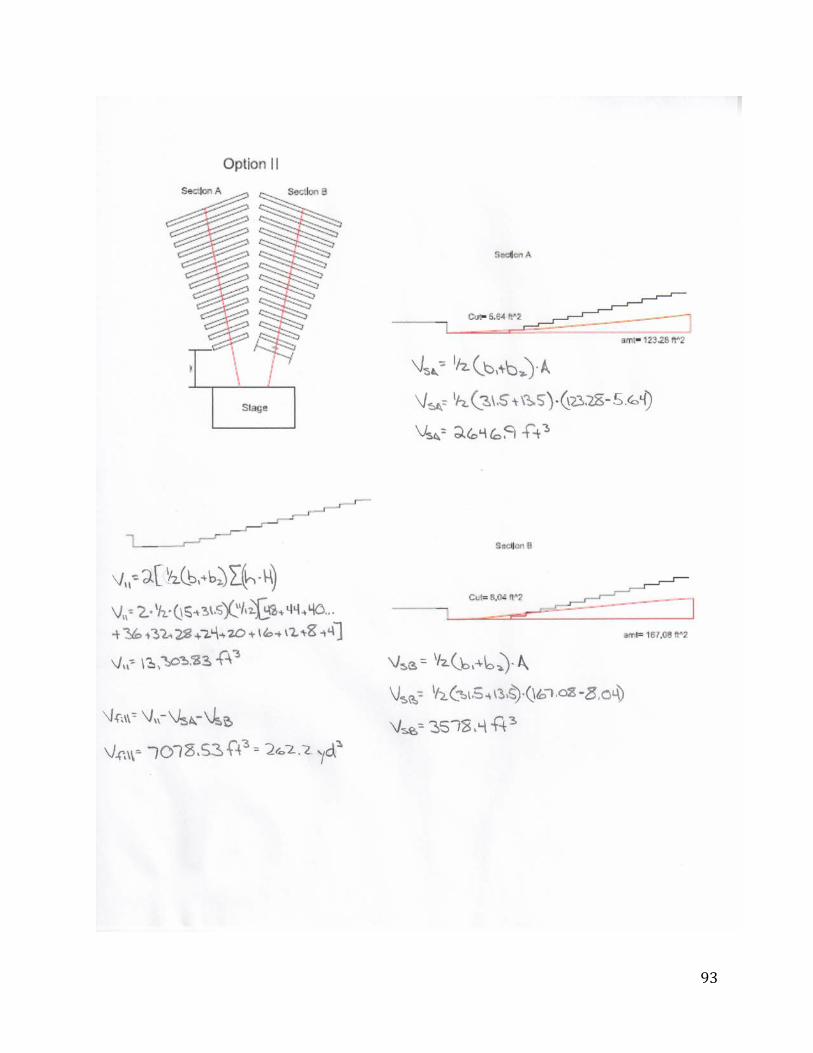
93
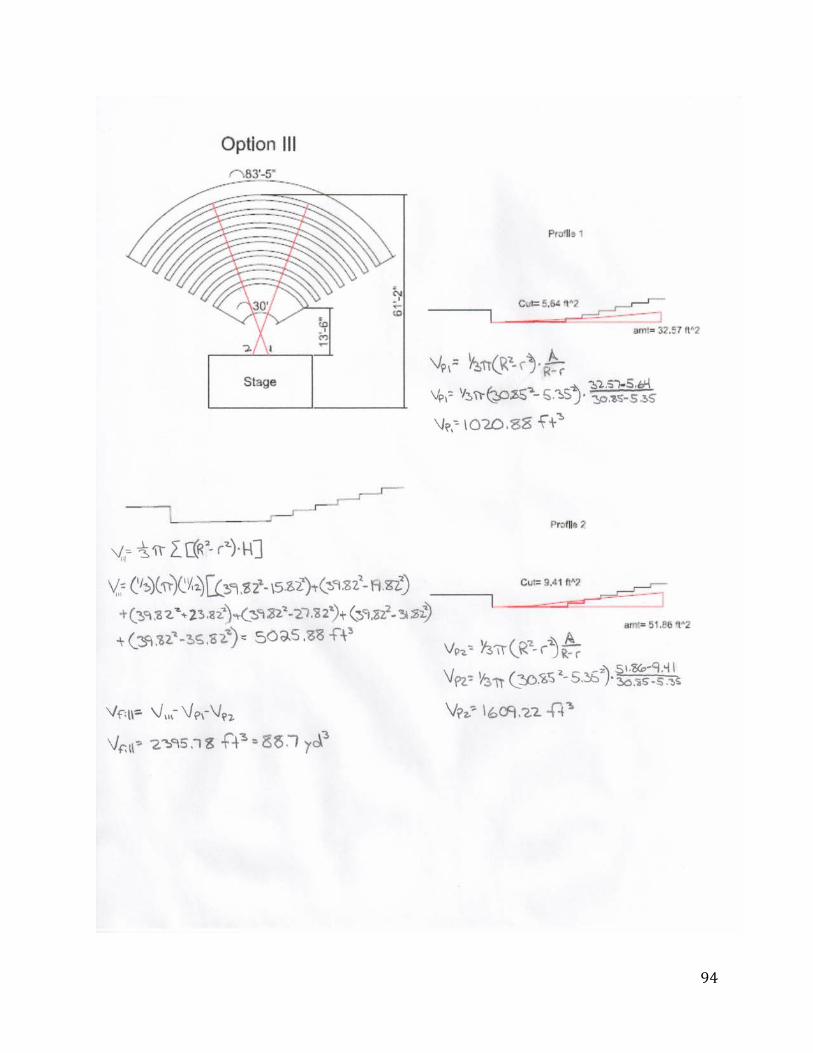
94

95
Appendix G: Final Site Grading Hand Calculations
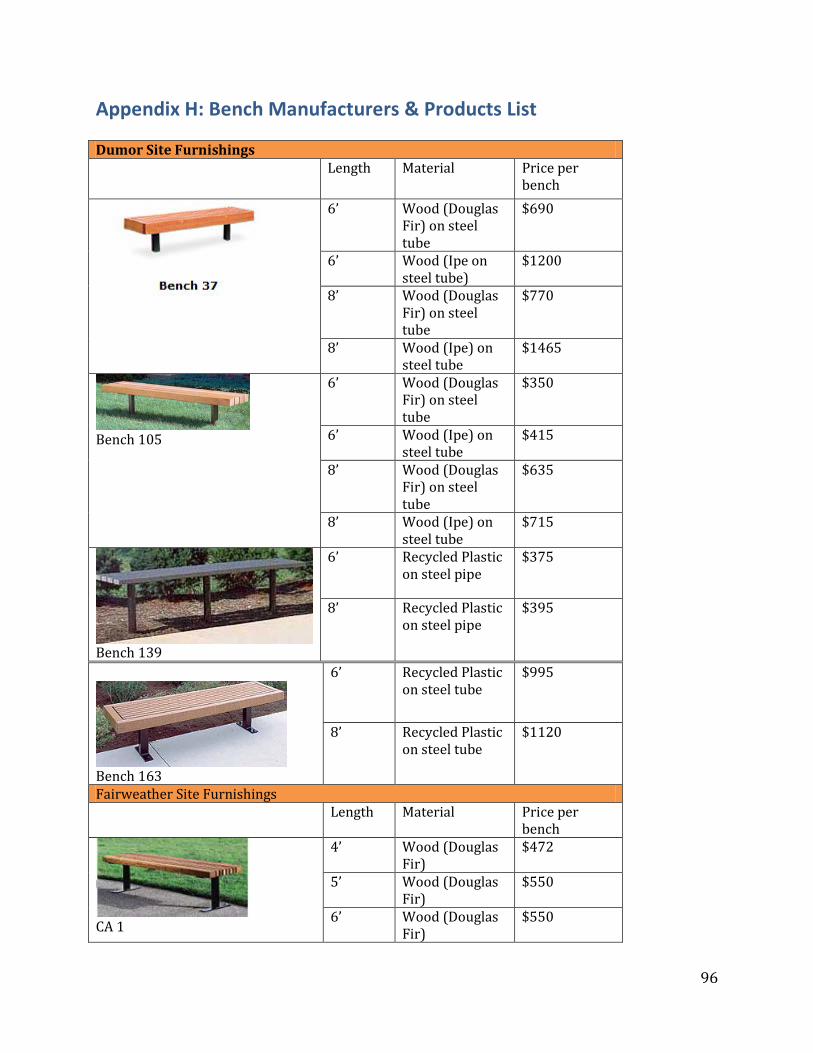
96
Appendix H: Bench Manufacturers & Products List Dumor Site Furnishings Length Material Price per
bench
6’ Wood (Douglas Fir) on steel tube
$690
6’ Wood (Ipe on steel tube)
$1200
8’ Wood (Douglas Fir) on steel tube
$770
8’ Wood (Ipe) on steel tube
$1465
Bench 105
6’ Wood (Douglas Fir) on steel tube
$350
6’ Wood (Ipe) on steel tube
$415
8’ Wood (Douglas Fir) on steel tube
$635
8’ Wood (Ipe) on steel tube
$715
Bench 139
6’ Recycled Plastic on steel pipe
$375
8’ Recycled Plastic on steel pipe
$395
Bench 163
6’ Recycled Plastic on steel tube
$995
8’ Recycled Plastic on steel tube
$1120
Fairweather Site Furnishings Length Material Price per
bench
CA 1
4’ Wood (Douglas Fir)
$472
5’ Wood (Douglas Fir)
$550
6’ Wood (Douglas Fir)
$550

97
8’ Wood (Douglas Fir)
$680
4’ Recycled Plastic $567 5’ Recycled Plastic $712 6’ Recycled Plastic $786 8’ Recycled Plastic $960
Peterson Length Material Price per
bench
BN-84 BN-96
7’ Precast Concrete
$606
8’ Precast Concrete
$690
PB-SQ
6’ Precast Concrete
$611
8’ Precast Concrete
$715
CB-2
6’ Precast Concrete
$435
MB-R
7’ Precast Concrete
$851
MB1
6’ Steel $361
Site Craft Length Material Price per
bench
Woodcrest BKF
5’ Wood $650 6’ Wood $725
7’ Wood $820
8’ Wood $925 T-300 5’ $610
6’ $685

98
7’ $775 8’ $865
Custom Design Precast Length Material Price per
bench
The Madison Bench
5’ Precast Concrete
$388
The A & M Bench
6’ Precast Concrete
$448
The Texas Bench
8’ Precast Concrete
$499
ColorStone Length Material Price per
bench
BV 338 Series
5’ Recycled Plastic on steel pipe
$487
6’ Recycled Plastic on steel pipe
$578
7’ Recycled Plastic on steel pipe
$635
8’ Recycled Plastic on steel pipe
$767
Brandon Bench- Straight
6’ Precast Concrete
$352
B6 Slats
6’ Metal (Steel) $402 8’ Metal (Steel) $448
7’-6” Metal (Aluminum )
$290
15’ Metal (Aluminum )
$335
21’ Metal (Aluminum )
$385
27’ Metal (Aluminum )
$440

99
Thomas Steele
WDF2
6’ Wood $809 8’ Wood $969 6’ Recycled Plastic
$369
8’ Recycled Plastic
$429
Wabash Valley
Signature Series
6’ Steel $189
Signature Series
10’ Steel $306
Signature Series
15’ Steel $412

100
Appendix I: Bench Rank by Cost per Foot
Company Bench Name Length (feet)
Material Price per bench
Cost per foot
Wabash Valley Signature Series 15 Steel $412 $27 Wabash Valley Signature Series 10 Steel $306 $31 Wabash Valley Signature Series 6 Steel $189 $32 Dumor Bench 139 8 Plastic $395 $49 Thomas Steele WDF2 8 Plastic $429 $54 Color Stone B6 Slats 8 Steel $448 $56 Dumor Bench 105 6 Wood-Douglas Fir $350 $58 Color Stone Brandon Bench 6 Concrete $352 $59 Peterson MB-1 6 Steel $361 $60 Thomas Steele WDF2 6 Plastic $369 $62 Custom Design Precast
The Texas Bench
8 Concrete $499 $62
Dumor Bench 139 6 Plastic $375 $63 Color Stone B6 Slats 6 Steel $402 $67 Dumor Bench 105 6 Wood-Ipe $415 $69 Peterson CB-2 6 Concrete $435 $73 Custom Design Precast The A&M Bench
6 Concrete $448 $75
Custom Design Precast
The Madison Bench
5 Concrete $388 $78
Dumor Bench 105 8 Wood-Douglas Fir $635 $79 Fairweather CA1 8 Wood-Douglas Fir $680 $85 Peterson BN-96 8 Concrete $690 $86 Peterson BN-84 7 Concrete $606 $87 Dumor Bench 105 8 Wood-Ipe $715 $89 Peterson PB-SQ 8 Concrete $715 $89 Color Stone BV 338 Series 7 Plastic $635 $91 Fairweather CA1 6 Wood-Douglas Fir $550 $92 Color Stone BV 338 Series 8 Plastic $767 $96 Dumor Bench 37 8 Wood-Douglas Fir $770 $96 Color Stone BV 338 Series 6 Plastic $578 $96 Color Stone BV 338 Series 5 Plastic $487 $97 Peterson PB-SQ 6 Concrete $611 $102 Site Craft T-300 8 Wood $865 $108 Fairweather CA1 5 Wood-Douglas Fir $550 $110 Site Craft T-300 7 Wood $775 $111 Site Craft T-300 6 Wood $685 $114 Dumor Bench 37 6 Wood-Douglas Fir $690 $115

101
Site Craft Woodcrest BKF 8 Wood $925 $116 Site Craft Woodcrest BKF 7 Wood $820 $117 Fairweather CA1 4 Wood-Douglas Fir $472 $118 Fairweather CA1 8 Plastic $960 $120 Site Craft Woodcrest BKF 6 Wood $725 $121 Thomas Steele WDF2 8 Plastic $969 $121 Peterson MB-R 7 Concrete $851 $122 Site Craft T-300 5 Wood $610 $122 Site Craft Woodcrest BKF 5 Wood $650 $130 Fairweather CA1 6 Plastic $786 $131 Thomas Steele WDF2 6 Plastic $809 $135 Dumor Bench 163 8 Plastic $1,120 $140 Fairweather CA1 4 Plastic $567 $142 Fairweather CA1 5 Plastic $712 $142 Dumor Bench 163 6 Plastic $995 $166 Dumor Bench 37 8 Wood-Ipe $1,465 $183 Dumor Bench 37 6 Wood-Ipe $1,200 $200
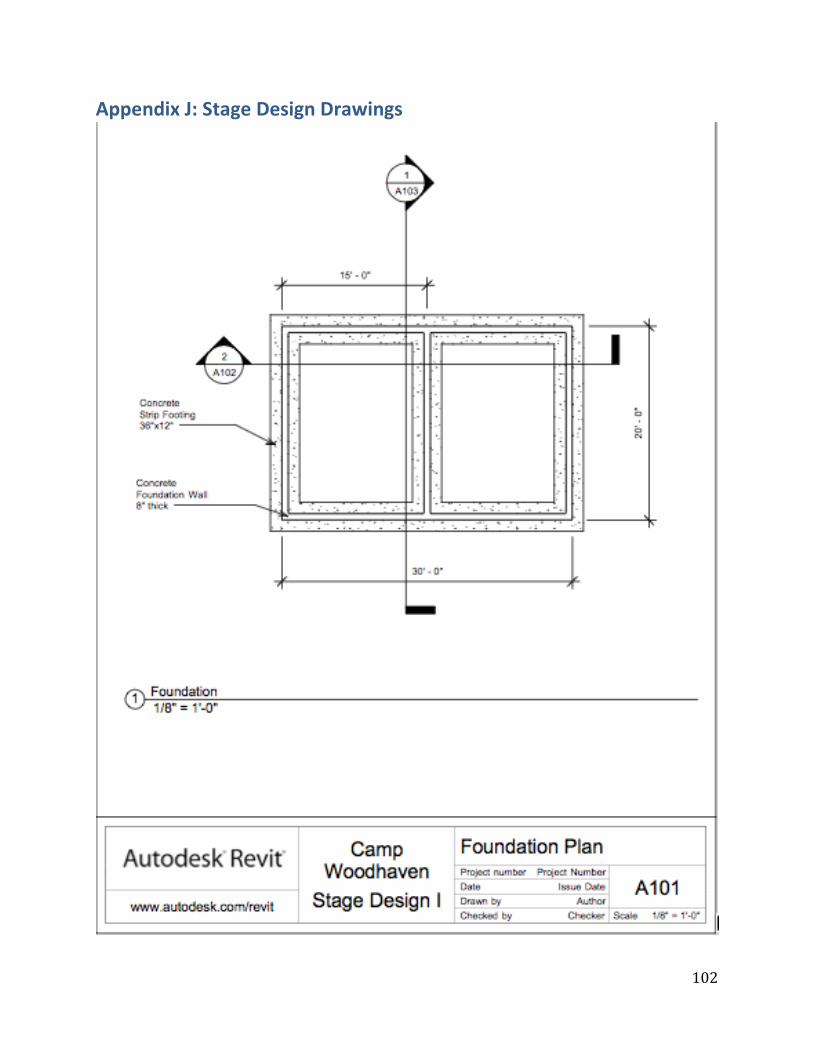
102
Appendix J: Stage Design Drawings

103
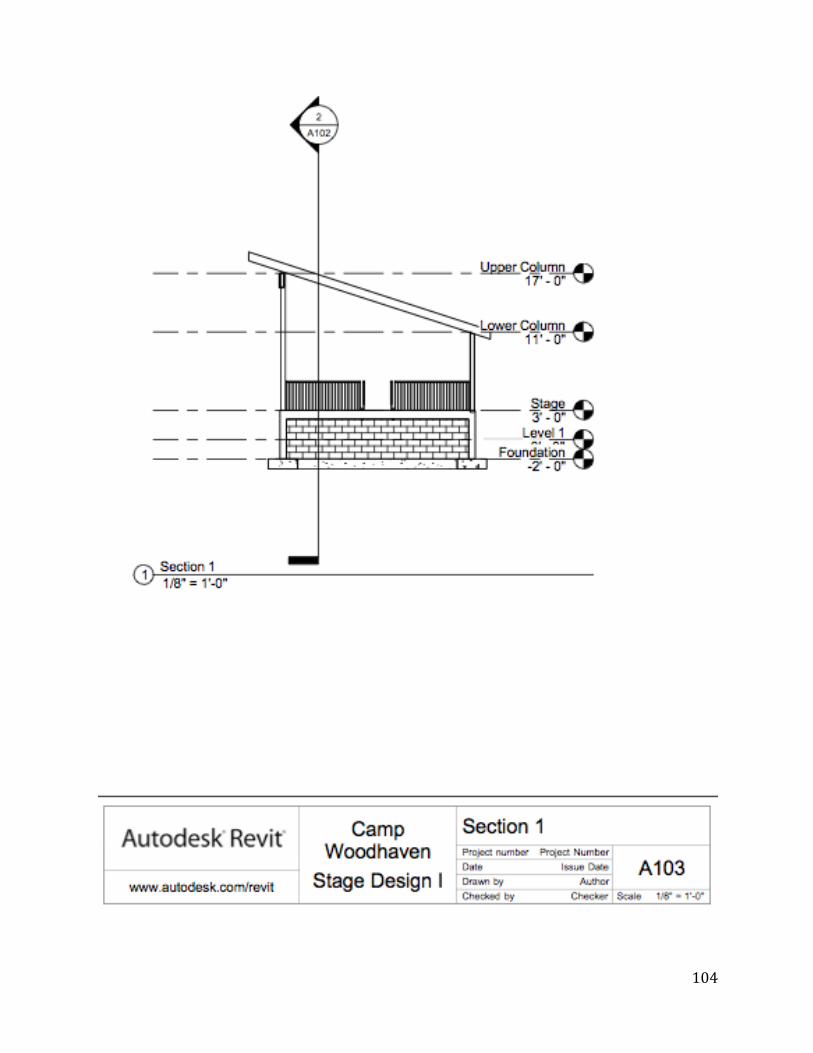
104
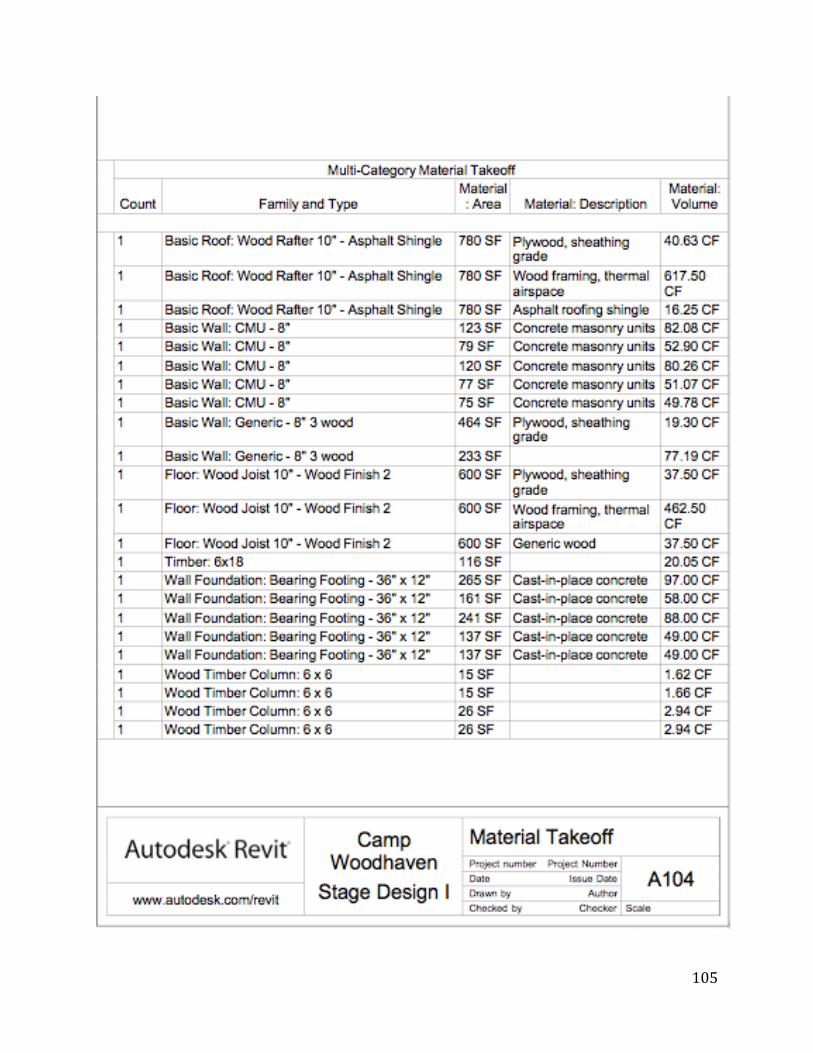
105
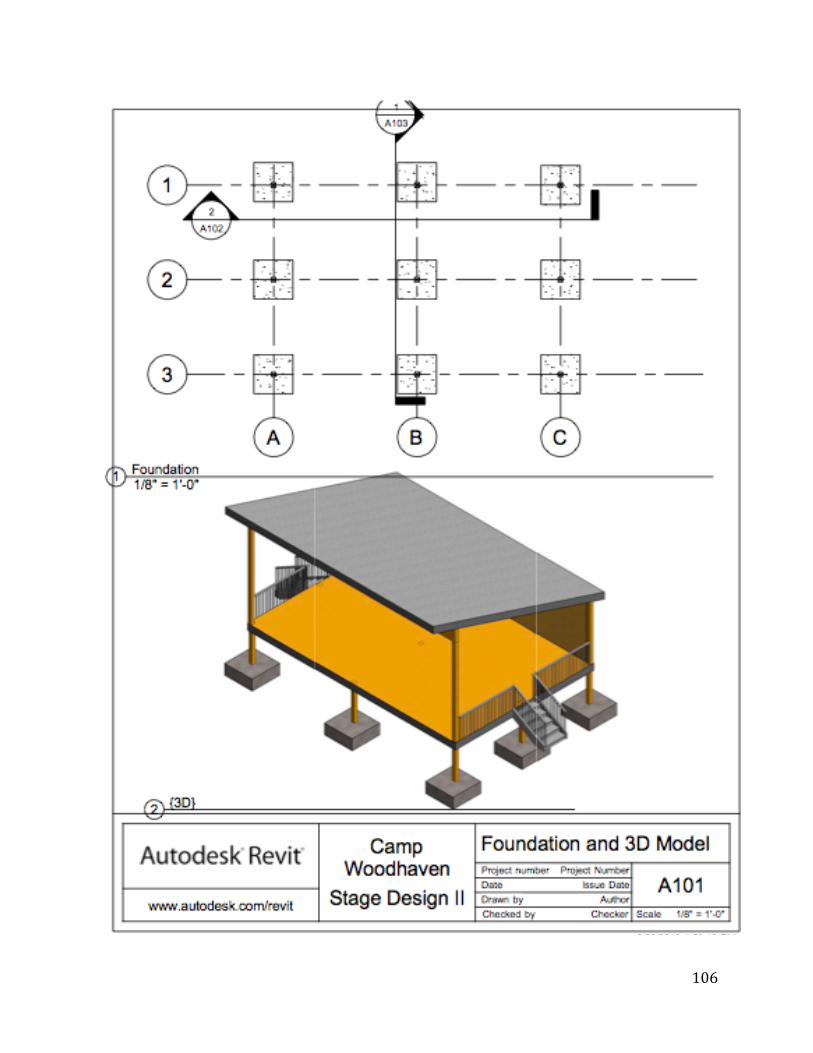
106

107
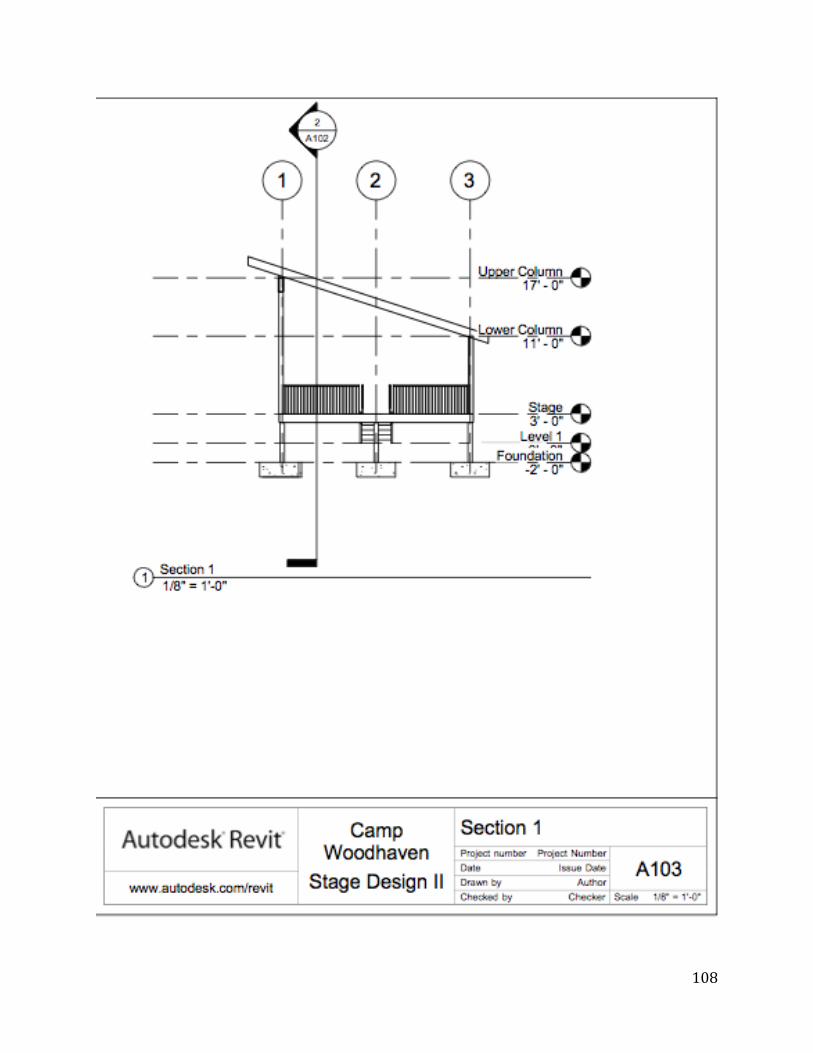
108

109
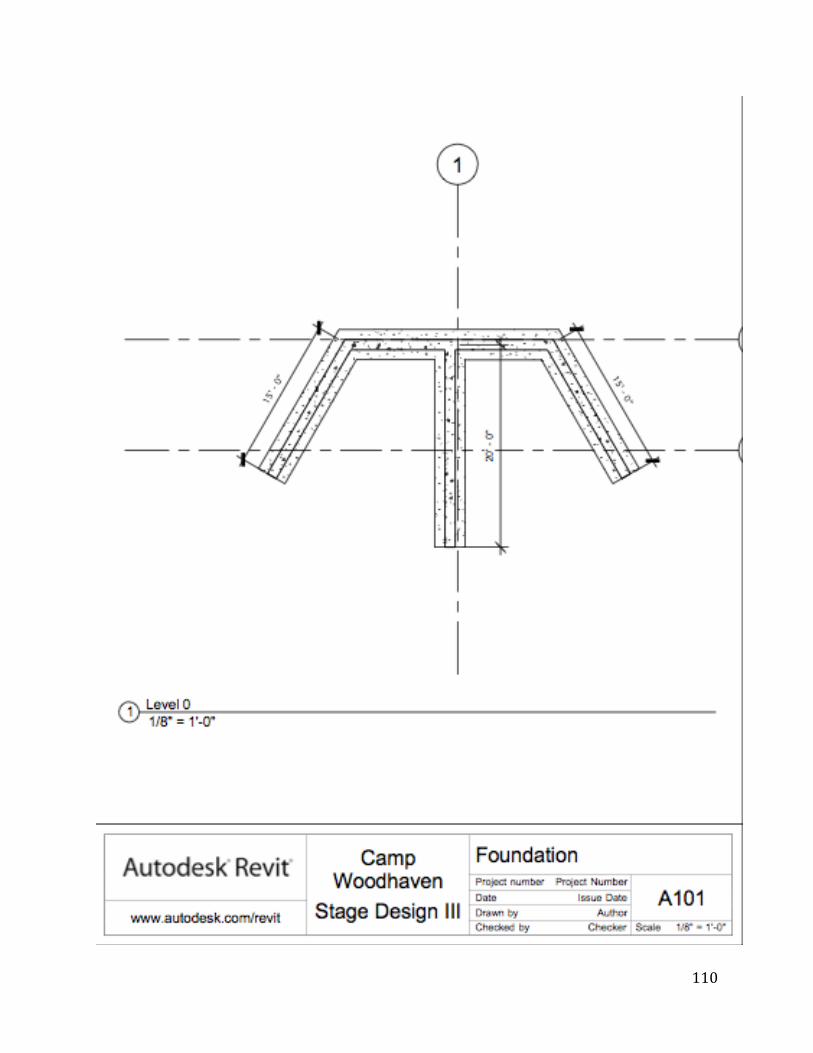
110

111

112

113

114

115

116

117
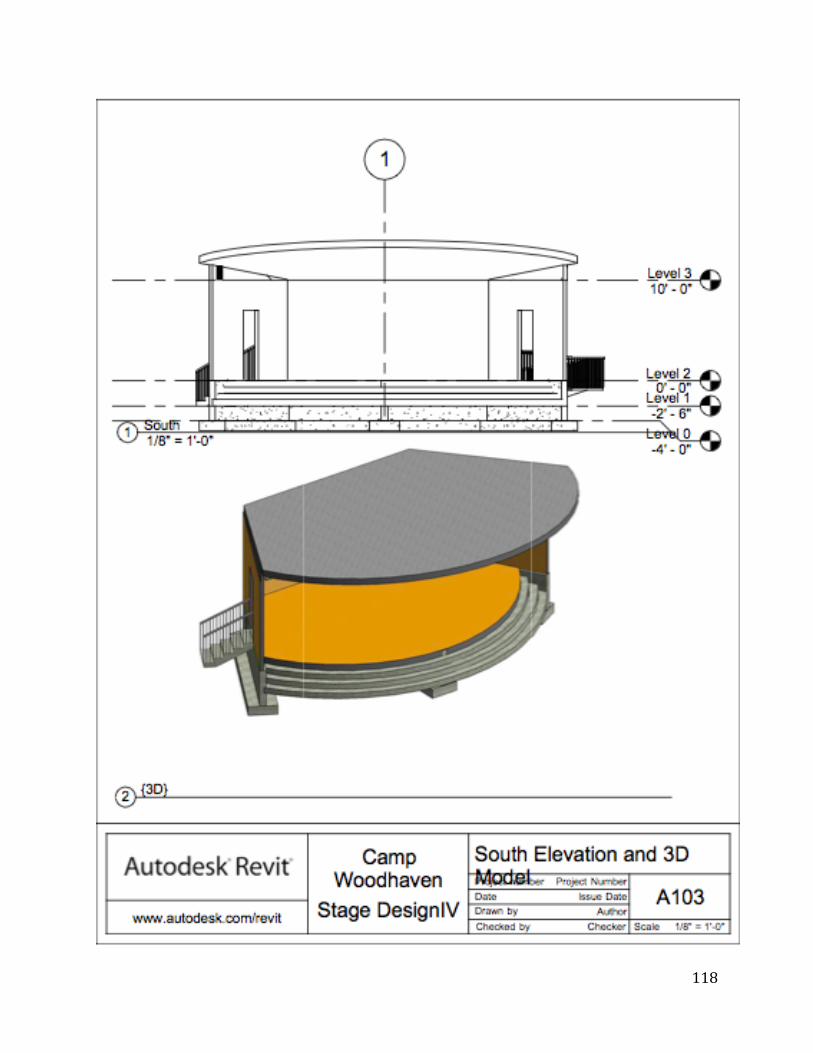
118

119
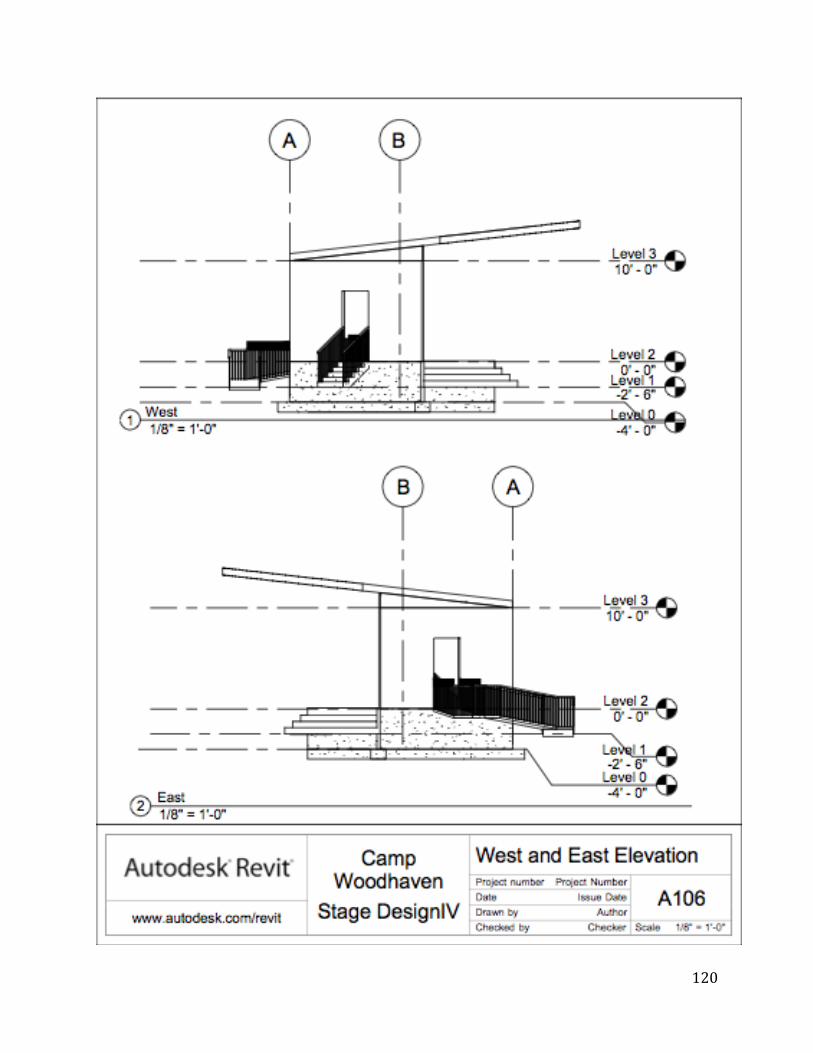
120
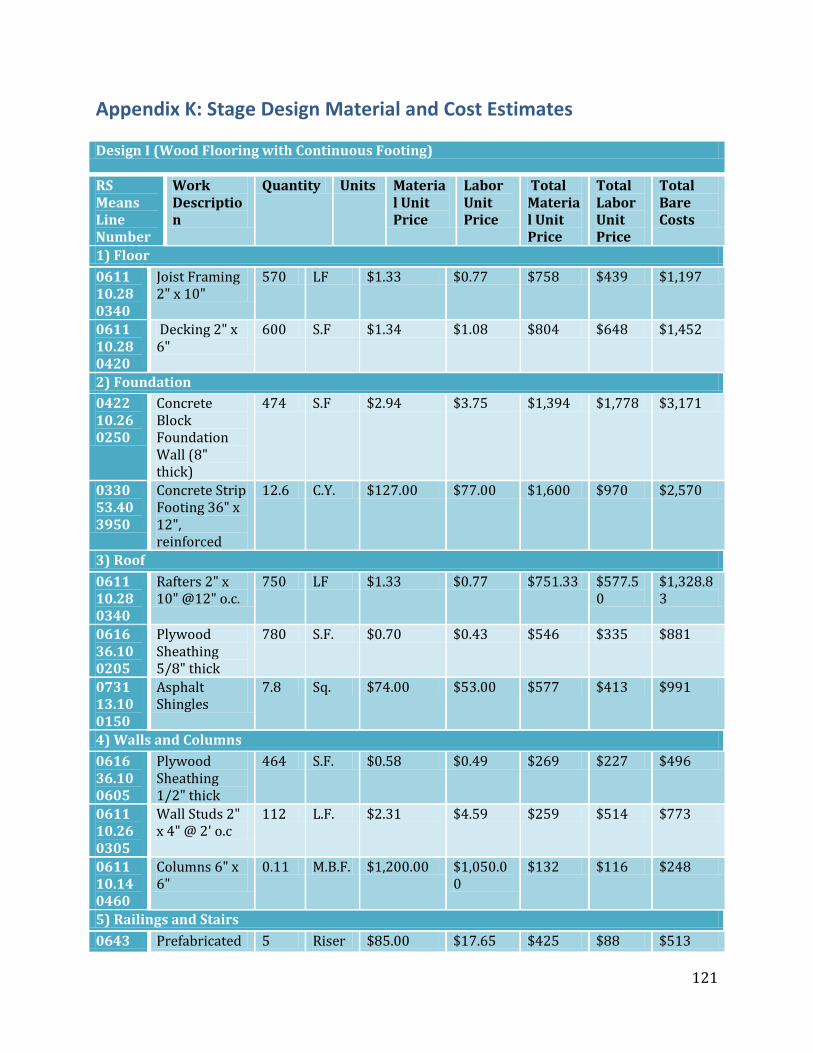
121
Appendix K: Stage Design Material and Cost Estimates Design I (Wood Flooring with Continuous Footing)
RS Means Line Number
Work Description
Quantity Units Material Unit Price
Labor Unit Price
Total Material Unit Price
Total Labor Unit Price
Total Bare Costs
1) Floor 0611 10.28 0340
Joist Framing 2" x 10"
570 LF $1.33 $0.77 $758 $439 $1,197
0611 10.28 0420
Decking 2" x 6"
600 S.F $1.34 $1.08 $804 $648 $1,452
2) Foundation 0422 10.26 0250
Concrete Block Foundation Wall (8" thick)
474 S.F $2.94 $3.75 $1,394 $1,778 $3,171
0330 53.40 3950
Concrete Strip Footing 36" x 12", reinforced
12.6 C.Y. $127.00 $77.00 $1,600 $970 $2,570
3) Roof 0611 10.28 0340
Rafters 2" x 10" @12" o.c.
750 LF $1.33 $0.77 $751.33 $577.50
$1,328.83
0616 36.10 0205
Plywood Sheathing 5/8" thick
780 S.F. $0.70 $0.43 $546 $335 $881
0731 13.10 0150
Asphalt Shingles
7.8 Sq. $74.00 $53.00 $577 $413 $991
4) Walls and Columns 0616 36.10 0605
Plywood Sheathing 1/2" thick
464 S.F. $0.58 $0.49 $269 $227 $496
0611 10.26 0305
Wall Studs 2" x 4" @ 2' o.c
112 L.F. $2.31 $4.59 $259 $514 $773
0611 10.14 0460
Columns 6" x 6"
0.11 M.B.F. $1,200.00 $1,050.00
$132 $116 $248
5) Railings and Stairs 0643 Prefabricated 5 Riser $85.00 $17.65 $425 $88 $513
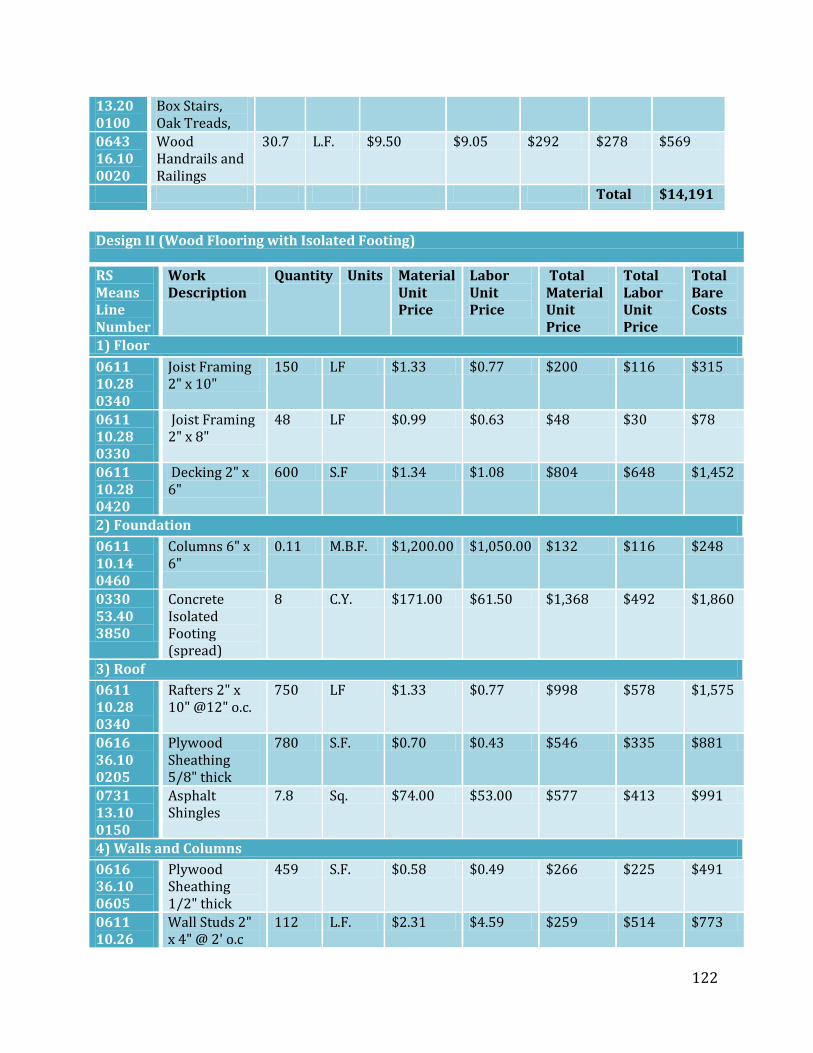
122
13.20 0100
Box Stairs, Oak Treads,
0643 16.10 0020
Wood Handrails and Railings
30.7 L.F. $9.50 $9.05 $292 $278 $569
Total $14,191
Design II (Wood Flooring with Isolated Footing)
RS Means Line Number
Work Description
Quantity Units Material Unit Price
Labor Unit Price
Total Material Unit Price
Total Labor Unit Price
Total Bare Costs
1) Floor 0611 10.28 0340
Joist Framing 2" x 10"
150 LF $1.33 $0.77 $200 $116 $315
0611 10.28 0330
Joist Framing 2" x 8"
48 LF $0.99 $0.63 $48 $30 $78
0611 10.28 0420
Decking 2" x 6"
600 S.F $1.34 $1.08 $804 $648 $1,452
2) Foundation 0611 10.14 0460
Columns 6" x 6"
0.11 M.B.F. $1,200.00 $1,050.00 $132 $116 $248
0330 53.40 3850
Concrete Isolated Footing (spread)
8 C.Y. $171.00 $61.50 $1,368 $492 $1,860
3) Roof 0611 10.28 0340
Rafters 2" x 10" @12" o.c.
750 LF $1.33 $0.77 $998 $578 $1,575
0616 36.10 0205
Plywood Sheathing 5/8" thick
780 S.F. $0.70 $0.43 $546 $335 $881
0731 13.10 0150
Asphalt Shingles
7.8 Sq. $74.00 $53.00 $577 $413 $991
4) Walls and Columns 0616 36.10 0605
Plywood Sheathing 1/2" thick
459 S.F. $0.58 $0.49 $266 $225 $491
0611 10.26
Wall Studs 2" x 4" @ 2' o.c
112 L.F. $2.31 $4.59 $259 $514 $773
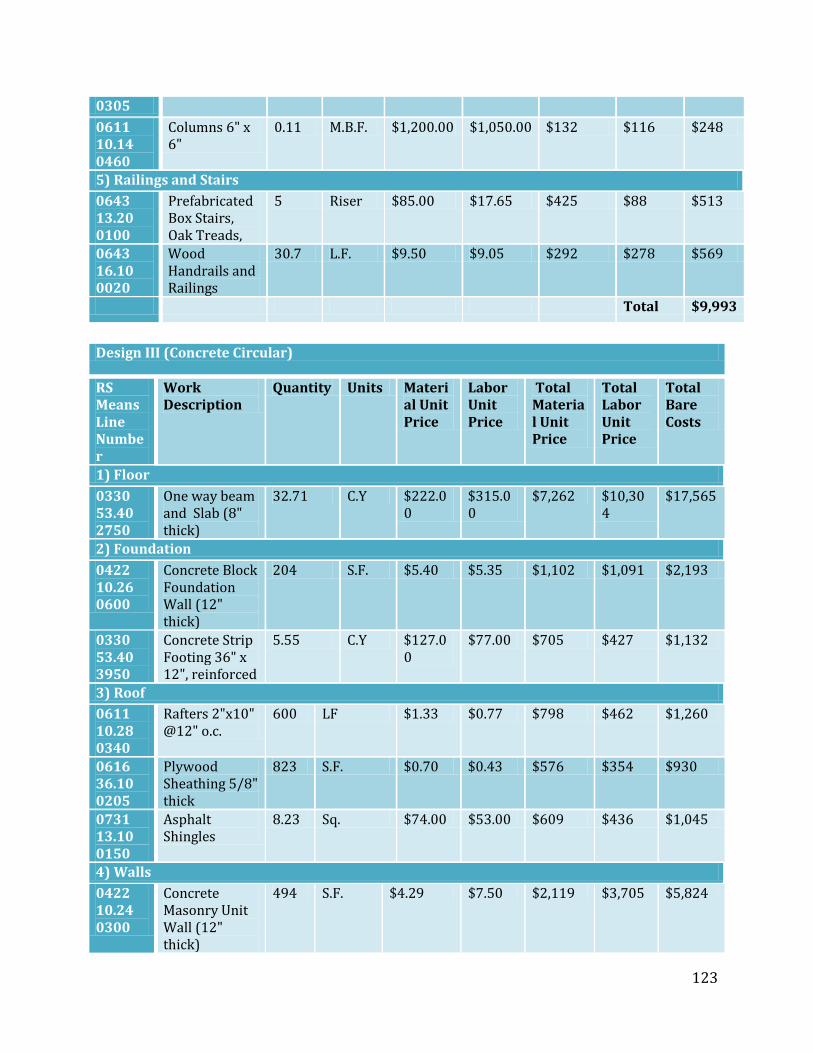
123
0305 0611 10.14 0460
Columns 6" x 6"
0.11 M.B.F. $1,200.00 $1,050.00 $132 $116 $248
5) Railings and Stairs 0643 13.20 0100
Prefabricated Box Stairs, Oak Treads,
5 Riser $85.00 $17.65 $425 $88 $513
0643 16.10 0020
Wood Handrails and Railings
30.7 L.F. $9.50 $9.05 $292 $278 $569
Total $9,993
Design III (Concrete Circular)
RS Means Line Number
Work Description
Quantity Units Material Unit Price
Labor Unit Price
Total Material Unit Price
Total Labor Unit Price
Total Bare Costs
1) Floor 0330 53.40 2750
One way beam and Slab (8" thick)
32.71 C.Y $222.00
$315.00
$7,262 $10,304
$17,565
2) Foundation 0422 10.26 0600
Concrete Block Foundation Wall (12" thick)
204 S.F. $5.40 $5.35 $1,102 $1,091 $2,193
0330 53.40 3950
Concrete Strip Footing 36" x 12", reinforced
5.55 C.Y $127.00
$77.00 $705 $427 $1,132
3) Roof 0611 10.28 0340
Rafters 2"x10" @12" o.c.
600 LF $1.33 $0.77 $798 $462 $1,260
0616 36.10 0205
Plywood Sheathing 5/8" thick
823 S.F. $0.70 $0.43 $576 $354 $930
0731 13.10 0150
Asphalt Shingles
8.23 Sq. $74.00 $53.00 $609 $436 $1,045
4) Walls 0422 10.24 0300
Concrete Masonry Unit Wall (12" thick)
494 S.F. $4.29 $7.50 $2,119 $3,705 $5,824
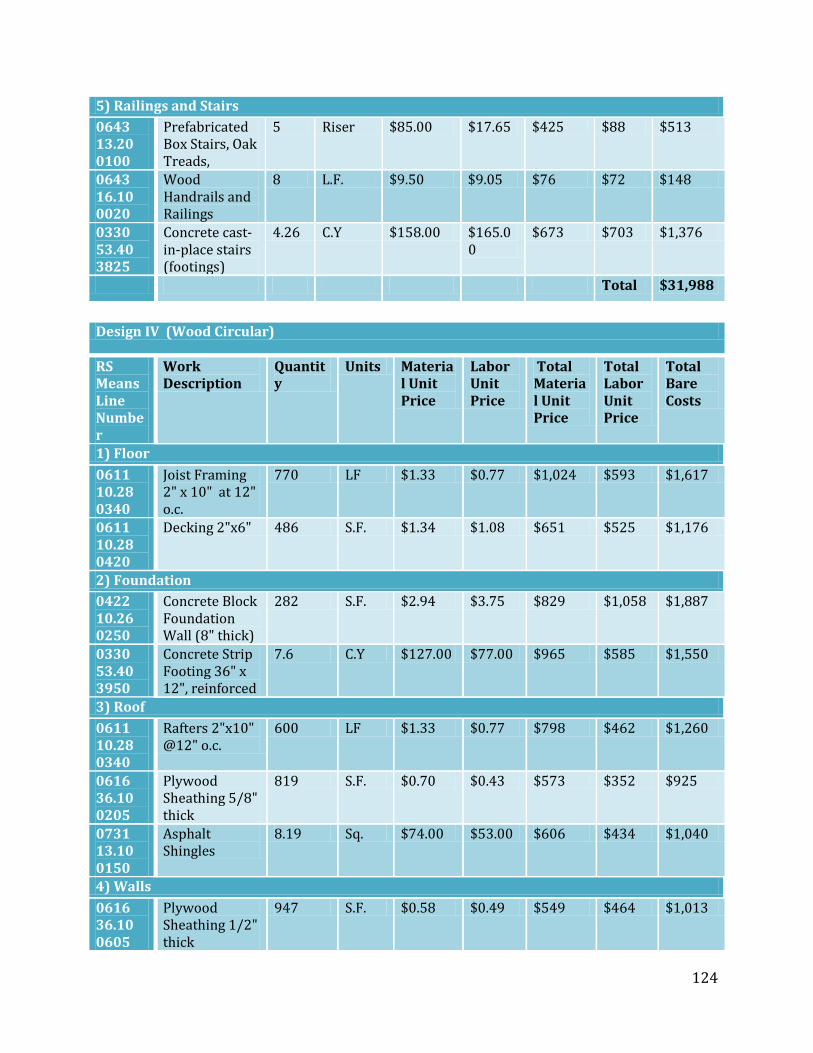
124
5) Railings and Stairs 0643 13.20 0100
Prefabricated Box Stairs, Oak Treads,
5 Riser $85.00 $17.65 $425 $88 $513
0643 16.10 0020
Wood Handrails and Railings
8 L.F. $9.50 $9.05 $76 $72 $148
0330 53.40 3825
Concrete cast-in-place stairs (footings)
4.26 C.Y $158.00 $165.00
$673 $703 $1,376
Total $31,988
Design IV (Wood Circular)
RS Means Line Number
Work Description
Quantity
Units Material Unit Price
Labor Unit Price
Total Material Unit Price
Total Labor Unit Price
Total Bare Costs
1) Floor 0611 10.28 0340
Joist Framing 2" x 10" at 12" o.c.
770 LF $1.33 $0.77 $1,024 $593 $1,617
0611 10.28 0420
Decking 2"x6" 486 S.F. $1.34 $1.08 $651 $525 $1,176
2) Foundation 0422 10.26 0250
Concrete Block Foundation Wall (8" thick)
282 S.F. $2.94 $3.75 $829 $1,058 $1,887
0330 53.40 3950
Concrete Strip Footing 36" x 12", reinforced
7.6 C.Y $127.00 $77.00 $965 $585 $1,550
3) Roof 0611 10.28 0340
Rafters 2"x10" @12" o.c.
600 LF $1.33 $0.77 $798 $462 $1,260
0616 36.10 0205
Plywood Sheathing 5/8" thick
819 S.F. $0.70 $0.43 $573 $352 $925
0731 13.10 0150
Asphalt Shingles
8.19 Sq. $74.00 $53.00 $606 $434 $1,040
4) Walls 0616 36.10 0605
Plywood Sheathing 1/2" thick
947 S.F. $0.58 $0.49 $549 $464 $1,013
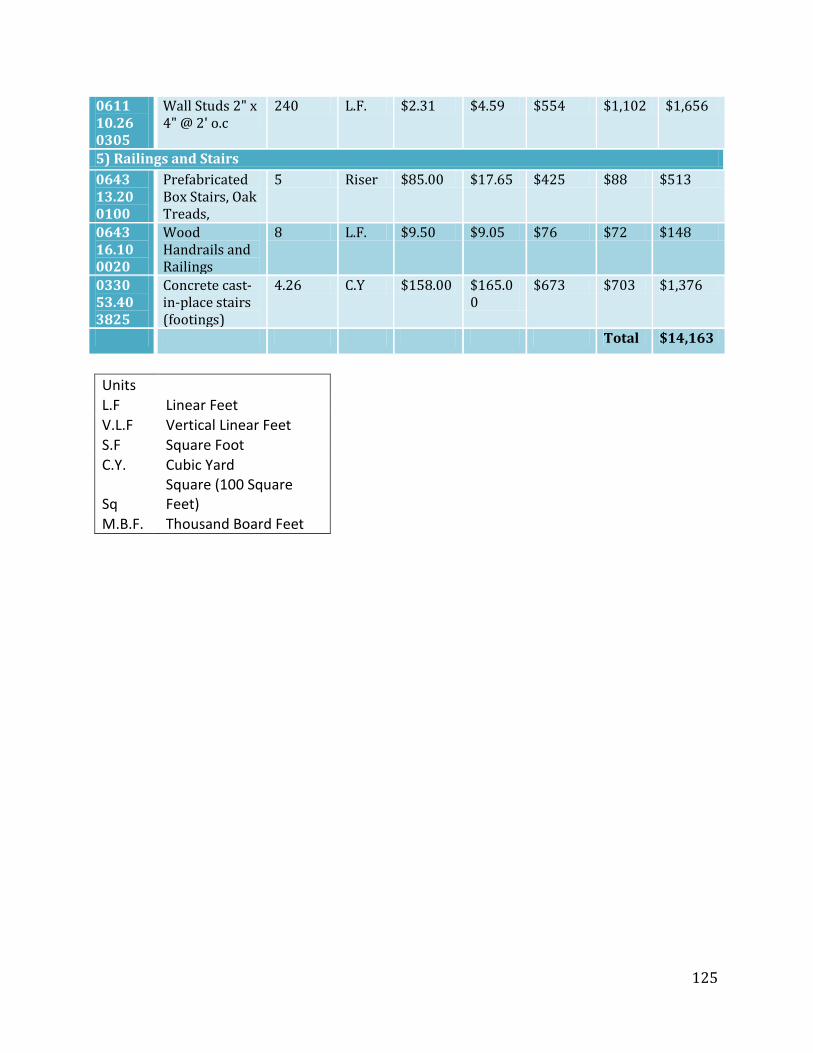
125
0611 10.26 0305
Wall Studs 2" x 4" @ 2' o.c
240 L.F. $2.31 $4.59 $554 $1,102 $1,656
5) Railings and Stairs 0643 13.20 0100
Prefabricated Box Stairs, Oak Treads,
5 Riser $85.00 $17.65 $425 $88 $513
0643 16.10 0020
Wood Handrails and Railings
8 L.F. $9.50 $9.05 $76 $72 $148
0330 53.40 3825
Concrete cast-in-place stairs (footings)
4.26 C.Y $158.00 $165.00
$673 $703 $1,376
Total $14,163
Units L.F Linear Feet V.L.F Vertical Linear Feet S.F Square Foot C.Y. Cubic Yard
Sq Square (100 Square Feet)
M.B.F. Thousand Board Feet