can a landscape scale predator - university of otago · mouse tracking ... rabbit meat and let to...
TRANSCRIPT

Can a landscape scale predator
control regime be employed to
ensure sustainable recruitment
in endangered mohua (Mohua
ochrocephala) populations,
South Island New Zealand.
Tristan Rawlence
A report submitted in partial fulfilment of the
Post-graduate Diploma in Wildlife Management
University of Otago
2010
University of Otago
Department of Zoology
P.O. Box 56, Dunedin
New Zealand
WLM Report Number: 240

1
Can a landscape scale predator control regime be employed to ensure
sustainable recruitment in endangered mohua (Mohua ochrocephala)
populations, South Island New Zealand.
Tristan Rawlence*
Research report in fulfilment of WILM 403, University of Otago, Dunedin
Fieldwork and Anaylsis for Department of Conservation, R&D section,
Nelson
Supervisor: Graeme Elliott, Department Of Conservation
Wildlife Management Report Number 240
*Contact: [email protected]

2
Contents
CONTENTS ............................................................................................................................. 2
LIST OF FIGURES ................................................................................................................. 3
LIST OF TABLES ................................................................................................................... 3
ABSTRACT ............................................................................................................................. 4
INTRODUCTION ................................................................................................................... 5
METHODS .............................................................................................................................. 8 STUDY SITES ...................................................................................................................................... 8
The Dart- Caples ............................................................................................................................ 9 Catlins ...............................................................................................................................................11
BEECH MAST- SEED TRAYS .............................................................................................................14 TRACKING TUNNELS .......................................................................................................................15 PREDATOR CONTROL OPERATION METHODS ...............................................................................15 MOHUA NEST MONITORING ...........................................................................................................16 STATISTICAL ANALYSIS ..................................................................................................................17
RESULTS .............................................................................................................................. 18 BEECH MAST- SEED TRAYS .............................................................................................................18 MOHUA NESTING SUCCESS .............................................................................................................18 PREDATOR CONTROL RESPONSE ...................................................................................................20
Rat tracking ...................................................................................................................................20 Mouse tracking .............................................................................................................................25 Stoat Tracking ..............................................................................................................................26
DISCUSSION ........................................................................................................................ 27
ACKNOWLEDGEMENTS .................................................................................................. 29
REFERENCES ...................................................................................................................... 30

3
List of Figures
FIGURE 1. PREDATOR CYCLE ............................................................................................................... 7 FIGURE 2: STUDY SITE LOCATIONS ...................................................................................................... 8 FIGURE 3: DART STUDY SITE ..............................................................................................................10 FIGURE 4: CATLINS STUDY SITE .........................................................................................................13 FIGURE 5: SEED TRAY .........................................................................................................................14 FIGURE 6: SEED TRAY RESULTS .........................................................................................................18 FIGURE 7: NESTING SUCCESS AT ALL SITES ......................................................................................19 FIGURE 8: BREAKDOWN OF FAILED NESTING ATTEMPTS ................................................................20 FIGURE 9: CATLINS RAT TRACKING ...................................................................................................21 FIGURE 10: DART RAT TRACKING .....................................................................................................22 FIGURE 11: CATLINS MOUSE TRACKING ...........................................................................................25 FIGURE 12: DART MOUSE TRACKING ................................................................................................25 FIGURE 13: CATLINS STOAT TRACKING ............................................................................................26 FIGURE 14: DART STOAT TRACKING .................................................................................................26
List of Tables
TABLE 1: PREDATOR CONTROL METHODS ........................................................................................15 TABLE 2: BROOD AVERAGED PRODUCTIVITY VALUES FROM ELLIOTT (1990). ...........................17 TABLE 3: PRODUCTIVITY VALUES AND POPULATION GROWTH RATES ...........................................24

4
Abstract )n the last years many of New Zealand’s native avifauna have under gone
drastic reductions in range and as a result have become very rare or even extinct.
New Zealand conservationists are world leaders in island conservation, yet the
ultimate goal remains in managing species, in large forest tracts on the mainland
in the face of introduced predators bought on by human colonisation.
The aim of this study was to investigate options for cost effective landscape scale
predator control by monitoring the effects of each on a sensitive indicator
species, the mohua (Mohua ochrocephala). By studying the beech tree phenology
as the driver for the predator plagues and using tracking tunnels to index
predators the study concluded that high rat (Rattus spp.) tracking rates resulted
in high nest predation and poor breeding performance in our indicator species.
This study revealed aerial 1080 to be a cost effective method in reducing rats
during beech masts to a level where mohua could be productive to a sustainable
level and thus ensure longevity of mainland populations.
Keywords: Mohua ochrocephala, Masting, Nothofagus, Rattus, 1080,
brodifacoum, Catlins forest park, Dart valley, Predation, tracking tunnels, nesting
success, predator control.

5
Introduction
The mohua (or yellowhead, Mohua ochrocephala) is a small insectivorous, hole
nesting passerine, endemic to the South Island of New Zealand. It belongs to the
endemic genus that includes the whitehead (M. albicilla) and brown creeper (M.
novaezelandiae). All three species have been faced with habitat destruction
brought on by the arrival of Europeans in New Zealand but only the mohua has
disappeared from extensive areas of relatively unmodified forests and is
continuing to decline (Elliott & Suggate 2003). Historical records report they
were present in most forest habitats in the South Island and Stewart Island O’Donnell . They are now all but absent from % of their former range, this contraction has occurred largely in the last 30 years as small remnant
populations lost the battle with introduced predators and became extinct (Gaze , O’Donnell & Dilks , O’Donnell a and Elliott pers. comm. Mammalian predators introduced to New Zealand with Polynesian and European
settlers have been blamed for the decline of many native bird species (King
1984). Elliott (1996) suggested that adult mohua mortality outside of the
breeding season was uncommon as mohua forage high in the trees, however
stoats (Mustela erminea), at least in the Eglinton valley, were responsible for
mortality on the hole nesting females. When stoat numbers were high 67% of
nests and 50% of females were predated by stoats.
Their range has contracted southwards and mohua are now only found in large
forest blocks in the south of the South Island. Several populations (Mt Stokes &
Burwood Bush) have become extinct as a direct result of an influx in predator

6
numbers in response to a Beech (Nothofagus spp.) masting event. While others
have required supplementary transfers of birds from more productive sites as
the period between predation events is insufficient for the population to remain
viable. Most of the forests which mohua remain are now part of large scale
predator control programmes with the key sites falling under the umbrella of the
Operation Ark project.
Mohua are considered nationally vulnerable with conservation dependency as
their qualifier under the Conservation Status of NZ Birds (Miskely et al. 2008).
Operation Ark began in 2004 with its purpose is to preserve sustainable
populations of five key species on the mainland South Island. The operational
objective is to ensure integrated management and protection of the species on
the sites and to counter the effect of predator plagues in beech forests in the
South Island. The species targeted for protection were Kakariki karaka
(Cyanoramphus malherbi), Mohua, Whio (Hymenolaimus malachorhynchos ) and
Pekapeka (Mystacina tuberculata tuberculata , Chalinolobus tuberculata )
Rats, Stoats and Possums are the main predators to be controlled to prevent
further threatened species decline. Although large scale predator control is
possible, it is expensive. Therefore the Department of Conservation has
prioritised control in 10 sites throughout the range of the key species for
maximum conservation benefit
Extensive beech flowering and seeding follows warm summers in the previous
year. Rat plagues follow heavy beech seeding. The increased food supply from
seeds, insects and mice increased stoat and rat numbers which then reduced

7
populations of the key species by up to 90% in some unprotected areas (Elliott &
Suggate 2003).
Figure 1. Predator Cycle
This report presents the monitoring results of mohua nesting success from the
Catlins and Dart Operation Ark areas in response to a range of predator control
methods. The aim of the study was to find a cost effective management solution
to ensure mohua remain a part of the South Island beech forest ecosystem.

8
Methods
Study Sites
This study was undertaken in two sites between 2004-2010 during summer in
beach mast years (04/05, 06/07 and 09/10)
Figure 2: Study site locations

9
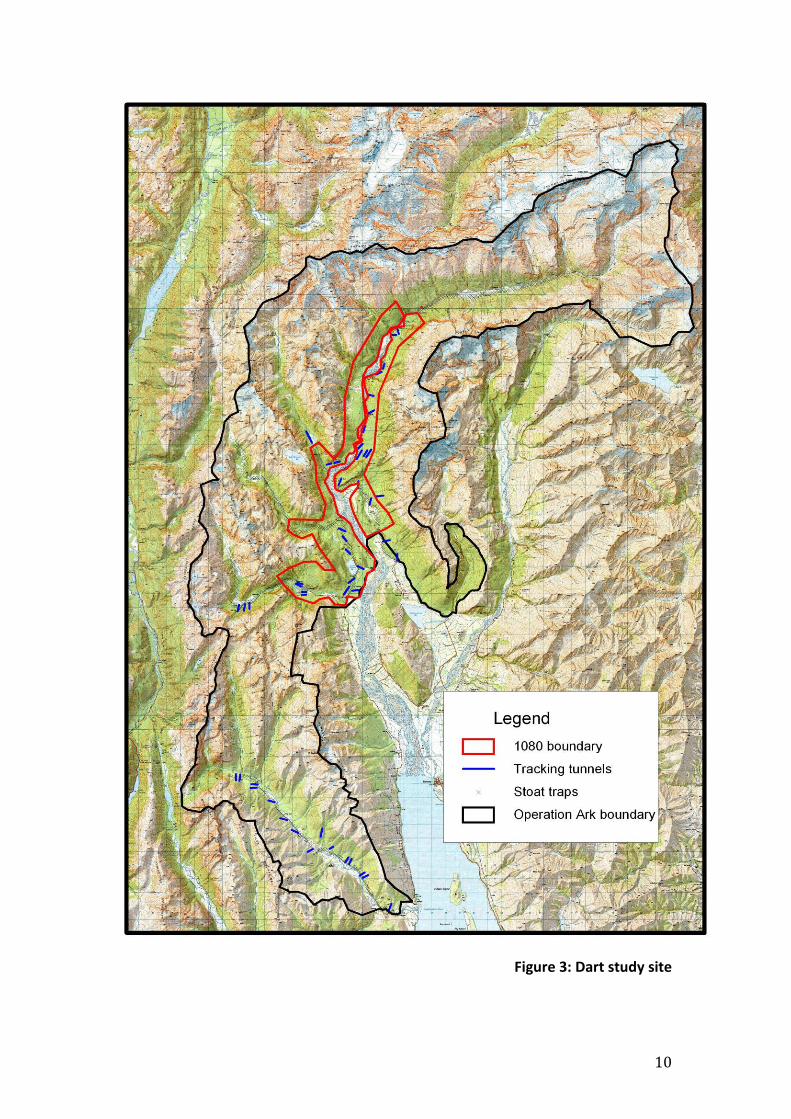
The Dart- Caples
The Dart-Caples Operation Ark site (fig 3) comprises 72,000 ha of native forest,
and alpine tops (or 25,000 ha of forest) in Mt Aspiring National Park (35,5543
ha) about 30 km west of Queenstown.
The operational area comprises a mosaic of red beech at low altitudes in the
valley floors and silver and mountain beech elsewhere. It has one of the three
largest remaining populations of nationally endangered mohua, probably about
25% of the current population. Mohua are the focus of predator control efforts in
the Dart-Caples and the aim of the predator control is to maintain mohua
populations at approximately their current levels (Elliott & Suggate 2003).
The mohua monitoring was carried out in the Dart catchment in two subsites
acting as treatment and control areas.
10
Figure 3: Dart study site

11
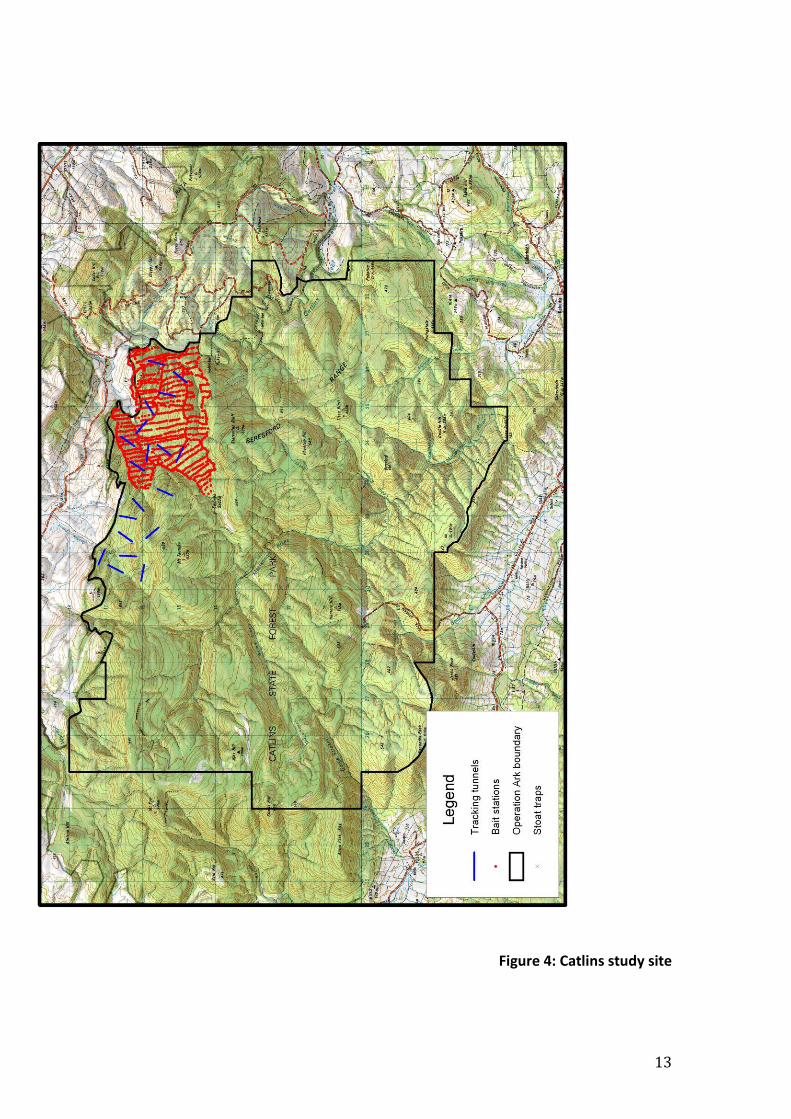
Catlins
The Catlins Operation Ark site (fig 4) comprises 12,651 ha of native forest, which
is part of the Catlins Conservation Park (53,000 ha), is about 100 km southwest
of Dunedin. This forest is the largest remaining area of native forest on the east
coast of the South Island.
The Operational Area comprises a mosaic of predominantly silver beech, with
fringes of Podocarp-hardwood forest, and subalpine yellow-silver pine
(Lepidothamnus intermedius) - cedar (Libocedrus bidwillii) forest. The Catlins
has one of the three largest remaining populations of nationally endangered
mohua, probably about 25% of the current population. Recent surveys show that
two to three thousand mohua are present in about 8500 ha of the operational
area (Elliott & Suggate 2003).
Mohua are the focus of predator control efforts in the Catlins, the aim of the
predator control is to maintain mohua populations at approximately their
current levels.
Mohua monitoring was undertaken in the Thisbe and Daphne catchments with
the Thisbe acting as the treatment area and Daphne as the control.

13
Figure 4: Catlins study site
14
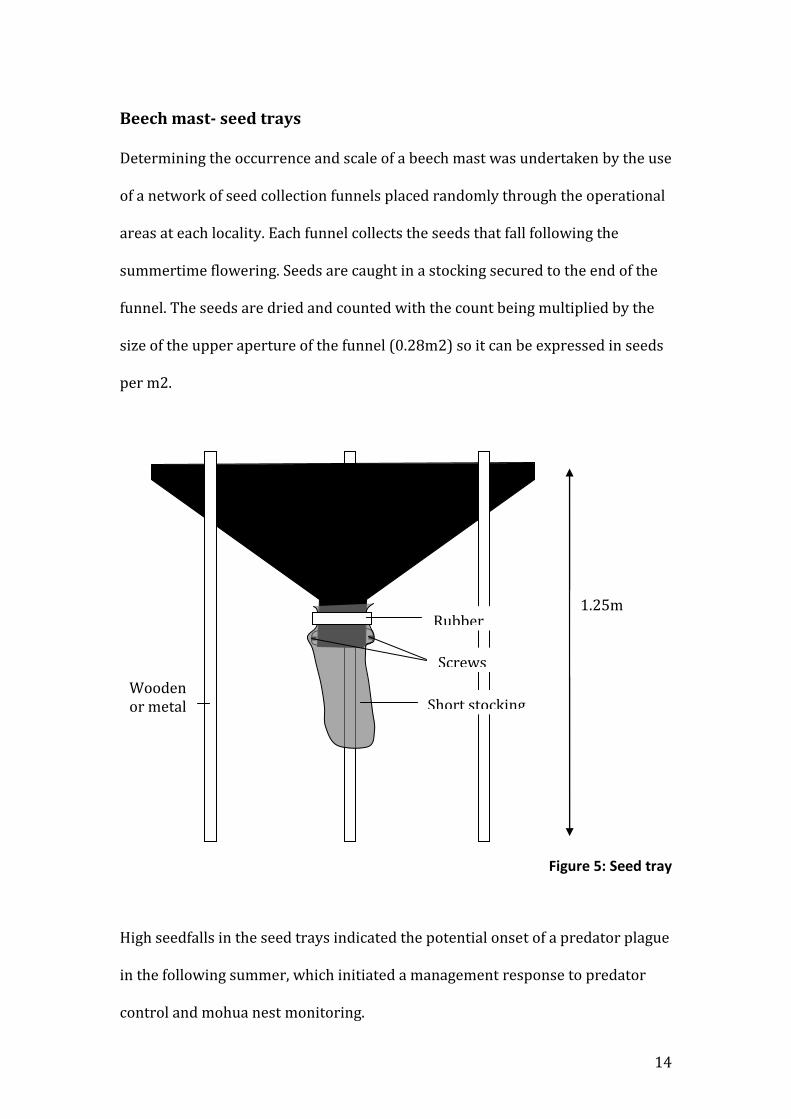
Beech mast- seed trays
Determining the occurrence and scale of a beech mast was undertaken by the use
of a network of seed collection funnels placed randomly through the operational
areas at each locality. Each funnel collects the seeds that fall following the
summertime flowering. Seeds are caught in a stocking secured to the end of the
funnel. The seeds are dried and counted with the count being multiplied by the
size of the upper aperture of the funnel (0.28m2) so it can be expressed in seeds
per m2.
Figure 5: Seed tray
High seedfalls in the seed trays indicated the potential onset of a predator plague
in the following summer, which initiated a management response to predator
control and mohua nest monitoring.
Wooden or metal stake
1.25m Rubber band
Screws
Short stocking

15
Tracking tunnels
Tracking tunnel lines are in place at both sites to measure the seasonal pulses in
predator density as the beech masting cycle feeds the system. The tunnels are
run monthly over three days. The first night the tunnels are baited with peanut
butter to track rats and mice and the second night the tunnels are baited with
rabbit meat and let to run for the next two nights to track mustelids. The animals
enter the tunnel to get the bait and step in ink on route leaving footprints on a tracking card upon exiting the tunnel. The tunnels were run using Trakka pre inked cards (http://www.gotchatraps.co.nz/) and the methodology set out in
Gillies & Williams (2002) .
Predator control operation methods
Both localities have an existing network of stoat traps which ran for the entire
length of this study in both the treatment and control sites. The trap network used a mixture of Fenn mark and DOC traps double set in boxes. A variety of other predator control methods were trialled and are detailed below.
Table 1: Predator control methods
Site Year Method
Catlins Treatment 2004 Ditrac in bait stations at 125m x 50m intervals
Catlins Treatment 2006 1080 & Brodifacoum bait stations at 125m x 50m intervals
Dart Treatment 2006 Brodifacoum in bait stations at 100x100 intervals then pre fed
Aerial 1080 3kg/ha, 0.15%
Catlins Control 2007 Animal Health Board Aerial 1080
Catlins Control &
Treatment
2009 Pre fed Aerial 1080 1kg/ha, 0.15%
Dart Treatment 2009 Pre fed Aerial 1080 1kg/ha, 0.15%
16
Mohua nest monitoring
Nests were found by locating singing males in the forest. The males are generally
flying around their territory singing their territorial song. The males were then
followed to see if they were attending a nesting female. Females generally spend
40-60 minutes incubating then 15-20 minutes feeding off the nest with the male.
The male is followed until either a female turns up or one hour has elapsed
indicating the male does not have a partner.
The behaviour of the pair during the feeding period can only be described as frantic with the female constantly foraging only pausing for the male to feed
her. During this courtship feeding the female will flutter her wings begging for
the food item often emitting a high pitch trill. The female will then make a f
purposeful flight back to her nest. At this stage the female is pursued and with
luck a nest is located, although this often takes more than one incubation cycle to
pinpoint the nest. The process is made more complicated by the occurrence of
helper birds that can be confused with females or make the pair appear non-
nesting and the fact that all this is going on 20m above you in the canopy of the
forest.
Once the nest is located the tree is climbed to confirm that it is indeed a nest and
to establish what the contents and stage of the nest is. A ring of sticky string is
placed around the base of the tree with the theory being that any potential
predator will leave some hair on the sticky string en route to the nest. The nest is
then visited every 3-5 days to see if the nest is still active. Two scenarios arise
from the nest observations, either the nest successfully fledges or it fails, if the
latter occurs the nest is re-climbed and nest cavity inspected if it looks to be a

17
predation event the contents is swabbed for DNA analysis along with any hair
from the sticky string around the base of the tree.
Statistical Analysis
From the nest observations a data set was obtained consisting of season start,
day nest found (i), checked and found still active (j) date found failed (k) and fate
(f). This dataset is then imported into program MARK using the nest survival
function. The Nest records were divided into groups comprising of site (Catlins
or Dart) and treatment or control. The productivity values in Elliott (1990) were
averaged to 1.5 broods per season and a linear relationship was assumed
between productivity, survival and nesting success.
Table 2: Brood averaged productivity values from Elliott (1990).
Normal Year
0 0 0.97165 0.2246 0 0 0 0.8295 0.78975 Beech Mast Year 0 0 0.4545 0.2246 0 0 0 0.8295 0.4853
The corresponding formula from the slope and intercept (productivity=2.7655x-
0.6517, survival=1.6281x-0.1659, x= nesting success) were used to construct
matrices for each treatment and control based on the nesting success outputs
from MARK. Each matrix was an average of one masting year and two
intermediate years which is slightly pessimistic given beech masting occurs
every 3-4 years (Wardle, 1984) The population growth rates from the dominant
eigen values of the transition matricies were calculated(Groenendail et al 1988)

18
using the eigen function in the stats package R to gauge the success of the
treatment regimes.
Results
Beech mast- seed trays
Beech masts occurred in the summers of 2004/2005, 2006/2007 and
2009/2010 in the Catlins and in 2006/2007 and 2009/2010 (fig 6). As a result
different predator control methods were trialled in each year.
Figure 6: Seed tray results
Mohua Nesting success
The nesting success of mohua varied greatly in response to a range of factors
present in the complex forest ecosystem. This study monitored 153 nests over 3
beech mast years and recorded 32 nest failures. The differing scale of each mast
and the differing scale of the rat population eruption make it difficult for tight
comparisons between treatment methods. The presence of expansive trap
networks for stoats, which are available to catch rats in the control areas,
coupled by the poor nesting success prove that trapping is not effective at

19
controlling rats in a masting year. High rat numbers seemed to be the biggest
drivers of predation events and although we could not confirm rats actually
predating nests, the high tracking and high predation rates appear highly
correlated. When a rat population explosion occurred and the treatment was
efficient the difference in nesting success of mohua was significant.
Figure 7: Nesting Success at all sites
All results need to be taken in the context of the tracking tunnel and treatment
results in order to piece together a picture of what is occurring within the
system. Nest failures were broken down between sites as well as between
treatment and control areas. Predation events were only recorded if obvious
predated remains were found upon climbing the tree and observing the nest. All
predated nest trees were checked to see if the sticky string around the tree had
picked up hair from the predator. Unfortunately this method was not effective
for mohua as only two predation events were confirmed by this method during
the course of the study. The unknown category contains many possible scenarios
including abandonment, inability to access the nest and cryptic predation events.

20
The results from the breakdown of predators are inconclusive if treatment sites
receive less predation events from the nest failures than the control sites.
Figure 8: Breakdown of failed nesting attempts
Predator control response
Rat tracking
Rats showed the greatest response to the predator control operations of all
introduced animals tracked. However it is clear that some predator control
operations are vastly more effective than others. There is also great variability in
the size of mast and the size of the rat population peak, which is very hard to
predict when planning a predator control operation.

21
Figure 9: Catlins rat tracking
Catlins 04/05 Ditrac bait stations
The Ditrac bait stations trial showed rats took a significant reduction in
population size as a result of the poison, however they were still tracking at a
high enough rate to recover to their original peak. This is a little concerning as the potential scale of the beech mast didn’t really eventuate according to the seedfall results (fig 6). The ineffectiveness of this method is also confirmed with
the very similar nesting success results (82% Treatment & 75% control) from
the treatment and control areas (table 3).
Catlins 06/07 1080/ brodifacoum bait stations
The ground based bait station treatment was very effective in this moderate
sized masting event in the Catlins. It instantly reduced the rat population to very
low tracking results while the control site continued tracking a very high number
of rats. The Animal health board conducted an aerial 1080 drop targeted at
possums (Trichosurus vulpecula) to control bovine tuberculosis in the control
area in June. The rat numbers in the control site dropped as a result, although
the rat numbers were expected to drop at that time anyway as the seed was
germinating. This expected collapse in the rat population happened in the Dart
22
(fig 10) at the same time without the poison. Mohua experienced significantly
better breeding success in the treatment area than in the control with 76% and
26% respectively.
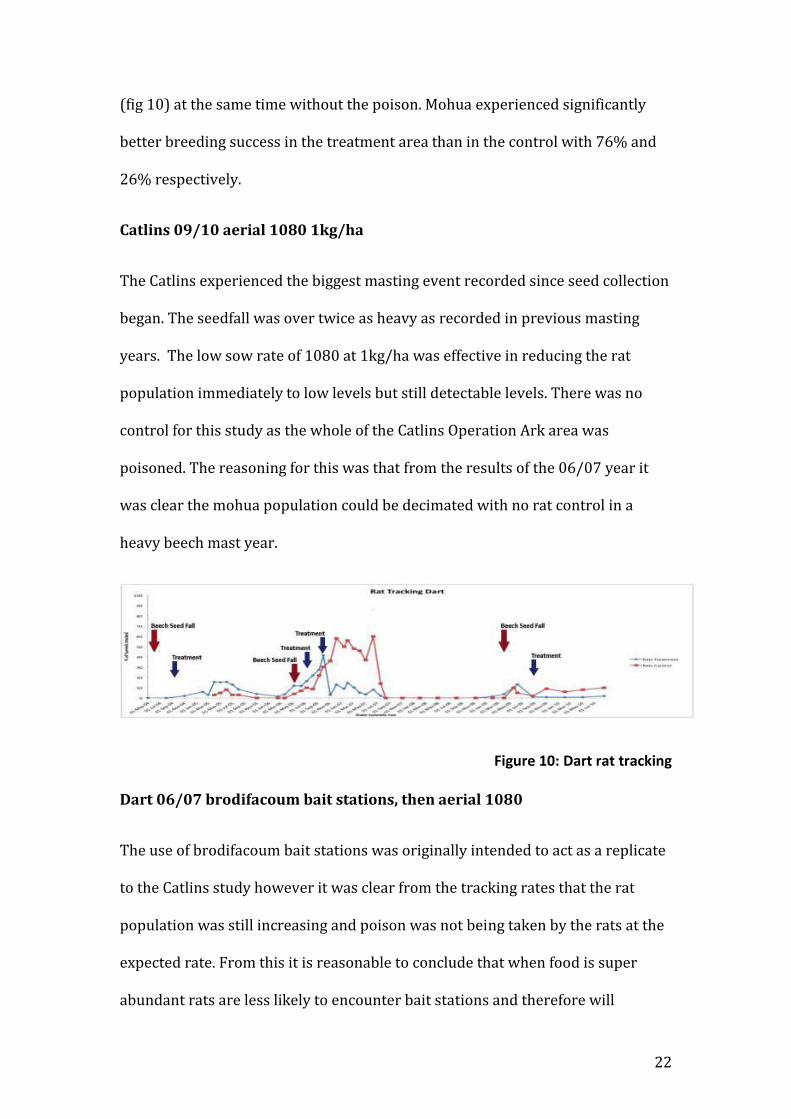
Catlins 09/10 aerial 1080 1kg/ha
The Catlins experienced the biggest masting event recorded since seed collection
began. The seedfall was over twice as heavy as recorded in previous masting
years. The low sow rate of 1080 at 1kg/ha was effective in reducing the rat
population immediately to low levels but still detectable levels. There was no
control for this study as the whole of the Catlins Operation Ark area was
poisoned. The reasoning for this was that from the results of the 06/07 year it
was clear the mohua population could be decimated with no rat control in a
heavy beech mast year.
Figure 10: Dart rat tracking
Dart 06/07 brodifacoum bait stations, then aerial 1080
The use of brodifacoum bait stations was originally intended to act as a replicate
to the Catlins study however it was clear from the tracking rates that the rat
population was still increasing and poison was not being taken by the rats at the
expected rate. From this it is reasonable to conclude that when food is super
abundant rats are less likely to encounter bait stations and therefore will

23
continue to experience population growth. To save the mohua population from a
potentially disastrous breeding season the decision was made to conduct an aerial rescue operation at kg/ha. This proved to be very effective even when there was abundant food present in the forest and reduced rats to low but,
still detectable levels.
Dart 09/10 aerial 1080 1kg/ha
The Dart experienced a small beech mast in 2009. The methodology was the
same as the Catlins operation. The treatment reduced rats to undetectable
tracking rates, although from the control area the rat population never really
took off. The mohua still had considerably better nesting success in the
treatment area 57% to the 17% in the control. The nesting success in the
treatment area was still not sustainable. It was thought by the field workers that
nests were being abandoned rather than suffering from predation events due to
the fact that the banded females were often found after the nest had failed which
is not normally the case.
The true measure of success of the predator control operation is whether or not
the level of improvement in nesting success results in a sustainable recruitment into the population and a resultant population growth rate λ . The results for the 2005 summer in the Catlins show both the treatment and control are
sustainable but the rat plauge never really eventuated. The results from 2006 in
the Catlins show the treatment was very effective and good sustainable nesting
success was achieved in the treatment area, while the control had no chance of
long term survival. The Aerial 1080 treatment in the same year in the Dart again
showed sustainable recruitment in the treatment, and the population to be in

24
steep decline in the control. The 2009 operation in the Catlins was also effective
and resulted in a positive population trend. There was no control for that year as
the whole Operation Ark area was treated leaving no comparable site for a
control. The results for the Dart for the same year showed the treatment was
successful, yet the nesting success was not sustainable but was still much worse
in the control. There is potential that other factors played a part in the lower
observed nesting success in the treatment site such as abandonment due to
starvation, as suggested by the field workers which is backed up by the nesting
failure breakdown (fig 8) with no sign of predation at any of the failed nests.
Table 3: Productivity values and population growth rates
Site
Observed Nesting Success
3yr average nesting success Productivity Survival
Growth rate
λ
Catlins 05
T 0.819289672 0.664429891 1.1858 0.9158 1.649226
Catlins 05
C 0.754540825 0.642846942 1.1261 0.8807 1.415814
Catlins 06
T 0.763963516 0.645987839 1.1348 0.8858 1.44804
Catlins 06
C 0.260447523 0.478149174 0.6706 0.6125 0.3553211
Catlins 09
T 0.643517594 0.605839198 1.0237 0.8204 1.075799
Dart 06 T 0.883501246 0.685833749 1.2450 0.9507 1.910012
Dart 06 C 0.455030033 0.543010011 0.8500 0.7181 0.6467531
Dart 09 T 0.570108493 0.581369498 0.9561 0.7806 0.8887604
Dart 09 C 0.170254962 0.448084987 0.5875 0.5636 0.2603089
25
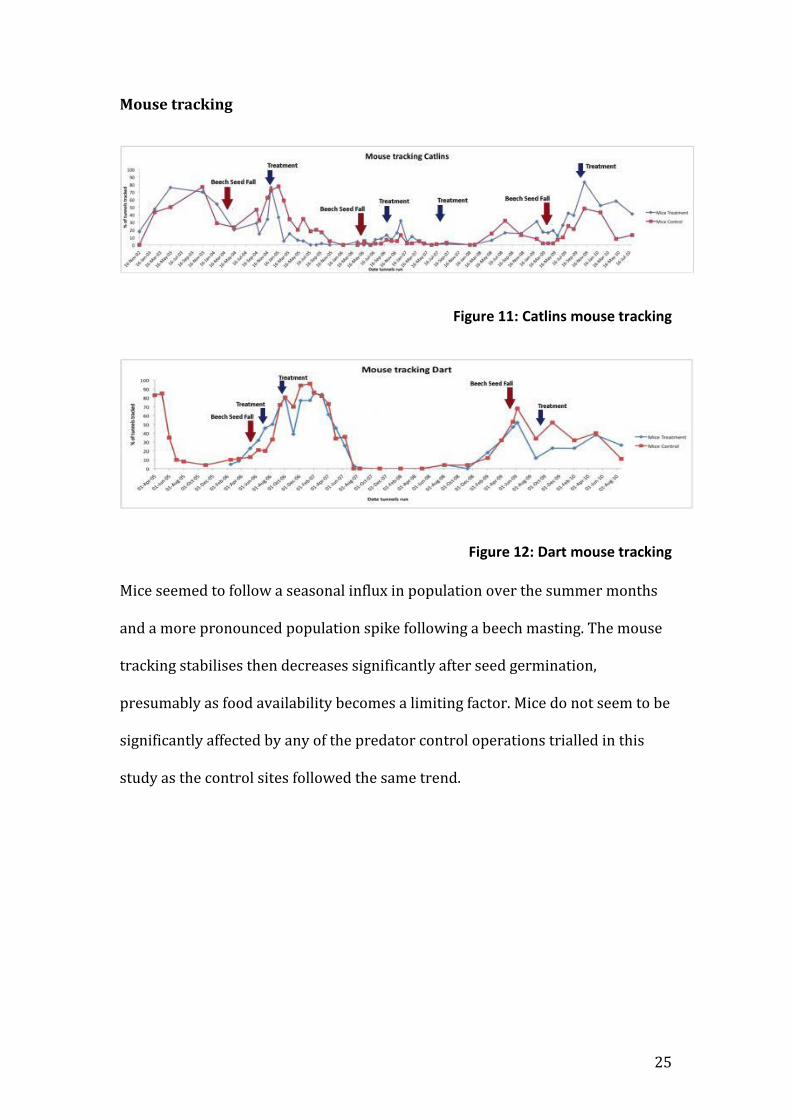
Mouse tracking
Figure 11: Catlins mouse tracking
Figure 12: Dart mouse tracking
Mice seemed to follow a seasonal influx in population over the summer months
and a more pronounced population spike following a beech masting. The mouse
tracking stabilises then decreases significantly after seed germination,
presumably as food availability becomes a limiting factor. Mice do not seem to be
significantly affected by any of the predator control operations trialled in this
study as the control sites followed the same trend.
26
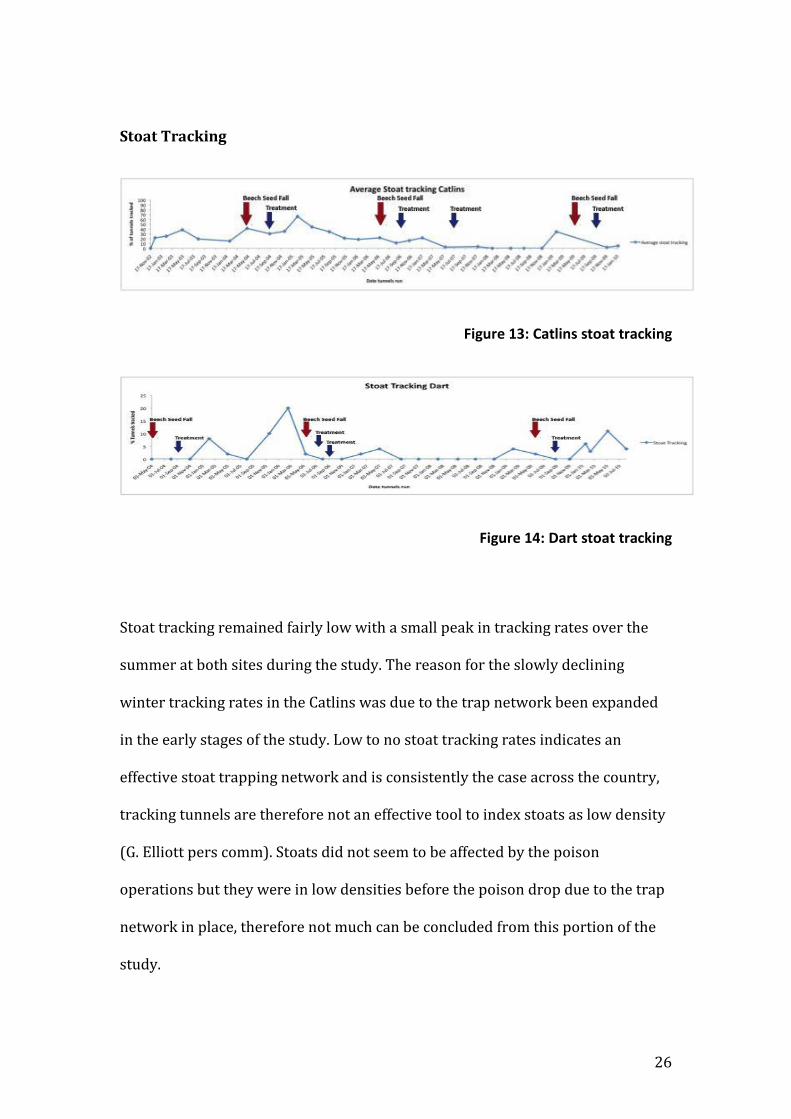
Stoat Tracking
Figure 13: Catlins stoat tracking
Figure 14: Dart stoat tracking
Stoat tracking remained fairly low with a small peak in tracking rates over the
summer at both sites during the study. The reason for the slowly declining
winter tracking rates in the Catlins was due to the trap network been expanded
in the early stages of the study. Low to no stoat tracking rates indicates an
effective stoat trapping network and is consistently the case across the country,
tracking tunnels are therefore not an effective tool to index stoats as low density
(G. Elliott pers comm). Stoats did not seem to be affected by the poison
operations but they were in low densities before the poison drop due to the trap
network in place, therefore not much can be concluded from this portion of the
study.

27
Discussion
The rat tracking and mohua nesting success results show a significant response
to the intensive bait station and aerial 1080 treatments trialled in this study and
therefore it would be reasonable to conclude that rats play a large role in the
predation of mohua, at least in the Catlins and the Dart, and most probably
elsewhere in the South Island. As the treatment and control sites had an existing
trap network targeting stoats, but with the potential to control rats, it would also
be reasonable to conclude that trapping is not an effective control method for
rats in beech forest experiencing regular masting events, at least in the 100m spacing’s of the existing networks in this study. Tighter trap spacing may prove
to be an effective management tool but very costly and inefficient in remote
locations.
The question of which treatment method should be used long term comes down
to two key elements, being cost and effectiveness. Both treatments were effective
in most years of the study but the bait stations failed in the Dart in the 2006/07
summer where no detectable knock down of rats occurred and bait take by rats
was low. Aerial 1080 in this scenario was however still very effective. The
reasons for this can possibly be attributed to an overabundance of food in the
forest ecosystem therefore that rats did not need to travel far to find food
making them less likely to encounter a bait station. The aerial 1080 is
presumably more available to the rats in this situation.
The difference in cost between the two methods is substantial. The cost for an
aerial 1080 operation at 1kg/ha is between $20-24 per hectare while the cost of

28
running existing bait station network following a beech mast at $72-108 per
hectare.
Aerial 1080 was not as effective at the low sow rate of 1kg/ha as 3kg/ha aerial
1080 or the Catlins Bait station operation. There are a number of possible
reasons why a complete knock down of rats was not achieved, either the
treatment was not as effective or there was so much food due to the scale of the
beech mast that the rat population was able to recover quickly or that there were
not as likely to eat bait. The question that really needs to be asked is do rat
numbers need to be reduced to the level achieved by bait stations or higher
amounts of 1080? Nesting success was in fact highest following the 3kg/ha drop in the Dart with a population growth rate of λ= . with the low sow rate of kg/ha achieving a population rate of λ= . in the Catlins and λ= . in the
Dart. The Dart result is cast in doubt by a high abandonment rate. In reality the
low sow 1080 regime needs more rigours trialling over a few more seasons to
rule out the other potential variables before a decision on its effectiveness can be
made.
It seems that if the tracking tunnels are tracking rats prior to the beech seedfall
then they will peak at very high numbers, where if the rats are not detectable
prior to the beech mast, they will not reach a problem level. When you consider
the rat population going through an exponential growth phase if they start with
one rat per hectare compared to 4 rats per hectare the peak of the population
will be four times higher even though the initial populations were both small.
More work is required on tracking rats at low densities to better understand this
part of the process. One thing that is clear is that in all control sites, when the

29
masting results in a rat plague, nesting mohua were heavily predated and not
able to sustain their population at its current level. Therefore ongoing aerial
1080 at a sow rate somewhere in between 1 & 3kg/ha remains only way to
currently maintain sustainable recruitment in mohua over large tracts of forest.
Acknowledgements
Many thanks to Graeme Elliott for his good discussion on the interpretation of
the data. Also thanks to all the field workers who assisted with the data
collection over the years the study was run.

30
References
Elliott, G.P. 1990. The Breeding biology of the mohua. Unpublished Ph.D. thesis,
Victoria Universtiy of Wellington, Wellington, New Zealand
Elliott, G.P. 1996. Productivity and mortality of mohua (Mohua ochrocephala).
New Zealand journal of ecology 23:229-237
Elliott, G., Suggate, R. 2003. Operation ark: 3 year progress report. Department of
Conservation, Southern Regional Office, Christchurch, New Zealand.
Gaze, P.D. 1985. Distribution on mohua (Mohua ochrocephala) in New Zealand.
Notornis 32:261-269
Gillies, C., Williams, D. 2002. Using tracking tunnels to monitor rodents and
mustelids. Unpublished report, Department of Conservation.
Groenendail, Van, J., Kroon, De, H. 1988. Projection matrices in population
biology. Trends in Ecology and Evolution 3: 264-269
King, C.M. Immigrant killers: introduced predators and the conservation of birds
in New Zealand. Auckland, Oxford University Press 1984
Miskelly, C., Dowding, J., Elliott, G., Hitchmough, R., Powlesland, R., Robertson, H.,
Sagar, P., Scofield, P., Taylor, G. 2008. Conservation status of New Zealand birds.
Department of Conservation, Wellington.
O’Donnell, C.F.J., Dilks, P.J. 1986. Forest birds in South Westland-status
distribution and habitat use. Occasional publication 10. Wellington, New Zealand.
Wildlife Service, Department of Internal Affairs.

31
O’Donnell, C.F.J. 1996. Predators and the decline of New Zealand forest birds: an
introduction to the hole nesting bird and predator programme. New Zealand
journal of zoology 23(3) 213-219
O’Donnell, C.F.J. 1996a. Monitoring mohua (yellowhead) populations in the South
Island, New Zealand, 1983-1993. . New Zealand journal of zoology 23(3) 221-228
Wardle, J. 1984. The New Zealand Beeches. Ecology Utilisation and Management.
New Zealand Forest Service, Wellington, New Zealand.