can a specially designed information intervention around...
TRANSCRIPT

ZEF-Discussion Papers on Development Policy No. 213
Mohammad Abdul Malek, Tahsina Naz Khan, Nicolas Gerber, Ratnajit Saha, and Ikhtiar Mohammad
Can a specially designed information intervention around the WASH-agriculture linkages make any difference? Experimental evidence of behavioral changes and health impacts
Bonn, April 2016

The CENTER FOR DEVELOPMENT RESEARCH (ZEF) was established in 1995 as an international,
interdisciplinary research institute at the University of Bonn. Research and teaching at ZEF
addresses political, economic and ecological development problems. ZEF closely cooperates
with national and international partners in research and development organizations. For
information, see: www.zef.de.
ZEF – Discussion Papers on Development Policy are intended to stimulate discussion among
researchers, practitioners and policy makers on current and emerging development issues.
Each paper has been exposed to an internal discussion within the Center for Development
Research (ZEF) and an external review. The papers mostly reflect work in progress. The
Editorial Committee of the ZEF – DISCUSSION PAPERS ON DEVELOPMENT POLICY include
Joachim von Braun (Chair), Christian Borgemeister, and Eva Youkhana. Tobias Wünscher is
Managing Editor of the series.
Mohammad Abdul Malek, Tahsina Naz Khan, Nicolas Gerber, Ratnajit Saha, and Ikhtiar
Mohammad, Can a specially designed information intervention around the WASH-
agriculture linkages make any difference? Experimental evidence of behavioral changes
and health impacts, ZEF – Discussion Papers on Development Policy No. 213, Center for
Development Research, Bonn, April 2016, pp. 45.
ISSN: 1436-9931
Published by:
Zentrum für Entwicklungsforschung (ZEF)
Center for Development Research
Walter-Flex-Straße 3
D – 53113 Bonn
Germany
Phone: +49-228-73-1861
Fax: +49-228-73-1869
E-Mail: [email protected]
www.zef.de

The authors:
Mohammad Abdul Malek, BRAC Research and Evaluation Division, Dhaka and University of
Bonn Center for Development Research, Bonn.
Contact: [email protected]; [email protected]
Tahsina Naz Khan, BRAC Research and Evaluation Division, Dhaka.
Contact: [email protected]; [email protected]
Nicolas Gerber, Center for Development Research (ZEF), University of Bonn.
Contact: [email protected]
Ratnajit Saha, BRAC Research and Evaluation Division, Dhaka.
Contact: [email protected]; [email protected]
Ikhtiar Mohammad, BRAC Research and Evaluation Division, Dhaka, Bangladesh.
Contact: [email protected]; [email protected]

Acknowledgements
The authors acknowledge the contributions and support from the late Mahabub Hossain, the
late Babor Kabir, Md Akramul Islam, Joachim von Braun, Evita Hanie Pangaribowo, Samantha
Antonini, Priyanka Chowdhury, Professor Abdul Bayes, Mahafuzar Rahman, Milan Kanti
Barua, Andrew Jenkins, Nepal C. Dey, Tahera Akter and the PhD students working on the ZEF
WATSAN-agriculture project. We also appreciate the valuable comments and feedback from
numerous researchers and practitioners at different meetings held at the ZEF in Bonn, and
BRAC in Dhaka. We would also like to thank the BRAC WASH program team and the BRAC
RED Agricultural Economics Research Unit, including the RED supporting units, for their
support in implementing the treatments and surveys at different stages of the project. This
research was financed by the Bill and Melinda Gates Foundation under the WATSAN-
agriculture project at ZEF.
Abstract
This paper attempts to evaluate the effectiveness of the specially designed packages of
water, sanitation and hygiene (WASH) interventions with ‘student brigades’ (student teams
tasked with maintaining hygiene in school) on household WASH behavior and practices in
both a household and farm setting. In addition, household members’ health and
developmental productivity outcomes were also examined. A randomized control trial (RCT)
involving student brigades (SBs) was carried out in six sub-districts (hotspots) characterized
by comparatively poor WASH indicators. The specially designed WASH-agriculture treatment
consisted of three interventions: (1) informing the households about the prior water testing
results; (2) delivering hygiene messages with the help of posters; (3) equipping SB members
with water quality test kits and asking them to test the water quality at different places and
report their findings to their household. Employing the difference-in-difference (DID)
multivariate regression technique, the analysis revealed that the BRAC WASH treatment
performed well in terms of effecting behavioral changes and improving hygiene practices. In
addition, the results suggested that informing households of their drinking water quality and
conveying WASH-agriculture hygiene messages to them could have a significant incremental
impact over the existing BRAC WASH treatment in changing household hygiene behavior and
practices at home and on farms. This research provides evidence that students can act as
agents of change in improving water quality, sanitation and health in a rural setting.
Keywords: Water quality information, WASH-Agriculture hygiene messages, BRAC WASH
program, student brigades, randomized control trial, DiD multivariate regression, behavioral
change, Bangladesh
JEL codes: C9, I15, Q11, Q15

1
1. Introduction
The development interventions by the government of Bangladesh or other stakeholders,
consisting mainly of non-governmental organizations (NGOs), have made enormous health
advances in Bangladesh. The country now has the highest life expectancy, the lowest total
fertility rate, and the lowest infant and under-five mortality rate among countries in south
Asia, despite spending less on healthcare than several of their neighboring countries.
However, Bangladesh still faces challenges in terms of water supply and sanitation (Engell
and Lim, 2013), especially in achieving the Sustainable Development Goal (SDG) 6, which
aims to ensure the availability and sustainable management of water and sanitation for all
by 2030. Generally, poor water quality has a wide range of adverse health impacts (such as
high mortality and morbidity rates, malnutrition and reduced life expectancy), and the
resulting higher incidence of illness also brings about high economic costs (Srinivasan &
Reddy, 2009). Every year in Bangladesh, 2.5 million under-five children are affected by
diarrhea as a result of fecal matter coming into contact with food and water, which leads to
1.5 million child deaths (USAID, 2013). Van Derslice and Briscoe (1995) mentioned that
improving water quality can only help reduce diarrhea risk of households living in good
sanitary conditions. Although the development interventions have reduced diarrhea
prevalence and therefore contributed to the reduction in child and infant deaths, diarrhea is
still a major health problem in Bangladesh. A person can reduce their diarrhea risk by having
access to clean water, sanitation and hygiene facilities, and also by practicing good hygiene.
Although Bangladesh achieved its Millennium Development Goals (MDG) for 2015 in terms
of access to improved water source, the question remains whether access to improved
water source actually translates to the use of improved water. Poor personal hygiene may
adversely affect water quality at the point of use (POU), effectively negating the benefits of
having access to improved water sources. Further studies are needed to address the issue of
poor water quality at the POU, especially the microbial quality of household drinking water.
There is also a need to study how disseminating information on proper hygiene practices to
households could help them improve their WASH behavior so as to achieve the desired
health outcomes. Bangladesh’s MDGs and SDGs concerning water and sanitation also did
not adequately address water quality issues. There is a disconnection between the
achievement of the MDGs and its effectiveness in producing the desired health outcomes.
This presents an opportunity for an NGO such as BRAC to help realize the full benefits of
access to improved water by providing basic WASH education to rural, peri-urban and urban
households living in hotspot areas1. WASH education could alleviate health issues left
unsolved by the slow progress in providing more households with improved sanitation
facilities.
1where the WASH achievements are reasonably poorer than the average rural and urban areas.

2
Economic literature has established that wealth is a key driver of the willingness-to-pay
(WTP) to protect oneself from environmental and health hazards. However, a study
investigating the effect of information on a community’s demand on environmental quality
in a suburb in Delhi, India, found that when given information, treatment households were
not only more willing to pay for but also ready to spend more on water treatment methods
(Jyotsna and Somanathan, 2008). This showed that information intervention can also be
effective in increasing the demand for quality WASH technology. Further, public health
literature emphasizes the role of WASH information and knowledge in improving household
behavior and achieving health outcomes. Existing studies have tested the effectiveness of
different WASH interventions, with either a single treatment arm or multiple treatment
arms, that contributed to household-level behavioral and health outcomes (Waddington et
al., 2009). However, there is a limited number of WASH interventions that address both at-
home and on-farm hygiene issues. Anecdotal evidence suggests that farming households
have higher a diarrhea risk than non-farming ones; the results of the water quality census
conducted for this study (which will be discussed later) were able to confirm this
observation. Our interaction with BRAC WASH practitioners also gave us the impression that
educating a person on general hygiene is insufficient for changing their hygiene behavior at
home and on farm to the extent of improving their health, nutrition and productivity
outcomes. Thus, the WASH-agriculture treatment in this study also included information on
hygiene practices that are applicable both at home and on farms. As mentioned earlier,
having access to improved water sources does not necessarily mean safe POU drinking
water quality. Poor personal hygiene at both the point of source (POS) and the POU might
introduce fecal matter into drinking water, therefore contaminating the water and
rendering it unsafe for drinking. In this study, apart from trained technical assistants
collecting information on domestic water quality, treatment households were requested to
participate in the water quality evaluation process at both the POU and POS. This was aimed
at helping them understand their drinking water quality so that they can take the necessary
measures to maintain safe drinking water. Another aspect of the field experiment is that
students were asked to disseminate proper hygiene knowledge to their community as a
form of information intervention. Many WASH initiatives in developing countries have
effectively employed student participation as a strategy to change community hygiene
behavior. Devaney et al. (1993) found that involving students in health interventions
enhances the students’ school achievement. Nutbeam et al. (1993) also found a positive
correlation between unhealthy behavior and student underachievement as well as
alienation in school. This underlines the importance of schools shifting towards more
participatory forms of practice. Further, Jensen (2010) mentioned that action-competence is
acquired through children’s genuine participation in any intervention where they try to
influence ‘real life’ as part of their education. However, there is a limited number of
empirical and scientific studies assessing the role of students as agents of change and as

3
channels of conveying hygiene messages to their community. Involving student networks in
implementing information treatments could potentially build community capacity and
benefit the students, their household and their community. Therefore, we evaluated the
effectiveness of our WASH-agriculture intervention package in 1) changing the at-home and
on-farm WASH behavior of adult household members and 2) improving health outcomes for
the household members. The participating student networks came from various secondary
schools in six hotspot areas (sub-districts) in Bangladesh. These areas include not only those
where BRAC WASH (NGO-led) activities were present but also those without BRAC WASH
activities. This allowed us to estimate the incremental impact the WASH-agriculture
treatment had over the existing BRAC WASH treatment or any other existing interventions
run by the government or other NGO stakeholders.
This paper is organized as follows: Section 2 describes the study objectives and hypotheses.
Section 3 gives a brief description of the study sites, the study and treatment design,
sampling strategies, impact pathway and so on. Section 4 describes the analytical methods
used in our impact analysis. Section 5 briefly discusses the baseline survey results; and the
treatment impact on household WASH behaviors and practices, health, and developmental
productivity. The final section summarizes and concludes the study.

4
2. Study Objectives and Hypotheses
2.1 Study Objectives
Understanding how drinking water can be contaminated between the POS and the POU is
crucial to improving household health and developmental outcomes. The objective of this
study is to understand how to build community capacity in water and sanitation monitoring
and how community WASH behavior can be improved. To address these objectives, we
began with the assumption that giving a person more hygiene information can increase
their demand on environment cleanliness, improve their WASH behavior and consequently
improve their health outcomes. We evaluated the impact of our WASH-agriculture
treatment on 1) at-home and on-farm WASH behavior of the treated household members
and 2) health and developmental productivity outcomes for treated household members.
2.2 Study Hypotheses
We hypothesized that relative to the control group, individuals and households in the
treatment groups will
exhibit greater improvement in their WASH behavior, practice and knowledge (at
home and on farms);
show greater change in their attitude towards WASH-related technology, including
their willingness to adopt WASH-related technology and the amount of money they
are willing to invest in acquiring such technology;
have drinking water with improved microbial quality;
have lower diarrhea incidence;
have improved under-five child anthropometrics;
have lower cost of illness and fewer days of work/school absenteeism.

5
3. Study Methods
3.1 Selection of study sites
In Bangladesh, the average coverage of improved drinking water sources and sanitation
facilities in rural and urban areas are nearly equal. Around 86% of the urban population and
84% of the rural population have access to improved drinking water sources, while 55% of
both rural and urban populations have access to improved sanitation facilities (UNICEF and
WHO, 2015). However, some advanced rural or peri-urban areas and marginal rural areas in
Bangladesh have poorer-than-average WASH-related outcomes compared with their rural or
urban counterparts. Such areas are considered hotspots. We used several indicators to
select the hotspots for this study, such as improved water supply coverage, sanitation
coverage, prevalence of water-related diseases (diarrhea), agro-ecological zone, BRAC
WASH intervention areas, and the level of development (peri-urban/advanced rural or
marginal rural). Information was obtained using various maps showing groundwater level,
agro-ecological zones, flood- and drought-prone areas, and sites with high diarrhea
prevalence. Other sources of information include the development level in different areas
and a list of areas in Bangladesh with BRAC WASH interventions. After obtaining all these
information, we selected six study sub-districts based on the criteria given in Table A:

6
Table A Overview of the criteria for selecting hotspots
Sl.
No District Sub-district
Median
Groundw
ater levels
(m, msl)1
AEZs Flood & drought
prone area
Diarrhea
prevalence4
Sanitation
coverage
(%)5
Level of
development
BRAC WASH
interventions
01 Naogaon Atrai 12-16 5 & 3
Not flood prone &
Severe drought
prone
1(6-8%)
&
2(<52%)
53
Advanced
rural
Present
02 Tangail Kalihati 8-12 8 & 9
Low river flooding
& Slight drought
prone
1(5-6%)
&
2(62-69%)
48
Advanced
rural
Present
03 Tangail Mirzapur 8-12 8 & 9
Low river flooding
& Slight drought
prone
1(5-6%)
&
2(62-69%)
--
Advanced
rural
Absent
04 Jamalpur Bakshiganj 14-20 8 & 9
Not flood prone &
slightly to no
drought area
1(>11%)
&
2(62-69%)
41
Marginal rural Present
05 Jamalpur Melandaha 14-20 8 & 9
Not flood prone &
slightly to no
drought area
1(>11%)
&
2(62-69%)
--
Marginal rural Absent
06 Patuakhali Bauphal 0-2 13
Moderate tidal
surge & Slight
drought area
1(8-11%) &
2(69-79%) 32
Marginal rural Present
Note: Median Groundwater Levels (m, msl1:m, msl) where m=meter and msl=mean sea level (Shamsudduha et al.,
2009). Diarrhea Prevalence4 (BBS/UNICEF MICS 2006): 1= % of children who had diarrhea in the two weeks prior to
data collection, 2= % of children aged 0-59 months who had diarrhea and had received oral rehydration treatment with ORS
Annex 2-a gives a general picture of the socio-economic, health, sanitation and drinking
water status at the study sites, while Annex 2-b shows agricultural practice at those sites.
BRAC WASH interventions had been conducted in four of the sub-districts (Baufal, Atrai,
Kalihati, Bakshiganj) in the past, whereas BRAC WASH interventions had never taken place
in the two remaining sub-districts (Mirzapur, Melandaha). In all study areas, government- or
NGO-led WASH interventions, if ever present, had operated on a very limited scale.
The locations of the study areas are shown in Fig 1. Although these advanced or marginal
rural areas differ among themselves to some extent in terms of socio-economic status and
agricultural practice, the selected hotspots are similar in terms of WASH status. The six
selected study sub-districts were divided into three distinct groups:
a) BRAC WASH treatment group: BRAC WASH treatment has been ongoing in selected sub-
districts of the country since between 2012-2013. The BRAC WASH treatment includes both

7
building infrastructure (e.g., latrine installation) and providing education (e.g., general
hygiene messages). BRAC uses several platforms to conduct WASH education, such as door-
to-door household visits, SBs, school management committees, village WASH committees
and the organization of cluster meetings (BRAC, 2016). The same interventions and the
same platforms were used across the different treatment areas.
b) WASH-agriculture Treatment group: This refers to areas receiving our specially designed
WASH-agriculture treatment (to be elaborated in the following section) concurrently with
the BRAC WASH treatment. The WASH-agriculture treatment was administered through SBs
formed as part of a BRAC WASH program that focuses on hygiene promotion and education
for students, training and orientation for teachers, school compound cleaning and disposal
of solid waste, the provision of separate latrines for girls, and menstrual hygiene education.
Shortly after BRAC had installed sanitation infrastructure in school compounds, the SBs were
formed and subsequently trained to develop their capacities in proactively promoting
proper hygiene in both their school and household. Each SB consists of 24 students with
commendable grades selected from grades 6-9. They received a 30-day training along with
their teachers. These student volunteers are tasked with educating their fellow students,
and members of their households and community to promote hygienic behavior. Being a SB
member enhances a student volunteer’s reputation, and they are valued by others in their
school as well as community. SBs also act as a catalyst for the student volunteers to develop
their leadership skills.
c) Control group: Areas in this group received neither BRAC WASH treatment nor WASH-
agriculture treatment. However, these areas may have received WASH intervention carried
out by government departments or other stakeholders.
One of our concerns when studying the control group was whether any WASH interventions
not led by BRAC WASH were present in these areas. After careful investigation, we found
various small-scale government-led WASH interventions in the six study sub-districts
(hotspots). Nevertheless, this issue was carefully addressed in the protocol design, the
survey and treatment implementation, and the data analyses.
8
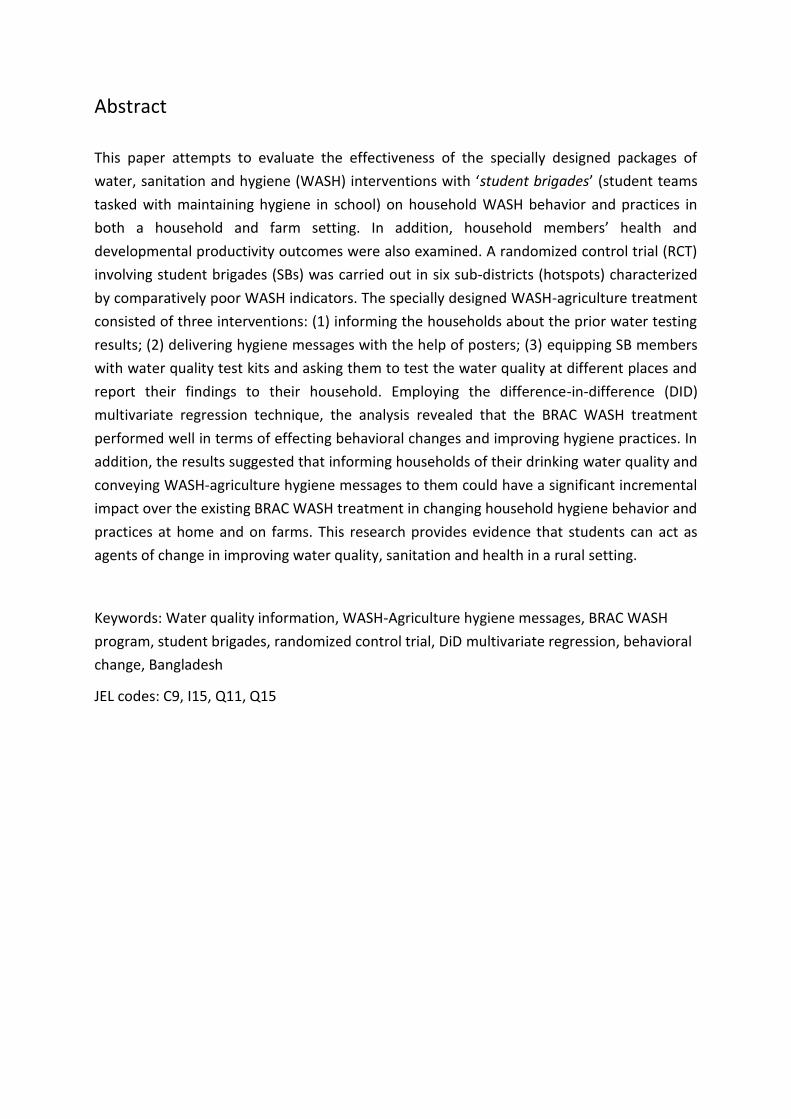
Figure 1 Map of WASH-agriculture Nexus study sites locations in Bangladesh
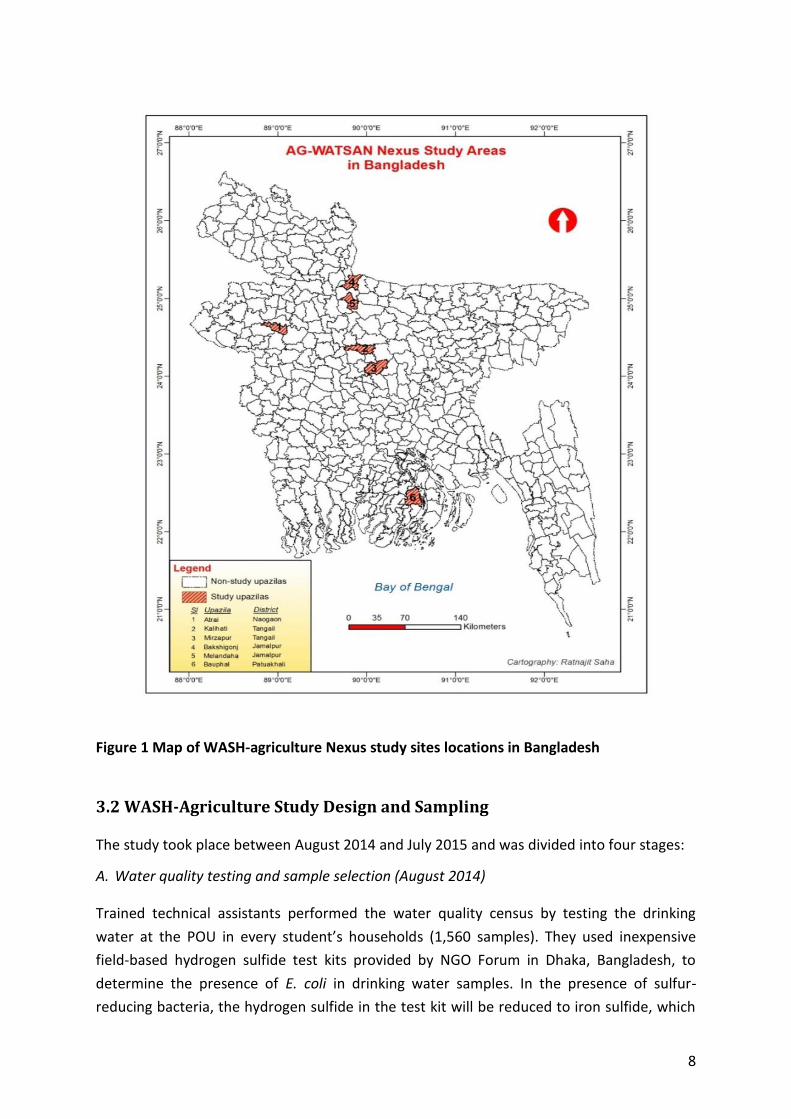
3.2 WASH-Agriculture Study Design and Sampling
The study took place between August 2014 and July 2015 and was divided into four stages:
A. Water quality testing and sample selection (August 2014)
Trained technical assistants performed the water quality census by testing the drinking
water at the POU in every student’s households (1,560 samples). They used inexpensive
field-based hydrogen sulfide test kits provided by NGO Forum in Dhaka, Bangladesh, to
determine the presence of E. coli in drinking water samples. In the presence of sulfur-
reducing bacteria, the hydrogen sulfide in the test kit will be reduced to iron sulfide, which
9
causes the sample to have a black coloration. A detailed description of the test kit and the
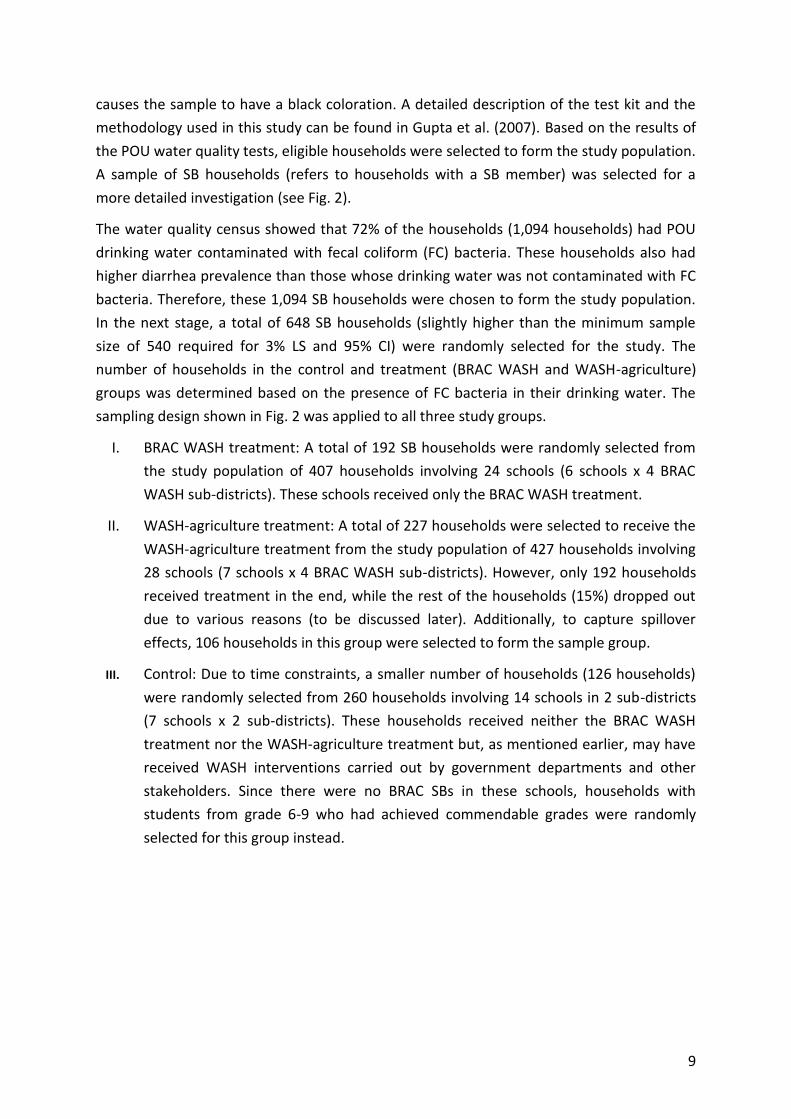
methodology used in this study can be found in Gupta et al. (2007). Based on the results of
the POU water quality tests, eligible households were selected to form the study population.
A sample of SB households (refers to households with a SB member) was selected for a
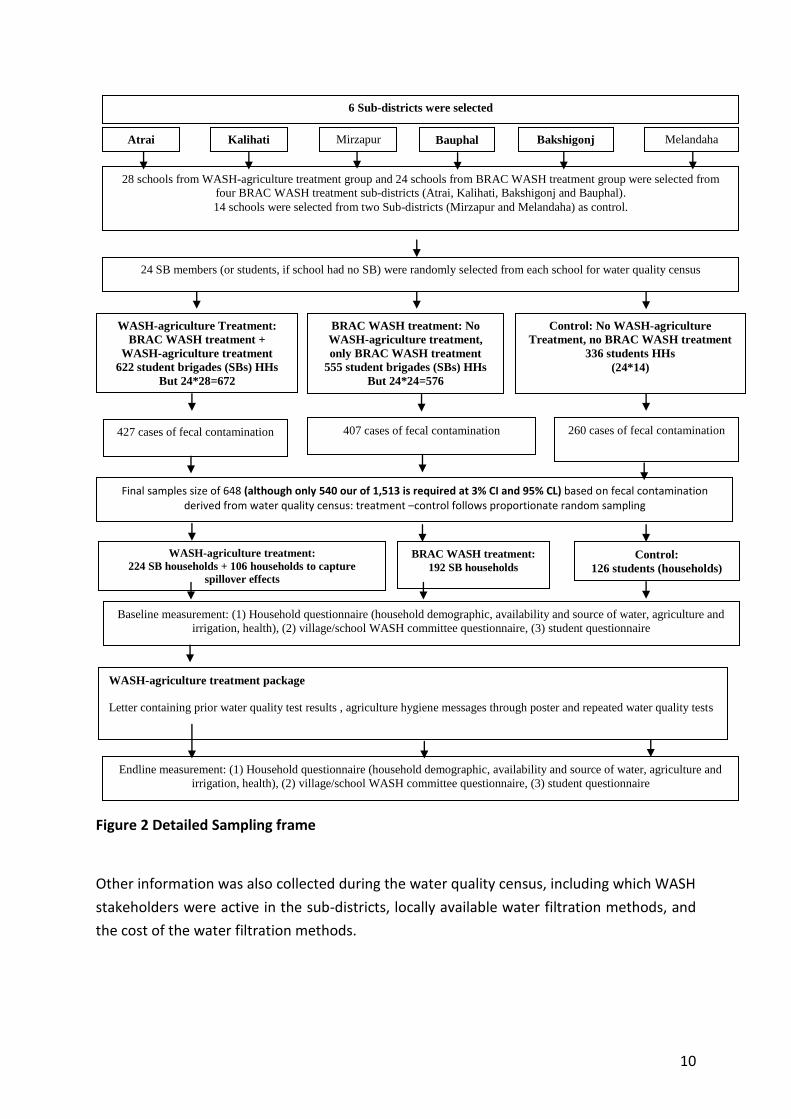
more detailed investigation (see Fig. 2).
The water quality census showed that 72% of the households (1,094 households) had POU
drinking water contaminated with fecal coliform (FC) bacteria. These households also had
higher diarrhea prevalence than those whose drinking water was not contaminated with FC
bacteria. Therefore, these 1,094 SB households were chosen to form the study population.
In the next stage, a total of 648 SB households (slightly higher than the minimum sample
size of 540 required for 3% LS and 95% CI) were randomly selected for the study. The
number of households in the control and treatment (BRAC WASH and WASH-agriculture)
groups was determined based on the presence of FC bacteria in their drinking water. The
sampling design shown in Fig. 2 was applied to all three study groups.
I. BRAC WASH treatment: A total of 192 SB households were randomly selected from
the study population of 407 households involving 24 schools (6 schools x 4 BRAC
WASH sub-districts). These schools received only the BRAC WASH treatment.
II. WASH-agriculture treatment: A total of 227 households were selected to receive the
WASH-agriculture treatment from the study population of 427 households involving
28 schools (7 schools x 4 BRAC WASH sub-districts). However, only 192 households
received treatment in the end, while the rest of the households (15%) dropped out
due to various reasons (to be discussed later). Additionally, to capture spillover
effects, 106 households in this group were selected to form the sample group.
III. Control: Due to time constraints, a smaller number of households (126 households)
were randomly selected from 260 households involving 14 schools in 2 sub-districts
(7 schools x 2 sub-districts). These households received neither the BRAC WASH
treatment nor the WASH-agriculture treatment but, as mentioned earlier, may have
received WASH interventions carried out by government departments and other
stakeholders. Since there were no BRAC SBs in these schools, households with
students from grade 6-9 who had achieved commendable grades were randomly
selected for this group instead.
10
Figure 2 Detailed Sampling frame
Other information was also collected during the water quality census, including which WASH
stakeholders were active in the sub-districts, locally available water filtration methods, and
the cost of the water filtration methods.
6 Sub-districts were selected
Atrai Kalihati Mirzapur Bakshigonj Melandaha Bauphal
28 schools from WASH-agriculture treatment group and 24 schools from BRAC WASH treatment group were selected from
four BRAC WASH treatment sub-districts (Atrai, Kalihati, Bakshigonj and Bauphal).
14 schools were selected from two Sub-districts (Mirzapur and Melandaha) as control.
WASH-agriculture Treatment:
BRAC WASH treatment +
WASH-agriculture treatment
622 student brigades (SBs) HHs
But 24*28=672
BRAC WASH treatment: No
WASH-agriculture treatment,
only BRAC WASH treatment
555 student brigades (SBs) HHs
But 24*24=576
Control: No WASH-agriculture
Treatment, no BRAC WASH treatment
336 students HHs
(24*14)
24 SB members (or students, if school had no SB) were randomly selected from each school for water quality census
407 cases of fecal contamination 260 cases of fecal contamination
Final samples size of 648 (although only 540 our of 1,513 is required at 3% CI and 95% CL) based on fecal contamination derived from water quality census: treatment –control follows proportionate random sampling
WASH-agriculture treatment:
224 SB households + 106 households to capture
spillover effects
Control:
126 students (households)
Baseline measurement: (1) Household questionnaire (household demographic, availability and source of water, agriculture and
irrigation, health), (2) village/school WASH committee questionnaire, (3) student questionnaire
427 cases of fecal contamination
BRAC WASH treatment:
192 SB households
WASH-agriculture treatment package
Letter containing prior water quality test results , agriculture hygiene messages through poster and repeated water quality tests
Endline measurement: (1) Household questionnaire (household demographic, availability and source of water, agriculture and
irrigation, health), (2) village/school WASH committee questionnaire, (3) student questionnaire

11
B. Baseline survey (December 2014 – January 2015)
A baseline survey was conducted among the selected sample households and students, and
in their respective communities (the school WASH committee and village WASH committee)
mainly to establish the similarity between the treatment and the control groups and
highlight the salient WASH and agricultural hygiene issues.
C. WASH-agriculture intervention (March – May 2015)
The WASH-agriculture treatment implementation guidelines presented in Annex 5 were
given to the teachers in charge of the SBs. Only SB members in the treatment group were
given the technical knowledge related to the intervention. They were taught how to collect
water samples from the POU and POS in their household and were instructed to collect
water samples on three different times (March 2015 at the POU, April 2015 at the POS, and
May 2015 at the POU). The SB members were also taught how to analyze the water samples
at school using the test kits provided and how to communicate the results to their
households. These repeated drinking water tests at the POU and POS were expected to help
the SB households better understand their own drinking water quality and encourage them
to take necessary measures to ensure safe drinking water quality. The teachers also
distributed a letter containing the results of the initial water quality test and a poster
displaying agriculture hygiene messages only to the SB members in the treatment group.
Students in the control group were not given these items. The SB members were
responsible for explaining the messages about agriculture hygiene conveyed by the poster
to their household members. A copy of the letter and the poster are shown in Annex 3 and
Annex 4 respectively.
D. Endline survey (June-July 2015 or 12 weeks after the WASH-agriculture treatment was
given)
During the endline survey, the trained technical assistants collected and tested water
samples from the POU of the selected sample households again. They also conducted a
detailed survey among the households, students, school WASH committee and village WASH
committee.
3.3 WASH-agriculture impact pathway
Figure 3 gives an overview of the WASH-agriculture treatment and impact pathway (Malek
et al. 2015). The expected immediate output of improved hygiene awareness was increased
demand on drinking water quality and WASH environment. This would consequently change
household hygiene behavior and practice (such as improving hygiene index, increasing the
amount of investment in and the willingness to pay for WASH-related technology, and

12
lowering medical expenditure caused by water borne diseases), which in turn would lead to
better direct, or short-term, outcomes. For instance, the quality of water used for drinking,
cooking and washing may be improved, and instances of fecal contamination of the drinking
water at home and on farms may also be reduced because of improved WASH practice in
both settings. These short-term outcomes would later translate into improved health (such
as improved child anthropometrics) and higher developmental productivity by reducing
incidence of waterborne diseases (such as diarrhea).
3.4 Ethical Considerations
Interviews were only conducted after the participants had given their consent and ethical
clearance was obtained from the appropriate authority. While the risk of creating an
imbalance between the development path of the treatment and control groups cannot be
completely ignored, we consider it minimal given that BRAC WASH may be scaling up the
intervention program. The program would most likely be gradually expanded to cover
households in the control areas after the completion of fieldwork related to this study. We
hope that the beneficial effects of the interventions will motivate other organizations to
replicate the interventions or include them in other WASH or development programs in the
future.
Improved health and
developmental
productivity Improved water
quality and
hygiene practices
Household
WASH behavior
and investment Demand for improved
water quality,
sanitation and
hygiene environment
Communicating water
quality test result
Hygiene messages
(farm and household)
Water quality testing
kit at school for their
testing.
Immediate Output Long-term Outcome Short-term Outcome Activities
Figure 3 Impact pathway of WASH-agriculture intervention through the student brigades
13
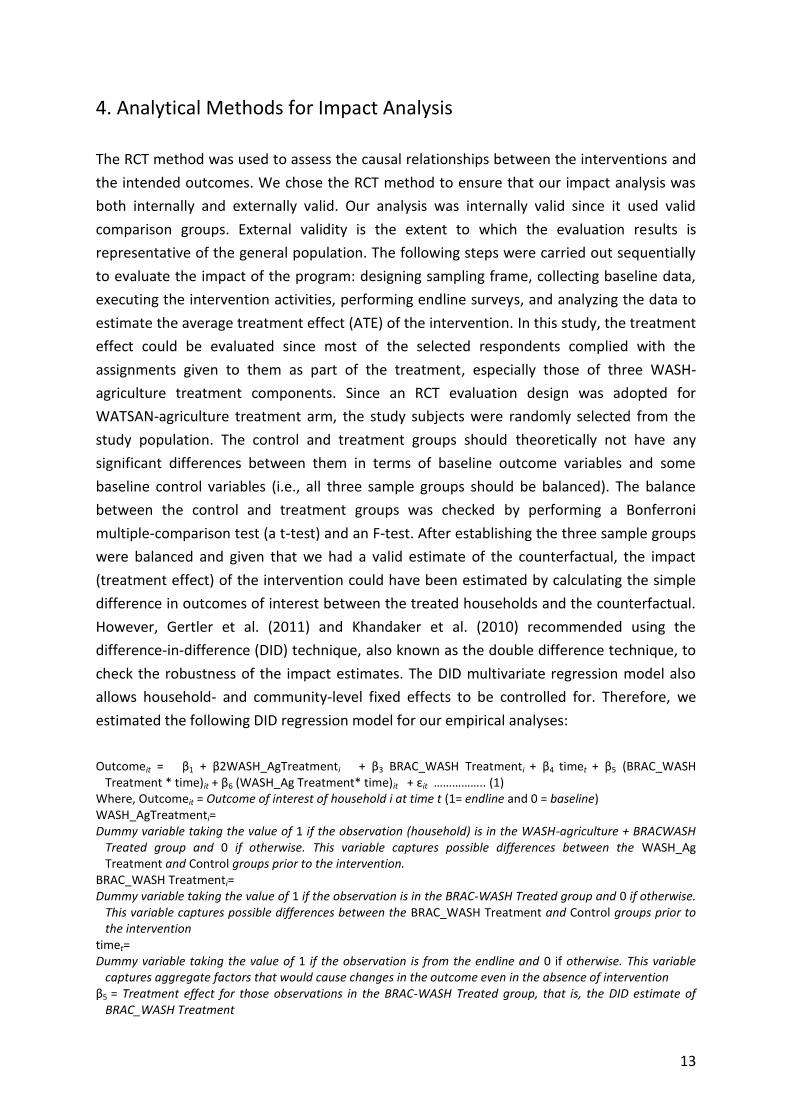
4. Analytical Methods for Impact Analysis
The RCT method was used to assess the causal relationships between the interventions and
the intended outcomes. We chose the RCT method to ensure that our impact analysis was
both internally and externally valid. Our analysis was internally valid since it used valid
comparison groups. External validity is the extent to which the evaluation results is
representative of the general population. The following steps were carried out sequentially
to evaluate the impact of the program: designing sampling frame, collecting baseline data,
executing the intervention activities, performing endline surveys, and analyzing the data to
estimate the average treatment effect (ATE) of the intervention. In this study, the treatment
effect could be evaluated since most of the selected respondents complied with the
assignments given to them as part of the treatment, especially those of three WASH-
agriculture treatment components. Since an RCT evaluation design was adopted for
WATSAN-agriculture treatment arm, the study subjects were randomly selected from the
study population. The control and treatment groups should theoretically not have any
significant differences between them in terms of baseline outcome variables and some
baseline control variables (i.e., all three sample groups should be balanced). The balance
between the control and treatment groups was checked by performing a Bonferroni
multiple-comparison test (a t-test) and an F-test. After establishing the three sample groups
were balanced and given that we had a valid estimate of the counterfactual, the impact
(treatment effect) of the intervention could have been estimated by calculating the simple
difference in outcomes of interest between the treated households and the counterfactual.
However, Gertler et al. (2011) and Khandaker et al. (2010) recommended using the
difference-in-difference (DID) technique, also known as the double difference technique, to
check the robustness of the impact estimates. The DID multivariate regression model also
allows household- and community-level fixed effects to be controlled for. Therefore, we
estimated the following DID regression model for our empirical analyses:
Outcomeit = β1 + β2WASH_AgTreatmenti + β3 BRAC_WASH Treatmenti + β4 timet + β5 (BRAC_WASH
Treatment * time)it + β6 (WASH_Ag Treatment* time)it + εit …………….. (1) Where, Outcomeit = Outcome of interest of household i at time t (1= endline and 0 = baseline) WASH_AgTreatmenti= Dummy variable taking the value of 1 if the observation (household) is in the WASH-agriculture + BRACWASH
Treated group and 0 if otherwise. This variable captures possible differences between the WASH_Ag Treatment and Control groups prior to the intervention.
BRAC_WASH Treatmenti= Dummy variable taking the value of 1 if the observation is in the BRAC-WASH Treated group and 0 if otherwise.
This variable captures possible differences between the BRAC_WASH Treatment and Control groups prior to the intervention
timet= Dummy variable taking the value of 1 if the observation is from the endline and 0 if otherwise. This variable
captures aggregate factors that would cause changes in the outcome even in the absence of intervention β5 = Treatment effect for those observations in the BRAC-WASH Treated group, that is, the DID estimate of
BRAC_WASH Treatment
14
β6 = Treatment effect for those observations in the WASH-agriculture Treated group, that is, the DID estimate of WASH_Ag Treatment
β1 = Constant, the mean of outcome variables for Control group at the baseline.
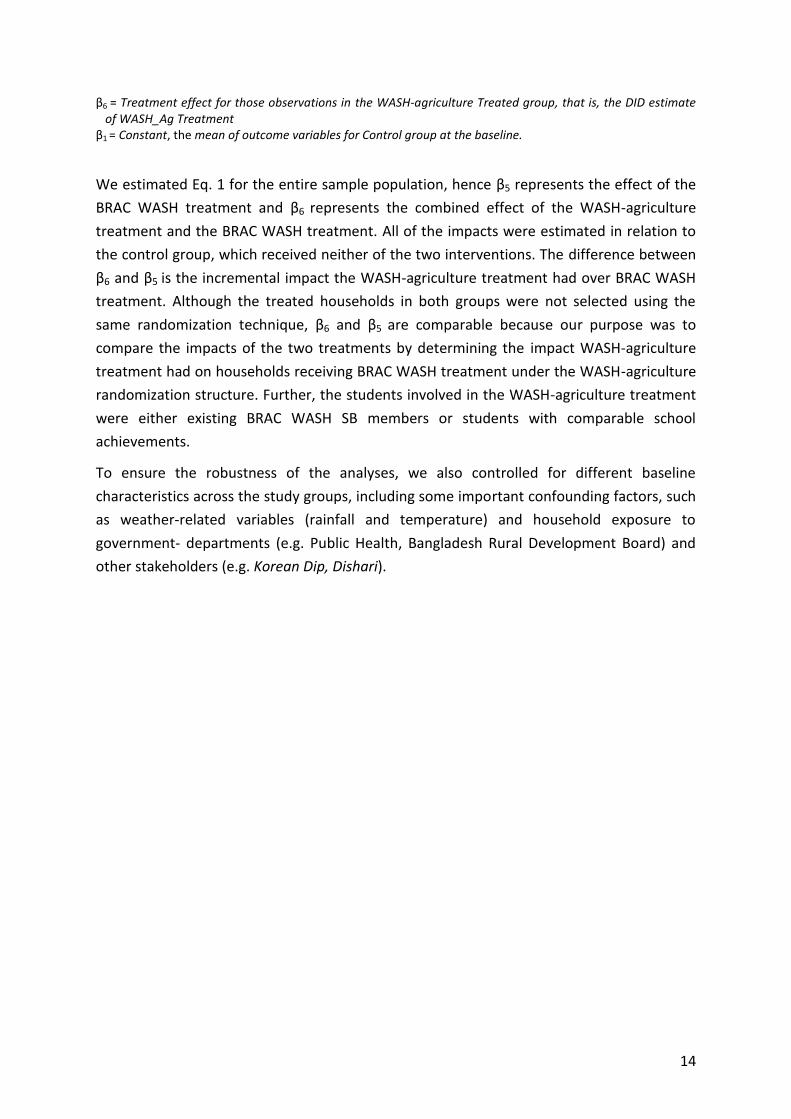
We estimated Eq. 1 for the entire sample population, hence β5 represents the effect of the
BRAC WASH treatment and β6 represents the combined effect of the WASH-agriculture
treatment and the BRAC WASH treatment. All of the impacts were estimated in relation to
the control group, which received neither of the two interventions. The difference between
β6 and β5 is the incremental impact the WASH-agriculture treatment had over BRAC WASH
treatment. Although the treated households in both groups were not selected using the
same randomization technique, β6 and β5 are comparable because our purpose was to
compare the impacts of the two treatments by determining the impact WASH-agriculture
treatment had on households receiving BRAC WASH treatment under the WASH-agriculture
randomization structure. Further, the students involved in the WASH-agriculture treatment
were either existing BRAC WASH SB members or students with comparable school
achievements.
To ensure the robustness of the analyses, we also controlled for different baseline
characteristics across the study groups, including some important confounding factors, such
as weather-related variables (rainfall and temperature) and household exposure to
government- departments (e.g. Public Health, Bangladesh Rural Development Board) and
other stakeholders (e.g. Korean Dip, Dishari).

15
5. Results and Discussion
5.1 Baseline Survey Results
As mentioned earlier, there should be theoretically no significant difference between the
three groups (the BRAC WASH treatment, WASH-agriculture and control group) in terms of
baseline outcome variables of interest and major baseline characteristics because we
adopted an RCT evaluation design. To determine whether there were any significant
differences between the groups at baseline, a Bonferroni multiple-comparison test (a t-test)
and an F-test were performed on key variables. We found that the baseline variables and
baseline household characteristics were statistically similar between the three groups in
most of the cases, which was in line with our expectation (Annex 6-a,b). More specifically, 9
out of 16 control variables reflected that the groups were balanced, while 19 out of 33
outcome variables indicated that the groups were balanced. There were only minor
statistical differences in the other baseline variables (such as household size, the student’s
math score, average temperature, latitude, and household exposure to other WASH
programs for control variables; and washing hands with soap or detergent before preparing
and eating food, willingness to pay for water purification methods, and water hygiene index
for outcome variables). We also adopted the DID multivariate regression technique to take
into account the dissimilarities in these variables between the groups and to ensure the
robustness of the analysis.
5.2 WASH-agriculture Treatment Acceptance and Attrition
A total of 227 SB households were randomly selected for the WASH-Agriculture treatment
based on the baseline survey results. However, only 192 of the SB households received
treatment in the end and the remaining households dropped out of the treatment due to
various reasons, such as unavailability, vacation or change of residence. Treatment attrition
was around 15%, while survey attrition was less than 1%. As shown in Table 1, exactly 50%
of the treatment households reported that “water testing result” was the most important
treatment form, followed by “poster” (42%) and then “repeated water testing” (8%). About
55 % of the SB households were involved in the repeated water tests. About 41% of the
households thought the water tests were necessary. During the endline survey, the
enumerators found that 83.85% of the households were displaying the poster at home.

16
Table 1 Treatment household’s acceptance of the WASH-agriculture treatment at the treatment areas
Acceptance: SB households that received the letter and poster and carried repeated water testing? (N=227) 192 (84.58%)
Which component of the treatment was the most important to the SB household? (N=192)
1) Water testing result in the letter 96 (50.00%)
2) Agriculture hygiene messages/Poster 80 (41.67%)
3) Repeated water testing by children in the household 16
(8.33%)
Reason for performing repeated water testing (N=192)
-Because it was necessary 78 (40.61%)
-Because they were asked to 107 (55.33%)
-Because it was free 7
(4.06%)
Enumerators observed poster display at home during endline data collection (N=192) 161 (83.85%)
Households members complied with the messages on the poster (N=192) 188 (97.92%)
Were those messages necessary for maintaining household cleanliness, safe drinking water and leading healthy life? (N=192) 192 (100.00%)
Table 2 The extent to which SB household members followed the agriculture hygiene messages on the poster according to the household head (N=192)
Agriculture hygiene messages Did not follow
Followed somewhat
Followed quite well
Used to follow even
before getting the
poster
1. Carry safe drinking water in a covered clean jar/bottle to the crop field 40 (20.83%) 74 (38.54%) 58 (30.21%) 20 (10.42%)
2. Treat water using current standard practices and store treated water properly 83 (43.23%) 47 (24.48%) 50 (26.04%) 12 (6.25%)
3. Protect drinking water and food from wastes/latrine 6 (3.13%) 59 (30.73%) 66 (34.38%) 61 (31.77%)
4. Use hygienic latrine 25 (13.02%) 39 (20.31%) 79 (41.15%) 49 (25.52%)
5. Wash hands with soap/detergent after working on the farm, handling animals/wastes and defecating 14 (7.29%) 43 (22.4%) 67 (34.90%) 68 (35.42%)
6. Wash hands with soap/detergent before cooking and eating 3 (1.56%) 62(32.29%) 87 (45.31%) 40 (20.83%)
In addition, 97.92% of the households complied with the hygiene messages on the poster;
all the households acknowledged that compliance with the hygiene messages was necessary
for maintaining household cleanliness, ensuring safe drinking water and leading a healthy
life. Table 2 shows the extent to which household members followed the six agricultural

17
hygiene messages on the poster according to their household head. All the messages
conveyed by the poster are meant to ensure household cleanliness, safe drinking water and
a healthy life. The idea of having improved health encouraged the households to adhere to
the messages. Further, the students played a pivotal role in conveying the messages to their
household members. Household members tended to respond more positively to the
message of handwashing before preparing and eating food, and the use hygienic latrine
than to the other hygiene messages. Household members appeared less likely to adhere to
the message of proper water treatment and storage. The underlying reason for this was
most likely the scarcity of the recommended treatment measures. Further, the farmers who
work in crop fields usually did not carry drinking water to the field; therefore, only a low
percentage of farmers followed this hygiene message.
5.3 Impact on Various Outcomes
We estimated both direct and indirect impacts of the interventions. In our analyses, the
direct (or short-term) impacts encompass those that affected WASH behavior, WASH
hygiene index, a household’s willingness to pay for water purification equipment, WASH
expenditure, and drinking water quality in terms of FC contamination. Other impacts were
considered indirect (or long-term) and include those that affect diarrhea prevalence,
anthropometric measures among under-five children, cost of illness caused by waterborne
diseases and school absenteeism. The DID multivariate regression technique was used for
estimating the impact of the interventions. All estimates are reported to show the impact of
BRAC WASH treatment and WASH-agriculture treatment. Table 3 to Table 12 show the DID
regression coefficients of BRAC WASH treatment*time (β5) and WASH-agriculture*time (β6).
The coefficients measure the impacts of the existing BRAC WASH treatment and the
specially designed WASH-agriculture treatment (administered alongside the BRAC WASH
treatment) using the control group as reference. Further, the difference between β5 and β6
indicates the incremental impact the WASH-agriculture treatment had over the BRAC WASH
treatment alone.
To ensure the robustness of the analyses, we controlled for different baseline
characteristics, including some important confounding factors such as weather-related
variables (rainfall and temperature) and household exposure to WASH interventions run by
government departments (as shown in We also controlled for different baseline
characteristics to ensure the robustness of the analyses (Table 12). These analyses were
meant to help us understand the impact of the two treatments. In the following sub-
sections, apart from statistically significant results, some statistically insignificant results will
also be discussed because of their implication for policymaking.

18
5.3.1 Direct/short term impacts
1) Improvement in WASH behavior and practices at home and on farms
WASH-agriculture treatment households exhibited improved WASH behavior compared
with both BRAC WASH treatment households and control households. They were more
likely to store drinking water at home; and practice handwashing with soap or detergent
after farming activities, handling animals or wastes, and defecating as well as before
preparing and eating food. For example, the WASH-agriculture treatment households were
13.8 percentage points more likely to store drinking water at home than the control
households, and the BRAC WASH treatment households were 11 percentage points more likely
to do so. In terms of storing drinking water at home, the WASH-agriculture treatment
households showed a 2.8 percentage point gain over the BRAC WASH treatment
households. As the WASH-agriculture treatment was carried out alongside the BRAC WASH
treatment, this 2.8 percentage point gain represents the incremental impact the WASH-
agriculture treatment had over the BRAC WASH treatment in improving water storage
practice at home and on farms. However, it should be noted that this behavioral practice
showed a positive relationship with the baseline household characteristic ‘household
exposure to other WASH programs’, which suggests the incremental impact of WASH-
agriculture treatment may have been overestimated by about 1.9 percentage points. The
WASH-agriculture treatment also had incremental impact on the handwashing practices
mentioned above; the estimated incremental impact on handwashing with soap before
preparing and eating food was robust to baseline household characteristics.

19
Table 3 Improvement in water, sanitation and hygiene behavior at home and on farms
VARIABLES
Carrying safe drinking water in a covered clean jar/bottle to
the crop field
Water treatment using current
standard practices and proper
preservation of treated water
Storage of drinking Water at home
Protecting drinking water and food from
wastes/latrine Using hygienic latrine
Handwashing with soap/detergent after
farming activities, handling
animals/wastes and defecating
Handwashing with soap/detergent before preparing and eating
food
WASH_Ag Treatment -0.0129 (0.0479)
0.0356 (0.0450)
0.00657 (0.0403)
-0.000135 (0.0469)
0 (0.0245)
0.0175 (0.0220)
-0.0504 (0.0415)
-0.0862* (0.0470)
0.0260 (0.0392)
0.0170
(0.0444) 0.0295
(0.0390) 0.0217
(0.0388) -0.0998***
(0.0377) -0.170*** (0.0457)
BRAC_WASH Treatment 0.0696
(0.0488) 0.0909** (0.0460)
0.0417 (0.0405)
0.0423 (0.0515)
-0 (0.0246)
0.0322 (0.0222)
0.0710* (0.0420)
0.124** (0.0519)
0.0859** (0.0394)
0.00696
(0.0488) -0.00846 (0.0397)
-0.00858 (0.0397)
-0.137*** (0.0379)
-0.255*** (0.0502)
time 0.103** (0.0441)
3.249*** (0.378)
0.0273 (0.0371)
0.906* (0.474)
-0.238*** (0.0226)
-0.754*** (0.185)
0.0472 (0.0383)
1.805*** (0.477)
0.0157 (0.0362)
1.614*** (0.448)
0.0867** (0.0359)
-1.198*** (0.327)
0.109*** (0.0347)
1.237*** (0.462)
BRAC_WASH Treatment*time
0.0255 (0.0689)
0.0237 (0.0650)
0.0412 (0.0572)
-0.0159 (0.0776)
0.110*** (0.0348)
0.109*** (0.0313)
0.00670 (0.0594)
-0.0255 (0.0778)
0.0210 (0.0557)
0.0287
(0.0734) 0.0925* (0.0561)
0.0814 (0.0560)
0.118** (0.0535)
0.171** (0.0756)
WASH_AgTreatment*time 0.179*** (0.0677)
0.162** (0.0632)
0.0506 (0.0570)
0.00480 (0.0731)
0.138*** (0.0347)
0.118*** (0.0309)
0.131** (0.0587)
0.232*** (0.0729)
0.0675 (0.0555)
0.0981
(0.0691) 0.104*
(0.0552) 0.0896
(0.0545) 0.172*** (0.0533)
0.238*** (0.0712)
Household Controls [Household exposure with other WASH programs]
No
Yes [0.06
(0.05)]
No
Yes [0.226***
(0.05)] No
Yes [0.0615***
(0.0220)] No
Yes [-0.0678 (0.0521)]
No
Yes [0.0769
(0.0492)]
No
Yes [0.0882** (0.0391)]
No
Yes [ 0.0280 (0.0507)]
Constant (Control) 0.372*** (0.0312)
7.710*** (1.284)
0.196*** (0.0263)
3.106** (1.449)
1*** (0.0160)
0.0917 (0.632)
0.689*** (0.0271)
2.409* (1.455)
0.724*** (0.0256)
8.877***
(1.372) 0.699*** (0.0254)
-1.232 (1.115)
0.757*** (0.0246)
5.066*** (1.413)
Observations 1,192 1,192 1,282 775 1,282 1,282 1,262 767 1,282 775 1,244 1,244 1,282 775
R-squared 0.039 0.185 0.009 0.071 0.115 0.314 0.020 0.156 0.013 0.204 0.041 0.086 0.071 0.149
Notes: 1) Standard errors in parentheses. *** p<0.01, ** p<0.05, * p<0.1. 2) The variable WASH_Ag Treatment captures possible differences between the WASH_Ag Treatment and Control groups prior to the intervention. WASH_Ag Treatment
group refers to the group that received the WASH-agriculture treatment. 3) The variable BRAC_WASH Treatment captures possible differences between the BRAC_WASH Treatment and Control group prior to the intervention. 4) The variable time captures aggregate factors that cause changes in the outcome even without any intervention. 5) The variable WASH_AgTreatment*time shows the DID estimated impact of the WASH-Ag treatment, which include the BRAC WASH treatment. 6) The variable BRAC_WASH Treatment*time shows the DID estimated impact of the BRAC WASH treatment. 7) The variable Household Controls contains baseline household characteristics, such as household distance from school, household size, and household expenditure in the
previous month. Along with all household control variables, ‘household exposure to other WASH programs’ is reported in the brackets. 8) Constant indicates the mean of the control group at baseline.

20
2) Household WASH hygiene index
Fifteen hygiene behaviors were used to calculate five hygiene indices (environmental,
sanitary, water, food and personal) that constituted the overall WASH hygiene index, shown
in the last column of Table 4. The indices were scored on a scale of one to three, with one
representing ‘worst’, two ‘moderate’ and three ‘best’.
The results show that the BRAC WASH treatment had greater impact on the sanitary hygiene
index and WASH hygiene index than the WASH-agriculture treatment (Table 4). Both were
robust to household control variables, but the WASH hygiene index exhibited a negative
relationship with the variable ‘household exposure to other WASH programs’, which did not
suggest any over- or underestimation of the impacts on the WASH hygiene index. The
WASH-agriculture treatment had incremental impact on the environmental hygiene index
over the BRAC WASH treatment, but only after controlling for baseline household
characteristics. In comparison, the WASH-agriculture treatment had greater impact on the
personal hygiene index after considering the household controls, although the personal
hygiene index also had a negative relationship with the variable ‘household exposure to
other WASH programs’. As with the WASH hygiene index, this did not suggest any over- or
underestimation of the impacts on the personal hygiene index.
Even though the BRAC WASH treatment had greater impact on the sanitary hygiene index
and the overall WASH hygiene index than the WASH-agriculture treatment (performed
concurrently with the BRAC WASH treatment), this does not mean that the WASH-
agriculture treatment caused household hygiene behavior to worsen. WASH-agriculture
treatment was carried out in six sub-districts (hotspots) characterized by comparatively poor
WASH indicators, and the two treatment groups consisted of households with slightly
dissimilar baseline characteristics, which was why the DID regression technique was used for
the analysis in the first place. The negative difference between the values of β6 and β5 (found
in Eq. 1) implies that applying the WASH-agriculture treatment on top of the existing BRAC
WASH treatment did not have as much impact as applying the BRAC WASH treatment alone.
Nonetheless, households receiving the WASH-agriculture treatment still achieved better
WASH outcomes than those in the control group.

21
Table 4 Impact on WASH hygiene indices
VARIABLES Environmental hygiene
index Sanitary hygiene index Water hygiene index Food hygiene index Personal hygiene index
Overall WASH hygiene index
WASH_AgTreatment -0.00391 (0.0685)
-0.0307 (0.0686)
0.0135 (0.0631)
0.0126 (0.0619)
-0.103 (0.0628)
-0.149** (0.0625)
0.0894 (0.0629)
-0.0597 (0.0755)
0.0101 (0.0661)
-0.101 (0.0780)
0.00610 (0.219)
-0.206 (0.214)
BRAC_WASH Treatment 0.0597
(0.0691) 0.0496
(0.0698) -0.0199 (0.0637)
-0.0361 (0.0629)
-0.117* (0.0634)
-0.152** (0.0636)
0.114* (0.0635)
-0.0675 (0.0829)
0.0907 (0.0667)
-0.0208 (0.0857)
0.128 (0.221)
-0.0583 (0.218)
time 0.268*** (0.0630)
-0.860 (0.576)
-0.0881 (0.0580)
2.246*** (0.520)
0.142** (0.0578)
-1.006* (0.526)
0.184*** (0.0578)
-0.538 (0.762)
0.0536 (0.0608)
-0.939 (0.788)
0.559*** (0.201)
-0.344 (1.799)
BRAC_WASH
Treatment*time
0.245** (0.0977)
0.234** (0.0983)
0.272*** (0.0901)
0.239*** (0.0887)
0.210** (0.0897)
0.184** (0.0897)
0.0539 (0.0898)
0.172 (0.125)
0.146 (0.0944)
0.255** (0.129)
0.927*** (0.312)
0.873*** (0.307)
WASH_AgTreatment*time 0.156
(0.0968) 0.160*
(0.0963) 0.156*
(0.0893) 0.165*
(0.0868) 0.141
(0.0889) 0.141
(0.0878) 0.0308
(0.0890) 0.205* (0.117)
0.250*** (0.0935)
0.288** (0.121)
0.734** (0.309)
0.795*** (0.300)
Household Controls [Household exposure with other WASH programs]
No
Yes [-0.0883 (0.0683)]
No
Yes [-0.0750 (0.0616)]
No
Yes [-0.0309 (0.0623)]
No
Yes [-0.159* (0.0836)]
No
Yes [-0.194** (0.0864)]
No
Yes [-0.581***
(0.213)]
Constant (Control) 1.632*** (0.0445)
-2.233 (1.961)
2.123*** (0.0410)
5.528*** (1.769)
2.176*** (0.0409)
-0.207 (1.789)
2.172*** (0.0409)
1.007 (2.331)
2.142*** (0.0430)
0.977 (2.410)
10.25*** (0.142)
5.741 (6.121)
Observations 1,274 1,274 1,274 1,274 1,274 1,274 1,274 775 1,274 775 1,274 1,274
R-squared 0.081 0.113 0.014 0.089 0.038 0.083 0.033 0.097 0.032 0.086 0.068 0.140
Notes: 1) Standard errors in parentheses. *** p<0.01, ** p<0.05, * p<0.1. 2) The variable WASH_AgTreatment captures possible differences between the WASH_AgTreatment and Control groups prior to the intervention. WASH_AgTreatment group refers to the
group that received the WASH-agriculture treatment. 3) The variable BRAC_WASH Treatment captures possible differences between the BRAC_WASH Treatment and Control group prior to the intervention. 4) The variable time captures aggregate factors that affect the outcome even without any intervention. 5) The variable WASH_AgTreatment*time shows the DID estimated impact of the WASH-Ag treatment, which includes the BRAC WASH treatment impact. 6) The variable BRAC_WASH Treatment*time shows the DID estimated impact of the BRAC WASH treatment. 7) The variable Household Controls contains baseline household characteristics, such as household distance from school, household size and household expenditure in the previous month.
Along with all household control variables, ‘household exposure to other WASH programs’ is reported in the brackets. 8) Constant shows the mean of the control group at baseline.

22
3) Impact on WASH expenditure and the willingness to use or pay for technology adoption
and WASH expenditure
Table 5 shows the impact of the two treatments on a household’s willingness to use2 or pay
for water purification methods. When compared with the WASH-agriculture treatment, the
BRAC WASH treatment alone had a greater impact on a household’s willingness to use or
pay for six of the nine measures to ensure drinking water safety. These six measures are
namely ‘pumping and sand removal, ‘cloth filter’, ‘boiling’, ‘water storage container’,
‘bottled water’ and ‘ceramic water filter’. The results were robust to household control
variables. However, after controlling for baseline household characteristics, these results
turn out to be slightly underestimated. Among them, the impact on ‘cloth filtration’ and
‘ceramic water filter’ were underestimated by the largest margins.
The WASH-agriculture treatment had incremental impacts on the measures ‘chlorine tablet’
and ‘non-electric filter’ over the BRAC WASH treatment. Controlling for baseline household
characteristics revealed that the incremental impacts were slightly underestimated.
The WASH-agriculture treatment was initially estimated to have a larger impact on the
variable ‘sandstone filter’ than the BRAC WASH treatment. However, after considering the
household control variables, the BRAC WASH treatment turned out to have a larger impact
on ‘sandstone filter’ instead. The results remained consistent even after taking into account
household exposure to other WASH programs.
2 We use ‘willingness to use’ for water purification methods that do not require any monetary investment and ‘willingness to pay’ for water purification methods that requires some monetary investment.

23
Table 5 Willingness to use or pay for technology adoption
VARIABLES
Willingness to use or pay for water purification methods
Pump and sand removal (conventional method)
Cloth filter (conventional method)
Boiling Chlorine tablet Water storage
container Bottled water (factory made)
WASH_AgTreatment -0.228***
(0.0293)
-0.209*** (0.0290)
-0.236***
(0.0380)
-0.218*** (0.0431)
-0.219***
(0.0347)
-0.188*** (0.0340)
-0.154***
(0.0242)
-0.144*** (0.0242)
-0.193***
(0.0364)
-0.162*** (0.0339)
-0.106***
(0.0179)
-0.121*** (0.0246)
BRAC_WASH Treatment -0.227***
(0.0295)
-0.205*** (0.0293)
-0.251***
(0.0382)
-0.232*** (0.0473)
-0.229***
(0.0348)
-0.196*** (0.0344)
-0.148***
(0.0243)
-0.141*** (0.0245)
-0.198***
(0.0365)
-0.160*** (0.0343)
-0.106***
(0.0179)
-0.120*** (0.0270)
time -0.0682**
(0.0270)
-0.383 (0.244)
-0.0868**
(0.0350)
0.125 (0.435)
-0.0945***
(0.0320)
0.125 (0.286)
-0.126***
(0.0223)
-0.322 (0.204)
0.0675**
(0.0335)
-1.074*** (0.285)
-0.0723***
(0.0165)
-0.0596 (0.248)
BRAC_WASH Treatment
*time
0.152***
(0.0417)
0.152*** (0.0413)
0.218***
(0.0540)
0.276*** (0.0713)
0.220***
(0.0493)
0.230*** (0.0484)
0.167***
(0.0344)
0.168*** (0.0345)
0.291***
(0.0517)
0.300*** (0.0483)
0.109***
(0.0254)
0.126*** (0.0406)
WASH_AgTreatment*time 0.125***
(0.0415)
0.122*** (0.0407)
0.216***
(0.0537)
0.175*** (0.0671)
0.218***
(0.0490)
0.215*** (0.0477)
0.172***
(0.0342)
0.175*** (0.0340)
0.259***
(0.0514)
0.251*** (0.0476)
0.0978***
(0.0253)
0.0997*** (0.0382)
Household Controls [Household exposure with other WASH programs]
No
Yes [0.0848***
(0.0290)]
No
Yes [0.110** (0.0478)]
No
Yes [0.0724** (0.0340)]
No
Yes [0.0563** (0.0243)]
No
Yes [0.0307
(0.0339)]
No
Yes [0.0225
(0.0272)]
Constant (Control) 0.244***
(0.0191)
-2.648*** (0.832)
0.337***
(0.0248)
-2.630** (1.332)
0.283***
(0.0226)
-1.112 (0.977)
0.176***
(0.0158)
-0.705 (0.696)
0.210***
(0.0237)
-4.485*** (0.974)
0.107***
(0.0116)
-0.494 (0.759)
Observations 1,282 1,282 1,282 775 1,282 1,282 1,282 1,282 1,282 1,282 1,282 775
R-squared 0.072 0.128 0.046 0.227 0.046 0.116 0.044 0.078 0.114 0.258 0.039 0.094

24
Table 5 Willingness to use or pay for technology adoption (Continued)
VARIABLES
Willingness to use or pay for water purification methods
Ceramic water filter Filter made of sand stone Non-electric filter (factory
made)
WASH_AgTreatment -0.124***
(0.0209)
-0.144*** (0.0269)
-0.167***
(0.0261)
-0.166*** (0.0308)
-0.0975***
(0.0236)
-0.0955*** (0.0237)
BRAC_WASH Treatment -0.124***
(0.0210)
-0.152*** (0.0296)
-0.161***
(0.0263)
-0.185*** (0.0338)
-0.0815***
(0.0237)
-0.0840*** (0.0240)
time -0.0760***
(0.0193)
-0.718*** (0.272)
-0.0759***
(0.0241)
-0.348 (0.311)
-0.0375*
(0.0218)
0.00342 (0.199)
BRAC_WASH Treatment
*time
0.123***
(0.0297)
0.158*** (0.0445)
0.128***
(0.0371)
0.181*** (0.0510)
0.111***
(0.0336)
0.118*** (0.0338)
WASH_AgTreatment*time 0.112***
(0.0295)
0.122*** (0.0419)
0.133***
(0.0370)
0.120** (0.0480)
0.136***
(0.0334)
0.149*** (0.0332)
Household Controls [Household exposure with other WASH programs]
No
Yes [0.0570* (0.0298)]
No
Yes [0.0915*** (0.0341)]
No
Yes [-0.0265 (0.0237)]
Constant (Control) 0.130***
(0.0136)
-2.383*** (0.832)
0.183***
(0.0170)
-1.411 (0.952)
0.103***
(0.0154)
-0.932 (0.681)
Observations 1,282 775 1,282 775 1,282 1,282
R-squared 0.038 0.112 0.043 0.131 0.023 0.053
Notes: 1) Standard errors in parentheses. *** p<0.01, ** p<0.05, * p<0.1. 2) The variable WASH_AgTreatment captures possible differences between the WASH_AgTreatment and
Control groups prior to the intervention. WASH_AgTreatment group refers to the group that received the WASH-agriculture treatment.
3) The variable BRAC_WASH Treatment captures possible differences between the BRAC_WASH Treatment and Control group prior to the intervention.
4) The variable time captures aggregate factors that affect the outcome even without any intervention. 5) The variable WASH_AgTreatment*time shows the DID estimated impact of the WASH-Ag treatment, which
include the BRAC WASH treatment impact. 6) The variable BRAC_WASH Treatment*time shows the DID estimated impact of the BRAC WASH treatment. 7) The variable Household Controls contains baseline household characteristics, such as household distance
from school, household size, and household expenditure in the previous month. Along with all household control variables, ‘household exposure to other WASH programs’ is reported in the brackets.
8) Constant shows the mean of the control group at baseline.
The WASH-agriculture treatment did not have any significant incremental impact on
household WASH expenditure over the BRAC WASH treatment (Table 6). However, after
controlling for baseline household characteristics, the impact of the BRAC WASH treatment
was greater than that of the WASH-agriculture treatment, but the resulting change in
household WASH expenditure was insignificant.

25
Table 6 Impact on WASH expenditure
VARIABLES WASH Expenditure (BDT)
WASH_AgTreatment -83.14** (38.82)
-86.32** (37.25)
BRAC_WASH Treatment -44.04 (38.99)
-69.23* (37.67)
time -108.4***
(35.78) -380.4 (313.6)
BRAC_WASH Treatment*time 112.0** (55.14)
117.3** (53.07)
WASH_AgTreatment*time 112.6** (54.89)
117.2** (52.29)
Household Controls [Household exposure with other WASH programs]
No
Yes [26.54
(37.30)]
Constant (Control) 437.8***
(25.30) 2,851*** (1,071)
Observations 1,282 1,282
R-squared 0.009 0.120
Notes: 1) Standard errors in parentheses. *** p<0.01, ** p<0.05, * p<0.1. 2) The variable WASH_AgTreatment captures possible differences between the WASH_AgTreatment and
Control groups prior to the intervention. WASH_AgTreatment group refers to the group that received the WASH-agriculture treatment.
3) The variable BRAC_WASH Treatment captures possible differences between the BRAC_WASH Treatment and Control group prior to the intervention.
4) The variable time captures aggregate factors that affect the outcome even without any intervention. 5) The variable WASH_AgTreatment*time shows the DID estimated impact of the WASH-Ag treatment, which
include the BRAC WASH treatment impact. 6) The variable BRAC_WASH Treatment*time shows the DID estimated impact of the BRAC WASH treatment. 7) The variable Household Controls contains baseline household characteristics, such as household distance
from school, household size, and household expenditure in the previous month. Along with all household control variables, ‘household exposure to other WASH programs’ is reported in the brackets.
8) Constant shows the mean of the control group at baseline.
4) Impact on microbial water quality
A microbial water quality test was conducted for every sample household before as well as
after they received treatment (Table 7). At the baseline, the pre-intervention period, 100% of
the households in our sample households had FC bacteria contamination in the drinking water.
In the analysis, microbial water quality was represented as a binary variable, taking on the
value one or zero depending whether FC bacteria were present in a household’s drinking
water. The WASH-agriculture treatment had a greater impact than the BRAC WASH
treatment alone. Controlling for baseline household characteristics revealed that the impact
of the WASH-agriculture treatment was underestimated, even though other WASH programs
also had significant positive impact on household microbial water quality.

26
Table 7 Impact on microbial water quality (FC presence)
VARIABLES Water Quality Result
WASH_AgTreatment 0
(0.0288) -0.00549 (0.0291)
BRAC_WASH Treatment 0
(0.0290) -0.0108 (0.0294)
time -0.186*** (0.0266)
-0.0751 (0.245)
BRAC_WASH Treatment*time -0.0937** (0.0410)
-0.0831** (0.0415)
WASH_AgTreatment*time -0.115*** (0.0408)
-0.109*** (0.0409)
Household Controls [Household exposure with other WASH programs]
No
Yes [-0.0609** (0.0291)]
Constant (Control) 1***
(0.0188) 1.760** (0.836)
Observations 1,280 1,280
R-squared 0.154 0.170
Notes: 1) Standard errors in parentheses. *** p<0.01, ** p<0.05, * p<0.1. 2) The variable WASH_AgTreatment captures possible differences between the WASH_AgTreatment and
Control groups prior to the intervention. WASH_AgTreatment group refers to the group that received the WASH-agriculture treatment.
3) The variable BRAC_WASH Treatment captures possible differences between the BRAC_WASH Treatment and Control group prior to the intervention.
4) The variable time captures aggregate factors that affect the outcome even without any intervention. 5) The variable WASH_AgTreatment*time shows the DID estimated impact of the WASH-Ag treatment, which
include the BRAC WASH treatment impact. 6) The variable BRAC_WASH Treatment*time shows the DID estimated impact of the BRAC WASH treatment. 7) The variable Household Controls contains baseline household characteristics, such as household distance
from school, household size, and household expenditure in the previous month. Along with all household control variables, ‘household exposure to other WASH programs’ is reported in the brackets.
8) Constant shows the mean of the control group at baseline.
5.3.2 Indirect/long-term impacts
1) Impact on diarrhea prevalence
As reported in Table 8, the WASH-agriculture treatment largely had a positive, statistically
significant impact on diarrhea prevalence. Compared with the control group, students and
household members who received the WASH-agriculture treatment were around five
percentage points less likely to suffer from diarrhea during the two weeks prior to the
endline survey. The results were robust to household control variables. However, diarrhea
prevalence among under-five children in the WASH-agriculture treatment group was
significantly higher than in the control group. This may have been due to the very small
sample size available, which is a result of the inadequate number of survey responses. The
BRAC WASH treatment did not have any significant impact on the diarrhea prevalence in any
of the three age categories (Table 8). Therefore, the WASH-Agriculture treatment may be

27
considered an improvement over the BRAC WASH treatment. It should be noted that FC
bacteria are not the only cause of diarrhea and that the treatments may not have involved
every measures for reducing diarrhea risk in humans.
Table 8 Impact on diarrhea prevalence of household members
VARIABLES
Diarrhea prevalence
Adults Under-five children Students All household members
WASH_AgTreatment -0
(0.111) -0.0379 (0.130)
0 (0.185)
-0.551 (0.422)
0.0104 (0.0133)
0.0140 (0.0135)
0.0104 (0.0136)
0.0142 (0.0137)
BRAC_WASH Treatment 0.0313
(0.0935) 0.0415 (0.118)
-0 (0.185)
-0.139 (0.339)
-0.0111 (0.0134)
-0.00606 (0.0137)
-0.0111 (0.0137)
-0.00584 (0.0139)
time 0.321*** (0.0965)
-0.617 (1.367)
0.143 (0.177)
-2.354 (4.160)
0.0224* (0.0126)
-0.209* (0.113)
0.0222* (0.0128)
-0.215* (0.115)
BRAC_WASH Treatment*time
0.147 (0.132)
0.0381 (0.155)
0.190 (0.261)
0.350 (0.283)
-0.00462 (0.0192)
-0.00739 (0.0194)
0.000618 (0.0195)
-0.00281 (0.0197)
WASH_AgTreatment*time 0.149
(0.157) 0.0682 (0.173)
0.190 (0.261)
0.938** (0.294)
-0.0492*** (0.0190)
-0.0490** (0.0191)
-0.0491** (0.0193)
-0.0493** (0.0194)
Household Controls [Household exposure with other WASH programs]
No
Yes [-0.483** (0.213)]
No
Yes [0.854* (0.407)]
No
Yes [0.0290** (0.0135) ]
No
Yes [0.0279** (0.0137)]
Constant (Control) 0
(0.0683) 20.19
(12.43) 0
(0.125) -45.21 (37.91)
0.0165* (0.00878)
-0.793** (0.383)
0.0165* (0.00894)
-0.845** (0.390)
Observations 154 138 38 25 1,195 1,195 1,200 1,200
R-squared 0.271 0.363 0.188 0.947 0.009 0.024 0.009 0.025
Notes: 1) Standard errors in parentheses. *** p<0.01, ** p<0.05, * p<0.1. 2) The variable WASH_AgTreatment captures possible differences between the WASH_AgTreatment and
Control groups prior to the intervention. WASH_AgTreatment group refers to the group that received the WASH-agriculture treatment.
3) The variable BRAC_WASH Treatment captures possible differences between the BRAC_WASH Treatment and Control group prior to the intervention.
4) The variable time captures aggregate factors that affect the outcome even without any intervention. 5) The variable WASH_AgTreatment*time shows the DID estimated impact of the WASH-Ag treatment, which
include the BRAC WASH treatment impact. 6) The variable BRAC_WASH Treatment*time shows the DID estimated impact of the BRAC WASH treatment. 7) The variable Household Controls contains baseline household characteristics, such as household distance
from school, household size, and household expenditure in the previous month. Along with all household control variables, ‘household exposure to other WASH programs’ is reported in the brackets.
8) Constant shows the mean of the control group at baseline.
2) Impact on child health (anthropometrics)
Anthropometry is the measurement of body dimensions, such as weight and height, that
reflect the nutritional status of an individual or a population group (Cogill, 2001). In this
study, child anthropometrics3 were classified into three categories: wasting (less weight for
height), stunting (less height for age) and underweight (less weight for age). As shown in
Table 9, neither the BRAC WASH treatment nor the WASH-agriculture treatment significantly
improved child anthropometrics in the first regression. Even after controlling for baseline
3 World Health Organization (WHO) growth standard has been used for these estimations.
28
household characteristics, the treatments only had a few weakly significant impacts on child
anthropometrics. Therefore, little conclusion can be drawn from the child anthropometric
data. This is unsurprising as it takes a long time to observe detectable improvements in
anthropometric measures and the time frame of this study was not long enough for such
improvements to be observed, as is the case in other similar studies (Boisson et al., 2013;
Brown et al., 2014; and Okyere et al., 2015). However, children in a BRAC WASH treatment
household were slightly less likely to be stunted, and children in a WASH-agriculture
treatment household had the highest likelihood of being stunted or underweight after the
treatment. These findings are difficult to explain.

29
Table 9 Impact on Child anthropometrics
VARIABLES The Child(ren) of the
Household is/are Wasting
The Child(ren) of the Household is/are
Stunting
The Child(ren) of the Household is/are
Underweight
WASH_AgTreatment -0.0664 (0.0474)
-0.121** (0.0480)
0.0116 (0.0702)
0.0523 (0.0846)
-0.0197 (0.0717)
-0.0401 (0.0833)
BRAC_WASH Treatment -0.0133 (0.0443)
-0.0484 (0.0444)
0.111* (0.0656)
0.167* (0.0858)
0.0341 (0.0670)
0.0885 (0.0844)
time 0.0208
(0.0400) -0.410 (0.538)
0.0104 (0.0592)
-0.935 (1.025)
0.0521 (0.0605)
-1.732* (1.009)
BRAC_WASH Treatment*time -0.0663 (0.0626)
-0.0600 (0.0626)
-0.132 (0.0927)
-0.229* (0.125)
-0.128 (0.0948)
0.0306 (0.123)
WASH_AgTreatment*time -0.00197 (0.0670)
-0.0114 (0.0651)
0.141 (0.0993)
0.257** (0.123)
0.0423 (0.101)
0.226* (0.121)
Household Controls [Household exposure with other WASH programs]
No
Yes [-0.172*** (0.0465)]
No
Yes [-0.0835 (0.0872)]
No
Yes [-0.238*** (0.0858)]
Constant (Control) 0.104*** (0.0283)
8.278* (4.999)
0.177*** (0.0419)
-9.685 (10.91)
0.208*** (0.0428)
13.80 (10.74)
Observations 430 430 430 279 430 279
R-squared 0.014 0.108 0.022 0.134 0.009 0.140
Notes: 1) Standard errors in parentheses. *** p<0.01, ** p<0.05, * p<0.1. 2) The variable WASH_AgTreatment captures possible differences between the WASH_AgTreatment and Control groups
prior to the intervention. WASH_AgTreatment group refers to the group that received the WASH-agriculture treatment. 3) The variable BRAC_WASH Treatment captures possible differences between the BRAC_WASH Treatment and Control
group prior to the intervention. 4) The variable time captures aggregate factors that affect the outcome even without any intervention. 5) The variable WASH_AgTreatment*time shows the DID estimated impact of the WASH-Ag treatment, which include the
BRAC WASH treatment impact. 6) The variable BRAC_WASH Treatment*time shows the DID estimated impact of the BRAC WASH treatment. 7) The variable Household Controls contains baseline household characteristics, such as household distance from school,
household size, and household expenditure in the previous month. Along with all household control variables, ‘household exposure to other WASH programs’ is reported in the brackets.
8) Constant shows the mean of the control group at baseline.
3) Impact on cost of illness
On average, BRAC WASH treatment households incurred a somewhat higher cost of illness than
WASH-agriculture treatment households. At baseline, there were some significant differences
in household expenditure on treating waterborne diseases between the three groups. A
household in the control group spent an average of BDT 486.2 on treating waterborne
diseases at baseline. After treatment, a BRAC WASH treatment household spent about BDT
243 more and a WASH-agriculture treatment household about BDT 209.5 more than a control
household on average. Thus, the WASH-agriculture treatment had an incremental impact of
BDT 33.5 over the BRAC WASH treatment. After considering household control variables, it
was found that this decrease in the average expenditure was underestimated by about BDT
10.9. The higher average household expenditure on waterborne diseases in both the BRAC
WASH treatment group and the WASH-agriculture treatment group may partly be attributed
to higher levels of awareness among the treated households. Having a higher level of
awareness of waterborne diseases may have motivated treated households to visit a
certified doctor (likely one with an MBBS and charges a higher consultation fee) when they

30
felt unwell instead of using home remedies or seeking an uncertified village doctor for
treatment at no or little cost.
Table 10 Impact on cost of illness for waterborne diseases
VARIABLES Cost of illness
(Expenditure on waterborne diseases in month prior to survey – in BDT)
WASH_AgTreatment -224.2** (88.21)
-268.9*** (87.91)
BRAC_WASH Treatment -217.8** (85.26)
-280.3*** (85.97)
time -456.9***
(61.92) -2,333***
(580.9)
BRAC_WASH Treatment*time 243.0***
(92.34) 281.0***
(92.36)
WASH_AgTreatment*time 209.5** (95.01)
236.6** (94.19)
Household Controls [Household exposure with other WASH programs]
No Yes
[-31.26 (46.76)]
Constant (Control) 486.2***
(57.48) -2,950* (1,678)
Observations 749 749
R-squared 0.095 0.139
Notes: 1) Standard errors in parentheses. *** p<0.01, ** p<0.05, * p<0.1. 2) The variable WASH_AgTreatment captures possible differences between the WASH_AgTreatment and
Control groups prior to the intervention. WASH_AgTreatment group refers to the group that received the WASH-agriculture treatment.
3) The variable BRAC_WASH Treatment captures possible differences between the BRAC_WASH Treatment and Control group prior to the intervention.
4) The variable time captures aggregate factors that affect the outcome even without any intervention. 5) The variable WASH_AgTreatment*time shows the DID estimated impact of the WASH-Ag treatment, which
include the BRAC WASH treatment impact. 6) The variable BRAC_WASH Treatment*time shows the DID estimated impact of the BRAC WASH treatment. 7) The variable Household Controls contains baseline household characteristics, such as household distance
from school, household size, and household expenditure in the previous month. Along with all household control variables, ‘household exposure to other WASH programs’ is reported in the brackets.
8) Constant shows the mean of the control group at baseline.
4) Impact on school absenteeism
Student absenteeism data was collected from the participating schools to measure the
impact the treatments had on student developmental productivity. In this case, the students
were asked if they had been absent from school in the two weeks before the survey. Both
treatments had no significant impact on this variable (Table 11). After controlling for
baseline household characteristics, we found that the WASH-agriculture treatment had no
incremental impact on school absenteeism over the BRAC WASH treatment. However,
students in a WASH-Agriculture treatment household were 15.7% less likely to be absent
from school in the two weeks before the endline survey than those in the control group.

31
Table 11 Impact on school absenteeism
VARIABLES Student Absenteeism
WASH_AgTreatment 0.0969** (0.0473)
0.102** (0.0515)
BRAC_WASH Treatment 0.0525
(0.0478) 0.0689
(0.0529)
time 0.487*** (0.0400)
1.306*** (0.391)
BRAC_WASH Treatment*time 0.0180
(0.0629) -0.0539 (0.0689)
WASH_AgTreatment*time -0.0872 (0.0620)
-0.157** (0.0677)
Household Controls [Household exposure with other WASH programs]
No Yes
[-0.208* (0.110)]
Constant (Control) 1.365*** (0.0299)
3.407*** (1.197)
Observations 1,000 837
R-squared 0.251 0.291
Notes: 1) Standard errors in parentheses. *** p<0.01, ** p<0.05, * p<0.1. 2) The variable WASH_AgTreatment captures possible differences between the WASH_AgTreatment and Control groups
prior to the intervention. WASH_AgTreatment group refers to the group that received the WASH-agriculture treatment. 3) The variable BRAC_WASH Treatment captures possible differences between the BRAC_WASH Treatment and Control
group prior to the intervention. 4) The variable time captures aggregate factors that affect the outcome even without any intervention. 5) The variable WASH_AgTreatment*time shows the DID estimated impact of the WASH-Ag treatment, which include the
BRAC WASH treatment impact. 6) The variable BRAC_WASH Treatment*time shows the DID estimated impact of the BRAC WASH treatment. 7) The variable Household Controls contains baseline household characteristics, such as household distance from school,
household size, and household expenditure in the previous month. Along with all household control variables, ‘household exposure to other WASH programs’ is reported in the brackets.
8) Constant shows the mean of the control group at baseline.
32
6. Summary and conclusion
We conducted an RCT to examine the effectiveness of a specially designed package of
WASH-agriculture interventions involving students in terms of its’ impact on 1) the WASH
behavior of household members both at home and on farms, and 2) the health and
developmental outcomes for the students’ household members. The WASH-agriculture
treatment consisted of sending every treatment household a letter informing them of their
drinking water quality, putting up posters with hygiene messages and requesting them to
perform repeated water quality tests. Households selected for the study population had
either BRAC SB members or students with similar qualities; the study involved 66 schools in
6 WASH hotspots (sub-districts) in Bangladesh. The control group in this study received
neither the WASH-agriculture treatment nor the BRAC WASH treatment, but may have
received other WASH interventions by government departments or other NGO stakeholders
on a limited scale. The study design allowed us to estimate the differential impacts between
1) the BRAC WASH treatment group and the control group, 2) the WASH-agriculture
treatment group and the control group, and 3) the WASH-agriculture treatment group and
the BRAC WASH treatment group.
Initially, we performed POU water quality tests using inexpensive and user-friendly test kits
for every household with students in the study areas (a total of 1,560 households).
Households whose drinking water was contaminated with FC bacteria were selected for the
study population (1,094 households). Then, a total of 648 households were randomly chosen
for the entire study. The initial water quality census and baseline survey found that the
interventions we suggested for this experiment were justified. The study groups were similar
in most of the outcome and control variables at baseline. Out of those selected for the
WASH-agriculture treatment, 84.58% received the WASH-agriculture treatment and the
remaining households dropped out due to various reasons. The treatment attrition is around
15%, while the survey attrition is less than 1%.
We estimated both direct and indirect impacts of the interventions. The direct, or short-
term, impacts encompass changes in household WASH behavior, WASH hygiene index, the
willingness to use or pay for water purification methods, WASH expenditure and drinking
water quality in terms of the presence of FC bacteria. Impacts that require more time to be
observable were considered indirect impacts. These include changes in diarrhea prevalence,
anthropometric measures in under-five children, developmental productivity (more
specifically, cost of illness for waterborne diseases), and school absenteeism.
The DID multivariate regression technique was used to estimate the impact of the
treatments for the households with slightly dissimilar baseline characteristics across the
three groups. To ensure the robustness of the analyses, we controlled for different baseline
characteristics, including an important confounding factor (i.e., a household’s exposure to
other WASH programs). These analyses helped us better understand the magnitude of the

33
impact of the two treatments. After controlling for baseline characteristics, over- or
underestimations were generally small or negligible, indicating that the study results were
robust.
In general, the WASH-agriculture treatment had an incremental impact over the BRAC WASH
treatment, determined by calculating the difference between β6 and β5 in Eq. 1. Compared
with the BRAC WASH treatment, the WASH-agriculture treatment was especially effective in
improving the following: household WASH behavior and practices both at home and on
farms, the willingness to use or pay for three of the nine water purification methods, WASH
expenditure, and POU drinking water quality. However, the existing BRAC WASH treatment
performed better than the WASH-agriculture treatment for some other indicators related to
hygiene behavior and developmental productivity. The WASH-agriculture treatment had no
significant incremental impact over the BRAC WASH treatment in terms of diarrhea
prevalence, anthropometric measures in under-five children, and school absenteeism.
The fact that the BRAC WASH treatment had a greater impact on a few outcome variables
than the WASH-agriculture treatment does not mean that the WASH-agriculture treatment
caused household hygiene behavior to deteriorate. The DID regression results only indicate
that the WASH-agriculture treatment did not surpass the level of impact the BRAC WASH
treatment had by itself; households in the WASH-agriculture treatment group still had
improved outcomes when compared with households in the control group. There was no
evidence suggesting that the two treatments had any negative impact on household WASH
outcomes.
During the endline survey, the treated households were asked to assess the effectiveness of
three different components of the WASH-agriculture treatment. The households generally
considered receiving previous water quality test results and the poster containing agriculture
hygiene messages the two most important forms of intervention. Thus, the positive impact
of the WASH-agriculture treatment can mainly be attributed to these two factors.
While the BRAC WASH treatment had been making good progress in improving household
WASH behavior and practices, households that received the WASH-agriculture treatment
showed some gains over those that received only the BRAC WASH treatment, especially in
terms of their at-home and on-farm WASH behavior, and the microbial quality of their
drinking water. The three-month observation period was too short for any potential health
improvement among under-five children to be detectable. Improvement in diarrhea
prevalence cannot be detected within a very short time. Further, diarrhea may also be
caused by factors not addressed in the two treatments. However, BRAC WASH has
contributed significantly to meeting the country’s WASH goals through its various
community- and business-oriented approaches (BRAC, 2015). Therefore, based on the study
results, we recommend scaling up the BRAC WASH program to include hotspot areas with
poor household WASH indicators. Additionally, involving students in the BRAC WASH
program as agents of change and as a channel of conveying agriculture hygiene messages
34
could be an effective strategy for motivating households and communities to improve their
WASH behavior and practices, especially at home and on farms. Further, the WASH-
agriculture treatment could be scaled up through simple institutional or administrative
arrangements that do not require high monetary investment on generating water quality
information and poster implementation containing hygiene messages.
The suggested WASH-agriculture treatment represents an improvement over existing WASH
treatments. The study found that conveying farm-related hygiene messages to households
and informing them of their drinking water quality could be useful in improving household
hygiene behavior. Even though the WASH-agriculture treatment was implemented through
SB members, the impact could also be attributed to the efforts of their household members
and community. This shows that our study contributed to building the capacity of the
treatment households and communities in monitoring their own WASH environment
through water quality testing. Our study findings are relevant for researchers, policymakers
and program implementers in the WASH sector of not only Bangladesh but also other
developing countries.
35
References
BRAC (2015). Reaching millions with water sanitation and hygiene in Bangladesh. Extracted
from www.brac.net, 7th World Water Forum.
Boisson, S. M., Stevenson, L., Shapiro, V., Kumar, L. P., Singh, D., Ward and Clasen T. (2013).
Effect of Household-Based Drinking Water Chlorination on Diarrhea among Children
under Five in Orissa, India: A Double-Blind Randomized Placebo-Controlled Trial. PLoS
Medicine, 10(8): e1001497, pp.1-12.
Brown, J., Hamoudi, A., Jeuland, M. and Turrini, G. (2014). Heterogeneous Effects of
Information on Household Behaviors to Improve Water Quality. The Duke Environmental
and Energy Economic Working paper EE 14-06, pp 1-44.
Cogill, B. (2001). Anthropometric indicators measurement guide. Food and nutrition
technical assistance project. Academy for Educational Development, Washington DC:
USA
Devaney, B. (1993). Evaluating the effects of school health interventions on school
performance. Design Report, Mathematica Policy Research, Princeton, N.J
Engell, R. E. and Lim, S. S. (2013). Does clean water matter? An updated meta-analysis of
water supply and sanitation interventions and diarrheal diseases. The Lancet, 381, S44
Gertler, P. J., Martinez, S., Premand, P., Rawlings, L. B., &Vermeersch, C. M. (2011). Impact
evaluation in practice. World Bank Publications
Gupta, S.K., Sheikh, M.A., Islam, M.S., Rahman, K.S., Jahan, N., Rahman, M.M., Hoekstra,
R.M., Johnston, R., Ram, P.K. and Luby, S. (2007).Usefulness of the hydrogen sulfide test
for assessment of water quality in Bangladesh.Journal of Applied Microbiology, 104, pp
388–395
Jensen, R. (2010). The (Perceived) Returns to Education and the Demand for
Schooling.Quarterly Journal of Economics, 125 (2), pp 515–48
JMP Report (2015). Joint Monitoring Programme for Water Supply and Sanitation-Estimates
on the use of water sources and sanitation facilities Bangladesh. World Health
Organization (WHO)/United Nations Children’s Fund (UNICEF), Switzerland (April 2014)
(wssinfo.org).

36
Jyotsna, J. and Somanathan, E. (2008). The importance of being informed: Experimental
evidence on demand for environmental quality. Journal of Development Economics, 87,
pp 14–28.
Khandker, S. R., Koolwal, G. B., and Samad, H. A. (2010). Handbook on impact evaluation:
quantitative methods and practices. World Bank Publications
Malek, M. A., Ratnajit, S., Chowdhury, P., Khan, T.N., Ikhtiar, M. (2015). Water quality
information, WATSAN-agriculture hygiene messages and water testing with school
students: Experimental evidence for behavioral changes in Bangladesh. Proceedings of
International Association of Agricultural Economists 2015 Conference, August 9-14,
2015, Milan, Italy.
Nutbeam, D., Smith, C., Moore, L. and Bauman, A. (1993). Warning! Schools can damage
your health: alienation from school and its impact on health behavior. Journal of
pediatrics and child health. 29 Suppl 1, S25-30
Okyere, C.Y., Pangaribowo, E.H., Gerber, N. and J. von Braun. (forth coming). Household
Water Quality Testing and Information: Identifying Impacts on Health Outcomes, and
Sanitation and Hygiene-related Risk-mitigating Behaviors. ZEF- Discussion Papers on
Development Policy, Center for Development Research, Bonn.
Srinivasan, J, T. and Reddy, V,R. (2009). Impact of irrigation water quality on human health: A
case study in India, Ecological Economics, Vol. 68, no. 11, pp 2800-2807
USAID (2013). Water and Development Strategy, 2013-2018. United States Agency for
International Development, Washington, D.C.
Van-Derslice, J. and Briscoe, J. (1995). Environmental interventions in developing countries:
Interactions and their implications. American Journal of Epidemiology, Vol 141, no. 2, pp
135-144
Waddington H., Snilstveit B., White H. and Fewtrell L. (2009). Water, sanitation and hygiene
interventions to combat childhood diarrhea in developing countries. 3ie Systematic
Review: 2009.

37
Annex
Annex 1. Prevalence of diarrhea in the hotspot areas in Bangladesh (1 if yes) : Results from logit regression
Diarrhea Coef. Std. Err. P-values
Income 0.000 0.000 0.958
Agri_work (1 if yes) 0.460 0.211 0.029
ChildU5 (1 if yes) -0.263 0.202 0.193
Latrine_imprvd (1 if yes) 0.007 0.211 0.972
Soap/ash use for hand wash (1 if yes)
-0.663 0.206 0.001
Advanced areas (1 if yes) -0.030 0.190 0.874
Impvd_toilet (1 if yes) -0.424 0.389 0.276
Ss2 (1 if control) 0.600 0.251 0.017
Ss3 (1 if treatment) -0.004 0.255 0.986
Inc2 -0.533 0.256 0.038
inc3 -0.167 0.298 0.574
inc4 -0.121 0.464 0.795
_cons -0.031 0.814 0.970
Number of obs 648
LR chi2(12) 43.33
Prob> chi2 0
Annex 2-a. Socio-economics, health, sanitation and drinking water sources at study sites in Bangladesh
Indicators National
rural
Peri-urban/ advanced rural areas Marginal rural areas
Kalihati Atrai Mirzapur Avg Bauphal Bakshiganj Melandaha Avg
People under poverty
line (%) 35 28 30 25 27 41 49 47 45
Child mortality rate
(000) 66 99 42 56 66 65 67 96 76
% of population using
improved sanitary
facilities
42 58 72 67 66 21 39 57 39
% of population using
improved water
sources
96 100 97 100 99 100 95 100 98
Source: HIES (2010) and District series of Yearbook of Agricultural Statistics 2010 (BBS)

38
Annex 2-b. Agricultural practices at study sites in Bangladesh
National Peri-urban/ advanced rural areas Marginal rural areas
Kalihati Atrai Mirzapur Avg Bauphal Bakshiganj Melandaha Avg
Irrigation 62.19 77.65 76.89 75.74 76.76 0.55 77.90 91.54 56.66
Cropping
intensity 173 193 182.22 184 186.41 181 190 195 188.67
MV
Adoption 80.23 91.81 84.39 96.82 91.00 22.32 97.85 94.87 71.68
Source: District series of Yearbook of Agricultural Statistics 2010 Note: Though differences between those peri-urban and marginal areas in terms of socio-economic and
agricultural practices exist, there are similarities among those areas in terms of prevalence of diarrhea- all areas have high diarrhea prevalence rate.

39
Annex 3. Letter treatment
……March 2015 Name and Address………………………… Dear Madam/Sir, Greetings. Probably you can recall that we took drinking water sample to test the water quality from your home during the survey conducted in August 2014. Thank you for your cooperation. Unfortunately, we found the sample of your household fecal contaminated (pathogen). But we are not very sure whether this contamination might make you sick. You may wish to take the following preventive measures:
1. You may please get your water at point of use (POU) tested again through your kid to confirm whether the water is still contaminated. The water testing kit is kept at your kids’ school and your kid is already taught about how to use it. You may also like to test the water at source of your household at second time and thirdly at point of source. You will get maximum three times to get the water sample to be tested from your kids’ school at free of cost within next 12 weeks.
2. If your drinking water is still contaminated, we recommend you to take actions that could make it clean prior to drinking. We also suggest you to maintain cleanliness regarding farm activities both at home and at farm fields. We request you to set the posters at your dwelling wall and follow the agriculture hygiene messages given at the poster-your kids are also taught about these messages at the school.
We will appreciate your cooperation to follow these guidelines to make your environment clean. With warm regards, …………………….. (Dr. Mohammad Abdul Malek) Senior Research Fellow and Co-coordinator, Agricultural Economics Unit BRAC Research and Evaluation Division (RED) BRAC Center 75 Mohakhali, Dhaka Phone: Cell: Email:

40
Annex 4. WASH-agriculture hygiene poster

41
Annex 5. Treatment implementation guidelines for Research Assistants and School Teachers
1st
Stage (7th
-12th
March, 2015)
7th
March, Send the researchers to their designated sub-districts and speak to the sub-district WASH
program officers regarding the next day’s preparations and content of the training.
8th
March: Training on water quality testing for bacteria in water and awareness and knowledge through
poster to be given to the school teachers in charge of the student brigades in schools which are covered
by the WASH offices and to 3-4 WASH program POs in the designated sub-districts.
At the same time, the teachers will be notified to choose 8 student brigades from their respective
schools and inform them about the procedures as well. During the training day, the teachers will be
given the materials for water testing, list of students, letter to the parents of the respective chosen
students, register copies, sample bottles, vial, marker, poster and a sheet of paper where names of
respective teachers, their mobile number and signature will be included.
9th
March: The teachers will make the selected student brigades aware of the water testing and poster
and inform them to bring water from their households in the supplied sample collection bottle the next
day. For collection of water they should be told with emphasis that “Water should be brought from the
point of use (Pitcher/Jug) from which they drink water.” It should be stated that after the student
brigades hand over their bottles to the teachers, the teachers should mark each bottle with their
individual household ID number. Side by side the student brigades will be explained about the letter to
their parents and the poster. By paying visits to a few schools, it will be observed if the designated
teachers are explaining properly to the selected student brigades regarding the required procedure.
10th
March: The student brigades will hand over their bottles to their designated teachers to test
bacteria in water. The teachers will mark each bottle with the respective household ID number and then
using the vial will proceed with the water testing for each household. Water will be kept in the vial for
48 hours for testing purpose. For safety purpose it is wise to keep the vials with the head teacher of
each respective school. The researchers will visit the schools for some time.

42
2nd
Stage: (11th
-13th
April, 2015)
The respective teachers will wash and properly clean the bottles with soap/detergent and inform the students
to bring water from the point of source of their drinking water (tube-well/pipe). The water quality testing
should be completed by 13th
April as per the steps of stage 1 and the results should be recorded in the
registered copy.
3rd
Stage: (11th
-13th
May, 2015)
The students will bring water from point of use (Pitcher/Jug) of their drinking water and test properly just like
before and by 13th
May 2015 complete the whole procedure of water quality testing.
The register copies will be collected by the end of the 3rd
stage water quality testing.
With regards to any query please contact Ikhtiar Mohammad, Staff Researcher, at the mobile number
01670211214.
11th
March: The research assistants of each designated sub-districts will go around school to school for observation
purpose with the support of the WASH officers. They will observe if the schools are storing the water appropriately
and also notice if there has been any change in the color of the water. With the view to make the water quality
testing for bacteria in water successful, 48 hours must be given to avail appropriate results.
12th
March: After completion of 48 hours, the research assistants should visit the designated schools of the
respective sub-districts again and observe and assert the change in color of the water in the vial. At the same time
attention must be given to the teachers in keeping record of the change in the color of the water in their register
copy.

43
Annex 6-a. Balance checking of Baseline characteristics (Control Variables)
Baseline Characteristics
(1) (2) (3) (4) (5) (6) (7) (8)
Control Mean
(SD)
WASH-agriculture Treatment
BRAC WASH Treatment
F-test Sample Size (N) Mean
(SD) Diff
(P-value) Mean (SD)
Diff (P-value)
F-stat P-value
Household Head Characteristics
Male 0.94
(0.24) 0.93
(0.26) 0.01 (1)
0.97 (0.17)
-0.03 (0.68)
1.73 0.18 648
Years of Schooling 5.48
(7.49) 5.41
(7.26) 0.07 (1)
5.38 (7.18)
0.10 (1)
0.91 0.40 648
Household Characteristics
Expenditure in last one month (BDT)
95,565 (48,342.72)
83,942.06 (51,895.55)
11,622.9 (0.21)
93,316.16 (80,163.09)
2,248.84 (1)
2.34 0.10 648
Household Distance from School (Km)
0.79 (0.54)
1.15 (1.08)
-0.35 (0.001)
0.92 (0.73)
-0.13 (0.62)
8.31 0.0003 648
Household family size 5.81
(2.01) 5.34
(1.96) 0.47
(0.07) 5.74
(2.06) 0.07 (1)
3.81 0.02 648
Number of Children under five years of age
0.6 (0.63)
0.42 (0.62)
0.17 (0.03)
0.57 (0.64)
0.03 (1)
0.40 0.67 228
Farm Size (decimal) 98.99
(75.93) 137.87
(152.10) -38.88 (0.15)
142.25 (189.79)
-43.26 (0.14)
2.39 0.09 435
School Characteristics
Drinking water purification facility in the school
0 (0)
0.07 (0.26)
-0.07 (1)
0.17 (0.38)
-0.17 (0.27)
1.60 0.21 66
Separate latrines for
men and women 1
(0) 0.96
(0.19) 0.04 (1)
0.96 (0.20)
0.04 (1)
0.27 0.76 66
Student Characteristics
Students perceived their health as “very good”
0.86 (0.36)
0.96 (0.19)
-0.11 (0.35)
1 (0)
-0.14 (0.13)
0.88 0.42 648
Math Score of
Students - Term
3/Final (2014) in GPA
3.27 (1.26)
3.6 (1.18)
-0.33 (0.03)
4.03 (0.88)
-0.76 (0.00)
14.55 0.00 648
Weather Characteristics
Average temperature (Degree Celsius)
18.4 (0.34)
18.68 (1.00)
-0.28 (0.01)
18.68 (1.00)
-0.28 (0.02)
4.8 0.01 648
Average Rainfall (Millimeter)
0.24 (0.24)
0.27 (0.20)
-0.03 (0.45)
0.27 (0.20)
-0.03 (0.53)
1.18 0.31 648
Location Characteristics
Latitude (degree decimal)
24.57 (0.45)
24.19 (1.12)
0.38 (0.001)
24.16 (1.03)
0.41 (0.001)
7.90 0.00 648
longitude (degree decimal)
89.94 (0.14)
89.82 (0.57)
0.11 (1)
89.68 (2.23)
0.25 (0.25)
1.57 0.21 648
Household exposure
with other WASH
program
0.21 (0.41)
0.07 (0.26)
0.14 (0)
0.08 (0.27)
0.13 (0)
21.54 0.00 1296

44
Annex 6-b. Balance checking of Baseline characteristics (Outcome Variables)
Baseline Outcome Variables
(1) (2) (3) (4) (5) (6) (7) (8)
Control Mean
(SD)
WASH-agriculture Treatment
BRAC WASH Treatment
F-test Sample Size (N) Mean
(SD) Diff
(P-value) Mean (SD)
Diff (P-value)
F-stat P-value
Presence of Fecal Coliform Bacteria
1 (0)
1 (0)
0 (.)
1 (0)
0 (.)
. . 648
Water, Sanitation and Hygiene Behavior
Carrying safe drinking water in a covered clean jar/bottle to the crop field
0.34 (0.48)
0.38 (0.49)
-0.04 (1)
0.44 (0.50)
-0.10 (0.23)
10.48 0.23 596
Treating water by current standard practices and preserve treated water
0.22 (0.41)
0.19 (0.39)
0.02 (1)
0.24 (0.43)
-0.02 (1)
0.62 0.54 641
Stocking Drinking Water in the House
1 (0)
1 (0)
0 (.)
1 (0)
0 (.)
0 . 641
Protecting drinking water and food from wastes/latrine
0.71 (0.46)
0.65 (0.48)
0.06 (0.69)
0.76 (0.43)
-0.05 (1)
30.28 0.04 631
Using hygienic latrine
0.71 (0.45)
0.74 (0.44)
-0.03 (1)
0.81 (0.39)
-0.10 (0.15)
20.25 0.11 641
Washing hands with soap/detergent after farming , handling animals/wastes and defecation
0.71 (0.45)
0.71 (0.45)
0.00 (1)
0.69 (0.46)
0.02 (1)
0.36 0.70 622
Washing hands with soap/detergent before cooking and eating
0.88 (0.33)
0.65 (0.48)
0.23 (0)
0.62 (0.49)
0.26 (0)
50.47 0.004 641
Diarrhea Prevalence
All Households 0.02
(0.13) 0.02
(0.15) -0.01
(1) 0.01
(0.07) 0.01 (1)
10.30 0.22 610
Adult Households 0
(0) 0
(0) 0
(1) 0.03
(0.18) -0.03
(1) 0.70 0.50 77
Students 0.02
(0.13) 0.02
(0.15) -0.01
(1) 0.01
(0.07) 0.01 (1)
10.30 0.27 609
Children of less than five years of age
0 (0)
0 (0)
0 (.)
0 (0)
0 (.)
. . 15
Treated water to make it safer to drink
0.02 (0.15)
0.03 (0.17)
-0.01 (1)
0.03 (0.17)
-0.01 (1)
0.38 0.68 641
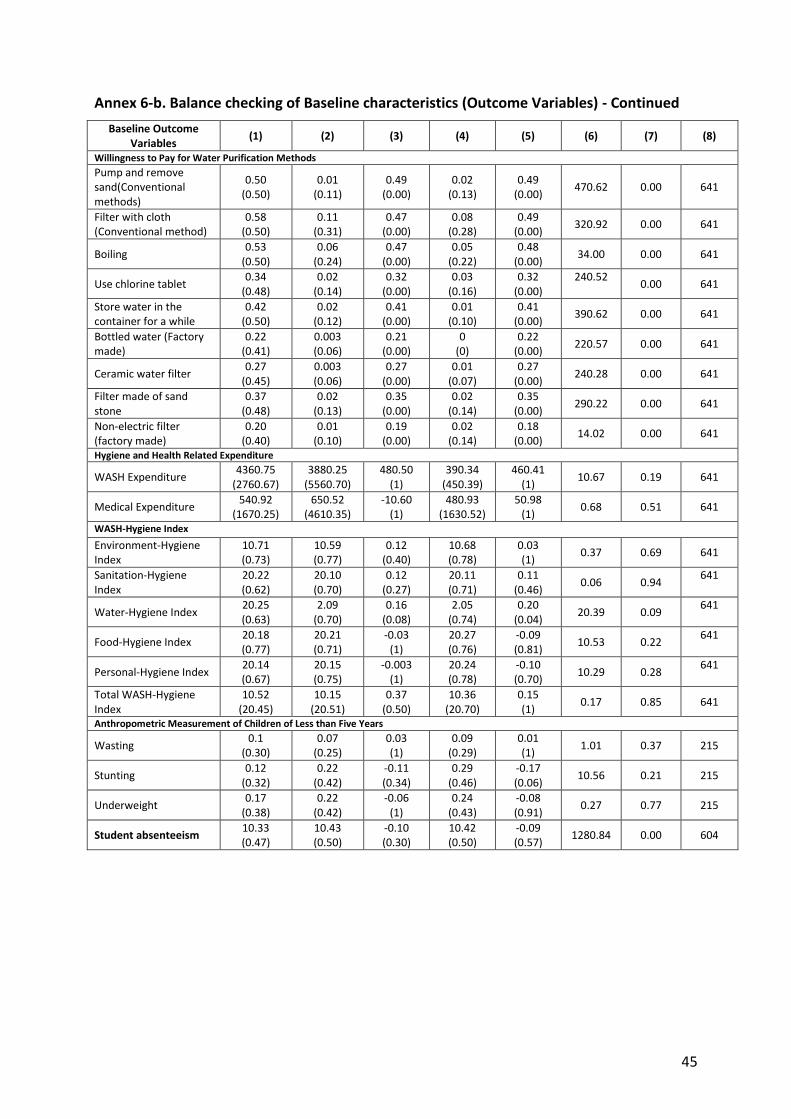
45
Annex 6-b. Balance checking of Baseline characteristics (Outcome Variables) - Continued
Baseline Outcome Variables
(1) (2) (3) (4) (5) (6) (7) (8)
Willingness to Pay for Water Purification Methods
Pump and remove sand(Conventional methods)
0.50 (0.50)
0.01 (0.11)
0.49 (0.00)
0.02 (0.13)
0.49 (0.00)
470.62 0.00 641
Filter with cloth (Conventional method)
0.58 (0.50)
0.11 (0.31)
0.47 (0.00)
0.08 (0.28)
0.49 (0.00)
320.92 0.00 641
Boiling 0.53
(0.50) 0.06
(0.24) 0.47
(0.00) 0.05
(0.22) 0.48
(0.00) 34.00 0.00 641
Use chlorine tablet 0.34
(0.48) 0.02
(0.14) 0.32
(0.00) 0.03
(0.16) 0.32
(0.00) 240.52
0.00 641
Store water in the container for a while
0.42 (0.50)
0.02 (0.12)
0.41 (0.00)
0.01 (0.10)
0.41 (0.00)
390.62 0.00 641
Bottled water (Factory made)
0.22 (0.41)
0.003 (0.06)
0.21 (0.00)
0 (0)
0.22 (0.00)
220.57 0.00 641
Ceramic water filter 0.27
(0.45) 0.003 (0.06)
0.27 (0.00)
0.01 (0.07)
0.27 (0.00)
240.28 0.00 641
Filter made of sand stone
0.37 (0.48)
0.02 (0.13)
0.35 (0.00)
0.02 (0.14)
0.35 (0.00)
290.22 0.00 641
Non-electric filter (factory made)
0.20 (0.40)
0.01 (0.10)
0.19 (0.00)
0.02 (0.14)
0.18 (0.00)
14.02 0.00 641
Hygiene and Health Related Expenditure
WASH Expenditure 4360.75
(2760.67) 3880.25
(5560.70) 480.50
(1) 390.34
(450.39) 460.41
(1) 10.67 0.19 641
Medical Expenditure 540.92
(1670.25) 650.52
(4610.35) -10.60
(1) 480.93
(1630.52) 50.98
(1) 0.68 0.51 641
WASH-Hygiene Index
Environment-Hygiene Index
10.71 (0.73)
10.59 (0.77)
0.12 (0.40)
10.68 (0.78)
0.03 (1)
0.37 0.69 641
Sanitation-Hygiene Index
20.22 (0.62)
20.10 (0.70)
0.12 (0.27)
20.11 (0.71)
0.11 (0.46)
0.06 0.94 641
Water-Hygiene Index 20.25 (0.63)
2.09 (0.70)
0.16 (0.08)
2.05 (0.74)
0.20 (0.04)
20.39 0.09 641
Food-Hygiene Index 20.18 (0.77)
20.21 (0.71)
-0.03 (1)
20.27 (0.76)
-0.09 (0.81)
10.53 0.22 641
Personal-Hygiene Index 20.14 (0.67)
20.15 (0.75)
-0.003 (1)
20.24 (0.78)
-0.10 (0.70)
10.29 0.28 641
Total WASH-Hygiene Index
10.52 (20.45)
10.15 (20.51)
0.37 (0.50)
10.36 (20.70)
0.15 (1)
0.17 0.85 641
Anthropometric Measurement of Children of Less than Five Years
Wasting 0.1
(0.30) 0.07
(0.25) 0.03 (1)
0.09 (0.29)
0.01 (1)
1.01 0.37 215
Stunting 0.12
(0.32) 0.22
(0.42) -0.11 (0.34)
0.29 (0.46)
-0.17 (0.06)
10.56 0.21 215
Underweight 0.17
(0.38) 0.22
(0.42) -0.06
(1) 0.24
(0.43) -0.08 (0.91)
0.27 0.77 215
Student absenteeism 10.33 (0.47)
10.43 (0.50)
-0.10 (0.30)
10.42 (0.50)
-0.09 (0.57)
1280.84 0.00 604