can energy democracy energize the "good life" in nebraska?
TRANSCRIPT

T H E C O M I N G O F E N E R G Y D E M O C R A C Y
E N E R G I Z I N G ‘ T H E G O O D L I F E ’
John Farrell Director of Democratic EnergyNovember 21, 2015
Presentation to Nebraska Sierra Club

A L I T T L E H I S T O R Y
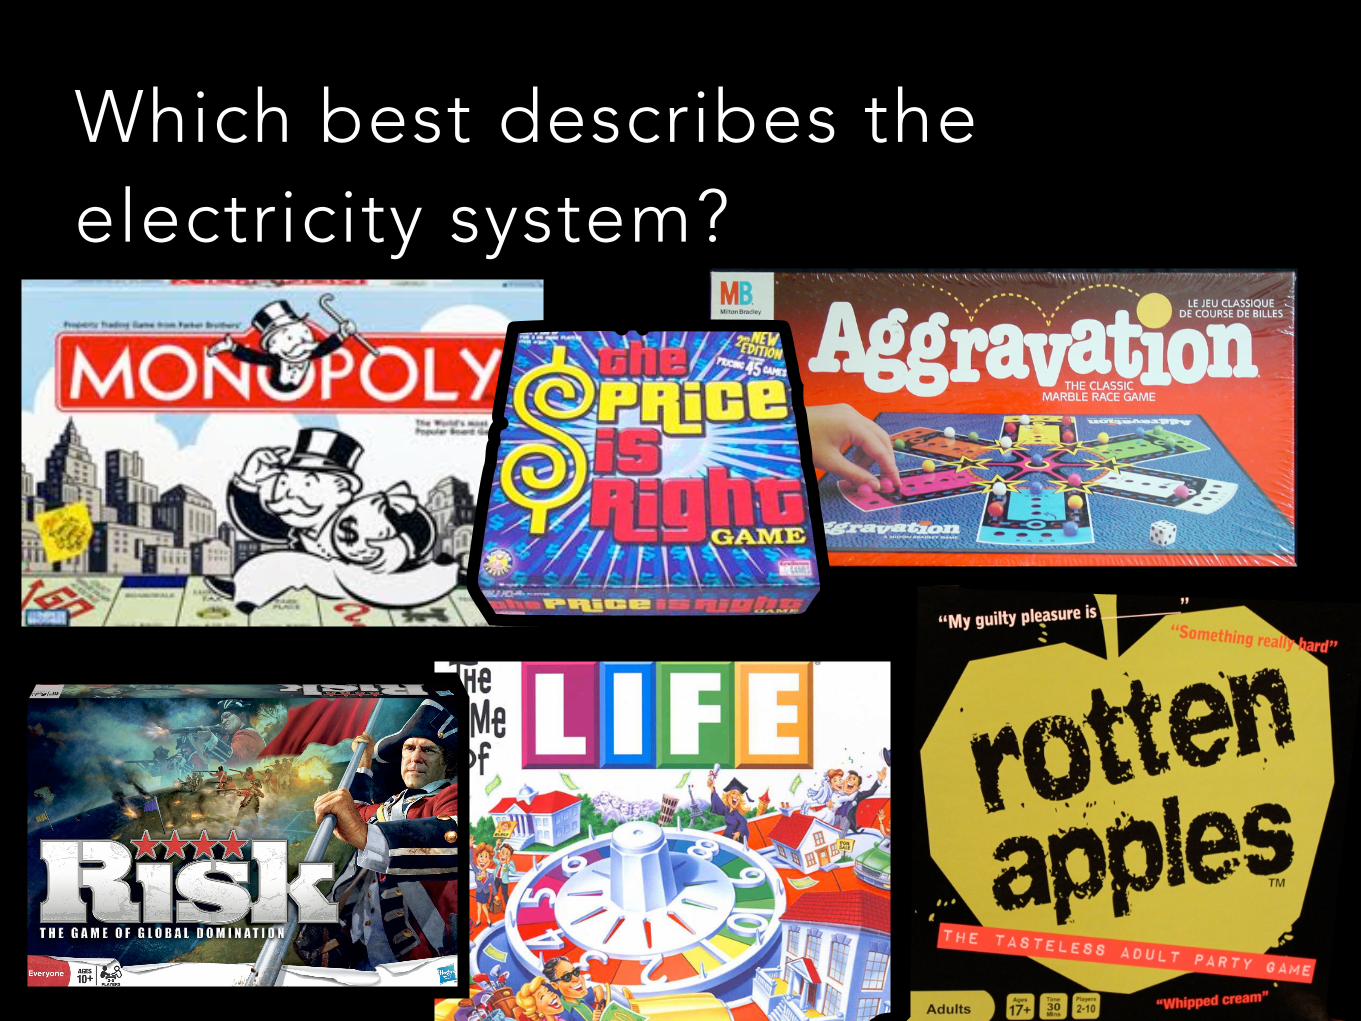
Which best describes the electricity system?
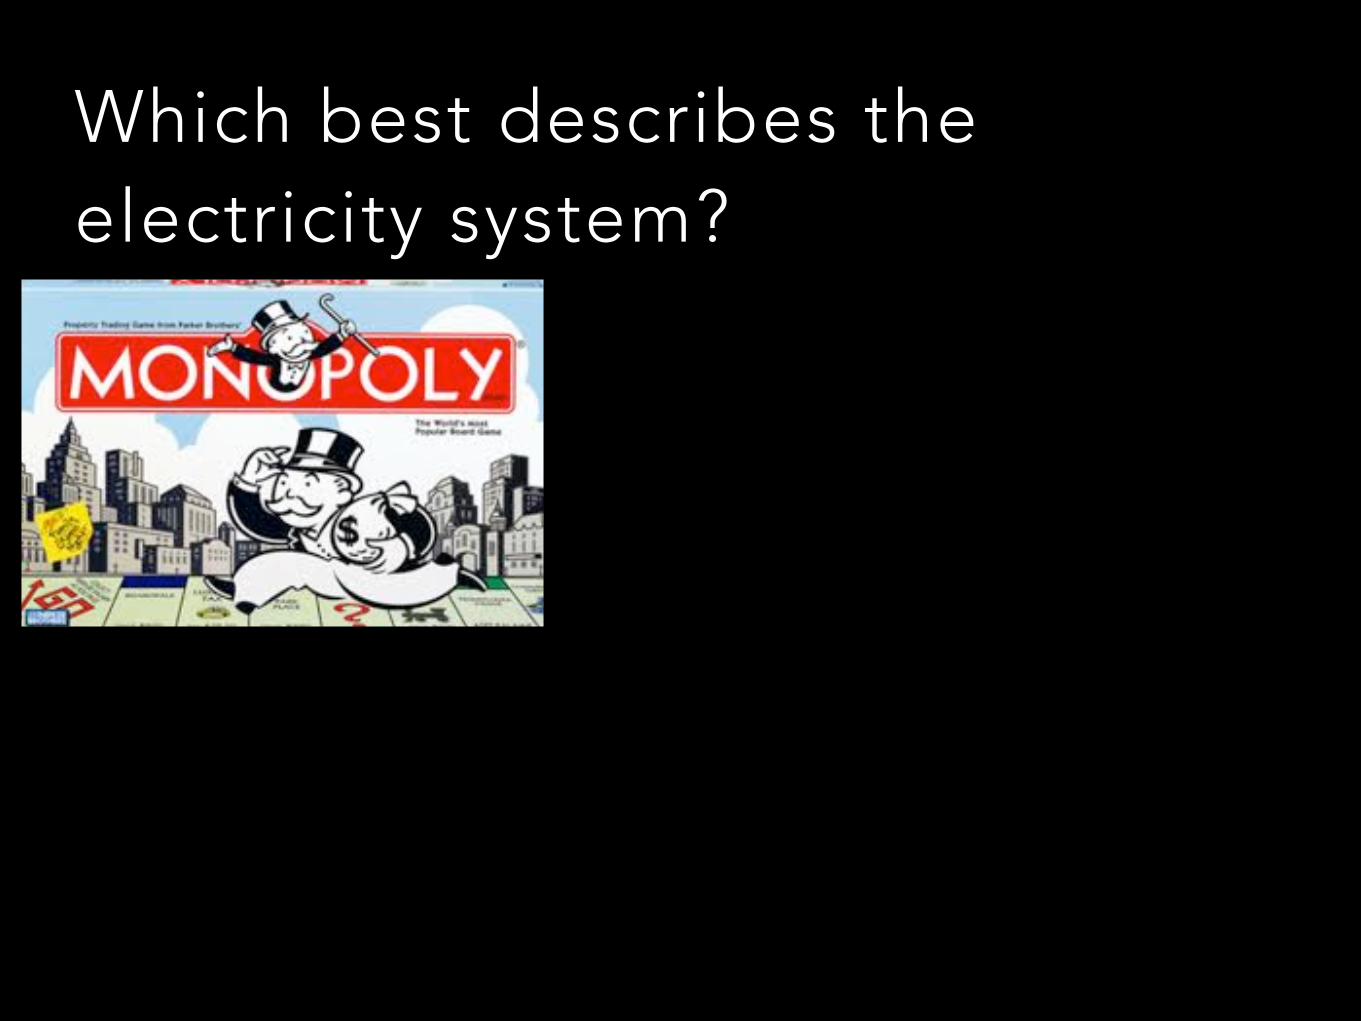
Which best describes the electricity system?

Centralized Power
House
Commercial building
Factory
Transmission network
Distribution network
T I M E S , T H E Y A R E A C H A N G I N G
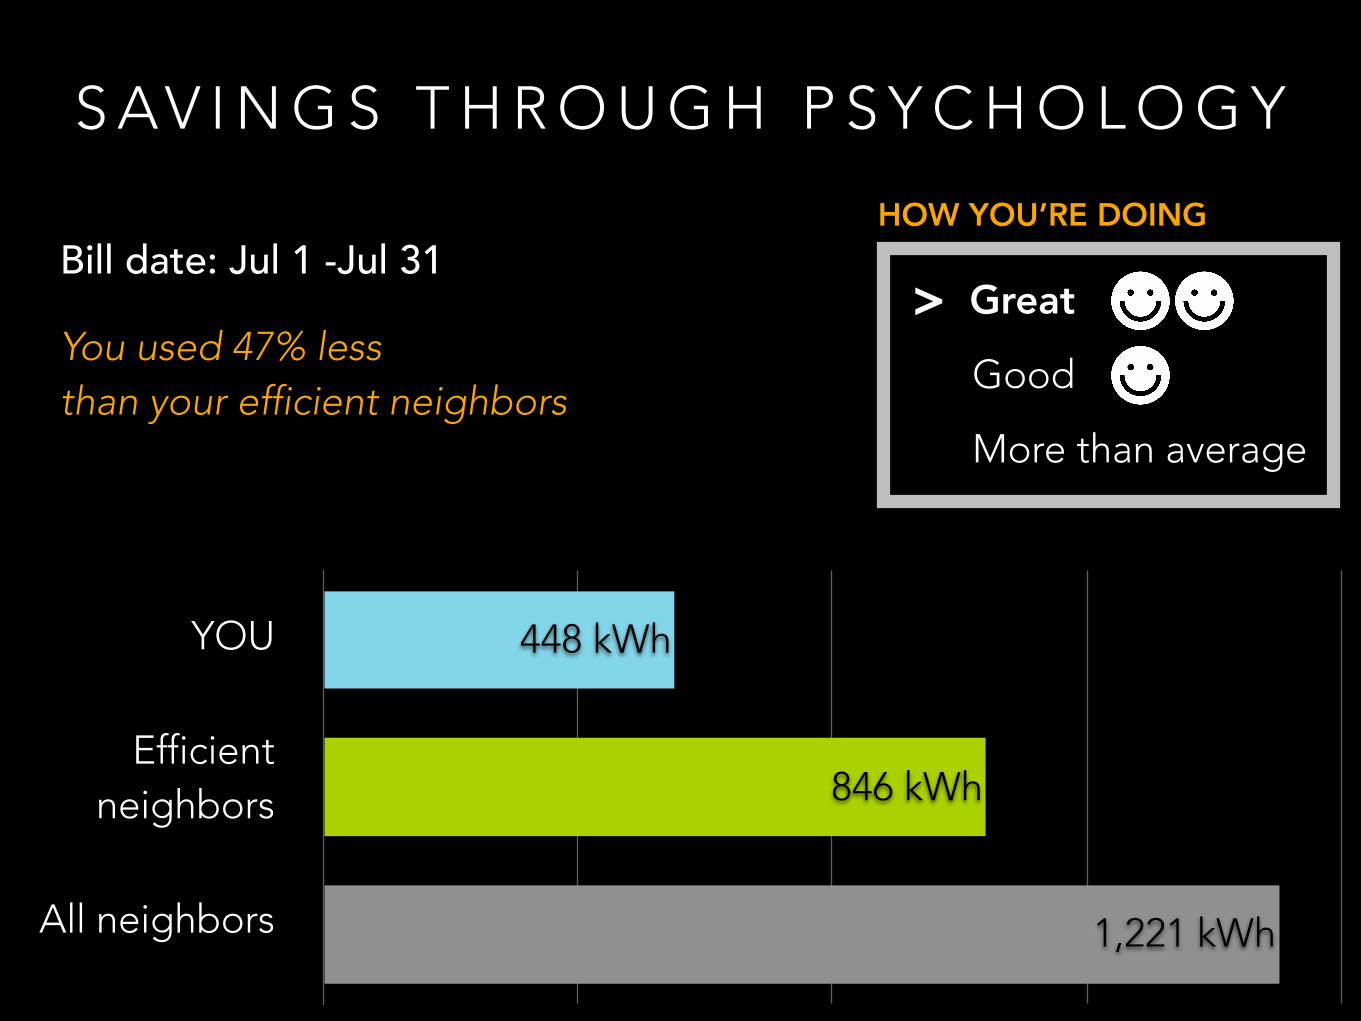
S AV I N G S T H R O U G H P S Y C H O L O G Y
1,221 kWh
846 kWh
448 kWh
Efficient neighbors
All neighbors
YOU
Bill date: Jul 1 -Jul 31Great
Good
More than average
>You used 47% less than your efficient neighbors
HOW YOU’RE DOING

S AV I N G S T H R O U G H P S Y C H O L O G Y
1,221 kWh
846 kWh
448 kWh
Efficient neighbors
All neighbors
YOU
Bill date: Jul 1 -Jul 31Great
Good
More than average
>You used 47% less than your efficient neighbors
HOW YOU’RE DOING
1-3% savings

D E M A N D M A N A G E M E N T
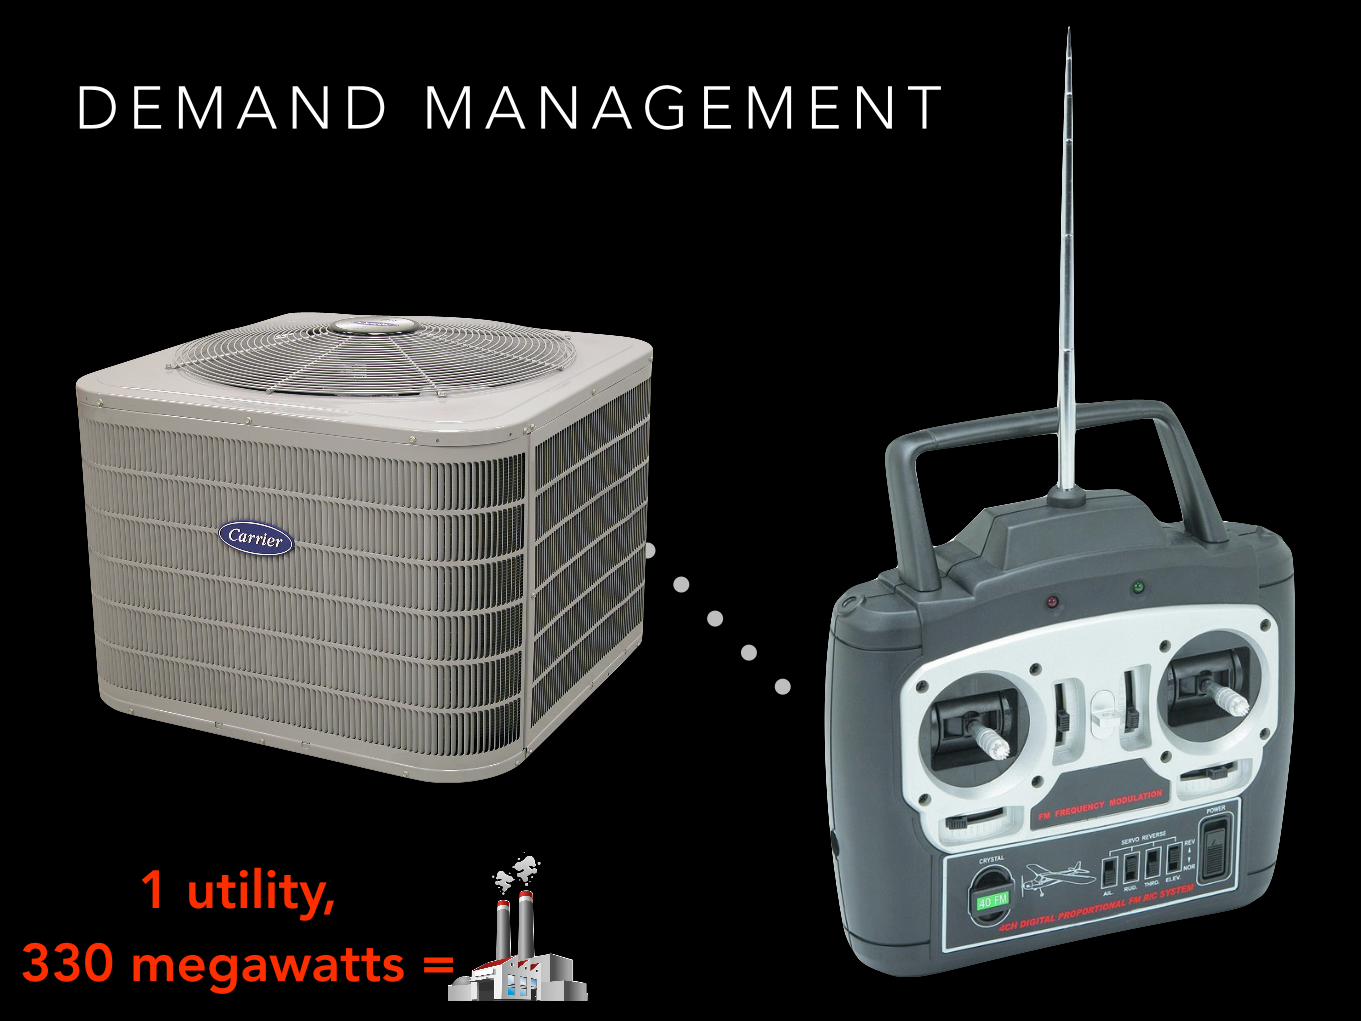
D E M A N D M A N A G E M E N T
1 utility, 330 megawatts =

S M A R T C O N T R O L

S M A R T C O N T R O L
10-12% savings on heating and 15% savings on cooling
E N E R G Y S T O R A G E ( S O O N )

When did electricity sales peak nationwide?• 2013
• 2010
• 2007
• 2005
• earlier

3.2
3.3
3.4
3.5
3.6
3.7
3.8
2000 2001 2002 2003 2004 2005 2006 2007 2008 2009 2010 2011 2012 2013 2014
P E A K
S TA G N A N T R E TA I L S A L E S
trillion kilowatt-hours

What is the last year fossil fuel provided > 60% of new power plant capacity?
• 2013
• 2010
• 2007
• 2005
• earlier

Perc
ent o
f new
cap
acity
0%
20%
40%
60%
80%
100%
Fossil fuel Renewable
Gig
awat
ts a
dd
ed (w
hite
line
)
0
10
20
30
40
50
2003 2005 2007 2009 2011 2013 2015Q2
R I S I N G R E N E W A B L E E N E R G Y S H A R E
June 10, 2015
of new power plant capacity

Perc
ent o
f new
cap
acity
0%
20%
40%
60%
80%
100%
Coal Gas Wind Small Solar Big Solar
Gig
awat
ts a
dd
ed (w
hite
line
)
0
10
20
30
40
50
2003 2005 2007 2009 2011 2013 2015Q2
SUBSTANTIAL GROWTH OF DISTRIBUTED SOLAR
44%
26%
18%
12%
June 10, 2015
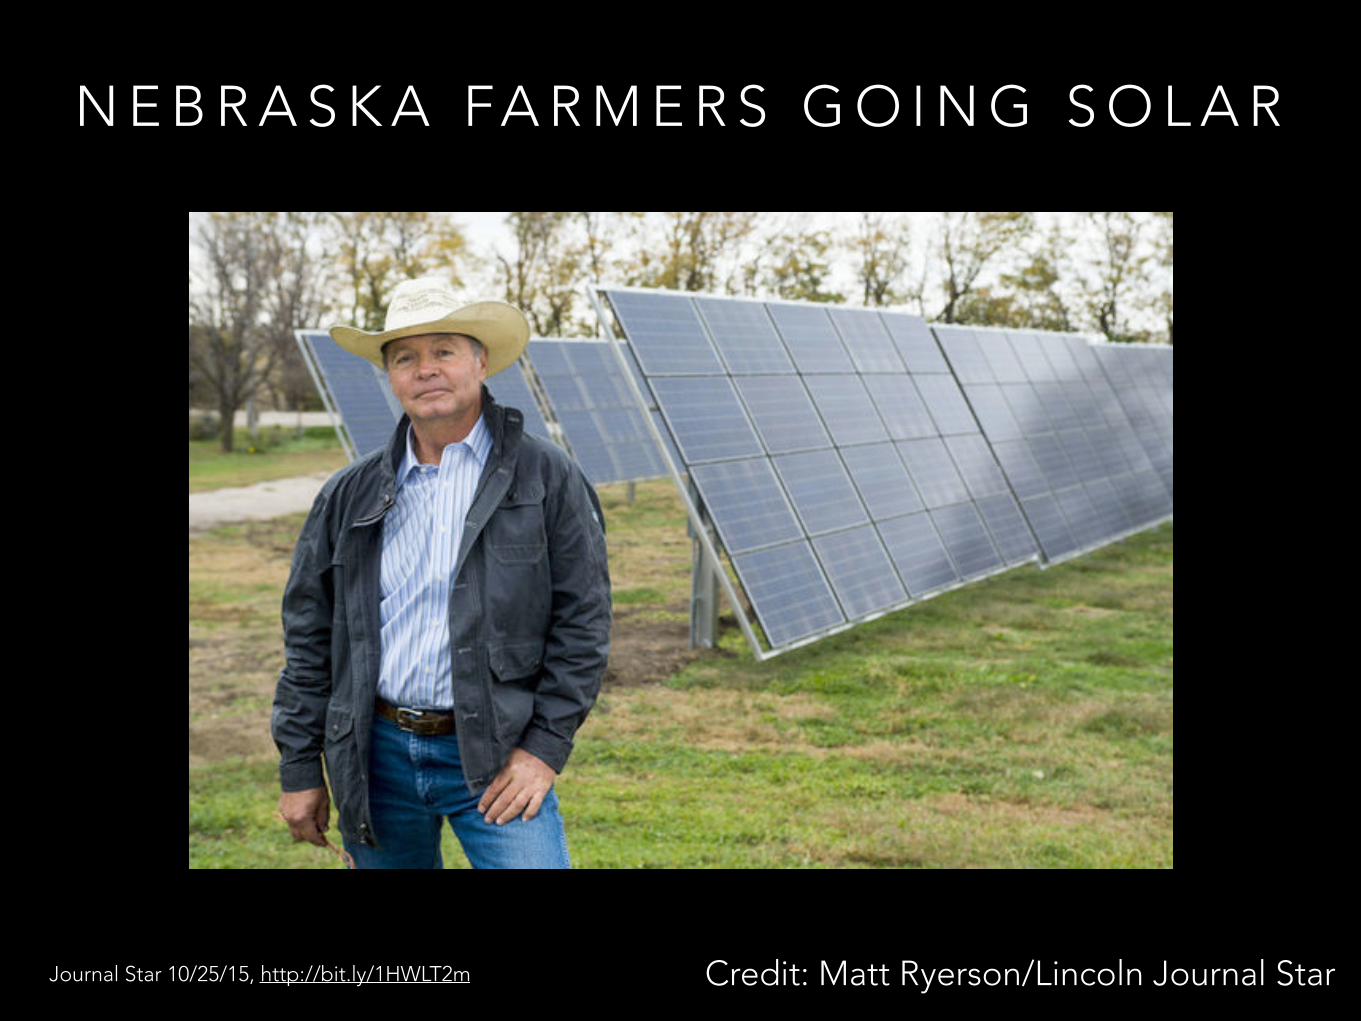
N E B R A S K A FA R M E R S G O I N G S O L A R
Credit: Matt Ryerson/Lincoln Journal StarJournal Star 10/25/15, http://bit.ly/1HWLT2m
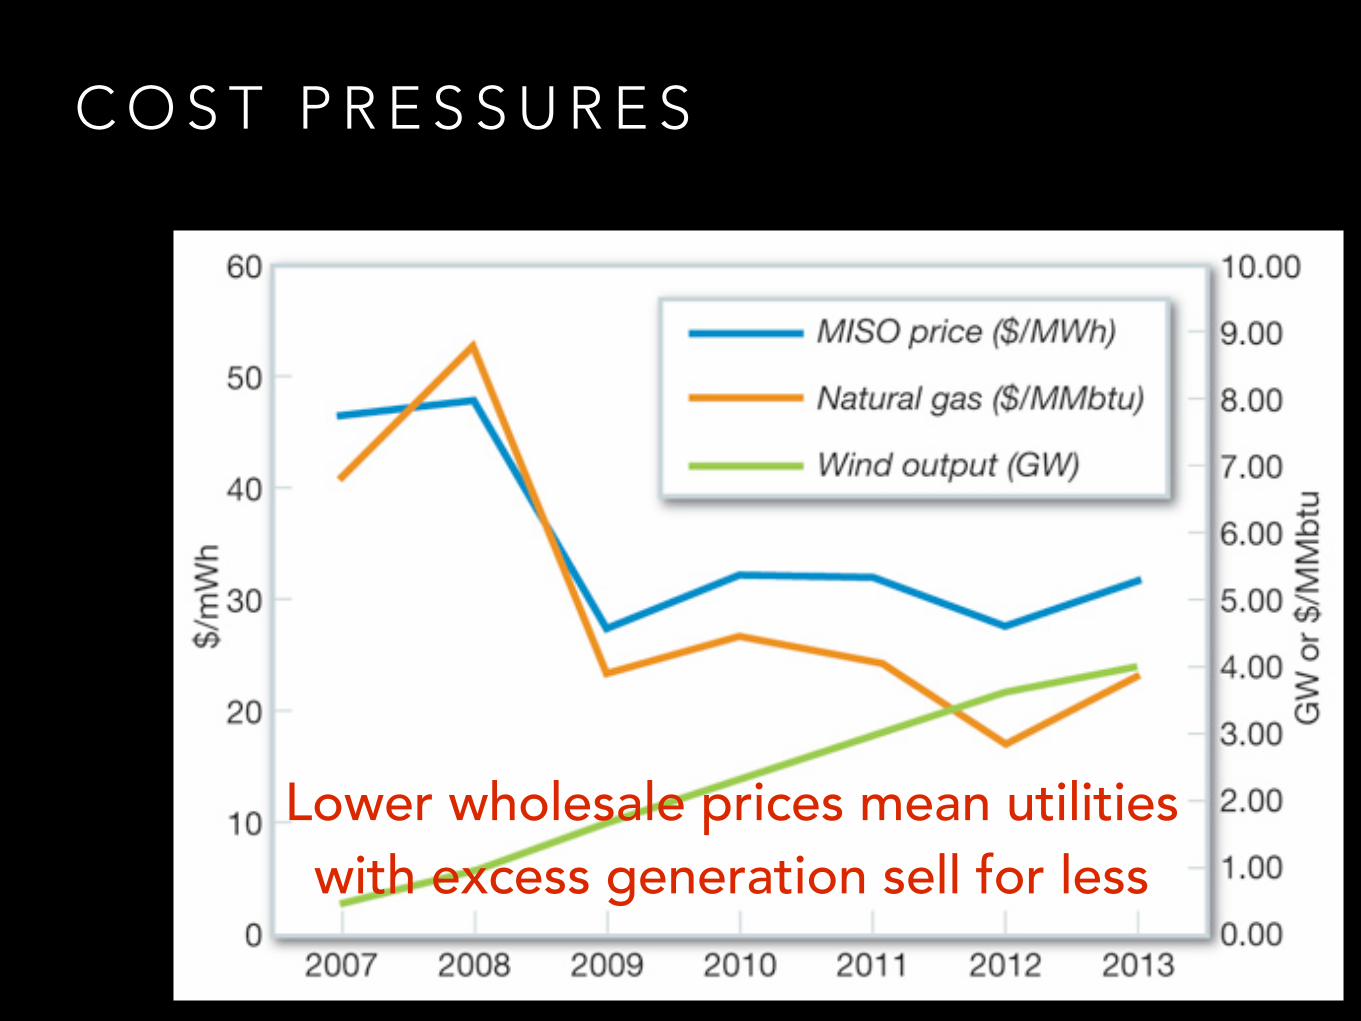
C O S T P R E S S U R E S
Lower wholesale prices mean utilities with excess generation sell for less
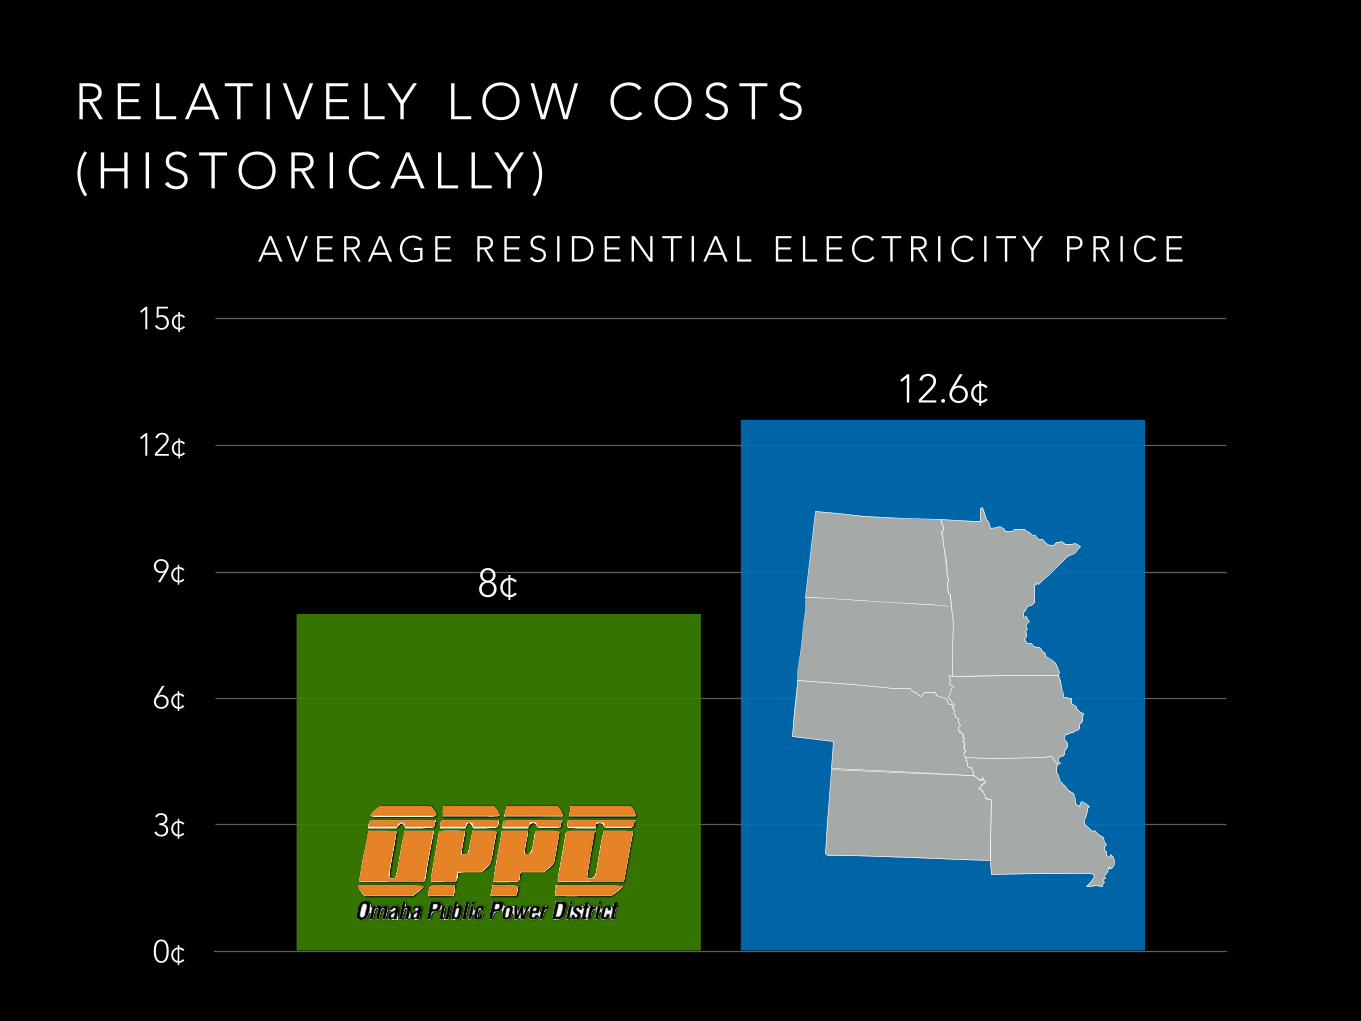
AV E R A G E R E S I D E N T I A L E L E C T R I C I T Y P R I C E
0¢
3¢
6¢
9¢
12¢
15¢
12.6¢
8¢
R E L AT I V E LY L O W C O S T S ( H I S T O R I C A L LY )

At a high environmental
cost

Centralized PowerYesterday Tomorrow
Local CHP plant
Storage
House with geothermal
Clean, local power
2015
House
Commercial building
Factory
Transmission network
Distribution network

F O R W A R D O R B A C K W A R D ?
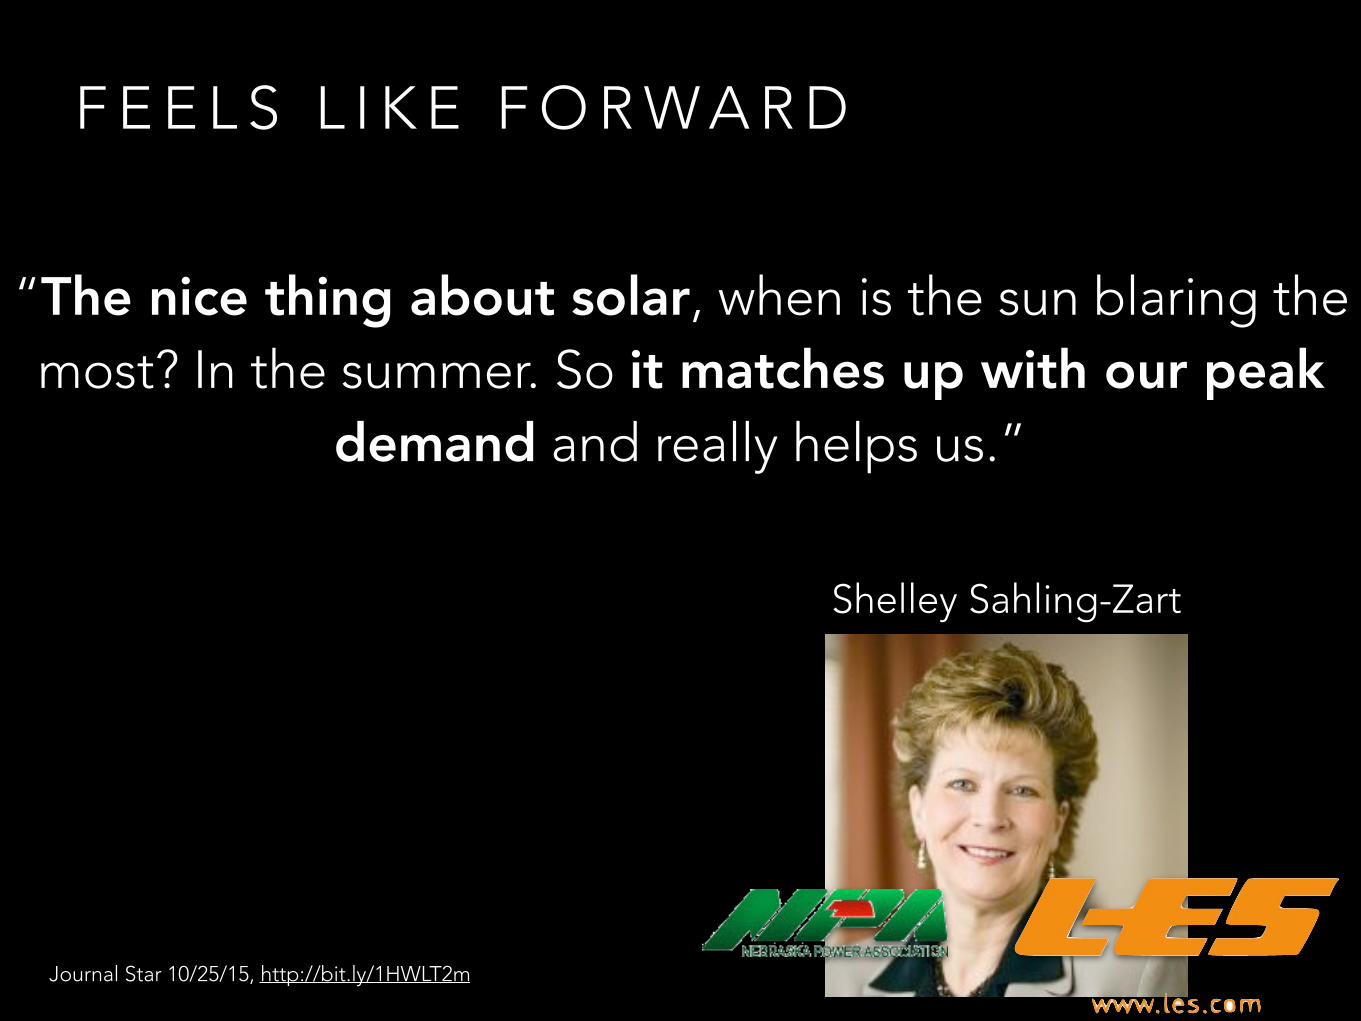
F E E L S L I K E F O R W A R D
“The nice thing about solar, when is the sun blaring the most? In the summer. So it matches up with our peak
demand and really helps us.”
Shelley Sahling-Zart
Journal Star 10/25/15, http://bit.ly/1HWLT2m

F E E L S L I K E F O R W A R D
“The nice thing about solar, when is the sun blaring the most? In the summer. So it matches up with our peak
demand and really helps us.”
Shelley Sahling-Zart
“we’re a long ways from [the 1% net metering limit]”
Journal Star 10/25/15, http://bit.ly/1HWLT2m
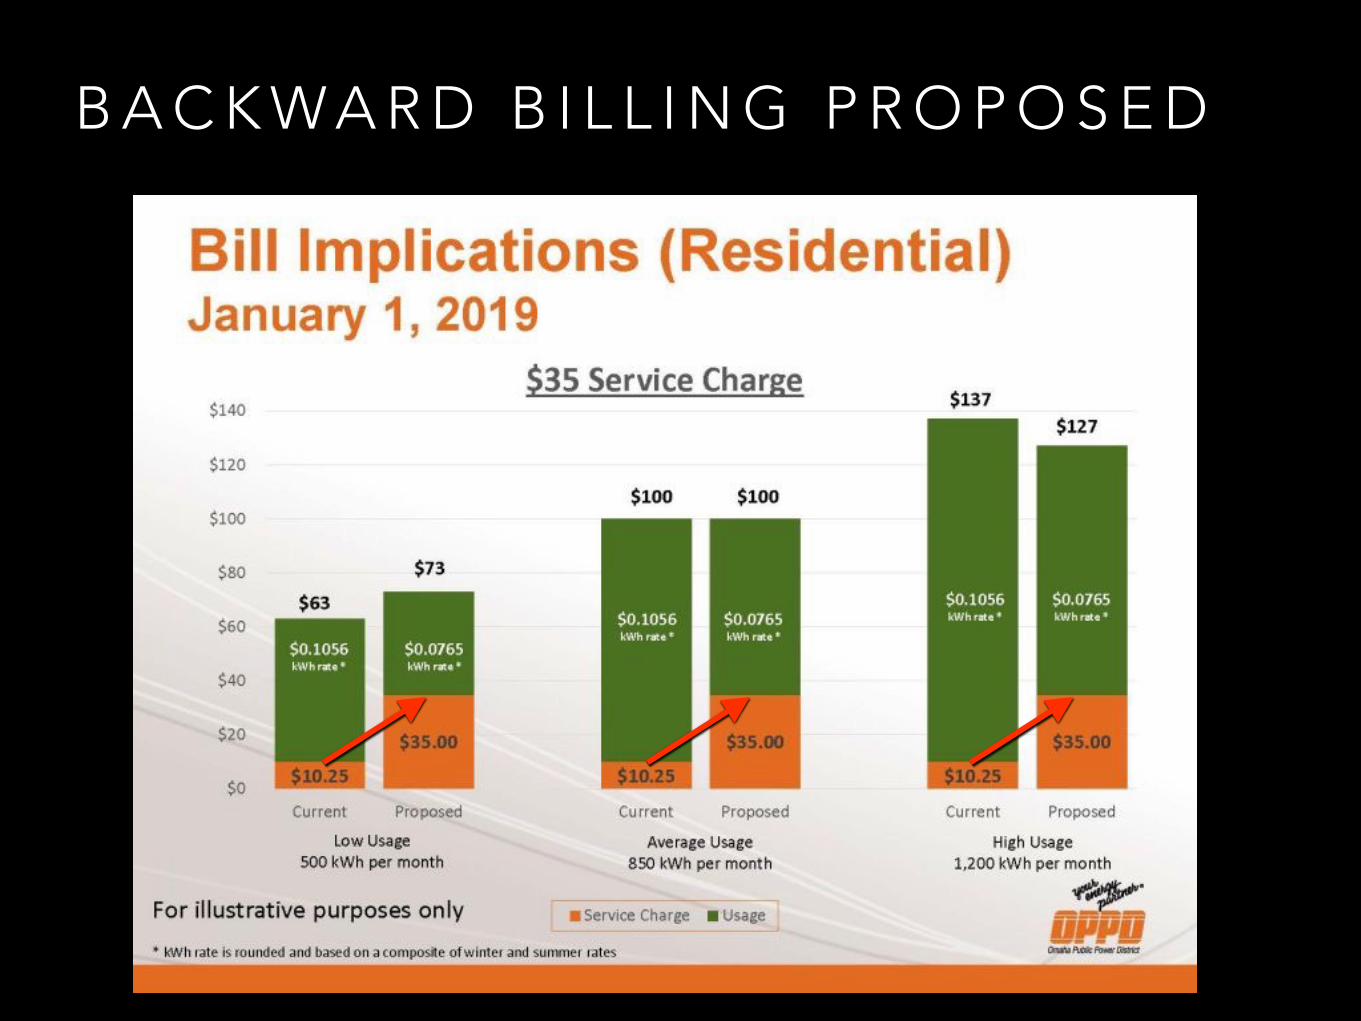
B A C K W A R D B I L L I N G P R O P O S E D

B A C K W A R D B I L L I N G P R O P O S E D
F R U G A L U S E R S PAY M O R E
B I G U S E R S PAY L E S S
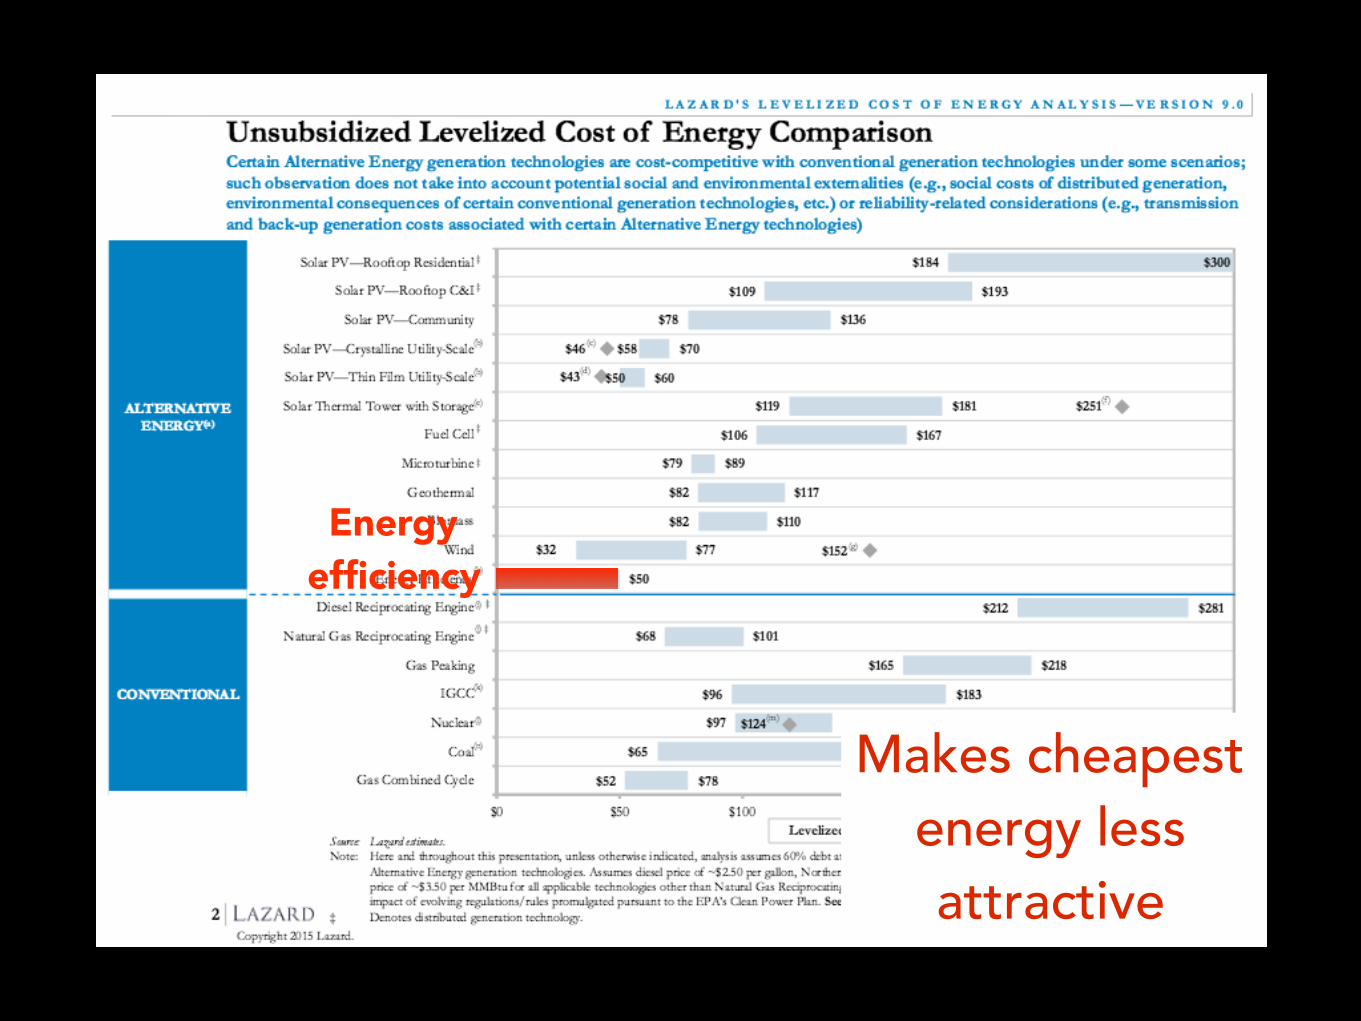
Energy efficiency
Makes cheapest energy less attractive
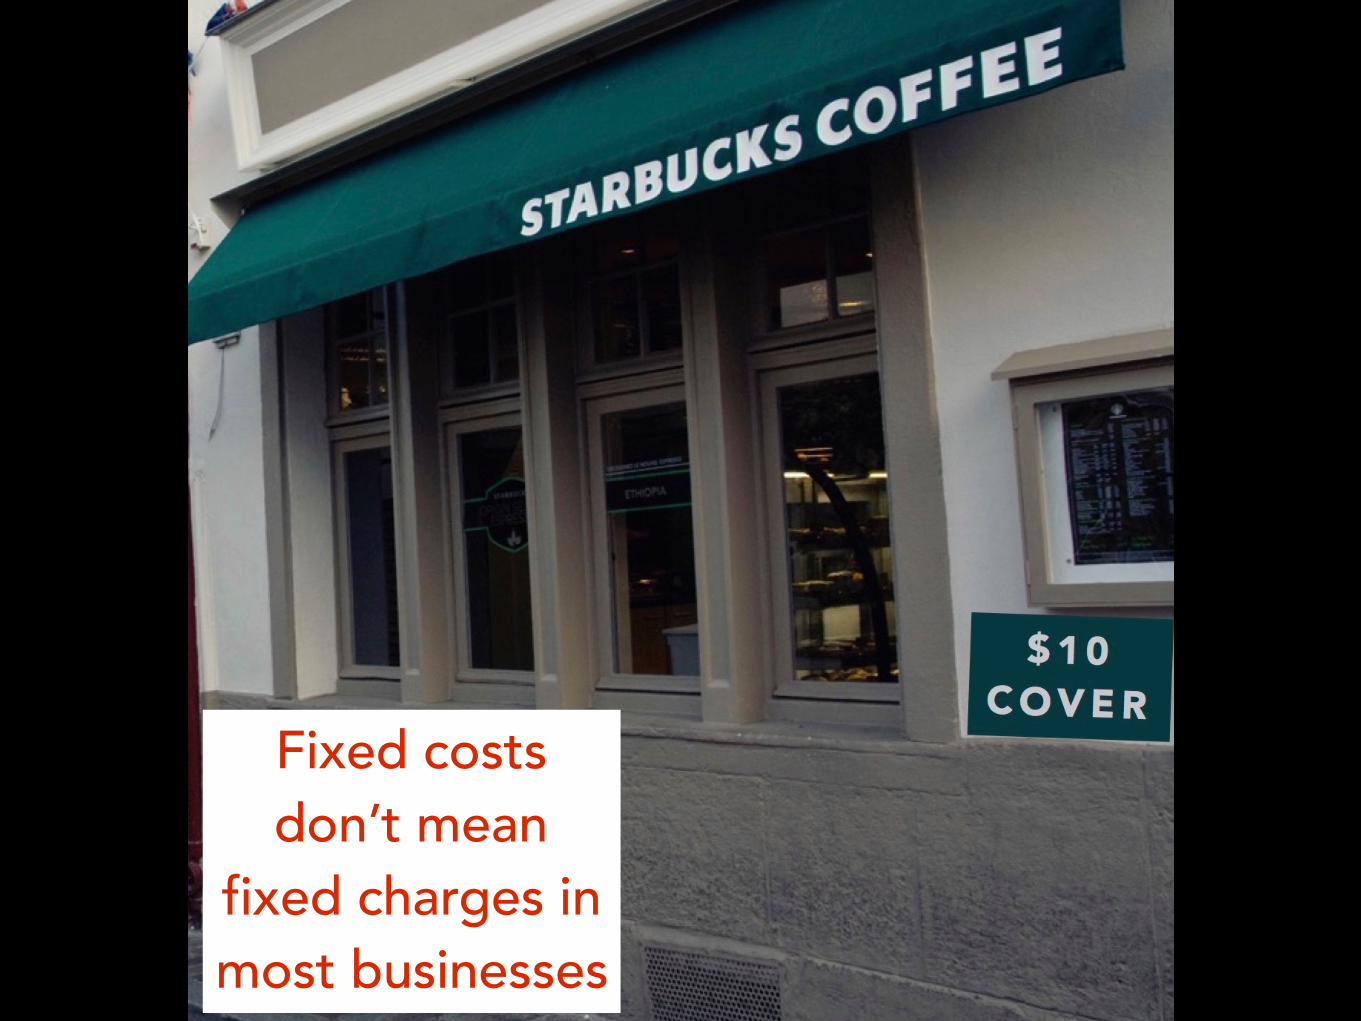
Fixed costs don’t mean
fixed charges in most businesses
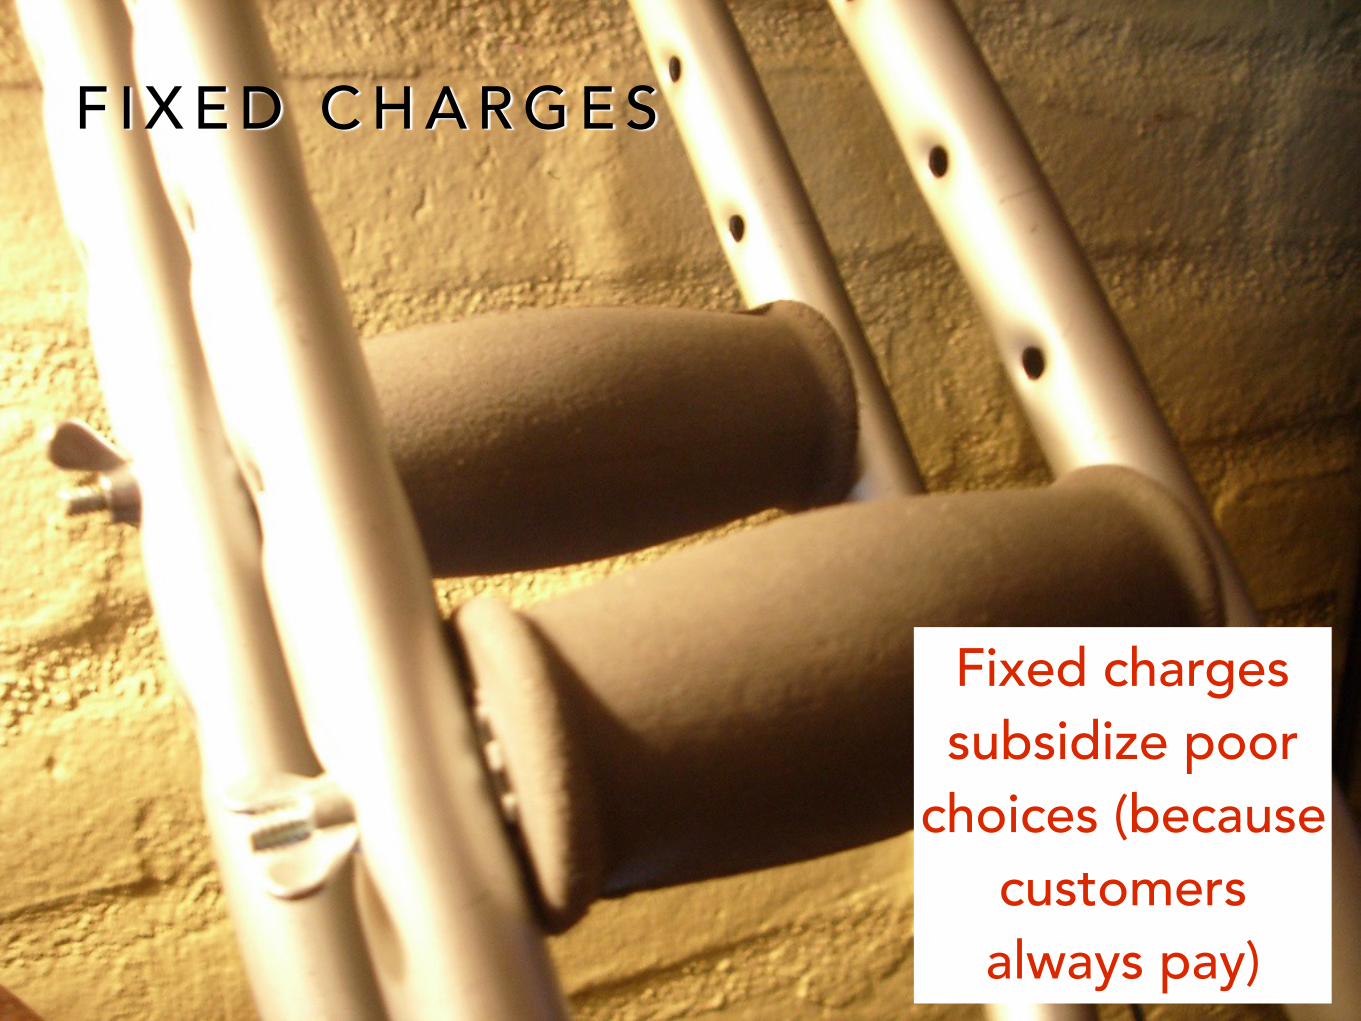
F I X E D C H A R G E S
Fixed charges subsidize poor
choices (because customers always pay)

Fixed charges slay solar

N E B R A S K A I S N O T A L O N ESTATES FACING CHALLENGES TO DISTRIBUTED POWER
Sources: Renewable Energy World, Greentech Media, IREC, Vote Solar and many more
10/21/15http://bit.ly/DG-UnderFireMapData-ILSR

W H AT ’ S P O S S I B L E ?

H O W M A N Y S TAT E S C A N G E T 1 0 0 % O R M O R E O F T H E I R E L E C T R I C I T Y L O C A L LY ?
• 8
• 15
• 30
• 42
• all of them

S TAT E C L E A N E N E R G Y P O T E N T I A L
Source: Energy Self-Reliant States, 2nd Edition
100% or more 75 to 100%
50 to 75% 25 to 50% 25% or less
Potential percent of
power from local renewables
30 states!

Residential and Commercial roofs
L O C A L S O L A R P O T E N T I A L
50% or more 25 to 50% 10 to 25%
25-50%
50%+
15-25%
P O T E N T I A L P E R C E N T O F P O W E R F R O M L O C A L R O O F T O P
S O L A R

8500
590
750
30,000
16,000
7200
11,000
1800
990
360012,000
780
7000
8200
510011,000
190026,0002400
7300
5100
360
26001100
1200
800
14004800
1800
32,000
5000
580
970
2300
4100
4400
2900
7200
6800
2800
7100
11,000
11,000
550010,000
12,000
20
1140700
4000
Percent of Sales1-5%5-10%10% or moreSource: http://www.ilsr.org/commercial-roofop-revolution/
*No incentives
D I S T R I B U T E D S O L A R P O T E N T I A L AT PA R I T Y * B Y 2 0 2 2
(Megawatts, residential & commercial)
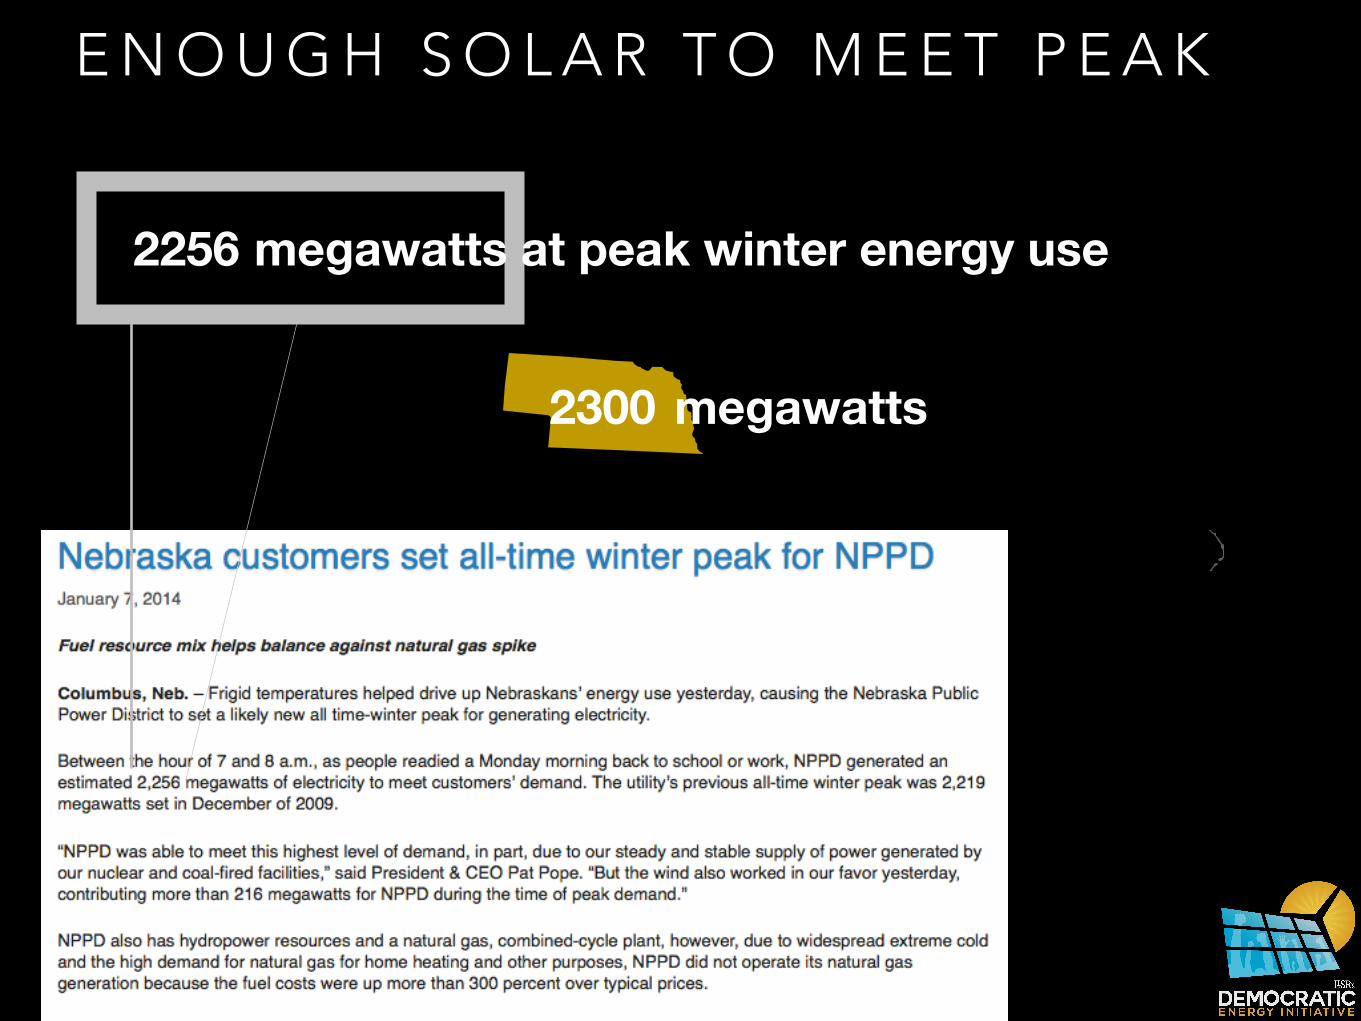
2300 megawatts
E N O U G H S O L A R T O M E E T P E A K
2256 megawatts at peak winter energy use
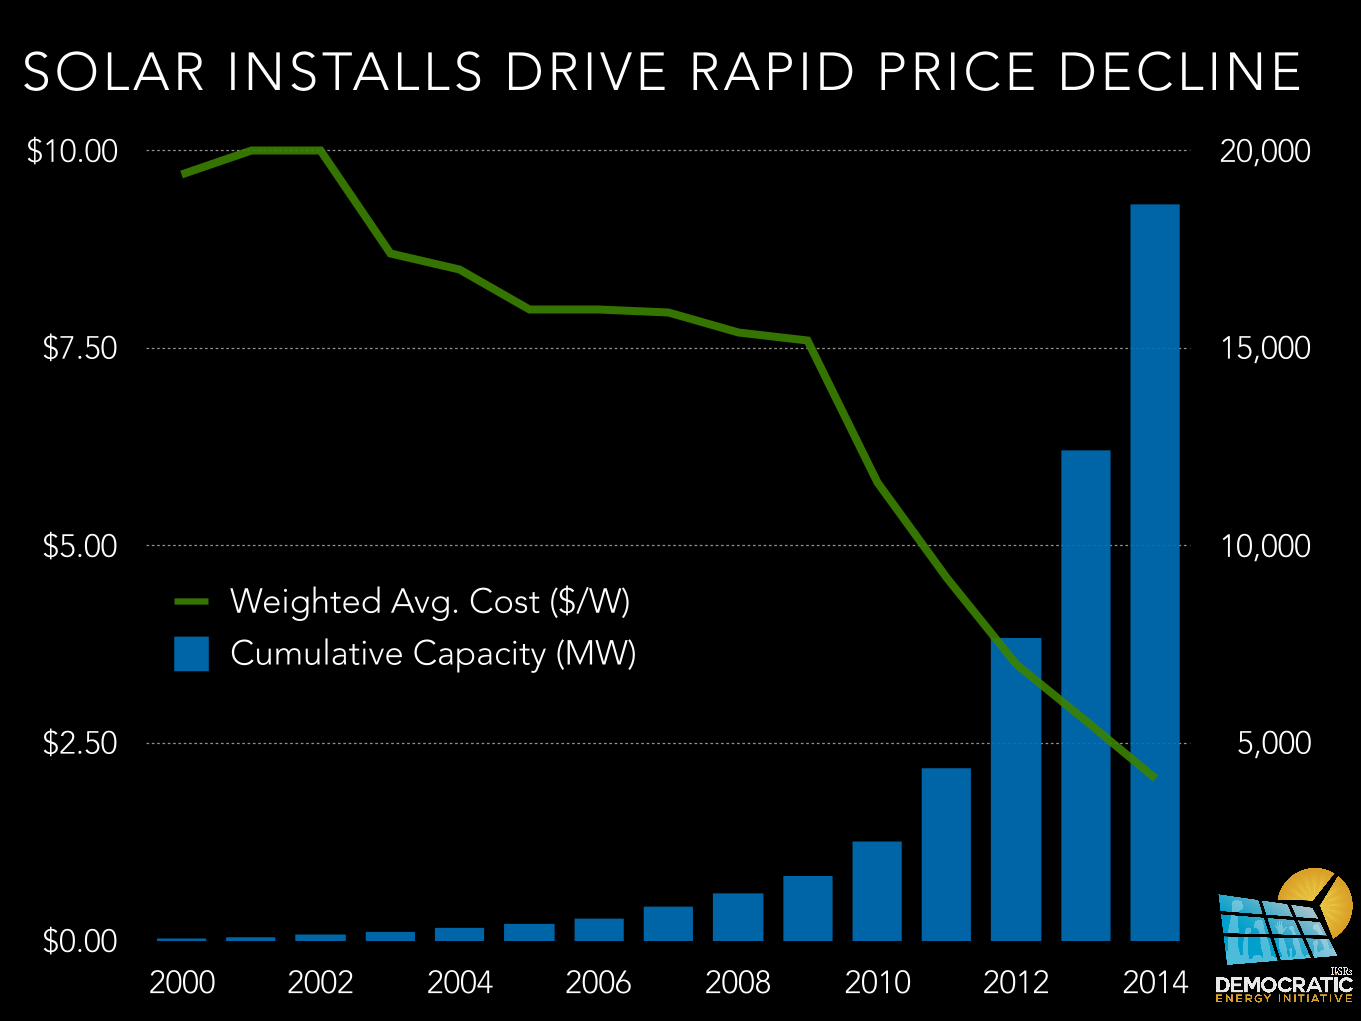
0
5,000
10,000
15,000
20,000
$0.00
$2.50
$5.00
$7.50
$10.00
2000 2002 2004 2006 2008 2010 2012 2014
Weighted Avg. Cost ($/W)
Cumulative Capacity (MW)
SOLAR INSTALLS DRIVE RAPID PRICE DECLINE
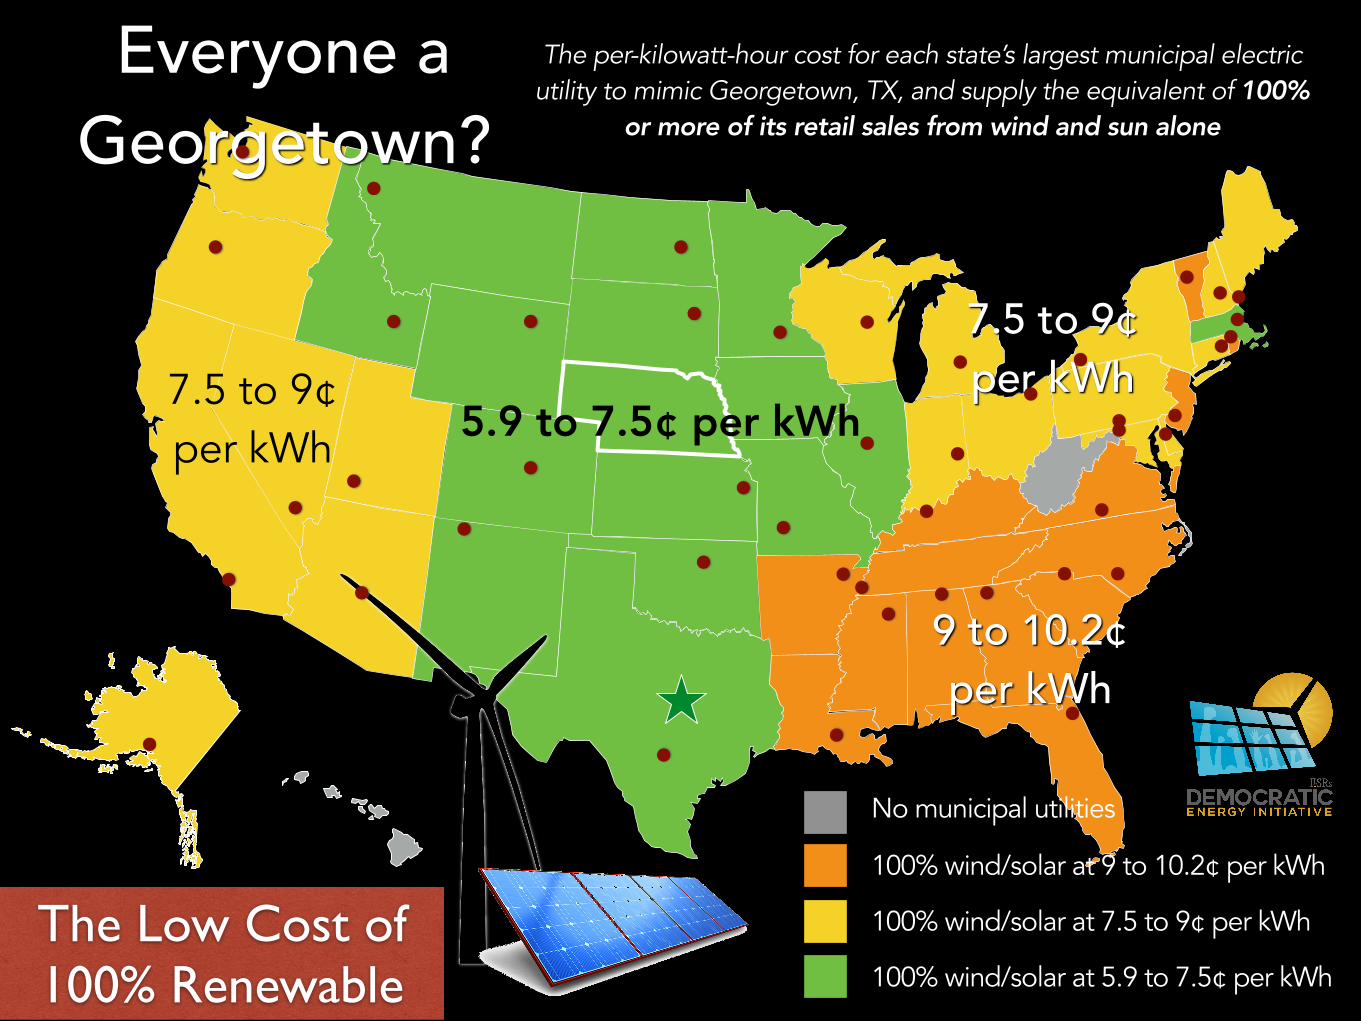
Everyone a Georgetown?
No municipal utilities
100% wind/solar at 9 to 10.2¢ per kWh
100% wind/solar at 7.5 to 9¢ per kWh
100% wind/solar at 5.9 to 7.5¢ per kWh
5.9 to 7.5¢ per kWh
9 to 10.2¢ per kWh
7.5 to 9¢ per kWh
7.5 to 9¢ per kWh
The per-kilowatt-hour cost for each state’s largest municipal electric utility to mimic Georgetown, TX, and supply the equivalent of 100%
or more of its retail sales from wind and sun alone
The Low Cost of 100% Renewable

W H AT C A N W E D O ?

R E A D U P

F I R E B A C KSTATES FACING CHALLENGES TO DISTRIBUTED POWER
Sources: Renewable Energy World, Greentech Media, IREC, Vote Solar and many more
10/21/15http://bit.ly/DG-UnderFireMapData-ILSR

All Nebraska utilities are
public power, owned by the
cities they serve!
E N E R G Y D E M O C R A C Y I S C O M I N G

Credit: Markus Lütkemeyer via Flickr
The 20th century utility
had few resources to
juggle

The 21st century utility may not
have the capacity alone

E N E R G Y D E M O C R A C Y I N A C T I O N
INDEPENDENTLOCAL GRID MANAGER
= super efficient buildings
A solution that New York is
pursuing
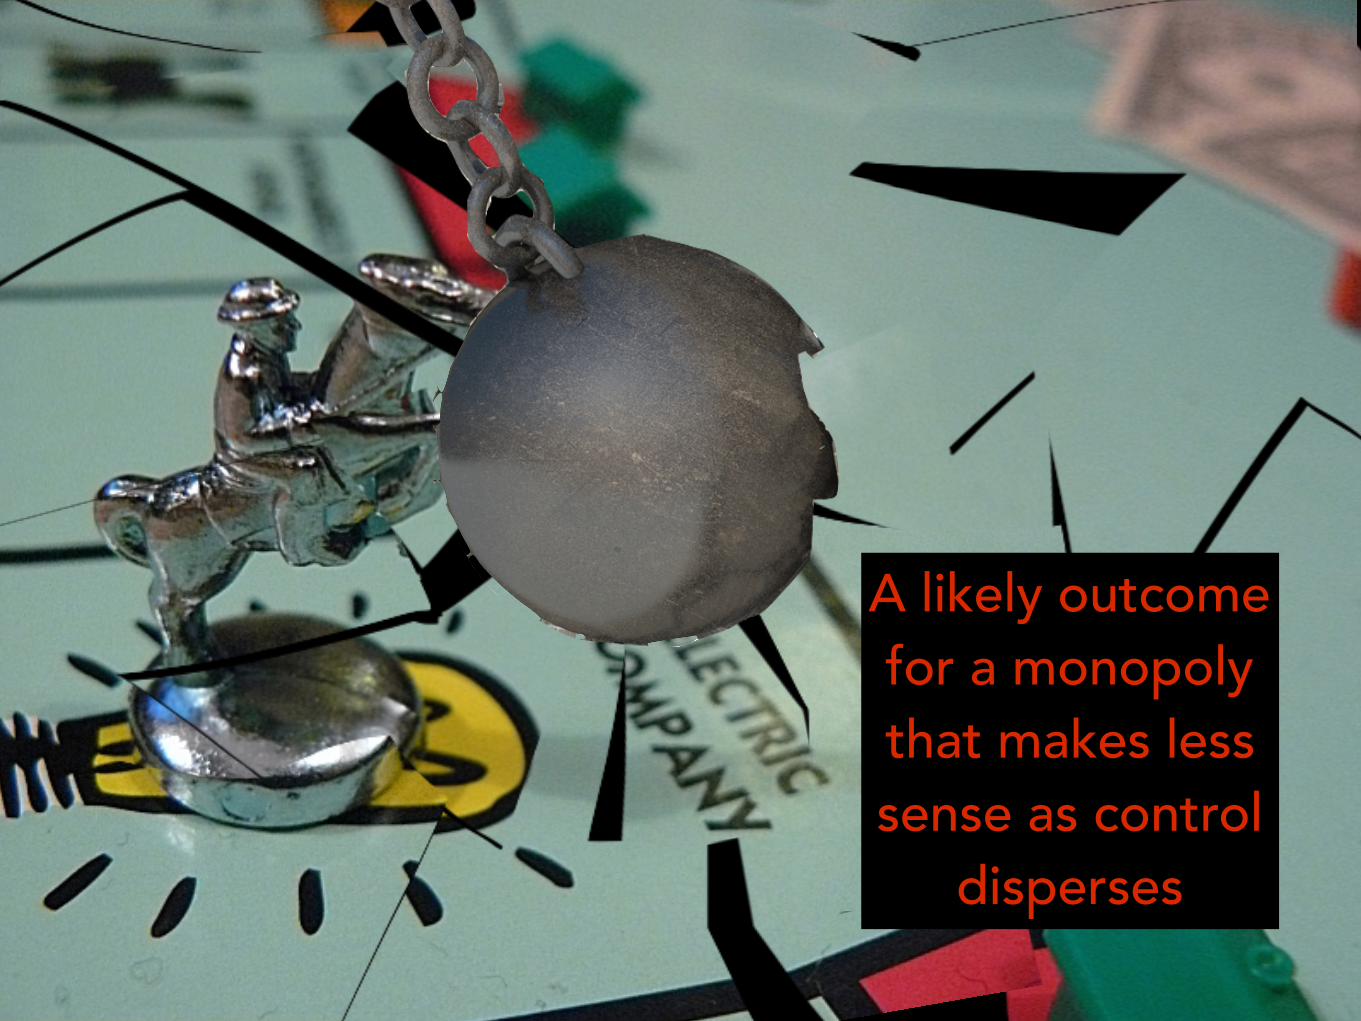
A likely outcome for a monopoly that makes less sense as control
disperses

T H A N K Y O U !@johnffarrell
www.ilsr.org
C H A N G I N G T H E R U L E S
P R O V I D I N G T O O L S
1 0 0 % R E N E WA B L E L O C A L E C O N O M Y
H U M A N S C A L E
L O C A L O W N E R S H I P
D E M O C R AT I C A U T H O R I T Y
I L L U S T R AT I N G T H E V I S I O N