can palm oil loosen its links to the petroleum market?
TRANSCRIPT

© 2016 LMC International. All rights reserved. www.lmc.co.uk
Can palm oil loosen its links to the
petroleum market?
Presentation to MPOB’s Palm Oil Review & Outlook
by James Fry, KL, 17th January 2017

©LMC International, 2017 223/12/2016
I will examine how the price band linking CPO prices to petroleum prices has been behaving recently.
I then review the impact of MPOB’s monthly stock figures on the fluctuations of prices in the price band.
I turn after this to consider how the recent El Niño has affected CPO prices and the nature of the price band.
Indonesia’s BPDP Sawit (the CPO Fund) proves to be a major new price stabilisation mechanism in the palm market, which reinforces the price band.
I will end with a brief discussion about the petroleum market today, highlighting the role now played by US shale oil producers.
Summary of the topics I will consider today

©LMC International, 2017 323/12/2016
Current state of the price band

©LMC International, 2017 423/12/2016
The price band linking vegetable and crude oil prices is now well accepted. It implies that a $10/bbl rise in the price of Brent crude would lift CPO prices by $70.
0
300
600
900
1,200
1,500
1,800
2,100
Jan-07 Jan-08 Jan-09 Jan-10 Jan-11 Jan-12 Jan-13 Jan-14 Jan-15 Jan-16
EU
prt
ices (
US
$ p
er
ton
ne)
Soy Oil CPO Rapeseed Oil Sun Oil Brent
©LMC International, 2017 523/12/2016
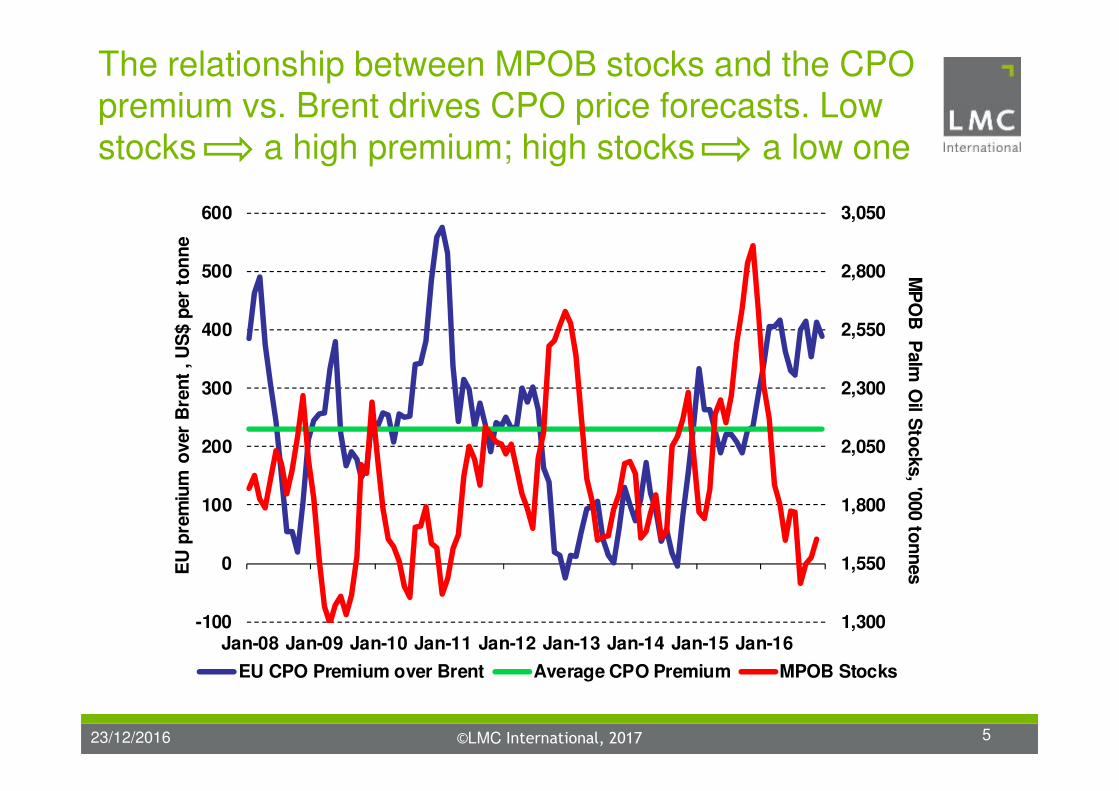
The relationship between MPOB stocks and the CPO premium vs. Brent drives CPO price forecasts. Low stocks a high premium; high stocks a low one
1,300
1,550
1,800
2,050
2,300
2,550
2,800
3,050
-100
0
100
200
300
400
500
600
Jan-08 Jan-09 Jan-10 Jan-11 Jan-12 Jan-13 Jan-14 Jan-15 Jan-16
MP
OB
Palm
Oil S
tocks, '0
00 to
nn
esE
U p
rem
ium
over
Bre
nt
, U
S$ p
er
ton
ne
EU CPO Premium over Brent Average CPO Premium MPOB Stocks

©LMC International, 2017 623/12/2016
This year something was different. Despite record high MPOB stocks, the EU CPO premium over Brent never fell on a monthly basis at all far below $200.
1,300
1,550
1,800
2,050
2,300
2,550
2,800
3,050
-100
0
100
200
300
400
500
600
Jan-08 Jan-09 Jan-10 Jan-11 Jan-12 Jan-13 Jan-14 Jan-15 Jan-16
MP
OB
Palm
Oil S
tocks, '0
00 to
nn
esE
U p
rem
ium
over
Bre
nt
, U
S$ p
er
ton
ne
EU CPO Premium over Brent Average CPO Premium MPOB Stocks

©LMC International, 2017 723/12/2016
The EU CPO price, in general, equals the Brent crude oil price plus a premium linked to MPOB stock levels.
The premium moves in the opposite direction to the movement in palm oil stocks.
So far so good, but this time round, the EU premium did not fall back to zero despite all-time record stocks.
Since this came as a surprise, we need to delve a little to discover what special factors caused the behaviour of CPO prices and their relationship with the level of MPOB palm oil stocks to change.
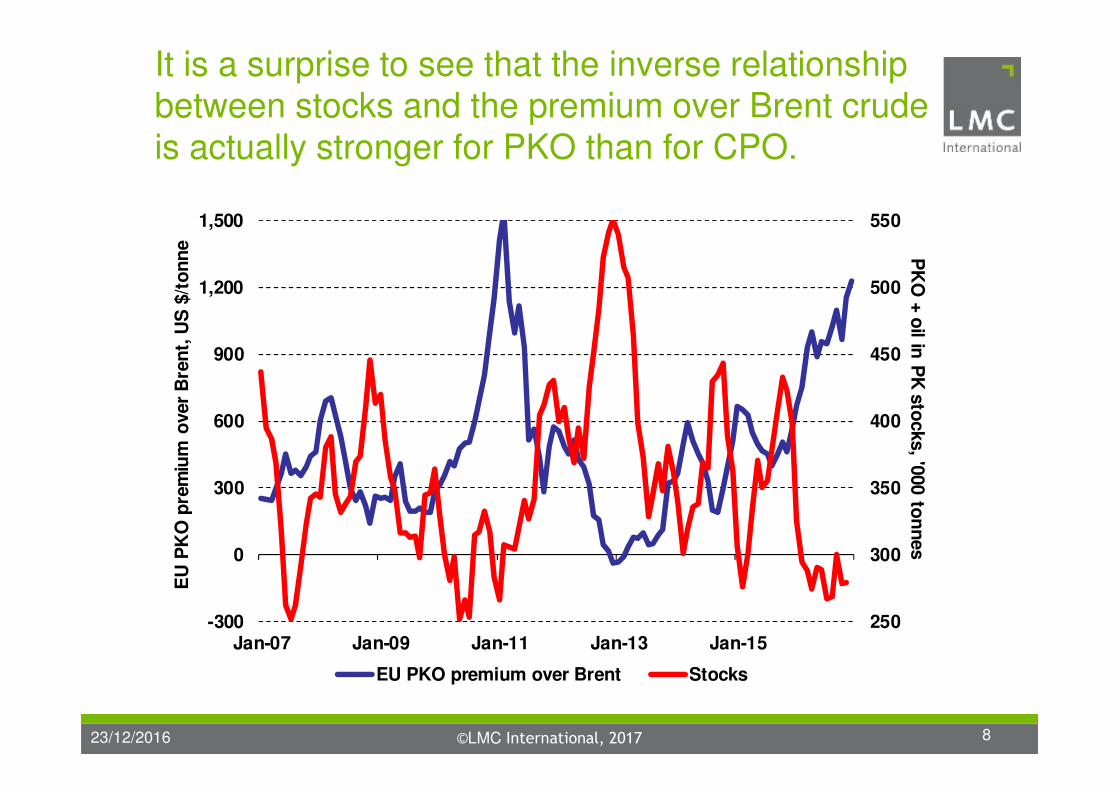
(Please note from the next diagram that PKO prices and stocks display a similar inverse relationship.)
The price band seems to be operating quite well
©LMC International, 2017 823/12/2016
It is a surprise to see that the inverse relationship between stocks and the premium over Brent crude is actually stronger for PKO than for CPO.
250
300
350
400
450
500
550
-300
0
300
600
900
1,200
1,500
Jan-07 Jan-09 Jan-11 Jan-13 Jan-15
EU
PK
O p
rem
ium
over
Bre
nt,
US
$/t
on
ne P
KO
+ o
il in P
K s
tocks, '0
00 to
nn
es
EU PKO premium over Brent Stocks

©LMC International, 2017 923/12/2016
The arrival of a mega El Niño

©LMC International, 2017 1023/12/2016
One reason for the different behaviour was that many people knew that a mega-El Niño was well on its way, following the path last seen back in 1997-98.
-1.5
-1.0
-0.5
0.0
0.5
1.0
1.5
2.0
2.5
Jan Mar May Jul Sep Nov Jan Mar May Jul Sep Nov
Ocean
ic N
iño
In
dex (
ON
I)
1997-98 2009-10 2015-16

©LMC International, 2017 1123/12/2016
The impact of the El Niño on year-on-year growth in Malaysian CPO output has been remarkably similar to that seen in 1997-99, but slightly slower this time.
-36%
-24%
-12%
0%
12%
24%
36%
48%
60%
-1.5
-1.0
-0.5
0.0
0.5
1.0
1.5
2.0
2.5
Jan Jul Jan Jul Jan Jul
Ye
ar o
n ye
ar, C
PO
ou
tpu
t gro
wth
Oce
an
ic N
iño
In
de
x
ONI 1997-99 ONI 2015-16 Growth 1997-99 Growth 2015-17

©LMC International, 2017 1223/12/2016
In terms of the usual way in which El Niño is measured (using the Oceanic Niño Index), the 2015-16 El Niño is as large an event as the 1997-98 one, which also had a dramatic impact on palm oil production.
As we have just seen, the pattern of year-on-year monthly growth rates in these two El Niños has been very similar, but with the growth path shifted down slightly this time round.
The reasons for the slower growth this El Niño are: the underlying expansion in new mature areas in Malaysia is less than it was in the 1990s; also, there is some evidence that older trees suffer more from the drought.
The El Niño had a major impact on CPO output

©LMC International, 2017 1323/12/2016
The creation of Indonesia’s CPO Fund

©LMC International, 2017 1423/12/2016
In July 2015, the Indonesian government created the BPDP Sawit (the “CPO Fund”), which collected all the revenue earned from a new export levy (of $50/tonne on CPO exports and levies on exports of other palm products). This income was close to $750 million/year.
The money subsidised deliveries of biodiesel for use in the price controlled (Public Service Obligation) diesel sold by Pertamina. The fund paid the biodiesel seller the CPO price plus US$125 plus delivery costs, but the subsidy ensured that Pertamina paid only the delivered price for gasoil coming from Singapore.
A guarantee of biodiesel sales also lifted CPO prices.
Another new factor, the Indonesian CPO Fund

©LMC International, 2017 1523/12/2016
Indonesia’s biodiesel use varies with CPO’s premium over diesel. If Brent is $50/bbl, 2 million tonnes/year can be funded at $745 FOB CPO; 3 million at $620.
0
1
2
3
4
5
6
500 525 550 575 600 625 650 675 700 725 750
To
nn
ag
e t
hat
can
be s
ub
sid
ised
, m
n t
on
nes
FOB CPO price, US$ per tonne
End 2016

©LMC International, 2017 1623/12/2016
The Indonesian CPO Fund is very ingenious. It has a fixed pot of cash each year, generated from the export levies that are paid on all exports of palm products.
This cash then has to be shared among the biodiesel suppliers to Pertamina. The suppliers are guaranteed a good margin, while Pertamina pays no more for its biodiesel than it would pay for gasoil instead.
That is not the end of the story. Producers do not mind paying the levy because taking the palm oil out of the market has raised world prices by more than the levy.
Note that this works just like a price stabilisation fund.
Indonesia’s biodiesel mandate is not a fixed % blend. The subsidised volumes move in the opposite direction to CPO-gasoil price spreads.

©LMC International, 2017 1723/12/2016
The price band still seems to be valid, linking CPO prices to Brent crude, with MPOB stocks a key factor.
The recent El Niño had a big impact, in that temporary very high stocks were not a signal for a total collapse in the CPO premium over Brent. Instead, the market was intelligent and took account of the drought.
Another development has been the creation of the CPO Fund in Indonesia. This is not a fixed mandate. Rather, it is a very important new price stabilising mechanism, under which the volume of palm biodiesel moves in the opposite direction to the CPO premium.
This has reinforced the CPO-Brent crude price band.
To recap the conclusions so far

©LMC International, 2017 1823/12/2016
What is happening in petroleum markets?

©LMC International, 2017 1923/12/2016
Right now, stocks to use ratios are at all-time highs in the US, and they have not reacted to output cuts.
70
75
80
85
90
95
100
105
0
20
40
60
80
100
120
140
US
sto
cks o
f all p
rod
ucts
in d
ays o
f use
Bre
nt
cru
de,
US
$ p
er
bb
l.
Brent Crude Moving average US stocks in days of demand

©LMC International, 2017 2023/12/2016
US shale oil rigs lead the supply response to crude oil price rises. As OPEC works to lift prices, US shale oil producers react quickly to offset the production cuts.
0
20
40
60
80
100
120
140
0
200
400
600
800
1,000
1,200
1,400
Jan-07 Jan-09 Jan-11 Jan-13 Jan-15
No
. o
f U
S s
hale
oil
rig
s
No. of US shale oil rigs Bbl/rig/day (LH axis) WTI, $/bbl (RH axis)

©LMC International, 2017 2123/12/2016
I have no doubt that the price band remains as valid a concept as it has done for the past ten years.
As always, concepts must adapt to new external circumstances, and the recent experience of the El Niño demonstrates that climate is another influence.
In some ways, the Indonesian CPO Fund is the most intriguing new factor, by creating a mechanism that reinforces the workings of the price band, by adapting subsidised biodiesel demand to the CPO-Brent spread.
So, crude oil continues to set the floor to CPO prices. In the crude market, a battle is waging between US shale oil and OPEC. Palm producers have to care who wins.
So where does this analysis leave us?

©LMC International, 2017 2223/12/2016
Thank you

For more information, please visit www.lmc.co.uk