can your unit pass a particulate emission …...ambient air • can sample pm10 and/or pm2.5 (using...
TRANSCRIPT

Can your unit pass a Particulate
Emission Compliance Test?
Kevin Crosby The Avogadro Group, LLC
California - Oregon - Arizona
Source Emissions Testing and Emissions Specialists
McIlvaine Hot Topic Hour, April 25, 2013

The Test Method Defines Compliance
The Process and its Emission Controls determine actual emissions
But the Test Method defines the results used to determine compliance
There is a difference – and it can be important!
Methods have been developed in attempts to measure actual emissions of: Filterable PM and Condensable PM
The objective is accurate results for: - Primary, Directly emitted PM, PM10, PM2.5 - Gaseous Precursors to formation of Secondary PM2.5 (SO2, NOX, VOC, NH3)

What is Particulate Matter? Mass/volume measured at Ambient Monitor Emissions - Mass/volume measured at Stack
Primary Particulate Filterable PM (primary “front half”)
Solid or liquid particles at stack or filter temperature– PM, PM10 & PM2.5
Condensable PM (primary “back half”) Vapor or gas at stack conditions - Organic and inorganic Condenses and/or reacts upon cooling and dilution in ambient air,
forms solid or liquid particles immediately after stack discharge All assumed to be in the PM2.5 size fraction
Secondary Particulate Vapor or gas at stack conditions and after discharge Forms PM by chemical reactions in atmosphere
downstream of release point

Filterable PM Measurement • Total FPM - EPA Method 5 and Method 17
(1970’s) - Measure Filterable PM only, all sizes of particles together
• PM10, PM2.5 – EPA Method 201A (1990, updated 2010) - Aerodynamic separation of larger particles, measure particles less than 10 µm or less than 2.5 µm, or both
• Measure concentration in units of: Mass of PM collected per Volume of stack gas sampled Typical units: grains / dscf (7000 grains in a pound) or mg / dscm

EPA Method 17 – In-stack Filter
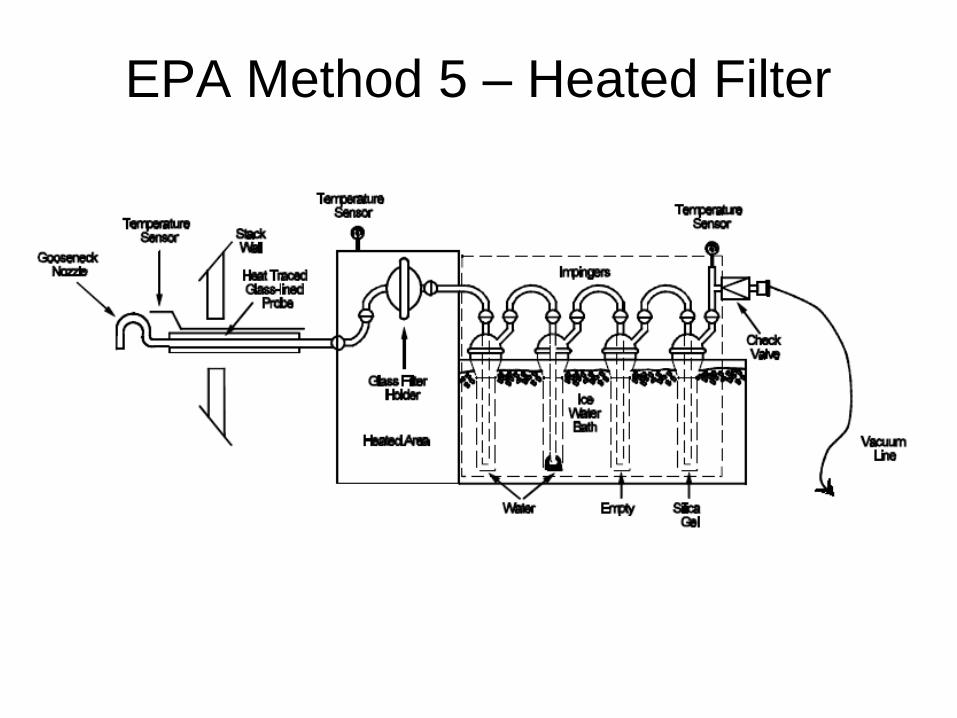
EPA Method 5 – Heated Filter
Filterable PM Measurement • Solid particles – capture not temperature dependent
- fly ash, elemental carbon (soot), etc.
• Liquid particles – capture is temperature dependent Different compounds condense at different temp’s - sulfuric acid droplets (condensed SO3+H2O) - semi-volatile organics (organic carbon – smoke) Filter temperature affects capture, defines results EPA Method 5 – 250oF – some sulfuric acid captured EPA Method 5B – 320oF – no sulfuric acid EPA Method 17 – In-stack filter at stack temperature - what’s captured will depend on stack temp - cannot be used in “wet” stacks such as scrubbers Compounds in vapor phase at filter temp pass through
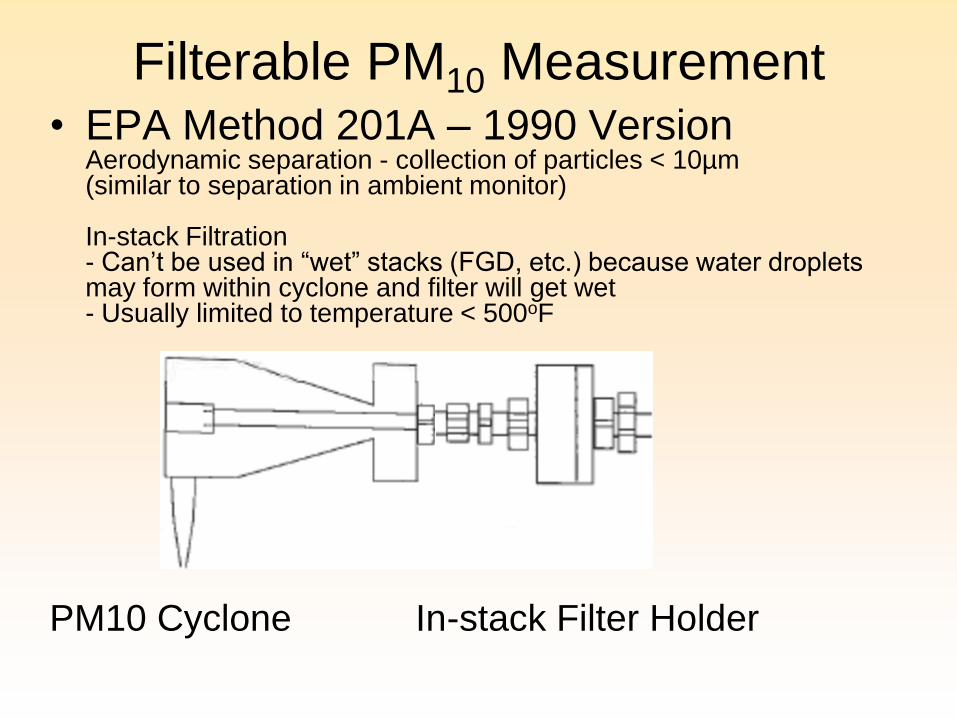
Filterable PM10 Measurement • EPA Method 201A – 1990 Version
Aerodynamic separation - collection of particles < 10µm (similar to separation in ambient monitor) In-stack Filtration - Can’t be used in “wet” stacks (FGD, etc.) because water droplets may form within cyclone and filter will get wet - Usually limited to temperature < 500oF
PM10 Cyclone In-stack Filter Holder
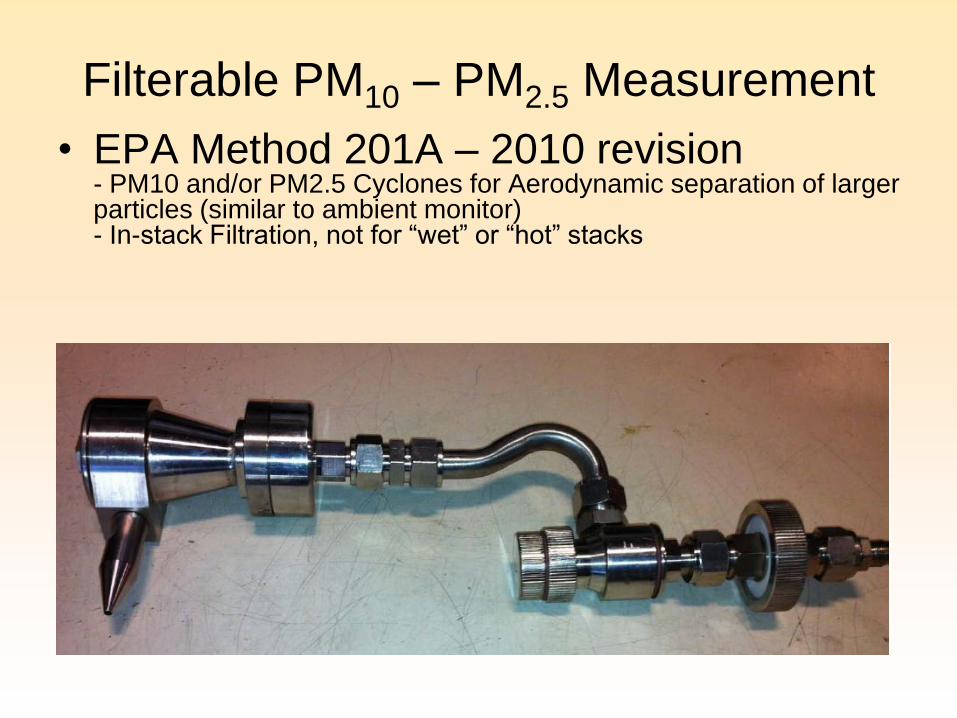
Filterable PM10 – PM2.5 Measurement
• EPA Method 201A – 2010 revision - PM10 and/or PM2.5 Cyclones for Aerodynamic separation of larger particles (similar to ambient monitor) - In-stack Filtration, not for “wet” or “hot” stacks
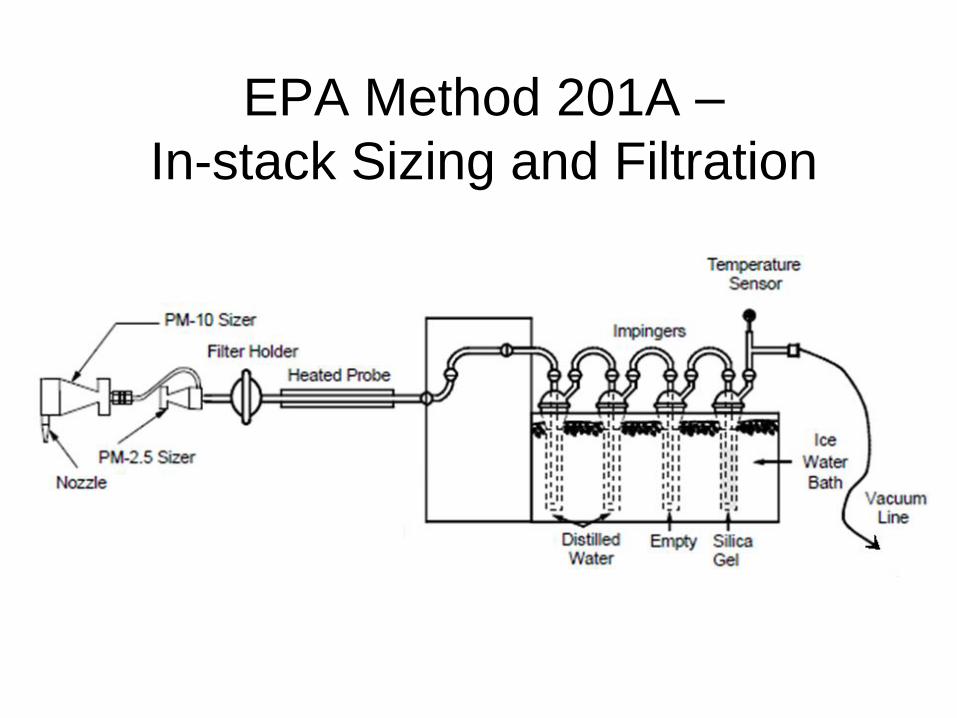
EPA Method 201A –
In-stack Sizing and Filtration

Filterable PM, PM10, PM2.5
Measurement Issues Hot Stacks > 500oF
Probably can’t use 201A, so: Measure Total FPM, call it all PM10 or PM2.5
Wet Stacks (scrubber exhaust) Can’t use 201A, so: Measure Total FPM, call it all PM10 or PM2.5 - This can over-represent PM10 or PM2.5 emissions! Large droplets would make larger particles NOTE: Wet-stack methods are in development! - The larger droplets will be cut out of sampling - Then the larger particles will be cut out, too - one method includes dilution, the other does not The method development needs FUNDING!
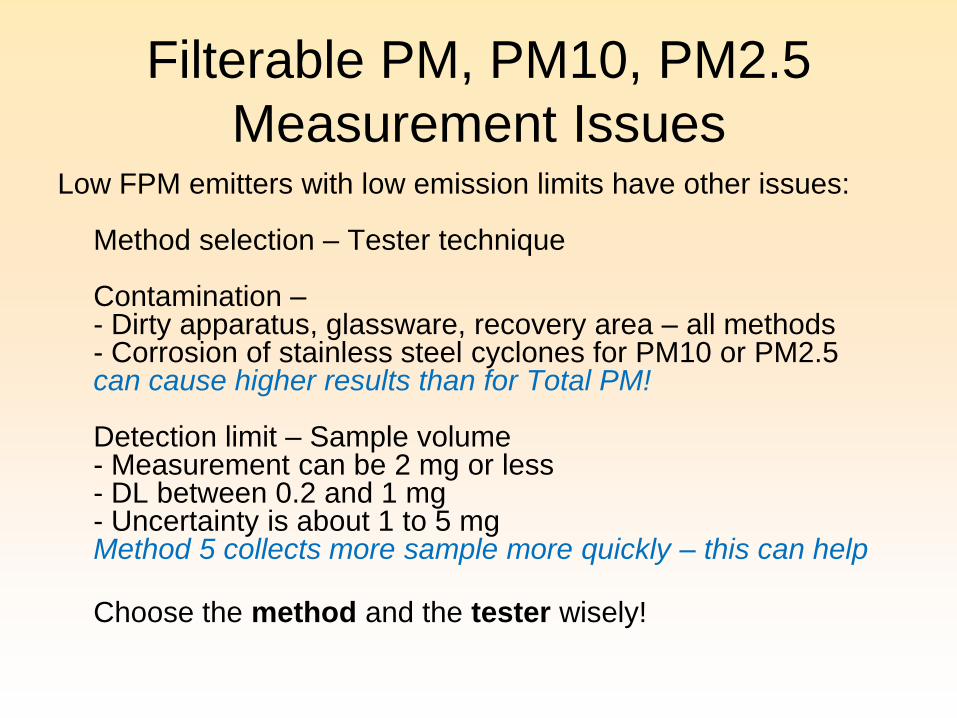
Filterable PM, PM10, PM2.5
Measurement Issues Low FPM emitters with low emission limits have other issues:
Method selection – Tester technique Contamination – - Dirty apparatus, glassware, recovery area – all methods - Corrosion of stainless steel cyclones for PM10 or PM2.5 can cause higher results than for Total PM! Detection limit – Sample volume - Measurement can be 2 mg or less - DL between 0.2 and 1 mg - Uncertainty is about 1 to 5 mg Method 5 collects more sample more quickly – this can help
Choose the method and the tester wisely!
Traditional CPM Measurement
• Designed to capture what went through the filter:
- inorganics (SO3/Sulfuric Acid Mist, etc.)
- organics (semi-volatile)
• SCAQMD, CARB, ODEQ, WDOE methods (1960’s, 1970’s) – include Filterable and Condensable PM (we have been measuring CPM on the West Coast for decades…)
• EPA 202 (1990 version “Old 202”)
• Sample bubbles through water in impingers
• Collects CPM really well – at < 68oF
• But – Gases dissolve in that water, too…

Maximized gas-liquid contact

Traditional CPM Measurement
Gases dissolve and create artifact “CPM”
some SO2 gets oxidized to sulfate
SO2, NH3, HCl in solution dry down to:
– Ammonium Sulfate, Ammonium Bisulfate
(forms from SO2 oxidation to sulfate in solution)
– Ammonium Chloride (forms readily – some of this
may be actual CPM rather than artifact)
The artifact salts confuse the division between
Primary PM2.5 and
Secondary PM2.5 formed from precursor gases
SO2, NH3, HCl get counted as gaseous emissions
AND as PM emissions!
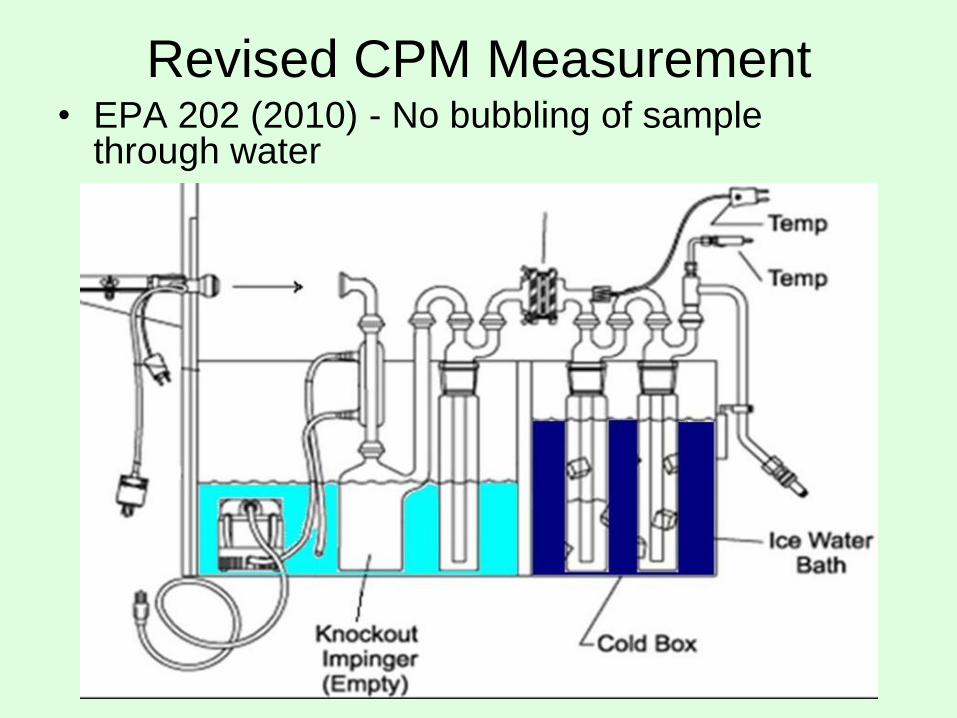
Revised CPM Measurement • EPA 202 (2010) - No bubbling of sample
through water
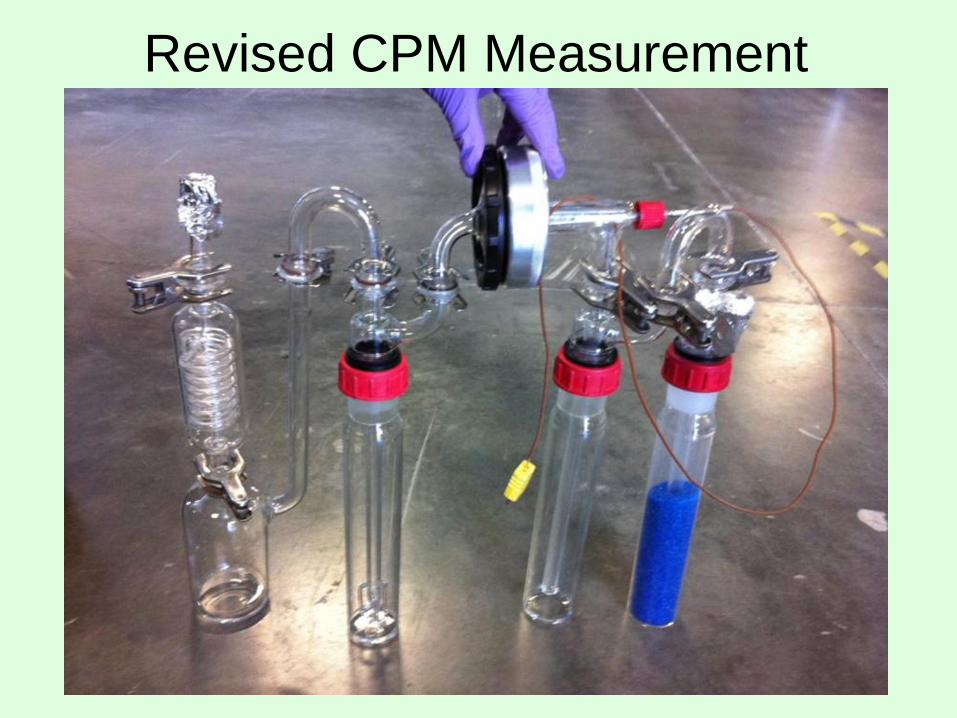
Revised CPM Measurement

Revised CPM Measurement
Minimizes gas-liquid contact
Collects condensate (including water) at <85oF
Gases should dissolve less; SO2 stripped out by
post-test purge with pure Nitrogen
Hypothesis: Much less artifact
This can work quite well on stacks with
little or no ammonia
But – when ammonia is present, we still measure
artifact ammonium salts (often about as much as
with the old methods)
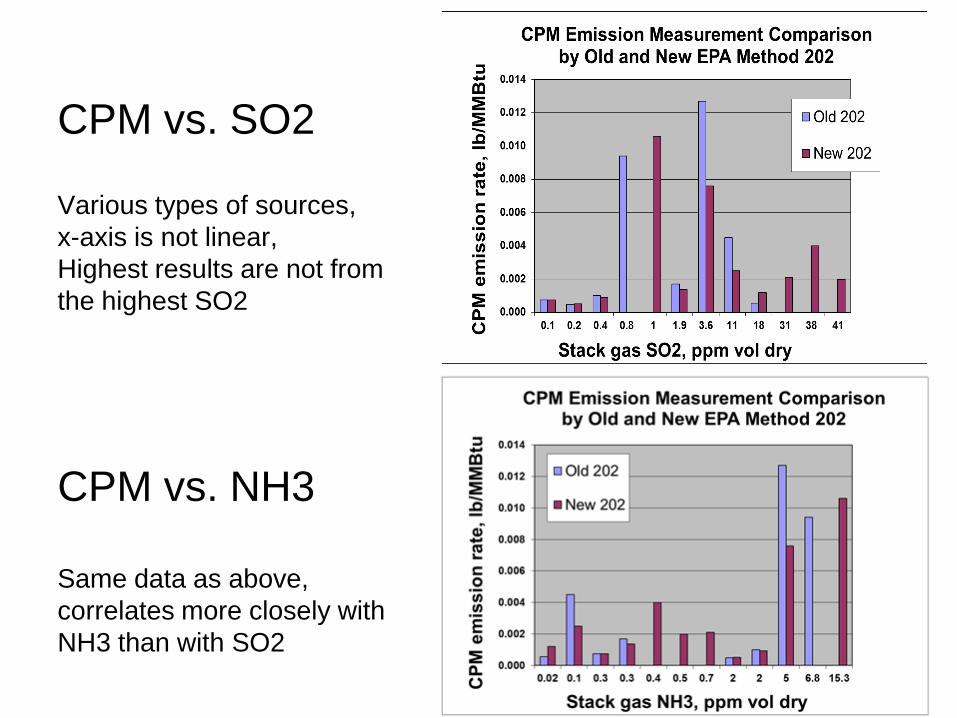
CPM vs. SO2 Various types of sources,
x-axis is not linear,
Highest results are not from
the highest SO2
CPM vs. NH3
Same data as above,
correlates more closely with
NH3 than with SO2
CPM Methods Comparison
• New 202 can (in some cases) measure less
sulfate artifact than the old Method
• Amount of artifact in either method depends on
concentration of NH3 more than SO2 (excess
SO2 gets purged out)
• Significant artifact remains in new 202 results
when Ammonia is present
- our Hypothesis is not proven
• Is there a solution?

Dilution Sampler Concept Stack emissions of Primary PM2.5
Emissions into a "virtual" stream of air
Photochemistry
Particles Secondary + Primary PM2.5
+ Condensables
Stream of air + Gases
Ambient sampler PM2.5 filter
Stack sampling of Primary PM2.5 by CTM-039
Sample "emitted" into a stream of air
Primary PM2.5 - Particles and Condensables (and Gases)
Sampled through filter
same as Ambient sampler
Stream of air Gases remain as gases, no secondary PM2.5
Dilution Method CTM-039 (2004)
• Designed to emulate dilution of stack emissions in ambient air
• Can sample PM10 and/or PM2.5 (using the same in-stack cyclones as 201A) Can also be used on wet stacks (without the cyclones)
• Condensables form in the same way as in actual emissions – EPA’s Gold Standard
• Primary PM2.5 – particles and CPM - all sampled together (like ambient air sampling)
• Disadvantage: Expensive new equipment, Not widely embraced
• Case studies…


Methods Comparison for CPM • Combined-cycle GT with SCR – too close to detection limit to tell
• Foundry – SO2 and semi-volatile organics
Old 202 highest, New 202 lower (probably captured less SO2),
CTM-039 lowest (apparently captured even less SO2, but all the
methods captured the semi-volatile organics)
• Boiler A – Biomass, SNCR, baghouse – SO2 and NH3 were present
New 202 lower, captured less SO2 artifact
- measured emissions still above permit limit
New 202 with ammonia turned off (NOX over limit)
- eliminated ammonium sulfate artifact, nice low result
CTM-039 with ammonia on – unit passed, even test A2!
• Boiler B – Biomass-coal, SNCR, baghouse - SO2 and NH3 plus HCl
CTM-039 helped some at higher emission levels
- But its results were similar to Method 202 at low emission levels…

Methods Comparison for CPM • CTM-039 can greatly reduce artifact from NH3 and SO2
in some cases (boiler A passed test using this method!)
• CTM-039 can have a higher blank background (there is
more surface area of apparatus to rinse and recover
sample from)
• So its Detection Limit can be a bit higher than for 201A-
202
• Let’s look closer at the Boiler B case study to illustrate
other issues…

Methods Comparison Case Study
Solid Fuel w/SNCR, 2 Series of Tests
Case Study Comparison
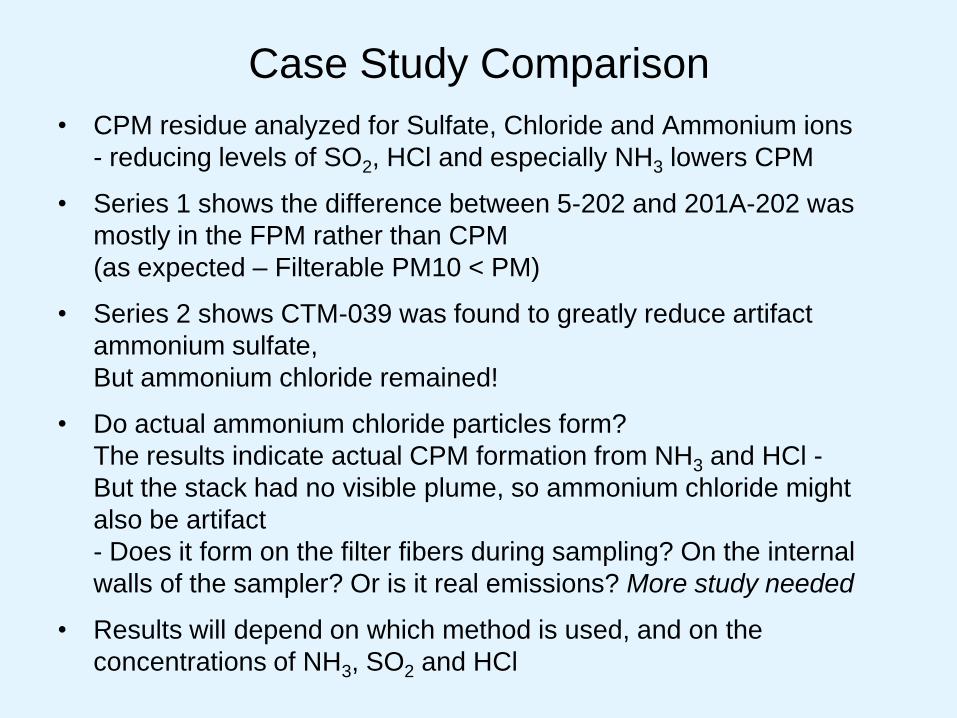
• CPM residue analyzed for Sulfate, Chloride and Ammonium ions
- reducing levels of SO2, HCl and especially NH3 lowers CPM
• Series 1 shows the difference between 5-202 and 201A-202 was
mostly in the FPM rather than CPM
(as expected – Filterable PM10 < PM)
• Series 2 shows CTM-039 was found to greatly reduce artifact
ammonium sulfate,
But ammonium chloride remained!
• Do actual ammonium chloride particles form?
The results indicate actual CPM formation from NH3 and HCl -
But the stack had no visible plume, so ammonium chloride might
also be artifact
- Does it form on the filter fibers during sampling? On the internal
walls of the sampler? Or is it real emissions? More study needed
• Results will depend on which method is used, and on the
concentrations of NH3, SO2 and HCl
Case Study Experience • New Method 202 gets better CPM results in some cases,
barely any better in others
• Dilution such as CTM-039 can help CPM results greatly
in some cases
• We have learned how to run CTM-039 very well
- any new method takes experience to run well
• We know enough so far to understand that it might not
be “the solution” for all cases
– especially with NH3 and HCl forming NH4Cl

Conclusions • The test method defines the results
- Not all can/should be used everywhere – choose wisely,
discuss with your testers
- Match carefully to the stack gas conditions
- Consider likely test results when designing emission controls
and fuels and other commodities used
• The wet stack methods may become important tools for FPM
- one of them will help FPM only
- the other includes dilution, so may also help CPM
Funding will make the methods better, and get them sooner
• Nuances of testing technique can be critical, and make more
difference at lower emission limits
• Use very competent testers to get the best results
- cheap results are not inexpensive

Questions ???
Kevin Crosby Technical Director
Source Emissions Testing and Emissions Specialists