canaccord genuity growth conference august 12, 2015
TRANSCRIPT

Canaccord Genuity Growth Conference August 12, 2015

Aaron Jagdfeld, President & Chief Executive Officer
York Ragen, Chief Financial Officer(262) 506-6064 [email protected]
Michael Harris, Vice President – Finance and Investor Relations(262) 544-4811 x2675 [email protected]
2

Forward Looking Statements
Certain statements contained in this presentation, as well as other information provided from time to time by Generac Holdings Inc. or its employees, may contain forward-looking statements that involve risks and uncertainties that could cause actual results to differ materially from those in the forward-looking statements.
Forward-looking statements give Generac’s current expectations and projections relating to the Company’s financial condition, results of operations, plans, objectives, future performance and business. You can identify forward-looking statements by the fact that they do not relate strictly to historical or current facts. These statements may include words such as “anticipate,” “estimate,” “expect,” “forecast,” “project,” “plan,” “intend,” “believe,” “confident,” “may,” “should,” “can have,” “likely,” “future,” “optimistic” and other words and terms of similar meaning in connection with any discussion of the timing or nature of future operating or financial performance or other events.
Any such forward-looking statements are not guarantees of performance or results, and involve risks, uncertainties (some of which are beyond the Company’s control) and assumptions. Although Generac believes any forward-looking statements are based on reasonable assumptions, you should be aware that many factors could affect Generac’s actual financial results and cause them to differ materially from those anticipated in any forward-looking statements, including: frequency and duration of power outages impacting demand for Generac products; availability, cost and quality of raw materials and key components used in producing Generac products; the impact on our results of possible fluctuations in interest rates and foreign currency exchange rates; the possibility that the expected synergies, efficiencies and cost savings of our acquisitions will not be realized, or will not be realized within the expected time period; the risk that our acquisitions will not be integrated successfully; difficulties Generac may encounter as its business expands globally; competitive factors in the industry in which Generac operates; Generac's dependence on its distribution network; Generac's ability to invest in, develop or adapt to changing technologies and manufacturing techniques; loss of key management and employees; increase in product and other liability claims or recalls; and changes in environmental, health and safety laws and regulations.
Should one or more of these risks or uncertainties materialize, Generac’s actual results may vary in material respects from those projected in any forward-looking statements. A detailed discussion of these and other factors that may affect future results is contained in Generac’s filings with the Securities and Exchange Commission (“SEC”), particularly in the Risk Factors section of our 2014 Annual Report on Form 10K and in its periodic reports on Form 10Q. Stockholders, potential investors and other readers should consider these factors carefully in evaluating the forward-looking statements. Any forward-looking statement made by Generac in this presentation speaks only as of the date on which it is made. Generac undertakes no obligation to update any forward-looking statement, whether as a result of new information, future developments or otherwise, except as may be required by law.
3

Generac Business Overview
About Generac� Founded in 1959
� A leading designer and manufacturer of a wide range of power generation equipment and other engine powered products serving residential, light commercial, industrial, oil & gas, and construction markets.
� Products are available globally through a broad network of independent dealers, distributors, retailers, wholesalers and equipment rental companies, as well as sold direct to certain end users.
� Products marketed and distributed primarily under the Generac®, Magnum™, Ottomotores™, Tower Light™, Powermate®, MAC™ and DR® brands.
� Approximately 3,600 employees as of 12/31/2014
� Approximately 4.0 million ft2 of manufacturing, distribution and fulfillment capacity located in the U.S., Mexico, Italy, UK and Brazil.
6/30/15 LTM Sales: $1.356 billion
4

Major Long-Term Growth Themes
Residential Backup Power� Key drivers: aging and underinvested grid, favorable demographics, heightened power outages
� Low penetration (~3.5%) within emerging product category of home standby (HSB) generators
� ~ 75% share of domestic HSB market with significant barriers to entry
� Leading position in portable generators further enhances brand awareness
Commercial & Industrial Generators� Natural gas generators gaining share vs. diesel in the U.S. and Canada
� Low penetration within emerging “Optional” standby market
� Growing importance of backup power for critical telecommunications infrastructure
� Recently expanded product offering significantly increases addressable market
Mobile Products� Mobile products platform benefitting from secular shift toward renting of mobile equipment
� Acquisitions in recent years provide new access to long-term opportunity in oil & gas market
� Regulatory environment increasing demand for gaseous fueled generators that run on well gas
International Expansion and Diversification � Future acquisitions may provide opportunity to accelerate expansion into other regions of the world
� Entry into other “engine-powered” adjacent product categories
Residential Engine-Powered Tools (EPT) � Recent CHP acquisition provides additional scale and growth to EPT platform
� Cross-selling with nat’l retailers; expand D2C capabilities; better optimize production and supply chain
5

Track Record of Innovation & Growth
$0
$100
$200
$300
$400
$500
$600
$700
$800
$900
$1,000
$1,100
$1,200
$1,300
$1,400
$1,500
$1,600
'89 '91 '93 '95 '97 '99 '01 '03 '05 '07 '09 '11 '13 LTM
2004 – 2014
~12% organic
revenue CAGR
Note: $ amounts in millions. Represents gross sales excluding freight revenue. Excludes “Portable Product” sales prior to the division’s divestiture in 1998. Figures include results from acquisitions completed during 2011 – 2015; see slide titled “Summary of Acquisitions” for further details.
History of Innovation Driving Organic Growth
� Commercialized affordable home standby generators and light-commercial generators
� Differentiated distribution model
� Over 250 engineers on staff as of 12/31/14, over 170 U.S. and international patents and patent applications
� Natural gas and Bi-Fuel™ expertise
� Modular Power System (MPS) approach for industrial applications
� A.M.P.™ targeted marketing process and PowerPlay™ in-home selling solution for home standby generators
� Continued focus on new product introductions
6
6/30/15

Broad Product Offering
Residential Products
Product End Markets
Served
Chore-Related
Outdoor Power
Equipment
Wide variety of
property
maintenance
applications –
residential, light
commercial,
municipal and farm
Portable &
Inverter
Generators
Emergency home
backup,
construction,
recreation & other
light duty uses
Air-cooled
Home Standby
Generators
Emergency backup
– small to medium
homes
Liquid-cooled
Home Standby
Generators
Emergency backup
– larger homes &
small businesses
Industrial Products
Product End Markets
Served
Light Towers,
Mobile
Generators &
Heaters
Temporary lighting, power
and heating for
construction, energy and
other – rental equipment
co’s a key channel
Larger kW &
Container
Gensets
Prime & emergency
backup – regulated
markets
Larger kW &
Container
Gensets
Prime & emergency
backup – non-regulated
markets
Commercial
Stationary
Generators
Emergency backup – small
to mid-sized retail,
telecom, municipal
Industrial
Stationary
Generators
Emergency backup – large
healthcare, telecom,
municipal, manufacturing
7

PRAMAC
AMERICA
Expands portable
generator offerings
for consumer value
and premium
contractor
categories
Marietta, GA
8
Oct 2011
MAGNUM
POWER
PRODUCTS
Mobile products
including light
towers, mobile
generators and
pumps
Berlin, WI
Dec 2012
OTTOMOTORES
Larger kW and
container gensets
for Latin America
market
Mexico City,
Mexico &
Curitiba, Brazil
Aug 2013
TOWER LIGHT
Mobile light
towers for EMEA
and other
international
markets
Milan, Italy
Nov 2013
BALDOR
GENERATORS
Expands
domestic offering
of standby and
prime-duty
gensets up to 2.5
MW
Oshkosh, WI
Sep 2014
MACExpands mobile
products
platform with
addition of
commercial and
industrial heaters
Bismarck, ND
Oct 2014
Summary of Acquisitions
Revenue synergies
� New products, customers, end markets
� Numerous cross-selling opportunities
� Geographic and international expansion
Cost synergies
� Strategic global sourcing initiatives
� Innovation and cost-reduction engineering
� Adopt Generac’s lean cost culture
� Operational excellence focus
Represents relatively smaller acquisition of Gen-Tran completed in February 2012 (manual transfer switches for portable generators - Alpharetta, GA)
Aug 2015
CHPExpands chore-
related products
line-up and
provides
additional scale
to the residential
engine-powered
tools platform
Vergennes, VT

Powerful Macro Trends Drive
� ~75% of buyers age 50 and older
� 45-50% of homes valued under $300k
� 80-85% retro-fit application
(1) Source: U.S. Energy Information Administration. Interruptions measured as affecting more than 50,000 customers and comparing to three and five-year rolling averages.(2) At $1mm/mile (3) Source: Company warranty registration data (4) Source: Company estimates
Aging Grid Driving Power Interruptions(1)
� 30–50% of T&D network in the U.S. is 40–50 years old
� Undergrounding the grid would cost up to $4.0 trillion(2)
North American Penetration Opportunity(4)
Every 1% of increased penetration equals ~ $2 billion of market opportunity
Aging Population Fits Demographic(3)
Home Standby Penetration Opportunity
9
� ~10% CAGR for home standby
generators from 2004-2014
� Generac has ~ 75% share

Secular Penetration Opportunities
Natural Gas vs. Diesel Market Growth
� Nat gas gensets up to 35% less expensive
� Lower operating costs than diesel - leading to improved ROI
“Optional” Standby Customers
� Over 14 million buildings in U.S. with very low penetration
� Increasing level of outages driving the need for backup power
Wireless Communications Infrastructure
� Over 300,000 cell tower sites in U.S. with only 30-35%
penetration
� Providers facing increasing competitive/regulatory
pressures to harden networks
Light Commercial/Retail Opportunity
Commercial and Industrial
10
Source: Frost & Sullivan, Generac estimates
63.0%
48.0%
37.0%
52.0%
20.0%
30.0%
40.0%
50.0%
60.0%
70.0%
2013 2018
North American Generator Market Share by Fuel Type
Diesel revenue Gas revenue
60kW to 300kW output power range

Oil & Gas Infrastructure
� New access to the oil & gas market through acquisitions in
recent years
� Potential long term up-cycle driven by increase in “shale” oil
and gas production
� Regulatory environment regarding flaring of natural gas and
attractive ROI driving demand for gaseous-fueled generators
� Secular opportunity for mobile power equipment including
light towers, generators, heaters and other support equipment
that are essential to drilling and production sites
Mobile Equipment - Rental vs. Buy
Source: ARA Rental Market Monitor, IHS Economics - December 2014 forecast(1) The American Rental Association
� Share of U.S. construction equipment owned by rental
companies reached 54% in 2014 as compared to 40% a
decade ago(1)
� Overall industry projected to grow at ~ 9% CAGR from 2014-18
� Construction and industrial projected to grow at a similar level
Secular Penetration OpportunitiesCommercial and Industrial (cont’d)
11

Differentiated Distribution Model
Established and diverse distribution model = growth driver & competitive advantage
National Retailers
Commercial & Industrial Distribution (legacy Generac):
Catalog andE-Commerce
Private LabelPartners
Residential & Light Commercial Distribution:
= ~ 5,200 Res/Comm Dealers = ~ 135 Industrial Dealer and GAIN Dealer Locations
Res/Comm Dealers
Wholesalers
NationalAccounts
Equipment Rental Yards
Gov’t and Military
IndustrialDealers
Oil and Gas Accounts
12

Innovative Sales and Marketing Tools
Scheduling in-home consultations (IHC)
� PowerPlay™ in-home selling solution
� IHC University sales training
Improving close rates
Finding the most “likely” prospect
� A.M.P.™ targeted marketing process”
� Advanced data analytics
Driving optimized media selection
� “Power You Control” and “Just A Drop”
national TV ad campaigns
� Direct mail, telemarketing, etc.
� Generac Lead Team qualifies sales prospects
13
NEC Approved Technical Generator Sizing
Consultative Back-Up Power Plan
Customized Good-Better-Best Proposal
Customized Financing Proposal

“Powering Ahead” Strategic Plan
Grow Residential Standby Generator Market • Increase awareness, availability and affordability
• Further optimize innovative sales and marketing techniques
• Grow residential dealer base• Continued focus on product expansion and innovation
Diversify End Markets with new products and services• Leverage brand, distribution and supply chain
• Organic expansion through innovation
• Evaluate other adjacent engine powered products through acquisitions
Gain Industrial Market Share
• Leverage expanded diesel product offering
• Specialized expertise in natural gas engines and generators
• Upgrade and expand distribution
• Build relationships with specifying engineers
• Increase awareness in “optional” standby power market
Enter New Geographies
• Leverage Ottomotores and Tower Light acquisitions
• Drive growth in int’l markets with additional investment and focus
• Evaluate additional regions for future expansion through organic growth and acquisitions
14

Financial Summary
15
$792.0
$1,176.3
$1,485.8 $1,460.9 $1,356.5
37.2% 37.4%38.3%
35.3% 34.4%30.0%
40.0%
50.0%
60.0%
$200
$500
$800
$1,100
$1,400
$1,700
2011 2012 2013 2014 LTM 2015
Total Net Sales Gross Margin %
$188.5
$289.8
$402.6
$337.3
$284.8
23.8% 24.6%
27.1%
23.1%21.0%
15.0%
25.0%
35.0%
45.0%
55.0%
$50
$100
$150
$200
$250
$300
$350
$400
$450
2011 2012 2013 2014 LTM 2015
Adjusted EBITDA Adjusted EBITDA margin %
$157.7
$213.2 $229.2
$218.3
$173.7
$50
$100
$150
$200
$250
2011 2012 2013 2014 LTM 2015
Free Cash Flow
$504.7
$785.8
$1,047.2
$898.3 $883.1
2.7x 2.7x 2.6x 2.7x3.1x
1.0x
2.0x
3.0x
4.0x
5.0x
6.0x
$0
$200
$400
$600
$800
$1,000
$1,200
2011 2012 2013 2014 LTM 2015
Consolidated Net Debt Consolidated Net Debt Leverage Ratio

Relative PerformanceCompared with Industrial Technology Peers
16
Source: Thomson One, Company Filings Note: Charts for Free Cash Flow Yield and Enterprise Value / NTM EBITDA use closing share prices as of August 7, 2015.(1) Figures represent a five-year compound annual growth rate calculated by comparing the base year 2010 to the analyst consensus revenue forecast for 2015 for each company.(2) Adjusted EBITDA figures were used for GNRC. For all other companies, EBITDA is calculated as Operating Income plus D&A .(3) Determined by taking the ratio of FCF (Operating Cash Flow less Capex) on an LTM basis compared to Market Capitalization.(4) Based on recent enterprise value to consensus NTM EBITDA estimates. Figure for GNRC determined by subtracting the value of the tax shield in determining enterprise value.
Subtracts present value of tax shield from EV due to reduced add back of income taxes for EBITDA

Consolidated net sales: down approximately 10% vs. 2014
� Assumes record low power outage environment experienced during 1H 2015 continues into 2H 2015
− Residential products: down approximately 11% (due to challenging power outage environment)
− C&I products: down approximately 10% (given telecom and oil & gas headwinds)
� Potential residential sales upside of $30-$50 million in 2H 2015 IF power outages return to a more normalized level vs. the record low levels assumed in current guidance
Adjusted EBITDA: anticipate margins in the low-20% range at approximately 21.0%
Cash income taxes:
� Cash tax rate for full-year 2015: anticipated to be approximately 6% of pretax income
� Cash taxes going forward: ~ 36% tax rate on pre-tax profits less ~ $49 million annual tax shield
Free cash flow: anticipate free cash flow over $100 million during 2H 2015 from inventory monetization as well as seasonally stronger second half
2015 Business OutlookAs reported on August 6, 2015
17

10%Low-
to-mid 20%
L+250$49
million
Cap Ex ~2% of
sales
~$1 Billion
Free Cash Flow Targets
Priority Uses of Capital:
18 Strong Cash Flow Conversion Drives Value Creation for Shareholders
4yr
Sales
CAGR
Attractive
EBITDA
Margins
Low Cost
Debt
Annual
Tax Shield
Asset-lite
Model
Best in Class
Free Cash
Flow Yield
2015-2018 Free Cash Flow Generation:
Invest in organic growth
Pay down debt to 2-3x leverage
Strategic acquisitions
Return of capital to shareholders
$200mm stock
repurchase program:
Aug 2015 Board
authorization over the
next 24 months

Generac (GNRC)
Leading “Industrial Technology” Company
Best in class organic revenue growth
� ~ 12% CAGR in organic revenue over the last 10 years
� Low penetration in key markets, especially home standby market at only ~3.5% penetrated with every 1% increase representing ~ $2 billion market opportunity
� Key macro drivers: aging and underinvested grid; favorable demographics; increasing number of power disruptions; increasing reliance on uninterrupted power and data; natural gas gensets gaining share vs. diesel
Market leader with significant barriers to entry
� ~ 75% share of domestic home standby market
� Unmatched multi-channel distribution led by ~ 5,200 residential & light commercial dealers
� Exclusive focus on power generation and engine powered products
� Considerable sourcing and manufacturing scale
Superior financial profile
� GMs consistently in the mid-to-high-30% range, EBITDA margins in low-to-mid-20% range
� Favorable tax structure worth an estimated $3.50 to $4.25 per share in present value tax savings
� Strong track record of free cash flow conversion and de-levering balance sheet
Strong product, market and geographic expansion opportunities
� Proven track record in completing strategic acquisitions and introducing new products
� Significant international market opportunity – 9% of 2014 revenue outside of U.S. and Canada
Investment Highlights
19

Appendix
20

Compar ison - Tesla Powerwal l
Standalone Backup Power Comparison – Battery vs. HSB generator
(1) Electricity usage of some common household appliances (per Tesla): refrigerator – 4.8 kWh/day; clothes dryer – 3.3 kWh each use; clothes washer – 2.3 kWh each use Sources: Generac, Tesla, U.S. Energy Information Administration, Company estimates21
Tesla battery primarily serves different market than emergency backup power –More of a supplement to solar/peak-shaving applications
Inputs Notes
Capacity of Powerwall battery (kWh) 10
Battery cost (to installer) 3,500$
Markup on battery (approx.) 10% Battery cost to end user 3,850$
Inverter cost (approx.) 3,000$ Converts DC/AC, also serves as a charger/monitor and the intelligence/controls to the system
Professional install cost/other equipment (approx.) 2,750$ Labor, permits, software and electrical equipment to wire out the circuits to be backed up
Installation cost increase per each add'l unit 5% Insufficient information available, this is an approximate estimate
Avg kW use per hour 1.25 National average is ~ 1.25 kW per hour
Duration of backup power desired (hours) 48 Assumes no other alternative energy source (e.g. solar panels)
Outputs
Number of battery units needed 6.0 Per Tesla, limit is 9 units maximum to be installed together
Retail cost of battery units 23,100$
Cost of installation 7,188$
Total system cost - 48 hrs. backup protection 30,288$

Sales by Region & Product
22

Total Outage Hours (Severity)
23
“Normal” baseline outages
(excluding major events)
Last 10 quarters
> 50% below “normal”
1H 2015 (record low outages)
> 20% below last 10 quarters

Favorable Tax Attributes
Tax attributes and 338(h)10 election overview
� $1.9 billion combined asset basis step-up created through 2006 acquisition of Generac and other acquisitions
– Each amortizes over 15 years
– Reduces cash tax obligation by approx. $49 million per year through 2020
Results in present value tax savings of ~ $240-$290 million(2) or $3.50-$4.25 per share
(1) Assuming continued profitability and no limitations at an assumed 38.5% federal and state tax rate.(2) Based on annual discount rate of between 5 and 10%
24
($ mm) Total 2015 2016 2017 2018 2019 2020 2021 2022+
Annual tax amortization $900 $128 $128 $128 $128 $128 $128 $107 $27
Cash tax savings(1)
$346 $49 $49 $49 $49 $49 $49 $41 $10

Net Sales by Product Class
Figures include results from acquisitions completed during 2011 – 2014; see slide titled “Summary of Acquisitions” for further details.
($ in millions)
25
$491.0
$705.4
$843.7
$722.2 $668.9
$250.3
$410.3
$569.9
$652.2 $599.7
$50.7 $60.5
$72.1 $86.5 $87.8
$0
$100
$200
$300
$400
$500
$600
$700
$800
$900
2011 2012 2013 2014 LTM
2015
Residential Commercial & Industrial Other

Q2 2015 & LTM Financial Overview
26
($ in millions)
Actual Y/Y % Actual LTM Y/Y %
Q2 2015 Change Q2 2015 Change
Residential 133.5$ (25.7%) 668.9$ (9.0%)
Industrial 134.6 (17.7%) 599.7 (4.8%)
Other 20.3 3.9% 87.8 11.9%
Net Sales 288.4$ (20.5%) 1,356.5$ (6.1%)
Gross Profit 95.9$ (25.1%) 467.2$ (12.3%)
% Margin 33.3% 34.4%
Adjusted EBITDA 52.4$ (38.0%) 284.8$ (22.1%)
% Margin 18.2% 21.0%
Net Income (1) 14.8$ (72.5%) 120.4$ (34.7%)
Adjusted Net Income 35.3$ (38.2%) 195.7$ (24.5%)
Adjusted EPS 0.50$ (38.2%) 2.79$ (24.6%)
Free Cash Flow 8.6$ (78.8%) 173.7$ (26.7%)
Consolidated Net Debt 883.1$ (1.7%)
Consolidated Net Debt Leverage Ratio 3.1x
(1) Q2 2015 and LTM 2015 periods include a loss on extinguishment of debt of $3.4 and $6.9 million, respectively; and a
$1.4 million business optimization expense. LTM 2014 period includes a $16.0 million pre-tax gain on change in
contractual interest rate and a $4.9 million pre-tax gain on measurement of contingent consideration.

Adjusted EBITDA Reconciliation
($ in millions)
27
2011 2012 2013 2014 2015 LTM
Reported net income $ 324.6 $ 93.2 $ 174.5 $ 174.6 $ 120.4
Interest expense 23.7 49.1 54.4 47.2 46.1
Depreciation and amortization 56.1 54.2 36.8 34.7 36.9
Income taxes provision (benefit) (237.7) 63.1 104.2 83.7 55.5
Non-cash write-down and other charges 10.4 0.2 0.1 (3.9) 3.9
Non-cash share-based compensation expense 8.6 10.8 12.4 12.6 11.5
Loss on extinguishment of debt 0.4 14.3 15.3 2.1 6.9
Gain on change in contractual interest rate - - - (16.0) -
Transaction costs and credit facility fees 1.7 4.1 3.9 1.9 1.8
Other 0.5 0.7 1.0 0.3 1.8
Adjusted EBITDA $ 188.5 $ 289.8 $ 402.6 $ 337.3 $ 284.8

Adjusted EBITDA Reconciliation
($ in thousands)
28
Net income to Adjusted EBITDA
reconciliation
2015 2014 2015 2014
Net income 14,844$ 54,025$ 120,416$ 184,337$
Interest expense 10,763 11,428 46,129 47,614
Depreciation and amortization 10,129 8,381 36,937 36,074
Income taxes provision 8,628 28,397 55,475 104,812
Non-cash write-down and other charges 404 (5,198) 3,875 (6,491)
Non-cash share-based compensation 2,582 2,881 11,499 12,379
Loss on extinguishment of debt 3,427 - 6,879 -
Gain on change in contractual interest rate - (16,014) - (16,014)
Transaction costs and credit facility fees 481 498 1,832 2,661 Other 1,164 134 1,771 373
Adjusted EBITDA 52,422$ 84,532$ 284,813$ 365,745$
Three months ended
June 30, LTM June 30,
(unaudited)(unaudited)
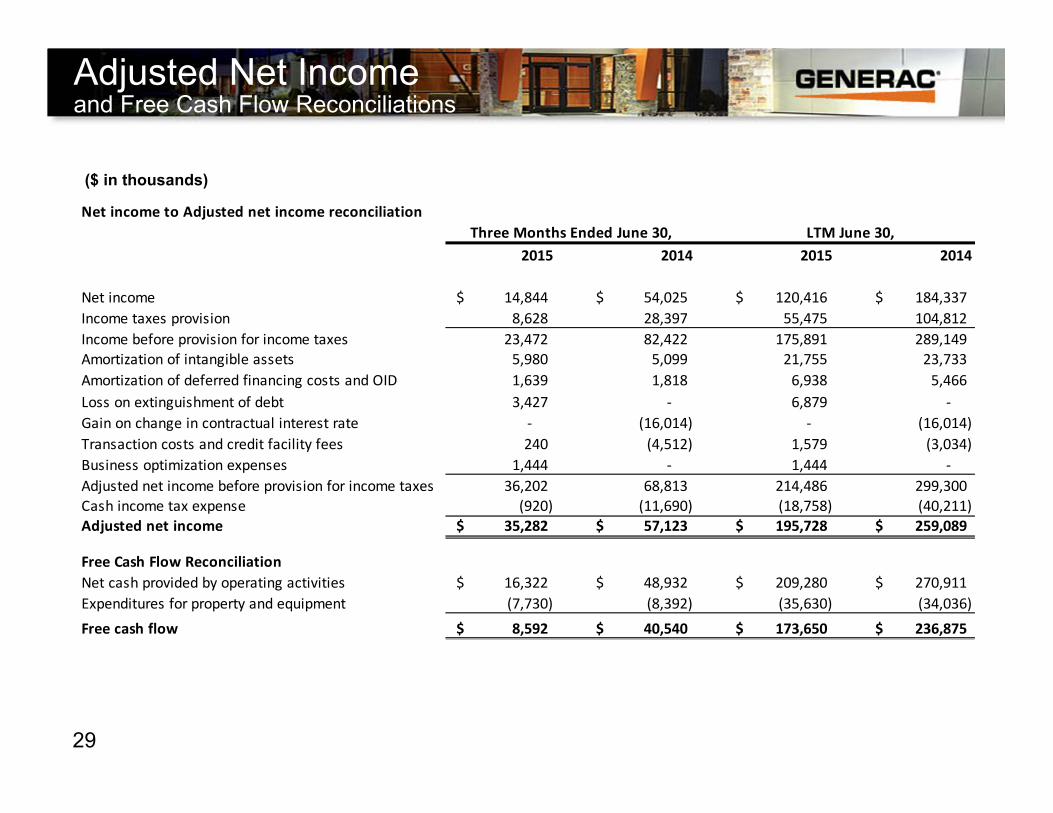
Adjusted Net Income
($ in thousands)
and Free Cash Flow Reconciliations
29
Net income to Adjusted net income reconciliation
2015 2014 2015 2014
Net income 14,844$ 54,025$ 120,416$ 184,337$
Income taxes provision 8,628 28,397 55,475 104,812
Income before provision for income taxes 23,472 82,422 175,891 289,149
Amortization of intangible assets 5,980 5,099 21,755 23,733
Amortization of deferred financing costs and OID 1,639 1,818 6,938 5,466
Loss on extinguishment of debt 3,427 - 6,879 -
Gain on change in contractual interest rate - (16,014) - (16,014)
Transaction costs and credit facility fees 240 (4,512) 1,579 (3,034)
Business optimization expenses 1,444 - 1,444 -
Adjusted net income before provision for income taxes 36,202 68,813 214,486 299,300
Cash income tax expense (920) (11,690) (18,758) (40,211)
Adjusted net income 35,282$ 57,123$ 195,728$ 259,089$
Free Cash Flow Reconciliation
Net cash provided by operating activities 16,322$ 48,932$ 209,280$ 270,911$
Expenditures for property and equipment (7,730) (8,392) (35,630) (34,036)
Free cash flow 8,592$ 40,540$ 173,650$ 236,875$
Three Months Ended June 30, LTM June 30,