canada 2030: an agenda for sustainable development€¦ · particularly relevant for canada’s...
TRANSCRIPT

---------------------------------- ----------------------------------
------------------------------
Canada 2030: An Agenda for
Sustainable Development
Shannon Kindornay
Andrew Sharpe
Purbita Sengupta
Elham Sirag
Evan Capeluck
February 2015
Ottawa, Canada

2
Content
Acknowledgements ....................................................................................................................................... 3
Acronyms and Abbreviations ........................................................................................................................ 4
List of Tables, Figure and Boxes .................................................................................................................. 5
Report Highlights ........................................................................................................................................... 7
Introduction.................................................................................................................................................. 14
Post-2015 Priorities for Canada .................................................................................................................. 18
End Poverty ................................................................................................................................................. 22
Ensure Quality Education for All ................................................................................................................. 31
Create Jobs, Sustainable Livelihoods and Inclusive Growth for All ............................................................ 41
Ensure Energy and Develop Infrastructure for All ...................................................................................... 49
Establish a Sustainable, Healthy and Resilient Environment for All ........................................................... 63
Establish Open, Accountable, Inclusive and Effective Institutions, Rule of Law and a Peaceful and
Inclusive Society ......................................................................................................................................... 80
Establish a Global Partnership for Sustainable Development .................................................................... 96
Measuring Progress on Post-2015 in Canada .......................................................................................... 108
Political Economy of the Data Revolution ................................................................................................. 119
Conclusion................................................................................................................................................. 125
References ................................................................................................................................................ 133
Annex 1. Research Process...................................................................................................................... 147
Annex 2. Targets and Indicators Examined for Canada ........................................................................... 150
Annex 3. Sources to Monitor Post-2015 ................................................................................................... 166
Annex 4. Data Quality Assessment Framework ....................................................................................... 171
Annex 5. Key Resources Consulted for the Data Quality Assessment .................................................... 173

3
Acknowledgements
This is a report of the Post-2015 Data Test, an initiative developed and led by Bangladesh’s Centre for
Policy Dialogue and Canada’s Norman Paterson School of International Affairs at Carleton University in
association with the Southern Voice on the Post-MDG International Development Goals network. The
Canada case study was managed and led by Shannon Kindornay, Adjunct Research Professor, at the
Norman Paterson School of International Affairs. The report was written by Shannon Kindornay, Andrew
Sharpe, Purbita Sengupta, Elham Sirag and Evan Capeluck.
Carleton University thanks the William and Flora Hewlett Foundation for its support of the Canada case
study under the Post-2015 Data Test.
The authors are grateful to Livia Bizikova, Director, Knowledge for Integrated Decisions at the
International Institute for Sustainable Development and Brandon Schaufele, Assistant Professor of
Business, Ecnomics and Public Policy at Western University’s Ivey Business School for their ongoing
engagement throughout the research process and insightful feedback.They would also like to thank Denis
Côté, Yiagadeesen Samy and Kate Higgins for comments on the report, as well as others who
participated in focus group discussions and key informant interviews throughout the research process.
This report does not necessarily reflect the views or opinions of Carleton University, the Centre for the
Study of Living Standards, its Board of Directors or anyone consultated throughout the research process.

4
Acronyms and Abbreviations
CANSIM
CMEC
CPD
CSO
DFATD
FDI
FPT
FY
GDP
GHG
LICO
LIM
MBM
MDGs
NHS
NSI
ODA
OECD
OECD-DAC
OPEC
OWG
PPP
PUMFs
SDGs
SLID
UN
US
Canadian Socio-Economic Information Management System
Council of Ministers of Education, Canada
Centre for Policy Dialogue
civil society organisation
Foreign Affairs, Trade and Development Canada
foreign direct investment
federal, provincial and territorial
fiscal year
gross domestic product
greenhouse gas
low income cut-off
low income measure
Market Basket Measure
Millennium Development Goals
National Household Survey
North-South Institute
official development assistance
Organisation for Economic Co-operation and Development
OECD Development Assistance Committee
Organization of the Petroleum Exporting Countries
Open Working Group on Sustainable Development (United Nations)
purchasing power parity
public use microdata files
Sustainable Development Goals
Survey of Labour and Income Dynamics
United Nations
United States

5
List of Tables, Figure and Boxes
Tables and Figure
Boxes
Box 1 Universal post-2015 Sustainable Development Goals 14 Box 2 What is the data revolution? 15 Box 3 Sustainable development post-2015 19 Box 4 Key issues addressed by poverty reduction strategies for eight provinces and three
territories 24
Box 5 Data strategy: End poverty 27 Box 6 Box 7
Sustainable development education in Canada Data strategy: Ensuring quality education for all
34 37
Table 1 End poverty: Targets and indicators 26 Table 2 Ensure quality education for all: Targets and indicators 35 Table 3 Create jobs, sustainable livelihoods and inclusive growth for all: Targets and
indicators 44
Table 4 Ensure sustainable energy and develop infrastructure for all: Targets and indicators
54
Table 5 Establish a sustainable, healthy and resilient environment for all: Targets and indicators
71
Table 6 Establish open, accountable, inclusive and effective institutions, rule of law and a peaceful and inclusive society: Targets and indicators
89
Table 7 Establish a global partnership for sustainable development: Targets and indicators
102
Table 8 Data availability for measuring progress against global targets and indicators 112 Table 9 Table 10
Global targets and indicators for which data need to be collected Key potential sources for monitoring the post-2015 agenda in Canada
113 114
Table 11 Overarching considerations in the assessment of Statistics Canada sources 116 Table 12 Results of the data quality assessment 118 Figure 1 Index of actual spending and full-time equivalents employment, 2000–01 to 2012–
13 (2000–01 = 100) 122
Table 1.1 Table 1.2
Stakeholders consulted for the Canada case study Requests made to Statistics Canada throughout the research project
147 148
Table 2.1 Table 2.2 Table 2.3 Table 2.4 Table 2.5 Table 2.6 Table 2.7
End poverty: Targets and indicators Ensure quality education for all: Targets and indicators Create jobs, sustainable livelihoods, and inclusive growth for all: Targets and indicators Ensure sustainable energy and develop infrastructure for all: Targets and indicators Establish a sustainable, healthy and resilient environment for all: Targets and indicators Establish open, accountable, inclusive and effective institutions, rule of law and a peaceful and inclusive society: Targets and indicators Establish a global partnership for sustainable development: Targets and indicators
151 151 153 155 157 161 162 163
Table 3.1 Table 4.1 Table 5.1
Potential sources for monitoring the post-2015 agenda in Canada Data quality assessment framework Overarching resources consulted for the Canadian data quality assessment
166 171 173
Table 5.2 Instrument-specific resources consulted for the Canadian data quality assessment 173

6
Box 8 Data strategy: Create jobs, sustainable livelihoods and inclusive growth for all 45 Box 9 Data strategy: Ensure sustainable energy and develop infrastructure for all 56 Box 10 Box 11 Box 12 Box 13
Energy generation: Spotlight on the North Environmental health in Aboriginal communities and the post-2015 commitment to “leave no one behind” Aichi Biodiversity Targets and indigenous knowledge and land-use practices Data strategy: Establish a sustainable, healthy and resilient environment for all
60 65 67 73
Box 14 Data strategy: Establish open, accountable, inclusive and effective institutions, rule of law and a peaceful and inclusive society
92
Box 15 Box 16 Box 17 Box 18 Box 19
Global partnership terminology Data strategy: Establish a global partnership for sustainable development Establishing Canada’s SDG roadmap: Building on provincial and territorial poverty reduction strategies Engagement by Canadian women’s groups on sustainable development: Linking the domestic and the global Measuring global partnership post-2015
97 104 125 129 131

7
Report Highlights
About the study
In 2015, governments will negotiate a set of Sustainable Development Goals (SDGs) to replace the
Millennium Development Goals (MDGs), which expire in 2015. Like the MDGs, the SDGs will comprise
goals, targets and indicators against which countries and the world will track progress on sustainable
development. But unlike the MDGs, the SDGs are set to be universal in nature, applying to all countries,
including developed countries like Canada. The implementation of the SDGs is also expected to allow
countries space to identify their own national priorities within the broad sustainable development
framework. A key question in this context is how the SDGs will be effectively applied across countries at
different stages of development. In an effort to address this question, this report examines what the SDGs
could mean for Canada. It is part of a broader multi-country initiative – the Post-2015 Data Test – which
looks at how the SDGs could be applied and measured across a range of low, middle and high-income
countries.
The key objective of this study is to identify the opportunities and challenges that may arise for Canada
from the implementation of a universal, country-relevant SDG framework, including those related to
measuring progress. The study unpacks Canada’s national priorities for candidate SDGs in seven areas –
poverty, education, employment and inclusive growth, energy and infrastructure, environmental
sustainability and disaster resilience, governance, and global partnership for sustainable development. It
provides an overview of key data sources and identifies the factors for realising progress in the Canadian
context. Importantly, the report also examines the implementation challenges Canada may face as a
federal state in which provinces and territories have jurisdiction over goal areas such as education.
The report makes a number of valuable contributions. First, it serves as a comprehensive overview of
Canada’s sustainable development challenges, broadly understood in terms of economic, social and
environmental well-being. Second, the report also takes stock of the current state of Canada’s national
statistical system and data availability for monitoring progress on the SDGs. Given the breadth of issues
addressed, the report is divided into sections according to candidate SDG areas and measurement
issues. Each goal sections can be read on a stand-alone basis for readers interested in particular
candidate goal areas and their implications for Canada. Finally, the report provides a concrete example of
how a universal, country relevant sustainable development agenda could be applied to high income
countries.

8
Key findings
The study finds that the candidate SDGs are relevant to the Canadian
context and broadly correspond with national sustainable development
challenges.
Recognising that the SDG framework is set to give countries space to
identify and target national priorities in the implementation of the SDGs,
the study includes an examination of Canadian priorities across seven
candidate goal areas. Challenges related to the social, economic and
environmental well-being of Canada’s Aboriginal peoples appear across
six of the seven goals. Similarly, the study finds that issues related to
gender equality are cross-cutting for a significant number of potential
SDG areas.
A number of global minimum standards have been identified for the SDG
framework, such as ending extreme poverty as measured by the
proportion of the population living on less than US$1.25 (purchasing
power parity) per day and ensuring that all newborns are registered with
civil authorities. For the most part, global minimum standards are not
particularly relevant for Canada’s domestic priorities, though some, such
as ensuring universal access to infrastructure, may be relevant,
particularly in Canada’s North.
The conversation on the post-2015 agenda has been limited in Canada.
Environmental and development-oriented federal government
departments and civil society actors tend to be directly engaged in the
international discussions. However, domestic stakeholders, such as
provincial and municipal governments, the private sector and civil society
organisations that focus on Canadian issues, are not aware of the post-
2015 process and its relevance to their work domestically. This is
unsurprising given that such global frameworks have historically been
applied to developing countries and have had little impact on Canada’s
domestic priorities with the exception of guiding Canada’s approach to
international development cooperation.
Nevertheless, the study reveals that, while not directly linked to the SDG
process, a rich history of work on issues related to the SDG agenda –
such as addressing poverty and climate change – exists in Canada
through a patchwork of national, sub-national and local initiatives by
governments and non-governmental stakeholders.
The study includes an evaluation of the availability of good quality official
data, including disaggregated data, to measure progress on the post-
2015 agenda. It also looks at dimensions of the data availability–
transparency–accountability nexus, examining possibilities for how
stakeholders can use data to hold government to account for progress on
post-2015.
Key Findings
The proposed
Sustainable Development
Goals (SDGs) are relevant
for Canada.
Addressing the well-
being of Aboriginal
peoples is prevalent
across SDGs. Issues
related to gender equality
are also cross-cutting.
Global minimum
standards are not
particularly relevant for
Canada’s national
priorities.
Most Canadian
stakeholders have little to
no knowledge of the post-
2015 agenda.
Nevertheless, efforts to
address sustainable
development concerns in
Canada are established
and ongoing for many
candidate goal areas.

9
Canada has an excellent, relatively independent statistical system that is
well placed to measure progress on the post-2015 agenda. Most
indicators examined under the study are already available or can be easily
calculated. Data gaps are most prevalent for goals related to governance,
the environment, and energy and infrastructure. Disaggregated data are
nearly always available for age, sex and sub-national levels (such as
provinces/territories, metropolitan areas, federal electoral districts) but less
readily available by minority group and income level.
Though challenges exist, unofficial data are not necessarily needed to fill
gaps in measuring progress. Statistics Canada and other government
departments and agencies are well positioned to address data gaps if
afforded the necessary resources to do so. The use of unofficial data
sources to measure progress on post-2015 may present a risk given that
they do not necessarily follow the same level of rigor and transparency as
Statistics Canada.
For the targets and indicators examined in this study, data on goals
related to poverty, education and employment are excellent and very good
for all other candidate goal areas. Nevertheless, there is room to improve
the relevance of data produced through greater consultation with users by
data providers.
Unsurprisingly, given the agency’s raison d’être, sources of data from
Statistics Canada identified through the data mapping process typically do
better in the data quality assessment than data from other government
departments and agencies. Official data providers outside Statistics
Canada tend to have gaps in terms of the availability and presentation of
metadata including methodologies, concepts and other information about
survey instruments, consultation with users and reporting on data
reliability.
While Canada is well placed to measure progress on the post-2015
agenda, a number of challenges exist. In the recent past, the federal
government has not demonstrated a commitment to ensuring the
availability of good data, as shown by cuts to Statistics Canada’s human
and financial resources and the controversial decision to terminate the
mandatory long-form census. The capacity of Statistics Canada to
continue producing high-quality data has been questioned, particularly in
light of changes to some survey instruments that have jeopardised the
continuity and comparability of important datasets. Nevertheless, the
quality of unaffected survey instruments – those which have not been
impacted by cuts or significant changes to methodologies – remains high.
Key Findings
Official data are available
for 78 per cent of the 133
indicators examined in
this study.
With the appropriate
resources, Statistics
Canada and other
government departments
and agencies have the
capacity to address data
gaps.
Data quality is excellent
for goals related to
poverty, education and
employment and very
good for all other
candidate goal areas.
Lower data quality is
associated with data
sources from other
departments and
agencies while data from
Statistics Canada are of
excellent quality.
While Canada has an
excellent statistical
system, it has seen
deterioration in recent
years.

10
There is no question that the level of access to official data is excellent
for all stakeholders in Canada and that users’ capacities to use data are
good. Canada has a free, open and independent media that plays an
important role in holding government to account. At the same time, the
enabling environment for civil society has become increasingly closed in
recent years as charitable organisations have seen funding cuts and
stricter regulations on the activities that they can undertake, particularly
with respect to advocacy.
Implications for Canada
To date, the Canadian government has championed a post-2015
framework that focuses on the poorest and most vulnerable in developing
countries, ensures a continued emphasis on maternal, newborn and child
health, and effectively promotes job creation and sustainable economic
growth. These priorities reflect Canada’s current approach to development
cooperation. While these issues are important for the SDG framework,
Canada’s inputs tend to reflect its priorities for developing countries rather
than its priorities for realising sustainable development at home, such as
addressing the situation of Aboriginal peoples and reducing greenhouse
gas emissions. Given the universal nature of the framework, there is a
need to move beyond the development perspective to ensure that national
priorities also inform the global agenda. This is important for ensuring that
the post-2015 agenda is relevant for high-income countries, particularly
Canada, in addition to developing countries.
The SDGs, as they are currently articulated, capture gender equality
dimensions of sustainable development with a standalone goal as well as
cross-cutting targets under other candidate goal areas. Canada should
continue to support this approach to integrating gender equality into the
SDGs as a means to ensure due attention to this issue both at home and
abroad. While the SDGs emphasise social inclusion, there is no specific
goal or target for indigenous peoples. The well-being of Aboriginal peoples
is cross-cutting for many of the candidate SDGs in Canada. This suggests
scope for a potential “made in Canada” goal that aims to spur efforts to
realise better outcomes for Canada’s Aboriginal communities.
Key Findings
The enabling
environment for civil
society advocacy has
become increasingly
closed due to funding
cuts and stricter
regulations on the
political activities that
charitable organisations
can undertake.
Implications for
Canada
The federal government’s
approach to the SDGs
should move beyond a
development-focused
perspective.
Application of the SDGs in
Canada requires special
attention to Aboriginal
issues beyond what is
currently outlined in the
proposed SDGs.
Global minimum standards
may serve as an important
guide for Canada’s post-
2015 international
development cooperation
priorities.

11
The realisation of global minimum standards will require significant
resources. For example, ensuring that no person is living on less than
US$1.25 (purchasing power parity) per day will require domestic and
international resources to make progress in many countries. Global
minimum standards will likely play an important role in galvanising
international efforts for key sustainable development challenges. For
Canada, global minimum standards could serve as a useful guide for
future development cooperation priorities.
Different levels of government and non-state actors have made
significant efforts to identify and address Canada’s sustainable
development challenges. A good basis exists for establishing Canada’s
SDG roadmap. However, a key challenge is bringing these efforts
together in a national plan, particularly for certain goal areas such as
poverty, environment, and energy and infrastructure, where less
consensus exists between governments at the federal and
provincial/territorial levels on the nature of challenges and their solutions.
This issue is exacerbated by the unique division of responsibilities across
federal and provincial/territorial jurisdictions in Canada, though
coordination mechanisms exist between and across different levels of
government.
Canada will need to negotiate a set of national priorities that balances
perspectives between various levels of government and creates space
for provinces, territories and municipalities to build on ongoing efforts.
Greater consultation on the post-2015 agenda is needed. Such efforts
could inform Canada’s position in the SDG negotiations and increase
buy-in on the framework across government departments and levels of
government, which should aid in the implementation of the SDG agenda.
While the Department of Foreign Affairs, Trade and Development
Canada will likely play a key role in reporting on Canada’s
implementation of the SDGs to the United Nations, Statistics Canada will
have a central role to play in the collection and coordination of data for
monitoring progress. This is unsurprising given the highly centralised
nature of Canada’s statistical system. A significant proportion of the data
needed to monitor the SDGs is collected by Statistics Canada,
particularly in the areas of poverty, education, employment and
governance. While Statistics Canada also collects data on the
environment, energy and infrastructure, and global partnership, other
agencies and departments will also play a role in data collection for these
goal areas, building on existing data collection.
Implications for
Canada
Ongoing efforts on
sustainable development
in Canada provide a
roadmap for SDG
implementation.
SDG implementation has
the potential to harness
and build off of existing
policies and coordination
mechanisms across
jurisdictions.
The federal government
should consult more
broadly on the SDGs with
Canadian stakeholders,
including sub-national
governments, the private
sector and civil society.
Statistics Canada will
have a central role to play
in the collection and
coordination of data for
monitoring progress
against the SDGs.

12
Most indicators for measuring progress on post-2015 examined in this
study are currently available or can be made readily available relatively
easily. However, additional efforts will be needed to calculate and report
on certain indicators and collect additional information, particularly in the
areas where data gaps are greatest.
There is room to improve data providers’ consultation with data users.
Statistics Canada is already taking a number of steps to this effect. There
is significant room to improve the data quality of other departments that
provide data. The adoption of Statistics Canada’s policies and procedures
related to the preparation and presentation of metadata, including
reporting on quality of data sources, errors and revisions, would greatly
improve the quality of data on the environment, energy and infrastructure,
governance and global partnership, goal areas that have a paucity of data.
Efforts are needed to preserve the excellence of Canada’s statistical
system. Statistics Canada needs to be provided with the necessary
financial and human resources to improve on and continue to provide
good quality data to inform decision making. This is especially important
given the heightened role that Statistics Canada will likely play in
supporting monitoring of and reporting on the post-2015 framework.
There is no question that inclusivity is an important part of the post-2015
agenda. Significant efforts have been made to ensure that all stakeholders
– citizens, civil society, various levels of government, and the private
sector – are consulted on the new agenda. Furthermore, non-state actors
are seen to be playing a critical role in holding governments to account on
their implementation of the SDGs at the national level. In its adoption of
the SDGs, Canada should ensure that all domestic stakeholders
participate in the identification of national priorities. Efforts are needed to
establish an effective enabling environment for civil society organisations
to provide input on the SDG agenda, carry out independent research and
advocacy efforts related to the SDGs, and play a critical role in holding
government to account.
Implications for
Canada
Efforts will be needed to
improve data availability
for goals relating to
governance, the
environment, and energy
and infrastructure.
Efforts are needed to
improve the quality of
data collected by
departments, agencies
and ministries across
Canada. Adoption of
Statistics Canada data
quality standards across
departments and
agencies would greatly
improve this.
Statistics Canada should
be provided with the
necessary financial and
human resources to
improve on and continue
providing good quality
data.
An enabling environment
for civil society to engage
on the SDG framework
and hold government to
account should be
established.

13
Implications for the Sustainable Development Framework
A key question regarding the SDG framework is how it can allow country
differentiation under a universal set of SDGs. This study finds that the
SDG framework covers Canadian sustainable development challenges.
However, targets and corresponding indicators may need to be adjusted
to ensure relevance in high-income countries. The use of a global set of
targets and indicators, coupled with national targets and indicators that
represent country priorities, may offer a concrete way forward that
ensures the universal framework resonates across countries with
different levels of development and priorities.
While the SDG framework may resonate in high-income countries, a key
challenge will be getting domestic stakeholders engaged. The Canada
case study reveals a need to move the domestic conversation beyond
the federal government. Ensuring that the universal framework resonates
across countries with different levels of development requires input from
countries based on their domestic experiences. Furthermore, lack of
engagement on the SDGs may represent a potential missed opportunity
for domestic constituencies to spur action on sustainable development by
using the SDGs to support existing drivers of change. Finally, the SDGs
may also serve as an opportunity to connect domestic and global
constituencies on issues related to sustainable development, affording
greater opportunities for shared actions and lesson sharing.
It is clear that many policies and strategies that address key elements of
the post-2015 agenda exist across different levels of government. As
countries move toward national implementation of the SDG framework,
the SDGs should leverage existing plans and initiatives and build on past
successes. Ensuring that the SDG framework allows country
differentiation will be important in this context.
The Canada case study reveals that global minimum standards may not
be particularly relevant for high-income countries. However, they will
likely play a critical role in galvanising efforts to address key global
challenges. Global minimum standards could serve as a roadmap for
international development cooperation efforts and activities carried out
under the global partnership for sustainable development.
Historically, commitments related to global partnership have been
measured at the global level. Moving forward, post-2015 presents an
opportunity for measuring commitments to global partnership at the
country level, as the Canada case study reveals. Such an approach
could strengthen global monitoring and accountability by tracking
countries’ individual contributions.
Data challenges for measuring progress on the SDG framework will be
less significant for high-income countries. Countries with robust statistical
systems could support other countries to monitor implementation of the
framework through lesson sharing and targeted capacity development.
Implications for
the SDG
Framework
A universal set of SDGs
that allows differentiation
can work across
countries with different
levels of development
and priorities.
A key challenge will be
getting domestic
stakeholders engaged.
SDG implementation
should support and
enhance existing
sustainable development
activities.
Global minimum
standards may serve as a
valuable guide for
international cooperation
efforts.
Contributions to global
partnership can be
measured at the country
level.
High-income countries
could play a critical role
in supporting SDG
monitoring.

14
Introduction
Current Context
In 2015, governments will negotiate a set of Sustainable Development Goals (SDGs) as part of their
commitments from the Rio+20 United Nations (UN) Conference on Sustainable Development in 2012.1
The SDGs will replace the Millennium Development Goals (MDGs), which are set to expire in 2015, with a
broad sustainable development agenda underpinned by a framework of goals, targets and indicators for
2030. Unlike the MDGs, the “post-2015” sustainable development agenda is planned to be universal,
which means that it will apply to all countries, not just developing ones. Countries are also set to have
space to determine their own sustainable development targets and corresponding indicators by which
they measure progress (Box 1). In this context, a key concern has been ensuring progress within all
sectors of society to “leave no one behind.” To support this principle, a “data revolution” has been called
for to enable governments and policy-makers to better track sustainable development progress and equip
people with the information they need to hold government to account (Box 2).
Box 1. Universal post-2015 Sustainable Development Goals
In 2012, governments agreed to establish a set of Sustainable Development Goals at the Rio+20 UN
Conference on Sustainable Development.2 At the same time, the 2015 target date of the MDGs is
approaching, with deliberations and negotiations intensifying on what the successor framework – the
post-2015 agenda – should be. There is broad consensus that the post-2015 agenda and the SDGs
should be one and the same and include goals, targets and indicators, as is the case with the MDGs.
The architecture that frames the post-2015 agenda will be considerably different from the MDGs in that it
will apply to all countries. While the framework will likely also give countries space to determine their own
sustainable development targets and corresponding indicators by which they measure progress at the
national level, the question of how the universal framework can and will be applied across low-, middle-
and high-income countries has been a topic of much concern.
The universal SDGs represent a paradigm shift from previous global development frameworks that
typically identified goals to be achieved in developing countries, with developed countries playing a
supportive role, particularly in terms of contributing finance. While developed countries are expected to
continue playing a supportive role with the post-2015 agenda, they will be also required to take actions to
address their own sustainable development challenges.
As countries have moved forward on the post-2015 agenda, a number of questions have arisen. For
example, how will the SDGs be effectively applied across countries at different stages of development?
How can a universal agenda be made country-specific? Given existing challenges to obtaining good
quality data throughout the developing world and given that the SDGs will cover more priority areas than
the MDGs, such as sustainable production and consumption and issues related to peace and security,
what are the key data gaps for monitoring progress on the SDGs? To address these questions, the Post-
2015 Data Test initiative was launched. Developed by the Centre for Policy Dialogue (CPD)3 and Carleton
1 See http://sustainabledevelopment.un.org/owg.html for more information on the preparatory process for the negotiations in 2015. 2 See http://www.uncsd2012.org for more information on the conference’s outcomes. 3 See www.cpd.org.bd for more information.

15
University’s Norman Paterson School of International Affairs (NPSIA),4 in association with Southern Voice
on the Post-MDG International Development Goals (Southern Voice),5 the Post-2015 Data Test aims to
road-test a number of potential SDGs across low-, middle- and high-income countries.6 Under the
initiative, research teams in four low-income countries, Bangladesh, Senegal, Sierra Leone and Tanzania,
two middle-income countries, Peru and Turkey, and one high-income country, Canada, examined
national-level priorities and measurement challenges for a number of potential SDG areas including
poverty, education, employment and inclusive growth, energy and infrastructure, environmental
sustainability, governance, and global partnership for sustainable development.
Box 2. What is the data revolution?
In its May 2013 report to the UN Secretary General, the High-Level Panel of Eminent Persons on the
Post-2015 Development Agenda (HLP) called for a “data revolution” to support the monitoring and
implementation of the post-2015 agenda.7 It argued that a data revolution should promote the integration
of statistics into public and private decision making and support efforts to build trust between societies
and states through transparency and accountability. The HLP called for: improvements in the quality,
availability and timeliness of data, including disaggregated data; greater data transparency and
accessibility; and harnessing diverse sources of knowledge and data, such as mobile technology, crowd
sourcing and other “real-time” initiatives to complement official statistics. Furthermore, it recognised that a
data revolution must also enhance government transparency and empower citizens to demand more from
their states (HLP 2013).
The call for a data revolution has been met with enthusiasm not only in UN and official circles, but also
citizen consultations. In August 2014, the UN Secretary-General established the Independent Expert
Advisory Group on a Data Revolution for Sustainable Development (IEAG) to inform efforts relating to the
data revolution going forward. In its November 2014 report,8 the IEAG called for: (i) the establishment of
global principles and standards on data, (ii) the creation of mechanisms to share technology and
innovations through a “Network of Data Innovation Networks,” (iii) new resources for capacity
development, (iv) leadership to coordinate and mobilise efforts through a UN-led “Global Partnerships for
Sustainable Development Data” and (v) the establishment of a “SDGs data lab” to support the
development of an initial set of SDG indicators (IEAG 2014).
This report presents findings from the Canada case study. Following the introduction, the report provides
an overview of national-level priorities for Canada across the goal areas examined in the study. This is
followed by an examination of available data for measuring progress on the post-2015 agenda. To
conclude, the report provides an overview of the key implications from the Canada case study for the
post-2015 framework and the data revolution. The remainder of this introduction provides a brief overview
of Canada’s involvement in the MDGs, the goal framework that precedes the SDGs and Canada’s
ongoing involvement in the post-2015 process. Information on the research process and methodology is
available in Annex 1.
4 Originally undertaken by the North-South Institute, an Ottawa-based international development think tank, the initiative was moved to NPSIA in October 2014 following the announcement that the North-South Institute would be closing. 5 Southern Voice on the Post-MDG International Development Goals is a network of 48 Southern think tanks from Africa, Latin America and South Asia. See www.southernvoice-postmdg.org for more information. 6 See www.post2015datatest.com for information on the initiative, including countries and research partners involved, summary of the research objectives, and details on the methodology for the country studies. 7 See http://www.post2015hlp.org for more information. 8 See IEAG (2014) for more information.

16
Canada, MDGs and Well-being
Canada has taken a number of measures to support the realisation of the MDGs in partner countries
(CIDA 2010). More recently, the Canadian government has championed international efforts to advance
maternal, newborn and child health – represented by MDGs 4 (reduce child mortality) and 5 (improve
maternal health) (Harper 2014). In this context, Canada plays a supportive role – as a donor country – in
realising the MDGs in other countries.
While the MDGs are not relevant as goals for Canada outside development cooperation efforts, much
work that has been done to examine issues related to well-being has shown significant progress. At the
international level, Canada tends to rank well against the Organisation for Economic Co-operation and
Development’s (OECD) Better Life Index (OECD 2013c), which examines indicators of well-being such as
housing, education, income and life satisfaction and places Canada fifth overall compared to 36 other
countries when the 12 indicators are equally weighted. The UN Development Programme’s 2014 Human
Development Index, which examines indicators related to life expectancy, schooling and gross national
income (GNI) per capita,9 ranked Canada eighth out of 187 countries – in other words, very high in
human development (UNDP 2014). Canada’s rank is lower in the inequality-adjusted Human
Development Index and Gender Inequality Index, ranking 10th and 23rd, respectively, out of 187
countries.
In Canada, a number of government initiatives have looked at well-being from the national level to more
local levels. Employment and Social Development Canada (2014) compiles and reports on a set of
Indicators of Well-being in Canada for 10 areas.10 Aboriginal Affairs and Northern Development Canada
has also established a Community Well-Being Index that examines well-being across areas such as
education, labour force activity, income and housing. Drawing on census data, the index is used to
compare First Nations and Inuit communities with other Canadian communities over time (AANDC
2012b).
Outside government, the Canadian Index of Wellbeing, which is based at the University of Waterloo,
measures well-being in terms of community vitality, democratic engagement, education, environment,
health, leisure and culture, living standards, and time use (Michalos et al. 2011). A recent report noted
that while Canada’s gross domestic product (GDP) grew by a robust rate of 28.9 percent from 1994 to
2010, this growth did not translate into significant gains in terms of well-being and quality of life,
particularly in the areas of environment,11 and leisure and culture12 (Canadian Index of Wellbeing 2012).
The Centre for the Study of Living Standards prepares an Index of Economic Well-being that captures
consumption flows, wealth stocks, equality and economic security (Osberg and Sharpe 2011). Osberg
and Sharpe (2011) noted that over the 1981–2010 period Canadians experienced gains in terms of
consumption and wealth but saw declines in terms of equality and economic security. In addition to these
efforts, a number of initiatives have also sprung up to measure progress at the community level.13
9 Based on data as of November 2013. 10 These include work, learning, financial security, family life, housing, social participation, leisure, health, security and the environment. 11 Includes indicators related to pollution, energy use, mineral reserves and biodiversity. 12 Includes indicators related to participation and time spent in leisure, arts and culture activities. 13 See, for example, Guelph Wellbeing (2014), Newfoundland and Labrador (2014) and Cantin, Rogers and Burdett (2008).

17
Canadian Engagement on Post-2015
The Canadian government has been participating in the preparations for UN negotiations in 2015, largely
through Foreign Affairs, Trade and Development Canada (DFATD). Canada is championing the poorest
and most vulnerable as a key focus for the post-2015 agenda as well as maternal, newborn and child
health, job creation and economic growth, and strengthening results and accountability (Rochon 2014).
The government has supported post-2015 consultation processes through the UN, notably on education
and data and accountability.14 In Canada, DFATD is coordinating with other government departments and
agencies including Environment Canada and Statistics Canada.
In June 2014, the Canadian government endorsed the Brussels G7 Summit Declaration, which included a
commitment to an ambitious universal post-2015 agenda (G7 2014). Nevertheless, government inputs to
date typically focus on MDG-like issues (maternal, newborn and child health, for example) rather than
concerns related to sustainable development in Canada. Further, the conversation in the country on the
post-2015 agenda does not include actors other than the usual suspects in the development community,
namely development-oriented civil society organisations (CSOs), academics and DFATD.
Endorsement of the universality dimension of the post-2015 agenda would mean confronting Canada’s
own unique sustainable development challenges, including addressing the needs of marginalised
communities, such as Aboriginal peoples, strengthening commitments and actions to address climate
change and environmental sustainability, improving energy efficiency and reducing dependency on non-
renewable energy, and facilitating the creation of decent, productive employment. In the context of
Canadian federalism, such confrontation will likely require significant consultations across levels of
government to ensure smooth implementation (Kindornay 2014a). In this context, this report seeks to
make a valuable contribution by unpacking what a post-2015 agenda might look like for Canada, how it
could be measured, and where challenges and opportunities for realising progress lay.
14 See www.worldwewant.org for more information on the UN post-2015 consultation processes. See Coté (2014) for a more complete overview of Canada’s international engagement on post-2015.

18
Post-2015 Priorities for Canada
Overview
The research initiative included the identification of national-level targets and indicators for a selection of
candidate SDGs.15 Reflecting a mix of MDG-like goal areas and new issues that are likely to be covered
by the SDG framework (Box 3), the initiative included the following goal areas:
poverty energy and infrastructure
employment and inclusive growth governance
education environmental sustainability and disaster resilience
global partnership for sustainable development
Based on the methodology developed for this initiative by CPD, NPSIA and Southern Voice, researchers
examined 5–6 targets and approximately 8–12 indicators for each candidate goal. CPD, NPSIA and
Southern Voice pre-selected some targets and indicators to be examined in all countries under each
selected goal area to allow for comparison on data availability across country case studies. Within this set
of pre-selected targets and indicators, they also included one target reflecting a potential global minimum
standard (see Box 3) for each goal area. These targets and indicators are referred to as “global”
throughout the study. All other targets and indicators were chosen in consultation with stakeholders.
Further, to ensure consistency, global targets and indicators make use of international definitions,
typically from UN agencies, where possible. Within the “national” set of targets and indicators, research
teams were instructed to ensure that at least one target (and corresponding indicator[s]) connects to
another theme to support intersectionality between goals.
Selecting National Targets and Indicators
The Methodology and Implementation Guide outlines a number of important criteria for selecting national-
level targets and indicators. A key selection criterion is ensuring the list reflects the sustainable
development challenges and priorities of each country rather than being based on data availability
(Bhattacharya, Higgins and Kindornay 2014, 26–29). Following a discussion on the merits of different
types of targets and indicators, the guide notes that targets should be: relevant through a clear
connection to the goal area and people’s priorities identified through consultations, likely to impact
sustainable development, understandable and easy to communicate, ambitious yet realistic, measurable,
consistent with international law, valuable in realising other targets across goal areas, and focused on
equity and equality where possible. The guide states the importance of ensuring indicators are relevant to
targets, provide a measure of progress that supports policymaking, are backed by an existing
methodology or one that can be easily developed, allow for meaningful trend analysis and disaggregation,
and are easy to understand. While recognising the importance of outcome-based indicators, such as
forest coverage, researchers were encouraged to go beyond them to make use of structural and process
indicators, such as proportion of forest area classified as protected. In line with the SDGs timeline
currently being discussed, all targets listed in the report assume a 2030 deadline.
15 See Bhattacharya, Higgins and Kindornay (2014) for further details on how candidate goals were selected and the key priority areas included under each goal.

19
Box 3. Sustainable development post-2015
Over two decades ago, the World Commission on Environment and Development (1987), better known
as the Brundtland Commission, first defined sustainable development in its report Our Common Future as
a process of development that “meets the needs of the present without compromising the ability of future
generations to meet their own needs.” In 1992, the UN Conference on Environment and Development
held in Rio de Janeiro led to the creation of Agenda 21, a programme of action aimed to improve
outcomes for the economic, social and environmental pillars of sustainable development.
Building on this history, the Open Working Group on Sustainable Development Goals (OWG) – a 30-
member inter-governmental committee of the UN General Assembly tasked with preparing a proposal for
the SDGs following the 2012 Rio+20 conference – released a set of 17 candidate SDGs, with 169
corresponding indicators, in July 2014. The proposed SDGs capture the environmental, social and
economic pillars of sustainable development and include provisions on a wide range of issues such as
environmental conservation, climate change, food security, gender equality and social inclusion, effective
institutions and rule of law, employment, infrastructure, and industrialisation, inter alia.16
In addition, the proposed SDGs also include a number of global minimum standards. As noted above, the
SDGs are set to provide countries with the space to establish national targets. However, the idea behind
global minimum standards, as proposed by the HLP, is that they should apply to all individuals or
countries. For example, ending extreme poverty as measured by US$1.25 (purchasing power parity
[PPP]) per day is a global minimum standard that seeks to ensure no person globally is living under the
international poverty line by 2030.
Using these guidelines as a reference point, national targets and indicators were selected across the goal
areas based on a literature review of current federal, provincial and territorial (FPT) policies and feedback
received from stakeholders. Key informant interviews were also used to validate the selected targets and
indicators, which were sent to interviewees in advance. Overall, national targets and indicators reflect a
balance of ongoing national priority areas and trends in international discussions on the SDGs. This
means that, in some instances, a target and corresponding indicator have been included because they
reflect an important area in international discussions on the SDGs rather than a priority of the Canadian
government. However, as a universal agenda, researchers assume that Canada’s adoption of the SDGs
will mean the inclusion of international priorities in domestic policies. An example of this is the target
supporting statistical capacity building in developing countries under “Establish a global partnership for
sustainable development.” While this is not a priority of Canada’s aid programme per se, it is a priority at
the international level.
The research team did not include specific numerical targets across the goal areas. For example, under
poverty, targets include “end extreme income poverty,” which is an absolute target (i.e., have no person
living under a particular poverty line) as well as “reduce poverty” and “address chronic poverty.” It was
understood that the identification of plausible numerical targets for Canada (such as “reduce poverty by x
%”) was outside the scope of what could be accomplished within the timeline and resources for the
initiative. Such an endeavour would have required substantial consultations across different levels of
government and sectors to ensure targets were both ambitious and realistic. Identification of numerical
16 See OWG (2014) for the full proposal.

20
targets is a logical next step arising from the completion of this research, particularly since Canada will
likely need to identify national-level targets for post-2015 implementation.
Presentation of Candidate SDGs
The sections that follow present the key national priorities identified by this study. For each SDG area, the
report presents information on the current status as well as previous and ongoing efforts. The national
priority areas selected for the case study are then discussed, accompanied by a table illustrating the
global, national and cross-cutting targets and indicators. Annex 2 provides a master table of all targets
and indicators selected for this study, with corresponding definitions included. While the global, national
and cross-cutting targets and indicators are presented separately, in some instances targets that were
pre-selected by CPD,NPSIA and Southern Voice were also used to capture national-level priorities, with
the addition of nationally relevant indicators. As such, some targets are repeated in the tables below.
Following the presentation of key national priorities, key sources for measuring progress against the
indicators in the study are presented. While it is clear that Canada has excellent data quality,17 data gaps
are likely to present some challenges to monitoring progress on the post-2015 agenda. For each goal
area, researchers explore possibilities for “quick wins”– areas where small changes to surveys, including
additional investments, could improve post-2015 monitoring – and challenges that are likely to require
more significant efforts. Following from the discussion, the researchers identify best sources18 for each
goal area, presented in the boxes throughout. These are followed by a discussion of opportunities and
challenges to realising progress in the goal area.
Feedback on Global Targets and Indicators
A number of global targets and indicators do not apply to the Canadian context. For example, the
indicator for South-South cooperation is redundant since Canada does not provide assistance in this
form. Under the goal “End poverty” and target “End extreme income poverty,” the indicator “proportion of
the population living under US$1.25 (PPP) per day” does not make sense for Canada. Similarly, with
respect to education, primary education is essentially universal, which means monitoring the proportion of
boys and girls who complete elementary school is also somewhat redundant.
Nevertheless, while some of the global indicators are problematic, the targets to which they correspond
were typically deemed relevant for Canada. For example, Canada should focus on ending extreme
poverty, yet how this is defined in the Canadian context will differ from the international definition.
Similarly, ensuring all Canadians have access to good-quality early childhood, primary and secondary
education is important though the metrics for Canada would likely focus more on access to child care,
particular learning outcomes and secondary school completion.
Feedback on the Potential Goal Areas for Canada
At the April 2014 inception workshop19 and in comments received throughout the research process, some
stakeholders raised the question of whether specific goals on gender equality and improving outcomes for
Aboriginal peoples should be added to the Canada case study. There is very little question that a
17The section “Measuring Progress on Post-2015 in Canada” provides a full discussion on the current state of Canada’s statistical system and an aggregate review of data availability and quality for measuring progress on post-2015 across goal areas. However, to provide a full picture of each goal area, information on key data sources and researchers’ suggested data strategy for post-2015 are presented with each goal discussed below. 18 All sources are from Statistics Canada unless otherwise stated. 19 See Kindornay (2014b) for the results of the inception workshop.

21
standalone goal on gender equality will be included in the SDG framework. The selection of national
targets and indicators, as well as corresponding trends in gender equality in Canada, clearly demonstrate
the need for special attention. As one expert on gender equality in Canada put it, “in no community in
Canada do women have equal access to work, wealth and personal security,” and then pointed out that it
is insufficient to simply add “and women” to specific targets. With respect to Canada’s indigenous
peoples, there is widespread recognition that efforts are needed to address conditions of inequality and
marginalisation across goal areas. No standalone goal for indigenous peoples is currently being debated
at the international level and very few references are made to indigenous peoples across the proposed
SDG framework.
While suggestions to include important standalone goals are welcome, for the purposes of the Post-2015
Data Test, research teams agreed to examine the seven goal areas outlined above and keep them
consistent to allow comparisons across case studies. As such, the suggested standalone goals were not
added to the Canada case study. Nevertheless, the implementation of the post-2015 agenda in Canada
will likely call for robust efforts to improve gender equality outcomes and the potential addition of a “made-
in-Canada” goal based on consultations with Aboriginal communities for improving outcomes for
Aboriginal peoples.

22
End Poverty
Background on Measuring Poverty in Canada
In general, measures of poverty can be defined in either absolute terms –
i.e., a measure that is determined by examining the accessibility of
resources necessary for survival – or relative terms, i.e., a measure that
takes into account social well-being by examining income, for example,
with respect to some average standard of living within a given region or
community. Though there is no official, government-mandated measure
of poverty in Canada, both Statistics Canada and Employment and Social
Development Canada (formerly Human Resources and Skills
Development Canada) have developed measures of low-income that
serve as proxies for poverty thresholds.
Currently, three measures of low-income are used as general indicators
of poverty in Canada: the low income cut-offs (LICOs), low income
measure (LIM) and Market Basket Measure (MBM). LICOs – Statistics
Canada’s most widely used measure of low income – and the LIM have
functioned as the primary indicators of poverty. As an absolute measure,
LICOs are defined as an income threshold at which a family spends at
minimum 20 percentage points more of its income on basic necessities
than the average family. The LIM, a relative measure used more often for
international comparison, is defined as an established percentage (50 per
cent) of median household income and categorises people as low-
income if they make below 50 per cent of the adjusted household median
income.
The underlying difference between the LIM and LICOs is best understood
in terms of the way they are affected by increases and decreases in
income levels. As Andrews (2012) notes, if, between one year and the
next, the incomes of every citizen were to double, the LIM, as a relative
measure, would remain unchanged as the distribution of income remains
unchanged. The LICOs, however, define an absolute poverty line.
Relative to this unchanged threshold, an increase in the overall income
level would reduce the poverty rate measured by LICOs. Finally, as an
alternate measure of absolute poverty, the MBM was developed in 2003
by Human Resources and Skills Development Canada. The MBM is a
fixed-weight indicator that calculates the necessary amount of income
needed by a family to purchase a specific basket of goods corresponding
to a basic standard of living (Statistics Canada 2013c).
Unsurprisingly, the different methods of estimating low income result in
both rates and trends that differ depending on which measure is
employed. As is stands, LICOs were the first measure to be introduced
and thus are used most frequently in trend analysis and comparison.
Section Highlights
National Priorities
Reduce overall poverty
Address poverty for
Aboriginals, people with
disabilities, female-headed
households, recent
immigrants and the
homeless
Key Data Sources
Survey of Labour and
Income Dynamics/Canadian
Income Survey
Opportunities
High government capacity to
adopt a variety of
interventions
Challenges
No national/official definition
of poverty
Persistence of poverty
among specific groups
despite existence of social
assistance programmes
Lack of national plan to
address poverty

23
Current Status Based on LICO after-tax estimates, the overall poverty rate in Canada was at 8.8 percent for the year
2011, the most recent year for which estimates are available (Statistics Canada 2013m). While LICOs
show a steady decline in the overall incidence of poverty – the 2011 rate is currently the lowest level on
record – poverty rates estimated by the LIM indicate a notably less pronounced decline. In fact, whereas
the LICO level fell from 12.5 percent in 2000 to 8.8 percent in 2011, the LIM level only fell from 12.8
percent to 12.6 percent during the same period (Statistics Canada 2013c).20 According to the LIM,
Canada ranks relatively poorly in comparison to other OECD countries, maintaining the 14th highest
poverty rate out of 34 countries.
More concerning, however, is the striking concentration of poverty in certain groups within the Canadian
population. Aboriginal peoples, in particular Aboriginal women and children, face rates of poverty and
deep poverty that are notably higher than general population averages. The 2011 National Household
Survey (NHS), which measured low income on the LIM after-tax basis, estimated that in 2010,
approximately 25.3 percent of Aboriginal peoples were categorised as low-income, in comparison to 14.9
percent of Canadians on average. An estimated 30.6 per cent of Aboriginal children fell into low-income
brackets, as opposed to only 17.3 percent of Canadian children on average (Statistics Canada 2013f).
Recent immigrants, lone-parent families (primarily female lone parents), people with disabilities and
unattached (single) individuals are among other groups that continue to face consistently high levels of
poverty.
Previous and Ongoing Efforts
Poverty reduction efforts at the federal level have come most often in the form of income assistance
programmes that primarily target low-income families with children and seniors. Notable examples of
these include the Canada child tax benefit, the Old Age Security pension and the Guaranteed Income
Supplement, the latter of which provides low-income Old Age Security recipients with a monthly non-
taxable benefit. A number of programmes also exist that provide income assistance to low-income recent
immigrants and people with disabilities, such as the Immigration Loans Program and the Canadian
Pension Plan Disability Benefit, respectively. For Canadians in general, employment insurance benefits,
the Working Income Tax Benefit and provincial minimum wage laws are among several tools designed to
both reduce and prevent the occurrence of low-income situations.
Though the income assistance programmes provided by the federal government demonstrate a
commitment to poverty reduction in a sense, there is no official federal poverty reduction plan as of 2014.
In the past, a number of initiatives have been launched based on previous poverty reduction goals set at
the national level – such as Campaign 2000, a national, regional and local movement focused on
promoting the House of Commons 1989 resolution to end child poverty by the year 2000 – but the goals
have not been met (Campaign 2000 2012).
In recent years, the extent of the federal government’s role in poverty reduction – defined in terms of its
efforts in comparison to those of other national governments as well as the provinces – has been called
into question by a number of anti-poverty campaigns, namely Make Poverty History and Campaign 2000.
20 According to the Canadian Income Survey (CIS), which replaced the Survey of Labour and Income Dynamics (SLID) for reference year 2012, the LIM after-tax rate was 13.8 percent in 2012. Due to the use of different methodologies, statistics from the CIS and the SLID cannot be compared. See http://www.statcan.gc.ca/daily-quotidien/141210/dq141210a-eng.htm for more details.

24
In 2008, as a result of this growing interest, the Standing Committee on Human Resources, Social
Development and the Status of Persons with Disabilities conducted a study on the federal government’s
involvement in attempting to reduce poverty levels. The general consensus among department officials
interviewed by committee members was that in order to reduce and eliminate (extreme) poverty in
Canada, a comprehensive and multi-faceted approach in which the federal government plays an active
role is needed (Hoeppner 2010).
At the provincial level, more concrete action has been taken in order to reduce poverty levels. To date,
eight provinces (exceptions are British Columbia and Saskatchewan) and all three territories have poverty
reduction strategies in place or are in the process of developing a plan (Canada Without Poverty 2013b).
Some provinces, including Manitoba, New Brunswick, Ontario and Quebec, have legislation in place that
requires the provincial government to prepare and report on poverty reduction plans. Provincial and
territorial plans tend to include a number of priority areas and targets (see Box 4).
Box 4. Key issues addressed by poverty reduction strategies for eight provinces and three
territories21
Sources:22 Newfoundland and Labrador (2006); Ontario (2008); New Brunswick (2009; 2014); Nova Scotia (2009); Québec (2010);
Manitoba (2012); Prince Edward Island (2012); Alberta (2013); Nunavut (2011); Yukon (2012); Northwest Territories (2014).
All poverty reduction plans take a multi-dimensional approach to poverty that includes issues like housing,
income and social assistance, employment, education, social inclusion and addressing the needs of
vulnerable groups. Examples of included targets are a 25 percent reduction in income poverty and a 50
21 Includes priorities identified as key pillars of the strategies and sub-components within pillars. For example, affordable housing is sometimes presented as a sub-component of a broad priority area such as meeting the needs of vulnerable groups. 22 Information for Alberta and Nunavut is based on background documents since they are in the process of developing poverty reduction strategies.
Provincial and territorial poverty
reduction strategies
Employment (all)
Education, including early
childhood development
(all)
Affordable housing (all)Health issues,
including mental health
(all)
Access
to
justice
(3)
Food
security
(6)
Addressing
needs of the
vulnerable
(all)
Strengthening
communities
(8)
Improving
coordination
and
collaboration
(7)

25
percent reduction in deep income poverty by the year 2015 (New Brunswick 2009; 2014) and the
reduction of the amount of children living in poverty by 25 percent over a five-year period (Ontario 2008).
In almost all cases, the implementation of these plans has seen positive results. In Ontario, though below
the proposed “25-in-5” target, the child poverty rate, as measured by after-tax LICOs, decreased 9.2
percent (from 15.2 percent to 13.8 percent) between 2008 – the year the plan was put into action – and
2011, despite a recession. Newfoundland and Labrador, whose aim was to achieve the lowest overall
poverty rate among all provinces by 2014, achieved that goal by 2011. Between 2000 and 2011, the
poverty rate (based on LICO estimates) declined from 13.2 percent to 5.3 percent, a rate that was nearly
40 percent below the national rate of 8.8 percent (Statistics Canada 2013m). It is difficult, however, to
determine how much of a fall in the poverty rate can be attributed to government policy, given the role of
other factors, especially the macroeconomic environment. Furthermore, as noted by Canada Without
Poverty, a CSO dedicated to the elimination of poverty in Canada, CSOs continue to identify areas for
improvements across plans, particularly in terms of situating efforts within human rights frameworks.23
National Priorities for Ending Poverty
As part of the development of a national poverty reduction strategy, many Canadian anti-poverty groups
have listed several key poverty reduction priorities. Areas of focus highlighted by a majority of these
groups include: affordable and adequate housing – an issue that was brought to attention by the UN
Committee on Economic, Social and Cultural Rights in 2006 (Canada Without Poverty 2013a) –
increased support for the unemployed and a specific focus on reducing poverty among Aboriginal peoples
and immigrants (particularly recent immigrants). At the inception workshop, stakeholders argued that
there is a need for Canada to address poverty for specific groups – i.e., groups that have historically lived
in poverty and are less likely to move out of poverty – such as Aboriginal peoples, recent immigrants,24
female-lone parent families and people with disabilities. They also noted that there is a need to address
chronic poverty, as measured by the persistence of low income. Provincial and territorial poverty
reduction plans tend to target these groups where applicable.
In the most recent iteration of the SDG framework by the OWG, the goal “End poverty in all forms
everywhere” includes targets for income poverty (including the proportion of the population living below
the national poverty line), social protection, access to economic resources and the creation of pro-poor
and gender-sensitive policy frameworks to accelerate poverty reduction, inter alia (OWG 2014, 6).
In the OWG’s study, one global minimum standard was included for this goal area, namely “End extreme
income poverty” as defined by the proportion of the population living below US$1.25 (PPP) per day. This
indicator does not make sense for Canada, a high-income country. As a proxy, the study includes a
national-level target, using the proportion of individuals living on less thanUS$12.50 (PPP) per day, which
may be a more appropriate indicator for high-income countries.
The targets and indicators selected by the research team for Canada listed in Table 1 broadly reflect the
priorities above.25 A number of indicators track progress for specific groups in society according to the
LIM, which was selected for the study given that it measures relative poverty and is more internationally
comparable than LICOs. Two indicators also look at the proportion of the population living in poverty
according to the LIM and MBM.
23 See Canada Without Poverty (2013b) for annual reviews of provincial and territorial poverty reduction efforts. 24 Most recent immigrants move out of poverty as they integrate into the labour market. 25 A key exception is a target and indicator on housing (though homelessness is included). This omission is due to this goal area being understood more in terms of income poverty.

26
Table 1. End poverty: Targets and indicators
Target Indicator
Global
End extreme income poverty Proportion of population below US$1.25 (PPP) per day
Reduce poverty Proportion of population below US$2 (PPP) per day
Proportion of population living below national poverty line
Share of employed persons living below the nationally-defined poverty line
Reduce the proportion of people who suffer from hunger
Prevalence of child stunting in boys and girls under 5, %
National
End extreme income poverty Proportion of the population living below US$12.50 (PPP) per day
Reduce poverty Proportion of the population in low income according to the Market Basket Measure
Proportion of Aboriginal identity population living below national poverty line
Proportion of people with disabilities living below national poverty line
Proportion of female-lone parent households living below national poverty line
Proportion of recent immigrants living below national poverty line
Proportion of people who are homeless
Address chronic poverty Persistence of low income
Data on Poverty
Overall, Canada is in a good position to monitor progress on ending poverty (Box 5). Key sources
identified through the data mapping process include the Survey of Labour and Income Dynamics (SLID)
(replaced by the Canadian Income Survey [CIS] for reference year 2012), NHS and Annual Income
Estimates for Census Families and Individuals. Additional sources, namely the Longitudinal Immigrant
Database and Longitudinal Survey of Immigrants to Canada, which provide data on the proportion of
immigrants living below the national poverty line, were identified for national targets and indicators. Good
quality data are available, including disaggregated data for various groups and historical data.
Nevertheless, the issue of choosing a relevant measure of poverty for Canada is an important concern for
monitoring progress on the post-2015 agenda. No particular measure is used consistently across existing
provincial and territorial poverty reduction strategies, though LICOs appear most frequently. The LIM,
which was selected for this study given that it is most often used for making international comparisons,
has limitations, especially when addressing the issue of “ending” poverty. As a relative measure, low-
income rates generated by the LIM will be difficult (but not impossible) to reduce to zero.
Another issue, one that applies to all measures of low income published by Statistics Canada, is the delay
associated with the publication of income data. Typically, income data collected through the SLID is
available to data users a minimum of 18 months after the end of the reference period. As a result,
monitoring ongoing progress becomes difficult when data for the most recent year are unavailable. For
example, Ontario’s poverty reduction strategy that was launched in 2008 frequently undergoes review to
evaluate the relative effectiveness of its poverty reduction initiatives and highlight areas for improvement
(see Ontario 2013). In November 2014, the most recent income data that were available according to the
SLID were for 2011. Thus when reporting on progress in 2013, the Government of Ontario, which uses

27
the LIM as its primary indicator of poverty in its reports, could only make adjustments for changes in low
income witnessed between 2008 and 2011. This issue has also been noted by government officials in
Manitoba who face a similar challenge when reporting (Manitoba Family Services, personal
communication).
This challenge has been exacerbated by the shift from the SLID to the CIS for reference year 2012. In
December 2014, income data for 2012 was released according to the CIS. However, Statistics Canada
did not release an adjusted historical dataset, which means that data from the 2012 CIS cannot be
compared with previous data. Statistics Canada has promised to release revised historical statistics by
December 2015. Statistics from the 2013 CIS will be released in July 2015 (Statistics Canada 2014g).
Another challenge to measuring progress within the Canadian context is the limited availability of data on
homelessness – an issue that is pervasive in Canadian society. To date, only a handful of studies at
various sub-national levels have been conducted to understand this problem. The most recent study by
the Canadian Homelessness Research Network (Gaetz et al. 2013) is the only national-level assessment
that provides estimates regarding homelessness. Statistics Canada also provides some data from the
census, but the information is mainly related to shelter use and captures only one data point, which
reduces opportunities to monitor historical trends. Moving forward, these data gaps need to be addressed
to capture progress on the SDGs in Canada.
It should be noted that some challenges may exist regarding quantifying the proportion of the Aboriginal
identity population living below the national poverty line. The poverty line is based on income level,
however defined by Statistics Canada, which does not adequately capture the income in kind that is
believed to occur in First Nations and Inuit communities.
Box 5. Data strategy: End poverty
Best data sources: Survey of Labour and Income Dynamics (SLID)/Canadian Income Survey (CIS)
Rationale: The SLID (replaced by the CIS in 2014 for reference year 2012) is a source for the bulk of
indicators under this goal area, both at global and national levels. The data are readily available online for
public use and various tabulations are easily accessible. The online data for low income is best captured
through the SLID, since Statistics Canada uses the revised LIM calculation method specifically for this
survey (Statistics Canada, personal communication). Finally, the SLID is particularly relevant for this
study because it is also used by Statistics Canada to compute OECD Income Distribution Data for
Canada (OECD 2012b).
Limitations: Despite the relatively good quality of the SLID data, the long data release period is an issue.
The SLID also uses a comparatively smaller sample survey than other possible sources, such as the
Annual Estimates for Census Families and Individuals (T1 Family File), and as a result has a narrow
geographic coverage. With the replacement of the SLID with the CIS as of reference year 2012, data
comparability has been impacted, which presents a challenge for analysis of trends. Finally, the SLID
does not capture data on indigenous peoples, which needs to be obtained from the NHS.

28
Opportunities for Ending Poverty
Significant Government Capacity to Adopt a Range of Interventions
Though Canada’s overall poverty rate, as measured by the LIM, is relatively high in comparison to similar
OECD countries (OECD 2014c), reducing poverty rates – and keeping them at consistently low levels – is
achievable. Over the course of the past three decades, Canada has been successful in reducing the
poverty rate of at least one group that had experienced disproportionately high levels of low income: the
elderly.
In 1980, Statistics Canada estimated that, based on LICO estimates, 21.4 per cent of the elderly
population (aged 65 and over) were living in poverty – 9.8 percentage points above the national rate.
However, by 2011, the situation had reversed itself. The proportion of low-income elderly had fallen to 5.2
percent, resting at 3.6 percentage points below the national rate. The Standing Committee on Human
Resources, Skills and Social Development and the Status of Persons with Disabilities attributed this
decline to both the maturation of the Canada Pension Plan and enhancement of the Old Age Security and
Guaranteed Income Supplement programmes (Hoeppner 2010). Income security programmes such as
those available to the elderly can be – and have been – used as a tool by the federal government to
prevent the onset of poverty, as well as to offer support to those who presently fall into low-income
categories. Despite the effectiveness of these programmes, however, many Canadian policy advocates
such as Citizens for Public Justice (2013) have noted that these programmes fall short when taken as the
sole approach to national poverty reduction.
Further developing some of these programmes, such as strengthening the Working Income Tax Benefit,
raising the Canada Child Tax Benefit and implementing a higher minimum wage, can be effective in
actively tackling poverty reduction (Citizens for Public Justice 2013). Implementing some form of a
“guaranteed liveable income” programme – such as a $12,00026 minimum guaranteed annual income per
person suggested by a Quebec government task force (Anderssen 2014) – has been highlighted as a
more extensive approach to nation-wide poverty reduction. Other recommendations have included:
increased federal investment in affordable housing projects, lowering child care costs and further
investing in the creation of new jobs. Regardless of the approach Canada chooses to adopt, the fact
remains that choices are unlimited. Unlike some countries seeking to reduce their poverty levels, such as
Mexico, Chile or Greece (Gatopoulos and Becatoros 2013), Canada is not bound by any strict financial or
political constraints.
Challenges for Ending Povery
Poverty Across Select Groups in the Population
Though poverty remains a widespread issue that affects a diverse range of Canadians, there are certain
groups within the population in which poverty is more concentrated and for whom attempting to actively
reduce poverty levels poses more of a challenge.
In general, the prevalence of extreme income poverty – defined in terms of living below US$12.50 per day
in high-income countries – is not a particularly large concern for Canada. For Canadians living at low- and
extremely low-income levels, aside from federal income assistance programmes, provinces and territories
26 All figures in the Canada case study are in Canadian dollars unless otherwise noted.

29
also provide support through social assistance programmes. The Ontario Ministry of Community and
Social Services, for example, provides assistance through Ontario Works, a programme that provides
financial and employment support for residents in immediate need of work and pay to cover food and
shelter costs (Ontario Ministry of Community and Social Services 2014). Manitoba’s Employment and
Income Assistance Program, Alberta’s Income Support programme and Prince Edward Island’s Social
Assistance Program all provide similar support to extremely low-income Canadians.
Perhaps the only significant challenge that Canada will face in terms of attempting to reduce extreme
income poverty is addressing the situations of the homeless. Unlike low-income data, Statistics Canada
does not publish monthly or annual information on the number of homeless people in Canada. Though
the agency does collect data on the number of people residing in shelters for census years, estimates of
homelessness based on shelter use neglect to include groups of homeless such as the unsheltered, the
provisionally accommodated,27 and turn-aways28 (Gaetz et al. 2013). As many social assistance
programmes require proof of identity, tax returns and asset information for eligibility, it is the unsheltered
– referring to the homeless people who do not use the shelter system or “street people” who are at risk of
sustaining extremely low levels of income.
Some municipal governments such as the City of Toronto have designed housing programmes that
directly target the unsheltered by providing them with permanent subsidised housing solutions (National
Alliance to End Homelessness 2008). As of 2008, the programme had successfully moved over 1,500
homeless people into housing units, increasing the likelihood that these low-income individuals will be
eligible for provincial financial support. However, a considerable number of the newly housed – about 13
per cent – are unable to maintain their residence (National Alliance to End Homelessness 2008). Among
these are the chronically homeless, many of whom suffer from substance abuse and mental health
issues.
Though low-income Aboriginal peoples, female lone-parent families and recent immigrants receive both
financial support and benefits, there remains the issue of addressing why susceptibility to poverty is
greater in these groups than among the rest of the population. Aboriginal peoples, for example, have
almost always been among the poorest in Canada. While efforts have been taken to bridge the persistent
gap in the standards of living between Aboriginal communities and the non-Aboriginal population,
success has varied (Noël and Larocque 2009). Addressing the fundamental issues that result in the
income disparity between Aboriginal communities and the non-Aboriginal population – such as
differences in overall education attainment and labour market qualification – is challenging but essential
to permanently reducing their poverty levels.
Recent immigrants, on the other hand, potentially experience higher rates of poverty due to various
cultural barriers. Language barriers, as well as issues with the recognition of foreign work and education
credentials, can prevent immigrants from proper labour market integration. Furthermore, immigrants can
also face discrimination in the labour force, which also contributes to lower earnings29 (Teelucksingh and
Galabuzi 2005; Block and Galabuzi 2011). The provinces have taken efforts to provide more services to
immigrants such as free language courses, information on career-training programmes and job-seeking
assistance (Ontario Ministry of Citizenship, Immigration and International Trade 2014). Despite such
27 Refers to those “whose accommodation is temporary or lacks security of tenure,” (Gaetz et al. 2013), i.e., those in transitional housing. This includes individuals living in hotels, motels and so on involuntarily, as well as “couch surfers.” 28 Refers to those denied the use of shelters, either due to spacing limitations or other specified reasons. 29 In fact, this issue is included in the goal area related to governance and inclusive society through the following indicator under the target that looks at discrimination in economic life: wage gap between immigrants and non-immigrants with comparable levels of education.

30
support, however, there has been relatively little decrease in immigrants’ poverty rate, based on LIM
estimates, over recent years (Citizens for Public Justice 2013).
Lone-parent families, 89 percent of which are headed by females, are on average nearly four times more
likely to be living in poverty than two-parent families in Canada (Statistics Canada 2013d). For female
lone-parents, probable factors that have been attributed to this difference are gender wage gaps – both
as a result of gender discrimination and differences in education and experience – and a lack of
affordable child care. Despite the additional assistance lone mothers receive, such as benefits including
the Universal Child Care Benefit, their poverty rates – based on either LICO or LIM estimates – remain
well above both the national average and the aggregate lone-parent average, though they have fallen
significantly in recent years (Statistics Canada 2013d).
National Poverty Reduction
The unanimous belief among anti-poverty advocates is that a comprehensive strategy aimed at
addressing poverty is needed at the national level. Without one, provinces and territories have chosen to
implement their own strategies with positive results. Poverty reduction goals set at the national level
would require the federal government to develop, introduce and implement a feasible strategy that
complements the existing efforts of provincial and territorial governments. Had a national plan already
existed, the process involved in committing to poverty reduction goals – such as incorporating specific
targets, monitoring progress and reporting on outcomes – would have proven significantly less
challenging.
In addition to the adoption of a national strategy, anti-poverty groups such as Make Poverty History and
the Dignity for All (2013) campaign have suggested that some form of a federal anti-poverty act be put
into action, as some provinces have implemented acts. Such an act would demonstrate commitment to
poverty reduction on the part of the federal government, as well as ensure accountability and
transparency (Citizens for Public Justice 2009). Efforts to reduce poverty by 2030, including developing
and meeting national targets, will in all likelihood prove to be more difficult for Canada than other
countries that have already adopted national plans such as the United Kingdom and Ireland.

31
Ensure Quality Education for All
Current Status As Canada has no federal department of education, departments or
ministries established at the provincial level are responsible for
overseeing the administration of education at all levels. The lack of a
unified, integrated national system results in regional differences in terms
of the way educational standards are determined and quality is assessed.
The Council of Ministers of Education, Canada (CMEC), established in
1967 by provincial ministers of education to facilitate inter-provincial
communication, currently stands as the institution accountable for
reporting on issues related to the quality of education as well as the
primary interlocutor on educational concerns at the primary, secondary
and post-secondary levels. CMEC serves as a forum through which
education ministers set pan-Canadian priorities. The Canadian Council
on Learning, a non-profit organisation that was funded by Employment
and Social Development Canada before its closure in 2012, frequently
reported on the status of learning and education in Canada in order to aid
policy-makers and identify research priorities.
According to the OECD, Canada consistently ranks among the top
providers of quality education. In 2011, Canada was identified as one of
the most well-educated countries in the world, given that just over half of
the working-age population (15 and over) holds some sort of post-
secondary qualification – a figure that was nearly 20 percentage points
above the OECD average (OECD 2013b). In addition, total expenditure
on education (as a percentage of GDP), number of hours spent teaching
and graduation rates are all areas in which Canada continues to exceed
OECD averages.
A pressing issue in the Canadian context is the discrepancies between
education levels in Aboriginal communities and the rest of the population.
The 2011 NHS estimates that while approximately 77 percent of the
overall population holds a high school diploma or equivalent, the
corresponding figure for the Aboriginal population is only 56.9 percent
(Statistics Canada 2013r; 2013s). There also appears to be a significant
variation in the secondary education attainment levels of Aboriginal
peoples depending on their areas of residence. In general, the situation
of Aboriginal peoples living on reserves has been considerably worse
than that of those living off reserves. In 2011, whereas 67.3 percent of
Aboriginal peoples aged 20–24 living off reserves held a high school
diploma or equivalent, only 38.7 per cent of Aboriginal peoples living on
reserves fell into the same category. In regards to post-secondary
attainment, Aboriginal peoples also fall behind the rest of the general
Section Highlights
National Priorities
Improve access to child care
Improve secondary school
completion rates for
Aboriginal peoples
Increase the number of
young adults with problem-
solving and critical-thinking
skills
Increase the number of
adults participating in
lifelong learning
Key Data Sources
Elementary-Secondary
Education Survey
Post-secondary Student
Information System
National Graduates Survey
Opportunities
Initiatives established across
jurisdictions to ensure safe
and secure learning
environments
Challenges
Inadequate national child
care policy and variation in
policies at the provincial
level creates uneven access
Lack of agreement between
Aboriginal communities and
government on education
reform
Variation in education costs
and support for post-
secondary students across
provinces creates uneven
access

32
population. The NHS estimates that in 2011, 48.4 percent of Aboriginal peoples aged 25–64 had attained
some sort of post-secondary qualification compared to 64.7 percent of the non-Aboriginal population.
There is general consensus across civil society and government stakeholders that addressing gaps in
Aboriginal education attainment is a key challenge and priority for Canada (CMEC, personal
communication; Canadian Education Association, personal communication).
Concerns have also been raised over increasing student debt loads and employment uncertainty in the
Canadian context (Shaker, Macdonald and Wodrich 2013). Tuition fees, which vary by province, rose
steadily in the 1990s at an average of almost 10 percent per year, slowing to roughly 5.3 percent per year
in the 2000s (Baluja 2011). While student debt levels have remained relatively stable, the proportion of
graduating students with debt has increased from 48 percent in 1995 to 57 percent in 2005.
Previous and Ongoing Efforts In terms of ensuring quality in the education system, efforts have come primarily in the form of policies
and initiatives developed by provincial ministries of education. Most of these policies target the four pillars
of CMEC’s vision for education, Learn Canada 2020, which promotes “quality lifelong learning
opportunities for all Canadians.” It includes provisions for early childhood education, elementary and
secondary schooling, post-secondary education, and adult learning skills and development (CMEC 2008).
At the primary and pre-primary level, a variety of newer initiatives have been developed in recent years in
order to focus attention on students with below-average likelihoods of educational success. Early
childhood education and learning has been a recent area of particular interest. Ministries of education
have worked closely with non-profit organisations in order to encourage research focused on assessing
the quality of early childhood education and learning and outlining potential areas for development
(Canadian Council on Learning 2011). The Early Development Instrument developed at McMaster
University and Understanding the Early Years, which was supported by the federal government, are
examples of research initiatives directed at examining the school readiness of preschool-aged children. In
the case of the Early Development Instrument – which is used as an indicator in a number of provinces –
results from the study helped learning partnerships identify school districts most in need of intervention. It
is worth noting that nearly all of the poverty reduction strategies prepared by provinces and territories
include provisions for early childhood development with aspects related to the availability of child care
and the quality of early childhood education.
As primary education remains a provincial concern, approaches to ensuring and assessing quality of
education vary according to province. Examples of more recent initiatives introduced by some provinces
include Ontario’s Primary Class Reduction Initiative, which aims to decrease the student-teacher ratio in
primary classrooms (Canadian Education Association 2010), Newfoundland and Labrador’s Safe and
Caring Schools Policy (Newfoundland and Labrador 2013), a larger anti-bullying programme being
introduced throughout some of the provinces,30 and Quebec’s Going the Healthy Route at School, a
framework policy that assists schools in creating an environment that encourages the adoption and
maintenance of a healthy lifestyle (Ministère de l'Éducation, du Loisir et du Sport, Québec 2014).
At the secondary level, including vocational and technical training programmes, Canada has seen
continued improvement over the years in areas measured by the OECD. Statistics Canada estimates
30 All of the provinces and territories have policies in place or under development with respect to bullying. In 2014, the federal government launched a campaign to stop cyber-bullying. In 2013, it adopted Bill C-13, the Protecting Canadians from Online Crime Act, which includes provisions on sharing intimate images without the consent of the person depicted (Public Safety Canada 2014a).

33
indicate that high school dropout rates have fallen approximately 53 percent – from 16.6 percent in 1990
to 7.8 percent in 2011 – and Canada currently maintains the sixth lowest overall dropout rate among all
OECD countries (OECD 2013b). In terms of performance, as measured by the Programme for
International Student Assessment test scores in 2012, Canada also maintains a relatively high standing,
with Canadian post-secondary students scoring well above OECD averages in mathematics, science and
reading (Brochu et al. 2013).
In recent years, there has been a trend in initiatives that target the development of critical-thinking skills
among youth at the secondary level – an important element of what are often referred to as 21st century
skills.31 Developing critical-thinking skills continues to be an important priority for Canada (CMEC,
personal communication). Organisations such as the Critical Thinking Consortium32 collaborate with
education ministries to develop classroom-proven curricula that promote problem-solving and critical-
thinking skills. The Life Skills, Mathematical Reasoning and Critical Thinking curriculum was developed by
the Canadian government to prevent the onset of problem gambling by teaching students coping and self-
monitoring skills (Public Health Agency of Canada 2013b). While critical thinking has been recognised as
an important area of educational development, measuring critical thinking across jurisdictions remains a
challenge (Canadian Education Association, personal communication).
The area in which Canada has been performing consistently well in recent years is post-secondary
education. Post-secondary enrolment – enrolment in universities, colleges and apprenticeship
programmes –and post-secondary completion rates have grown at a steady rate over the years.
However, assessment of the quality of post-secondary institutions is an issue. The Canadian Council on
Learning and CMEC have emphasised the need for a comprehensive indicator of overall post-secondary
education quality in Canada. The Canadian Council on Learning (2009) points out that the way
institutions measure their own quality – for example, in terms of their departmental rankings in
comparison to similar institutions – differs from the way that governments may measure their quality –
such as in terms of post-graduation employment rates – and thus a set of universally comparable
indicators is needed in order to accurately gauge where post-secondary institutions excel and where they
can improve.
In their review of rising post-secondary education costs and their impact, Shaker, Macdonald and
Wodrich (2013) note that the preferred policy response by governments has been to offer targeted
assistance measures, such as grants or bursaries for particular groups, tax credits and loan forgiveness
directed at in-province students. They suggest, however, that this approach is insufficient, pointing out
that it reduces the ability of students to leave their home province when pursuing post-secondary
education, makes it more difficult to navigate the system of university finance and creates uncertainty as
assistance programmes can change or be eliminated at any time. They argue for up front public funding
through progressive taxation as the fairest way to fund higher education that ensures individuals can pay
what they can afford.
Efforts to bridge the gap in education attainment between Aboriginal communities and the non-Aboriginal
population have been taken by governments and civil society organisations. Learn Canada 2020 lists
Aboriginal education as one of its ongoing priorities (CMEC 2008). The policy aims to improve graduation
rates, strengthen academic achievement and provide adequate career-transitioning assistance to
Aboriginal students. In addition, the implementation of the proposed First Nations Control of First Nations
31 Twenty-first century skills and learning is about “building capacity in areas that promote a resilient society capable of effectively adapting to rapid change [… and] represents a shift in emphasis from instruction of facts to a model which focuses on competencies such as critical thinking, character, creativity, innovation, as well as digital and computer literacy” (Boudreault et al. 2013, 3). 32 See http://tc2.ca for more information.

34
Education Actwould, in some form, give First Nations communities a more active role in overseeing
primary and secondary education in their respective communities, as well as guarantee a stable and
sufficient stream of funding (AANDC 2013; AFN 2014).
In addition to Aboriginal education, there also exists a range of underlying educational issues that have
been highlighted as focal points for development by CMEC. These include raising literacy levels,
improving student-teacher mobility,33 enhancing the effectiveness of the post-secondary education
system, ensuring equal learning opportunities are offered in both official languages, continuing to develop
the early childhood education and learning system, education data and research and sustainable
development education.
National Priorities for Ensuring Quality Education for All
The priorities selected for Canada in the area of education broadly address elements of education over
an individual’s lifespan (Table 2). They reflect pillars identified by CMEC but also what has been
proposed by the OWG (2014). Consensus exists that there is a need to address early childhood
education, assess quality of education and ensure equal access to safe learning environments at the
primary and secondary levels. Support for Aboriginal peoples is especially important in the Canadian
context. These issues are reflected in the targets and indicators below. In addition, they seek to capture
the need to ensure that individuals have skills needed for life and work, challenges related to accessing
post-secondary education and the importance of promoting lifelong learning. Included are a number of
cross-cutting targets that relate to sustainable development education, an area that Canada has
historically promoted (see Box 6) and the OWG has identified as a potential target for the SDGs.
Box 6. Sustainable development education in Canada
The proposed SDG for education includes the target of ensuring that “all learners acquire knowledge and
skills needed to promote sustainable development, including among others through education for
sustainable development and sustainable lifestyles, human rights, gender equality, promotion of a culture
of peace and non-violence, global citizenship, and appreciation of cultural diversity and of culture’s
contribution to sustainable development” (OWG 2014).
In Canada, sustainable development education is a priority in CMEC’s Learn Canada 2020that builds on
over two decades of work in the country. The goal is to raise students’ awareness of sustainable
development and encourage them to actively engage in working toward a sustainable society. To achieve
this goal, CMEC is working to support and strengthen sustainable development education across
jurisdictions. CMEC has adopted the UN Economic Commission for Europe’s vision regarding education
for sustainable development, which seeks the creation of a region that “embraces common values of
solidarity, equality and mutual respect between people, countries and generations [inter alia]” (CMEC
2010). In 2010, CMEC’s Education for Sustainable Development Working Group released a report
outlining a vision for the development of a pan-Canadian framework that builds on current activities. The
report outlined four priorities including integration of sustainable development concepts into curricula,
provision of appropriate support in teacher education, development of relevant teaching resources and
materials, and implementation and assessment of sustainable development education programmes at
school and school-district/board levels.
33 Refers to ability of students and teachers to move from one province or territory to another with as little disruption and complication as possible.

35
The cross-cutting targets and indicators demonstrate recognition that education plays a critical role in
contributing to achievement in other goal areas. For example, a cross-cutting target on legal education
arises from the goal area related to governance, while education to promote global citizenship was
identified for global partnership. In both instances, stakeholders suggest that more efforts are needed to
ensure that Canadians have the necessary educational background and related skills to improve their
access to justice in the former instance and make efforts to address global challenges in the latter.
Under the study, one global minimum standard was included for education, “ensure all children have
access to early childhood and quality primary and secondary education,” as measured by three
indicators: (i) % of girls and boys who complete primary school, (ii) % of girls and boys who complete
Table 2. Ensure quality education for all: Targets and indicators
Target Indicator
Global
Ensure all children have access to early childhood and quality primary and secondary education
% of girls and boys receiving at least one year in pre-primary programmes
% of girls and boys who complete primary school
% of girls and boys who complete secondary school
% of girls and boys who achieve a passing grade in national learning assessments at the primary school level
Increase the number of adults with skills, including technical and vocational skills
Proportion of individuals enrolled in a Technical and Vocational Education and Training institution
National
Ensure a safe, secure and effective learning environment in the classroom
Student-educator ratio
Proportion of school-aged children who report being bullied
Ensure all children have access to early childhood and quality primary and secondary education
Proportion of Aboriginals who complete secondary school
% of children aged 0–5 for whom there is a regulated childcare space
Increase the number of young adults with skills for problem-solving and critical thinking
% of youth demonstrating proficient skills in problem-solving and critical thinking by the end of secondary school
Increase the number of adults participating in lifelong learning
Proportion of adults enrolled in post-career, technical or professional training programmes
Average tuition fee for full-time students at degree-granting institutions
Average student debt from all sources at graduation
Average length of time it takes to pay student debt, by income quintiles
Proportion of adults who complete post-secondary education
Proportion of adults with student loans
Cross-cutting: Establish open, accountable, inclusive and effective institutions, rule of law and a peaceful and inclusive society
Increase access to justice Proportion of jurisdictions that have integrated legal education into secondary curricula
Cross-cutting: Establish a sustainable, healthy and resilient environment for all
Safeguard ecosystems and biodiversity # of jurisdictions that have integrated biodiversity into primary and secondary curricula
Cross-cutting: Establish a global partnership for sustainable development
Promote global citizenship # of jurisdictions that have integrated global citizenship into primary and secondary curricula

36
secondary school and (iii) % of girls and boys who achieve a passing grade in national learning
assessments at the primary school level. While Canada could improve outcomes, particularly on the first
and second indicators, primary education is already near universal.
Data on Education
Canada has excellent data on education overall (Box 7). Data is readily available on enrolment at all
levels from pre-primary to post-secondary education. No significant challenges exist to measuring global
targets and indicators selected for this study.34 Available surveys on enrolment include the Elementary-
Secondary Education Survey, Registered Apprenticeship Information System, Labour Force Survey and
the NHS/census. CMEC’s Pan-Canadian Assessment Program provides data on national learning
assessments. Statistics Canada’s National Graduates Survey, Postsecondary Student Information
System, and Tuition and Living Accommodation Costs for Full-time Students at Canadian Degree-
granting Institutions Survey were also identified for obtaining information on different aspects of post-
secondary education, including enrolment and costs.
One challenge that exists in the Canadian context, however, is obtaining an accurate picture of national
learning outcomes. Provincial and territorial governments have principal jurisdiction over education, which
allows them to establish their own curricula and assessment programmes. While the Pan-Canadian
Assessment Program (and, similarly, the OECD’s Programme for International Student Assessment)
provides information about educational outcomes across Canada, the jurisdictional differences in
educational activities present a challenge for acquiring comparable and accurate outcome data at the
national level.
Furthermore, the Pan-Canadian Assessment Program is limited to assessing math, reading and science
skills for Grade 8 students who are 13 years old at the beginning of the school year. While these
measures provide relevant information on problem-solving abilities, they do not necessarily show critical
thinking abilities – a performance metric that is important for Canada’s knowledge-based economy and
the needs of future employers. In terms of monitoring progress on critical thinking in Canada, it is likely
that some significant efforts will be needed to develop a standardised assessment mechanism that
accurately captures critical-thinking learning outcomes and is acceptable to all jurisdictions.
Another area where Canada will likely have trouble monitoring progress is on aspects related to safety at
school as measured by the indicator on bullying. The Health Behaviour in School-Aged Children study – a
school-based self-reported survey instrument that is conducted by the Public Health Agency of Canada in
collaboration with the World Health Organization’s Regional Office for Europe (Freeman et al. 2011) –
provides some information to compare historical trends in bullying. However, the latest data are not
readily (and publicly) available for manipulation by users. Furthermore, the sensitive nature of bullying
data makes it difficult to completely understand the prevalence of bullying in Canada as it is based on
perceptions. In this regard, Statistics Canada’s General Social Survey on Victimization has made
modifications to obtain data specifically on cyber-bullying35 through adult-reporting – thus, providing a
reference point for comparison against self-reported data (Perreault 2011). Following from this, a positive
34 Enrolment rates are only available at the primary level – rather than graduation rates – in administrative data. Because education is mandatory until age 16 in Canada, Statistics Canada assumes universal coverage in primary school completion rates (though home-schooled children and those in private institutions are excluded from administrative data) (Statistics Canada, personal communication). Nevertheless, other survey instruments, such as the census, Labour Force Survey and SLID, collect levels of education completion rates for the adult population. 35 Police-reported data on cyber-bullying also exist, but are very limited and relate specifically to cyber-crime.

37
step forward would be the further addition of general questions surrounding other forms of bullying that
will allow for greater data comparability and enhance data accuracy.
With respect to the costs of post-secondary education attainment, the National Graduates Survey is a key
source, though survey data are not readily available to the public and the collection frequency is irregular.
Furthermore, the data release period is relatively long. For example, the last survey was in 2010 and the
survey data were only released in 2014. From the perspective of monitoring post-2015 priorities identified
throughout this study, standardising the collection frequency (from occasional to regular intervals, for
example), making data publicly available and improving data release periods would serve as concrete
steps to improve understanding the costs and related impacts of participating in post-secondary
education.
Finally, some targets and indicators across goal areas suggest a need for new or enhanced curricula in
areas such as sustainable development education, legal education and global citizenship promotion.
While some jurisdictions have already made efforts on integrating these topic areas into curricula, data
will need to be collected in a much more systematic way to monitor progress.
Box 7. Data strategy: Ensuring quality education for all
Best data sources: Elementary-Secondary Education Survey, Postsecondary Student Information
System and National Graduates Survey.
Rationale: The Elementary-Secondary Education Survey is a relevant source for collecting information
on a number of global and national indicators related to primary and secondary education. It also provides
data on enrolment and student-educator ratios. The survey includes several levels of disaggregation,
namely age, sex and province/territory. Finally, since it is an administrative dataset, it is fairly reliable.
The two other surveys, Postsecondary Student Information System and National Graduates Survey,
capture the bulk of the information for measuring progress on post-secondary education including
enrolment and the financial challenges related to attaining this level of education. The Postsecondary
Student Information System provides administrative data and serves as a reliable source. The National
Graduates Survey provides detailed information regarding the costs of post-secondary education that is
being used as a proxy measure for access to post-secondary education in this study.
Limitations: While the Elementary-Secondary Education Survey is a relatively good data source, it has
some limitations related to data disaggregation and comparability. For instance, it cannot provide
disaggregated data by visible minorities and household income. Methodological changes have reduced
the comparability of data on enrolment rates before and after 2008, though they improved coverage. The
National Graduates Survey also has some comparability limitations, mainly due to the addition of new
categories and concepts. Furthermore, the survey frequency is irregular and there is a long lag between
the reference period and the survey release date, which makes it difficult to obtain timely data.

38
Opportunities for Ensuring Access to Quality Education for All There are no major barriers to ensuring a safe, secure and effective learning environment in Canadian
classrooms by 2030. The two indicators used to measure a safe, secure and effective learning
environment in the classroom in this study are the student-educator ratio and the proportion of school-
aged children who report being bullied.
Student-educator ratios have been on the decline in public elementary and secondary schools in Canada.
The nationwide ratio was 15.9 for the 2001–02 school year and it had dropped to 13.8 by 2010–11
(Statistics Canada 2013o).36 Despite the overall decline, a recent poll by the Canadian Teachers’
Federation, which surveyed more than 8,000 teachers across the country, found that nine out of 10
teachers cite class composition as a source of work-related stress, while 95 percent of respondents
claimed to experience stress because they do not have time to meet the individual needs of students
(CTF 2014). Provincial governments can easily lower the student-educator ratio by increasing funding for
elementary and secondary schools, as well as teacher education programmes at universities to ensure
that there is an adequate supply of teachers. The only apparent obstacles to reducing student-educator
ratios are the financial positions of provincial governments and whether provincial governments prioritise
this goal. Instead of trying to reduce student-educator ratios, provincial governments may decide to
integrate new technologies into the classroom in order to enhance the efficiency and efficacy of teachers.
Recently, there have been many initiatives to combat bullying in schools across Canada. Ontario, for
example, has taken an active interest in reducing the prevalence of bullying in elementary and secondary
schools. In addition to investing in a comprehensive bullying-prevention strategy as a part of its Safe
Schools Action Team initiative in 2004, the Ontario Ministry of Education implemented the Anti-Bullying
Act in 2012 (Ontario Ministry of Education 2014). The act ensured that one week in November be
designated “Bullying Awareness and Prevention Week” and stricter consequences be meted out to those
found guilty of bullying. Though no national survey of bullying currently exists in Canada, Toronto’s
Centre for Addiction and Mental Health, which conducts its own survey every two years, found that
Ontario in-school bullying rates had decreased by approximately 8 percent between 2012 and 2014
(Canadian Safe School Network 2014). Nova Scotia, New Brunswick, Quebec and Alberta also have
some form of anti-bullying legislation in place (Panjvani 2013), since the ministries – through CMEC –
have agreed that ensuring a “safe, inclusive and accepting” learning environment remains a national
priority (CMEC 2012).
Measures to combat bullying in Canada illustrate an effective approach to addressing challenges in
education – provinces and territories working individually to achieve a mutual goal. If all national
education priorities were approached in this manner then much more could be accomplished in this area.
Challenges for Ensuring Access to Quality Education for All
Child Care and Early Childhood Education
Primarily under provincial jurisdiction, there is a patchwork of child care and early childhood education
policies across Canada. This stems from the fact that the federal role is limited largely to funding
provincial and territorial programmes through the Canadian Social Transfer – a block transfer of funding
to sub-national jurisdictions for support related to education, childcare, social assistance and social
36 Figures remain higher than the national ratio in Alberta and British Columbia, where student-educator ratios were 15.9 and 16.8 in 2010–11, respectively (Statistics Canada 2013l).

39
services.37 As a result, there are significant differences across the provinces in terms of child care policies
and the availability and affordability of child care services (Cool 2007). Canada lacks a national child care
strategy and any direct mechanism to create one. Women’s groups and other CSOs continue to demand
universal childcare as a priority area for action (Alliance for Women’s Rights 2014).
Ensuring equal access to child care services in Canada remains a significant challenge. The previous
federal government collaborated with the provinces and territories to improve child care services in
Canada. For example, the FPT governments established the Social Union Framework Agreement in
1999. This framework “allowed them to work cooperatively to support the delivery of social programs and
services” and ultimately “led to the development of a series of measures for young children, including the
National Child Benefit (1998), the Early Childhood Development Initiative (2000), the Multilateral
Framework on Early Learning and Child Care (2003), the 2005 Bilateral Agreements with provinces”
(Cool 2007). The Conservative government that assumed power in 2006 has taken a different approach
to the child care issue and abolished the national child care strategy of the previous Liberal government.
This strategy was replaced with the 2006 Universal Child Care Benefit that provides a monthly cash grant
to parents with children under the age of six to be used as the parents deem appropriate. In October
2014, the government proposed to increase the benefit and extend it to children between the ages of six
and 17 starting in 2015.
Education Outcomes for Aboriginal Peoples
It is widely recognised that there is a crisis in Aboriginal education, as demonstrated by the failure to
close the gap between Aboriginal communities and the non-Aboriginal population in terms of secondary
and post-secondary completion from 2001 to 2011 (Calver forthcoming). First Nations communities are
divided in terms of their reception to Bill C-33, the First Nations Control of First Nations Education Act,
with some suggesting the act gives too much control to the minister of aboriginal affairs and is insufficient
in terms of protecting treaty rights and funding guarantees. The Assembly of First Nations has recently
repeated its call for the federal government to withdraw Bill C-33, following the resignation of the national
chief of the Assembly of First Nations amid criticism for his support of Bill C-33 in early 2014 (Canadian
Press 2014a; Roman 2014).
There are significant barriers to improving the relative educational performance of Aboriginal peoples in
Canada, including differences among Aboriginal groups in terms of their priorities and circumstances, and
disagreement and dysfunction in national First Nations organisations. At present, it is uncertain whether
the federal government will be able to come to a satisfactory agreement with Aboriginal groups to reform
education in a way that both respects the inherent right of self-government and improves the educational
performance of Aboriginal peoples.
Access to Lifelong Learning
At the post-secondary level, the average level of tuition varies drastically across the provinces. For
example, average undergraduate tuition fees ranged from $2,644 in Newfoundland and Labrador to
$7,259 in Ontario for the 2013–14 academic year, reflecting the different priorities of provincial
governments (Statistics Canada 2013p). In addition, each province operates its own student loans
programme, such as the Ontario Student Assistance Program and Student Aid Alberta. A key challenge
37 The federal government is directly involved in the provision of child care and early childhood education to Aboriginal communities, military families, and immigrants and refugees (Cool 2007).

40
with respect to improving access to post-secondary education by 2030 is the lack of consistency across
provincial jurisdictions in terms of costs and the need to consolidate student assistance programmes.
Developing Critical-Thinking Skills
In Canada’s knowledge-based economy, the ability to think critically and solve problems is highly valued.
A key challenge for Canada is creating a sense of urgency for education reform (Canadian Education
Association, personal communication). Discussions on education reform to promote 21st century skills
have been ongoing since the mid-1990s. However, as a 2013 review of five Canadian provinces shows,
the application of curricula to develop 21st century skills is inconsistent across provinces (Boudreault et
al. 2013). Moving forward, there is a need for better inter-provincial coordination on 21st century learning
and professional development for teachers to ensure they have the appropriate skills and resources to
promote core competencies in the classroom (Boudreault et al. 2013; Canadian Education Association,
personal communication).

41
Create Jobs, Sustainable Livelihoods and
Inclusive Growth for All
Current Status Canada’s progress in terms of job creation, growth and the development
of sustainable livelihoods varies substantially depending on what
variables are examined. On the whole, Canada performs well in most
areas as measured by indicators of economic well-being. The OECD’s
Better Life Index places Canada 10th – out of the 36 countries evaluated
– in the jobs category (earnings, job security and unemployment) (OECD
2013c). In 2013, Canada boasted the second highest employment rate
out of all OECD countries. Just over 72 percent of working-age people
(aged 15–64) reported having paid jobs (OECD 2013c). In the OECD’s
Employment Outlook 2012, it was noted that Canada had one of the
lowest long-term unemployment rates in the OECD and was one of the
few countries whose unemployment benefits parameters varied in
response to changing labour market conditions.
Despite performing well overall, there are certain areas in which Canada
has lagged behind. Recent evidence suggests that income and wealth
gaps are widening, between low-skilled and high-skilled workers and
between the richest and poorest income classes. This can be attributed
to the fact that the wages of low-skilled workers have been declining
relative to those of high-skilled workers and income growth over the
years has been disproportionate among income classes. In particular,
the top 1 percent of income earners in Canada saw their share of
personal income grow from 7.1 percent to 10.6 percent between 1982
and 2011. The bottom 50 per cent saw a decline in their share, from 17.8
percent to 17 percent during the same period (Statistics Canada 2013n).
As Veall (2012) notes, it is difficult to pinpoint exactly why top income
shares have surged in recent decades, hence developing policies to
reduce income inequality will be a challenge. Taking Canada’s current
state with respect to inequality into consideration, however, it is not
surprising that Canada currently maintains the 12th highest rate of
inequality out of 34 OECD countries as measured by the after-tax Gini
coefficient (OECD 2014c).
Though widening income inequality remains a concern, a recent New
York Times article reported that middle-class Canadians are better off
than the middleclass in the United States and a handful of other
developed countries. The middle class in Canada was labelled “the
world’s richest middle class” based on after-tax median income levels in
2010. Part of Canada’s success has been attributed to the government’s
efforts to raise the take-home pay of both middle- and low-income
households through redistribution of income (Leonhardt and Quealy
Section Highlights
National Priorities
Promote decent work
Support inclusive growth
and reduce income
inequality
Ensure equal pay for equal
work
Achieve full and productive
employment for all including
women, youth and
Aboriginal peoples
Key Data Sources
Labour Force Survey
Survey of Labour and
Income Dynamics/Canadian
Income Survey
Opportunities
Strong economy provides
opportunities to improve
performance in other areas
Strong legal framework to
ensure equal pay for equal
work
Challenges
Rising income and wealth
inequality
Lack of consensus on an
official measure of inequality

42
2014; also see Austen and Leonhardt 2014). As shown by the Centre for the Study of Living Standards,
income inequality in Canada becomes significantly reduced once transfers and taxes are taken into
consideration. While redistribution plays a significant role in offsetting inequality, Canada’s redistributive
efforts still fall below the OECD average (Sharpe and Capeluck 2012).
Previous and Ongoing Efforts Canada’s primary tool designed to “help create jobs, economic growth and long-term prosperity” is the
federal government’s Economic Action Plan, which was introduced in 2010 and is formally listed as part
of consecutive federal government budgets (Canada 2014b). The plan includes provisions to encourage
job creation and innovation, as well as promote prosperity through economic support for individuals,
families and small businesses. A number of specific initiatives have been highlighted by the plan. The
Canada Job Grant aims to assist low-skilled workers who may be ineligible for employment insurance
benefits. Connecting Canadians with Available Jobs is an initiative launched in 2013 that aims to help
unemployed people find jobs in their area related to their skill set through enhanced labour market
information. The Promoting Education in High-Demand Fields initiative aims to develop ways to promote
fields of education that lead to jobs in demand, such as programmes in the sciences, technology,
engineering and mathematics.
According to the Canadian Labour Congress, the youth unemployment and underemployment rates –
which it calculates using data on people aged 15–24 who are described as having an unmet need for
work, i.e., discouraged workers, involuntary part-time workers, and people waiting for a reply from an
employer— were nearly double the rates for workers aged 25–54 in 2013 (CLC 2014). The concern over
youth unemployment has led to a rise in the number of programmes provided by both the federal and
provincial governments that aim to create youth employment opportunities. The federal government’s
training and employment initiatives focus on areas such as student employment, namely through the
Canada Summer Jobs programme that provides subsidies to employers for hiring full-time students and
encourages the pursuit of innovation usually in the form of entrepreneurial grants.
Ensuring equal pay between genders has been an FPT concern. Pay equality – which refers to “equal
pay for equal work” in the sense that no pay discrimination, gender or otherwise, exists for people working
the same jobs – is ensured at a federal level under the Canadian Human Rights Act. Similar legislation,
such as the Alberta Human Rights Act and Manitoba’s Human Rights Code, also exists in all provinces
and territories. Pay equity, however, addresses the issue of “equal pay for work of equal value.” It
ensures that employers pay female-dominant job groups no less than male-dominant job groups if the
work is of comparable value. Certain provinces, including New Brunswick, Alberta, Manitoba and Prince
Edward Island, have their own version of a Pay Equity Act (Pay Equity Commission 2012) and a federal
model entitled the Public Sector Equitable Compensation Act has been introduced. The federal
Employment Equity Act exists to ensure that women, as well as Aboriginal peoples, persons with
disabilities and minorities all have equal access to the labour market.
Non-profit groups, academics and other observers continue to express concern regarding growing
income and wealth inequality in Canada, noting that inequality undermines social inclusion, upward
mobility and economic performance (see, for example, Broadbent Institute 2012; Corak 2013; Conference
Board of Canada 2013a; Dignity for All 2013; Macdonald 2014). A number of organisations have
launched various campaigns and initiatives, emphasising a need for the federal government to play a key
role in reducing inequality through approaches that address issues such as the promotion of decent work,
greater income assistance, access to public services and more progressive taxation.

43
National Priorities for Creating Jobs, Sustainable Livelihoods and Inclusive Growth for
All The targets and indicators related to employment and inclusive growth in the Canada case study broadly
reflect concerns at the national and international levels with respect to creating decent jobs, increasing
employment rates in general but also for particular groups, and addressing growing income and wealth
inequality. As noted above, jobs and shared prosperity are a priority for the federal government and
employment is typically included as a focus area in provincial and territorial poverty reduction strategies
given its direct link to income. At the inception workshop, participants agreed that reducing inequality and
improving equal pay outcomes are critical issues in Canada. Indicators such as the growth rate of
incomes for the bottom 40 percent, proportion of income held by the top 1 percent and the earnings ratio
between the bottom 90 percent and top 10 percent aim to capture progress on inequality. Participants
also suggested the inclusion of indicators on underemployment, the working poor and decent work. In
addition to specific indictors for specific populations, union coverage rates, access to workplace benefits
and incidents of workplace injury have been included as national indicators to provide an indication of
decent work.
At the international level, the OWG (2014, 12–13, 14–15) has proposed a broad set of targets related to
employment and sustainable economic growth (candidate goal 8) as well as reducing inequality within
and among countries (candidate goal 10). In addition to issues related to creating jobs and promoting
decent work (including protecting labour rights), targets for improving productivity, global resource
efficiency in consumption and production, ending child labour, supporting sustainable tourism, inter alia,
have been suggested. Targets on inequality include provisions for social inclusion, sustaining income
growth for the bottom 40 percent of earners, regulatory and policy reform, and support for developing
countries.
In Table 3 below, the priorities identified for Canada focus largely on unemployment, decent work, fair
treatment and income inequality. Efforts to support developing countries are captured under the
candidate goal outlining a new global partnership for sustainable development. One global minimum
standard is included in this list, namely equal pay for equal work. However, the indicator used below is not
particularly useful for Canada unless it is qualified with additional information. An indicator based on gross
earnings would be useful in the Canadian context if it were disaggregated by sex and controlled for
occupation and years of experience.

44
Table 3. Create jobs, sustainable livelihoods and inclusive growth for all: Targets and indicators
Target Indicator
Global
Achieve full and productive employment for all, including women and young people
Labour force participation rate
Time-related underemployment (thousands)
Ensure equal pay for equal work Mean nominal monthly earnings of employees (local currency)
Support inclusive growth and reduce inequality Gini coefficient
Palma ratio
Growth rate of income of the bottom 40%
Gross fixed capital formation (% of GDP)
National
Promote decent work Union coverage rate (by collective agreement), %
Proportion of employed with access to work-place benefits
Work-related injuries, per 1,000 employed workers
Support inclusive growth and reduce inequality Earnings ratio between the bottom 90% and top 10%
Reduce share of income held by the top 1% Proportion of total income held by the top 1%
Ensure equal pay for equal work Wage gap between men and women
Achieve full and productive employment work for all, including women, youth and Aboriginal peoples
Unemployment rate for Aboriginal identity population
Unemployment rate for youth
Unemployment rate for recent immigrants
Data on Employment and Inequality
Canada has fairly good data on employment. Relatively extensive information comes from the monthly
Labour Force Survey (though the NHS and census also provide data on employment). The data
challenge in this context is generating information that can clearly identify disparities within the labour
market. Information on job vacancies is one area where data are limited. As a result of a recent report by
the Advisory Panel on Labour Market Information (2009), Statistics Canada has taken some measures to
collect information in this area.38 However, the data are only available at sub-regional levels for different
industries. Noted by the 2012 Drummond Report and more recently by the auditor general of Canada, this
is a data gap in understandings of local job demands (Commission on the Reform of Ontario’s Public
Services 2012; Office of the Auditor General of Canada 2014). In 2014, Statistics Canada was given
additional funding to develop estimates on job vacancies at the sub-provincial level. Efforts to collect
information at more disaggregated levels can provide policy-makers and jobseekers a more accurate
picture of the current labour market. Furthermore, local data on job demand can create opportunities to
target funding to skills training and employment programming that can allow job seekers to transition to
industries with high job vacancy rates.
In terms of information on income statistics, there is comparatively sound data in Canada on income
earning and income inequality. The SLID and tax data from the Longitudinal Administrative Databank and
T1 Family File capture information that can be used to compute inequality indicators such as income ratio
between the bottom 90 percent and top 10 percent, wage gap between men and women, and earnings of
the top 1 percent. However, data are not necessarily consistent across the survey instruments, especially
with respect to data for the top 1 percent of income earners and the poor (Statistics Canada, personal
38 To collect data on job vacancies, Statistics Canada added a new survey instrument, Job Vacancy Statistics, and included two new questions to the existing Survey of Employment, Payrolls and Hours.

45
communication). The T1 Family File, which collects tax data from nearly 96 percent of the population,
would theoretically be the best source for computing the share of income of the top 1 percent of earners
given its extensive coverage. However, due to the relatively high cost associated with computation of
such a large dataset for Statistics Canada,39 the SLID, which has a smaller sample size, is used. As such,
some inconsistencies exist that can potentially affect data comparability.
A big problem with replacing the T1 Family File with the SLID is that the SLID reduces disaggregation
levels, as it has narrow geographic coverage concentrated mainly in populated urban areas. The use of
the SLID to calculate income disparities effectively fails to account for many of the rural communities in
Canada, including Aboriginal peoples living off reserves, who are disproportionately affected by poverty
(Statistics Canada, personal communication).40 Moving toward 2030, Canada will have to present data
that accurately capture income inequality across all of society and invest to enable Statistics Canada to
use data from the T1 Family File.
Box 8. Data strategy: Create jobs, sustainable livelihoods and inclusive growth for all
Best data sources: Labour Force Survey, Survey of Labour and Income Dynamics (SLID)/Canadian
Income Survey (CIS)
Rationale: The Labour Force Survey can be used for multiple global and national indicators identified in
this study. It is a major economic survey instrument that provides a relatively comprehensive picture of
Canada’s labour market. As a monthly survey, it provides timely data on the current employment situation
in the country. The maximum time allowed to elapse between the end of the reference period and
dissemination period is two weeks, with a major data release once a year. In terms of comparability, the
survey is a relatively good measure that can be used for analysing historical trends and, despite some
updates to the survey methodology, the information is fairly comparable given the added modifications
that have enhanced data quality.
The SLID/CIS, which is also a major source for the goal area on poverty, generally provides sound data
on income inequality. Again, it is important to note that SLID/CIS data are readily available online, making
it easily accessible to the public. As already noted, the SLID/CIS is the preferred data source for reporting
on income distribution to international organisations like the OECD, which effectively enables international
comparability.
Limitations: Despite being a very good source for employment data, the Labour Force Survey lacks data
for assessing the quality of jobs in the form of employees’ access to non-governmental work-place
benefits. Furthermore, budget requirements for the survey risk changing the sample size from time to
time, which can affect data quality (Statistics Canada 2012c). With regard to the SLID/CIS, coverage is an
issue since the sample size is relatively small. Also, the data release period is long and there is concern
that comparability will be reduced with the recent switch to the CIS.
39 It should, however, be noted that there are estimates from the T1 Family File of the top 15 per cent income share through Statistics Canada’s CANSIM database. 40 The SLID includes them but the sample size is too small for reliable estimates.

46
Opportunities and Challenges to Create Jobs, Sustainable Livelihoods and Inclusive
Growth for All Achieving Full and Productive Employment for All
Above all, Canada’s ability to achieve full and productive employment for all by 2030 depends on the
state of the economy. The strength of the labour market, as demonstrated by trends in the labour force
participation rate, the incidence of time-related underemployment, the incidence of involuntary part-time
workers, and the unemployment rate, depends on underlying economic conditions. Favourable economic
conditions strengthen the labour market and in turn put downward pressure on the unemployment rate,
upward pressure on the participation rate and wages, and lower the incidences of time-related
underemployment and involuntary part-time workers.
A favourable economic environment provides FPT governments with the opportunity to orient labour
market policies toward the needs of Aboriginal peoples, youth and other disadvantaged groups in order to
reduce unemployment rates of these groups. For example, additional funding for cooperative education
programmes, partnerships between employers and educators, and labour market policies directed at
training and employing youth have the potential to reduce the gap between the youth unemployment rate
and total unemployment rate. Similar policies can be pursued for Aboriginal peoples and other groups.
The key challenge is for FPT governments to be in a fiscal position to increase funding and make this
type of targeted labour market intervention a policy priority.
In addition, broad demographic trends present an opportunity to improve the labour market performance
of many groups. The aging of the Canadian labour force has created a great deal of replacement demand
for workers across sectors. In order to meet this demand, industries have reached out to these groups –
particularly women and Aboriginal peoples – to meet their demands for workers. For example, Mining
Industry Human Resources Council has reached out to various Aboriginal groups to increase their
participation in the mining industry (MiHR 2014).
Ensure Equal Pay for Equal Work
As noted above, there are strong legal frameworks at the FPT levels that guarantee equal pay for equal
work. While the necessary legal foundations are in place, the wage gap between men and women also
reflects socially embedded gender norms and preferences. A part of the wage gap between men and
women may reflect social norms that encourage men and women to gravitate toward different educational
programmes, occupations and industries. Moreover, women are more likely than men to leave the
workforce to raise children, reducing their labour market experience relative to that of men, which has
implications for the wage gap.
As opposed to overall income inequality within the population, inequality between genders has steadily
declined. Using raw labour data, Statistics Canada estimated that the gender wage gap (based on real
median hourly earnings) has decreased by nearly half, from approximately 26 percent in 1981 to around
13 percent in 2011 for the population aged 17–64. The bulk of this reduction can be explained by the fact
that men’s real median wages grew by roughly 5 percent during the period whereas those of women grew
by nearly 23 percent (Morissette, Picot and Lu 2013). At the same time, there has been a convergence in
overall employment rates by gender. Between 1976 and 2012, Statistics Canada noted that women saw a
38.2 percent increase, from 41.9 per cent to 57.9 per cent, in their employment rate, while men saw a 9.5

47
percent decline, from 72.7 percent to 65.8 percent, resulting in a significant reduction in the large gap in
rates at the start of the period (Statistics Canada 2015a).
Given recent trends in this area, it is likely that Canada will see greater reductions in the wage gap over
the SDG period.
Promoting Decent Work
The goals of job creation, sustainable livelihoods and inclusive growth can be attained through the
promotion of decent work, which is related to union coverage, the availability of workplace benefits and
incidence of workplace injuries.
Union coverage provides an indication of the extent to which Canadians are engaged in decent work. On
average, unionised workers enjoy higher wages as well as better benefits and working conditions than
non-unionised workers. As such, extending union membership, or at least union coverage, to a greater
proportion of the workforce provides an indication of decent work. According to analysis from Statistics
Canada, long-term trends in unionisation – defined as the proportion of all employees who are union
members – shows a decline from 1981 to 2012, though since 2000 the rate has been relatively stable
(Galarneau and Sohn 2013). Nevertheless, union coverage could be expanded through campaigns that
make non-unionised workers more aware of the benefits of unionisation and changes to collective
bargaining legislation that make it easier for unions to sign up new members. The challenge or danger of
such an approach is that it may significantly shift bargaining power toward unions and away from
employers, with employers responding by moving production to other jurisdictions.
Workplace benefits include vacation, pension and supplementary health coverage. Workers can obtain
such benefits through individual or collective bargaining or government statute. The proposed creation of
the “Ontario Pension Plan” by the Ontario government to supplement the Canada Pension Plan is an
example of a very recent statutory attempt by government to increase the proportion of workers with
adequate pension coverage. Similar initiatives could be undertaken in other benefit areas to ensure all
workers have access to socially adequate levels of workplace benefits. The challenge of such a top-down
approach is the costs imposed on employers to pay for these benefits, which can reduce profitability and
international competitiveness.
Canada has been successful is reducing the incidence of workplace injuries. According to data from the
Association of Workers’ Compensation Boards of Canada, the frequency of workplace injuries per 100
workers of assessable employers declined from 3.29 in 2000 to 1.65 in 2012 (AWCBC 2014). A great
deal of effort has been put into reducing the incidence of workplace injuries in Canada. Occupational
health and safety and workers’ compensation legislation have been present in Canada for many years.
Recently, FPT governments have been actively promoting health and safety awareness training for
workers and supervisors. For instance, a new regulation under Ontario’s Occupational Health and Safety
Act requires every worker and supervisor to participate in health and safety awareness training (Ontario
Ministry of Labour 2014). Similarly, the Canadian Centre for Occupational Health and Safety, established
in 1978, offers “a range of workplace health and safety services to help your organization raise
awareness, assess risks, implement prevention programs, and improve health, safety and well-being”
(CCOHS 2014).

48
Challenges: Supporting Inclusive Growth and Reduce Inequality In Canada, there has been a trend toward rising income inequality in general. The most startling example
of this has been the dramatic rise in the income share of the top 1 per cent (Veall 2012). After-tax income
inequality has also increased, driven by rising market income inequality (Sharpe and Capeluck 2012).
Reducing market income inequality is more difficult to reduce than after-tax income inequality, since it is
not directly affected by taxes and government transfers. In addition, after-tax income inequality is more
socially relevant than market income inequality because it reflects inequality in take-home pay rather than
inequality in gross salary.
Reducing after-tax income inequality is relatively straightforward. In order to reduce after-tax income
inequality, FPT governments can tax higher-income persons proportionally more and/or increase income
transfers to lower-income persons. However, the degree to which income inequality is reduced by 2030
will largely be determined by the priorities of policy-makers. FPT governments must make the reduction of
inequality a priority for this goal to be achieved. Consensus on what measure should be used to assess
reductions in inequalities, such as after-and before-tax income inequality, may be difficult to garner.
Coordination between provincial and territorial governments and the federal government will also be
needed to achieve this goal, since tax and transfer policies exist at both levels.

49
Ensure Energy and Develop Infrastructure
for All
Current Situation: Energy
Canada is one of the largest producers of energy in the world. It is
currently ranked as the second largest uranium producer, fourth largest
natural gas exporter and sixth largest oil producer. Net exports from
crude oil make up almost 30 percent of Canada’s total annual exports
(Natural Resources Canada 2013b). In 2013, net energy export revenues
were nearly $70 billion, up from 2012 revenues estimated at $63 billion
(National Energy Board 2014; National Energy Board 2013b). Canada
also generates a large amount of hydroelectricity that accounts for
approximately 59 percent of national electricity production and supply
(Natural Resources Canada 2013b).
Under Canada’s Constitution Act, FPT governments have shared
jurisdiction over energy. Provinces have primary responsibility to manage
resources within their boundaries (Canada 1867). This means that
provinces can explore, develop and trade in energy and are given
exclusive authority in the production of electricity. The federal
government reserves jurisdictional authority over the production and
management of nuclear energy given the associated high risks. The
government’s authority also extends to trade relations that are
international or inter-provincial in nature.
The oil sands are vital to Canada’s energy sector, accounting for almost
97 percent of the country’s oil reserves. While the United States remains
the primary consumer of the oil sands’ products, the federal government
is exploring opportunities to open up the current market to Asia.
Significant efforts are being made to initiate the construction of several
pipelines: the Enbridge Northern Gateway, Keystone XL, Kinder-Morgan
and Energy East. The building of the Enbridge pipeline in particular has
the potential to reduce dependency on the US economy for exports. It
has been argued that this pipeline, which would connect Alberta with
British Columbia’s Pacific coast, will allow producers to reach the growing
Chinese energy market, thus diversifying Canada’s energy exports (Allan
2012).
The potential profits aside, there are significant environmental concerns
associated with the development of the oil sands. An over reliance on
non-renewable energy sources has significantly increased Canada’s
greenhouse gas (GHG) emissions share – a key environmental indicator
that will be discussed in greater detail in the next chapter. The latest
estimate for 2012 shows that the oil sands account for some 35 percent
of GHG emissions within the oil and gas sector – the largest GHG –
Section Highlights
National Priorities
Ensure access to safe,
efficient and affordable
transportation
Improve maintenance of
public transport
infrastructure
Ensure access to energy
and improve efficiency and
sustainability of energy
supply, including renewable
energy
Key Data Sources
Large variety of sources
required given scope of the
goal area
Opportunities
Collaboration between FPT
governments on national
energy plan underway
Municipal infrastructure
plans in place
Challenges
Lack of federal leadership
on improving energy
efficiency and shifting to
renewable energy
Balancing economic and
environmental
considerations in oil sands
development
Insufficient resourcing to
municipalities to manage
growing infrastructure needs
Ensuring access to
infrastructure in remote
locations

50
emitting sector in Canada, which contributes nearly 25 percent of total emissions (Environment Canada
2014f). By 2020, emissions from the oil sands will make up nearly half of the emissions from the oil and
gas sector, further driving up the sector’s share of total GHG emissions to 28 percent (Environment
Canada 2014f). Environmental groups and academics have noted that construction of the proposed
pipelines will further increase GHG emissions from the oil sands, significantly impacting climate change
reduction strategies (Lazarus and Erickson 2013; Zickfeld 2011).41 Furthermore, this construction reduces
the incentive for Canada to transition to a more sustainable energy economy.
Canada is also over-consuming energy. Canada’s rank in energy intensity – a measure of consumption
expressed as the ratio of energy production and consumption to GDP – was third highest among OECD
countries in 2012. Canada averaged 0.20 tonnes of oil equivalent per thousand dollars of GDP (constant
2005 US$), which was more than the OECD average of 0.14 tonnes (OECD 2014b). Canada’s per capita
energy consumption is one of the highest in the world. World Bank (2014f) estimates42 show that Canada
used 7,270 kilograms of oil equivalent per capita in 2012 – comparatively higher than countries that share
similar economic and/or climate characteristics. For instance, Finland, Norway and Sweden – all
industrialised countries with comparatively similar climates – consumed 6,183, 5,942 and 5134 kilograms
of oil equivalent per capita, respectively.43
The two largest consumers of energy in Canada are the industrial and transportation sectors. The
industrial sector is by far the largest end-user of energy, accounting for 48 percent of the total end-use
energy demand in 2011 (National Energy Board 2013a). Energy-intensive industries such as iron and
steel, aluminium, petroleum refining, mining, and oil and gas extraction are some of the biggest energy
consumers within the sector. With regard to the transportation sector, end-use energy demand was 25
percent in 2011 (National Energy Board 2013a). While this may be comparatively low, the sector has
witnessed increased growth in energy use. Between 1990 and 2011, its energy usage grew by 41 percent
with the freight transportation industry having the highest growth rate (Statistics Canada 2013i). The
transportation sector is also the second largest GHG emitter in Canada, accounting for 23.6 percent of
total emissions in 2012 (Environment Canada 2014f).
Previous and Ongoing Efforts: Energy
FPT governments have made efforts to regulate the use of energy in a more efficient manner. A cross-
jurisdictional plan dealing with energy was approved at the 2011 Energy and Mines Ministers’
Conference. Titled the Collaborative Approach to Energy, this plan aims to facilitate collaboration among
ministers of energy in three key areas: (i) economic energy and responsible energy supply, (ii) efficient
energy use and (iii) knowledge and innovation (Canadian Intergovernmental Conference Secretariat
2011). In line with this plan, FPT governments are addressing energy efficiency through various
initiatives. For instance, FPT governments have agreed to adopt the National Energy Code of Canada for
Buildings that significantly strengthens older standards, making Canada the country with the most energy-
efficient building code in North America. Furthermore, hundreds of thousands of homes across Canada
have been retrofitted through collaborative FPT programmes to reduce costs and unnecessary usage of
energy (Energy and Mines Ministers’ Conference 2013; 2012).
In terms of knowledge generation and technology innovation, a number of tools and approaches have
been developed by FPT governments to address energy efficiency. Federal investment in research and
41 For more information on contributions to climate change, see the next chapter that focuses on environmental sustainability. 42 These estimates are based on International Energy Agency statistics. 43 This is a 2011 estimate. The figures will be more or less similar, however, for 2012.
51
development has been a primary tool to support innovation in energy technology. Some of the major
investments related to sustainable energy production and consumption include the ecoENERGY
Innovation Initiative, the Clean Energy Fund, CanmetENERGY and the Environmental Technology
Verification Program. Provinces and territories have been engaged in similar initiatives. For instance,
Alberta, British Columbia, Manitoba and Ontario have established different forms of clean energy
strategies, while the Yukon and Northwest Territories are investing in renewable energy projects (Energy
and Mines Ministers’ Conference 2014).44
Additionally, the Council of the Federation, comprised of Canada’s 13 provincial and territorial premiers,
has established the Canadian Energy Strategy Working Group. Composed of provincial and territorial
ministers of energy, this working group has the objective to ensure energy development takes place in an
environmentally sustainable manner that includes conservation and efficiency. The council’s latest
progress report, Canadian Energy Strategy, includes a seven-point action plan that addresses the
importance of balancing energy supply with economic growth and environmental protection (Council of
the Federation 2013; 2007). Several provincial and territorial initiatives have been undertaken based on
the objectives set out in the action plan.
A final point that is worth noting here is the efforts that are being made in the transportation sector to
improve fuel efficiency. Transport Canada, the federal authority charged with coordinating transportation
policies and programmes across the country, has established several sustainable transportation
programmes. The two ongoing programmes are ecoTECHNOLOGY for Vehicles, which conducts
environmental testing on emerging technologies for passenger vehicles and heavy-duty trucks, and Shore
Power Technology for Ports, which allows docked ships to use local electrical grids for power instead of
conventional diesel engines (Transport Canada 2014).45 Alongside Transport Canada, FPT governments
have also been collaborating on plans to make trucks more fuel-efficient. A guide has been developed to
this effect (see Council of Energy Ministers 2009), which several provinces are using to adopt eco-
trucking programmes. Such initiatives to promote energy efficiency in the transportation sector are
important for addressing climate change, especially considering the high level of GHG emissions in the
sector.
Current Situation: Infrastructure
Infrastructure Canada is the principal federal department responsible for public infrastructure
development and programme delivery. It works in collaboration with provinces, territories, municipalities,
the private sector and non-profit organisations. The department also works in association with other
federal departments like Transport Canada, which is responsible for transportation policies surrounding
public safety and environmental protection. At the provincial and territorial levels, infrastructure and
transportation departments and programmes have also been established to deal with local needs and
priorities. While infrastructure development is a collaborative responsibility among all levels of
government, the last few decades have seen municipalities taking a prominent role in managing local
infrastructure. As more and more Canadians have begun to reside in concentrated urban areas, the
structural demands and needs of these locales have increased (Dewing and Young 2006).
In the Canadian context, priorities related to infrastructure can vary across regions. For example, in highly
concentrated urban areas, questions related to reducing gridlock and improving public transportation are
44 For a complete list of FPT initiatives supporting energy technology innovation, see Energy and Mines Ministers’ Conference (2014). 45The department also works in partnership with other federal departments, provincial and municipal governments and international organisations to protect the environment.

52
often front and centre. In northern Canada, the relationship between infrastructure, economic
development and social well-being is most prevalent. Limited access to an all-season road in many of
these communities disproportionately increases the costs of basic goods.
A growing concern in Canada is that the current FPT funding allocation structure does not parallel the
depreciation rate of the service life of public infrastructure. The Canadian Infrastructure Report Card – a
project that was created to monitor and assess Canada’s drinking-water systems, wastewater and
stormwater networks, and roads – found that the imbalance between infrastructure investments and
increasing use has lowered the quality of transportation systems. Based on reporting from 139
municipalities, the Canadian Infrastructure Report Card estimates that only 47.5 per cent of road
networks are in good or very good condition, while 52.6 per cent are in fair or very poor condition. Experts
also noted that additional efforts are needed to help reduce commute times and improve public
transportation (Félio et al. 2012).
Further, a recent report shows that the average age of core public infrastructure46 has significantly
declined over the past decade or so – going down from 16.9 years in 2003 to 14.3 years47 in 2012. This
means that the “useful life” or service life of public infrastructure has depreciated and is currently
averaging at 53 percent, signalling that a majority of these assets’ estimated service life have reached or
passed the halfway mark (Infrastructure Canada 2014a). At the same time, municipalities have been
running fiscal deficits relative to their increasing responsibilities to maintain and build infrastructure. A
2006 report published by the Federation of Canadian Municipalities points out that provincial and federal
funding was often inconsistent and relatively minimal compared to what was actually needed on the
ground (FCM 2006). This gap in the FPT funding system has put an added stress on an already aging
infrastructure, as delays in maintenance have continued to raise overall costs.
Previous and Ongoing Efforts: Infrastructure
Infrastructure planning is primarily managed by sub-national governments, with major funding support
coming from the federal government. Central investment schemes have come in the form of two long-
term federal plans: (i) The Building Canada Plan, launched in 2007, that allocated an estimated total of
$33 billion to provinces and territories on infrastructure-related projects over a period of seven years and
(ii) the New Building Canada Plan, launched in 2013, that will make another $53 billion in investments
over the next 10 years (Infrastructure Canada 2011; Canada 2013c). Under these two plans,
Infrastructure Canada has set up five transfer payment programmes that provide funding to realise
provincial, territorial and national priorities, permanent and flexible public infrastructure, large-scale
infrastructure investments, and investments in smaller communities (Infrastructure Canada 2014a).
Provincial and territorial governments are leading the implementation of the investment funds with
additional local initiatives to address infrastructure gaps. An important driver in this context has been local
demand for job creation. Ontario, for instance, has introduced Bill 141, the Infrastructure for Jobs and
Prosperity Act, to establish an infrastructure investment framework that helps create jobs and sustain the
economy (Legislative Assembly of Ontario 2013). The federal government’s New Building Canada Plan
has also been initiated in part to address the country’s unemployment rate (Canada 2013c).
46 Core public infrastructure includes bridges, roads, water and wastewater systems, public transit, and cultural and recreational facilities. For the purpose of this study, we only look at bridges, roads and public transit. An assessment of water and sanitation systems was not included in this section because they are covered by another goal area in the potential SDG framework. 47 This estimate is projected based on a 2011 figure, 14.7 years.

53
While prompted by employment needs, Quebec’s efforts on infrastructure are linked to concerns about
the improvement of infrastructure maintenance and planning processes. In 2012, the provincial
government introduced A Better Way to Manage Our Infrastructure, an action plan that proposes a long-
term vision to address infrastructure project management based on transparency and best practices
(Québec 2012). Furthermore, the government committed $92.3 billion in 2013 for infrastructure
maintenance and construction over the next 10 years (Québec 2013a).
Quebec and British Columbia are also taking measures to address energy conservation. Quebec has
developed a Transportation Electrification Strategy that aims to reduce its transportation sector’s foreign
oil dependency and replace it with locally produced electricity (Québec2013b). British Columbia’s latest
transportation service plan outlines a strategy for developing sustainable transportation. The plan
envisions lowering GHG emissions by investing in transit, cycling and walking infrastructure (British
Columbia Ministry of Transportation and Infrastructure 2014b). The province has also taken measures to
improve mobility. One important undertaking has been the opening of the new Port Mann Bridge, which
will reduce commuting time by 50 percent during rush hour and provide better coverage for transit across
Vancouver (British Columbia Ministry of Transportation and Infrastructure 2014a).
National Priorities for Ensuring Sustainable Energy and Developing Infrastructure for All
The proposed framework for the SDGs includes a goal on ensuring access to affordable, reliable,
sustainable and modern energy with targets on affordability, reliability and access to modern energy
services, increasing renewable energy and improving energy efficiency. The targets and indicators
included in the Canada case study reflect the broad SDG targets. They emphasise renewable energy and
energy efficiency, which are of primary concern in the Canadian context.
The proposed SDG framework includes a number of targets on the quality, reliability, resilience and
sustainability of infrastructure. In addition to capturing these aspects of infrastructure development in
priorities for Canada, the issue of mobility (including improving public transportation systems) has been
included based on feedback from participants at the inception workshop. Participants agreed that mobility
should be seen in terms of affordability, accessibility, efficiency and safety.
Two targets that reflect global minimum standards are included below: (i) ensure full access to developed
infrastructure and communication technology as measured by internet users, access to all-season roads
and adults with an account at a formal financial institution and (ii) ensure access to energy and improve
efficiency and sustainability of energy supply, including renewable energy, as measured by households
with access to electricity and the share of the population with access to modern cooking solutions.
Ensuring access to infrastructure as measured by access to all-season roads is useful for Canada given
the challenges in Canada’s North with respect to infrastructure. However, the target on energy and other
corresponding indicators for infrastructure are not relevant. While the targets are important for Canada,
they would need to be measured according to indicators that are more ambitious and, as such,
appropriate for a high-income country.

54
Table 4. Ensure sustainable energy and develop infrastructure for all: Targets and indicators
Target Indicator
Global
Ensure full access to developed infrastructure and communication technology
Internet users (per 1,000 people)
Average bandwidth speed (megabits/second)
% of the population with access to an all-season road
% of adults with an account at a formal financial institution
Ensure access to energy and improve efficiency and sustainability of energy supply, including renewable energy
# of hours per day households have access to electricity on average
Rate of improvement in energy intensity
Share of the population with access to modern cooking solutions (%)
Share of renewable energy to total energy consumption
National
Ensure access to safe, efficient and affordable mobility
Proportion of fuel consumed by private transportation
Energy used by the transportation sector
Average cost of transportation, by public and private transportation modes48
Crash reduction after construction of safety improvement capital projects
Improve maintenance of public transport infrastructure
Existence of municipal frameworks or guidelines for assessing road conditions and capacity, by jurisdiction
Average commuting duration, by type of transportation mode
Annual public transit ridership
Ratio of investment in operation and maintenance of infrastructure to capital investment
Ensure access to energy and improve efficiency and sustainability of energy supply, including renewable energy
% of non-carbon, green energy to total energy consumption
Rate of change in total energy consumption, per capita
% of electricity being generated from renewable sources (wind, water, solar and bioenergy)
Total electricity available
# of person-days that people don't have access to electricity due to all causes, including weather
Cross-cutting: Establish a sustainable, healthy and resilient environment for all
Address climate change Rate of GHG emissions intensity, by industry
Data on Energy and Infrastructure
Energy
While there are some data on energy production patterns, the quality of data available for capturing a
comprehensive picture of Canada’s energy sector, including disaggregated data for all sectors and
comparable data for measuring current and historic energy consumption trends, is limited. Additional
information is especially required for measuring the share of renewable energy in total energy
consumption. Available data through Statistics Canada only provide information for the electricity sector
and exclude industries such as transportation or manufacturing. The recently published Energy Markets
Fact Book, 2013-2014 by Natural Resources Canada (2013a) provides some information on total
renewable energy consumption but only for one data point, the year 2010, which does not provide the
opportunity to compare historical trends. For measuring progress on energy efficiency, annual publication
of data showing the share of renewable energy consumption in total energy consumption will be
48 This indicator looks at the average cost of public and private transportation. It has been included to provide a comparison between the affordability of public transit and private transportation.

55
necessary. In this regard, Natural Resources Canada’s data on renewable energy for all sectors should
be calculated annually to better understand renewable energy production and consumption patterns over
time.
There are also some fundamental conceptual gaps in defining a renewable source that can create
confusion for data users who want to examine, for example, the share of non-carbon energy sources in
total energy consumption, data for which are currently unavailable in Canada. The definition for
renewable energy used by the International Energy Agency (2014a) and Natural Resources Canada
(2014a) includes solar, wind, geothermal, hydro and biomass. However, the inclusion of biomass as a
renewable source can be problematic if its consumption rate exceeds its regeneration rate. As such, data
representing energy generation from biomass should account for this factor and provide information to
users accordingly.
Infrastructure
In terms of infrastructure, measuring progress on safe, accessible and affordable mobility can present a
challenge since multiple datasets and indicators are necessary to illustrate concrete improvements.
Cognisant of this, the research team included a variety of indicators that would be useful in monitoring
affordable mobility, alongside safety, accessibility and efficiency. One way to link affordability with
accessible and efficient mobility is to look at data that show the comparative costs and times it takes to
travel by private transportation modes versus public modes. Currently, there is sufficient data through the
Survey of Household Spending that shows cost variations between the two transportation modes.
However, it should be kept in mind that an increase or decrease in spending on private vehicles can be
interpreted in a positive or negative light. In Canada’s case, this may be an indication that public
transportation systems are not efficient enough for frequent use but it could also indicate that there have
been improvements in the affordability of and accessibility to private transportation. Moving toward 2030,
careful consideration must be given in the application of this dataset for policymaking.
With regard to data monitoring of the condition of transportation infrastructure, the research team found
that commute time is a relevant metric because it captures a set period of time within which the majority
of a country’s population use a transportation mode (Félio et al. 2012; NRTSI and NRC 2009). Moreover,
commute time can be directly linked to individual well-being and affect leisure time that in turn can impact
national productivity. Currently, the NHS provides information on commute time, but only for the year
2011. So long as the survey questionnaire continues to include a question on this topic, which appears to
be the plan for 2016,49 it may serve as a useful source for measuring the indicator on commute time.
Finally, to monitor transportation quality as well as energy efficiency, an indicator on transit ridership was
included under the energy and infrastructure goal area. This indicator is specific to the Canadian context
and an increase in its value should be interpreted as positive both for reducing consumption and
conserving energy as well as showing an improvement in public transportation systems. Local transit
systems already keep count of these data and recently British Columbia started using this measure to
monitor the success of transit investments at the provincial level (British Columbia Ministry of
Transportation and Infrastructure 2012). However, there is no consolidated dataset that provides
information on transit ridership for all provinces and territories in Canada. The creation of such a dataset
would provide an important assessment tool for monitoring transit quality, which in turn could help assess
energy consumption rates.
49 Recent information from Statistics Canada (2014j) does not indicate any change in questions regarding commute times.

56
Box 9. Data strategy: Ensure sustainable energy and develop infrastructure for all
Best data sources: Canadian System of Environmental and Resource Accounts - Material and Energy
Flow Accounts, Electricity Supply and Disposition (annual survey), Survey of Household Spending,
Annual Industrial Consumption of Energy Survey, National Inventory Report, Canadian Internet Use
Survey, Fuel Consumption Survey, Consumer Price Index and National Household Survey (NHS).
Rationale: Measuring progress on sustainable energy and infrastructure development requires the use of
multiple surveys and databases. Partly owing to the variation of themes under this goal area, no one
survey stands out as a primary source for data. In this study, data on energy include indicators that relate
to measuring electricity availability and energy consumption patterns. As a result, data are collected from
multiple sources that include records, surveys and reports such as Canadian System of Environmental
and Resource Accounts - Material and Energy Flow Accounts, Electricity Supply and Disposition, Survey
of Household Spending, Annual Industrial Consumption of Energy Survey and the National Inventory
Report, among others. Infrastructure refers to both communication and transportation, which have
different data sources. Some of the surveys that have been used in this study are the Canadian Internet
Use Survey, Fuel Consumption Survey, Consumer Price Index and NHS, among others.
Limitations: Using multiple sources to analyse energy inputs/outputs and infrastructure quality can be
challenging and time-consuming. The biggest limitation of this data strategy is accounting for the data
gaps that exist across different sources, such as acquiring adequate and reliable data on road and bridge
conditions and renewable energy consumption.
Opportunities and Challenges to Ensure Sustinable Energy for All
In Canada, the context for meeting targets related to energy under the post-2015 agenda is difficult.
Given that jurisdictional responsibility is shared though often falls under the purview of the provinces
(take, for instance, electricity generation), different levels of government play an important role in
determining both opportunities and challenges. Collaboration between and among FPT governments is
an important step for ensuring sustainable energy for all that is affordable and safe. Two areas in which
Canada should invest are smart grid technology and the clean technology market. These areas have the
potential to increase energy efficiency and reduce the country’s dependence on carbon-based energy.
That being said, the challenges for progress on such a vision are manifold, beginning with a lack of
federal leadership. Limited consensus between and among jurisdictions on the gains and costs of energy
production in Canada is another key barrier.
Opportunities: Maximising the Advantages of Smart Grid Technology
In moving toward 2030, collaboration across FPT governments on developing a national energy
management framework to monitor electricity production and consumption can be an opportunity for
Canada to improve energy efficiency. The establishment of a national strategy to coordinate the adoption
of smart grid technology has the potential to directly impact the country’s energy efficiency.
By allowing consumers to monitor their electricity usage in real time, smart grid technology significantly
contributes to reducing energy overconsumption. Moreover, it presents a cost-effective solution for both

57
energy consumers and suppliers of electricity. According to the International Energy Agency,
“investments in smart grids . . . could generate up to USD 4 trillion in savings to 2050 in Europe alone,
reflecting a 4:1 return on investment” (IEA 2012). By closely monitoring electricity demand, suppliers can
reduce investment in new generation capacity and diversify output channels. From an environmental
standpoint, this increased grid flexibility can facilitate a balanced distribution of electricity generation
between renewable and non-renewable sources (IEA 2012). Such flexibility can make it possible for
renewable energy to enter the market without disproportionately increasing the cost burden for
consumers (Beauvais, Prieur and Bouffard 2012; also see Wies, Stensil and Harti 2013).
Despite the fact that all provinces are working to upgrade their grid systems, a coordinated national
strategy for adopting smart grid technology has not been developed. The only national body charged with
providing some coordination support to smart grid standardisation is the Task Force on Smart Grid
Technology and Standards (Standards Council of Canada 2012). The implementation of a national
strategy that enables provinces to synchronise smart grid projects and share best practices can benefit
the technology in two separate ways. First, in order to gain economies of scale, the streamlining of data
through a synchronised smart grid system can reduce unnecessary administrative costs and better
coordinate information channelling. Second, a national strategy that establishes stringent principles on
consumer security can address the privacy concerns that are currently being raised with regard to smart
grid’s overreliance on communication technology (Standards Council of Canada 2012). While FPT
governments have begun reviewing best practices and problems surrounding smart grid technology
(Energy and Mines Ministers’ Conference 2012), a more aggressive plan to implement a national
framework is imperative to accelerate the transition of the electricity industry to smart grid. The adoption
of such technology presents an important opportunity for Canada to secure energy supply in an efficient
and sustainable manner.
Opportunities: Paving the Path for Clean Technology (De-carbonisation)
Investment in the clean technology market presents an opportunity for Canada to improve its energy
conservation efforts both from environmental and economic standpoints. The clean tech market is a
growing portion of the global economy that is predicted to be worth US$3 trillion by 2020 (Philp et al.
2012). Renewable energy makes up a considerable portion of this market and Canada is emerging as a
leader in hydroelectricity generation. In 2013, hydroelectricity accounted for nearly 62 percent of the
country’s electricity (Statistics Canada 2014f).The provinces have been the main drivers in this market.
Two key provincial initiatives have been Ontario’s decision to phase out coal, including through the use of
renewable energy, and Newfoundland and Labrador’s construction of the Lower Churchill hydroelectric
projects, which will generate 16.7 terawatt hours of electricity annually and significantly reduce GHG
emissions (Nalcor Energy 2009; see also Environment Canada 2014f).
While Canada is clearly making progress in generating hydroelectricity, other areas of the renewable
energy market, including non-hydro renewable energy sources, remain largely untapped. A recent
estimate valued the global market to be currently worth approximately $1 trillion, of which Canada has
only a 1 percent share (Philp et al. 2012). With regard to non-hydro renewable energy sources, only
around 3 percent of total electricity generation comes from these sources (Statistics Canada 2014f). A
recent report by the International Energy Agency projects that, at the current rate of growth, the capacities
of these energy sources are expected to more than triple between 2011 and 2018 – going up from 7.6
gigawatts to 25.4. There is potential for accelerating this growth. As the report indicates, Canada has an
excellent renewable resource portfolio for wind energy and bioenergy along with hydropower. For
instance, Alberta has an abundance of wind energy and Nova Scotia has the potential to lead the
expansion of ocean energy (IEA 2013).

58
The majority of current funding for renewable energy projects come from various government sources at
the federal and provincial levels. The provinces of Alberta, Ontario and Quebec have the most robust
funding programmes, though with varying capacities and limitations. A key driver would be to the
establishment of a national framework to support financial incentives in the renewable energy market.
Such incentives are particularly useful for supporting new renewable energy projects that often face
challenges during start up. For instance, Alberta’s carbon-offsetting scheme requires facilities that emit
over 100,000 tonnes of carbon dioxide to invest in renewable energy sources and carbon capture
technology (IEA 2013). This scheme has generated revenue that has been redistributed to wind energy
projects in the province. However, given the province’s economic dependence on the oil and gas sector,
the government has avoided providing direct financial subsidies to the renewable energy market. Hence,
a national framework that creates incentives for the private sector to make investments in the form of
venture capital can be particularly useful for financing new renewable energy projects.
Careful implementation of a national feed-in tariffs framework is another way to diversify investment in
renewable energy projects (Peters and Weis 2008). Experience from Ontario’s implementation of a feed-
in tariffs framework suggests that the framework may not benefit the public if sufficient provisions are not
established to account for the decrease in renewable energy costs over time (Dewees 2012).50 As such,
any feed-in tariffs will require a thorough framework at the national level to counter economic losses for
the public. As seen in Germany, the introduction of feed-in tariffs has already helped the country shift 15
percent of its electricity supply to be generated by renewable sources (Peters and Weis 2008). Therefore,
a national feed-in tariffs framework has the potential to build a stronger renewable energy market, one
that can contribute to an efficient and sustainable energy supply, which is accessible and safe for the
public.
Challenges: Global Oil Prices and the Oil Sands
Canada’s economy is significantly impacted by the oil and gas sector. The drop in global oil prices in the
second half of 2014 has presented a unique challenge for the country. The oil sands, which have been a
major economic driving force in the industry, are likely to take the biggest hit from the fall in prices. Prior
to the price drop, IHS Cambridge Energy Research Associates (2014) projected that the oil sands would
contribute $171 billion to Canada’s GDP by 2025 – an increase of 88 percent from the share of GDP in
2012, which was roughly $91 billion. This projection now appears overestimated and it is likely to
decrease substantially as the prices of oil as well as gas continue to fall.51
While global oil prices may eventually stabilise, the most recent International Energy Agency forecast
shows that their decline will persist well into the first half of 2015 (IEA 2014b). Furthermore, the extent of
this decline is unclear and current estimates put the average price of oil, here measured in terms of Brent
crude oil, at US$68 per barrel for 2015 (US Energy Information Administration 2014). This price could
plunge even further in light of the November 2014 meeting of the Organization of the Petroleum Exporting
Countries (OPEC), where members decided not to lower production from its 2011 level at 30 million
barrels per day (OPEC 2014). With no measures to bring down oil and gas supply, the impact will be most
pronounced in 2015 as demand sees little to no growth – it is expected to increase by only 1.1 million
barrels per day (IEA 2014b).
50 It was estimated that solar power, while generating only 2 per cent of Ontario’s electricity output, would cost the province $1.25 billion annually by the end of 2014 (Sharp 2013). Ontarians bore this massive expense due to government failure to account for the decrease in solar energy cost overtime. 51 At the beginning of October 2014, the global average price of Brent crude oil was approximately US$99. In December 2014, when this report was being finalised, the global average price had dropped to US$61.38 (NASDAQ.com 2014).
59
Given the capital-intensive bitumen (oil sands crude) extraction process, these low prices will not only hurt
Canadian sales but also impact Canadian oil producers’ profit margins as production costs become less
competitive compared to those of conventional crude52 – for instance, those found in OPEC members.
Some Canadian companies have started reacting to the plunge in prices by altering investment decisions,
particularly for new projects (IEA 2014b; Lewis and Tait 2014; Tuttle 2014). This is visible in the case of
Statoil and Cenovus: “Statoil has reported that it is delaying the development of the Corner [steam-
assisted gravity drainage] project in northern Alberta by at least three years in favour of more
economically competitive projects as material and labour costs render the project unattractive” (IEA
2014b, 25–26). Cenovus, on the other hand, will adjust its capital expenditure for 2015 to generate near-
term cash flows (IEA 2014b). Canadian companies are not the only ones being impacted by declining oil
prices. US companies producing shale oil, which also uses a capital-intensive extraction process though
to a lesser degree, are expected to experience some decline in production. Overall, capital-intensive oil
industries are going to struggle with low oil prices and in Canada’s case, companies producing oils sands
crude, with its resource-intensive extraction process, are likely to bear the brunt of this struggle.
Market volatility has the potential to threaten stable economic growth in Canada. It is expected to cut
nominal growth of the economy by nearly $3 billion in 2015 with more cutbacks to come in the following
years (Isfeld 2014). A way forward for Canada is to diversify the energy sector by further investing in the
clean technology market – an area that, as noted, presents a development opportunity for the country.
This is especially true for future-proofing Canada’s economy not only from oil price shocks, but also
to offset any changes in consumption patterns which will likely shift to more sustainable and renewable
energy sources given the increasing concern to address climate change53 (School of Political Studies,
University of Ottawa, personal communication; The Community Power Report, personal communication).
Given both market volatility and climate change, remaining dependent on oil sands crude for generating
revenue can potentially hurt Canada’s economy and the challenge now is to find a balance between the
development of the oil and gas sector and the usage of alternative fuel sources like renewable green
energy. This is especially important for achieving the SDG targets related to ensuring access to energy
and improving the efficiency and sustainability of the energy supply, including renewable energy.
Challenges: Divergent Interests and Insufficient Federal Leadership
Another challenge for Canada is ensuring that federal leadership engages in FPT collaboration for
developing both the non-renewable and renewable energy sectors. Given that energy resource
development falls under the jurisdiction of the provinces, it can be difficult to find common ground for
discussing a national energy framework – an issue also raised by a provincial-level representative during
a stakeholder interview (Ministry of Energy, Government of Alberta, personal communication). Efforts by
the Energy and Mines Ministers’ Conferences and Council of the Federation are commendable. However,
it is important to recognise that natural resources vary across provinces and territories, with Alberta
leading the way in energy production, followed by British Columbia, Manitoba and Saskatchewan. Federal
efforts to address imbalances can be difficult since regional interests vary and stringent policies may be
required to ensure shared benefits from the gains of energy production and export.
The federal government’s current focus on developing the oil sands in Alberta provides limited
opportunities for other energy sources, such as renewable sources, to gain larger shares of Canada’s
52 Conventional crude oil is extracted through standard methods that are less capital-intensive as opposed to oil sands crude, which is extracted through thermally intensive methods such as steam-assisted gravity drainage. 53 The European Union recently attempted to label Canada’s tar sands as the “dirtiest” and a recent shipment of bitumen (oil sands crude) to Spain was greeted with protests by environmentalists (Kassam and Vaughan 2014).

60
energy market. This, in turn, creates barriers for provinces and territories that do not produce or produce
little non-renewable energy to develop their energy sectors. The situation is exacerbated for Canadian
territories that are primarily dependent on imported fossil fuels, mainly in the form of diesel, for energy
generation (see Box 10). The impact of this situation is twofold. First, dependence on imported energy
leaves the North vulnerable to volatile price fluctuations54 and, second, emissions from diesel have
severe implications for air quality in the North, which is already being impacted by climate change
(National Energy Board 2011; Northwest Territories, Nunavut, and Yukon 2011). There is a need for
federal government initiatives to support opportunities for sustainable energy production and consumption
in the territories.
The greatest challenge for Canada in achieving the SDGs is bringing all the provinces and territories on
board to recognise the benefits of investing in alternative energy markets and garnering federal efforts to
do so. Federal leadership here is warranted, but to date, other than a few collaborative approaches noted
earlier, no substantive steps have been taken to effectively move forward on a national plan for
sustainable, efficient energy production. Instead, tremendous measures are being taken by the federal
government to pursue the development of the oil sands.
Box 10. Energy generation: Spotlight on the North
Clean and affordable energy generation is a major challenge for communities living in Canada’s North,
mainly comprised of the Yukon, the Northwest Territories and Nunavut. Cold climatic conditions and a
sparse population – 100,000 people dispersed over 3.5 million square kilometres – have left communities
dependent on imported fossil fuels that significantly raise the cost of living. One of the main sources of
energy primarily used for electricity generation is diesel. Nunavut’s electricity is generated entirely from
diesel. Propane and natural gas are two other common sources of energy in the region. As carbon-based
compounds, these sources emit GHG emissions that are significantly contributing to environmental
degradation in a region that is already being disproportionately impacted by climate change. Moreover,
per capita energy use in the North is very high (almost double) when compared to the rest of Canada due
to extreme temperatures – which adds further to the environmental burden (National Energy Board 2011).
Some initiatives to transition to renewable energy sources like hydro, wind, biothermal and biomass as
well as hybrid systems have already been undertaken in the North (Northwest Territories, Nunavut, and
Yukon 2011). However, the high costs of implementing alternative energy technologies – chiefly due to
the difficult geography of the region and lack of adequate infrastructure – has impeded the development
process (National Energy Board 2011). As a result, communities continue to rely on carbon-based fuels
for energy generation and do not make progress on energy efficiency and environmental sustainability.
Opportunities and Challenges to Develop Infrastructure for All
Opportunities: Municipal Infrastructure Strategies
The municipal fiscal deficit for infrastructure management, noted earlier, suggests that there is a need to
further restructure the municipal funding system. Some initiatives are already underway to address this
problem. For instance, the federal government has taken measures to increase the Gas Tax Fund,
projecting to invest nearly $10 billion over the next five years across provinces and territories
(Infrastructure Canada 2014b). The fund channels resources to municipalities to help support the
54Though it should be noted that the recent decline in oil prices might temporarily benefit the territories.

61
maintenance and construction of local infrastructure. Currently, the federal government makes bi-yearly
payments to provinces and territories, which are then redistributed among municipalities. While this is
arguably a predictable source of funding for municipalities, the system of payments could be improved by
the federal government reducing intermediary transactions and targeting funding to meet specific
community needs.
Provinces and territories also have a significant role to play in reducing municipal burdens and ensuring
local needs for infrastructure maintenance are adequately met. Timely funding for road and bridge
maintenance is imperative for increasing the service life of the infrastructure and avoiding unnecessary
replacement costs, which can be very high (Félio et al. 2012). A key provincial initiative has come from
Ontario. By proposing the development of a municipal infrastructure strategy, Ontario has actively begun
pursuing FPT cooperation to address municipal infrastructure challenges (Ontario Ministry of
Infrastructure 2012). This presents greater opportunities for partnering with municipal authorities.
As Canada signs on to the post-2015 agenda, such collaborative approaches can be a significant step
forward in combating the municipal fiscal deficit for infrastructure management and improving public
infrastructure maintenance. The country’s aging infrastructure requires immediate attention from all levels
of government, since neglect will only increase the costs of maintenance and replacement.
Challenges: Municipal Capacity to Manage Public Transportation
A primary challenge for Canada in dealing with infrastructure management is addressing the country’s
aging transportation infrastructure through its management at the municipal level. This challenge has
implications for Canada’s ability to sustainably manage and maintain infrastructure, a national priority
identified for post-2015.The latest data show that a greater share of core public infrastructure, which
includes transportation systems, has seen a nearly 50 percent reduction in service life (Infrastructure
Canada 2014a). Given the significant role that municipalities have come to play in managing
infrastructure, it becomes imperative that municipal capacity to assess infrastructure conditions is
strengthened. Recent modifications to the municipal funding system is certainly a step forward, but there
are still significant budget gaps that present a challenge for municipal asset management. The recent
Canadian Infrastructure Report Card indicates that many municipalities lack the adequate financial
resources to establish regular assessment programmes for monitoring road conditions. For instance, it
was found that only 60 percent of municipalities that reported data on road capacity had a systematic
process in place to assess road capacity against public demand (Félio et al. 2012).
The lack of municipal capacity to adequately assess the conditions of key transportation systems is
concerning because without assessment frameworks it is difficult to understand the extent to which the
service life of road systems will continue to depreciate. Such frameworks are especially important for
monitoring the post-2015 targets on public transportation infrastructure. The current data show that
Canadians spend on average approximately 25 minutes commuting to work one way, with travel times
longer in metropolitan areas such as Toronto and Montreal, which have average commute times of
around 30 minutes (Turcott 2011; Statistics Canada 2013b). With regard to public transportation systems,
only 12 percent of commuters use public transportation and spend on average between 40–52.5 minutes
commuting compared to private vehicle users who spend on average approximately 23.7 minutes
(Statistics Canada 2013b). In order to improve commute times and encourage the use of fuel-efficient
transportation means like public transportation systems, municipalities in cooperation with federal
authorities will need to establish stronger assessment frameworks for monitoring the conditions of
transportation infrastructure. In the absence of such efforts, it will be difficult to realise improvements in
the area of public transportation.

62
Challenges: Access to All-Season Roads
With Canada’s vast territory and extreme weather conditions, ensuring access to all-season roads for
every community presents a unique challenge for FPT governments. To address this challenge in the
North, the federal government is investing in the construction of an all-season road between Inuvik and
Tuktoyaktuk in the Northwest Territories (Infrastructure Canada 2014a). This initiative is an important step
forward, particularly since the majority of communities in the North lack access to all-season roads and
often rely on expensive and inefficient transportation systems like air transport or unsafe ground
transportation on winter roads.55 Nevertheless, there are still many places in the North where people do
not have access to safe and affordable transportation. For example, in the northern part of Manitoba that
sees sub-Arctic climatic conditions with varying temperatures in summer and winter, 30,000 people live in
28 remote communities within a 560,000 square kilometre area with limited transportation systems and
almost no reliable ground infrastructure like roads and railways (Taylor and Parry 2014). The lack of a
reliable ground transportation system has meant that these remote communities rely on alternative
means for moving goods and supplies, which can greatly increase the cost of living.
Canada’s territories are confronted by a similar situation. Nunavut, which has approximately 32,000
residents, has an abundance of mineral wealth. However, it also lacks a reliable ground transportation
system. As a result, the territory has been unable to capitalise on its vast supply of natural resources and
continues to remain dependent on federal funding assistance. A report published by Action Canada found
that the current revenue generated by Nunavut’s only mining company, Agnico Eagle Mines Ltd.,
represents 15 percent of the territory’s GDP (Anderson et al. 2014). This is a significant figure considering
that nearly 91 percent of the territory’s annual budget depends on federal funding. The development of
the mining industry has the potential to propel economic growth and reduce Nunavut’s dependence on
the federal government, yet it will be difficult to sustain accelerated growth without adequate ground
infrastructure.
Ensuring access to reliable road systems can certainly benefit the economies of the North but the
challenge is not only road construction but also maintenance. This is partly due to the high costs of
infrastructure management in sparsely populated remote locations and partly a result of the region’s
difficult geographic terrain. Such economic and geographic constraints create a level of uncertainty that
can isolate communities, further thwarting development and decreasing living standards.
The disadvantages faced by communities lacking access to an all-season road demonstrates the
intersectionality of the SDGs in the Canadian context. For instance, targets to “reduce extreme income
poverty,” “support inclusive growth and reduce inequality” and “achieve full and productive employment
for all” will not be met if people do not have access to safe transportation systems or if sub-national
governments lack the necessary ground infrastructure to grow their economies. Most importantly, having
underdeveloped road systems in marginalised communities in Canada will not be in line with the vision of
the proposed SDGs to “leave no one behind.”
55 The safety concerns regarding the use of winter roads are a product of climate change. This issue will be discussed in greater detail later on in the report.

63
Establish a Sustainable, Healthy and
Resilient Environment for All
Current Situation
Environmental Health
Canada boasts a diverse ecosystem with a wide array of flora and fauna.
Much of the country’s economy relies on natural resources that allow for
the production of timber, fish products, drinkable water and many other
commodities. In 2011, it was estimated that the direct contribution of the
natural resource sector accounted for 15 percent of nominal GDP while
indirect contributions accounted for an additional 4 percent (Oliver 2012).
Moreover, Canada’s natural resources are of global significance. For
instance, almost a quarter of the world’s boreal forests and 15 percent of
temperate forests are found in Canada (Commissioner of the
Environment 2013). The country also holds 7 percent of the world’s
drinkable freshwater, with the Great Lakes being the largest freshwater
reservoir.
Environmental protection is a shared responsibility among FPT
governments. The federal government is primarily responsible for
regulating all environmental matters that are international and inter-
provincial/territorial in nature or fall within federal jurisdiction. The
provinces and territories, on the other hand, are responsible for
protecting the majority of the environment within their jurisdictions, which
can include managing waste and reducing water and air pollution. The
principal legislation guiding environmental protection is the Canadian
Environmental Protection Act (Parliament of Canada 1999) and the
national regulatory body is Environment Canada.
A national-level plan has been established to safeguard the environment.
In 2008, the federal government passed the Federal Sustainable
Development Act that has guided the development and implementation of
the Federal Sustainable Development Strategy and establishment of
goals and targets related to sustainable development (Canada 2008a).
The Federal Sustainable Development Strategy makes the federal
government’s decisions and plans regarding the environment more
transparent to the public and the government accountable to Parliament.
Originally introduced in 2010 for a three-year period, the strategy has
recently been renewed for another three years and addresses four key
themes: (i) addressing climate change and air quality, (ii) maintaining
water quality and availability, (iii) protecting nature and Canadians and
(iv) shrinking the environmental footprint.
Section Highlights
National Priorities
Address climate change
Build resilience and reduce
vulnerability to natural
disasters
Safeguard ecosystems and
biodiversity
Improve air and water
quality
Reduce per capita waste
Improve integration of
biodiversity, ecosystem
services and benefit-sharing
Key Data Sources
Canadian Environmental
Sustainability Indicators
Variety of additional sources
given scope of the goal area
Opportunities
Policies, plans and
coordination mechanisms
linked to a number of target
areas already in place
Sub-national government
initiatives address disaster
resilience and climate
change
Challenges
Significant variation between
federal and sub-national
approaches to
environmental sustainability,
including addressing climate
change

64
Internationally, Canada is a signatory to a number of multilateral and bilateral agreements, including, inter
alia, the Convention on Biological Diversity, UN Framework Convention on Climate Change, Copenhagen
Accord and UN Basel Convention on the Control of Transboundary Movements of Hazardous Wastes
and their Disposal. The United States is Canada’s central partner and the two countries cooperate on
policies to govern key resources. For example, the Canada–United States Great Lakes Water Quality
Agreement establishes a framework for the two countries to plan for and respond to both human-induced
and natural disasters (Canada and United States of America 2008). Strategies to regulate the
environment involve FPT governments and international cooperation.
In Canada, air and water quality vary by region. As with most industrialised countries, urban areas face
the greatest challenge with regard to pollution. That being said, Canadian cities have fared comparatively
well in controlling air pollution based on a survey conducted by the World Health Organization. The
survey compared the prevalence of respirable particulate matter (PM10) and fine particulate matter
(PM2.5) – key indicators of urban air pollution – across 1,100 cities and found that the overall air quality of
Canadian cities is third best in the world (WHO 2014).Environment Canada (2014a) compiled historical
emissions tends that demonstrate that emissions of 13 air pollutants have declined between 1985 and
2012. In terms of water quality, overall freshwater quality is in good standing for the majority of Canada
with 84 out of 101 national monitoring sites having a consistent freshwater quality score between 2003
and 2011 and 13 other sites showing significant improvements (Environment Canada 2014e). These
results do not necessarily capture water quality conditions for all communities in Canada. In particular,
they fail to show the situation on Aboriginal reserves where poor water quality has had severe negative
impacts on livelihoods (see Box 11).
Canada’s vast forest resources are a significant concern for conservation. Natural Resources Canada’s
(2014c) report on the state of Canada’s forests found that 153 million hectares of forestland out of 348
million hectares are being sustainably managed. The country also has 8.6 million hectares of forest
damaged by insects, 4.2 million burned in forest fires,56 0.6 million harvested for timber57 and 0.05 million
deforested. That being said, the report notes that “[w]ood volume is expected to stay relatively unchanged
as both harvesting and natural disturbances (such as fire and insect infestation) continue to be offset by
forest regeneration and growth” (Natural Resources Canada 2014b). Further, a general decline in paper
demand and the recent collapse of the US housing market has decreased demand for Canadian lumber
and commercial harvest activities declined by 12 percent between 2011 and 2012 (Natural Resources
Canada 2014b). In terms of the total area of land and water protected for conservation purposes, there
has been a significant increase with the protection of terrestrial area – land and freshwater – doubling
over the past 20 years (Environment Canada 2014c). The majority of protected areas are located in
Canada’s North and the total area is almost proportional to the size of Ontario.
Despite the successes in conservation efforts, a major challenge for Canada is reducing GHG emissions,
which, as noted, are partly the result of over consumption. With regard to GHG emissions per capita,
Canada ranked 30th out of the OECD’s 34 member countries in 2011 (OECD 2014a). Regarding the
absolute value, the data available for 2012 indicate that Canada’s total GHG emissions were estimated to
be 699 megatonnes of carbon dioxide equivalent – up from the 1990 estimate of 591 megatonnes
(Environment Canada 2014f). According to the Copenhagen Accord, Canada pledged to maintain its
GHG emissions target at 611 megatonnes in 2020. However, Environment Canada (2014h) recently
projected that the country will most likely fail to meet its that target since emissions are expected to rise to
727 megatonnes by 2020 – requiring a reduction of 116 megatonnes. It is important for Canada to set
56 Here, forest fires refer to fire resulting from natural causes. 57 Harvesting forestland for timber is heavily regulated in Canada and coordinated with artificial regeneration practices since natural regeneration occurs for less than half of harvested forestland.

65
strict regulations to reduce GHG emissions given that, despite a small population, the country is already
accounting for 2 percent of global GHG emissions (Canada 2013a). As will be discussed in greater detail
later in the report, the impacts of climate change in Canada will vary across regions with some places
experiencing greater risks than others. Keeping in line with the vision of the proposed SDGs to “leave no
one behind,” the federal government must address this problem if well-being for all of society is to be
upheld.
Box 11. Environmental health in Aboriginal communities and the post-2015 commitment to “leave
no one behind”
Aboriginal communities are often disproportionately affected by poor environmental health. A study of air
quality in Alberta’s Athabasca region found that chemical concentrations from activities related to the oil
sands have significantly lowered air quality (Cotter 2014; for a scientific report see Parajulee and Wania
2014). Despite having a sparse population density, the Athabasca region was found to have air quality
comparable to urban areas like Toronto. It is unclear to what extent air quality is being affected by
pollution on Aboriginal reserves, since the majority of air quality monitoring sites are located in and
around urban centres, which results in a considerable data gap (Assembly of First Nations, personal
communication).
In addition to concerns related to lower air quality, Aboriginal communities face increasing health risks
associated with contaminated sites58 and poor water quality. Though contaminated sites are found all
across Canada, Aboriginal peoples living on reserves are affected disproportionately by these sites as
they prevent communities from capitalising on land-based resources that have been traditionally
employed for economic sustenance. Aboriginal Affairs and Northern Development Canada found more
than 3,766 contaminated sites on reserves in 2012, out of which 2,876 are either active or suspected to
be active (AANDC 2012a).
Water quality on reserves also raises considerable health and sanitation concerns. In 2011, a report
published by the auditor general of Canada noted that nearly half of the water systems on reserves were
unsafe to drink from and posed significant risks to residents (Office of the Auditor General of Canada
2011). Moreover, many households do not have access to clean running water and must haul water from
neighbouring standpipes (Stastna 2011).
The alarming water quality conditions on reserves coupled with poor air quality indicates that significant
environmental disparities exist within Canada and many Aboriginal communities are subjected to unfair
living conditions. Environmental health on Aboriginal reserves is clearly an area that FPT governments
must address to ensure that they “leave no one behind” in moving toward 2030. Furthermore, the
disproportionate gap between the water quality on reserves and that in other locales in Canada indicates
that there is an urgent need to generate disaggregated data.
Disaster Resilience
With respect to issues related to disaster resilience, the Emergency Management Act is the main national
legislation guiding FPT responsibilities (Parliament of Canada 2007). It takes a localised approach under
which municipalities are given the primary duty to serve as first respondents to disasters such as flooding
and wildfire, though Public Safety Canada is the federal government department tasked with managing
58 A contaminated site is "one at which substances occur at concentrations (1) above background (normally occurring) levels and pose or are likely to pose an immediate or long term hazard to human health or the environment, or (2) exceeding levels specified in policies and regulations” (Treasury Board of Canada Secretariat 2014).

66
emergency planning. Public Safety Canada’s mandate is to coordinate emergency planning with
provinces and territories, especially in cases when local authorities are unable to cope with a disaster or
emergency.
Disasters in Canada tend to have significant economic impacts on society, with some instances requiring
forced evacuation while others mainly cause destruction to properties and the environment. Since the
majority of the Canadian population live in urbanised areas, urban flooding is a significant challenge for
municipalities and homeowners. The latest data show that the cost of urban flooding can range from tens
of millions to hundreds of millions of dollars. For instance, the city of Montreal incurred a loss of $260
million dollars in insured damages in 2012 due to flooding. In 2005, heavy rainfall in southern Ontario cost
municipalities in the region over $500 million in insured damages. The other city in Canada that has
incurred heavy losses due to constant spring flooding is Calgary. Homeowners also face a difficult
situation, as the majority are not insured for groundwater or overland flooding (Sandink 2013). However, it
is important to note here that very few deaths occur as a result of flooding in Canada, though there may
be related health risks.
Wildfires are also a concern during Canada’s summer months (June–September), particularly in the
western parts of the country. They have been known to wipe out forestland and vegetation and threaten
communities – particularly Aboriginal communities – that live in and around wildland. Current data show
that between 2010 and 2014 there were 13 incidents of wildfire, out of which six significantly impacted
communities (Public Safety Canada 2014b). One of the most severe cases occurred in northern Alberta
in May 2011 when some 49 wildfires led to the forced evacuation of 12,055 people. The net economic
loss for the communities was estimated at $700 million. More recently, British Columbia has been
experiencing a greater share of wildfires. In 2014, it was reported that 200,000 hectares of land had been
destroyed by wildfire – the largest fire incident since the 1950s (CBC News 2014).
A growing concern for Canada is climate change and the potential impacts that it will have on
environmental and community resilience in the North.59 With rises in temperature, the dramatic melting of
the polar ice cap in the Arctic has already placed a significant portion of wildlife, such as polar bears, at
risk while threatening the food security of indigenous communities who depend on hunting to survive
(Guyot et al. 2006; Schuster et al. 2011). However, it is important to note that melting sea ice creates
navigable shipping routes60 (Pizzolato et al. 2014; Stewart et al. 2007). In particular, Arctic cruise tourism
has significantly increased since 2005, which creates economic opportunities for local communities in the
area. That being said, there is growing concern over the adverse effects that tourism can have on
communities, especially in terms of its impact on traditional ways of life (Department of Geography,
University of Ottawa, personal communication; see also Allison 2013). Mitigating the risks to communities
posed by a growing tourism industry and the melting of the polar ice cap presents a unique challenge for
Canada’s North with some notable opportunities. Though it is not only Canada’s North that will be
impacted by climate change, since a dramatic rise in the sea-level will also severely affect coastal areas.
For example, Vancouver – Canada’s third largest city – is at high risk of experiencing overland flooding in
the coming years, alongside other coastal cities in the province of British Columbia (Hallegatte et al.
2013).
59 This issue will be discussed in greater detail later in the report. 60 For instance, shipping vessel counts have increased by 20 per cent from 2007 to 2012 – mainly due to an increased number of fishing boats using these routes (Pizzolato et al. 2014).

67
Previous and Ongoing Efforts
Environmental Health
The Federal Sustainable Development Strategy has resulted in several national-level plans and policies
to safeguard the environment. All federal departments have made commitments to implement the
strategy, with Environment Canada assuming a stewardship role. To support the strategy, the department
has started regulating GHG emissions, especially for the transportation and electricity industries
(Environment Canada 2013g). Efforts have also been made to advance cleaner energy production.
Aboriginal Affairs and Northern Development Canada has developed its own departmental target on
water quality and quantity that aims to lower risk ratings for on-reserve water and wastewater systems.
The department has also established implementation strategies for two specific Federal Sustainable
Development Strategy goal areas on climate change and ecosystem conservation and restoration.
A number of environmental initiatives have also been introduced as a result of Canada’s international
commitments. For instance, the UN Convention on Biological Diversity has informed several plans on
environmental conservation. The latest draft by the Federal-Provincial-Territorial Biodiversity Working
Group (2011; 2013) establishes an overarching framework to protect biodiversity. It is based on the
internationally agreed upon Strategic Plan for Biodiversity 2011-2020, which came out of the 10th
meeting of the Conference of the Parties for the Convention on Biological Diversity (CBD 2011; also see
Box 12). All parties to the convention committed to translate the strategic plan into a national framework
within two years. The framework developed by the Federal-Provincial-Territorial Biodiversity Working
Group lists several goals and targets relating to water and land management, sustainable production and
consumption, and biodiversity knowledge generation that Canada should achieve by 2020.
Box 12. Aichi Biodiversity Targets and indigenous knowledge and land-use practices
The Aichi Biodiversity Targets form the basis of the Strategic Plan for Biodiversity 2011-2020. The
strategic plan is comprised of a list of 20 global biodiversity targets and sets an important precedent for
indigenous communities. In particular, target 18 of the Aichi list officially recognises the significance of
indigenous knowledge and land-use practices for biodiversity conservation. It reads:
By 2020, the traditional knowledge, innovations and practices of indigenous and local
communities relevant for the conservation and sustainable use of biodiversity, and their
customary use of biological resources, are respected, subject to national legislation and relevant
international obligations, and fully integrated and reflected in the implementation of the
Convention with the full and effective participation of indigenous and local communities, at all
relevant levels. (CBD 2011; also see CBD 2013)
The introduction of such a provision is an important step forward in recognising the value of traditional
land-use practices. Several other targets also make special provisions for ensuring the inclusion of
indigenous groups in biodiversity planning given its significance to their traditional ways of life.
The federal government has taken initiative to reduce GHG emissions through a sector-by-sector
regulatory approach that was introduced in 2007 (NRT 2012). This approach aims to establish emissions
and product performance standards for several sectors including, among others, transportation,
electricity, and oil and gas. So far, the government has taken some initiative to reduce emissions in the
transportation and electricity sectors. For instance, the federal government, in collaboration with the

68
provinces, succeeded in shutting down some of the coal-fired electricity plants across the country – most
evident in Ontario, which, as noted earlier, became the first province to close all coal-based plants.
According to the 2014 Canada’s Emissions Trends report, the regulations on coal-fired plants mean that
Canada will be able to cumulatively reduce GHG emissions to nearly 214 megatonnes within 21 years
(Environment Canada 2014b). With regard to the transportation sector, the aforementioned federal
initiatives to increase fuel efficiency and launch eco-trucking programmes are also contributing to
reducing GHG emissions. For instance, heavy-duty vehicle regulations are expected to reduce emissions
by 23 percent from 2018.
These projections indicate sectoral regulations that are being implemented under the federal sector-by-
sector approach have the potential to reduce emissions, but this potential may not be realised if the
government does not take stringent action to address the oil and gas sector. So far, the federal
government has delayed any attempts to regulate this sector and recent statements suggests that little
will be done in 2015.61 However, the provinces, mainly British Columbia, Quebec, Alberta and to a lesser
extent Manitoba, are making efforts to regulate the oil and gas sector. The most progressive of these
plans has been British Columbia’s carbon-pricing system, which has emerged as a viable model for
Canada and the rest of North America (Beaty, Lipsey and Elgie 2014; Lee 2011). Introduced in 2008, a
carbon tax applies to all GHG emissions generated within British Columbia. Between 2008 and 2012, the
tax rate was set to annually increase by $5 per tonne, starting at $10 per tonne in 2008 and ending with
$30 per tonne in 2012 (British Columbia Ministry of Finance 2014b). The carbon-pricing system is
revenue neutral, meaning that the money generated from taxing the burning of fossil fuels is reinvested to
reduce other provincial taxes, and has helped generate approximately $1.2 million in revenue while
substantially reducing fossil fuel use (British Columbia 2008; British Columbia Ministry of Finance 2014a).
Quebec has introduced a cap-and-trade system that is also quite comprehensive in nature. This system
has evolved out of Quebec’s participation in the Western Climate Initiative,62 which aims to create a
harmonised emissions-trading programme in North America. It regulates businesses that emit more than
25,000 metric tonnes of carbon dioxide, requiring these businesses to either purchase emission
allowances or upgrade to clean technology (Ministère du Développement durable, de l’Environnement et
de la Lutte contre les changements climatiques, Québec 2014). Alberta and Manitoba have both
introduced carbon-pricing systems though their success rates in reducing GHG emissions have varied.
Alberta’s model requires major industrial facilities to reduce emissions by only 12 percent over a nine-year
period (Partington 2013). Manitoba, on the other hand, takes an even narrower approach that applies an
emissions tax mainly to coal. Evidently, some initiative is being undertaken at the provincial level to
regulate emissions in the oil and gas sector while the federal response remains comparatively weak and
shows little sign of progress.
Disaster Resilience
With respect to emergency management, a national policy has been developed to address emergencies
whose scale and magnitude are outside the capacity of local authorities to handle. The Federal Policy for
Emergency Management adopts an all-hazards approach to human-induced and natural disasters that
encompasses four key pillars: mitigation/prevention, preparedness, response and recovery (Public Safety
61 In December 2014, the current government indicated that it would not impose any unilateral regulations on the oil and gas sector to curb GHG emissions while Canada is being confronted by a global decline in oil prices (Canadian Press 2014b; McDiarmid 2014; Cheadle 2014a). 62 The current members of the Western Climate Initiative are British Columbia, Ontario, Quebec and Manitoba as well as the US state of California. Of the five members, Quebec and California have been most proactive in keeping with the initiative’s commitments. British Columbia, which has had some significant success with carbon pricing, has chosen to remain quite “removed” from the initiative’s process (Purdon, Houle and Lachapelle 2014).

69
Canada 2012). A planning guide, which outlines steps to implement these pillars in an effort to harmonise
emergency response protocols across jurisdictions, has also been developed (Public Safety Canada
2010). Alongside emergency management plans, FPT governments have agreed on Canada’s National
Disaster Mitigation Strategy to foster knowledge sharing and share a common understanding of the
responsibilities that each level of government holds for mitigating disasters (Public Safety Canada 2008).
Canada’s national framework for emergency management has evolved with an explicit recognition of the
importance of coordinated and collaborative plans.
Provincial and territorial emergency management plans tend to be more comprehensive in nature than
federal plans in that they pertain to environmental conditions and potential hazards within local
boundaries. For example, British Columbia has established hazard-specific plans for flooding and wildfire
alongside an all-hazards plan that outlines provincial responses to hazards that are more common or
high-risk (Emergency Management British Columbia 2014). Further, emergency planning between
jurisdictions is also being coordinated to manage disasters that affect multiple provinces and territories.
For instance, Alberta is developing its Earthquake Response Plan for British Columbia to coordinate
response plans between the two provinces in the event of a catastrophic earthquake (Alberta Emergency
Management Agency 2012).
Given the impacts of wildfires on indigenous communities, the First Nations’ Emergency Services Society
of British Columbia was established to provide emergency services within Aboriginal communities (though
it now offers a broader range of services). To date, several programmes have been established to reduce
the risks of residential and forest fires on reserves (First Nations’ Emergency Services Society of British
Columbia 2014). Such programmes at the grassroots level show that emergency management is also
being driven by particular community needs in different parts of Canada.
National Priorities to Establish a Sustainable, Healthy and Resilient Environment for All
At the international level, a number of goal areas have been proposed that relate to the environment,
including ensuring sustainable consumption and production, addressing climate change, conserving
water resources and protecting ecosystems (OWG 2014). Some 38 targets have been suggested across
these goal areas. Given the scope of this study, a portion of the targets and indicators listed below relate
to the potential global SDG framework, including provisions related to reducing waste and trends in
ecosystem conservation such as deforestation.
Given the diversity of Canada’s ecosystems, targets and indicators for specific ecosystems were
suggested by stakeholders throughout the research process, such as those on the loss of Arctic lands
and wetlands.63 A number of targets and indicators were also drawn from Canada’s commitments under
the UN Convention on Biological Diversity. These include indicators on integrating biodiversity into
educational curricula and participation by indigenous peoples in the traditional economy (i.e., arts, fine
crafts, trapping, etc.).Targets and indicators on water and air quality were also included, given that health
problems are increasingly tied to these issues.
In the goal area on climate change, the potential SDG framework includes provisions on building
resilience to climate change and disasters. During the inception workshop, participants deemed the
establishment of disaster mitigation plans to be a priority for Canada. A number of specific indicators have
been included to examine the impacts of natural disasters in terms of economic losses and displacement.
63 The ecosystems covered are hardly exhaustive – only a sample is included here. Presumably, indicators would be needed to capture other important ecosystems as Canada moves forward on the SDGs.

70
The global minimum standard included for this goal area is “publish and use economic, social and
environmental accounts in all governments and companies” as measured by companies publishing
according to integrated reporting standards and the federal government’s use of the System of
Environmental-Economic Accounting, which was initiated by the UN Statistical Commission to organise
statistical data to monitor interactions between the economy and the environment. The system, which
involves standard concepts, definitions, classifications, and accounting rules and tables allows the
government to produce internationally comparable statistics. With respect to integrated reporting, no data
currently exist on the extent to which Canadian companies – or large tax units – publish according to
integrated reporting standards. More work is needed to develop an appropriate methodology for capturing
this indicator, which is an area that is quite relevant for Canada, particularly in terms of accounting for the
private sector’s contributions to sustainable development.

71
Table 5. Establish a sustainable, healthy and resilient environment for all: Targets and indicators
Target Indicator
Global Build resilience and reduce deaths from natural hazards
Disaster deaths per 1,000 inhabitants
Safeguard ecosystems and biodiversity Net loss in forest area (% of land area)
Trends in coverage of protected areas
Publish and use economic, social and environmental accounts in all governments and companies
Share of large tax unit taxpayers using integrated reporting64
Existence of national and sub-national government publishing according to the System of Environmental-Economic Accounting65
National Build resilience and reduce vulnerability to natural hazards
% of public infrastructure owners that have produced disaster mitigation plans
# of people displaced by natural disasters
# of person-days people are displaced due to natural disasters
Direct economic losses from natural disasters (% of GDP)
% of the population displaced by wildfire in the last five years
% of the population exposed to flooding in the last five years
Safeguard ecosystems and biodiversity Area of terrestrial ecozones covered by forest land, disaggregated by forest type
Proportion of the Arctic conserved
Habitat secured for waterfowl (wetlands)
Proportion of at-risk wildlife species whose status is upgraded to higher risk (annual)
Proportion of medium and large population centres that have developed biodiversity conservation strategies
# of jurisdictions who have integrated biodiversity into elementary and secondary curricula
Area of forest disturbed annually by insects (three species: forest tent caterpillar, mountain pine beetle, spruce budworm), fire and harvesting
Improve air and water quality Outdoor concentrations of fine particulate matter (PM2.5), ground-level ozone (O3), sulphur dioxide (SO2), nitrogen dioxide (NO2) and volatile organic compounds (VOCs)
Degree of physical, chemical threats and/or biological impairments to freshwater sources
Reduce per capita waste through prevention, reduction, recycling and reuse
Estimate of transboundary movement of hazardous waste and recyclable materials
Estimate of solid municipal waste collected, disposed of and recycled
Address climate change Rate of greenhouse gas emissions intensity, by industry
Improve the integration of biodiversity, ecosystem services and benefit-sharing into planning, policy formulation
Trends in land-use change and land tenure in the traditional territories of indigenous and local communities
Proportion of Aboriginals practicing traditional occupations66
64 Integrated reporting is a process founded on integrated thinking that results in a periodic integrated report by an organisation about value creation over time and related communications regarding aspects of value creation. An integrated report is a concise communication about how an organisation’s strategy, governance, performance and prospects, in the context of its external environment, lead to the creation of value in the short, medium and long term (IIRC 2013). Large taxpayers are very different from other categories of taxpayers and present certain significant risks to effective tax administration. Key characteristics of large businesses include: concentration of revenues, complexity of business and tax dealings, withholding agent or intermediary role, use of professional tax advisors and possession of in-house tax organisation. Businesses may be publicly listed corporations, multinational companies or private groups (OECD 2009). The Canada Revenue Agency defines large taxpayers as businesses with gross revenues in excess of $250 million. 65 This is primarily a “yes-no” indicator and has binary variables that can only have two possible values. 66 Aichi Biodiversity Targets include a target on respecting traditional knowledge. An indicator on the status and trends in the practice of traditional occupations was adopted by the Conference of the Parties to the Convention on Biological Diversity in 2010 (CBD 2010).

72
Data on the Environment and Disaster Resilience
Canada has good environmental data that provide information on water quality, GHG emissions trends,
air quality and conservation measures, much of which come from the Canadian Environmental
Sustainability Indicators database (Box 13). With respect to indicators on disaster resilience, researchers
identified Statistics Canada’s Vital Statistics database and Public Safety Canada’s Canadian Disaster
Database as potential data sources. Statistics Canada’s Waste Management Industry Survey, Canadian
Council of Forest Ministers’ and Natural Resources Canada’s National Forest Inventory and Environment
Canada’s National Inventory Report also provide information for indicators under this goal area.
While a number of data sources exist, limitations with regard to data coverage reduce the possibility of
viewing disaggregation and historical trends. The indicator for air quality in particular lacks adequate data
for making historical comparisons across all regions of Canada. Indeed, air quality monitoring sites have
existed only in a handful of geographic locations. Though the National Air Pollution Surveillance Program
was established in 1969, for years it captured information on only a small area within Canada’s vast
geography (Environment Canada 2013f). Despite currently having nearly 200 monitoring sites, it is
difficult to assess air quality based on historical data for many regions.
Furthermore, the recent increase in coverage does not necessarily mean information on the entire
population is being captured. Often air quality monitoring sites are located in urban areas with high
population concentrations. What this has meant is that the air quality of certain regions, primarily the
North with its rural communities and Aboriginal peoples, has not been monitored. From the perspective of
measuring progress across marginalised groups in the post-2015 context, monitoring the air quality of
these segments of society is imperative. Such monitoring is not just important for maintaining inclusivity
with respect to the SDGs. Compared to urban areas that face significant air pollution, the situation is
similar or potentially worse in many Aboriginal communities. As was noted earlier, air quality for Aboriginal
peoples in northern Alberta has been affected by hazardous pollutants from the oil sands, threatening the
health of communities in the region (Cotter 2014). Some monitoring sites for assessing water quality
around the oil sands already exist (Environment Canada 2013a) and similar surveillance measures
should be implemented for air quality.
In terms of disaster data, the data are easily accessible and available for most regions of the country.
However, there is limited information on the readiness of communities to mitigate disasters and their
impacts. The Federation of Canadian Municipalities may be well positioned to create a database of
aspects of municipal disaster plans, as it has already done a significant amount of work in this area,
including the publication of a report showing the number of municipalities without disaster plans (see
National Security Group 2006).
Little data also exist that capture displacement from disasters. The Canadian Disaster Database captures
a lot of information on the impacts of disasters, but there is no data that show the length of time for which
people are displaced (Public Safety Canada 2014b). As noted, in Canada there are significant problems
with urban flooding that results in property damage. Currently, the data on the proportion of the population
affected by flooding only include figures for the number of individuals evacuated – excluding those who
did not require evacuation but were nonetheless placed at risk or incurred economic losses due to
flooding. More detailed data about impacts must be collected in order to capture the actual losses that
Canadians suffer as a result of disasters.

73
Box 13. Data Strategy: Establish a sustainable, healthy and resilient environment for all
Best data sources: The Canadian Environmental Sustainability Indicators (Canada 2006) serve as a
potential source for a number of indicators on air and water quality as well as conservation. Monitoring
environmental sustainability will require making use of multiple databases and surveys.
Rationale: The goal area for the environment is broadly structured to include three targets – a target on
biodiversity conservation, one on pollution and emissions and another on disaster planning. As such, the
data are relatively different and require the use of different survey instruments and databases. Some
primary sources include the Vital Statistics - Death Database, Canadian Disaster Database, National
Forest Inventory, National Inventory Report, Canadian Environmental Sustainability Indicators and Waste
Management Industry Survey.
Limitations: In terms of the environment, limitations include measuring long-term trends as well as data
coverage. For data on natural disasters, the aforementioned sources do not fully assess disaster impacts
or community-level planning efforts.
Opportunities for Establishing a Sustianable, Healthy and Resilient Environment
Environmental Health: Biodiversity and Conservation
Canada has the potential to lead the way on environmental conservation, particularly given the breadth
and scope of the ecosystems within its borders. The latest report by Natural Resources Canada (2014c)
on the state of Canada’s forests indicates that the country is making substantial progress on conserving
forestland. Moving toward 2030, Canada’s implementation of a thoroughly planned strategy that clearly
identifies national goals related to conservation would be the key to securing its leadership in this area. In
this regard, the development of the draft framework to protect biodiversity by the Federal-Provincial-
Territorial Biodiversity Working Group (2011; 2013) is an important opportunity for Canada to develop its
ecosystems. Still, there is a need to identify concrete strategies to achieve the targets proposed in the
framework – a major gap that was noted by the Commissioner of the Environment and Sustainable
Development (2013).
Environment Canada’s role in implementing the UN Convention on Biological Diversity must also be
identified. Recent budget cuts have stopped the department from releasing another report on ecosystem
statuses and trends, which is one of Canada’s commitments under the convention (Federal, Provincial
and Territorial Governments of Canada 2010). As such, it is important to understand what future role
Environment Canada will play in monitoring Canada’s commitments under the convention. If the
government can successfully address these drawbacks and develop a concrete plan for remaining
committed to the convention, Canada could become a leader in environmental conservation.
Offsetting policies also present an opportunity for improving outcomes of biodiversity conservation.
Biodiversity offsets are “measurable conservation gains, deliberately achieved to balance any significant
biodiversity losses that cannot be countered by avoiding or minimising impacts from the start, or
addressing the damage done through restoration” (BBOP 2013, 2). Offsetting schemes have long existed
in Canada through different legislation, regulatory requirements, and industry and FPT programmes
(Poulton 2014). However, provisions to support offsetting schemes have not been sufficiently
standardised. Since Canada heavily relies on its natural resources to support its economy, a standard

74
approach to offsetting policies is important for establishing strict provisions for the planning and
implementation of schemes. Environment Canada’s (2012) recent publication of an operational
framework to support offsets or conservation allowances serves as an opportunity on which to build a
national guideline. However, further coordination among provinces and territories is needed to reduce the
number of overlapping and conflicting offset prescriptions.
It should be noted that offsetting policies are only useful for conservation when complete avoidance or
minimisation of environmental impacts is impossible. Additionally, it is necessary to ensure that these
policies involve a definitive plan that clearly highlights the conservation aims and baselines against which
the offsets can be measured (Bull et al. 2013). In the absence of such plans, it will be difficult to realise
benefits that will help sustain ecozones, including wildlife habitats, and reduce threats to at-risk species –
two environmental targets that are key in progress on the SDGs. Canada must work toward standardising
its provisions that support offsetting schemes to ensure that net losses from commercial or other activities
are adequately compensated.
Environment Health: Cooperation among Provinces and Territories
Further cooperation among provinces and territories on environmental protection presents an important
opportunity for Canada to address climate change. The aforementioned efforts being made by British
Columbia, Quebec, Alberta and to some extent Manitoba in regulating the oil and gas sector are
particularly significant in this regard. Moreover, British Columbia’s carbon-pricing system and Quebec’s
cap-and-trade system provide two very different but effective models for the rest of the country to follow.
British Columbia’s carbon tax, as noted earlier, has earned the province national and international
recognition since the policy instrument has succeeded in creating a balanced approach to the
environment and the economy. Being revenue neutral, the carbon-pricing system has helped cut $440
million in corporate income taxes and $237 million in personal income taxes (British Columbia Ministry of
Finance 2014a). According to analysts, these cuts are partly responsible for the province’s increased
GDP growth, which is slightly higher than that of other provinces in Canada (Beaty, Lipsey and Elgie
2014; Elgie and McClay 2013). More importantly on the environmental front, carbon pricing has reduced
demand for gasoline in the province by 16 percent between 2008 and 2014, prompted communities to
invest in clean energy projects and reduced per capita GHG emissions by 10 percent between 2008 and
2011 (Beaty, Lipsey and Elgie 2014; Shah and Beckstead 2012; Horne and Sauve 2014; Elgie and
McClay 2013). That being said, the decision in 2013 by the provincial government to maintain its 2012
taxation rate at $30 per tonne limits opportunity to make further progress on addressing climate change.
As Gass and Sawyer (2012) point out, there remains room for improvement and future challenges to
reducing GHG emissions will have to be mitigated to continue with progress.
Quebec, on the other hand, has established and operationalised an impressive cap-and-trade system, the
first jurisdiction in North America to do so. Through this system, the province aims to reduce emissions by
67.1 metric tonnes by 2020 – an impressive 22.4 percent reduction target from 2005 levels (Purdon,
Houle and Lachapelle 2014). The Quebec Ministry of Finance has pointed out that it will not only reduce
GHG emissions but also generate approximately $2.7 billion of added revenue by 2020 (Ministère des
Finances, Québec 2012). Given its affiliation with the aforementioned Western Climate Initiative,
Quebec’s cap-and-trade system has also become linked with the emissions market of California –the only
US member of the Western Climate Initiative and also one of its initial founders. This affiliation is said to
further improve Quebec’s cap-and-trade system’s revenue generation capacity. Moreover, one study has
argued that this partnership will save Quebec between $386 million and $532 million as opposed to the

75
cost it would have incurred had it tried to establish the system independently (Purdon, Houle and
Lachapelle 2014).
Despite a general lack of federal leadership, Quebec’s collaborative efforts to establish a cap-and-trade
system coupled with British Columbia’s carbon-pricing system are important markers of provincial
progress in regulating GHG emissions and should be duplicated across Canada. They present
opportunities to establish critical benchmarks for provinces like Manitoba and Alberta to remodel their
weaker regulatory frameworks and Ontario and Saskatchewan, which are considering putting a price on
carbon. The government of Alberta, for instance, is considering increasing its carbon emissions target by
40 percent with an adjusted $40 per tonne rate to address the gap in its regulatory policy (Dyer 2013).
If the plan succeeds, Alberta will become the province with the highest carbon price policy in Canada.
However, it has been suggested that an even more effective system could be established if the
government increases the price annually on a predictive rate (Dyer 2013) – a plan similar to what British
Columbia had between 2008 and 2012.
Alongside the provinces, territories are also establishing frameworks to address climate change that set
good examples for the rest of Canada to take note of or adapt. To address the impacts of climate change
in Canada’s North, the three territorial governments have developed a Pan-Territorial Adaptation Strategy
that commits governments to work with local, territorial, national, Aboriginal and international partners
(Northwest Territories, Nunavut, and Yukon2011). Strategies that include collaboration with local and
Aboriginal communities have the potential to facilitate inclusive economic growth and promote shared
knowledge and practices. If implemented accurately, such strategies can create local opportunities that
have ripple effects across societies.
Disaster Preparedness
In terms of disaster mitigation plans, Canada has already made significant progress. The introduction of
national-level planning strategies is an indication that FPT governments recognise the importance of
coordinated efforts to manage emergencies. Furthermore, the US–Canada partnership in emergency
management planning recognises that environmental disasters impact people indiscriminately and so
greater cooperation is needed at the international as well as the national level. These initiatives have the
potential to yield improved outcomes in the future and it is important to continue with cooperation and
further engage local- and municipal-level authorities.
Opportunities also exist in incorporating the traditional knowledge of Aboriginal communities for land-use
and wildfire management purposes (Conservation and Water Stewardship, Government of Manitoba,
personal communication). Aboriginal peoples in Canada have been using prescribed burning for centuries
to control forest fires, manage vegetation and safeguard habitats (see Weber and Stocks 1998; Turner,
BoelscherIgnace and Ignace 2000; McCue 2013). Efforts have been made to incorporate this practice by
different authorities across Canada. Parks Canada, the federal department charged with planning for
prescribed burning, has made plans for a number of national parks (Parks Canada 2014). Nevertheless,
there is still a need to advance prescribed or controlled burning. Since the 1990s, the use of prescribed
burning for forest management has decreased in British Columbia while wildfires have shown a marked
increase (Leverkus et al. 2014). This correlation suggests that further incorporation of traditional
knowledge on prescribed burning into forest management plans and processes is a way for Canada to
better control wildfire. Incorporation of this practice can also promote inclusivity and create an opportunity
for Aboriginal communities and the greater society to utilise traditional knowledge for the benefit of all.

76
With regard to standardised interpretation of building and plumbing codes, there is an opportunity for
Canada to reduce the risks and costs associated with basement flooding and sewer backup – two key
components of urban flooding – through the mandatory installation of backwater valves. A recent study
has shown that backwater valves are one of the most effective and commonly used devices for
preventing sanitary and storm sewer backup (Sandink 2013). However, there is no regulation in Canada
to make its installation mandatory. The only national policy that references the use of backwater valves is
the National Plumbing Code of Canada (Canadian Commission on Building and Fire Codes 2010,
sentence 2.4.6.4). Though provincial, territorial and municipal authorities have adopted this code at the
local level, its wording remains open to interpretation and, as a result, installation requirements for the
valves can vary by jurisdiction (Sandink 2013). Clarifying this wording and making installation of
backwater valves mandatory would greatly reduce this inconsistency while lowering the risks of flooding
as well as the costs. Given the threats to cities posed by increased periodic rainfall due to climate
change, future risks of urban flooding can be mitigated by timely action on requiring the installation of
backwater valves.
Challenges to Establishing a Sustainable, Healthy and Resilient Environment for All
Environment Health: Policy Climate
On the issue of environmental sustainability, the policy climate in Canada is not very progressive.
Debates in Canada’s Parliament usually centre on whether the federal government is taking a balanced
approach to safeguarding the environment while promoting economic growth. Critics have highlighted that
the federal government has chosen to give primacy to the oil and gas sector by providing generous
compensation through increased subsidies and reduced corporate taxes while cutting budgets for
environmental programmes. As Dobson and Assadollahi (2014, 1) point out, “the value of foregone tax
revenues and other direct federal support for the oil sector now comes close to exceeding the entire
budget of Environment Canada, at the same time that the department’s budget is being cut.”
The federal government’s limited initiative to protect the environment is also evident in the national GHG
emissions policy. Through a series of actions, the government has weakened its commitments to GHG
emissions reduction targets. Despite being an active participant during the 1997 UN negotiations on the
Kyoto Protocol, the Canadian government decided to withdraw from this major international
environmental agreement in 2012. This move was, however, foreseen. With the change in federal
leadership in 2006, the government decided to abandon its Kyoto commitments informally67as it became
obvious that Canada would not be able to meet the Kyoto target,68 which was a 6 per cent reduction in
absolute emissions from 1990 levels by the end of 2012. In 2009, the government signed the
Copenhagen Accord, a non-binding international agreement that adjusted the GHG emissions reduction
target to a 17 per cent reduction from 2005 levels by the end of 2020. This move substantially lowered the
GHG emissions reduction target for Canada69 and deliberately aligned it to that of the United States’
(NRT 2012).This series of policy changes ultimately culminated in the federal government’s decision to
pull out of Kyoto. Under the Federal Sustainable Development Strategy, Canada continues to follow the
aforementioned Copenhagen target (Sustainable Development Office 2013) – a relatively weaker target
that exceeds 1990 levels.
67 It should be noted that Canada still remained party to the convention. 68 It is important to note that when Canada ratified the Kyoto Protocol in 2002, its emissions had already increased to 717 megatonnes from the 1990 baseline level of 590 megatonnes. 69 In 2007, the new target set was a 20 per cent reduction in GHG emissions by the end of 2020 from 2006 levels. While this might appear ambitious at first glance, GHG emissions for Canada were peaking at 750 megatonnes for the 2006 baseline year – a nearly 27 per cent increase from 1990 levels. As such, a 20 per cent reduction of GHG emissions based on 2006 levels considerably lowered the emissions standards set in the Kyoto Protocol.

77
Moving toward 2030, the new policy direction taken by the federal government will have severe
consequences for Canada, as it diminishes the country’s capacity to lower its GHG emissions. The
situation is exacerbated by the recent development in the sector-by-sector regulatory approach -– the
primary approach devised by the federal government to reduce GHG emissions. The recent decision by
the federal government to not proceed with regulation of the oil and gas sector can further damage the
environment given the high emissions rate of this sector. The Commissioner of the Environment and
Sustainable Development (2014) found that a general lack of coordination by Environment Canada has
slowed down cooperation among provinces and territories and concluded that Canada will most certainly
miss its national target. The federal government’s decision to not regulate the oil and gas sector will most
likely allow Canada’s GHG emissions to continue to rise.
In terms of environmental conservation, the introduction of the Jobs, Growth and Long-Term Prosperity
Act, which was introduced to implement the 2012 federal budget, weakened environmental assessment
tools for monitoring the country’s ecosystems. The act made several important amendments to the
country’s environmental protection regime, one of which includes overwriting the Canadian Environmental
Assessment Act, thereby setting fewer limitations for environmental assessments of federally regulated
projects. Aboriginal reserve lands, especially those located in and around the oil sands region, may be
disproportionately impacted by lowered standards. According to the Commissioner of the Environment
and Sustainable Development (2014), consultations with First Nations and Métis on developing oil sands
projects have not been engaging or effective and Environment Canada has disregarded the incorporation
of the traditional knowledge of these peoples for monitoring environmental damage. The introduction of
the Jobs, Growth and Long-Term Prosperity Act has further weakened already weak environmental
assessment tools and created more barriers for First Nations and Métis to safeguard their ecosystems.
The actions of the federal government showcase the importance of political will in achieving progress on
environmental sustainability – a point that was highlighted by several stakeholders during interviews for
this report (David Suzuki Foundation, personal communication; The Community Power Report, personal
communication). The post-2015 challenge for Canada will be to develop and implement policies that can
better balance economic progress without jeopardising the environment. There is a strong consensus that
national leadership is lacking in the area of the environment (David Suzuki Foundation, personal
communication; School of Political Studies, University of Ottawa, personal communication). While
provinces have found ways to work around this policy climate, there is a need for a united approach in
Canada to better position the country internationally with respect to climate change and other aspects of
environmental sustainability. It is especially critical to act now as the world prepares for the 2015 United
Nations Climate Change Conference in Paris where governments will come together to establish a
universal legally binding climate agreement.
Environmental Health: Natural Resource Development
Canada’s efforts to develop the oil sands in Alberta hinder progress on environmental sustainability
across the country. As has been discussed above, there are economic risks associated with dependence
on the oil sands. That being said, the environmental losses are even more pervasive. As noted, the oil
sands make up a significant share of the country’s GHG emissions, accounting for nearly 8.7 percent of
total emissions in 2012 (Environment Canada 2014f). By 2020, growth in oil sands production will
generate an estimated 103 megatonnes of carbon dioxide equivalent while total emissions for Canada
are projected to reach 727 megatonnes (Canada 2014b). The oil sands’ contribution to national GHG
emissions will double by 2020 and their expansion will prevent Canada from meeting the Copenhagen
target for 2020. Their expansion will also significantly impede progress on the environmental aspects of

78
the post-2015 agenda, particularly the targets on addressing climate change and safeguarding
ecosystems and biodiversity.
There is growing concern that the mining of ore and in situ extraction of bitumen will threaten ecosystems
(David Suzuki Foundation, personal communication). There are significant reserves of oil sands under
Alberta’s boreal forest, a critical habitat that is home to a large proportion of the world’s wildlife
population. Development projects that support in situ extraction have already begun placing many
species at risk. For instance, woodland caribou populations have almost halved over the past 10 years
(Greenpeace 2010). Mining has also disturbed some forestland. In 2013, it was estimated that 715
square kilometres of the boreal forest was impacted by mining operations (Pembina Institute 2014). While
this is a small proportion given that total boreal forestland coverage stretches out across nearly six million
square kilometres, the rates at which mining and in situ extraction projects are growing are increasing. At
the current rates, almost 18.6 hectares of forestland – the equivalent of 34.5 football fields – will have
been cleared on a daily basis by 2022 (Grant, Angen and Dyer 2013).
Moving forward, Canada must carefully assess the environmental consequences of oil sands expansion.
The country’s national GHG emissions reduction target, which is already very low, will not be met if
mining and in situ extraction projects continue expanding. Biodiversity conservation will be substantially
affected and many species will be placed at great risk. In the absence of rigorous carbon-pricing systems
and emissions reduction standards, there is little incentive for the economy to transition away from oil
sands development. The accelerated development of the oil sands will inherently slow progress on
increasing environmental sustainability, making it difficult for Canada to achieve the SDG targets related
to climate change and the environment.
Disaster Resilience: Impact of Climate Change
There will be implications for local communities in Canada due to changes in temperature and extreme
weather events related to climate change. Feltmate and Thistlethwaite (2012) identified a number of
important climate trends that Canada will experience in upcoming years. They found that overall
temperature in Canada will rise by 2°C by 2020 and 4°C by 2050. The Arctic will experience a more
significant increase in temperature ranging between 2°C and 4°C by 2020 and 4.5°Cand 8°C by 2050. As
noted, the warming of the Arctic is already threatening the ecosystems and livelihoods of indigenous
communities. The projected rise in temperature will further endanger the region in the coming years.
Furthermore, the rise in temperature will cause the thawing of permafrost in the North that will release
large quantities of methane70 into the atmosphere, which will accelerate the rate of climate change
(Feltmate and Thistlethwaite 2012).
In terms of extreme weather events resulting from climate change, the Intergovernmental Panel on
Climate Change (2014) suggests that heavy precipitation will likely increase globally along with extreme
sea-level rises and frequent weather-related disasters. What this means for Canada is that some regions
will become more exposed to flooding while places with drier weather conditions will benefit from the
change. As noted, coastal cities will be most affected by flooding, which will increase costs for
municipalities and homeowners as well as private enterprises like insurance companies. The Center for
Global Development found that Canada is likely to be severely affected by extreme weather in the future
– allotting the country a global rank of 48th under the category for direct (physical) risks associated with
extreme weather (CGD 2014).
70 Methane is a greenhouse gas with global warming potential that is 20 times greater than that of carbon dioxide.

79
The impending impacts of climate change clearly present a challenge to progress on the SDG targets and
make the resilience of communities and the environment more urgent. The first step is to address the
vulnerabilities of urban areas by strengthening infrastructure construction and maintenance standards to
counter climate-related problems. One way to do this is by establishing disaster mitigation plans for pre-
existing and new infrastructure – an important measure represented by our indicator “% of public
infrastructure owners that have produced disaster mitigation plans.” A second step may be utilising local
resources, such as traditional knowledge for prescribed burning in forest management, discussed above.
These multi-scalar measures can directly help in mitigating climate change–related disasters. Other
measures that can indirectly enhance Canada’s resilience are reducing overconsumption habits,
transitioning away from fossil fuels and building a united approach in Canada with strengthened federal
leadership – all of which have been discussed.

80
Establish Open, Accountable, Inclusive and Effective Institutions,
Rule of Law and a Peaceful and Inclusive Society
Current Situation
Canada is a federal state with sub-national governments at the provincial,
territorial and municipal levels. The Canadian Constitution outlines the
responsibilities between the federal and provincial governments, which
each have their particular areas of jurisdiction. The federal government is
responsible for issues of a national nature such as foreign policy and
trade,70 while sub-national governments are responsible for more local
issues, such as municipalities, universities, schools and hospitals.
Jurisdictional overlap exists between the national and sub-national levels
of government and the federal government plays an important role in
financing activities and programmes at the sub-national level.
Cooperation on various issues between the two levels of government
occurs, as noted throughout this report.
Rule of Law, Human Rights and Access to Justice
Canada is a peaceful country characterised by rule of law, open
democratic processes and well-functioning institutions.71 Overall, the
crime rate in Canada is low and has been declining since the 1990s
(Perreault 2012). Human rights and freedoms are guaranteed by the
1982 Canadian Charter of Rights and Freedoms, which includes
provisions on fundamental freedoms such as religious freedom and rights
including the right to participate in democratic processes, the right to life,
liberty and security of the person, and the right to equal protection and
benefit of the law without discrimination on any grounds, inter alia.72 All
provinces and territories also have human rights legislation and, as
noted, Canada also has a human rights act that sets out provisions
related to non-discrimination. Canada is party to most major UN human
rights conventions (see Canada Heritage 2013).73 Rule of law is
respected by the government. Through Canada’s independent courts,
citizens can challenge government policies and actions. Legislation can
be struck down and the courts can require the government to produce
legislation on human rights grounds.
Section Highlights
National Priorities
End discrimination and
address inequalities of
Aboriginal peoples, people
with disabilities, women and
recent immigrants
Increase access to justice
Increase political
participation
Reduce bribery and
corruption
Key Data Sources
A variety of data sources are
required given scope of the
goal area
Additional data collection
needed
Opportunities
Strong human rights
guarantees
Targeted interventions to
address rights of people with
disabilities
Women’s political
participation
Challenges
Insufficient attention to
improving human rights
outcomes for Aboriginal
peoples and women
Insufficient resourcing of
mechanisms to improve
access to justice in judicial
systems
Introduction of new
legislation which may
negatively impact voter
turnout rates

81
While an appropriate legal framework exists in Canada, ensuring social inclusion and realising the rights
of particular groups, such as Aboriginal peoples, people with disabilities and women, remain a71
challenge.72The Canadian Charter of Rights and Freedoms includes provisions related to Aboriginal rights
and non-discrimination for all people.73Canada has also endorsed the UN Declaration on the Rights of74
Indigenous Peoples75 as well as ratified the UN Convention on the Rights of Persons with Disabilities and
the Convention on the Elimination of All Forms of Discrimination against Women. Nevertheless, the
situations of Aboriginal peoples and people with disabilities considering different aspects of socio-
economic well-being, including housing, employment and poverty, are those of ongoing marginalisation
and inequality (Human Rights Council 2014; Canadian Human Rights Commission 2012). In 2013, the
UN special rapporteur on the rights of indigenous peoples declared that Canada faces a crisis with
respect to the situation of Aboriginal peoples (Commissio 2013). Women in Canada continue to face
greater economic insecurity and are more likely to experience violence than men. Women are 11 times
more likely to be victims of sexual offenses and three times more likely to be victims of criminal
harassment than men (Statistics Canada 2013q). The situation with respect to violence against women is
particularly worrisome for indigenous women in Canada, who are disproportionately affected (see Human
Rights Watch 2013; Brennan 2011b; Sinha 2013; Mathyssen2011).
Some have also noted that recent immigrants continue to face discrimination in the Canadian economy.
Visible minorities76 in Canada experience a significant income gap compared to other Canadians, a trend
that is particularly concerning given that immigrants now account for more than one-fifth of the Canadian
population (Alexander, Burleton and Fong 2012). Based on 2006 census data, visible minorities earned
only 81.4 cents for every dollar paid to other Canadians (Block and Galabuzi 2011; see also Morissette
and Sultan 2013; Calver forthcoming). This stems from disparities in the proportion of visible minorities
who hold secure, well-paying jobs. Though visible minorities tend to have higher rates of labour force
participation, they are also more likely to work in insecure, temporary and low-paying jobs. A number of
studies have shown that immigrants face lower mobility into high-wage jobs and higher mobility out of
high-wage jobs (see Calver forthcoming for an overview of the literature). According to Labour Force
Survey data, the wage gap tends to decrease between immigrant and non-immigrant Canadians over
time. In 2013, established immigrants– individuals who have been in Canada for more than 10 years –
had the same average wages as domestic-born workers when averaged across levels of education.
Nevertheless, the income gap experienced by very recent immigrants – individuals who have been in
Canada for less than five years – is significant and tends to increase with higher education levels (Calver
forthcoming).
A number of groups have also raised concerns about access to justice in Canada. Canada scores 11th
out of 99 countries and 11th out of 30 high-income countries on the World Justice Project’s Rule of Law
Index, which measures corruption, transparency, protection of human rights and other aspects related to
the justice system through a mix of general population polls and “qualified respondents’ questionnaires”
solicited by legal professionals (World Justice Project 2014). Scores for civil and criminal justice are
71 The federal government is also technically responsible for the territories, but over the years responsibilities have been decentralised to territorial governments. 72 See Sharpe, Kessler and Thunert (2014) for a recent assessment of the quality of Canadian democracy. 73 It should be noted that the charter focuses primarily on civil and political rights and does not necessarily guarantee social, economic and cultural rights. See Amnesty International Canada (2012) for a review of the current situation in Canada. 74 Notable exceptions include the International Convention on the Protection of the Rights of All Migrant Workers and Members of Their Families, International Convention for the Protection of All Persons from Enforced Disappearance and the optional protocols for the UN Convention on the Rights of Persons with Disabilities and International Covenant on Economic, Social and Cultural Rights (see OHCHR 2013). 75 Though the government’s statement was qualified, noting that it “remained concerned with the meaning and interpretation of certain provisions [in] the declaration. Accordingly, it [. . . endorsed] the declaration as an aspirational document rather than a document of customary international law” (Mitchell and Enns 2014). 76 A self-reported status in the census.

82
among the lowest for Canada across the areas captured by the index. With respect to civil justice,
Canada does poorly on accessibility and affordability as well as unreasonable delays. The Canadian
Forum on Civil Justice (2012) has argued that increasing evidence suggests that Canada’s court system
is too expensive for many Canadians to access and it is unclear how individuals are resolving their legal
problems (if at all) when they cannot access the court system. Furthermore, people, particularly those
from marginalised communities, have low confidence in the justice system, which is often seen as difficult
to navigate and inaccessible (CBA 2013). According to the World Justice Project (2014), Canada fairs
poorly on discrimination in the criminal justice system,77 a finding that is supported by a recent report of
the Office of the Correctional Investigator, which serves as an ombudsman for federal offenders. The
report noted that Aboriginal peoples are vastly over-represented in Canada’s federal prison system,
pointing to systemic discrimination (CBC News 2013).
Transparency and Corruption
Canada has a number of mechanisms to ensure transparency in government. In addition to proactive
disclosure policies, which are discussed below, the Access to Information Act sets out provisions for the
release of internal government information based on requests by citizens. Bureaucratic procedures and
delays often undermine the effectiveness of the act. As noted by Sharpe, Kessler and Thunert (2014, 25),
“in general, there is a reluctance on the part of the political and bureaucratic officials to release
information that puts the government in a bad light.” They argue that the current federal government has
also misapplied restrictions in the act by censoring information on the basis of national security concerns.
Nevertheless, the federal government has committed to the Open Government Partnership, an
international platform for countries committed to making reforms to improve the openness, accountability
and responsiveness of government.78 Canada’s Action Plan on Open Government sets out commitments
to improve the availability of information, promote professional integrity, incorporate new technologies to
improve openness and engage citizens (Government of Canada 2014). This plan led to the creation of
the Open Government Portal in 2011, which provides access to over 209,000 datasets from various
government departments through the Open Data Portal, Open Information Portal and Open Dialogue
Portal. Eleven out of 13 provinces and territories, as well as nearly 50 municipalities have also
established open data portals.79
Canada does fairly well against its peers on the issue of corruption. According to Transparency
International’s Corruption Perceptions Index, which ranks countries based on how corrupt their public
sectors are perceived to be, Canada ranks ninth out of 177 countries with a score of 81 out of 100, where
0 represents highly corrupt and 100 represents very clean (Transparency International 2013a). Canada
ranks as the second to least corrupt country in the world according to the TRACE Matrix, which measures
interactions between businesses and government, anti-bribery laws and enforcement, government
transparency and capacity for civil oversight (TRACE 2014). The Global Corruption Barometer, which
surveys approximately 1,000 people from each of 107 countries to assess perceptions of corruption,
found that very few Canadians reported paying a bribe for government services – 3 percent compared to
the global average of 27 percent – though the majority of respondents thought corruption has increased in
the past two years and 54 percent thought government is run by a few big interests (Transparency
International 2013b). It also found that 61 percent of respondents perceived political parties to be corrupt
77 The indicator on whether the criminal justice system is impartial “measures whether the police and criminal judges are impartial and do not discriminate against suspects based on socio-economic status, gender, ethnicity, religion, national origin, or sexual orientation” (World Justice Project 2014). 78 See http://www.opengovpartnership.org for more information. 79 See http://open.canada.ca/en for more information.

83
or extremely corrupt, followed by business (48 percent of respondents), Parliament (47 percent), the
media (39 percent) and public officials (38 percent).
While proactive disclosure mechanisms (see Library and Archives Canada 2013) and independent official
auditing bodies exist to ensure transparency of and accountability for public spending, a number of high-
profile scandals have recently emerged across Canada involving misuse of public funds or abuses of
privilege by senior officials. Examples include the misuse of government resources by Alberta Premier
Alison Redford, which led to her resignation in August 2014, and the Senate expenses scandal in 2012, in
which three senators claimed ineligible travel and housing expenses that led to their suspension. In
Quebec, a commission was established in 2011 to examine the awarding and management of public
contracts in the construction industry. The Charbonneau Commission, chaired by Justice France
Charbonneau, heard from nearly 200 witnesses who revealed corruption and collusion in the industry,
which led to the resignations of the mayors of Montreal and Laval, Quebec’s first and second largest
cities, owing to corruption allegations. Business figures and senior union officials were also implicated,
leading to additional resignations in the private sector.80 A journalist for Maclean’s, a weekly Canadian
current affairs magazine, dubbed Quebec Canada’s most corrupt province, citing a history of high-profile
scandals involving issues such as political financing, favouritism and corruption in the construction
industry (Patriquin 2010). Finally, Canada saw the “sponsorship scandal” in the mid-2000s, which found
that public funds intended for federal government advertising in Quebec had been misused and
misdirected under the leadership of the Liberal Party of Canada. The commission established to
investigate found that under the advertising programme, which ran from 1996 to 2004, money was
awarded to advertising firms for little or no work and these firms had Liberal organisers or fundraisers on
their payroll or made donations back to the Liberal Party.81
Democracy and Democratic Processes
Canada is ranked “free” according to Freedom House, which assesses the state of political rights and civil
liberties globally based on a survey that asks respondents about their experiences regarding electoral
practices, freedom of expression and belief, and rule of law, inter alia (Freedom House 2014). Fair, open
and inclusive elections are held regularly in Canada (Sharpe, Kessler and Thunert 2014, 21).82 Nearly
any adult Canadian citizen can run in a federal election at minimal cost by submitting a nomination form
containing either 50 or 100 signatures, depending on the population of the electoral district, and all
citizens over 18 have the right to vote.
Canada has independent and open media and freedom of expression is guaranteed. The Canadian
Broadcasting Corporation, branded as CBC/Radio-Canada, serves as the publicly owned radio and
television broadcaster whose independence is enshrined in legislation. While mainstream media
ownership is quite concentrated in the country, alternative media sources are on the rise such as online
newspapers, magazines and blogs. Nevertheless, as noted by Sharpe, Kessler and Thunert (2014, 24),
given the important role of mainstream media in setting the national agenda, the concentration of media
ownership may jeopardise the extent to which certain opinions are represented.
80 See http://www.cbc.ca/montreal/features/charbonneau-corruption-inquiry for details. 81 See http://www.cbc.ca/news2/background/groupaction/gomeryreport_phaseone.html for details. 82 However, in the 2011 federal election the “robocall scandal” emerged, involving allegations that calls were made to dissuade voters from voting. The scandal garnered significant attention from citizens and the media. After a three-year probe, the chief electoral officer concluded that there was not enough information to prove an offence had been committed. Critics argued the lack of evidence demonstrated that Elections Canada did not have sufficient power and resources to properly investigate election fraud (Cheadle 2014b).

84
Despite this context, political engagement in Canada is low, particularly when compared to other high-
income countries as measured by voter participation rates (Conference Board of Canada 2013b). Voter
participation has steadily declined in Canada, with eligible youth voters being the most unlikely to vote
(Pammet and LeDuc 2003; Uppal and LaRochelle-Côté 2012). Education levels are an important factor;
more educated individuals are more likely to vote. At the federal level, 61.1 percent of registered voters
voted in the 2011 election, marginally up from 58.8 percent in 2008. Canada has seen an overall
downward trend since the 1960s when voter turnout rates for registered voters were 75–80 percent
(Pammett and LeDuc 2003; Elections Canada 2013). Most provinces have also seen a decline though a
number of provinces continue to see comparatively high rates.83 In their most recent provincial elections
in 2014 and 2012, respectively, Ontario saw 52 percent of eligible voters vote while Alberta saw 54.4
percent.84 At the municipal level, trends tend to be even lower (see, for example, Gludovatz 2014).
In addition to voting, Canadians could also be more engaged in non-voting political activities, such as
volunteering in elections, contacting elected officials, expressing political views, donating money to
political candidates or being a member of a political party (Moore et al. 2010; Anderson, Hilderman and
Loat 2013). A 2007 national survey on giving, volunteering and participating indicates that Canadians are
spending less time volunteering for organisations that focus on law, advocacy and politics85 (Hall et al.
2009, 10; see also Anderson, Hilderman and Loat 2013).
Concerns have also been raised, particularly aimed at the federal government, regarding the “closing
space” for advocacy and dissent. As noted by Amnesty International Canada (2012), Canada has a rich
history of government support for advocacy, debate and discussion on public policy issues. Status of
Women Canada, which historically funded progressive CSOs, has had its funding for research and
advocacy cut (Amnesty International Canada 2012). The Court Challenges Program, which was
established in 1978 to provide financial support for individuals and non-governmental organisations to
access the costly court system in order to challenge government policies on the basis of human rights,
was eliminated in 2006.
CSOs that have publicly criticised government policies have been defunded, which has had a significant
chilling effect across civil society. In addition, some suggest that recent government efforts to crack down
on charities with links to terrorists or organised crime through Canadian Revenue Agency audits is really
a way to sanction environmental groups and others critical of government policy. Commentators have
noted that environmental organisations with charitable status seem to be disproportionately affected
(Fekete 2014).86
Concern over the closing space for advocacy and dissent has led to the creation of Voices-Voix, a non-
partisan coalition comprised of over 200 organisations that documents attacks by government on
individuals and institutions that have raised concern over federal government policy (Voices-Voix 2014).
Founded in 2010, the coalition has documented over 80 cases of, inter alia, surveillance, defunding,
83 Prince Edward Island tends to see voter turnout rates of over 80 percent (with the exception of the last election in 2011 that saw voter turnout at 76.53 percent) (Elections Prince Edward Island 2011). Quebec has seen voter turnout rates around 70 per cent since 2000 (though the voter turnout rate was 57.43 percent in 2008, a notable exception) (Directeur général des élections du Québec 2014). 84 Though it should be noted that, in comparison to other provinces, Alberta’s voter turnout rate, in the 40–66 percent range, has historically been low over the past 40 years (Elections Alberta 2012). 85 Organisations and groups that promote and protect civil and other rights, advocate for particular interests, promote public safety or offer legal services. 86 Of the 900 organisations that were reviewed in the first year of the government’s review process, only one organisation had its charitable status revoked for participating in excessive political activities. Under Canadian law, charities can devote 10 percent of their resources to “political” activities (Fekete 2014).

85
interference with independent institutions and civil service employees being fired or forced to resign for
not sufficiently supporting government policies.
In terms of governing bodies, representation by women in the Canadian political system at the national
and sub-national levels remains low. The Inter-Parliamentary Union (2014) ranks Canada 55th out of 188
countries in terms of women’s representation in parliament (lower or single house). The World Economic
Forum’s (2013) Global Gender Gap Report 2013 ranked Canada 42nd out of 136 countries on political
empowerment as measured by female representation in parliament, women at the ministerial level and
the proportion of years for which countries have had female heads of state or government. A number of
barriers have been identified to women’s participation in politics including continued disproportionate
share of household and family responsibilities, less financial independence, social norms regarding the
suitability of politics as a vocation for women, discrimination and Canada’s first-past-the-post electoral
system, which is based on one candidate per riding rather than proportional voting systems that allow for
a list of candidates in each riding (Cool 2010; FCM 2012; Tremblay, Arscott and Trimble 2013). Between
1997 and 2008, the proportion of women in Canada’s Parliament remained around 20 percent (Cool
2010). In 2011, 25 percent of members of Parliament were women. As of June 2014, the proportion of
female representatives in provincial and territorial parliaments ranged from a low of 10.5 percent in the
Northwest Territories to a high of 36 percent in British Colombia (Equal Voice 2014).87 At the municipal
level, 16 percent of mayors and 26 percent of councillors are women (Equal Voice 2014; see also FCM
2013). The situation is even worse for Aboriginal women and women who are not Caucasian.
Concern also exists with respect to representation by visible minorities in government. In the 2004 federal
election, only 7.1 percent of elected officials were visible minorities, compared to 14.9 percent of the
population at the time (Black and Hicks 2006).88 In the 2011 federal election, 9.4 percent of members of
Parliament were visible minorities, compared to 16.2 percent of the population (Crawford 2011). Andrew
et al. (2008, 18) note that elected officials are becoming more diverse in Canada but argue that the
archetype of the Canadian elected official is still “male, White, middle-class, middle-aged, Christian,
Canadian-born, and majority-language speaking.”
Previous and Ongoing Efforts
Realising Rights
Efforts have been taken to address human rights for particular groups in Canada at the federal and
provincial levels. Aboriginal Affairs and Northern Development Canada is the federal department
mandated to support Aboriginal peoples. It is responsible for funding and overseeing initiatives related to
improving outcomes for Aboriginal peoples who live on reserves and works in partnership with Aboriginal
communities and through federal-provincial and federal-territorial agreements (AANDC 2014). The
department oversees the federal government’s Specific Claims Action Plan, which was established in
2007 to speed up the resolution of claims based on past grievances related to obligations under historic
treaties or management of First Nation lands and finances. It also provides funding for different
programmes related to economic development, education and infrastructure, for example. Off-reserve
Aboriginal peoples are under the responsibility of provincial governments. Initiatives, which vary across
provinces and territories, typically aim to address key issues such as poverty, social inclusion, housing
and infrastructure. Most provincial and territorial poverty reduction strategies in Canada include special
provisions to improve outcomes for Aboriginal peoples.
87 See Trimble, Arscott and Tremblay (2013) for a recent review of women’s representation in Canada across levels of government. 88 Based on Statistics Canada definitions.
86
In 2001, the federal government opened an Office for Disability Issues, which serves as the focal point on
disability issues at the federal level and is responsible for reporting annually on Canada’s efforts to
address the concerns of people with disabilities. Its efforts include financial assistance and savings plans,
funding for projects and community initiatives to support improved accessibility and economic
opportunities for people with disabilities, and efforts to raise awareness about disability and accessibility
issues (see HRSDC 2013; Canada 2014a). Provinces and territories have also taken certain efforts to
improve outcomes for people living with disabilities (see Canada 2014a for overview). In addition to
human rights legislation and policies on non-discrimination, provinces and territories promote a variety of
initiatives to improve access to housing and independent living, provide special education and financial
assistance and encourage employers to hire people with disabilities.89 In the 2013 federal budget, the
federal government announced $222 million, matched by sub-national level governments, to support
programming related to skills training and employment.
With respect to women’s rights, Status of Women Canada is the federal department whose mandate is to
promote gender equality and women’s full participation in economic, social and democratic life. The
department supports initiatives to address its key priorities, which currently include addressing violence
against women,90 promoting women’s leadership and democratic participation, including on boards and in
Governor in Council appointments, and promoting women’s entrepreneurship and participation in non-
traditional occupations, such as construction trades, engineering and mathematics. These priority areas
largely reflect priorities at the provincial and territorial levels (Status of Women Canada, personal
communication). Status of Women Canada supports a number of initiatives to improve gender equality
outcomes based on its priorities. For example, the Opening Doors: Economic Opportunities for Women
initiative provides funding for projects that seek to advance women in non-traditional occupations,
increase economic options for women and improve prosperity for immigrant women. An Advisory Council
for Promoting Women on Boards was established to examine ways to increase women’s participation on
boards, since women account for 10.3 percent of board seats according to a 2013 survey. The council’s
2014 report called for the federal government to take a leadership position on gender balance and for the
establishment of a 30 percent goal for women’s representation on boards by 2019, with a longer-term
goal of achieving gender balance (Government of Canada’s Advisory Council for Promoting Women on
Boards 2014).
The federal government also has initiatives to address violence against women. It has established a
Federal Victims Strategy, which is administered by Justice Canada and includes the provision of funding
to provinces, territories and non-governmental organisations for projects and activities. The government
has committed nearly $80 million since 2007 to enhance victim assistance programmes, promote access
to justice and promote knowledge on and awareness of victimisation (Justice Canada 2012). In addition,
the Family Violence Initiative, established in 1988, brings together 15 federal government partners whose
efforts aim to reduce family violence through awareness raising, strengthened capacity to respond to
family violence and the identification of effective interventions (Public Health Agency of Canada 2013a).
At the sub-national level, nearly all provinces and territories have specific initiatives aimed at addressing
violence against women (Johnson and Kapoor 2013). Initiatives also exist at the FPT levels to specifically
address violence against Aboriginal women. In 2010, the federal government committed $25 million over
five years to address the issue of missing and murdered Aboriginal women through improvements in the
judicial and law enforcement systems as well as special funding provisions under the Federal Victims
89 For example, Ontario launched a “Don’t Waste Talent” awareness campaign in 2010 to address barriers to employment (Canada 2014b). 90 The 2014 Federal-Provincial-Territorial Forum, which serves as a mechanism to discuss key issues related to gender equality and coordinate activities, focused on addressing sexual violence against women.

87
Strategy to offer access to culturally appropriate services and establish community-based awareness
initiatives (Canada 2014b).
With respect to recent immigrants, efforts have been made to ensure the recognition of foreign work and
education credentials and improve immigrants’ language skills to improve integration into the labour
market. In 2012, the federal government announced a plan to assess the credentials of immigrants before
they arrive in Canada to ensure that individuals will be able to find work when they arrive. Settlement
services offered to recent immigrants are typically offered by local authorities such as municipal
governments, neighbourhood community centres and non-profit organisations. For instance, Toronto,
which is home to the largest share of immigrants in Canada and took in 381,700 newcomers91 in 2011
(Statistics Canada 2013u), has programmes to bridge foreign-trained professionals residing in the city
into new job opportunities (see Toronto 2014). The other two metropolitan areas that receive substantial
numbers of immigrants are Montreal and Vancouver (National Household Survey 2013a), which also
provide a variety of settlement services. The federal government, for its part, gathers relevant information
on immigrant settlement programmes through Citizenship and Immigration Canada, which is the main
department responsible for overseeing immigration, refugee and citizenship issues. Yet, the patchwork
way in which settlement services are delivered has caused outcomes to be uneven (Alexander, Burleton
and Fong 2012). Critics have argued that there is a need to standardise language programmes and
foreign credential recognition services.
Access to Justice
While criminal justice is a shared responsibility among FPT governments, legal aid is provided at the sub-
national level based on cost-sharing arrangements between FPT governments. All provinces and
territories have publicly funded legal aid programmes that provide advice to low-income individuals for
little or no cost.92 Duty counsel – “emergency room professionals of the court system” who provide
immediate services to unrepresented litigants – has been expanded in the last decade (Buckley 2010).
The federal government also provides support to improve access to justice specifically for Aboriginal
women.
In addition, several legal education initiatives exist. Justice Canada’s Supporting Families Fund, which
involves services, programmes and information resources for families to better access the family justice
system, provides support for legal education. Organisations can submit project proposals for initiatives
that develop information for divorcing or separating families. At the provincial level, non-governmental
organisations and associations play an important role in delivering public education clinics and
information resources, particularly to low-income individuals and others who face barriers to accessing
the justice system (Buckley 2010).
Transparency and Corruption
As noted, Canada joined the Open Government Partnership in 2011 and has taken steps to make data
and information more widely available to the public. Canada is party to various international conventions
and initiatives aimed at combating corruption, such as the UN Convention against Corruption and OECD
Convention on Combating Bribery of Foreign Public Officials in International Business Transactions,
among others (DFATD 2012). It is illegal to bribe a foreign public official under Canadian law. Historically
seen as a laggard on the issue, the federal government amended the Corruption of Foreign Public
91 This figure is almost one-third of total newcomers to Canada in that year. 92 See Justice Canada (2014) for an overview.
88
Officials Act in 2013 to close loopholes, create new offences and strengthen Canada’s international anti-
corruption legislation (Morrison et al. 2013) with the aim of ensuring that Canadian companies “play by
the rules” in their dealings abroad (Mas 2013). The Quebec government has taken steps to combat
corruption by passing two pieces of legislation related to public procurement, establishing a permanent
anti-corruption police squad and setting up a commission to examine procurement related to the
construction industry (see Van Praet 2013).
While efforts have evidently been made, Transparency International Canada (2013) suggests that more
work is needed. In an examination of Canada’s implementation of the UN Convention against Corruption,
it noted that while Canada has fully implemented most of the convention’s articles, more efforts are
needed to improve enforcement. It suggested additional steps to address domestic and foreign bribery,
illicit enrichment, money laundering and the protection of whistle-blowers.
Democratic Processes
Elections Canada’s efforts to promote voter turnout, particularly among the youth population and other
groups who experience barriers to voting, include conducting research about voter participation,
producing civil education materials, advertising elections and working to ensure that polling stations are
accessible (Elections Canada 2014a). The agency also works with and supports non-governmental
organisations that promote democratic participation. All of Canada’s provinces have adopted civic
education curriculum reform, which tends to focus not only on political processes, but also character,
volunteerism and community values (Milner and Lewis 2011, 137). However, according to their review of
Ontario’s introduction of civic education in 2000 and the succeeding federal elections in 2004 and 2006,
Milner and Lewis (2011) suggest that civic education may not be having the desired effect in terms of
impacting youth voter turnout. They conclude that effective front-line implementation of civic education –
or in other words, effective presentation of curricula in a dynamic and interesting way – is most likely to
have a lasting effect on political participation among youth.
With respect to representation in politics, several initiatives have been established to promote women’s
participation. Campaign schools – events that provide mentoring and training to women – have been
launched in provinces such as British Colombia, Nova Scotia and Quebec (Cool 2010). The Liberal Party
of Canada held a number of campaign schools in 2014 and Equal Voice – a multi-party organisation that
promotes women’s participation in Parliament – offers an online campaign school called “Getting to the
Gate.”93 Additional efforts by political parties include the provision of financial assistance to help
nominated women, systematic steps to identify female candidates and minimum targets for female
candidates (Cool 2010; Ballington et al. 2011).
National Priorities for Establishing Open, Accountable, Inclusive and Effective
Institutions, Rule of Law and a Peaceful and Inclusive Society
The proposed SDG framework includes the goal “promote peaceful and inclusive societies for sustainable
development, provide access to justice or all and build effective, accountable and inclusive institutions at
all levels” (OWG 2014). Under this goal area, targets areas include reducing violence, promoting rule of
law and ensuring equal access to justice, reducing illicit financial flows, reducing corruption and bribery,
improving accountability and transparency, and citizen participation in decision-making. Most of these
target areas are captured by the list of targets and indicators below (Table 6).
93 For more information, see www.gettingtothegate.com.

89
Also listed are targets and indicators on discrimination in political and economic life, which reflect targets
under the proposed SDGs related to inequality within and among countries as well as between genders.
Table 6. Establish open, accountable, inclusive and effective institutions, rule of law and a peaceful and inclusive society: Targets and indicators
Target Indicator
Global
Provide free and universal legal identity, such as birth registrations
Percentage of children under 5 who are registered with the civil authority
Proportion of adults with a basic legal identity document
Monitor and end discrimination and inequalities in public service delivery, the rule of law, access to justice and participation in political and economic life on the basis of social status
Average time between filing a case and receiving a verdict
Proportion of seats held by women and minorities in national- or local-level government
% of adults with an account at a formal financial institution, disaggregated by sex
Improve personal safety Prevalence of violence against women, including domestic violence
Violent death per 100,000 people
Reduce bribery and corruption in all forms
Survey data regarding bribes or gifts for service from a government official – “In the past year, how often (if ever) have you had to pay a bribe, give a gift, or do a favour to government officials in order to get a document or receive a service”
Improve transparency in the revenue system
Share of eligible taxpayers who submit their taxes
National
Monitor and end discrimination and inequalities in economic life on the basis of social status
Proportion of senior managers who are women
Wage gap between immigrants and non-immigrants with comparable levels of education
Increase access to justice Proportion of legal aid applications approved
Proportion of parties appearing in court without legal counsel because they cannot afford it
Proportion of people who are aware of their fundamental rights, the law and the legal system
Proportion of jurisdictions that have integrated legal education into secondary curricula
Support realisation of human rights Compliance with recommendations from the UN’s Universal Periodic Review and UN treaties
Implementation of the UN Convention on the Rights of Persons with Disabilities
Compliance with the UN Declaration on the Rights of Indigenous Peoples and recommendations by the special rapporteur on the rights of indigenous peoples
Increase public participation in political processes, including elections at all levels of government
Proportion of eligible voters who vote in federal elections
Proportion of eligible voters who vote in provincial and territorial elections
Proportion of eligible voters who vote in municipal elections
Proportion of citizens who have engaged in non-voting political activities
Proportion of Canadians who demonstrate basic understanding of political processes and institutions in Canada
Reduce bribery and corruption Number of Canadian firms or individuals sanctioned under the World Bank’s fraud and corruption policy
Survey capturing perceptions of corruption in Canada

90
During the inception workshop, the issue of access to justice was highlighted as a major area of concern
for participants and, as such, indicators on the issue have been included for Canada. Participants also
agreed on the importance of combating corruption, though they recognised that difficulties exists in
identifying an appropriate national-level indicator. Hence, two suggestions are listed in Table 6. Reflecting
on social inclusion, participants, as well as stakeholders consulted through interviews and peer reviewers,
noted that compliance with international human rights standards is a critical challenge with respect to
Aboriginal peoples. They also mentioned that more efforts are needed to realise the rights of women and
people with disabilities.
The global minimum standard included for this goal area is “provide free and universal legal identity, such
as birth registrations.” In the Canadian context, registration of newborns is nearly universal, which means
that this global minimum standard is not relevant.
Data on Governance
Data related to governance are the most problematic across the goal areas (see Box 14). This is
unsurprising given the range of issues captured by this goal area. It is worth recalling that some of the
global targets and indicators for which data do not exist are less relevant for Canada. For example,
Canada does not collect information on the proportion of individuals who are registered at birth or adults
with a basic legal identity document. In Canada, birth registration is a legal requirement and Statistics
Canada (2014i), which monitors coverage, estimates that late registrations represent 1,000 to 1,500
cases five years following birth.
In the area of access to justice, data are insufficient. A data gap exists with respect to who is able to
access the justice system and disaggregated data are unavailable, though it is generally understood that
access to justice is a greater challenge for Aboriginal peoples and the poor (Buckley 2010). The lack of
good data has prompted a number of groups to take up initiatives aimed at identifying the economic and
social costs of justice (Canadian Forum on Civil Justice 2012) and developing access to justice metrics
(CBA 2013).
With respect to monitoring progress on post-2015, it will be nearly impossible for Canada to provide an
accurate picture of the average time between filing a case and receiving a verdict across FPT and
municipal court systems from current datasets. Statistics Canada collects data through the Integrated
Criminal Court Survey, which provides data on adults and youth, Civil Court Survey and Legal Aid
Survey. With regard to how the indicator on time could be captured through these survey instruments,
information collected from the Integrated Criminal Court Survey and Civil Court Survey are not
necessarily comparable (Statistics Canada, personal communication). The Civil Court Survey provides
information on active court cases by elapsed time from case initiation to first deposition, while the
Integrated Criminal Court Survey provides information on completed criminal court cases by the length of
elapsed time from court appearance to verdict. Neither survey has achieved full national coverage. For
both surveys, median elapsed times are calculated and readily available, though it is possible for
Statistics Canada to calculate averages from the datasets.
There is also a data gap with respect to the number of people appearing before court without
representation because they cannot afford it. The Civil Court Survey allows for collection of this kind of
information, but figures are not available due to non-response and data quality limitations (Statistics
Canada, personal communication). These data are lacking for most jurisdictions under the Civil Court
Survey, though the survey has a variable that seeks to capture information on representation. As a result,

91
the number of people appearing before court without representation because they cannot afford it is not
reported.
Clearly, data on access to justice will be a challenge for SDG monitoring in Canada. Data from the Civil
Court Survey and Integrated Criminal Court Survey can provide proxies for average times between filing
a case and receiving a verdict, but more efforts will be needed to improve coverage and data quality to
enable reporting on other indicators identified in this study.
Data are largely available on political participation –participation in elections and non-election activities–
through Elections Canada, provincial and territorial electoral bodies and Statistics Canada’s General
Social Survey. However, monitoring progress on representation by women and visible minorities across
levels of government in Canada requires more work. The Library of Parliament maintains a database on
federal elections that is available online through the Open Data Portal and includes information on
candidates, election outcomes, ridings and gender. It also has a database on female representatives at
the provincial and territorial levels, though information is not available in a user-friendly searchable format
and not presented in a way that allows quick comparison between female elected officials and total seats.
No official database for women’s representation at the municipal level is available. The situation is worse
for information on visible minority representatives. This is not to say that information does not exist but
rather that it has not been compiled by an official source in a way that facilitates simple tracking of historic
trends. Provincial and territorial electoral bodies do not always provide historical data though tend to
provide standard information on current members of parliament.
One effort to address this issue is the Canadian Elections Database at the University of Calgary (Sayers
2014). The database, which compiles data on FPT election results by political party, candidate and
electoral district, aims to establish a comprehensive data source for Canadian elections since
Confederation. In preparing the dataset, a number of challenges were identified including inconsistency
between electronic and written records and the fact that ethnicity is not recorded (Sayers, personal
communication). On gender, the database includes imputations where data are missing though figures
are fairly close to reality. For the purposes of measuring progress on post-2015, a significant amount of
work is needed to develop a comprehensive database on representation by women and visible minorities
across different levels of government in Canada. The Canadian Elections Database – though an unofficial
source – may serve as a useful and practical starting point for monitoring progress. Additional efforts are
particularly needed to systematically collect data for representation at the municipal level.
Another area for which it is difficult to capture accurate data is the prevalence of violence against women.
Statistics Canada has a variety of data sources including the Uniform Crime Reporting Survey, Homicide
Survey, Transition Home Survey (which captures information on women and children in shelters) and the
General Social Survey - Victimization. Limitations to each of these survey instruments exist. The
Homicide Survey – as suggested by the name – only captures homicides. The Uniform Crime Reporting
Survey allows for a high degree of disaggregation by type of crime and contains information on the
gender of victims and the accused and their relationship. However, only crimes that come to the attention
of the police are recorded. Under-reporting is often a problem since many women do not report their
experiences with violence to the police. Similarly, the Transition Home Survey only captures information
on the women (and children) who report. The General Social Survey - Victimization seeks to address this
challenge through self-reporting but collects data less frequently than other survey instruments (Statistics
Canada, personal communication). Furthermore, the sample size is not large enough to allow for
adequate disaggregation by country of origin for recent immigrants and ethnicity, figures for which are
presented as aggregates of all immigrants and visible minorities (Johnson and Colpitts 2013). Trade-offs

92
clearly exist between the various sources in terms of relevance and frequency. Nevertheless, Canada has
the national-level data to report on progress for this area in the proposed SDG framework.
A number of indicators at the national level – particularly those related to realising human rights – are
based on expert review. As such, potential sources have not yet been suggested. Additional work will
likely be needed to develop appropriate methodologies, though making use of the UN’s Universal
Periodic Review to facilitate monitoring on this area, as suggested by the Sustainable Development
Solutions Network (2014), is a practical approach.
Finally, in the area of corruption and transparency, official data are difficult to find. In many respects,
much of the “monitoring” is unofficial, events-based and a result of evaluations by independent auditing
bodies and the media. In thinking through a number of the issues related to governance in this study,
monitoring progress on areas like realising human rights, increasing transparency and combating
corruption may require trusted independent domestic or international organisations to conduct monitoring
and evaluation. Notwithstanding debates about methodology, organisations like Transparency
International already play a monitoring role and may be well placed to monitor progress on transparency
and corruption under the proposed SDG framework.
Box 14. Data strategy: Establish open, accountable, inclusive and effective institutions, rule of law
and a peaceful and inclusive society
Best data sources: A variety of data sources are required to measure progress on this goal area and
additional efforts will likely be needed to collect data and develop methodologies to measure priorities
identified in this study more effectively.
Rationale: The variety of thematic issues addressed under this goal area make it impossible for any one
survey instrument to measure progress. Potential sources identified include the Civil Court Survey,
Integrated Criminal Court Survey, Uniform Crime Reporting Survey and General Social Survey.
Limitations: Efforts will be needed to improve data collection, including the availability of disaggregated
data, across targets and indicators, most notably with respect to access to justice, political representation
and violence against women. Surveys identified as sources to monitor access to justice do not have full
coverage. It is also not necessarily possible to compare the civil and criminal court systems given how the
two systems operate. Data on political representation exist but the costs of populating a comprehensive
“official” source would likely be prohibitive, especially given that reliable unofficial sources could fill some
of the gaps, at least on representation by women at FPT levels. The General Social Survey, which serves
as a possible source for data on political participation and victimisation, collects data every five years,
which may not be frequent enough for monitoring post-2015. It is also limited in terms of disaggregated
data.
Opportunities for Establishing Open, Accountable, Inclusive and Effective Institutions,
Rule of Law and a Peaceful and Inclusive Society
Realising the Rights of People With Disabilities
In the UN’s latest Universal Periodic Review of Canada, seven recommendations were made with respect
to the UN Convention on the Rights of Persons with Disabilities centring largely on continuing ongoing

93
efforts (OHCHR 2013). Canada accepted all of them with the exception of the recommendation on
ratifying the optional protocol that allows a committee to receive complaints when a violation occurs.
While greater efforts could be made to coordinate between federal and provincial jurisdictions, particularly
on the issue of benefits (Manitoba Jobs and the Economy, Government of Manitoba, personal
communication), evidence suggests that federal and provincial governments have demonstrated
commitment to realising the rights of people with disabilities through legal frameworks, policies and
intervention mechanisms (McColl et al. 2010). Governments have taken steps to raise awareness on
issues related to disability and a number of financial assistance mechanisms exist.
Women’s Political Representation
Though figures were stagnant over the 2000s, more recent figures show increases in the proportion of
female representatives in Parliament. While Canada has not yet reached the UN-recommended figure of
30 percent for the proportion of women in government, with the exception of the Senate (the upper
chamber of the national Parliament), some political parties have taken efforts, including the
implementation of quotas, to promote women’s participation. Moreover, Canadian society is changing.
Full gender equality is not yet a reality, but there is no question that significant gains have been made in
terms of gender equality outcomes over the past few decades. More women are participating in the
labour force and trends suggest that unpaid work is becoming increasingly shared (Marshall 2011).
Sexism certainly still exists in Canadian society and continued efforts are needed to promote gender
equality, though changing social norms and trends bode well for increasing women’s participation in
politics.
Challenges to Establishing Open, Accountable, Inclusive and Effective Institutions and
Rule of Law and Peaceful and Inclusive Society
Realising the Rights of Particular Groups in Canadian Society
With respect to women’s rights, the extent to which FPT governments have demonstrated concerted
leadership on gender equality in the recent past is questionable. In 2006, the word “equality” was
controversially removed from the mandate of Status of Women Canada, which has also seen significant
budget cuts and staff layoffs as well as the closure of the majority of its regional offices (Amnesty
International Canada 2012). These changes have had implications for women’s organisations historically
funded by Status of Women Canada and have led to the closure of a number of those organisations (see
West Coast LEAF 2008; Whittington 2013).
Furthermore, Canada has no national plan to address violence against women. Critics have noted that
existing policies and strategies are not sufficiently framed by gender equality or human rights, but rather
tend to see victims as gender neutral. Moreover, as with women’s organisation, organisations that focus
on violence against women, particularly those focusing on research and advocacy, have seen a decline in
government funding (Johnson and Kapoor 2013, 13). This has occurred in a context where self-reported
violence against women has remained stable (Sinha 2013). It should also be noted that, in addition to the
reduced capacity of Status of Women Canada, a recent audit across federal government departments
revealed that most departments do not effectively perform gender-based analysis on a consistent basis,
despite the government’s commitment to do so since 1995 (Office of the Auditor General of Canada
2009).

94
The UN special rapporteur on the rights of indigenous peoples noted that despite having a sound legal
framework, steps taken by FPT governments to address key issues, such as the well-being gap between
Aboriginal communities and the non-Aboriginal population, outstanding treaty and Aboriginal claims, and
the vulnerability of indigenous women and girls to abuse, have been insufficient (Human Rights Council
2014). The UN’s latest Universal Periodic Review of Canada’s human rights situation included nearly 20
recommendations with respect to Aboriginal peoples. Canada rejected the recommendations to give full
effect to the UN Declaration on the Rights of Indigenous Peoples and establish a national action plan in
pursuance of the declaration, though it accepted the recommendation to adopt a comprehensive strategy
to address the situations of Aboriginal peoples at the federal level. Canada also rejected numerous
recommendations that called for a national action plan to address violence against indigenous women, a
call which has been echoed at the national level by advocates who have demanded a national inquiry into
missing and murdered Aboriginal women. Canada agreed, however, to ensure parity of funding and
services between Aboriginal communities and the non-Aboriginal population and to make greater efforts
to consult with Aboriginal peoples.94 Commentators have called for the creation of a national Indigenous
Rights Task Force, with annual reporting, under the Canadian Human Rights Commission as a significant
step in promoting greater progress on and accountability for realising the human rights of Aboriginal
peoples in Canada (Mitchell and Enns 2014).
A major challenge in terms of progress by immigrants is their low employment rate, which is especially an
issue among recent immigrants.95 A recent study conducted by Statistics Canada on the immigrant labour
force found that this group was hit the hardest by the 2008–09 financial crisis. Between 2008 and 2011,
the employment rate for recent immigrants aged 25–54 fell to approximately 63 percent (Statistics
Canada 2012c). The employment rate started improving in 2012 and as of 2014, it stands at 66.4 percent
– a 0.7 percent drop from the previous year’s national average (Statistics Canada 2015b). When the
employment rate is compared with Canadian-born labour force participants, the numbers are significantly
different. The employment rate for Canadian-born labour force participants averages approximately 83
percent with 2014 estimates indicating a rate of 83.1 percent (Statistics Canada 2015c). The employment
gap between the two groups varies between 15 and 19 percentage points, demonstrating a substantial
disparity. Of course, economic and societal integration are important determinants of this disparity.
However, Labour Force Survey data show that even when immigrants become well established96 the
employment rates between the two groups still differ by nearly three percentage points (Statistics Canada
2015c; also see Statistics Canada 2012c).
It is not just the low employment rate that is a problem. Even when immigrants find jobs, they tend to
receive lower-than-average pay with visible minorities having the lowest earnings in this group. For
instance, the median income in 2009, the most recent year from which data are available, for immigrants
coming from Africa, Asia and South America was approximately $21,500 regardless of how high their
educational qualifications were (Statistics Canada 2015b). Canadians’ median income ranged
somewhere between $36,000 and $37,500 for the 2007–11 period (Statistics Canada 2013v). The
incomes of individuals who held a university degree tended to be much higher and a good proportion of
these individuals belonged to the top 10 percent of earners97 (Statistics Canada 2013w). Low incomes as
well as the low employment rate are evidently major obstacles hindering economic progress for
94 The UN special rapporteur on the rights of indigenous peoples also noted that additional efforts are needed to ensure effective consultation with and participation by indigenous peoples in the decision-making processes that affect them (Human Rights Council 2014). 95 Recent immigrants are defined as those who landed in Canada within the last five years 96 “Well established” refers to immigrants who have been living in Canada for more than 10 years. 97 In 2010, the incomes of the top 10 percent of Canadians were over $80,400.

95
immigrants in Canada and parts of a systemic problem that must be tackled with greater efforts from all
levels of government to ensure equal opportunity for all segments of society.
Access to Justice
Several challenges to ensuring access to justice in Canada exist. Research suggests that the country’s
legal aid programmes are in dire need of an overhaul (Buckley 2010). Spending on the justice system is
low at roughly 1 percent of government budgets (CBA 2013, 11) and funding for legal aid has not
increased in real terms in the past 10 years (CBA 2014). In comparison to other social services, such as
the health and education systems, policy-makers do not prioritise financing to improve access to the
justice system and legal aid is not delivered in a comprehensive or consistent manner across provinces
and territories.98 This has led to underfunding and programming that cannot meet individuals’ needs,
disparities in coverage across provinces and territories, and fragmentation in terms of the services that
legal aid clients access, all of which disproportionately impact marginalised individuals who are most in
need of legal aid, such as low-income individuals, women, people with disabilities, recent immigrants,
members of racialised communities and Aboriginal peoples (CBA 2014).
The Canadian Bar Association has indicated that there is a need to adopt a more client-centred
approach, implement flexible delivery mechanisms and better coordinate legal aid and other services. It
has suggested targets based on a three-pronged approach. The approach includes facilitating “everyday
justice” by building the population’s capabilities through training to use the justice system appropriately,
effective triage and use of technological solutions, transforming the formal justice system to offer a range
of dispute resolution mechanisms and reinventing the delivery of legal services to eliminate gaps in
service through a more effective continuum of public and private legal services offered according to
categories of need.99 A few provinces have increased eligibility for legal aid, but advocates continue to
argue for increased coverage (Buckley 2010). Some suggest that “the renewal of the federal role in
funding legal aid and in establishing national legal aid policy is the sine qua non step to ensure the
viability and sustainability of this vital social program” (Buckley 2010, 64).
Promoting Democractic Participation
Amendments to the Canada Elections Act were passed in May 2014, one of which may make it more
difficult for voters to vote. The use of voter information cards to prove one’s address is no longer allowed.
According to experts, up to 500,000 voters could be disenfranchised from the new provision (Bryden
2014). Elections Canada’s chief electoral officer argued against this provision, among others in the bill,
suggesting that some groups, such as seniors in seniors’ residences and students living on campus, often
have difficulty proving their address and, as such, voter information cards in combination with another
piece of identification should be allowed (Elections Canada 2014b).100 In 2015, Canadians will go to the
polls for a federal election that will provide some indication of the impact of the changes to the act.
98 See CBA (2012) for an overview of the history of legal aid in Canada. 99 See CBA (2013) for a complete overview of the approach, which is far more comprehensive than what can be presented here, and associated targets. 100 Initially, the amendments also included eliminating the practice of allowing individuals to vouch for voters without identification, which the chief electoral officer also argued against (CBA 2014). This provision was removed from the final bill.

96
Establish a Global Partnership for
Sustainable Development
Current Situation
The goal area related to global partnership essentially refers to countries’
efforts to support sustainable development at the global level and within
developing countries. Under MDG 8, global partnership was
characterised by commitments on official development assistance (ODA)
and debt relief, efforts to increase trade with and investments to
developing counties as well as the improvement of technology transfer
and access to affordable essential drugs to meet developing country
needs. In the OWG’s proposed SDGs, the agenda on global partnership
has been broadened to include issues such as supporting developing
countries’ capacities to mobilise domestic resources, improving the
quality and availability of data in developing countries, reducing the costs
of remitting money and building multi-stakeholder partnerships (see Box
15 for an overview of the terminology used below).
In terms of Canada’s engagement with developing countries through
trade, investment and remittances, Bhushan (2013a) provides an
excellent overview of current trends.100 In terms of flows between Canada
and developing countries, imports to Canada, bilateral remittances and
foreign direct investment (FDI) are significantly higher than aid. In 2012,
aid spending was less than $6 billion. The value of goods imported to
Canada from developing countries101 was roughly $133.4 billion, or
approximately 29 percent of Canada’s imports. For least developed and
low-income countries, Canada’s imports from the poorest countries
represent a fraction of total imports valued at approximately $5.14 billion
and tend to be dominated by fuel and mineral products and textiles and
apparel from Angola and Bangladesh, respectively.
FDI and remittances to developing countries account for considerably
smaller flows in comparison to imports but are still significantly larger
than aid. Total FDI outflow to developing countries was around $11.7
billion in 2012, representing 31 percent of Canada’s total FDI. However,
investments in least developed and other low-income countries are
marginal. In 2010–11, flows were roughly $53 million, with the Americas
serving as the only region where Canadian FDI flows are significant,
high-income countries aside. Countries in this region include resource-
rich countries like Argentina, Chile and Mexico. According to World Bank
(2011) estimates, remittances from Canada to developing countries were
around $14.7 billion, or 64 percent of Canada’s total migrant remittances
in 2011, but only $480 million went to least developed and low-income
countries (Bhushan 2013a).
Section Highlights
National Priorities
Address special needs of
fragile, least developed,
small island developing and
landlocked states
Promote better statistics for
development
Support climate change
adaptation and mitigation
Strengthen domestic
resource mobilisation in
developing countries
Implement ODA
commitments
Promote global citizenship
Key Data Sources
Canadian International
Merchandise Trade
(Customs Basis)
Canada's International
Investment Position
Aid data provided to OECD
Opportunities
Strong track record in
meeting ODA commitments
Challenges
Foreign policy agenda that
does not balance trade,
security and development
interests
Increasingly unilateral
approach to global politics

97
Box 15. Global partnership terminology
Developing country: There is no established convention for the designation of “developed” and
“developing” countries or regions in the UN system. In common practice, Japan in Asia, Canada and the
United States in North America, Australia and New Zealand in Oceania, and most countries in Europe are
considered “developed” countries and regions. In international trade statistics, the five-country Southern
African Customs Union is treated as a developed region, Israel is recognised as a developed country,
countries that have emerged from the former Yugoslavia are treated as developing countries, and the
countries of Eastern Europe and the former Union of Soviet Socialist Republics countries in Europe are
not included under either developed or developing regions (OECD 2014d). 101102
Least developed country: The identification of “least developed country” is currently based on three
criteria: GNI per capita, human assets and economic vulnerability to external shocks. The latter two are
measured by two indices of structural impediments, namely the human assets index and economic
vulnerability index. The Committee for Development Policy, a subsidiary body of the UN Economic and
Social Council, is – inter alia – mandated to review the category of least developed countries every three
years and monitor countries’ progress after graduation from the category.103
Landlocked developing country: A country that lacks territorial access to the sea.
Small island developing state: Small island developing states were recognised as a distinct group of
developing countries facing specific social, economic and environmental vulnerabilities at the UN
Conference on Environment and Development in 1992. The UN recognises the 38 UN member states
belonging to the Alliance of Small Island States, an ad hoc negotiating body established by small island
developing states at the UN. Geographical regions identified as the locations of these states include the
Caribbean, Pacific and Atlantic Oceans, Indian Ocean, Mediterranean and South China Sea.104
Aid: The words "aid" and "assistance" refer to flows that qualify as ODA or official aid (OECD 2014d).
Official development assistance: Flows of official finance administered with the promotion of the
economic development and welfare of developing countries as the main objective, which are
concessional in character with a grant element of at least 25 percent (using a fixed 10 percent rate of
discount). By convention, ODA flows comprise contributions of donor government agencies, at all levels,
to developing countries (“bilateral ODA”) and multilateral organisations. ODA receipts comprise
disbursements by bilateral donors and multilateral organisations. Lending by export credit agencies – with
the pure purpose of export promotion – is excluded (OECD 2014d).
Official aid: Flows that meet conditions of eligibility for inclusion in ODA other than the fact that the
recipients are on Part II of the DAC List of Aid Recipients (OECD 2014d).
Other official flows: Transactions by the public sector with countries on the DAC List of Aid Recipients
that do not meet the conditions for eligibility as ODA or official aid, either because they are not primarily
aimed at development or they have a grant element of less than 25 per cent (OECD 2014d).
101 See also CIDP (2014) for an interactive dashboard on “Canada’s Development Footprint Beyond Aid,” which compiles data on trade inflows, FDI and remittances between Canada and developing countries. 102 These countries include China. See Bhushan (2013a, 35–36) for a full breakdown of countries included. 103 See http://unohrlls.org/about-ldcs/criteria-for-ldcs for more information. 104 For more information, see http://unohrlls.org/about-sids.

98
Though globally ODA rose by 6.1 percent in real terms in 2013, Canada’s ODA fell significantly by 11.4
percent from US$5.65 billion in 2012 to US$5.01 billion in 2013 (OECD2014a; 2012 prices and exchange
rates).This decline can be explained by exceptional payments made in 2012 for climate change and debt
relief, as well as budget cuts (OECD 2014a; see also Bowers-Krishnan and Bhushan 2014). In 2012,
Canada’s ranking among the 29 OECD-Development Assistance Committee (DAC) donors improved in
terms of aid volume, moving from ninth in 2011 to sixth in 2012 with its aid budget increasing by 4.1
percent in real terms in 2011 (OECD 2013a).105 In 2010, the Canadian government announced an “aid
freeze” that would represent a 9.7 percent decline in real terms over three years – or $377.6 million by
2014–15 – in the International Assistance Envelope.106 According to data for 2013, Canada now ranks
ninth against its peers in terms of volume of disbursed ODA. Canada’s ODA-to-GNI ratio–the measure
often used to examine developed countries’ commitments to development – puts it at 16th in 2013 (at
0.27 percent) against other OECD-DAC ODA providers, down from its ranking of 14th in 2012 (at 0.32
percent). Like most other donor countries, Canada has never reached the international goal of allocating
0.7 percent of its GNI to development.
In Canada, aid is provided through a number of institutions, though historically the bulk of it was provided
by the Canadian International Development Agency, which disbursed $3.45 billion in fiscal year (FY)
2012–13 (DFATD 2013b). In 2013, the agency was merged with Foreign Affairs and International Trade
Canada, becoming DFATD. Prior to the merge, Foreign Affairs and International Trade Canada’s aid
expenditures focused on Canada’s engagement with fragile and conflict-affected states (these recipients
accounted for 41 percent of its aid expenditures in FY2012–13) (DFATD 2013b). DFATD provides
bilateral aid (through country- and region-specific initiatives, including humanitarian assistance),
disburses multilateral aid (support provided through multilateral organisations such as UN agencies) and
works with civil society partners to achieve Canada’s development objectives. Other key departments
involved in the provision of aid include Finance Canada and the International Development Research
Centre.107 The latter, which managed $254.59 million in FY 2013–13, is an arm’s length government
entity – a Crown corporation – that supports researchers and innovators in developing countries in
identifying solutions to their development challenges through the provision of financial resources, advice
and training.
Finance Canada was responsible for $544.56 million in FY2012–13 and has the primary responsibility of
representing Canada in international financial institutions such as the World Bank, International Monetary
Fund and regional development banks. It also manages Canada’s debt relief initiatives. Canada also
contributes to Fast-Start Financing for climate change adaptation and mitigation, an international initiative
linked to the Copenhagen Accord. In 2013, the government reported contributing $432 million for
FY2012–13,108 thereby meeting its commitment of $1.2 billion. In the same FY, Canada provided $528
million in humanitarian assistance to respond to complex humanitarian crises and natural disasters
(DFATD 2013c).
As noted by Heidrich, Kindornay and Blundell (2013, 29), Canada’s provinces “do not have a coordinated,
systematic, or significant presence in international cooperation.” Nevertheless, provinces are engaged in
105 It should be understood, however, that this improvement in ranking is due largely to declines from other donors, such as the Netherlands and Sweden, which ranked above Canada in previous years (Bhushan 2013b). 106 In Canada, the term “international assistance” is far broader than ODA, referring to funding included in the International Assistance Envelope. Not all components of this portfolio are included in the calculations of ODA. Furthermore, ODA includes other disbursements, such as debt relief, contributions from provincial and municipal governments to development aid and the costs of new refugees and students from developing countries in Canada. This means that figures reported in the International Assistance Envelope differ from what is reported as ODA (see Heidrich, Kindornay and Blundell (2013) for a review). 107 Fifteen federal departments and agencies play a role, including those responsible for national defence, health, the environment and industry. See Heidrich, Kindornay and Blundell (2013) and DFATD (2013b) for more details. 108 FY refers to the fiscal year, which is from April 1 to March 31.

99
development cooperation. Quebec is the only province with an independent international development
programme,109 while other provinces tend to disburse aid sporadically. In 2012, aid from the provinces
accounted for 0.65 percent of Canadian aid, or $3.71 million, with Quebec serving as the biggest provider
(Heidrich, Kindornay and Blundell 2013). At the municipal level, the Federation of Canadian Municipalities
provides the second largest amount of aid from non-federal donors with the majority of its support being
for programmes from DFATD. It provides in-kind technical assistance by Canadian municipal experts in
areas such as administration, engineering, urban planning and inter-governmental relations.
Concerns have been raised about the recent direction that Canadian aid policy has taken, most notably in
terms of declines in aid spending, alignment of aid with foreign policy objectives, and changes to
Canada’s approach to partnership with non-governmental actors (Bülles and Kindornay 2013; Bhushan
2012). In addition to the announcement to freeze aid in 2010, the federal government in 2012 announced
cuts to aid spending by about 7.5 percent over the following three years. It was recently revealed that
nearly $300 million, or 10 percent, of planned aid went unspent in FY 2012–13, though this lapse should
be understood in the context of broader government lapses in spending.110
The merger that resulted in DFATD was met with concerns from members of Canada’s international
development community, who feared it meant that development priorities will become increasingly
secondary to diplomatic and economic interests (Douglas and Kindornay 2013). These concerns were
exacerbated by the release of the federal government’s Global Markets Action Plan in 2013. In an effort
to entrench “economic diplomacy” as a staple of Canada’s approach to foreign policy, the plan states that
“all diplomatic assets of the Government of Canada will be marshalled on behalf of the private sector in
order to achieve . . . stated objectives within key foreign markets” (DFATD 2013a). The plan outlines the
government’s intention to pursue new trade agreements and foreign investment promotion and protection
agreements as well as improve emerging market access to small and medium-sized companies. While
some have welcomed the government’s approach, others have suggested that it is short-sighted and
there is a need for a more balanced approach that incorporates Canada’s security as well as
development interests (Ibbitson 2013).
Canada’s approach to partnership with the private sector and CSOs has also changed. Recently, the
federal government has taken a proactive approach to working with the private sector on international
cooperation – an approach that coincides with international trends – and has partnered with Canadian
companies, notably those in the mining industry, to support development projects abroad (Douglas and
Kindornay 2013). This approach has led to much controversy and critics have argued that aid should not
be used to subsidise the corporate social responsibility initiatives of Canadian companies, particularly
mining companies. Others, however, welcome the shift toward improved partnerships with the private
sector, recognising the significant potential that exists for the federal government to use aid resources to
leverage private finance, achieve greater scale in aid activities and support private sector–led solutions to
development challenges. Conversely, CSOs engaged in development have seen significant reductions to
their funding (Bhushan 2012) and since 2011, funding mechanisms have become less predictable. This
has reduced the capacity of Canadian CSOs to deliver programming on the ground and led to cuts in
long-standing partnerships, more limited programming and significant staff reductions (CCIC and ICN
2014; see also CCIC and ICN 2012). In 2014, the government released a draft civil society policy that
may signal a shift toward strengthening support for Canadian CSOs. The strategy notes the importance of
supporting civil society and recognises that a sound and coherent approach to partnering with CSOs is
critical for achieving sustainable development (DFATD 2014a).
109 See Ministère des Relations internationales et Francophonie, Québec (2014). 110 See Bhushan (2014a) for a full review of aid spending and lapses.

100
In addition to aid, Canadians make private donations to support international development. According to
the Index of Global Philanthropy and Remittances, Canadians privately gave $2.05 billion over the 2008–
11 period, though this figure is incomplete and likely underestimates the total amount given (Center for
Global Prosperity 2013).
Overall, Canada is at the middle of the pack in terms of commitments to international development in
comparison with its peers. According to the Center for Global Development’s Commitment to
Development Index, which looks at wealthy countries’ efforts to help poor countries, Canada ranks 13th
out of 28 countries.111 The index looks at performance in seven key areas – aid, trade, investment,
migration, environment, security and technology – and demonstrates that while Canada continues to offer
favourable terms of trade to developing countries, exports few arms to poor and undemocratic
governments and has a tax policy that favours private giving, its relatively small contributions to
international peacekeeping, ongoing trade protection in sectors such as dairy and textiles, and poor
environmental record undermine performance. In no area captured by the index is Canada leading the
way.
Previous and Ongoing Efforts
Canada has certain initiatives that provide preferential trade access to least developed and low-income
countries. Since 2003, Canada has offered duty-free, quota-free market access for nearly all products,
including textiles and apparel, through the Least Developed Country Tariff and the Market Access
Initiative for Least Developed Countries. In addition, Canada has provided preferential access for 18
Caribbean countries under the Commonwealth Caribbean Countries Tariff since 1986. While the federal
government does not report on the impacts of its market access initiatives on developing countries,
Bhushan (2013a, 20) demonstrates that growth in imports from the poorest countries has outpaced
growth in Canadian trade overall, though performance is driven by a few key trading partners, as noted
above. It is also worth noting that Canada supports “aid for trade,” which provides support for developing
countries to establish trade-related skills and infrastructure that expand their trade. In 2009, Canada
committed US$461.7 million, the bulk of which – US$288.4 million – was allocated to least developed
countries and other low-income countries (OECD and WTO 2011).
With respect to aid, Canada has legislation –the Official Development Assistance Accountability Act
(Canada 2008b) – that articulates key principles for aid delivery. The act stipulates that aid must focus on
poverty reduction, take into consideration the perspectives of the poor and align with international human
rights standards. ODA for humanitarian efforts – such as post-disaster or post-conflict reconstruction – is
exempted. By requiring that all departments report back to Parliament on aid spending, the act has made
aid spending more transparent and accountable (OECD 2012a, 9) and has led to standardised reporting
across departments that administer aid.
Canada has also taken steps to position itself as a leader in aid transparency and accountability. At the
Fourth High Level Forum on Aid Effectiveness in 2011, the minister for international cooperation
announced that Canada would join the International Aid Transparency Initiative, which aims to make
information on foreign assistance more accessible.112 In addition, the federal government provided access
111 See CGD (2013) for a full review. 112 See IATI (2012) for more information on the initiative. See Bhushan and Higgins (2011) for a full review of Canada’s various transparency initiatives.

101
to international development information through the Open Data Portal, making available datasets on
DFATD (and former Canadian International Development Agency) projects, international assistance by
country and multilateral organisations, maternal, newborn and child health projects, and historical project
data from FY2005–06 onward. Researchers and CSOs currently have significant access to Canadian aid
data in addition to what is already available through the OECD.
In 2009, Canada announced five focus areas for its aid programme – increasing food security, securing
the future of children and youth, stimulating sustainable economic growth, promoting democracy, and
ensuring security and stability.113 Advancing maternal, newborn and child health became a key
development priority under the Muskoka Initiative, which was announced in June 2010 at the Group of
Eight summit in Canada. The federal government has committed $4.6 billion over the 2010–20period in
support of advancing global efforts on maternal, newborn and child health.114
With respect to debt relief, Canada was a founding member of the Paris Club in 1956, which provides
bilateral debt relief to debtor countries. In addition to its participation in the Heavily Indebted Poor
Countries Initiative and Multilateral Debt Relief Initiative, Canada established the Canadian Debt Initiative
in 1999 to forgive the remaining 10 percent of debts owed to Canada by countries that complete the
Heavily Indebted Poor Countries Initiative process, which includes debt cancellation of up to 90 percent.
Through its participation in debt relief initiatives, Canada has cancelled more than $1 billion in debt (CIDA
2012).Three countries remain in the Heavily Indebted Poor Countries Initiative and Canadian Debt
Initiative processes – the Democratic Republic of the Congo, Burma and Sudan. Through the Multilateral
Debt Relief Initiative, countries that complete the Heavily Indebted Poor Countries Initiative process are
eligible to have their debts to international financial institutions cancelled, with creditor countries like
Canada compensating for the debts. Canada will contribute approximately $2.5 billion to these efforts
over a 50-year period. As of 2011, it had contributed $321.5 million (Finance Canada 2012).
National Priorities to Support a Global Partnership for Sustainable Development
The national-level priorities selected for this study were informed by input from stakeholders throughout
the research process, international discussions on the SDGs, Canada’s existing efforts and the needs of
developing countries.
As noted above, the OWG’s proposed SDGs include the goal “strengthen the means of implementation
and revitalise the global partnership for sustainable development” (OWG 2014). Many of the global and
national targets and indicators for this study reflect the OWG goal areas. Indicators related to debt relief,
market access and aid provision for key priorities identified by the OWG, such as meeting the ODA-to-
GNI ratio target and supporting statistical capacity and domestic resource mobilisation in developing
countries, are listed below.
Indicators related to the specific needs of developing countries have also been included, such as those
related to financial support for productive capacity, climate change adaptation and mitigation in
developing countries and aid-for-trade for least developed, small island and landlocked states. The
national targets and indicators broadly reflect feedback obtained during the inception workshop, in which
participants noted the importance of focusing Canada’s aid on fragile, small island and landlocked states
113 There are also three cross-cutting themes, namely increasing environmental sustainability, promoting gender equality and helping to strengthen governance institutions and practices. See Bülles and Kindornay (2013) for an overview and critique of Canada’s aid priorities. 114 See Bhushan (2014b) for an overview of Canada’s efforts under the Muskoka Initiative.

102
in addition to least developed countries, as well as providing support for statistical capacity building.
National targets and corresponding indicators on promoting global citizenship were included to reflect
ongoing efforts by Canadian CSOs in this area.115
Table 7. Establish a global partnership for sustainable development: Targets and indicators
Target Indicator
Global Create an enabling environment for sustainable development
Low-income country debt forgiveness or reduction (% of GDP)
Share of trade in goods and services from low-income countries under duty-free, quota-free market access
Existence of laws for ensuring country-by-country reporting by multi-national corporations, disclosure of beneficial ownership and the prevention of money laundering
Increase financing to productive capacity in low- and middle-income countries
Share of aid to the productive sector
Proportion of foreign direct investment to the productive sector
Share of South-South cooperation to the productive sector
National Address the special needs of fragile, least developed, small island and landlocked states
Total aid allocated to least developed countries
Proportion of aid allocated to least developed countries
Total aid allocated to small island states for climate adaptation and mitigation
Proportion of aid allocated to small island states for climate adaptation and mitigation
Total aid-for-trade financing allocated to least developed, small island and landlocked states
Proportion of aid-for-trade financing allocated to least developed, small island and landlocked states
Promote better statistics for development Total aid allocated to statistical capacity building in developing countries
Proportion of aid allocated to statistical capacity building in developing countries
Support climate change adaptation and mitigation in developing countries
Official climate financing that is incremental to ODA
Strengthen domestic resource mobilisation in developing countries, providing international support to improving tax collection, tax and natural resource revenue transparency
Total aid to support taxation
Proportion of aid to support taxation
Implement ODA commitments to provide 0.7% of GNI in ODA to developing countries
Ratio of ODA to GNI
Reduce the transaction costs of remittances from Canada to 5% or less, including regulatory and administrative costs
Average transaction cost of remitting money, %
Promote global citizenship Proportion of Canadians who contribute to sustainable development efforts abroad through volunteer efforts (in Canada or abroad) or donations
# of jurisdictions that have integrated global citizenship into elementary and secondary curricula
Cross-cutting: Establish a sustainable, healthy and resilient environment for all Reduce per capita waste through prevention, reduction, recycling and reuse
Estimate of transboundary movement of hazardous waste and recyclable materials
115 See, for example, the Global Hive initiative (http://www.globalhive.ca), which promotes global citizenship and is supported by DFATD.

103
It is worth highlighting that the approach taken to measure global partnership here differs from how global
partnership has been monitored under the MDGs. At the moment, reporting on global partnership is
carried out at the aggregate level and includes analysis of other flows in areas such as aid, trade and
investment. The new proposed approach seeks to measure Canada’s individual contribution to global
development, hence the use of national-level indicators for this goal area.
The global minimum standard included for this goal area relates to creating an enabling environment for
sustainable development as measured by the existence of laws for ensuring country-by-country reporting
by multinational corporations, disclosure of beneficial ownership and the prevention of money laundering.
While Canada has regulations to address money laundering,116 additional steps are still needed to ensure
country-by-country reporting by Canadian multinational corporations and improve disclosure of beneficial
ownership.
Data on Global Partnership Overall, Canada has potential data sources for most of the indicators under the goal area on global
partnership (see Box 16). However, indicator concepts present a challenge for overall monitoring and
coding, while confidentiality restrictions may limit the utility of the national-level sources identified through
the data mapping process.
Many of the indicators under this goal area refer to country income levels and concepts like ODA.
Indicators examine flows to low- and middle-income countries and a significant number of the national-
level indicators focus on aid flows, which include ODA and other official flows. However, the composition
of country income level categories changes over time as countries move (typically up) from lower to
higher income categories. Similarly, the group of countries referred to as “least developed” is not fixed.
Notably, the concept of ODA has evolved over time and continues to evolve, which impacts the
magnitude of ODA.117 As definitions and the relevant compositions of countries change between 2015
and 2030, due consideration will need to be given to the comparability of historic datasets and how
results are interpreted. For example, if a significant number of aid-recipient countries shift from low-
income to lower middle-income categories, trends may show a decline in aid to low-income countries,
which would not be a negative outcome.
It may be challenging to get an overall picture of sectoral spending from aid data due to project coding.
Projects are coded by multiple sectors and given percentages to account for the “proportion” of the
project that contributes to each sector. Take, for example, a project that promotes environmental
protection by supporting businesses to adopt better pollution control mechanisms and clean technology.
A project of this nature could be coded 30 percent for biosphere protection, 30 percent for small and
medium-sized enterprise development and 40 percent for environmental policy and administrative
management. This process relies on the judgment of the person doing the coding, which is inherently
subjective (though guides exist to assist coders). While these factors make it difficult to obtain a perfectly
accurate picture, data are likely good enough to monitor progress on post-2015 and broadly reflect reality
overall. It should be mentioned that transparency initiatives related to aid have improved the availability of
information on the issue.
116 See http://www.fintrac-canafe.gc.ca/reg/1-eng.asp and http://actionplan.gc.ca/en/initiative/improving-corporate-transparency for more information. 117 See Hynes and Scott (2013) for an overview.

104
As noted in the Methodology and Implementation Guide for this study, the research focuses on official
country-level data (Bhattacharya, Higgins and Kindornay2014). DFATD produces a number of aid
datasets. The Historic Project Data Set provides detailed information on Canadian International
Development Agency (now DFATD) projects (DFATD 2014b). The dataset used to produce the annual
Statistical Report on International Assistance is also available and includes broad data representing all
departments involved in aid delivery (see DFATD 2013c). While both datasets are publicly available in
user-friendly formats, figures provided by Canada to the OECD are likely the best source for monitoring
progress on post-2015. Canada reports aid figures on a FY basis, but post-2015 monitoring will occur
based on the calendar year. Furthermore, the marker system used by Canada to track thematic areas
(i.e., environment, trade, etc.) is much less detailed than the OECD’s Creditor Reporting System that
allows for significant disaggregation on aid spending, particularly in terms of sector coding, which easily
facilitates monitoring of aid commitments for particular country groups and sectors. Notably, the Auditor
General of Canada’s (2013) recent report on Canada’s multilateral aid found that data provided by the
Canadian International Development Agency (now DFATD) has not always been accurate, suggesting
that more effort is needed to ensure the quality of data reported. The OECD’s Creditor Reporting System
is evidently the most practical dataset for monitoring post-2015 commitments and what will most likely be
used by the international community to monitor progress on global goals as it has data that are
comparable across donors. It therefore makes sense to use data provided to the OECD to monitor
national-level commitments, which will ensure consistency and allow for comparison across global and
national targets and indicators.
Box 16. Data strategy: Establish a global partnership for sustainable development
Best data sources: Canadian International Merchandise Trade (Customs Basis), Canada's International
Investment Position and DFATD aid data provided to the OECD.
Rationale: The databases on trade and investment are the primary data sources available in Canada.
Indicators identified for post-2015 can be calculated based on these datasets since data quality is good.
While Canada has a number of official datasets on aid, they are problematic in terms of the reporting
period (FY rather than calendar year) and the data cannot be disaggregated in its current form as the
OECD’s Creditor Reporting System can. Further, the OECD dataset is internationally comparable and
populated on an ongoing basis, so very little additional effort would be needed to make use of this
dataset.
Limitations: Efforts will be needed to calculate indicators based on the preferred datasets. FDI data are
often confidential, which may mean that data for some countries will be suppressed.
Regarding non-aid flows, Canada has data on FDI stocks in developing countries but they are available
only by sector or by country – not both together. This means figures are not currently available on the
proportion of FDI that flows to the productive sector in low-income countries. Calculating these figures
from existing data is possible, but it would “require a fair bit of work in the FDI section [at Statistics
Canada] and it would be subject to an assessment of the results for confidentiality” (Statistics Canada,
personal communication). FDI data are subject to confidentiality considerations. For instance, when one
or two firms account for the entire stock of Canadian FDI in a particular country, these data are kept
confidential.
Canada does not report on the impacts of market access agreements in terms of whether they increase
trade from low-income countries. Nevertheless, it is possible to calculate the proportion of goods that

105
enter Canada from low-income countries subject to market access agreements. Finally, no official dataset
currently exists on remittances from Canada to developing countries, though the World Bank’s Bilateral
Remittance Index serves as a potential data source.
Opportunities for Contributing to a Global Partnership for Sustainable Development
The federal government’s focus on open data as well as transparency of and accountability for aid
spending bodes well for realising targets related to aid. It is unlikely that Canada will formally commit to
the 0.7 per cent ODA-to-GNI target in the near future (the current government has frozen the aid budget
and, perhaps more importantly, increasing aid is not a politically salient issue in Canada [Chapnick
2013]), but it is clear that Canada has taken steps to improve its monitoring of and accountability for the
commitments it does make. Canada is relatively well positioned to make progress and it has a good track
record of meeting the development cooperation commitments that it makes. In terms of the targets
identified for this study, Canada has historically provided the majority of its aid to least developed and
low-income countries, which accounted for 61 percent of the country’s aid receipts in 2012 (Bhushan
2013a). With respect to statistical capacity building, Canada’s contributions for this purpose have
increased in the recent past, plus the federal government is helping to fund the UN thematic consultation
on data and accountability for post-2015, which suggests that there may be continued support for
statistical capacity building in the future, especially since it aligns well with the government’s overall
approach to data, transparency and accountability. Notably, DFATD has been increasingly looking at how
it can support domestic resource mobilisation in developing countries.
In reviewing Canada’s climate financing, Tomlinson (2013) found that Canada’s contributions to Fast-
Start Financing have been new and additional to budgeted levels of ODA. Moreover, the bulk of Canada’s
allocations, 70 per cent, have been going to countries that are highly vulnerable to the impacts of climate
change, including least developed countries, small island states and certain African countries. However, a
significant proportion of Canada’s allocations have been in the form of loans, repayable to Canada,
through trust funds managed by the World Bank’s International Finance Corporation and regional
development banks. This means that more than $615 million will be returned to Canada over the life of
the initiative. While Canada has set a positive precedent with respect to providing new and additional
funds for climate change adaptation and mitigation, attention needs to be paid to the quality of its
contributions.
Challenges for Contributing to a Global Partnership for Sustainable Development
Certain broad challenges may hinder Canada’s ability to realise outcomes related to a renewed global
partnership for sustainable development, including the federal government’s current approach to foreign
policy, the low prioritisation of development in national policymaking and an overall decline in Canada’s
commitment to multilateralism.
Canada’s Global Markets Action Plan, described above, may translate into greater opportunities for
increasing FDI to developing countries. As noted, the approach puts an emphasis on economic
considerations, particularly in terms of promoting Canadian business interests. Based on the federal
government’s current direction, FDI from Canada to developing countries will likely increase. However,
the extent to which Canadian FDI will benefit developing countries (at least in terms of the proportion that
goes to the productive sector) is questionable and difficult to track. As noted by Bhushan (2013a),
recently negotiated foreign investment promotion and protection agreements with African countries have
included significant mining components. Ongoing negotiations in another 14 countries mirror Canada’s

106
mining investments, particularly in West Africa and countries such as Mongolia, Vietnam, India, Pakistan
and Indonesia. It is worth noting that questions have been raised regarding the extent to which foreign
investment promotion and protection agreements contribute to sustainable development (Bernasconi-
Osterwalder et al. 2012). The international investment regime tends to offer excessive protection to
foreign investors – protection that is enforced by a largely criticised investor-state dispute settlement
mechanism – which may deter governments from adopting public policies on environmental protection or
national economic development. Given that Canadian investments are primarily in resource-rich
countries, this arrangement presents an added challenge to ensuring that Canadian FDI, particularly in
the natural resource sector, contributes to broad economic, social and environmental aspects of
sustainable development and does not undermine the ability of host countries to enact, for example,
greater environmental protection policies as they pursue the SDGs.
Canada is also in the process of negotiating free trade agreements with a number of different countries.
The majority of these countries are high- or middle-income countries and the federal government sees
strategic benefits to gaining greater market access. With respect to low-income countries, most have
already been granted duty-free, quota-free market access. However, as noted above, such access has
not necessarily led to a significant increase in exports across countries and sectors. While DFATD
supports various initiatives aimed at increasing developing countries’ exports to Canada, additional efforts
are needed to enable developing countries to fully capitalise on duty-free, quota-free market access to
Canada, particularly given that Canada’s geographical location and characteristics act as natural barriers
to increased trade. Given the government’s focus on trade over development, it seems unlikely that
additional efforts will be forthcoming. Significant improvement on the indicator related to imports from low-
income countries is likely to occur as a result of economic growth in trading partner countries rather than
any particular efforts taken by the federal government.
Another key challenge in the Canadian context is the extent to which development efforts are a national
priority (Chapnick 2013). Despite vocalised concerns by members of Canada’s international development
community regarding the recent aims and direction of Canada’s aid programme, which has been aligned
with broad foreign policy objectives,118 the federal government has continued upon its chosen path.
Chapnick (2013) has convincingly argued that what development advocates fail to realise is that there is
very little political incentive in Canada to make development a priority. The international development
portfolio has not been a priority for any Canadian government in the past two decades, unlike in the
United Kingdom where support for development tends to exist across party lines. This means it is very
unlikely that Canada will meet the 0.7 per cent of ODA-to-GNI target for aid spending by 2030 without a
major shift in current thinking across political parties in the country.
It is also worth noting that Canada’s current approach to multilateralism represents a break from the past.
Canada has historically been seen as a good global citizen which “punches above its weight” in
international affairs through a principled approach to foreign policy and notable contributions to the two
world wars and peacekeeping. The country also championed the Responsibility to Protect doctrine
following the 1994 Rwandan genocide. While Canada has historically taken a variety of approaches to
multilateralism across areas such as trade, security and the environment (see Black and Donaghy 2010),
it used multilateralism to promote Canadian interests and values and employed multilateralist practices to
enhance Canadian influence in the world, indicating that multilateralism has been an important part of
Canadian foreign policy (Keating 2010). Recently, however, concerns have been raised about Canada’s
commitment to multilateralism and related global institutions (Brown and Olender 2013; Keating 2010).
118 See Heidrich, Kindornay and Blundell (2013) for a brief overview and Douglas and Kindornay (2013) on changes in Canada’s approach to aid and the private sector.

107
Notwithstanding increasing support to international financial institutions over the 2000s (Bhushan and
Higgins 2011), critics suggest that Canada has increasingly taken “an attitude of indifference” to
multilateral governance, particularly as questions regarding the effectiveness of global institutions in
addressing challenges such as regional conflicts, climate change and trade have emerged (Keating 2010,
15). In 2013, Canada withdrew from the UN Convention to Combat Desertification. As discussed above,
the country also withdrew from the Kyoto Protocol in 2011. In 2010, Canada failed to win a Security
Council seat for the first time in its history, which critics argued showed that Canada is no longer a
respected international actor (McAskie 2012; CBC News 2010b). In 2013, Canada’s minister of foreign
affairs announced that Canada would not run for a seat in 2014. In their review of Canada’s commitment
to multilateral development cooperation on maternal, newborn, and child health, food security, and
climate change over the 2000–10 period, Brown and Olender (2013, 158) found that “Canada
increasingly adopted an issue-by-issue approach to multilateralism, engaging when the government
determined it was in its interest to do so, but otherwise disengaging or becoming a free rider.”

108
Measuring Progress on Post-2015 in Canada
Overview of the National Statistical System
Organisation
Canada’s highly centralised national statistical system has historically
been recognised as one of the world’s leading systems, alongside those
of Australia, New Zealand and Sweden (Edmunds 2005; see also
Statistics Canada 2013h). A single model for an effective national
statistical system does not exist – the systems of Canada, New Zealand
and Sweden are all quite different. Nevertheless, many statisticians have
noted that the most successful systems share several fundamental
characteristics (Chander 2009). In the Canadian context, the statistical
system is built upon a sound legal framework and has high levels of
public credibility and political autonomy.
Statistics Canada is the federal agency serving as Canada’s central
statistical office. Under the Statistics Act of 1918, Statistics Canada is
required to “collect, compile, analyse, abstract and publish statistical
information relating to the commercial, industrial, financial, social,
economic and general activities and condition of the people of Canada”
(Statistics Canada 2014c). In addition to providing information on
Canada’s economy and society, the agency promotes sound statistical
standards and practices as one of its principal objectives.
The centralised nature of the statistical system means that Statistics
Canada plays an important role in the facilitation of information sharing
among government departments and agencies, as well as provincial
statistical offices, which rely heavily on Statistics Canada for the
collection of raw data (Thompson 2010, 380–81).The agency works with
a number of partner organisations – such as the Canadian Institute for
Health Information, as well as other government departments and
agencies – to provide statistical information and analysis for a range of
purposes (Goldmann 2007). As a member of the Industry Portfolio, for
example, which is a group of 12 federal departments and agencies
working in partnership, Statistics Canada and other members are
positioned to “further the government's goal of building a knowledge-
based economy in all regions of Canada and to advance the
government's jobs and growth agenda” (Industry Canada 2014).
Official Producers of Data
There are three main types of data based on different sources: census
data, sample survey data and administrative data. Generally, the first two
types are largely produced by Statistics Canada, while the third type is a
by-product of the daily activities of other government departments and
Section Highlights
National Statistical
System
Highly centralised system
based on sound legal
framework with relatively
high degree of political
autonomy
Statistics Canada serves as
the central statistical office,
collecting data on nearly all
aspects of Canadian life
Other government agencies
and departments also
produce official data
Data Availability
Data are available for 76 per
cent of the 133 indicators
examined in this study
71 per cent of global
indicators and 78 per cent of
national indicators are
available or can be easily
made available
Data gaps are most
prevalent for goal areas
related to the environment,
energy and infrastructure,
and governance
Data Quality
Data quality is excellent for
goal areas related to
poverty, education and
employment, and very good
for all other goal areas
Where lower scores exist,
they are largely due to a lack
of evidence demonstrating
user consultation
Data quality is better for
Statistics Canada sources
than those of other agencies
and departments

109
agencies, which supply Statistics Canada with the data necessary to produce statistical outputs. Thus,
there are many hands at work in Canada’s national statistical system, all of which require adequate
resources for that system to function properly.
Other public and private institutions such as Health Canada, Industry Canada, the Canada Mortgage and
Housing Corporation, the Canadian Real Estate Association, Environment Canada, DFATD, the
Canadian Institute for Health Information119 and the Bank of Canada also produce data independently.
Though Statistics Canada remains the primary source of data for the majority of Canadian researchers
and analysts, in some cases non-official data sources are used as a supplement. The Bank of Canada,
for example, uses non-official data sources to monitor economic conditions. Based on data obtained from
quarterly consultations with different businesses, it publishes the Business Outlook Survey to provide an
alternative economic perspective that “augments views gleaned from official data” (Armah 2013).
Almost all of Statistics Canada’s data are made available to the general public. Most the data produced
are available online through the Canadian Socio-Economic Information Management System (CANSIM)
database and in their public use microdata files (PUMFs), both of which are updated frequently and
provided free of charge. The census and NHS online portals developed by Statistics Canada also provide
the most recent information in a convenient format and, unlike most other survey data, at very detailed
geographical levels. In addition, archived census profiles and related data products are also maintained
for a number of previous census years. Some information, such as data for certain smaller geographic
regions, are unavailable as a standard product on Statistics Canada’s accessible databases. Requests
can be made for custom information that can be produced for a fee which varies depending on the extent
of the request. The accessibility of official data is generally dependent on the data producer. The Bank of
Canada provides information on economic indicators such as interest rates, exchange rates and price
indices directly through its online databases, for example. The Canada Mortgage and Housing
Corporation provides historical housing data through the Canadian Housing Information Centre, an
Ottawa-based corporate library, in addition to its online databases. Other data producers may have
additional requirements and/or restrictions involved in accessing their data, such as service fees and non-
disclosure agreements.
The data published by Statistics Canada is used by a diverse range of groups – including governments,
community groups, corporations and individuals – for differing purposes. Specific ways that Statistics
Canada’s data are used by governments include analysing economic performance, developing fiscal and
monetary policies, developing social programmes, improving the allocation of government funding and
assessing the cost-effectiveness of health and education programmes (Statistics Canada 2009a).
Unofficial Data Producers
Historically, the vast majority of economic, social and environmental data has been collected, processed,
compiled and produced by official sources including national statistical offices, government departments
and agencies involved in the production of statistics and international organisations involved in the
production of statistics. However, data are also increasingly collected, processed, compiled and produced
by non-official sources (OECD 2013e).120
119 The Canadian Institute for Health Information collates and produces statistics on health in Canada. While all provinces and territories across Canada collect data, the institute produces statistics that allow for comparison across the country using official data from the provinces and territories. The institute is a key source for health data in Canada and follows strict data quality guidelines. See http://www.cihi.ca for more information. 120 Typically, non-official sources refer to all sources of data except for national statistical offices and other government institutions within national statistical systems. For the purposes of this study, international organisations such as the World Bank, OECD,

110
In aggregate, non-official data are generally less reliable than official data. A wide array of organisations
are considered non-official sources, including non-governmental organisations, businesses, and
academic institutions. Unlike official sources, non-official sources often have their own agendas and are
not legally bound to act in the public interest. Non-governmental organisations, particularly advocacy
groups, are visibly biased, making it difficult to trust in the reliability of their data. For example, the surveys
conducted by the Canadian Federation of Independent Business on the issue of job shortages may not
present a balanced view of the labour market since the federation has an evident policy agenda –
promoting the interests of small businesses – and it limits participation in its surveys to its members.121 In
addition, producers of non-official data often lack the expertise and resources of official sources. In terms
of expertise, academic researchers are a clear exception – they usually have relevant expertise and a
commitment to objectivity. Reliable non-official data do exist (e.g., the Penn World Table122 and World
Top Incomes Database123), but official data are generally preferable.
Nevertheless, non-official data are frequently used to address data gaps. For example, international
organisations use non-official data “to fill gaps or to improve data quality and comparability” for data
provided by official sources (UNStats 2013).Governments sometimes use non-official data to justify and
inform their decisions. For example, Finance Canada’s Jobs Report released alongside the 2014 federal
budget used data on online job postings from Wanted Analytics124 to calculate a non-official job vacancy
rate (Finance Canada 2014). However, these non-official data were inconsistent with official data from
Statistics Canada. More specifically, the non-official job vacancy rate increased over the past few years
while the official job vacancy rate stayed relatively stable, with the non-official rate being about 2.5
percentage points higher than the official rate (4 per cent versus 1.5 per cent, respectively). The use of
non-official data by Finance Canada may have been driven by the need to support the federal
government’s view that skills shortages were a critical issue facing the Canadian economy and justify the
importation of a large number of workers, even for unskilled positions, under the Temporary Foreign
Workers Program.
Finance Canada’s use of data from Wanted Analytics also illustrates the risks associated with the use of
data from non-official sources. To estimate the number of online job postings, Wanted Analytics “uses
software to send Web spiders across all known online job sites to create a database of available jobs”
(Curry and Grant 2014). However, Kijiji – one of the online job sites used by Wanted Analytics to estimate
the number of job vacancies – was an unreliable source for job postings and led to the double counting of
online job postings in many cases (Curry 2014a). When the Conference Board of Canada removed Kijiji
as a source for its Help-Wanted Index, a similar statistic from Wanted Analytics, the help-wanted trend,
changed from increasing to stable (Curry and Grant 2014). After removing Kijiji as a source of data, the
Help-Wanted Index became consistent with trends in the official job vacancy rate.
It is important to mention a new type of non-official data – big data. A wide variety of factors has spurred
the development of big data, including the digitisation of transactions, popularisation of the internet, and
computerisation of devices. Unlike official census and sample survey data, big data are a by-product of
daily activities, such as the use of social media, rather than an end in themselves. Since big data are not
subject to the same careful design as censuses or sample surveys, they are often biased as the subsets
International Monetary Fund and International Labour Organization were considered as official sources even though they frequently use non-official sources to make national official data internationally comparable (Upadhyaya 2014). 121 See http://www.cfib-fcei.ca/english/index.html for more information. 122 For more information, see https://pwt.sas.upenn.edu. 123 See http://topincomes.g-mond.parisschoolofeconomics.eu for more information. 124 See https://www.wantedanalytics.com for more information.

111
of populations covered by big data are not always representative of the relevant target population, making
them unreliable for economic, social and environmental analysis (Armah 2013). In addition, Armah (2013,
36) argues that “it remains unclear how best to select, organize and aggregate unstructured [big] data so
that they provide meaningful signals.” Nevertheless, there are many advantages to big data including
large sample size, timeliness, high frequency and detailed level of disaggregation.
Data Availability for Post-2015 As evident above, Statistics Canada collects data through the use of censuses, sample surveys and
administrative records. A short-form and detailed long-form census was administered every five years
until 2011, when the NHS was introduced. Statistics Canada currently runs over 350 surveys – usually
conducted on monthly or annual bases – and statistical programmes that provide information on an
extensive list of subjects. The collection of administrative data, on the other hand, involves compiling data
from administrative records rather than questionnaires. Administrative records are maintained, for
example, to regulate the inflow and outflow of goods across borders, assist in the legal process involved
in registering events such as births and deaths, and administer tax benefits (Statistics Canada 2002). The
substantial amount of information that Statistics Canada is able to gather from its sources – across areas
related to topics such as labour, education, business performance, environment and health – generally
means that researchers and other frequent data users are not often limited by gaps in data availability.
It is worth noting that the vast majority of national surveys administered by Statistics Canada – with the
exception of the census and NHS – do not collect information from First Nations or Inuit communities and
have a limited sample of Aboriginal peoples living off reserve. A key challenge in this context is low
response rates. To address this challenge, Statistics Canada administers an Aboriginal Peoples Survey
that captures data on the social and economic conditions of Aboriginal peoples living in Canada.
Conducted on a quinquennial basis since 2006, it surveys First Nations people living off reserve, Métis
and Inuit.
Data Availability for Proposed Post-2015 Targets and Indicators
Statistics Canada publishes information on virtually all aspects of Canadian life, meaning that Canada is
in an excellent starting position to measure progress on post-2015 in terms of the availability of reliable
official data. For example, indicators on poverty, such as low-income rates estimated by the LICOs, LIM
and MBM, are available through the CANSIM database. Similar information on education, health, labour,
security and the environment is also available for a number of years either on CANSIM or by special
request, depending on the type of information needed. Data on governance are less readily available.
The availability of data from sources other than Statistics Canada, including data obtained from other
government departments and agencies as well as external organisations, is not particularly limited either.
With respect to post-2015, data availability will only be a challenge to the extent that monitoring
requirements for priorities under the global agenda vary significantly from the standard datasets that
Statistics Canada already produces. The data mapping process for this study demonstrated that, in most
instances, data were either already available for the indicator, the indicator could easily be calculated
from available data or Statistics Canada was able to calculate the indicator upon request. For 13 of the
global indicators, six of which fall under the goal area related to governance, data would need to be
collected either through new survey instruments or by adding an additional question to existing survey
instruments. This follows for 22 national-level indicators. Table 8 provides an overview of the general
availability of data for measuring progress against global targets and indicators, with national-level targets
and indicators represented by the shaded rows.
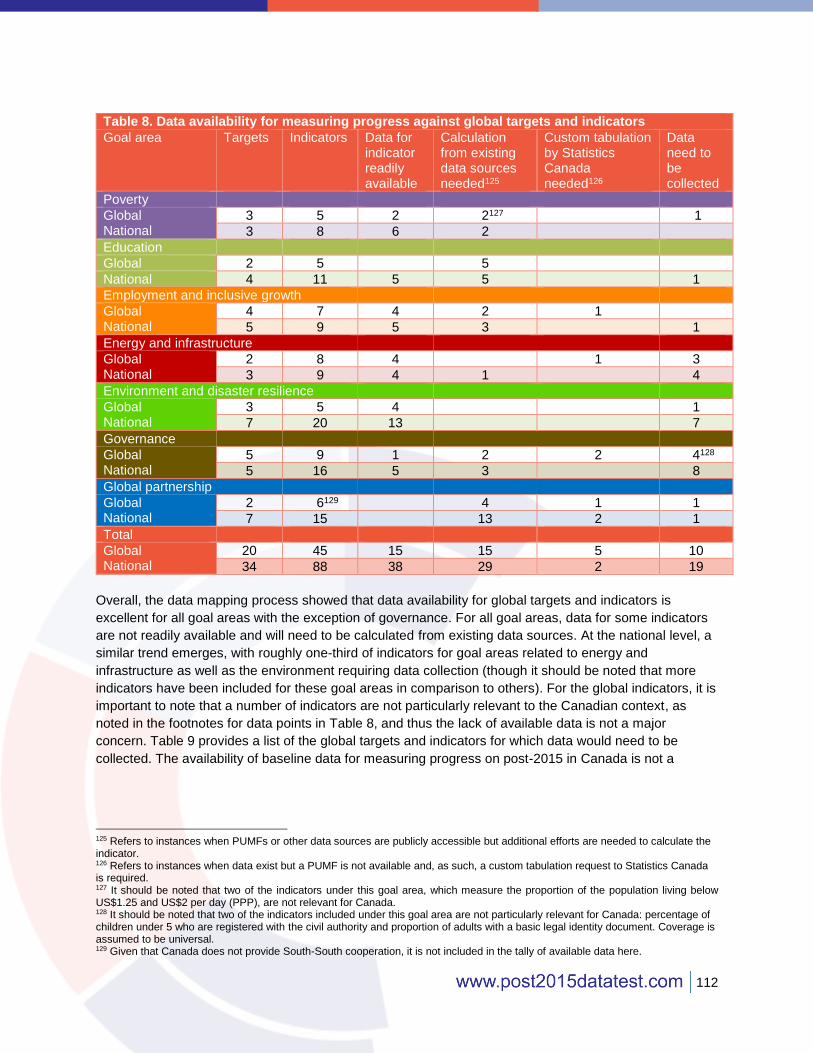
112
Table 8. Data availability for measuring progress against global targets and indicators
Goal area Targets Indicators Data for indicator readily available
Calculation from existing data sources needed125
Custom tabulation by Statistics Canada needed126
Data need to be collected
Poverty
Global National
3 5 2 2127 1
3 8 6 2
Education
Global 2 5 5
National 4 11 5 5 1
Employment and inclusive growth
Global National
4 7 4 2 1
5 9 5 3 1
Energy and infrastructure
Global National
2 8 4 1 3
3 9 4 1 4
Environment and disaster resilience
Global National
3 5 4 1
7 20 13 7
Governance
Global National
5 9 1 2 2 4128
5 16 5 3 8
Global partnership
Global National
2 6129 4 1 1
7 15 13 2 1
Total
Global National
20 45 15 15 5 10
34 88 38 29 2 19
Overall, the data mapping process showed that data availability for global targets and indicators is
excellent for all goal areas with the exception of governance. For all goal areas, data for some indicators
are not readily available and will need to be calculated from existing data sources. At the national level, a
similar trend emerges, with roughly one-third of indicators for goal areas related to energy and
infrastructure as well as the environment requiring data collection (though it should be noted that more
indicators have been included for these goal areas in comparison to others). For the global indicators, it is
important to note that a number of indicators are not particularly relevant to the Canadian context, as
noted in the footnotes for data points in Table 8, and thus the lack of available data is not a major
concern. Table 9 provides a list of the global targets and indicators for which data would need to be
collected. The availability of baseline data for measuring progress on post-2015 in Canada is not a
125 Refers to instances when PUMFs or other data sources are publicly accessible but additional efforts are needed to calculate the indicator. 126 Refers to instances when data exist but a PUMF is not available and, as such, a custom tabulation request to Statistics Canada is required. 127 It should be noted that two of the indicators under this goal area, which measure the proportion of the population living below US$1.25 and US$2 per day (PPP), are not relevant for Canada. 128 It should be noted that two of the indicators included under this goal area are not particularly relevant for Canada: percentage of children under 5 who are registered with the civil authority and proportion of adults with a basic legal identity document. Coverage is assumed to be universal. 129 Given that Canada does not provide South-South cooperation, it is not included in the tally of available data here.

113
problem. Key sources identified by the research team (see Table 10 and Annex 3) all provide data for
2010.130
Table 9. Global targets and indicators for which data need to be collected
Target Indicator
Poverty
Reduce the proportion of people who suffer from hunger
Prevalence of child stunting in boys and girls under 5, %
Energy and infrastructure
Ensure access to energy and improve efficiency and sustainability of energy supply, including renewable energy
# of hours per day households have access to electricity on average
Ensure full access to developed infrastructure and communication technology
% of the population with access to an all-season road
Ensure full access to developed infrastructure and communication technology
Average bandwidth speed (megabits/second)
Environment and disaster resilience
Publish and use economic, social and environmental accounts in all governments and companies
Share of large tax unit taxpayers using integrated reporting
Governance
Provide free and universal legal identity, such as birth registrations
% of children under 5 who are registered with the civil authority
Proportion of adults with a basic legal identity document
Monitor and end discrimination and inequalities in public service delivery, the rule of law, access to justice and participation in political and economic life on the basis of social status
Proportion of seats held by women and visible minorities in national- or local-level government
Reduce bribery and corruption in all forms Survey data regarding bribes or gifts for service from a government official – “In the past year, how often (if ever) have you had to pay a bribe, give a gift, or do a favour to government officials in order to get a document or receive a service”
Global partnership
Increase financing to productive capacity in low- and middle-income countries
Share of South-South cooperation to the productive sector
130 A notable exception is the Census of Population, which was conducted in 2011. While the census is used to adjust official estimates and other surveys and clearly plays a critical role in the production of official data, it is not listed as a key potential source in Table 10, which highlights more frequent surveys.

114
Key Sources of Data
Table 10 lists the key potential sources of data identified across goal areas. Annex 3 provides a complete
list of all sources that the research team envisions playing a role in the monitoring of global and national
targets and indicators. It also provides detailed information on major changes to survey instruments,
including implications of the changes, which informed the data quality assessment.
Many key sources emerged from the data mapping
process. In the goal areas related to poverty and
employment, the Labour Force Survey, Census of
Population and NHS, SLID/CIS and Longitudinal
Administrative Databank are sources of frequent data.
For education, survey instruments that track enrolment
and completion rates are of particular importance, such
as the Elementary-Secondary Education Survey,
Registered Apprenticeship Information System and
Postsecondary Student Information System.
As discussed below, multiple sources are needed to
track progress on targets and indicators related to
energy and infrastructure and the environment.
Regarding the environment, the Canadian
Environmental Sustainability Indicators are frequently
used to measure water and air quality as well as trends
in protected areas. While readily available data for
targets and indicators related to governance are mostly
lacking across the goal areas, key surveys include
those pertaining to the justice system as well as crime
and vital statistics. With respect to global partnership,
aid statistics provided by DFATD, as well as Statistics
Canada’s datasets on trade and investment, are most
relevant.
Quality of Data for Measuring Progress on Post-2015 in Canada
The data quality assessment framework used by research teams under the Post-2015 Data Test is
available in Annex 4 (see also Bhattacharya, Higgins and Kindornay2014). The framework was compiled
using number of quality assurance frameworks, including the Generic National Quality Assurance
Framework Template (Expert Group on NQAF 2012), the European Statistics Code of Practice
(ESSC2011), the International Monetary Fund’s Data Quality Assessment Framework (IMF 2006) and the
Code of Good Practice in Statistics for Latin America and the Caribbean (Working Group on Capacity
Building 2011). Statistics Canada’s Quality Assurance Framework (Statistics Canada 2002) was also
consulted. The five main criteria for examining data quality include: (i) relevance, (ii) accuracy and
reliability, (iii) timeliness and punctuality, (iv) accessibility and clarity and (v) coherence and comparability.
131 Sources from Statistics Canada, unless indicated otherwise.
Table 10. Key potential sources for monitoring the post-2015 agenda in Canada
Sources131 Goal area Census of Population Poverty
Education
Employment and inclusive growth
Canadian System of Environmental and Resource Accounts - Material and Energy Flow Accounts
Energy and infrastructure
Environment
General Social Survey Employment and inclusive growth
Governance
Labour Force Survey Education
Employment and inclusive growth
Governance
Longitudinal Administrative Databank
Poverty
Employment and inclusive growth
National Household Survey
Poverty
Education
Employment and inclusive growth
Energy and infrastructure
Governance
National Gross Domestic Product by Income and by Expenditure Accounts
Employment and inclusive growth
Global partnership
Survey of Labour and Income Dynamics/ Canadian Income Survey
Poverty
Employment and inclusive growth
Vital Statistics - Death Environment
Governance

115
Research teams examined the quality of available data for global targets and indicators under each goal
area against the five main criteria. Essentially, a basket of survey instruments was examined and an
overall score for each goal area was provided. Only key survey instruments that could potentially be used
to monitor progress on a goal area were included in the overall assessment (see Annex 3).132 The scores
presented below represent the totals for each criterion on a scale from 1 to 5. A score of 5 indicates that
data for the goal area meet all criteria sub-components, 3 indicates that the data meet more than half of
the criteria sub-components, while 1 means that no data meet the criteria. The scores 2 and 4 are used to
represent intermediate levels for which sub-component criteria are met by data.
Statistics Canada’s Quality Assurance Framework
The availability of “good data” – a term used to describe data that are relevant, accessible and
demonstrative of quality (Sheikh 2011) – has perhaps not been as much of a concern for Canada in the
recent past as it has been for countries with less advanced statistical systems. As the data produced by
Statistics Canada are often used in assisting government decision making, the agency has taken steps to
ensure the reliability of its data. The Quality Assurance Framework, developed in 2002, is a set of
management tools and mechanisms that Statistics Canada uses to assure the quality it its information, as
well as interpretability, accuracy, timeliness and coherence (Statistics Canada 2002). It includes
provisions for managing relevance, accuracy, timeliness, accessibility, interpretability and coherence,
which correspond to the key measures of quality assurance included in the data quality assessment
framework under the Post-2015 Data Test. Statistics Canada’s Quality Guidelines, published on an
occasional basis, is a set of checklists designed to encourage the pursuit of quality in Statistics Canada’s
work (Statistics Canada 2003; 2009c). The guidelines outline how Statistics Canada defines quality, as
well as the scope and purpose, principles and corresponding guidelines for survey steps and
components.133 In addition, Statistics Canada relies on a number of subject area advisory groups, as well
as the National Statistics Council and the Federal-Provincial-Territorial Consultative Council on Statistical
Policy, to ensure relevance in terms of meeting user information needs (see Statistics Canada 2013a).
Applying the Data Quality Assessment Framework
The research team was required to complete the data quality assessment for the global targets and
indicators. Given the availability of information and the frequent use of survey instruments to measure
progress on both global- and national-level targets and indicators in the Canadian context, scores for
each goal area are presented in Table 12 below first for the global level and then for the national level in
the shaded rows. The research team applied the framework systematically to each survey instrument
identified through the data mapping process. Surveys were assessed against each of the sub-
components for the criteria noted above. If the survey met a sub-component, it was given a score of 1.
These scores were then tabulated and converted to a score out of 5. The survey instruments were then
weighted in accordance with the number of indicators for which they are used in a given goal area, and
an overall score for the goal area was calculated out of 5.
Many resources were used to conduct the data quality assessment (see Annex 5 for a full list).
Overarching policies that guide Statistics Canada’s work, such as the Quality Assurance Framework and
Quality Guidelines, were particularly important. The auditor general of Canada’s recent report on
Statistics Canada(see Office of the Auditor General of Canada 2014) as well as the paper titled “Good
132 Survey instruments were included for cases in which data were not publicly available but exist. 133 For example, the guidelines provide detailed information and guidance on: objectives, uses and users; concepts; aspects of data processing such as editing, imputation and estimation; data quality evaluation; dissemination and disclosure control; as well as the management context (Statistics Canada 2003; 2009c).

116
Data and Intelligent Government” by the former chief statistician of Canada (see Sheikh 2011) were also
used. Table 11 provides an overview of overarching considerations based on the resources used to
conduct the data quality assessment of sources from Statistics Canada. The research team also
consulted documents on individual survey instruments and their data and contacted Statistics Canada
directly to ask for necessary clarifications. Typically, clarifications were related to the accessibility of data,
further information regarding metadata and consultations with data users. For survey instruments of other
government departments and agencies, such as Environment Canada and DFATD, the research team
took a similar approach – documentation on metadata was consulted, data were examined and
responsible departments and agencies were contacted directly when necessary.
Table 11. Overarching considerations in the assessment of Statistics Canada sources
Criterion, component
Sub-component(s) Note
Relevance, user needs Procedures to track user needs and uses of the statistics
While Statistics Canada consults with data users, the agency does not systematically track feedback from users based on the requests for clarifications that it receives. The agency began tracking feedback in 2014 upon recommendation of the auditor general of Canada.
Legislative requirement to consult with the user on data collection
The Statistics Act does not include provisions on consultation. However, Statistics Canada consults with data users on a fairly regular basis and makes use of advisory committees.
Relevance, user satisfaction Regular follow-ups with users to ensure user satisfaction
Periodic consultations with users to obtain feedback
Post-collection evaluations to compare data outcomes with user needs
Statistics Canada collects information regarding user satisfaction, though the auditor general of Canada notes that greater efforts are needed to obtain feedback beyond those of the federal government.
Accuracy and clarity, sampling and non-sampling errors
Compilation of user feedback to assess the relevance of the statistical study for user purposes
While feedback is noted, it is not collected in a systematic way with reports that are made publicly available. Statistics Canada began regularly compiling feedback beginning in 2014 upon recommendation of the auditor general of Canada.
Accessibility and clarity, clarity
Staff training and development programmes for writing about statistics
Figures on staff training are not reported in Statistics Canada’s departmental performance reports or information provided on specific areas of work. Nevertheless, the Quality Assurance Framework includes a section on training and the Quality Guidelines similarly note its importance.
Limitations to Data Quality Assessment
A number of limitations exist with respect to the data quality assessment. The research team relied on
publicly available information as well as information requested from Statistics Canada. It is possible that
additional resources are available internally at Statistics Canada, such as more recent data dictionaries
and methodology guides, which may have impacted scores. Further, in some instances, particularly for
data sources produced by other government departments and agencies, information was unavailable. To
address this issue, some survey instruments were scored against a smaller set of sub-components.134
The data quality assessment framework has its own limitations. Sub-components within the framework
are weighted equally, though their relative importance within and across criteria could be debated. In
addition, some of the sub-components are framed in such a way that survey instruments were
automatically scored 0. For example, under relevance, one sub-component is “legislative requirement to
134Specifically, the survey instruments in question covered data on representation in Parliament from the Library of Parliament, Environment Canada’s climate financing data and aid data from DFATD.

117
consult with the user on data collection.” While room for improvement exists with respect to Statistics
Canada’s user consultations (see Office of the Auditor General of Canada 2014), there is no question that
the agency consults with data users through various mechanisms on a fairly regular basis. However, the
Statistics Act does not enshrine a responsibility for Statistics Canada to consult with data users in
legislation. Furthermore, since the framework provides an overall score for each goal area based on the
basket of survey instruments it contains and the scoring criteria state that all sub-components must be
met for a score of 5 to be given, if one survey instrument meets all but one sub-component, the highest
score possible will only be 4.135
Finally, some aspects of the data quality assessment framework are repeated, which means that if a
survey instrument scores poorly on one sub-component, this may occur repeatedly throughout the
framework. For example, consultation with data users is a key component of the framework included in
different ways under various criteria. If no evidence of user consultation exists, this means that a survey
instrument cannot receive a 5 across any of the criteria. At the same time, it should be noted that this
limitation is tempered to a certain extent because the sub-components focus on different aspects of user
consultation, such as existence of advisory committees, procedures to track user needs and consultations
with users on dissemination.
Results of the Data Quality Assessment
Overall, the data quality assessment reveals, perhaps unsurprisingly given the discussion above, that the
quality of official data in Canada is excellent for the most part (see Table 12 for the results). Generally
speaking, more than half of the sub-components across criteria are met for all goal areas. Still, the results
indicate that room for improvement exists across goal areas in terms of relevance, particularly with
respect to ensuring that data correspond with and satisfy users’ needs. This finding is consistent with the
findings of the recent evaluation of Statistics Canada by the auditor general of Canada (Office of the
Auditor General of Canada 2014).
The results also show that, in general, data for goals related to poverty, education, and employment and
inclusive growth are of marginally higher quality than those in other goal areas. It is worth noting that
higher scores correspond to goal areas for which the bulk of sources come from Statistics Canada. In
Table 12, a score of 3 means that at least more than half of the sub-components are met for a given
criterion, while a 5 means that all sub-components are met. A four denotes a situation where the majority
of sub-components are met. A 2 represents instances when less than half of the sub-components are
met.
The quality of data for global targets and indicators related to poverty, employment and inclusive growth,
and education stands out. With the exception of the Pan-Canadian Assessment Program, all sources of
data for these goal areas come from Statistics Canada. Timeliness and punctuality as well as accessibility
and clarity consistently receive a perfect score. Poverty and education receive a score of 5 for coherence
and comparability while employment and inclusive growth receives a 4. In all three goal areas, relevance
as well as accuracy and reliability have very high scores of 4. The main reason for these lower scores is
because Statistics Canada is only beginning to systematically compile user feedback to assess the
relevance of survey instruments for user purposes, as noted above. The remaining goal areas tend to
receive lower scores across the board with few exceptions. The lower scores are largely related to a lack
of evidence demonstrating user consultation across the criteria for relevance, accuracy and reliability, and
135 On the other hand, it is all the more impressive when a 5 is awarded under the scoring methodology because it means that all survey instruments meet all sub-components for a particular goal area.

118
accessibility and clarity. In the goal areas of energy and infrastructure, environment and governance,
coherence and comparability tends to have a score of 4 because of the lack of comparability between
statistics derived from different sources or different reference periods in the cases of a number of survey
instruments. These are not an issue in the case of data for monitoring Canada’s efforts on global
partnership.
Table 12. Results of the data quality assessment
Goal area Relevance Accuracy and reliability
Timeliness and punctuality
Accessibility and clarity
Coherence and comparability
Poverty
Global National
4 4 5 5 5
4 4 5 5 4
Education
Global National
4 4 5 5 4
3 5 5 5 4
Employment and inclusive growth
Global National
3 4 5 5 5
3 4 5 5 4
Energy and infrastructure
Global National
3 4 4 4 4
3 4 5 4 4
Environment and disaster resilience
Global National
4 4 4 4 4
3 4 4 4 3
Governance
Global National
3 4 4 4 4
4 4 5 4 4
Global partnership
Global National
3 3 4 4 5
3 2 3 3 4
Overall, the quality of data for national targets and indicators is good. Where scores differ from the global
targets and indicators, they are only marginally less, typically because an additional survey instrument
used at the national level does not meet some of the sub-components for a particular criterion. The lower
scores for relevance as well as accuracy and reliability for the goal area of global partnership are
explained by the predominance of aid data sources as the key sources for national targets and indicators.
While many efforts have been taken to make aid data easily accessible and the federal government has
held some consultations with data users, the lack of policies and guidelines to regularly follow up with
users, reduce and evaluate errors, assess data sources, and transparently report on data revisions and
the quality of data produced brings down the overall score.

119
Political Economy of the Data Revolution
Understanding the Drivers of Data Gaps and Improvements Data gaps may exist and persist due to a combination of financial,
technical, institutional, capacity and/or political constraints. Recently, two
data gaps – the shortage of information on small communities in Canada
and inadequate information on job vacancies – have created a great
deal of controversy in the media and serve to illustrate the barriers to
addressing data gaps in Canada.
Political and Legal Barriers
There exist numerous political barriers to addressing data gaps in
Canada. Above all, funding to address data gaps is dependent on the
wants and needs of the government of the day. Governments’
willingness to address data gaps depends on political and financial
considerations. Governments may be more or less concerned about the
financial costs of addressing data gaps, the importance of data for
decision-making, and whether the data in question will support or
contradict their policies and priorities.
Political barriers to addressing data gaps are often intertwined with
financial and capacity constraints. The federal government recently
implemented across-the-board budget and job cuts as part of a plan to
balance its budget by 2015–16 (see Canada 2013b). Its current drive to
balance its budget is largely political – the next federal election is in
2015. These cuts have affected Statistics Canada as well as other
government departments and agencies involved in the national statistical
system. As a result, the capacity of Canada’s national statistical system
to address data gaps has deteriorated.
It is important to note that there are legal barriers to addressing some
data gaps related to confidentiality. Under the Statistics Act, all
information provided to Statistics Canada must be kept confidential. As a
result, Statistics Canada does not publish many data, such as output
data, for a subsector with a small number of companies or certain
census data for small communities, to “prevent published statistics from
being used to derive information” about a particular company or
individual (Statistics Canada 2014a).
Changes to Surveys and Data Collection Practices
Good governance requires evidence-based decision-making and such
decision-making requires high-quality data. Though Statistics Canada
has historically enjoyed a reputation as one of the world’s top statistical
agencies, there are numerous examples that show the federal
government’s commitment to the provision of high-quality data has
Section Highlights
Drivers of Data Gaps
Budget cuts
Low government
commitment to good quality
data
Changes to data collection
practices
Insufficient human resources
Data Accessibility
Canada’s adoption of open
government principles has
greatly improved the
availability of officially
produced data
Canada has established the
Open Data Portal, which
makes freely available over
300 electronic official
datasets
A significant amount of
Statistics Canada’s data is
freely available online and
through public use
microdata files
Overall, officially produced
data are easily accessible by
all stakeholders and
available in user-friendly
formats
Accountability
Mechanisms
Canada’s legal framework
provides an appropriate
basis for accountability
Independent research has a
high level of legitimacy
Closing space for advocacy
and dissent may undermine
the ability of CSOs to hold
government to account

120
deteriorated. Changes in data collection practices, including the elimination of numerous surveys –
usually as a result of federal budget cuts – have had an impact on the quality of data in key areas (Globe
and Mail 2014).
The most egregious example was the federal government’s decision to replace the mandatory long-form
census with the voluntary NHS for the reference year 2011. The chief statistician of Canada resigned in
protest to this decision, which was the first time a deputy minister resigned over a policy disagreement
with the federal government (Sharpe, Kessler and Thunert 2014). At the time, the government argued that
citizens should not be coerced to provide personal information under the threat of jail time or fines (the
penalty in Canada for failing to respond) and that data needs should be balanced with concerns for
privacy (Sheikh 2011, 326). Long-form data (which include information on income, education, and labour,
inter alia), it was argued, should be collected on a voluntary basis. For many, the decision was seen as
political, especially given that: (i) the census questions are vetted by the Office of the Privacy
Commissioner of Canada, (ii) Statistics Canada has never had a breach of its census data, (iii) the
number of privacy complaints received by Statistics Canada have been minimal136 and (iv) no Canadian
has ever served jail time for failing to fill out the long-form census.137 Users of census data, including
provincial governments, researchers and analysts expressed concerns regarding the government’s
decision (CBC News 2010a; Veall 2010; Green and Milligan 2010; Dillon 2010).
The NHS was sent to one-third of Canadians – compared to one-fifth for the long-form census – which
increased costs.138 In addition, the overall response rate sunk from 94 per cent to 68 per cent, rendering
the data unusable in one-fourth of communities due to lack of sufficient response (Sharpe, Kessler and
Thunert 2014). This has been seen by many researchers as a major impediment to informed and
evidence-based policymaking (Green and Milligan 2010; Sheikh 2011). While the NHS was similar to the
long-form questionnaire of the 2006 census in terms of content, a number of changes were made to some
questions and sections. For example, the questions used to determine Aboriginal identity were changed
and the questions on unpaid work were not asked in the NHS (Statistics Canada 2013g). These changes
have affected the continuity of the time series, as many of the estimates derived from the long-form
questionnaire of the 2006 census and NHS are inconsistent in terms of methodology and therefore should
not be compared. In addition, switching from a mandatory census to a voluntary sample survey means
that “it is impossible to determine with certainty whether, and to what extent, differences in a variable are
attributable to an actual change or to non-response bias” (Statistics Canada 2013g).
There have also been changes to the methodologies and surveys used by Statistics Canada. For
example, Statistics Canada replaced the SLID – crucial for income and poverty measurement – with the
CIS for the reference year 2012. Another notable change is Statistics Canada’s decision to remove
estimates for value added by industry before 1997 from its CANSIM database because of a change in
methodology.
Further, Statistics Canada’s collection methodologies increasingly rely on computer-assisted interviewing
and electronic data reporting. For example, the Aboriginal Peoples Survey started using computer-
assisted interviewing in 2012 (Statistics Canada 2012a), while Statistics Canada has used computer-
assisted interviewing for the Labour Force Survey since the 1990s (Statistics Canada 2014b). With
136 According to R. Brennan (2011), less than 100 complaints were lodged to Statistics Canada during the 2006 census. However, very few were related to privacy concerns. The Office of the Privacy Commissioner of Canada received only 50 complaints about the census over the 1990–2010 period, two of which related to the 2006 long-form census (CBC News 2010a). 137 According to Sheikh (2011, 327), only 64 Canadians have been “referred to the Public Prosecution Service of Canada in a population of over 31 million. Nobody was ever sent to jail for not completing the census questionnaire.” 138 In fact, $30 million of supplementary funding was allocated to cover the costs associated with increased questionnaire production and mailing for both the census and NHS, $22 million of which was spent.

121
respect to electronic data reporting, all Canadian households have been given the option of completing
their census questionnaire online since the reference year 2006 (Statistics Canada 2012b). This has led
to cost reductions and improvements in data quality.
Aside from being able to provide more detailed information on different aspects of the population,
censuses have continued to show technical improvements in terms of methodology and data collection
practices (Kalbach 2006). Smaller improvements have been made – and continue to be made – to
surveys and other products regularly, such as the updating and revision of population estimates used in
Labour Force Survey estimates (Statistics Canada 2011), and new instruments are being developed,
such as the Crime Severity Index that enables users to monitor changes in the severity of police-reported
crime from year to year (Statistics Canada 2009b). As well, Statistics Canada has been taking measures
to obtain more data on local areas and small communities to include in key surveys that currently publish
provincial- and national-level data, such as the Survey of Employment, Payrolls and Hours (Office of the
Auditor General of Canada 2014).
Resources
In Canada, statistics are a federal responsibility and Statistics Canada produces statistics for the federal
government as well as all of the provinces. Since Statistics Canada is a federal government agency, its
core funding and activities, including types of data collected, are determined by the federal government.
Federal funding for Statistics Canada is not always stable, which reflects shifting demands from the
federal government and other data users and has implications for data availability. Shifting demands from
the federal government have led to old surveys being eliminated and new surveys being frequently
commissioned. This process can both enlarge and shrink data gaps, making it difficult to generalise about
the implications for data availability. For example, the decision to switch from the long-form census to the
NHS created certain data gaps, while two recently announced surveys – the $8 million job-vacancy
survey and $6 million wage survey – will likely reduce other data gaps (Curry 2014c). Overall, Statistics
Canada’s elimination of various surveys has caused increasing concern among data users, especially for
data used in policymaking and planning (Ditchburn 2013).
It is important to mention that a significant amount of data from completed surveys remains unpublished
due to funding limitations. A notable example is the delays in data reporting that ensued following a
workplace survey conducted in 2012 by Statistics Canada for Employment and Social Development
Canada. The $4.6 million survey was intended to provide more detailed information on skills shortages in
Canada, but the obtained data were unable to be analysed or reported because funding ran out prior to
the completion of the survey process (Ditchburn 2013). The quality of information produced on the labour
market, residential housing and demographic characteristics has been questioned as budget cuts
continue, suggesting that the future of evidence-based policy making, as Bednar and Stabile (2012) note,
is becoming increasingly uncertain.
Recent budget cuts have affected government departments and agencies involved in Canada’s national
statistical system. Statistics Canada in particular has been subjected to severe budget and job cuts (see
Figure 1). The agency lost 25.6 percent of its workforce (as measured by full-time equivalents) between
2011–12 and 2012–13 and the level of employment at Statistics Canada in 2012–13 was 20 per cent
below that in 2000–01. Some of the decline in the workforce between 2011–12 and 2012–13 can be
attributed to the fluctuations that occur due to the entire census process, in this case that for the 2011
census. However, the percentage drop in employment in 2012–13 was considerably larger than the
declines following the previous censuses in 2002–03 and 2007–08, which saw percentage drops of10.3
percent and 6.8 percent, respectively.

122
Figure 1. Index of actual spending and full-time equivalents employment, 2000–01 to 2012–13 (2000–01 = 100)
Source: Statistics Canada, Departmental Performance Reports, prepared by authors.
Other departments and agencies that produce administrative data which have been affected include
Natural Resources Canada, Health Canada, Industry Canada, Employment and Social Development
Canada, Environment Canada, Finance Canada, the Canada Revenue Agency and the Canada
Mortgage and Housing Corporation.139 All of these departments and agencies play important roles in the
collection, processing, compilation and/or production of data. Though cuts to programme spending and
personnel do not necessarily lead to a reduction in the quantity and/or quality of programmes, it is unlikely
that the recent budget and job cuts have had no impact on the robustness of Canada’s national statistical
system.
Data Availability–Transparency–Accountability Nexus The elimination of data gaps alone will not to lead to the policy changes and progress required to realise
the post-2015 agenda. Data need to be accessible and transparent for citizens to monitor progress and
hold government to account. The state of data availability, accessibility and transparency and possibilities
for holding governments to account in Canada are reviewed below.
Availability and Accessibility of Officially Produced Data
The spread of personal computers, internet access and now smartphones and tablets has made data
accessible to the vast majority of Canadians. While data were in the past only available in hard copy and
at selected locations, much information is now published electronically and available to anyone with an
internet connection. The decision of data providers such as Statistics Canada to publish data on their
websites through online databases like the agency’s CANSIM and Census Profile databases has also
been an important driver of data accessibility. As mentioned, the federal government recently launched
the Open Government Portal140 as part of Canada’s Action Plan on Open Government. The online portal
provides access to thousands of government datasets on a wide range of subjects. There has also been
a move toward providing online access to official data free of charge. Statistics Canada made access to
139 For example, Employment in Social Development Canada’s spending on learning and labour market information – an expenditure category that includes the collection and analysis of labour market data – decreased from $84.9 million in 2011–12 to $66.9 million in 2013–14 (Curry 2014b). 140 For more information, see http://open.canada.ca/en.
60
80
100
120
140
160
180
2000-01 2002-03 2004-05 2006-07 2008-09 2010-11 2012-13
Ind
ex,
20
00
-01
= 1
00
Actual Spending
Full-time Equivalents

123
CANSIM free in February 2012.141 Generally speaking, providing online access to officially produced data
for free has become common practice in Canada and most other countries.
Prior to the implementation of the Open Licence Agreement in 2012, Statistics Canada charged a fee for
accessing its data through CANSIM (Statistics Canada 2014e). PUMFs, microdata files created by
Statistics Canada, were only easily accessible to Canadian post-secondary institutions as a part of the
Data Liberation Initiative between these institutions and the agency prior to 2011 (Séguin and Pagnotta
2011). With the objective of providing freely available data to the public, Statistics Canada decided to
undergo its own open data revolution and adopted a set of “open data principles” (see Statistics Canada
2014e) that led to the removal of fees and licensing agreements from the agency’s standard data
products in 2012. Since then, visits to the CANSIM database have increased substantially and the agency
has become one of the largest contributors of information to the federal government’s Open Data Portal
(Statistics Canada 2014e). Most of the data produced by Statistics Canada are available online through
the agency’s website and platforms such as CANSIM. These platforms have greatly improved public
access to nationally produced data in Canada. However, as noted above, a significant amount of data
from completed surveys remains unpublished due to a lack in funding (see also Bradshaw and Grant
2014).
With respect to data accessibility, it is important to differentiate between raw data and processed data.
Raw data are the primary data collected from a source, including administrative records, completed
sample survey questionnaires and completed census questionnaires. Raw data are compiled and
manipulated to create processed data. Processed data are what Statistics Canada publishes online
through platforms such as CANSIM. Consistent with the confidentiality provisions of the Statistics Act, the
agency will not release raw data if that information could identify individuals, households or companies
without their consent (Statistics Canada 2014a). Instead, it will manipulate raw data to protect the
identities of individual survey respondents such that the relevant information can be made publically
available.
There are two ways to access raw sample survey data or “microdata”. First and foremost, Statistics
Canada creates PUMFs for many of its sample surveys. PUMFs provide a subset of raw sample survey
data for which any information that could identify respondents is removed (Statistics Canada 2014h). For
example, a PUMF containing “limited information on each respondent involving suppressed data, levels of
geography restricted to the province and health region and broad variable coding” is created for each
round of the Canadian Community Health Survey (Statistics Canada 2014h). PUMFs are also available
for censuses. CD-ROMs containing PUMF data, which are of particular importance to researchers, can be
ordered free of charge from Statistics Canada.
Second, Statistics Canada has allowed government-authorised researchers to access confidential
microdata from Research Data Centres since 1998. Research Data Centres, a result of previous efforts to
increase data availability, were established by Statistics Canada in partnership with the Social Sciences
and Humanities Research Council. They are staffed by Statistics Canada employees and located across
Canada in secure university settings, so researchers “do not need to travel to Ottawa to access Statistics
Canada microdata” (Statistics Canada 2014h). Essentially, these data centres were created with the
intention of providing researchers with access to survey data and confidential microdata, which are much
more detailed than PUMFs and processed data and required for many research projects (Statistics
Canada 2014c). Individuals can also order (at a cost) customised data products for any sample survey or
141 Statistics Canada was very slow in adopting this practice. Many other national statistical offices, such as US statistical bureaus and services, have provided data free of charge for a long time.

124
census from Statistics Canada. These data products provide processed data with a breakdown or level of
detail that is not available online. For example, one could order labour force estimates from the Labour
Force Survey by detailed subsector or occupation.
Statistics Canada also publishes reference materials for its data to maximise transparency in terms of the
quality of data and methodologies used. For example, Statistics Canada released response rates and a
user guide, among other things, for the NHS and 2011 census. In addition, the agency publishes data-
quality indicators, which rate data in terms of reliability on a scale from A to F, alongside much of CANSIM
data to ensure that the public is aware of their trustworthiness.
The agency has also taken efforts to improve communication with data users. In 2012, it launched a
number of communication initiatives in order to provide stakeholders and survey respondents with more
information on survey data use as well as opportunities to express their opinions about their information
needs (Statistics Canada 2014j). Actions taken as a result of these initiatives include the creation of new
sections on the Statistics Canada website, publication of a monthly newsletter dedicated to small
business concerning the latest releases of data on the economy and society, and introduction of a crowd-
sourcing initiative that increases the visibility of the agency’s website through the use of social media.
Relative to the vast majority of other countries, the state of data availability, accessibility and
transparency in Canada is excellent. Statistics Canada produces data on virtually all aspects of Canadian
life, the public has easy access to most of the non-confidential data produced by the agency and the
agency is transparent in terms of the methodologies that it uses as well as the quality of data that it
produces. However, as mentioned, the availability of data is ultimately determined by the funder of
Statistics Canada’s activities – the federal government. The creation and elimination of sample surveys
depend on the needs of other government departments and agencies as well as the financial and political
landscape in the country. These needs and this landscape can be barriers to addressing data gaps and
improving data availability in Canada.
Completing the Data Availability–Transparency–Accountability Loop
As noted in the section on the goal area for governance, Canada’s legal framework provides the
necessary protections that enable citizens to hold government to account. Notwithstanding the closing
space for advocacy and dissent recently, CSOs, academics, the media and citizens can and do use
officially produced data, as well as other government information, to hold government to account. The
media play a crucial role in this regard and regularly report on government actions by making use of
official and unofficial data. Independent research has a high level of legitimacy in Canada, which means
that governments and the media take credible research findings seriously. When asked, interviewees
from government noted that independent research, including unofficial data, plays an important role in
informing decision-making processes. Similarly, CSOs and academics have noted that, while they may
not always appreciate their findings, governments are generally responsive to independent research. Still,
the closing space for advocacy and dissent in Canada is worrisome from the perspective of a functioning
data availability–transparency–accountability system.

125
Conclusion
The conversation on the post-2015 agenda is evidently at a nascent
stage in Canada. Aside from government departments and agencies
directly engaged in international discussions, domestic stakeholders
across sectors are not overly engaged in the post-2015 process. There is
no question that researchers faced a significant challenge to engaging
stakeholders in the Canadian context given the lack of knowledge
possessed by stakeholders regarding the post-2015 agenda and the
related aims of the data revolution. As pointed out in the May Post-2015
Data Test In-Progress Note for Canada, “it can be difficult for domestic
stakeholders to see and understand the relevance of the post-2015
sustainable development agenda for Canada – it is seen as more of a
‘developing country’ agenda” (Kindornay 2014c).Researchers found a
lack of awareness about the post-2015 agenda across FPT government
departments and agencies as well as with respect to CSOs working on
domestic issues in Canada, which suggests that the SDGs are not yet
playing a significant role in organisational planning. This is unsurprising
given the novelty of the SDG framework.
Nevertheless, a rich history of work on issues related to sustainable
development exists in Canada, including efforts by various levels of
government and non-governmental stakeholders to address issues
related to the SDGs. Most of Canada’s provinces and territories have
developed poverty reduction strategy plans (see Box 4 and Box 17). A
number of provincial and regional initiatives on improving energy
efficiency and addressing key aspects of climate change also exist.
Finally, CMEC has a history of work in the area of sustainable
development education. These efforts, inter alia, can play a valuable role
in informing Canada’s national SDG roadmap.
Box 17. Establishing Canada’s SDG roadmap: Building on
provincial and territorial poverty reduction strategies
Canada’s provinces and territories are implementing poverty reduction
strategies to improve economic and social well-being and taking a multi-
dimensional view of poverty that addresses issues such as housing,
employment, inclusivity, infrastructure, health and education. Provinces
and territories took broad participatory approaches to preparing their
strategies, engaging across government, civil society and the private
sector. In the case of Manitoba, for example, the provincial government
took measures to ensure that vulnerable populations could participate by
holding meetings in the evening and providing free public transportation
and food. As the federal government moves forward on the SDGs,
experiences from provincial and territorial poverty reduction strategies
offer insights into the potential content of Canada’s SDG roadmap, as
well as how it might be established in an inclusive way.
Key Findings
Most Canadian
stakeholders have little to
no knowledge of the post-
2015 agenda.
Nevertheless, efforts to
address sustainable
development concerns in
Canada are established
and ongoing for many
candidate goal areas.

126
Through an examination of Canada’s national priorities for candidate
SDGs in seven areas – poverty, education, employment and
infrastructure, environmental sustainability and disaster resilience,
governance and global partnership for sustainable development – this
case study finds that the candidate SDGs resonate in the Canadian
context and broadly correspond with national sustainable development
challenges.
The examination of national priorities across the seven goal areas
revealed that issues related to the social, economic and environmental
well-being of Canada’s Aboriginal peoples are prevalent. Targets related
to Aboriginal well-being include reducing poverty among Aboriginal identity
peoples, increasing employment, ensuring secondary school completion,
increasing access to clean and affordable energy, improving infrastructure
in remote communities, integrating biodiversity, ecosystem services and
benefit sharing into planning and policy formulation, and implementing the
UN Declaration on the Rights of Indigenous Peoples in Canada.
Dimensions related to gender equality also emerge across goal areas,
including addressing the wage gap in Canada, improving access to
affordable child care, improving women’s political participation and
addressing violence against women.
A number of global minimum standards were examined in this study, such
as ending extreme poverty as measured by the proportion of the population
living on less than US$1.25 (PPP) per day and ensuring that all newborns
are registered with civil authorities. For the most part, global minimum
standards are not particularly relevant for Canada’s domestic priorities,
though some, such as ensuring universal access to infrastructure, may be
relevant, particularly in Canada’s North.
Canada is well placed to measure progress against many of the candidate
goals and targets. It has an excellent, relatively autonomous statistical
system, with data available or data that could be made easily available for
78 per cent of the 133 indicators examined in the study. Data are available
or can be made easily available for 78 percent of the 45 global-level
indicators examined as well 78 percent of the 88 national-level indicators
examined. Where data gaps exist, they are most prevalent in the areas of
governance, the environment, and energy and infrastructure.
Though challenges exist, unofficial data are not necessarily needed to fill
gaps in measuring progress on post-2015 agenda in Canada. With
appropriate resources, Statistics Canada and other agencies and
departments could address data gaps. The use of unofficial data sources
may present more of a risk than an opportunity given that unofficial
sources do not necessarily follow the same level of rigor or transparency
in as Statistics Canada.
Key Findings
The proposed SDGs are
relevant for Canada.
Addressing the well-
being of Aboriginal
peoples is prevalent
across SDGs. Issues
related to gender equality
are also cross-cutting.
Global minimum
standards are not
particularly relevant for
Canada’s national
priorities.
Data are available for 78
per cent of the 133
indicators examined in
this study.
With the appropriate
resources, Statistics
Canada and other
government agencies and
departments have the
capacity to address data
gaps.

127
For the targets and indicators examined in this study, data on goals
related to poverty, education and employment are excellent and very
good for all other candidate goal areas. Nevertheless, there is room to
improve the relevance of data produced through greater consultations
with users by data providers.
Unsurprisingly, given its raison d’être, sources of data from Statistics
Canada identified through the data mapping process typically do better in
the data quality assessment than data from other government
departments and agencies. Official data providers outside Statistics
Canada, notably DFATD and Environment Canada, tend to have gaps in
terms of the availability and presentation of metadata, consultation with
users and reporting on data reliability.
While Canada has an excellent statistical system, a number of
challenges exist. In the recent past, the federal government has not
demonstrated a commitment to ensuring the availability of good data, as
shown by cuts to Statistics Canada’s human and financial resources and
the controversial decision to terminate the long-form census. The
capacity of Statistics Canada to continue producing high-quality data has
been questioned, particularly in light of changes to some survey
instruments that have jeopardised the continuity and comparability of
important datasets.
There is no question that the level of access to official data is excellent
for all stakeholders in Canada and that users’ capacities to use data are
good. Canada has a free, open and independent media that plays an
important role in holding government to account. At the same time, the
enabling environment for civil society has become more closed in recent
years in Canada as charitable organisations have seen funding cuts and
stricter regulations on the activities that they can undertake, particularly
with respect to advocacy.
Key Findings
Data quality is excellent
for goals related to
poverty, education and
employment and very
good for all other
candidate goal areas.
Lower data quality
correlates with data
sources from other
departments and
agencies while data from
Statistics Canada are of
excellent quality.
While Canada has an
excellent statistical
system, it has seen
deterioration in recent
years.
The enabling
environment for civil
society advocacy has
become increasingly
closed due to funding
cuts and stricter
regulations on the
political activities that
charitable organisations
can undertake.

128
To date, the Canadian government has championed a post-2015
framework that focuses on the poorest and most vulnerable, ensures a
continued emphasis on maternal, newborn and child health, and effectively
promotes job creation and sustainable economic growth. However the
SDGs are meant to serve as a universal set of goals for all countries, not
just developing ones. Canada’s inputs tend to reflect its priorities for
developing countries, rather than its priorities for realising sustainable
development at home. Given the universal nature of the framework, there
is a need to move beyond the development perspective to ensure that
national priorities also inform the global agenda. This will be important for
ensuring that the SDGs are relevant in high-income countries like Canada.
The SDGs, as they are currently articulated, capture gender equality
dimensions of sustainable development with a standalone goal as well as
cross-cutting targets under other candidate goal areas. Canada should
continue to support this approach to integrating gender equality into the
SDGs as a means to ensure due attention is given to addressing
inequalities between men and women both at home and abroad. The
range of goals that capture issues related to the well-being of Aboriginals
suggests scope for a potential “made-in-Canada” goal that specifically
works to spur efforts to realise better outcomes for Canada’s Aboriginal
communities.
The realisation of global minimum standards will require significant
resources. For example, ensuring that no person is living on less than
US$1.25 (PPP) per day will require domestic and international resources to
make progress in many countries. Global minimum standards will likely
play an important role in galvanising international efforts for key
sustainable development challenges. For Canada, they could serve as a
useful guide for future development cooperation priorities.
The lack of engagement by Canadian stakeholders on the SDGs may
indicate that the post-2015 agenda is not that relevant to the Canadian
context. Yet, as this study demonstrates, the SDGs indeed match with
Canada’s sustainable development challenges.
Though Canada has not yet signed onto the universal agenda, it likely will.
Greater consultations on the post-2015 agenda are needed. Such efforts
could inform Canada’s position in the SDG negotiations and increase buy-
in on the resulting framework across different government departments and
agencies as well as levels of government, which should aid in its
implementation. Indeed, implementation of the SDGs in Canada will
require significant efforts on the part of stakeholders already engaged in
the agenda, including the federal government, to work with provinces and
territories, municipalities, CSOs, the private sector and academia on the
Implications for
Canada
The federal government’s
approach to the SDGs
should move beyond a
development-focused
perspective.
Application of the SDGs
in Canada requires
special attention to
Aboriginal issues beyond
what is currently outlined
in the proposed SDGs.
Global minimum
standards may serve as
an important guide for
Canada’s post-2015
international
development cooperation
priorities.
The federal government
should consult more
broadly on the SDGs with
Canadian stakeholders,
including sub-national
governments, the private
sector and civil society.
129
SDGs and their implications for Canada going forward. This will be
important to ensure that the SDGs resonate within Canada and that
universal framework is practical.
A lot of work has already been done by various levels of government and
others, including CSOs and academics, to identify and address key
priorities that could serve as a basis for Canada’s national SDG
roadmap. Drawing on existing policies and strategies from various levels
of government, with input from non-governmental stakeholders such as
civil society, academia and the private sector, could enable the creation
and adoption of a robust SDG agenda in Canada.
However, the importance of consensus between stakeholders cannot be
overstated. A key challenge will be bringing these efforts together in a
national plan that balances different perspectives on national priorities
and the means by which to realise progress. Developing national
priorities for areas such as the environment, energy and infrastructure,
and employment and inclusive growth could prove to be quite contentious
given the variety of approaches and perspectives that exist on these
issues across Canada. The federal government will need to negotiate a
set of national priorities that balances the perspectives of various levels
of government and creates space for provinces and municipalities to
build on existing efforts. Given that FPT government share jurisdiction
over many candidate goal areas are of shared jurisdiction between the
FPT governments, consensus will need to be built.
The SDGs also present a potential opportunity to contribute to domestic
change drivers for sustainable development. As demonstrated by
Canadian women’s groups engaging on the post-2015 agenda, the SDGs
serve as an opportunity to connect domestic and global constituencies on
issues related to sustainable development, affording greater opportunities
for shared actions and lesson learning (Box 18).
Box 18. Engagement by Canadian women’s groups on sustainable
development: Linking the domestic and the global
The Alliance for Women’s Rights is a coalition of over 100 domestic and
international women’s organisations and allies from across Canada. The
coalition aims to raise awareness about women’s rights in the lead-up to
Canada’s next federal election in 2015 and has called on all political
parties to agree to a nationally broadcast leaders’ debate on issues
identified by women. The campaign – Up for Debate – calls on all parties
to take a comprehensive and well-resourced approach to addressing
violence against women, addressing growing economic inequality and
income gaps, including those between women, and supporting women’s
leadership (Alliance for Women’s Rights 2014). Importantly, the coalition
has called for actions both at home and abroad, including greater
Canadian leadership on women’s rights issues internationally.
Implications for
Canada
Ongoing efforts on
sustainable development
in Canada provide a
roadmap for SDG
implementation.
SDG implementation has
the potential to harness
and build off of existing
plans and coordination
mechanisms across
jurisdictions.
The SDGs could play an
important role in
supporting domestic
drivers of change for
sustainable development.
The SDGs serve as an
opportunity to link
domestic and global
constituencies on a
shared agenda for action
at home and abroad.

130
While DFATD will likely play a key role in reporting on Canada’s
implementation of the SDGs to the UN, Statistics Canada will have a
central role to play in the collection and coordination of data for monitoring
progress. This is unsurprising given the highly centralised nature of
Canada’s statistical system. A significant proportion of the data needed to
monitor the SDGs is collected by Statistics Canada, particularly in the
areas of poverty, education, employment, and governance. While
Statistics Canada also collects data on the environment, energy and
infrastructure, and global partnership, other agencies and departments will
also play a significant role in data collection for these goal areas.
Most indicators for measuring progress on post-2015 can be made readily
available relatively easily, but additional efforts will be needed to collect,
calculate and report on the SDGs, particularly in the areas where data
gaps are greatest.
There is room to improve data providers’ consultation with data users.
Statistics Canada is already taking a number of steps to this effect. There
is significant room to improve the data quality of other departments that
provide data. The adoption of Statistics Canada’s policies and procedures
related to the preparation and presentation of metadata, including
reporting on quality of data sources, errors and revisions, would greatly
improve the quality of data on the environment, energy and infrastructure,
governance and global partnership, goal areas that have a paucity of data.
Efforts are needed to preserve the excellence of Canada’s statistical
system. Statistics Canada needs to be provided with the necessary
financial and human resources to improve on and continue to provide
good quality data to inform decision making. This also follows for FPT
departments, agencies and ministries that play an important role in official
data collection. This is especially important given the heightened role that
Statistics Canada and other government departments and agencies will
play in supporting monitoring and reporting on the SDG framework.
There is a need to establish an inclusive and participatory environment
that enables stakeholders to effectively engage on the post-2015 agenda,
including with respect to identifying national priorities and holding
government to account for progress. As Canada embarks on SDG
implementation, consultation with domestic stakeholders should be an
important part of the process by which national priorities are identified and
realised, as was the case in provincial efforts to develop poverty reduction
strategies (Box 17). Efforts are also needed to support an effective
enabling environment for CSOs to provide input on the agenda, carry out
independent research and advocacy efforts related to the SDGs and play
a critical role in holding government to account.
Implications for
Canada
Statistics Canada will
have a central role to play
in the collection and
coordination of data for
monitoring progress on
the SDGs.
Efforts will be needed to
improve data availability
for goals relating to
governance,
environment, energy and
infrastructure.
Efforts are needed to
improve the quality of
data collected by
departments, agencies
and ministries across
Canada. Adoption of
Statistics Canada data
quality standards across
departments and
agencies would greatly
improve this.
Statistics Canada should
be provided the
necessary financial and
human resources to
improve on and continue
providing good quality
data.

131
This study found that the proposed SDG framework covers Canadian
sustainable development challenges. However, targets and
corresponding indicators may need to be adjusted to ensure relevance in
high-income countries. A key question for the SDG framework is how the
architecture can allow country differentiation under a universal set of
SDGs.
While the SDG framework may resonate in high-income countries, a key
challenge will be getting domestic stakeholders engaged. High-income
countries do not have the experience of the MDGs to build on, so
domestic stakeholders have little experience with global sustainable
development frameworks.
The Canada case study reveals a need to move the domestic
conversation beyond the federal government. Ensuring that the universal
framework resonates across countries with different levels of
development requires input from countries based on their domestic
experience. Furthermore, lack of engagement on the SDGs may
represent a potential missed opportunity for domestic constituencies to
spur action on sustainable development by using the SDGs to support
existing related activities. Finally, the SDGs may also serve as an
opportunity to connect domestic and global constituencies on issues
related to sustainable development, affording greater opportunities for
shared actions and lesson learning.
It is clear that many plans that address key elements of the post-2015
agenda exist across different levels of government. As countries move
toward national implementation of the SDG framework, the SDGs should
leverage existing plans and initiatives and build on past successes.
Ensuring that the SDG framework allows country differentiation will be
important in this context.
The Canada case study reveals that global minimum standards may not
be particularly relevant for high-income countries. However, they will
likely play a critical role in galvanising efforts to address key global
challenges such as reducing extreme poverty globally and ensuring that
all children under five years of age are registered with civil authorities.
Global minimum standards could also serve as a roadmap for
international development cooperation and activities carried out under the
global partnership for sustainable development.
Historically, commitments related to global partnership have been
measured at the global level (Box 19). Moving forward, post-2015
presents an opportunity for measuring commitments to global partnership
at the country level, as the Canada case study reveals. Such an
approach could strengthen global monitoring and accountability by
tracking countries’ individual contributions.
Implications for
the SDG
Framework
A universal set of SDGs
that allows differentiation
can work across
countries with different
levels of development
and priorities.
A key challenge will be
getting domestic
stakeholders engaged.
SDG implementation
should support and
enhance existing
sustainable development
activities.
Global minimum
standards are not
particularly relevant for
high-income countries,
but may serve as a
valuable guide for future
international cooperation
efforts.

132
Box 19. Measuring global partnership post-2015
Under the MDGs, reporting on global partnership occurs largely at the
global level with the exception of commitments related to ODA (MDG Gap
Task Force 2014). Commitments related to trade policy are typically
discussed in terms of multilateral trade negotiations, overall preferential
access and key tariff and non-tariff barriers to trade. Debt is examined
from the perspective of developing countries, rather than from the
perspective of individual debtors, while progress on access to affordable
medicines is largely presented as a global narrative. With respect to
technology transfer, indicators show trends in access to information and
communications technology.
While these measures are important for providing a global narrative of
progress, they have very little to say about individual countries’
contributions to global partnership. All high-income countries bear
responsibility for outcomes of global partnership. However, the lack of
country-by-country reporting creates significant potential for free riding and
does not create incentives for a race to the top.
Under the Post-2015 Data Test initiative, a number of national-level
indicators were developed to measure individual countries’ commitments
to global partnership. While it will still be critical to measure overall global
progress, national-level monitoring is an important complement to global
monitoring that improves accountability for outcomes in the area of global
partnership.
Data challenges for measuring progress on the SDG framework will be
less significant for high-income countries. Countries with robust statistical
systems could support other countries to monitor implementation of the
framework through lesson sharing and targeted capacity building.
Implications for
the SDG
Framework
Contributions to global
partnership can be
measured at the country
level.
High-income countries
could play a critical role
in supporting SDG
monitoring.

133
References AANDC (Aboriginal Affairs and Northern Development
Canada). 2012a. Internal Audit Report: Audit of Environmental and Contaminated Sites Management (South of 60º). Gatineau: AANDC.
———. 2012b. “Measuring Well-Being: The Community Well-Being (CWB) Index.” Accessed July 24, 2014. https://www.aadnc-aandc.gc.ca/eng/1100100016579/1100100016580.
———. 2013. Working Together for First Nation Students: A Proposal for a Bill on First Nation Education. Gatineau: AANDC.
———. 2014. “About AANDC.” Accessed August 8, 2014.https://www.aadnc-aandc.gc.ca/eng/1100100010023/1100100010027.
Advisory Panel on Labour Market Information. 2009. Working Together to Build a Better Labour Market Information System for Canada: Final Report. http://publications.gc.ca/collections/collection_2011/rhdc
c-hrsdc/HS18-24-2009-eng.pdf. AFN (Assembly of First Nations). 2014. Analysis: Bill C33 –
First Nation Control of First Nation Education. Ottawa: AFN. http://www.afn.ca/uploads/files/education/analysis_bill_c33.pdf.
Alberta. 2013. Together We Raise Tomorrow: Alberta’s Poverty Reduction Strategy. Discussion Paper, June. Edmonton: Government of Alberta. http://povertyreduction.alberta.ca/files/documents/ahs-prs-discussionguide-web.pdf.
Alberta Education. 2014. “About International Education.” Accessed July 25, 2014.http://www.education.alberta.ca/students/internationaleducation.aspx.
Alberta Emergency Management Agency. 2012. “Earthquake Response Plan for British Columbia (ERPBC).” Accessed August 11, 2014.http://www.aema.alberta.ca/catastrophic_earthquake_in_british_columbia.cfm.
Alexander, Craig, Derek Burleton, and Francis Fong. 2012. Knocking Down Barriers Faced by New Immigrants to Canada: Fitting the Pieces Together. Toronto: TD Economics.
Allan, Robyn. 2012. “An Economic Assessment of Northern Gateway.” Submitted to the National Energy Board Joint Review Panel. http://www.robynallan.com/wp-content/uploads/2012/02/Economic-Assessment-of-Northern-Gateway-January-31-2012.pdf.
Alliance for Women’s Rights. 2014. “Up for Debate: The Alliance for Women’s Rights.” Campaign platform.http://upfordebate.ca/sites/upfordebate/files/docs/campaign_platform.pdf.
Allison, Dean, chr. 2013. Canada and the Arctic Council: An Agenda for Regional Leadership; Report of the Standing Committee on Foreign Affairs and International Development. Ottawa: House of Commons.
Amnesty International Canada. 2012. Matching International Commitments with National Action: A Human Rights Agenda for Canada. Ottawa: Amnesty International
Canada. Anderson, Ian, Jaimie Boyd, Alexandra Laflamme-Sanders,
Paul Lang, and Mélanie Loisel. Breaking Ground in Nunavut: Assessing Transportation Infrastructure Proposals for Resource Development. Vancouver: Action Canada.
Anderson, Kelly, Jane Hilderman, and Alison Loat. 2013. Lightweights? Political Participation Beyond the Ballot Box. Samara Democracy Report #6.Toronto: Samara.
Anderssen, Erin. 2010. “To End Poverty, Guarantee Everyone in Canada $20,000 a Year. But Are You Willing to Trust the Poor?” Globe and Mail, November 19.
Andrew, Caroline, John Biles, Myer Siemiatycki, and Erin Tolley. 2008. “Introduction.” In Electing a Diverse Canada: The Representation of Immigrants, Minorities, and Women, edited by Caroline Andrew, John Biles, Myer Siemaitycki, and Erin Tolley, 3–22. Vancouver: UBC Press.
Andrews, Brendon. 2012. Sensitivity of the Index of Economic Well-being to Different Measures of
Poverty: LICO vs. LIM. Paper Presented at the CEA Annual Conference, Calgary, June. Ottawa: Centre for the Study of Living Standards.
Armah, NiiAyi. 2013. “Big Data Analysis: The Next Frontier.” Bank of Canada Review (Summer): 32–39.
Austen, Ian, and David Leonhardt. 2014. “Life in Canada, Home of the World’s Most Affluent Middle Class.” New York Times, April 30.
AWCBC (Association of Workers’ Compensation Boards of Canada). 2014. “Key Statistical Measures-KSM Data.” Accessed November 4, 2014.http://awcbc.org/?page_id=14#KSM.
Ballington, Julie, Randi Davis, Mireya Reith, Lincoln Mitchell, Carole Njoki, Alyson Kozma, and Elizabeth Powley. 2011. Empowering Women for Stronger Political Parties: A Good Practices Guide to Promote Women’s Political Participation. New York and Washington: United Nations Development Programme and National Democratic Institute for International Affairs.
Baluja, Tamara. 2011. “Staggering Debt: Lessons for Young and Old.” Globe and Mail, July 25.
Banerjee, Sudeshna Ghosh, Mikul Bhatia, Gabriela Elizondo Azuela, Ivan Jaques, Ashok Sarkar, Elisa Portale, Irina Bushueva, Nicolina Angelou, and Javier GustavoInon. 2013. Global Tracking Framework. Vol. 3.Sustainable Energy for All. Washington, DC: World Bank.
Beaty, Ross, Richard Lipsey, and Stewart Elgie. 2014. “The Shocking Truth About B.C.’s Carbon Tax: It Works.” Globe and Mail, July 9.
BBOP (Business and Biodiversity Offsets Programme). 2013. To No Net Loss and Beyond: An Overview of the Business and Biodiversity Offsets Programme (BBOP). Washington, DC: Forest Trends.
Beauvais, David, Alexandre Prieur, and François Bouffard. 2012. Smart Grid to Balance Renewable Energies: Contributing Distributed Energy Resources. Ottawa: Natural Resources Canada.
Bednar, Vass, and Mark Stabile. 2012. “Statistics Canada Cuts Compromise the Tools Used to Understand the State.” Toronto Star, July 10.
Bernasconi-Osterwalder, Nathalie, Aaron Cosbey, Lise Johnson, Damon Vis-Dunbar. 2012. Investment Treaties and Why They Matter to Sustainable Development: Questions and Answers. IISD, Winnipeg: International Institute for Sustainable Development.
Bhattacharya, Debapriya, Kate Higgins, and Shannon Kindornay. 2014. Methodology and Implementation Guide.Post-2015 Data Test. Dhaka and Ottawa: Centre for Policy Dialogue, The North-South Institute, and

134
Southern Voice on Post-MDG International Development Goals.
Bhushan, Aniket. 2012. “Recent Trends in Foreign Aid: Canada.” Blog, Canadian International Development Platform, April 12. http://cidpnsi.ca/blog/recent-trends-in-foreign-aid-canada.
———. 2013a. Beyond Aid: Trade, Investment, and Remittances between Canada and Developing Countries. Ottawa: The North-South Institute.
———.2013b. “Foreign Aid and Crises.” Blog, Canadian International Development Platform, April 4. http://cidpnsi.ca/blog/foreign-aid-and-crises.
———. 2014a. Leveraging Open Data to Analyze Canada’s Development Expenditure. Ottawa: The North-South Institute.
———. 2014b. The Muskoka Initiative and Global Health Financing. Ottawa: The North-South Institute.
Bhushan, Aniket, and Kate Higgins. 2011. “Using the New Canadian International Development Platform to Enhance Understanding of Multilateral Development Cooperation.” In Canadian Development Report 2011; Global Challenges: Multilateral Solutions, edited by Hany Besada and Shannon Kindornay, 117–43. Ottawa: The North-South Institute.
BIP (Biodiversity Indicators Partnership). 2014. “Coverage of Protected Areas.” Accessed July 10, 2014. http://www.bipindicators.net/pacoverage.
Black, David, and Greg Donaghy. 2010. “Manifestations of Canadian Multilateralism.” Canadian Foreign Policy Journal 16 (2): 1–8.
Black, Jerome H., and Bruce M. Hicks. 2006. “Visible Minorities and Under-Representation: The Views of Candidates. Electoral Insight (December). http://www.elections.ca/res/eim/article_search/article.asp?id=145&lang=e&frmPageSize.
Block, Sheila, and Grace-Edward Galabuzi. 2011. Canada’s Colour Coded Labour Market: The Gap for Racialized Workers. Ottawa and Toronto: Canadian Centre for Policy Alternatives and Wellesley Institute.
Bowers-Krishnan, Nathan, and Aniket Bhushan. 2014. “Foreign Aid: Recovering After Crisis?” Blog, Canadian International Development Platform, April 9. http://cidpnsi.ca/blog/foreign-aid-recovering-after-crisis.
Bradshaw, James, and Tavia Grant. 2014. “Lack of Funds Keeps Statscan Study from Public.” Globe and Mail, April 22.
Brennan, Richard J. 2011. “Conservatives Relied on a Few Complaints to Scrap the Census. Toronto Star, January 7.
Brennan, Shannon. 2011. “Violent Victimization of Aboriginal Women in the Canadian Provinces, 2009.”Juristat (May):1–21.
British Columbia. 2008. Carbon Tax Act. Victoria: Government of British Columbia.
British Columbia Ministry of Finance.2014a. Budget and Fiscal Plan 2014/15 – 2016/17.Victoria: British Columbia Ministry of Finance.
———. 2014b. “Tax Rates on Fuels: Motor Fuel Tax Act and Carbon Tax Act.” Tax Bulletin. Bulletin MFT-CT 005. Victoria: British Columbia Ministry of Finance. http://www.sbr.gov.bc.ca/documents_library/bulletins/mft-ct_005.pdf.
British Columbia Ministry of Transportation and Infrastructure.2012. 2012/13 – 2014/15 Service Plan. Victoria: British Columbia Ministry of Transportation and Infrastructure.
———. 2014a.2012/13 Annual Service Plan Report. Victoria: British Columbia Ministry of Transportation and Infrastructure.
———.2014b. 2014/15 – 2016/17 Service Plan. Victoria: British Columbia Ministry of Transportation and Infrastructure.
Boudreault, Félix-Antoine, James Haga, Ben Paylor, Annie Sabourin, Samira Thomas and Clifton van der Linden. 2013. “Future Tense: Adapting Canadian Education Systems for the 21st Century.” An Actions Canada Taskforce Report. Accessed February 10, 2015.http://www.actioncanada.ca/wp-content/uploads/2014/04/TF2-Report_Future-Tense_EN.pdf.
Broadbent Institute. 2012. Towards a More Equal Canada: A Report on Canada’s Economic and Social Inequality. Ottawa: Broadbent Institute.
Brochu, Pierre, Marie-Anne Deussing, Koffi Houme, and Maria Chuy. 2013.Measuring Up: Canadian Results of the OECD PISA Study. Toronto: Council of Ministers of Education, Canada.
Brown, Stephen, and Michael Olender. 2013. “Canada’s Fraying Commitment to Multilateral Development Cooperation. ”In Multilateral Development Cooperation in a Changing Global Order, edited by Hany Besada and Shannon Kindornay, 158–88. Basingstoke: Palgrave Macmillan.
Bryden, Joan. 2014. “Controversial Fair Elections Act Pushed through Parliament by Conservative Government.” National Post, May 13.
Buckley, Melina. 2010. Moving Forward on Legal Aid: Research on Needs and Innovative Approaches. Ottawa: Canadian Bar Association.
Bülles, Anni-Claudine, and Shannon Kindornay. 2013. Beyond Aid: A Plan for Canada’s International Cooperation. Ottawa: The North-South Institute.
Bull, Joseph W., K. Blake Suttle, Ascelin Gordon, Navinder J. Singh, and E.J. Milner-Gulland. 2013. “Biodiversity Offsets in Theory and Practice.” Oryx 47 (3): 369–80.
Calver, Matthew. Forthcoming. "Closing the Aboriginal Education Gap in Canada: Assessing Progress and Estimating the Economic Benefits.” Ottawa: Centre for the Study of Living Standards.
Campaign 2000. 2012.Needed: A Federal Action Plan to Eradicate Child and Family Poverty in Canada; Campaign 2000 – Report Card 2012.Toronto: Family Service Toronto.
Canada. 1867. Constitution Act, 1867. Accessed August 12, 2014.http://laws-lois.justice.gc.ca/eng/CONST/page-1.html.
———. 2006. Canadian Environmental Sustainability Indicators. Catalogue no. 16-251-XIE. Ottawa: Government of Canada.
———. 2008a. Federal Sustainable Development Act. Accessed August 12, 2014.http://laws-lois.justice.gc.ca/eng/acts/F-8.6/page-1.html.
———.2008b. Official Development Assistance Accountability Act.S.C. 2008, c.17.Ottawa: Government of Canada.
———. 2013a. Canada’s Sixth National Report on Climate Change 2014. Ottawa: Government of Canada.
———. 2013b. Jobs, Growth and Long-Term Prosperity: Economic Action Plan 2013. Ottawa: Government of Canada.
———. 2013c. The New Building Canada Plan: Canada’s Economic Action Plan 2013. Ottawa: Government of Canada.
———. 2014a. Convention on the Rights of Persons with Disabilities: First Report of Canada. Ottawa: Government of Canada.
———. 2014b. The Road to Balance: Creating Jobs and Opportunities. Ottawa: Government of Canada.

135
Canada and United States of America. 2008. Agreement between the Government of Canada and the Government of the United States of America on Emergency Management Cooperation. E105173. Ottawa and Washington, DC: Government of Canada and Government of the United States of America.
Canada Without Poverty. 2013a. “Housing in Canada – Increasingly Unaffordable.” Accessed July 24, 2014.http://www.cwp-csp.ca/2013/01/housing-in-canada-increasingly-unaffordable.
———. 2013b. “Poverty Progress Profiles.” Accessed July 24, 2014.http://www.cwp-csp.ca/poverty/poverty-progress-profiles.
Canadian Commission on Building and Fire Codes. 2010. National Plumbing Code of Canada. Ottawa: National Research Council Canada.
Canadian Council on Learning. 2009. Up to Par: The Challenge of Demonstrating Quality in Canadian Post-secondary Education; Challenges in Canadian Post-secondary Education. Ottawa: Canadian Council on Learning.
Canadian Education Association. 2010. Ontario’s Primary Class Size Reduction Initiative: Report on Early Implementation. Toronto: Canadian Education Association.
Canadian Forum on Civil Justice. 2012. The Cost of Justice: Weighing the Costs of Fair and Effective Resolution to Legal Problems. Toronto: Canadian Forum on Civil Justice.
Canadian Heritage. 2013. “Reports on UN Human Rights Treaties and Other Documents.” Accessed August 6, 2014.http://pch.gc.ca/eng/1357136859881/1357137099645.
Canadian Human Rights Commission. 2012. Report on Equality Rights of People with Disabilities. Ottawa: Canadian Human Rights Commission.
Canadian Index of Wellbeing. 2012. How Are Canadians Really Doing? The 2012 CIW Report. Waterloo: Canadian Index of Wellbeing and University of Waterloo.
Canadian Intergovernmental Conference Secretariat.2011. “Action Plan - Collaborative Approach to Energy.” Accessed August 12, 2014.http://www.scics.gc.ca/english/conferences.asp?a=viewdocument&id=1619.
Canadian Press.2014a. “AFN Leaders Repeat Call for Feds to Drop Aboriginal Education Reforms.” CTV News.ca, July 17.http://www.ctvnews.ca/canada/afn-leaders-repeat-call-for-feds-to-drop-aboriginal-education-reforms-1.1917909.
———. 2014b. “Regulating Oil and Gas a ‘Crazy’ Policy in Times of Cheap Oil, Harper says.” Financial Post, December 9.
Canadian Safe School Network. 2014. “Stu Auty Reviews Results from CAMH Study: School Yard Bullying Down, Cyberbullying Static.” CTV News Channel, July 10. http://canadiansafeschools.com/ 2014/07/stu-auty-reviews-results-from-camh-study-school-yard-bullying-down-cyberbullying-static.
Cantin, Sylvie,Romilly Rogers, and Samantha Burdett. 2008. Indicators of Healthy and Vibrant Communities Roundtable. Ottawa: Canadian Policy Research Networks.
CBA (Canadian Bar Association). 2012. Legal Aid and Access to Justice. Legal and Governmental Affairs, June. http://www.cba.org/cba/epiigram/pdf/legal-aid.pdf.
———. 2013. Reaching Equal Justice: An Invitation to Envision and Act. Ottawa: CBA.
———. 2014. “Legal Aid in Canada.” Accessed August 8, 2014.http://www.cba.org/CBA/Advocacy/legalaid.
CBC News. 2010a. “Illuminating the Enumerating.” CBC News, July 28.http://www.cbc.ca/news/canada/illuminating-the-enumerating-1.904296.
———. 2010b. “Policy Cost Canada UN Seat: Ex-Ambassador.” CBC News, October 13.http://www.cbc.ca/news/politics/policy-cost-canada-un-seat-ex-ambassador-1.964330.
———. 2013. “Aboriginal Corrections Report Finds ‘Systemic Discrimination.’” CBC News, March 7.http://www.cbc.ca/news/politics/aboriginal-corrections-report-finds-systemic-discrimination-1.1338498.
———. 2014. “B.C. Wildfires: 80 Australian Firefighters Headed to Canada.” CBC News, August 9.http://www.cbc.ca/news/canada/british-columbia/b-c-wildfires-80-australian-firefighters-headed-to-canada-1.2732369.
CBD (Convention on Biological Diversity Secretariat). 2010. “COP 10 Decision X/43.” Accessed July 31, 2014.https://www.cbd.int/decision/cop/?id=12309.
———. 2011. “COP 10 Decision X/2.” Accessed July 24, 2014.http://www.cbd.int/decision/cop/?id=12268.
———. 2013. Quick Guides to the Aichi Biodiversity Targets. Montreal: CBD.
CCIC (Canadian Council for International Co-operation) and ICN (Inter-Council Network of Provincial/Regional Councils for International Cooperation). 2012. Putting Partnership Back at the Heart of Development: Canadian Civil Society Experience with CIDA’s Call-for-Proposal Mechanism, Partnerships with Canadians Branch; An Analysis of Survey Results. Ottawa: CCIC.
———. 2014. Establishing an Enabling Environment for Civil Society Organizations in Canada: Key Issues Affecting Canadian International Development and Humanitarian Organizations; An Analysis of Survey Results. Ottawa: CCIC.
CCOHS (Canadian Centre for Occupational Health and Safety). 2014. “About CCOHS.” Accessed July 31, 2014.http://www.ccohs.ca/ccohs.html.
Center for Critical Thinking. 2013. “International Critical Thinking Test.” Accessed August 11, 2014.http://www.criticalthinking.org/pages/international-critical-thinking-test/619.
Center for Global Prosperity. 2013. The Index of Global Philanthropy and Remittances 2013; With a Special Report on Emerging Economies. Washington, DC: Hudson Institute.
CGD (Center for Global Development). 2013. Commitment to Development Index 2013: Canada Country Report. Washington, DC: CGD.
———. 2014. “Mapping the Impacts of Climate Change.” Accessed August 12, 2014.http://www.cgdev.org/page/mapping-impacts-climate-change.
Chander, Datuk Ramesh. 2009. “Effective National Statistical Systems: Essential Requirements.”Department of Statistics Malaysia.http://statistics.gov.my/portal/download_journals/files/2009/Volume1/contents_Effective_National_Statistical.pdf.
Chapnick, Adam. 2012. “The Politics of Reforming Canada’s Foreign Aid Policy 305.” In Struggling for Effectiveness: CIDA and Canadian Foreign Aid. Ed. Stephen Brown.McGill-Queen’s University Press, Ottawa.
Cheadle, Bruce. 2014. “Harper under Fire for Rationale behind Stalled Oil and Gas Regulations.” Associated Press, December 11.
———. 2014b. “Robocalls Probe Called Off Over Lack of Evidence. ”Globe and Mail, April 24, 2014.

136
CIDA(Canadian International Development Agency). 2010. Canada’s Contribution to the Global Effort to Reach the Millennium Development Goals. Gatineau: CIDA.
———. 2012. Report to Parliament on the Government of Canada’s Official Development Assistance 2011–2012. Gatineau: CIDA.
CIDP (Canadian International Development Platform). 2014. “Canada’s Development Footprint Beyond Aid: Interactive Data.” Accessed July 27, 2014.http://cidpnsi.ca/blog/portfolio/canadas-development-footprint-beyond-aid-interactive-data.
Citizens for Public Justice. 2009. “A Federal Anti-poverty Act: What’s in an Act?” The Catalyst 32(3): 5.
———. 2013. Poverty Trends Highlights: Canada 2013. Ottawa: Citizens for Public Justice.
CLC (Canadian Labour Congress). 2014. “Underemployment is Canada's Real Labour Market Challenge.” March 6.http://www.canadianlabour.ca/news-room/publications/underemployment-canadas-real-labour-market-challenge.
CMEC (Council of Ministers of Education, Canada). 2008. Learn Canada 2020:Joint Declaration. Toronto: CMEC.
———. 2010. Background – Developing a Pan-Canadian ESD Framework for Collaboration and Action. Education for Sustainable Development Working Group. Toronto: CMEC.
———. 2012. “Ministers of Education Mark a Milestone in Education Cooperation.” Press release, July 6. http://www.cmec.ca/278/Press-Releases/ Ministers-of-Education-Mark-a-Milestone-in-Education-Cooperation.html?id_article=508.
Commissio, Christina. 2013. “Canada Faces a ‘Crisis’ on Aboriginal Reserves: UN Investigator.” CTV News.ca, October 15. http://www.ctvnews.ca/canada/canada-faces-a-crisis-on-aboriginal-reserves-un-investigator-1.1497612.
Commission on the Reform of Ontario’s Public Services. 2012. Public Services for Ontarians: A Path to Sustainability and Excellence. Toronto: Government of Ontario.
Commissioner of the Environment and Sustainable Development. 2013. “2013 Fall Report of the Commissioner of the Environment and Sustainable Development. ”Office of the Auditor General of Canada. Accessed July 24, 2014.http://www.oag-bvg.gc.ca/internet/English/parl_cesd_201311_e_38658.html.
———. 2014. “2014 Fall Report of the Commissioner of the Environment and Sustainable Development. ”Office of the Auditor General of Canada. Accessed December 20, 2014.http://www.oag-bvg.gc.ca/internet/English/parl_cesd_201410_e_39845.html
Conference Board of Canada.2013a. “Income Inequality.”Accessed July 31, 2014.http://www.conferenceboard.ca/hcp/details/society/income-inequality.aspx.
———. 2013b. “Voter Turnout.” Accessed August 8, 2014.http://www.conferenceboard.ca/hcp/details/society/voter-turnout.aspx.
Cool, Julie. 2007. Child Care in Canada: The Federal Role. PRB 04-20E.Ottawa: Parliamentary Information and Research Service.
———. 2010. Women in Parliament. PRB 05-62E. Ottawa: Parliamentary Information and Research Service.
Corak, Miles. 2013. Public Policies for Equality and Social Mobility in Canada. Background paper prepared for the Canada 2020 event“ Equality of Opportunity – a Canadian dream?” Ottawa: Canada 2020.
COSEWIC (Committee on the Status of Endangered Wildlife in Canada). 2002. “About COSEWIC: Brief History.” Accessed August 12, 2014.http://www.cosewic.gc.ca/eng/sct6/sct6_3_e.cfm#hist.
Coté, Denis. 2014. “Canada’s Plans and Priorities for Post-2015.” Presentation, May 29.http://www.slideshare.net/APWG_Denis/canadian-priorities-for-post-2015?qid=c5775f1c-f157-4b27-8893-cbf818f63097&v=qf1&b=&from_search=9.
Cotter, John. 2014. “Environmental Health Risks of Alberta Oil Sands Likely Underestimated: Study.” Globe and Mail, February 3.
Council of Energy Ministers. 2009. On the Road to a Fuel-Efficient Truck: A Guide for Purchasing Aerodynamics for Heavy-Duty Tractors and Trailers. Ottawa: Government of Canada.
Council of the Federation. 2007. A Shared Vision for Energy in Canada. Ottawa: Council of the Federation.
———. 2013. Canadian Energy Strategy: Progress Report to the Council of the Federation. Ottawa: Council of the Federation.
Crawford, Kyle. 2011. “Diversity in the 41st Parliament.” Blog, Samara. Accessed August 5, 2014.http://www2.samaracanada.com/blog/post/Inside-the-41st-Parliament-NDP-now-most-diverse-Liberals-least-diverse.aspx.
CTF (Canadian Teachers’ Federation). 2014. Highlights of CTF Survey on the Quest for Teacher Work-Life Balance. Ottawa: CTF. http://www.ctf-fce.ca/Research-Library/Work-Life-Balance-Survey-DW-CAPTO.pdf.
Curry, Bill. 2014a. “Budget Cuts Blamed for Statscan Data Gaps.” Globe and Mail, May 10.
———. 2014b. “Internal Memo Reveals Ottawa Cut Labour Market Data Spending.” Globe and Mail, June 11.
———. 2014c. “Ottawa to Spend $14-Million on New Labour-Market Surveys.” Globe and Mail, June 12.
Curry, Bill, and Tavia Grant. 2014. “How Kijiji's Data Threw Off Ottawa’s Math on Skills Shortages.” Globe and Mail, March 25.
Demirguc-Kunt, Asli, and Leora Klapper, 2012."Measuring Financial Inclusion: The Global Findex Database."Policy Research Working Paper 6025.Washington, DC: World Bank.
DFATD (Foreign Affairs, Trade and Development Canada). 2012. “Corruption.” Accessed August 8, 2014. http://www.international.gc.ca/crime/corruption.aspx.
———. 2013a. Global Markets Action Plan: The Blueprint for Creating Jobs and Opportunities for Canadians Through Trade. Ottawa: DFATD.
———. 2013b. Report to Parliament on the Government of Canada’s Official Development Assistance 2012-2013. Ottawa: DFATD.
———. 2013c. Statistical Report on International Assistance: Fiscal Year 2012–2013. Ottawa: DFATD.
———. 2014a. “Draft Civil Society Partnership Policy.” Accessed July 27, 2014.http://www.international.gc.ca/development-developpement/cs-policy-politique-sc.aspx?lang=eng.
———. 2014b. “Historical Project Data Set.” Accessed February 15, 2015.http://www.acdi-cida.gc.ca/acdi-cida/acdi-cida.nsf/eng/CAR-1128144934-R9J.
Dignity for All. 2013. “Reducing Income Inequality in Canada: Federal Finance Committee Commences Study.” March 17. http://www.dignityforall.ca/en/reducing-income-inequality-canada-federal-finance-committee-commences-study.

137
Dillon, Lisa. 2010. “The Value of the Long Form Canadian Census for Long Term National and International Research.” Canadian Public Policy 36(3): 389–93.
Directeur général des élections du Québec. 2014. “History of Participation Rates.” Accessed August 8, 2014.http://www.electionsquebec.qc.ca/english/tables/history-of-participation-rates.php.
Dobson, Sarah, and Amin Assadollahi. 2014. Fossil Fuel Subsidies: An Analysis of Federal Financial Support to Canada’s Oil Sector. Calgary: Pembina Institute.
Dewees, Donald N. 2012.What Is Happening to Ontario Electricity Prices? Ottawa: Sustainable Prosperity.
Dewing, Michael, and William R. Young. 2006. Municipalities, the Constitution, and the Canadian Federal System.BP-276E. Ottawa: Parliamentary Information and Research Service.
Ditchburn, Jennifer. 2013.”Statscan Survey to Show Extent of Information Lost with Long-form Census.” Globe and Mail, May 5.
Douglas, Graeme, and Shannon Kindornay. 2013.The Business of Development: Canadian Aid and the Private Sector. Ottawa: The North-South Institute.
Dyer, Simon. 2013. Strengthening Alberta’s Greenhouse Gas Regulations. Briefing Note, April. Calgary: Pembina Institute.
Edmunds, Roger. 2005. Models of Statistical Systems.PARIS21 Document Series #6. Paris: OECD.
Elections Alberta. 2012. “General Elections 1975-2012 (Overall Summary of Ballots Cast and % of Voter Turnout).”Accessed August 6, 2014.http://www.elections.ab.ca/Public%20Website/750.htm.
Elections Canada. 2013. “Voter Turnout at Federal Elections and Referendums.” Accessed February 15, 2015.http://www.elections.ca/content.aspx?dir=turn&document=index&lang=e§ion=ele
———. 2014a “Elections Canada’s Outreach and Information Programs.” Accessed August 8, 2014.http://www.elections.ca/content.aspx?section=med&dir=c23/otr&document=index&lang=e.
———. 2014b. “Elections Canada’s Proposed Amendments to Bill C23.” Accessed August 10, 2014.http://www.elections.ca/content.aspx?section=med&dir=c23/pro&document=index&lang=e.
Elections Prince Edward Island. 2011. Statistics on General Elections from 1966 to 2011. Charlottetown: Elections Prince Edward Island.
Elgie, Stewart, and Jessica McClay. 2013. “BC’s Carbon Tax Shift Is Working Well after Four Years (Attention Ottawa).” Canadian Public Policy 39: S1–S10.
Employment and Social Development Canada. 2014. “Indicators of Well-Being in Canada.” Accessed July 24, 2014.http://www4.hrsdc.gc.ca/[email protected].
Energy and Mines Ministers’ Conference. 2012. Moving Forward on Energy Efficiency in Canada: Achieving Results to 2020 and Beyond. Ottawa: Government of Canada.
———. 2013. Energy Efficiency Update 2013; Energy Efficiency: Taking a Balanced Approach. Ottawa: Government of Canada.
———. 2014. Annex A: Compendium on Energy Technology Innovation in Canada. Ottawa: Government of Canada.
Environment Canada. 1995. Canadian Biodiversity Strategy: Canada’s Response to the Convention on Biological Diversity. Gatineau: Environment Canada.
———. 2012. Operational Framework for Use of Conservation Allowances. Gatineau: Environment Canada.
———. 2013a. “About Fresh Water Quality Monitoring and Surveillance.” Accessed August 14,
2014.http://www.ec.gc.ca/eaudouce-freshwater/default.asp?lang=En&n=50947E1B-1.
———. 2013b. Data Sources and Methods for the Air Quality Indicators. Gatineau: Environment Canada.
———. 2013c. “Definitions and Glossary.” Accessed August 12, 2014. http://www.ec.gc.ca/ges-ghg/default.asp?lang=En&n=B710AE51-1.
———. 2013d. “Hazardous Waste and Recyclable Material.” Accessed August 12, 2014.https://www.ec.gc.ca/gdd-mw/default.asp?lang=En&n=39D0D04A-1.
———. 2013e. “Municipal Solid Waste.” Accessed August 12, 2014. https://www.ec.gc.ca/gdd-mw/default.asp?lang=En&n=EF0FC6A9-1.
———. 2013f. “National Air Pollution Surveillance Program (NAPS).” Accessed August 14, 2014.http://www.ec.gc.ca/rnspa-naps.
———. 2013g. The 2012 Progress Report of the Federal Sustainable Development Strategy. Gatineau: Environment Canada.
———. 2014a. "2012 Air Pollutant Emission Summaries and Historical Emission Trends.” Accessed November 15, 2014.https://www.ec.gc.ca/inrp-npri/default.asp?lang=En&n=F98AFAE7-1.
———. 2014b. Canada’s Emissions Trends. Gatineau: Environment Canada.
———. 2014c. “Canada’s Protected Areas.” Accessed November 16, 2014.https://www.ec.gc.ca/indicateurs-indicators/default.asp?lang=en&n=478A1D3D-1.
———. 2014d. Data Sources and Methods for the Freshwater Quality Indicator. Gatineau: Environment Canada.
———. 2014e. “Freshwater Quality in Canadian Rivers.” Accessed November 16, 2014.https://www.ec.gc.ca/indicateurs-indicators/default.asp?lang=En&n=68DE8F72-1.
———. 2014f. National Inventory Report 1990–2012: Greenhouse Gas Sources and Sinks in Canada. Gatineau: Environment Canada.
Equal Voice. 2014. “Fundamental Facts: Elected Women in Canada by the Numbers.” Accessed August 5, 2014.http://www.equalvoice.ca/assets/file/Fundamental%20Facts%20-%20Elected%20Women%20in%20Canada%20by%20the%20Numbers(3).pdf.
ESSC (European Statistical System Committee). 2011. European Statistics Code of Practice: For the National and Statistical Community Authorities (CoP). Brussels: ESSC.
Expert Group on NQAF. 2012. Guidelines for the Template for a Generic National Quality Assurance Framework (NQAF). New York: United Nations.
FAO (Food and Agriculture Organization of the United Nations). 2012. “FRA 2015: Terms and Definitions.” Forest Resources Assessment Working Paper 180, FAO, Rome.
FCM (Federation of Canadian Municipalities). 2006. Building Prosperity from the Ground Up: Restoring Municipal Fiscal Balance. Ottawa, ON. Accessed February 14, 2015.http://www.fcm.ca/Documents/reports/Building_Prosperity_from_the_Ground_Up_Restoring_Muncipal_Fiscal_Balance_EN.pdf.
———. 2012. Women in Local Government: Getting to 30% by 2026. Ottawa: FCM.
———. 2013. “2013 - Municipal Statistics.” September 15. http://www.fcm.ca/Documents/reports/Women/2013_municipal_statistics_elected_official_gender_EN.pdf.
Federal, Provincial, and Territorial Governments of Canada. 2010. Canadian Biodiversity: Ecosystem Status and

138
Trends 2010. Ottawa: Canadian Councils of Resource Ministers.
Federal-Provincial-Territorial Biodiversity Working Group. 2011. “Draft 2020 Biodiversity Goals and Targets for Canada.” Accessed August 11, 2014. http://www.biodivcanada.ca/default.asp?lang=En&n=00248250-1.
———. 2013. “2020 Biodiversity Goals and Targets for Canada.”[Draft].Accessed August 11, 2014.http://www.biodivcanada.ca/00248250-F01E-4D57-8F45-D3943F6C24A9/Canada_Biodiversity_Targets_Backgrounde.pdf.
Fekete, Jason. 2014. “Budget Will Crack Down On Charities With Links to Terrorists, Organized Crime: Jim Flaherty.” National Post, February 7.
Félio, Guy. 2012. Canadian Infrastructure Report Card: Municipal Roads and Water Systems. Vol.1. Ottawa: Canadian Construction Association, Canadian Public Works Association, Canadian Society for Civil Engineering, and Federation of Canadian Municipalities.
Feltmate, Blair, and Jason Thistlethwaite.2012. Climate Change Adaptation: A Priorities Plan for Canada. Report of the Climate Change Adaptation Project (Canada).Waterloo: University of Waterloo.
Finance Canada. 2012. “Canada’s Contributions to Bilateral and Multilateral Debt Relief Initiatives.” Accessed July 27, 2014.http://www.fin.gc.ca/access/dri-iad-eng.asp.
First Nations’ Emergency Services Society of British Columbia. 2014. Annual Report 2013-2014. Vancouver: First Nations’ Emergency Services Society of British Columbia.
Freedom House. 2014. “Freedom in the World 2014.” Accessed August 11, 2014.http://freedomhouse.org/report/freedom-world/freedom-world-2014?gclid=Cj0KEQjw06GfBRCR9tDI4t6n5_MBEiQAFo6kuC-OYEyFh5TzVObsmK5NG3PPVrAcbBMv9f_oY-6GHyAaAqkI8P8HAQ#.U-lJ3-NdXnj.
Freeman, John G., Matthew King, and William Pickett with Wendy Craig, Frank Elgar, Ian Janssen, and Don Klinger. 2011. The Health of Canada’s Young People: A Mental Health Focus. Ottawa: Public Health Agency of Canada.
G7 (Group of 7). 2014. The Brussels G7 Summit Declaration. June 5.
Gaetz, Stephen, Jesse Donaldson, Tim Richter, and Tanya Gulliver. 2013. The State of Homelessness in Canada 2013. Toronto: Canadian Homelessness Research Network Press.
Galarneau, Diane, and Thao Sohn. 2013. Long-Term Trends in Unionization. Catalogue no. 75-006-X. Ottawa: Statistics Canada.
Gass, Philip, and Dave Sawyer. 2012. IISD Submission to the British Columbia Carbon Tax Review. Winnipeg: International Institute for Sustainable Development.
Gatopoulos, Derek, and Elena Becatoros. 2013. “Greece Unemployment Rate in November Hits Record High, Nearly Third of Population in Poverty.” World Post, February 14.
Globe and Mail. 2014. “It’s a False Economy to Cut Statscan’s Budget.” Globe and Mail, April 22.
Gludovatz, Norman. 2014. Getting the Majority to Vote: Practical Solutions to Re-engage Citizens in Local Elections. Vancouver: Centre for Civic Governance.
Goldmann, Gustave. 2007. “The Canadian Statistical System.” Lecture given at Cornell University, Ithaca, NY, February 22.http://www.vrdc.cornell.edu/info7470/2007/Lecture%20Notes/lecture5a-the-canadian-statistical-system.pdf.
Government of Canada’s Advisory Council for Promoting Women on Boards. 2014. Good for Business: A Plan to Promote the Participation of More Women on Canadian Boards. Gatineau: Status of Women Canada.
Government of Canada.2014. Canada’s Action Plan on Open Government. Treasury Board. Catalogue No. BT22-130/2014E-PDF.Accessed February 15, 2015.http://open.canada.ca/en/content/canadas-action-plan-open-government-2014-16.
Grant, Jennifer, Eli Angen, and Simon Dyer. 2013. Forecasting the Impacts of Oilsands Expansion. Calgary: Pembina Institute.
Greenpeace. 2010. Tar Sands and Boreal Forest.http://www.greenpeace.org/canada/Global/canada/report/2010/4/BorealForest_FS_Footnote_rev_4.pdf.
Green, David A., and Kevin Milligan. 2010. “The Importance of the Long Form Census to Canada.” Canadian Public Policy 36 (3): 383–88.
Guyot, Melissa, Cindy Dickson, Chris Paci, Chris Furgal, and Hing Man Chan. 2006.“Local Observations of Climate Change and Impacts on Traditional Food Security in Two Northern Aboriginal Communities.” International Journal of Circumpolar Health 65 (5): 403–15.
Guelph Wellbeing. 2014. “Guelph Wellbeing.” Accessed July 24, 2014.http://guelphwellbeing.ca.
Hall, Michael, David Lasby, Steven Ayer, and William David Gibbons. 2009. Caring Canadians, Involved Canadians: Highlights from the 2007 Canada Survey of Giving, Volunteering and Participating. Ottawa: Statistics Canada.
Hallegatte, Stephane, Colin Green, Robert J. Nicholls, and Jan Corfee-Morlot. 2013. “Future Flood Losses in Major Coastal Cities.” Nature Climate Change 3: 802–06.
Harper, Stephen. 2014. “Saving Every Woman, Every Child: Within Reach.” Toronto statement, May 30.http://pm.gc.ca/eng/news/2014/05/30/toronto-statement.
Heidrich, Pablo, and Shannon Kindornay with Matthew Blundell. 2013. Economic Relations between Canada and Latin America and the Caribbean. Caracas: Latin American and Caribbean Economic System (SELA).
HLP (High-Level Panel of Eminent Persons on the Post-2015 Development Agenda). 2013. A New Global Partnership: Eradicate Poverty and Transform Economies Through Sustainable Development. New York: United Nations.
Ho, Esther Sui-chu. 2013. Student Learning Assessment. Asia-Pacific Education System Review Series No. 5. Paris: United Nations Educational, Scientific and Cultural Organization.
Horne, Matt, and Kevin Sauve. 2014. The B.C. Carbon Tax: Backgrounder. Calgary: Pembina Institute.
HRSDC (Human Resources and Skills Development Canada). 2013. Federal Disability Reference Guide. Gatineau: HRSDC.
Human Rights Council. 2014. Report of the Special Rapporteur on the Rights of Indigenous Peoples, James Anaya: The Situation of Indigenous Peoples in Canada. A/HRC/27/52/Add.2. New York: United Nations.
Human Rights Watch. 2013. Those Who Take Us Away. Abusive Policing and Failures in Protection of Indigenous Women and Girls in Northern British Columbia, Canada. New York: Human Rights Watch.
Hynes, William, and Simon Scott. 2013. “The Evolution of Official Development Assistance: Achievements, Criticisms and a Way Forward.” OECD Development Co-operation Working Papers No. 12, Organisation for Economic Co-operation and Development, Paris.

139
Ibbitson, John. 2013. “Tories’ New Foreign-Affairs Vision Shifts Focus to ‘Economic Diplomacy.’” Globe and Mail, November 27.
IEA (International Energy Agency). 2012. Energy Technology Perspectives 2012: Pathways to a Clean Energy System. Paris: IEA.
———. 2013. Medium-Term Renewable Energy Market Report 2013: Market Trends and Projections to 2018. Paris: IEA.
———. 2014a. “Glossary: R.” Accessed July 10, 2014.http://www.iea.org/aboutus/glossary/r.
———. 2014b. Oil Market Report. November 14. Paris: IEA. IEAG (Independent Expert Advisory Group on a Data
Revolution for Sustainable Development). A World That Counts: Mobilising the Data Revolution for Sustainable Development. New York: Independent Expert Advisory Group Secretariat.
IHS Cambridge Energy Research Associates. 2014. Oil Sands Economic Benefits: Today and In the Future. Edmonton: IHS Cambridge Energy Research Associates.
IIRC (International Integrated Reporting Council). 2013. The International <IR> Framework. London: IIRC.
ILO (International Labour Organization). 2014. "Definitions." Accessed July 10, 2014.http://laborsta.ilo.org/definition_E.html.
IMF (International Monetary Fund). 2006. Data Quality Assessment Framework. Washington, DC: IMF.
Infrastructure Canada. 2011. “Building Canada - Modern Infrastructure for a Strong Canada.” Accessed August 18, 2014.http://www.infrastructure.gc.ca/prog/doc/booklet-livret01-eng.html.
———. 2014a. Report on Plans and Priorities (RPP), 2014-2015. Ottawa: Infrastructure Canada.
———. 2014b. The Federal Gas Tax Fund: Permanent and Predictable Funding for Municipalities. Ottawa: Infrastructure Canada.
Industry Canada. 2014. “Industry Portfolio.” Accessed August 18, 2014.http://www.ic.gc.ca/eic/site/icgc.nsf/eng/h_00022.html.
Intergovernmental Panel on Climate Change. 2014. Climate Change 2014: Synthesis Report. IPCC Fifth Assessment Report. New York: United Nations.
Inter-Parliamentary Union. 2014. “Women in National Parliaments.” Accessed August 5, 2014.http://www.ipu.org/wmn-e/arc/classif010614.htm.
Isfeld, Gordon. 2014. “With Oil Trading Below US$60, Provinces Brace for Impact of Global Oil Price Shock.” Financial Post, December 12.
John Howard Society of Canada. 1996. Literacy and the Courts: Protecting the Right to Understand. Kingston: John Howard Society of Canada.
Johnson, Holly, and Emily Colpitts. 2013. Fact Sheet: Violence against Women in Canada. Ottawa: Canadian Research Institute for the Advancement of Women.
Johnson, Holly, and Pam Kapoor. 2013.The Case for a National Action Plan on Violence against Women. Ottawa: Canadian Network of Women’s Shelters and Transition Houses.
Justice Canada. 2012. Backgrounder: Federal Victims Strategy and Victims Fund. Ottawa: Department of Justice Canada.
———. 2014. “Legal Aid Program.” Accessed August 8, 2014.http://www.justice.gc.ca/eng/fund-fina/gov-gouv/aid-aide.html.
Kalbach, Warren E. 2006. “Demographic Data Collection.” The Canadian Encyclopedia. Accessed July
10,2014.http://www.thecanadianencyclopedia.ca/en/article/demographic-data-collection/#related-articles.
Keating, Tom. “Past Imperfect, Future Conditional.” Canadian Foreign Policy Journal 16 (2): 9–25.
Kindornay, Shannon. 2014a. “Canada Post-2015: Confronting Our Own Development Challenges.” Canadian Government Executive (20) 4.http://www.canadiangovernmentexecutive.ca/category/item/1529-canada-post-2015-confronting-our-own-development-challenges.html.
———. 2014b.Inception Workshop Report: Canada. Post-2015 Data Test. Ottawa: The North-South Institute.
———. 2014c. Post-2015 Data Test: Canada Case Study in Progress. In-Progress Note No 3.http://www.post2015datatest.com/wp-content/uploads/2014/05/In-Progress-Note-3.pdf.
Kassam, Ashifa, and Adam Vaughan. 2014. “First Major Tar Sands Oil Shipment Arrives in Europe Amid Protests.” Guardian, June 6.
La Salle Institute of Governance. 2003. Background Paper on Access to Justice Indicators in the Asia-Pacific Region. Manila: La Salle Institute of Governance.
Lazarus, Michael, and Peter Erickson. 2013. “Greenhouse Gas Emissions Implications of the Keystone XL Pipeline.” Working Paper 2013-11, Stockholm Environment Institute, Stockholm.
Lee, Marc. 2011. “Fair and Effective Carbon Pricing: Lessons from BC.” Vancouver: Sierra Club BC and Canadian Centre for Policy Alternatives.
Legislative Assembly of Ontario. 2013. Bill 141: An Act to Enact the Infrastructure for Jobs and Prosperity Act, 2013. Toronto: Legislative Assembly of Ontario. http://www.ontla.on.ca/bills/bills-files/40_Parliament/Session2/b141.pdf.
Leonhardt, David, and Kevin Quealy. 2014. “The American Middle Class Is No Longer the World’s Richest.” New York Times, April 22.
Leverkus, Sonja, Chris Schippmann, Lana Lowe, Sam Fuhlendorf, and Robert W. Gray. 2014. “Bison and Fire: Continuing the Tradition.” BC Forest Professional (July–August): 20–22.
Lewis, Jeff, and Carrie Tait. 2014. “Canadian Oil Producers Brace for ‘Price War’ as Oil Hits Five-Year Lows.” Globe and Mail, December 8.
Library and Archives Canada. 2013. “Proactive Disclosure.” Accessed August 7, 2013.http://www.bac-lac.gc.ca/eng/transparency/proactive-disclosure/Pages/proactive-disclosure.aspx.
Macdonald, David. 2014. Outrageous Fortune: Documenting Canada’s Wealth Gap. Ottawa: Canadian Centre for Policy Alternatives.
Manitoba. 2012. All Aboard: Manitoba’s Poverty Reduction and Social Inclusion Strategy. Winnipeg: Government of Manitoba.
Marshall, Katherine. 2011. “Generational change in paid and unpaid work.” Statistics Canada. Catalogue No. 11-008-X. Accessed February 15, 2015. http://www.statcan.gc.ca/pub/11-008-x/2011002/article/11520-eng.pdf.
Mas, Susan. 2013. “Canada to Crack Down on Foreign Corruption, Bribery.” CBC News, February 5. http://www.cbc.ca/news/politics/canada-to-crack-down-on-foreign-corruption-bribery-1.1354500.
Mathyssen, Irene, chr. 2011. Ending Violence against Aboriginal Women and Girls: Empowerment - A New Beginning; Report of the Standing Committee on the Status of Women. Ottawa: House of Commons.
McAskie, Carolyn. 2011. Canada and Multilateralism: Missing in Action. The McLeod Group. Ottawa. Accessed February 15,

140
2015.http://web.net/~group78/pdf/Carolyn%20McAskie%20Canada%20%20Multilateralism%20-%20Missing%20in%20Action.pdf.
McColl, Mary Ann, Mike Schaub, Lauren Sampson, and Kevin Hong. 2010. A Canadians with Disabilities Act? Kingston: Canadian Disability Policy Alliance.
McCue, Duncan. 2013. “B.C. First Nation Sets Fires to Save Bison.” CBC News, June 19. http://www.cbc.ca/news/canada/b-c-first-nation-sets-fires-to-save-bison-1.1405739.
McDiarmid, Margo. 2014. “Stephen Harper Says Oil and Gas Regulations Now Would Be ‘Crazy.’” CBC News, December 9. http://www.cbc.ca/news/politics/stephen-harper-says-oil-and-gas-regulations-now-would-be-crazy-1.2866306.
MDG Gap Task Force. 2014. The State of the Global Partnership for Development. New York: United Nations.
Michalos, A.C., Smale, B., Labonté, R., Muharjarine, N., Scott, K., Moore, K., Swystun, L., Holden, B.,Bernardin, H., Dunning, B., Graham, P., Guhn, M., Gadermann, A.M., Zumbo, B.D., Morgan, A.,Brooker, A.-S., and Hyman, I. 2011. The Canadian Index of Wellbeing. Technical Report 1.0. Waterloo: Canadian Index of Wellbeing and University of Waterloo.
MiHR (Mining Industry Human Resources Council). 2014. “Aboriginal Groups.” Accessed August 5, 2014.http://www.mihr.ca/en/Aboriginal.asp.
Milner, Henry, and J.P. Lewis. 2011. “It’s What Happens on the Front Lines of Civic Education Policy that Matters: Reflections on a Natural Experiment on Youth Turnout in Ontario.” Canadian Political Science Review5 (2): 136–46.
Ministère de l'Éducation, du Loisir et du Sport, Québec. 2014. “Going the Healthy Route at School.” Accessed July 30, 2014. http://www.mels.gouv.qc.ca/en/current-initiatives/going-the-healthy-route-at-school.
Ministère des Finances, Québec. 2012. Budget 2012-2013;Québec and Climate Change: A Greener Environment. Ville de Québec: Gouvernement du Québec.
Ministère duDéveloppement durable, de l’Environnement et de la Lutte contre les changements climatiques, Québec. 2014. “The Carbon Market: The Québec Cap and Trade System for Greenhouse Gas Emissions Allowances.” Accessed December 20, 2014.http://www.mddelcc.gouv.qc.ca/changements/carbone/Systeme-plafonnement-droits-GES-en.htm.
Ministère desRelations internationales et Francophonie, Québec. 2014.“Québec International Development Program.”Accessed July 27, 2014.http://www.mrifce.gouv.qc.ca/en/solidarite-internationale/programmes-de-solidarite/programme-developpement-international.
Mitchell, Terry, and Charis Enns. 2014. “The UN Declaration on the Rights of Indigenous Peoples: Monitoring and Realizing Indigenous Rights in Canada.” Policy Brief No. 39. Waterloo: Centre for International Governance Innovation.
Moore, Kelley, Lenore Swystun, Bill Holden, Heather Bernardin, Beth Dunning, and Paul Graham. 2010. Democratic Engagement: A Report of the Canadian Index of Wellbeing (CIW). Saskatoon: Prairie Wild Consulting Co.; Canadian Index of Wellbeing.
Morissette, René, Garnett Picot, and Yuqian Lu. 2013. The Evolution of Canadian Wages over the Last Three Decades. Analytical Studies Branch Research Paper Series No. 347.Catalogue no. 11F0019M.Ottawa: Statistics Canada.
Morissette, René, and Rizwan Sultan. 2013. “Twenty Years in the Careers of Immigrant and Native-born Workers.”
Economic Insights No. 032. Catalogue no. 11-626-X. Ottawa: Statistics Canada.
Morrison, Mark, Jamie Olsen, Paul Schabas, Sean Boyle, and Simon Seida. 2013. “Canada Strengthens International Anti-corruption Legislation.”Bulletin,20 June. http://www.blakes.com/English/Resources/Bulletins/Pages/Details.aspx?BulletinID=1760.
Nalcor Energy. 2009. Lower Churchill Hydroelectric Generation Project: Environmental Impact Statement; Executive Summary. St. John’s: Nalcor Energy.
NASDAQ.com. 2014. “Crude Oil Brent: Latest Price and Chart for Crude Oil Brent.” Accessed December 20, 2014.http://www.nasdaq.com/markets/crude-oil-brent.aspx.
National Alliance to End Homelessness. 2008. Promising Strategy: Streets to Homes, Housing First in Toronto, Ontario; Getting Chronically Homeless People Back Into Housing. Toronto: National Alliance to End Homelessness.
National Energy Board. 2011. Energy Use in Canada’s North: An Overview of Yukon, Northwest Territories, and Nunavut. Energy Facts, March. Calgary: National Energy Board.
———. 2013a. Canada’s Energy Future 2013: Energy Supply and Demand Projections to 2035. Calgary: National Energy Board.
———. 2013b. Canadian Energy Overview 2012.Energy Briefing Note, July. Calgary: National Energy Board.
———. 2014. Canadian Energy Overview 2013. Energy Briefing Note, June. Calgary: National Energy Board.
National Security Group. 2006. Emergency: Municipalities Missing from Disaster Planning. Ottawa: Federation of Canadian Municipalities.
NRT (National Round Table on the Environment and the Economy). 2012. Reality Check: The State of Climate Progress in Canada. Ottawa: NRT.
Natural Resources Canada.2013a.Energy Markets Fact Book, 2013-2014. Ottawa: Natural Resources Canada.
———. 2013d. “Energy Sources and Distribution.” Accessed August 14, 2014.http://www.nrcan.gc.ca/energy/energy-sources-distribution.
———. 2013c. “Statistical Data:Forest Inventory.” Accessed August 12, 2014.https://cfs.nrcan.gc.ca/statsprofile/inventory/canada
———. 2013b. The State of Canada’s Forests: Annual Report 2013. Ottawa: Natural Resources Canada.
———. 2014a. “About Renewable Energy.”Accessed August 14, 2014.http://www.nrcan.gc.ca/energy/renewable-electricity/7295.
———. 2014b. The State of Canada’s Forests: Annual Report 2014. Ottawa: Natural Resources Canada.
New Brunswick. 2009. Overcoming Poverty Together: The New Brunswick Economic and Social Inclusion Plan. Fredericton: Government of New Brunswick.
———. 2014. Overcoming Poverty Together: The New Brunswick Economic and Social Inclusion Plan. Fredericton: Government of New Brunswick.
Newfoundland and Labrador. 2006. Reducing Poverty: An Action Plan for Newfoundland and Labrador.St. John’s: Government of Newfoundland and Labrador.
———. 2013. Safe and Caring Schools Policy. St. John’s: Government of Newfoundland and Labrador.
———. 2014. “Community Accounts.” Accessed July 24, 2014.http://nl.communityaccounts.ca/#.
Noël, Alain, and Florence Larocque. 2009. “Aboriginal Peoples and Poverty in Canada: Can Provincial Governments Make a Difference?” Paper prepared for the Annual Meeting of the International Sociological

141
Association’s Research Committee 19 (RC19), Montréal, August. http://www.cccg.umontreal.ca/rc19/PDF/Noel-A_Rc192009.pdf.
Northwest Territories. 2014. Government of the Northwest Territories Anti-poverty Action Plan: Building on the Strengths of Northerners, 2014/15–2015/16. Yellowknife: Government of the Northwest Territories.
Northwest Territories, Nunavut, and Yukon. 2011. Pan-Territorial Adaptation Strategy: Moving Forward on Climate Change Adaptation in Canada’s North. Yellowknife, Iqaluit, Whitehorse: Governments of the Northwest Territories, Nunavut, and Yukon.
Nova Scotia. 2009. Preventing Poverty. Promoting Prosperity. Nova Scotia’s Poverty Reduction Strategy. Halifax: Province of Nova Scotia.
NRTSI (National Round Table on Sustainable Infrastructure) and NRC (National Research Council Canada). 2009. Model Framework for Assessment of State, Performance, and Management of Canada’s Core Public Infrastructure. Ottawa: NRTSI and NRC.
Nunavut. 2011. The Makimaniq Plan: A Shared Approach to Poverty Reduction. Iqaluit: Government of Nunavut.
OECD (Organisation for Economic Co-operation and Development). 2009. Forum on Tax Administration: Compliance Management of Large Business Task Group. Guidance Note. Paris: OECD.
———. 2011. “Energy Intensity.” In OECD Factbook 2011-2012: Economic, Environmental and Social Statistics. Paris: OECD.
———. 2012a. Canada: Development Assistance Committee (DAC) Peer Review 2012. Paris: OECD.
———. 2012b. Income Distribution Data Review – Canada. Paris: OECD.http://www.oecd.org/els/soc/OECDIncomeDistributionDataReview-Canada.pdf.
———. 2013a. Development Co-operation Report 2013: Ending Poverty. Paris: OECD.
———. 2013b.Education at a Glance 2013:Canada. Paris: OECD.http://www.oecd.org/edu/Canada_EAG2013%20Country%20Note.pdf.
———. 2013c. OECD Better Life Index: Country Reports. Paris: OECD.
———. 2013d. Strengthening National Statistical Systems to Monitor Global Goals. OECD and Post-2015 Reflections, Element 5, Paper 1. Paris: OECD.
———. 2013e. The List of CRS Purpose Codes. Paris: OECD.http://www.oecd.org/dac/stats/documentupload/2012%20CRS%20purpose%20codes%20EN.pdf.
———.2014a. “Aid to Developing Countries Rebounds in 2013 to Reach an All-Time High.” Accessed August 24, 2014.http://www.oecd.org/newsroom/aid-to-developing-countries-rebounds-in-2013-to-reach-an-all-time-high.htm.
———. 2014b. “Greenhouse Gas Emissions.”OECD.Stat. Accessed August 24, 2014. http://stats.oecd.org/Index.aspx?DataSetCode=AIR_GHG#.
———. 2014c. Society at a Glance 2014: OECD Social Indicators. Paris: OECD.
———. 2014d. Glossary of Statistical Terms. Accessed February 15, 2015.http://stats.oecd.org/glossary/.
OECD (Organisation for Economic Co-operation and Development) and WTO (World Trade Organization). 2011. Aid for Trade at a Glance 2011: Showing Results. Paris and Washington, DC: OECD and WTO.
Office of the Auditor General of Canada. 2009. “Gender-Based Analysis.”In2009 Spring Report of the Auditor General of Canada. Ottawa: Office of the Auditor General of Canada.
———. 2011. “Chapter 4: Programs for First Nations on Reserves.” In Status Report of the Auditor General of Canada to the House of Commons. Ottawa: Office of the Auditor General of Canada.
———. 2013. “Official Development Assistance through Multilateral Organizations.” In 2013 Spring Report of the Auditor General of Canada. Ottawa: Office of the Auditor General of Canada.
———. 2014. “Meeting Needs for Key Statistical Data—Statistics Canada.” In 2014 Spring Report of the Auditor General of Canada. Ottawa: Office of the Auditor General of Canada.
OHCHR (Office of the High Commissioner for Human Rights). 2013. “Universal Periodic Review Second Cycle - Canada.” Accessed August 7, 2014. http://www.ohchr.org/EN/HRBodies/UPR/Pages/CASession16.aspx.
Oliver, Joe. 2012. “Natural Resources: Canada's Advantage, Canada’s Opportunity.” Remarks at CanaccordGenuity Corporation, September 4. http://www.nrcan.gc.ca/media-room/speeches/2012/3357.
Ontario. 2008. Breaking the Cycle: Ontario’s Poverty Reduction Strategy. Toronto: Government of Ontario.
———. 2013. Realizing Our Potential: Ontario’s Poverty Reduction Strategy, 2014-2019.Toronto: Government of Ontario.
Ontario Ministry of Citizenship, Immigration and International Trade. 2014. “Strengthening Immigrationin Ontario.” News release, February 19.http://news.ontario.ca/mci/en/2014/02/strengthening-immigration-in-ontario.html.
Ontario Ministry of Community and Social Services. 2014. “Ontario Works.” Accessed August 7, 2014.http://www.mcss.gov.on.ca/en/mcss/programs/social/ow.
Ontario Ministry of Education. 2014. “Safe and Accepting Schools.” Accessed August 7, 2014.http://www.edu.gov.on.ca/eng/teachers/safeschools.html
Ontario Ministry of Energy. 2013. Achieving Balance: Ontario's Long-Term Energy Plan. Toronto: Ontario Ministry of Energy.
Ontario Ministry of Infrastructure. 2012. Building Together: Guide for Municipal Asset Management Plans. Toronto: Ontario Ministry of Infrastructure.
Ontario Ministry of Labour. 2014. “Health and Safety Awareness Training for Workers and Supervisors.” Accessed August 7, 2014.http://www.labour.gov.on.ca/english/hs/training.
OPEC (Organization of the Petroleum Exporting Countries). 2014. “OPEC 166th Meeting Concludes.” Accessed December 12, 2014.http://www.opec.org/opec_web/en/press_room/2938.htm
Osberg, Lars, and Andrew Sharpe. 2011. Beyond GDP: Measuring Economic Well-being in Canada and the Provinces, 1981-2010. Ottawa: Centre for the Study of Living Standards.
OWG (Open Working Group on Sustainable Development Goals). 2014. Open Working Group Proposal for Sustainable Development Goals. New York: United Nations.
Pammett, Jon H., and Lawrence LeDuc. 2003. Explaining the Turnout Decline in Canadian Federal Elections: A New Survey of Non-voters. Ottawa: Elections Canada.
Panjvani, Lindsey. 2013. “An Overview of Anti-bullying Legislation and Alternatives in Canada.” Law Now, July 1. http://www.lawnow.org/an-overview-of-anti-bullying-
142
legislation-and-alternatives-in-canada/#sthash.71kxLwap.dpuf.
Parajulee, Abha, and Frank Wania. 2014. “Evaluating Officially Reported Polycyclic Aromatic Hydrocarbon Emissions in the Athabasca Oil Sands Region With a Multimedia Fate Model.” Proceedings of the National Academy of Sciences of the United States of America 111 (9): 3344–49.
Parliament of Canada. 1999. Canadian Environmental Protection Act, 1999. S.C. 1999, c. 33.Accessed July 24, 2014.http://laws-lois.justice.gc.ca/eng/acts/C-15.31/page-1.html.
———. 2007. Emergency Management Act. S.C. 2007, c. 15.Accessed July 24, 2014.http://laws-lois.justice.gc.ca/eng/acts/E-4.56/page-1.html.
Parks Canada. 2014. “2014 Prescribed Fires.” Accessed August 24, 2014.http://www.pc.gc.ca/eng/pn-np/mtn/feuveg-fireveg/dirige-prescribed/projet-projects.aspx.
Partington, P.J. 2013. “How Carbon Pricing Currently Works in Alberta.” Blog, Pembina Institute, April 5. http://www.pembina.org/blog/708.
Patriquin, Martin. 2010. “Quebec: The Most Corrupt Province.” Maclean’s, September 24.
Pay Equity Commission. 2012. “An Overview of Pay Equity in Various Canadian Jurisdictions: October 2011.”Accessed August 5, 2014.http://www.payequity.gov.on.ca/en/about/pubs/genderwage/pe_survey.php.
Perreault, Samuel. 2011.“Self-Reported Internet Victimization in Canada, 2009.”Juristat (September): 1–31.
———. 2012. “Police-Reported Crime Statistics in Canada, 2012.”Juristat (July): 1–45.
Peters, Roger, and Tim Weis. 2008. Feeding the Grid Renewably: Using Feed-In Tariffs to Capitalize on Renewable Energy. Calgary: Pembina Institute.
Philp, Ian, Jordan Isenberg, John-Frédéric Légaré-Trembley, and RemziCej. 2012. Launching Cleantech: Ensuring Canada’s Place in the New Global Market. Final Report of the Action Canada Taskforce on Clean Technology. Vancouver: Action Canada.
Pizzolato, Larissa,Stephen E. L. Howell,Chris Derksen,Jackie Dawson, and Luke Copland. 2014. “Changing Sea Ice Conditions and Marine Transportation Activity in Canadian Arctic Waters between 1990 and 2012.” Climate Change 123(2): 161–73.
Poulton, David W. 2014. Biodiversity Offsets: A Primer for Canada. Ottawa: Sustainable Prosperity and Institute of the Environment.
Prince Edward Island. 2012. Social Action Plan to Reduce Poverty. Charlottetown: Government of Prince Edward Island.
Public Health Agency of Canada.2013a. “Family Violence Initiative.” Accessed August 7, 2014.http://www.phac-aspc.gc.ca/ncfv-cnivf/initiative-eng.php.
———. 2013b. “Life Skills, Mathematical Reasoning and Critical Thinking Curriculum.” Canadian Best Practices Portal. Accessed August 7, 2014.http://cbpp-pcpe.phac-aspc.gc.ca.
Public Safety Canada.2008. Canada's National Disaster Mitigation Strategy. Ottawa: Public Safety Canada.
———. 2010. Emergency Management Planning Guide 2010–2011.Ottawa: Public Safety Canada.
———. 2012. Federal Policy for Emergency Management: Building a Safe and Resilient Canada. Ottawa: Public Safety Canada.
———. 2014a. “Harper Government Launches National Campaign to Stop Cyberbullying. ”News release,
January 9.http://www.publicsafety.gc.ca/cnt/nws/nws-rlss/2014/20140109-eng.aspx.
———. 2014b. “The Canadian Disaster Database.” Accessed August 20, 2014.http://www.publicsafety.gc.ca/cnt/rsrcs/cndn-dsstr-dtbs/index-eng.aspx.
Purdon, Mark, David Houle, and Erick Lachapelle. 2014. The Political Economy of California and Québec’s Cap-and-Trade Systems. Ottawa: Sustainable Prosperity.
Québec. 2010. Québec’s Combat Against Poverty: Government Action Plan for Solidarity and Social Inclusion, 2010-2015. Ville de Québec: Gouvernement du Québec.
———. 2012. A Better Way to Manage Our Infrastructure: Getting the Best Prices, Making the Best Choices. Ville de Québec: Gouvernement du Québec.
———. 2013a. The Québec Infrastructure Plan 2013-2023.Ville de Québec: Gouvernement du Québec.
———. 2013b. Transportation Electrification Strategy 2013-2017. Ville de Québec: Gouvernement du Québec.
R.A. Malatest& Associates Ltd. 2011. National Youth Survey Report. Ottawa: R.A. Malatest & Associates Ltd.
Rochon, Paul. 2014. “Millennium Development Goals: A Sprint to 2015 and the Way Forward.” Canadian Government Executive 20 (4).http://www.canadiangovernmentexecutive.ca/category/item/1520-millennium-development-goals-a-sprint-to-2015-and-the-way-forward.html.
Roman, Karina. “First Nations Divided Over Education Act and Their Leadership.”CBC News,May 1. http://www.cbc.ca/news/politics/first-nations-divided-over-education-act-and-their-leadership-1.2627976.
Sandink, Dan. 2013. Urban Flooding in Canada: Lot-Side Risk Reduction through Voluntary Retrofit Programs, Code Interpretation and By-laws. ICLR Research Paper No. 52. Toronto: Institute for Catastrophic Loss Reduction.
SaskPower. 2012. Boundary Dam Integrated Carbon Capture and Storage Demonstration Project. Regina: SaskPower.
Sayers, Anthony. 2014. “Canadian Elections Database.” Accessed August 14, 2014.http://canadianelectionsdatabase.ca/PHASE4/?p=home.
Schuster, Roseanne C., Eleanor E. Wein, Cindy Dickson, and HingMan Chan. 2011.“Importance of Traditional Foods for the Food Security of Two First Nations Communities in the Yukon, Canada.” International Journal of Circumpolar Health 70 (3): 286–300.
SECOR/KPMG. 2012. Étude sur la gestion actuelle du plan québécois des infrastructures et sur le processus de planification des projets. Montréal: SECOR/KPMG.
Séguin, Michel, and Jennifer Pagnotta. 2011. “Improving Access to PUMFs.” Presentation, Statistics Canada, August 30. http://www.iassistdata.org/downloads/2011/2011_f3_seguin_etal.pdf.
Shah, Timothy, and Claire Beckstead. 2012. Local Climate Action in British Columbia: Motivations and Policy Impacts. Calgary: Pembina Institute.
Shaker, Erika, and David Macdonald with Nigel Wodrich. 2013. Degrees of Uncertainty. Navigating the Changing Terrain of University Finance. Ottawa: Canadian Centre for Policy Alternatives.
Sharp, Bruce. 2013. “Blame Solar for Sky-High Ontario Power Bills.” Financial Post, October 29.
Sharpe, Andrew, and Evan Capeluck. 2012. The Impact of Redistribution on Income Inequality in Canada and the Provinces, 1981-2010. CSLS Research Report 2012-08. Ottawa: Centre for the Study of Living Standards.

143
Sharpe, Andrew, Anke Kessler, and Martin Thunert. 2014. Sustainable Governance Indicators: 2014 Canada Report.CSLS Research Report 2014-02.Ottawa: Centre for the Study of Living Standards.
Sheikh, Munir A. 2011. “Good Data and Intelligent Government.” In New Directions for Intelligent Government in Canada: Papers in Honour of Ian Stewart, edited by Fred Gorbet and AndrewSharpe, 305–36. Ottawa: Centre for the Study of Living Standards.
Sinha, Maire, ed. 2013. “Measuring Violence against Women: Statistical Trends.”Juristat (February): 1–120.
Standards Council of Canada. 2012. The Canadian Smart Grid Standards Roadmap: A Strategic Planning Document. Ottawa: Standards Council of Canada.
Stastna, Kazi. 2011. “Clean Running Water Still a Luxury on Many Native Reserves.” CBC News, November 30. http://www.cbc.ca/news/canada/clean-running-water-still-a-luxury-on-many-native-reserves-1.1081705.
Statistics Canada. 2002. Statistics Canada’s Quality Assurance Framework. Catalogue no. 12-586-XIE. Ottawa: Statistics Canada.
———. 2003. Statistics Canada Quality Guidelines. 4th ed. Catalogue no. 12-539-XIE.Ottawa: Statistics Canada.
———. 2009a. “How Data Are Used.” Accessed July 26, 2014.http://www.statcan.gc.ca/about-apercu/used-utiliser-eng.htm.
———. 2009b. Measuring Crime in Canada: Introducing the Crime Severity Index and Improvements to the Uniform Crime Reporting Survey.Catalogue no. 85-004-X. Ottawa: Statistics Canada.
———. 2009c. Statistics Canada Quality Guidelines. 5th ed.Ottawa: Statistics Canada.
———. 2010. “Survey of Labour and Income Dynamics (SLID) – 2010 Survey Overview.” Accessed July 24, 2014. http://www.statcan.gc.ca/pub/75f0011x/75f0011x2012001-eng.htm.
———. 2011. Improvements to the Labour Force Survey (LFS): The 2011 Revisions of the Labour Force Survey (LFS). Catalogue no. 71F0031X. Ottawa: Statistics Canada.
———. 2012a. “Summary of Changes Over Time - Aboriginal Peoples Survey (APS).” Accessed August 5, 2014.http://www23.statcan.gc.ca/imdb/p2SV.pl?Function=getMainChange&InstaId=16692&SurvId=3250&SurvVer=4&SDDS=3250.
———. 2012b. “2006 Census Questionnaires and Guides.” Accessed July 24, 2014.https://www12.statcan.gc.ca/census-recensement/2006/ref/question-guide-eng.cfm.
———. 2012c. The Immigrant Labour Force Analysis Series. Labour Statistics Division. Ottawa, ON. Accessed 19 January 2015.http://www.statcan.gc.ca/pub/71-606-x/71-606-x2012006-eng.pdf.
———. 2013a. “Advisory Groups.” Accessed July 26, 2014.http://www.statcan.gc.ca/about-apercu/relevant-pertinente-eng.htm.
———. 2013b. Commuting to Work. Catalogue no. 99-012-2011003.Ottawa: Statistics Canada.
———. 2013c. Low Income Lines, 2011-2012.Income Research Paper Series No. 002.Catalogue no. 75F0002M. Ottawa: Statistics Canada.
———. 2013d. “Low Income Measures.” Accessed July 25, 2014.http://www.statcan.gc.ca/pub/75f0002m/2012002/lim-mfr-eng.htm.
———. 2013e. “Market Basket Measure (2008 Base).”Accessed July 25, 2014.http://www.statcan.gc.ca/pub/75f0002m/2012002/mbm-mpc-eng.htm.
———. 2013f. “NHS Aboriginal Population Profile, 2011.”Accessed July 24, 2014.http://www12.statcan.gc.ca/nhs-enm/2011/dp-pd/aprof/index.cfm?Lang=E.
———. 2013g. NHS User Guide. Catalogue no. 99-001-X2011001. Ottawa: Statistics Canada.
———. 2013h. “Inside the World of Statistics Canada.” Accessed July 24, 2014.http://www.statcan.gc.ca/edu/power-pouvoir/about-apropos/5214850-eng.htm.
———. 2013i.Report on Energy Supply and Demand in Canada: 2011 Preliminary. Catalogue no. 57-003-X. Ottawa: Statistics Canada.
———. 2013j. “Response Burden Reduction Efforts: Communication Improvements – Results (October 2013).” Accessed July 24, 2014.http://www.statcan.gc.ca/about-apercu/pbri-iafp/rtra-arrp-eng.html.
———. 2013k. “Table 202-0705: Gini Coefficients of Market, Total and After-Tax Income, By Economic Family Type, Annual (Number).” Accessed July 30, 2014.http://www5.statcan.gc.ca/cansim/a26?lang=eng&retrLang=eng&id=2020705&tabMode=dataTable&srchLan=-1&p1=-1&p2=9.
———. 2013l. “Table 202-0706: Market, Total, and After-Tax Income of Individuals, Where Each Individual Is Represented By Their Adjusted and Unadjusted Economic Family Income, By Economic Family Type and Adjusted After-Tax Income Quintiles, 2011 Constant Dollars, Annual.” Accessed July 31, 2014.http://www5.statcan.gc.ca/cansim/a26?lang=eng&retrLang=eng&id=2020706&pattern=2020701..2020706&tabMode=dataTable&srchLan=-1&p1=-1&p2=-1.
———. 2013m. “Table 202-0802: Persons in Low Income Families, Annual (Data in Thousands).”CANSIM.Accessed July 24, 2014.http://www5.statcan.gc.ca/cansim/a26?lang=eng&retrLang=eng&id=2020802&paSer=&pattern=&stByVal=1&p1=1&p2=1&tabMode=dataTable&csid=.
———. 2013n. “Table 204-0001: High Income Trends of Tax Filers in Canada, Provinces, Territories and Census Metropolitan Areas (CMA), National Thresholds, Annual (Percent Unless Otherwise Noted).”CANSIM.Accessed July 24, 2014.http://www5.statcan.gc.ca/cansim/a26?lang=eng&retrLang=eng&id=2040001&paSer=&pattern=&stByVal=1&p1=1&p2=31&tabMode=dataTable&csid.
———. 2013o. “Table C.2.3: Student-Educator Ratio in Public Elementary and Secondary Schools, Canada, Provinces and Territories, 2001/2002 to 2010/2011.” Accessed July 30, 2014.http://www.statcan.gc.ca/pub/81-582-x/2013001/tbl/tblc2.3-eng.htm#tblc2.3n_1.
———. 2013p. “University Tuition Fees, 2013/2014.”Accessed July 24, 2014.http://www.statcan.gc.ca/daily-quotidien/130912/dq130912b-eng.htm.
———. 2013q. “Violence against Women, 2011.”Accessed August 5, 2014.http://www.statcan.gc.ca/daily-quotidien/130225/dq130225a-eng.htm.
———. 2013r. “The educational attainment of Aboriginal peoples in Canada.” National Household Survey (NHS), 2011.Accessed 10 February 2015.http://www12.statcan.gc.ca/nhs-enm/2011/as-sa/99-012-x/99-012-x2011003_3-eng.pdf.
———. 2013s. “Education in Canada: Attainment, Field of Study and Location of Study.” National Household Survey (NHS), 2011.Accessed 10 February 2015.http://www12.statcan.gc.ca/nhs-enm/2011/as-sa/99-012-x/99-012-x2011001-eng.pdf.

144
———. 2013t. “Vital Statistics – Death Database.” Accessed February 15, 2015.http://www23.statcan.gc.ca/imdb/p2SV.pl?Function=getSurvey&SDDS=3233
———.2013u. Immigration and Ethnocultural Diversity in Canada. Catalogue no. 99-010-X2011001. Ottawa: Statistics Canada.
———.2013v.Table 202-0101 - Distribution of earnings, by sex, 2011 constant dollars, annual. CANSIM Database. Accessed January 19, 2015.http://www5.statcan.gc.ca/cansim/a26?lang=eng&retrLang=eng&id=2020101&paSer=&pattern=&stByVal=1&p1=1&p2=-1&tabMode=dataTable&csid=.
———.2013w. Education and Occupation of high-income Canadians. National Household Survey. Accessed January 19, 2015.http://www12.statcan.gc.ca/nhs-enm/2011/as-sa/99-014-x/99-014-x2011003_2-eng.pdf.
———. 2014a. “Confidentiality and Privacy.”Accessed July 24, 2014.http://www.statcan.gc.ca/eng/survey/participant01.
———. 2014b. “Labour Force Survey (LFS), June 2014.” Accessed July 10, 2014.http://www.statcan.gc.ca/daily-quotidien/140711/dq140711a-eng.htm.
———. 2014c. “Mandate and Objectives.”Accessed July 24, 2014.http://www.statcan.gc.ca/about-apercu/mandate-mandat-eng.htm.
———. 2014g. “Registered Apprenticeship Information System (RAIS).” Accessed July 30, 2014.http://www23.statcan.gc.ca/imdb/p2SV.pl?Function=getSurvey&SDDS=3154.
———. 2014e. “Statistics Canada’s Adoption of Open Data.” Accessed June 20, 2014.http://data.gc.ca/eng/statistics-canadas-adoption-open-data.
———. 2014f. “Table 127-0007: Electric Power Generation, By Class of Electricity Producer, Annual (Megawatt Hour).” CANSIM. Accessed November 14, 2014.http://www5.statcan.gc.ca/cansim/a05?lang=eng&id=1270007&pattern=1270007&searchTypeByValue=1&p2=35.
———.2014g.“Canadian Income Survey, 2012.”Accessed December 17, 2014.http://www.statcan.gc.ca/daily-quotidien/141210/dq141210a-eng.htm.
———.2014h. “The Research Data Centres (RDC) Program.”Accessed July 30, 2014.
http://www.statcan.gc.ca/eng/rdc/index. ———. 2014i. “Vital Statistics - Birth Database.” Accessed
August 14, 2014.http://www23.statcan.gc.ca/imdb/p2SV.pl?Function=getSurvey&SDDS=3231.
———. 2014j. “National Household Survey (NHS).”Accessed February 15, 2015.http://www23.statcan.gc.ca/imdb/p2SV.pl?Function=getSurvey&SDDS=5178#a2.
———. 2015a.Table 282-0093 - Labour force survey estimates (LFS), employment by National Occupational Classification for Statistics (NOC-S), seasonally adjusted, monthly (persons). CANSIM Database. Accessed February 14, 2015.http://www5.statcan.gc.ca/cansim/a26?lang=eng&retrLang=eng&id=2820093&paSer=&pattern=&stByVal=1&p1=1&p2=-1&tabMode=dataTable&csid=.
———. 2015b. Table 054-0002 - Income of immigrants, by world area, sex, immigrant admission category, education qualifications, knowledge of official languages, and landing year for tax year 2012, annual. CANSIM Database. Accessed 19 January 2015.http://www5.statcan.gc.ca/cansim/a26?lang=eng&retrLang=eng&id=0540002&pattern=Income+And+Immigrant&tabMode=dataTable&srchLan=0&p1=-1&p2=-1.
———. 2015c. Table 282-0104 - Labour force survey estimates (LFS), by immigrant status, sex and detailed age group, Canada, annual (persons unless otherwise noted). CANSIM Database. Accessed 19 January 2015.http://www5.statcan.gc.ca/cansim/a26?lang=eng&retrLang=eng&id=2820104&pattern=Labour+Force+Survey+AND+Immigrant&tabMode=dataTable&srchLan=0&p1=-1&p2=-1.
Stewart, E.J., S.E.L. Howell, D. Draper, J. Yackel, and A. Tivy. 2007. “Sea Ice in Canada’s Arctic: Implications for Cruise Tourism.” Arctic 60 (4): 370–80.
Sustainable Development Office. 2013. Planning for a Sustainable Future: A Federal Sustainable Development Strategy for Canada, 2013–2016.Gatineau: Environment Canada.
Sustainable Development Solutions Network. 2014.“Indicators and a Monitoring Framework for Sustainable Development Goals: Launching a Data Revolution for the SDGs.” Revised working draft, July 25.http://unsdsn.org/wp-content/uploads/2014/07/140724-Indicator-working-draft.pdf.
Taylor, Susan, and Jo-Ellen Parry.2014. Enhancing the Resilience of Manitoba’s Winter Roads System. Winnipeg: International Institute for Sustainable Development.
Teelucksingh, Cheryl, and Grace-Edward Galabuzi. 2005. Working Precariously: The Impact of Race and Immigrants Status on Employment Opportunities and Outcomes in Canada. Toronto: Canadian Race Relations Foundation.
Thompson, Debra. 2010. “The Politics of the Census: Lessons from Abroad.”Canadian Public Policy36(3): 377–82.
Toronto. 2014. 2013 Progress Report on Equity, Diversity and Human Rights (EDHR) Achievements. Toronto: City of Toronto.
TRACE. 2014. “TRACE Matrix.” Accessed August 8, 2014.http://www.traceinternational.org/trace-matrix.
Transparency International. 2013a. “Corruption Perceptions Index 2013.”Accessed August 8, 2014.http://cpi.transparency.org/cpi2013/results.
———. 2013b. Global Corruption Barometer 2013.Berlin: Transparency International.
Transparency International Canada. 2013. UNCAC Implementation Review: Civil Society Organization Report. Toronto: Transparency International Canada.
Transport Canada. 2014. “Environmental Programs.” Accessed November 14, 2014.https://www.tc.gc.ca/eng/programs/environment-programs-index.htm.
Tremblay, Manon, Jane Arscott, and Linda Trimble. 2013. “Introduction: The Road to Gender Parity.” In Stalled: The Representation of Women in Canadian Governments, edited by Linda Trimble, Jane Arscott, and Manon Tremblay, 1–18. Vancouver: UBC Press.
Trimble, Linda, Jane Arscott, and Manon Tremblay, eds. 2013.Stalled: The Representation of Women in Canadian Governments. Vancouver: UBC Press.
Turner, Nancy J., Marianne BoelscherIgnace, and Ronald Ignace. 2000. “Traditional Ecological Knowledge and Wisdom of Aboriginal Peoples in British Columbia.” Ecological Applications 10(5): 1275–87.
Tuttle, Robert. 2014. “Canada Heavy Oil Nearing $40 Threatens Oil Sands Projects.” Bloomberg.com, December 11. http://www.bloomberg.com/news/2014-12-11/canada-heavy-oil-nearing-40-threatens-new-oil-sands-projects.html.
UN (United Nations). 2007. “Overview of International Legal Frameworks for Disability Legislation.” Accessed July

145
24, 2014.http://www.un.org/esa/socdev/enable/disovlf.htm#overleg3.
UNDP (United Nations Development Programme). 2014. Human Development Report 2014; Sustaining Human Progress: Reducing Vulnerabilities and Building Resilience. New York: UNDP.
UNESCO (United Nations Educational, Scientific and Cultural Organization). 2012. International Standard Classification of Education: ISCED 2011. Montreal: UNESCO Institute for Statistics.
UNEVOC (International Centre for Technical and Vocational Education and Training). 2012. "What is TVET?" Accessed July 10, 2014.http://www.unevoc.unesco.org/go.php?q=What+is+TVET
UNICEF (United Nations Children’s Fund). 2014. "Statistics by Area: Child Nutrition." Accessed July 10, 2014.http://www.childinfo.org/malnutrition.html.
UNISDR (United Nations Office for Disaster Risk Reduction). 2007. "Terminology." Accessed August 12, 2014.http://www.unisdr.org/we/inform/terminology.
———. 2009. 2009 UNISDR Terminology on Disaster Risk Reduction. Geneva: United Nations..
UNODC (United Nations Office on Drugs and Crime).2014. Global Study on Homicide 2013. New York: United Nations.
UN-OHRLLS (UN Office of the High Representative for the Least Developed Countries, Landlocked Developing Countries and Small Island Developing States). 2014. “About LDCs.” Accessed July 24, 2014.http://unohrlls.org/about-ldcs.
UNStats (United Nations Statistics Division).2013. Recommended Practices on the Use of Non-Official Sources in International Statistics. November.https://unstats.un.org/unsd/accsub-public/practices.pdf.
———. 2014. System of Environmental-Economic Accounting (SEEA)—Central Framework. New York: United Nations.
United States of America, Canada, and Mexico. 2012. North American Waterfowl Management Plan 2012: People Conserving Waterfowl and Wetlands. Washington, DC, Ottawa, and Mexico City: Governments of the United States of America, Canada, and Mexico.
Upadhyaya, Shyam. 2014. “Use of Non-official Sources for Transforming National Data into an International Statistical Product – UNIDO’s Experience.” Unpublished manuscript, United Nations Industrial Development Organization, Vienna.http://unstats.un.org/unsd/accsub/2014docs-CDQIO/Paper-UNIDO.pdf.
Uppal, Sharanjit, and Sébastien LaRochelle-Côté. 2012. “Factors Associated with Voting.” Perspectives on Labour and Income 24 (1): 4–15.
U.S. Energy Information Administration. 2014. Short-Term Energy Outlook (STEO).December. Washington, DC: U.S. Energy Information Administration.
Van Praet, Nicolas. 2013. “‘Everybody Is Scared Right Now.’ How Quebec Is Fighting Corruption.” Financial Post, December 26.
Veall, Michael R. 2010. “2B or Not 2B? What Should Have Happened With the Canadian Long Form Census? What Should Happen Now?” Canadian Public Policy 36(3): 395–99.
———. 2012. “Top Income Shares in Canada: Recent Trends and Policy Implications.” Canadian Journal of Economics 45 (4): 1247–72.
Voices-Voix.2014.”About the Coalition.” Accessed August 8, 2014.http://voices-voix.ca/en/about.
Weber, Michael G., and Brian J. Stocks 1998.“Forest Fires and Sustainability in the Boreal Forests of Canada.”Ambio 27 (7): 545–50.
West Coast LEAF. 2008. “Women’s Fund Closure Reduces Sustainability for Women’s Groups.” Accessed August 10, 2014.http://www.westcoastleaf.org/userfiles/file/WFF%20PressRelease.pdf.
Whittington, Les. 2013. “Conservatives Dismantling Social Programs Built Over Generations.” Toronto Star, December 9.
Wies, Tim, Shawn-Patrick Stensil, and Jeff Harti. 2013. Renewable is Doable: Affordable and Flexible Options for Ontario’s Long-Term Energy Plan. Calgary: Pembina Institute and Green Peace.
Working Group on Capacity Building. 2011. Code of Good Practice in Statistics for Latin America and the Caribbean. Santiago de Chile: Economic Commission for Latin America and the Caribbean.http://www.dane.gov.co/files/noticias/BuenasPracticas_en.pdf.
World Bank. 2005. Connecting East Asia: A New Framework for Infrastructure. Washington, DC: Asian Development Bank, World Bank, and Japan Bank for International Cooperation.
———. 2011b. One Goal, Two Paths: Achieving Universal Access to Modern Energy in East Asia and the Pacific. Washington, DC: World Bank.
———. 2014a. “Debt Forgiveness or Reduction (Current US$).”Accessed July 10, 2014.http://data.worldbank.org/indicator/DT.DFR.DPPG.CD.
———. 2014b. "Gross Fixed Capital Formation (% of GDP)."Accessed July 10, 2014.http://data.worldbank.org/indicator/NE.GDI.FTOT.ZS.
———. 2014c. “Procurement: World Bank Listing of Ineligible Firms and Individuals.” Accessed July 24, 2014.http://web.worldbank.org/external/default/main?pagePK=64148989&piPK=64148984&theSitePK=84266&theSitePK=84266&contentMDK=64069844&querycontentMDK=64069700&sup_name=&supp_country=.
———. 2014d. “Poverty Headcount Ratio at $1.25 a Day (PPP) (% of Population).”Accessed July 29, 2014.http://data.worldbank.org/indicator/SI.POV.DDAY.
———. 2014e. “Poverty Headcount Ratio at $2 a Day (PPP) (% of Population).”Accessed July 29, 2014.http://data.worldbank.org/indicator/SI.POV.2DAY.
———. 2014f. “World Development Indicators: Energy Production and Use.” Accessed August 12, 2014.http://wdi.worldbank.org/table/3.6.
World Commission on Environment and Development. 1987. Our Common Future. A/42/427. New York: United Nations.
World Economic Forum. 2013. The Global Gender Gap Report 2013. Geneva: World Economic Forum.
World Health Organization (WHO). 2014. “Ambient (Outdoor) Air Pollution in Cities Database 2014.”Accessed November 16, 2014.http://www.who.int/phe/health_topics/outdoorair/databases/cities/en.
World Justice Project. 2014. “WJP Rule of Law Index 2014: Canada.” Accessed August 5, 2014.http://data.worldjusticeproject.org/#/index/CAN.
Yukon. 2012. A Better Yukon for All: Government of Yukon’s Social Inclusion and Poverty Reduction Strategy. Whitehorse: Government of Yukon.
Zickfeld, Kristen. 2011. “Greenhouse Gas Emission and Climate Impacts of the Enbridge Northern Gateway Pipeline.” Unpublished manuscript, December

146
1.http://www.ceaa-acee.gc.ca/050/documents_staticpost/cearref_21799/83858/Greenhouse_Gas_Emission_Report.pdf.

147
Annex 1. Research Process
Research Team
The Canada case study was originally launched by
the North-South Institute, an Ottawa-based
international development think tank. In September
2014, the organisation announced its closure. Work
on the Post-2015 Data Test, including the Canada
case study, moved to NPSIA. The school is now
leading the Canada case study, working in
partnership with the Centre for the Study of Living
Standards. Founded in 1965 and based at Carleton
University, the Norman Paterson School of
International Affairs is Canada’s oldest school of
international affairs. The Centre for the Study of
Living Standards was established in 1995 as a
non-profit, national, independent research centre to
undertake research in the area of living standards.
Methodology
A methodology and implementation guide was
prepared for the initiative (Bhattacharya, Higgins
and Kindornay2014). It is available online and
contains full details on the methodological
approach undertaken.143 Below is a brief overview
of the research approach and activities undertaken,
noting where the approach differs from that of the
methodology and implementation guide for the
initiative.
A mix of research methods were used to examine
the following issues: Canada’s national priorities
under potential SDG areas, including the selection
of national level targets and indicators; potential
data gaps for measuring progress; and challenges
and opportunities that may exist in Canada for
realising the SDGs. Researchers carried out a
literature review of relevant policy documents and
academic papers, mapped sources of data from a
range of national databases, and applied a quality
142 Includes councils and semi-governmental organisations, such as the Federation of Canadian Municipalities 143 See initiative website, www.post2015datatest.com.
Table 1.1. Stakeholders consulted for the Canada case study
Stakeholder Organisations Academic and research institutions
Department of Civil and Environmental Engineering, Carleton University
Norman Paterson School of International Affairs, Carleton University
Centre for the Study of Living Standards
Department of Geography, University of Ottawa
Department of Political Science, University of Calgary
Graduate School of Public and International Affairs, University of Ottawa
International Institute for Sustainable Development
Ivey Business School, Western University
School of Labour Studies & Department of Economics, McMaster University
School of International Development and Global Studies, University of Ottawa
School of Political Studies, University of Ottawa
Civil society AidWatch Canada
Assembly of First Nations
Canadian Council for International Co-operation
Canadian Education Association
Canadian Forum on Civil Justice
Canadian Labour Congress
Canadian Teachers Federation
David Suzuki Foundation
Sustainable Development Technology Canada
The Community Power Report
Transparency International Canada
United Nations Association in Canada
Media The Globe and Mail
Government142 Aboriginal Affairs and Northern Development Canada
Canadian Revenue Agency
Conservation and Water Stewardship, Government of Manitoba
Council of Ministers of Education, Canada
Foreign Affairs, Trade and Development Canada
Environment Canada
Employment and Social Development Canada
Family Services, Government of Manitoba
Federation of Canadian Municipalities
Finance Canada
International Development Research Centre
Library of Parliament
Manitoba Jobs and the Economy, Government of Manitoba
Ministry of Energy, Government of Alberta
Public Safety Canada
Statistics Canada
Status of Women Canada

148
assessment framework144 to examine data adequacy for each goal area. Throughout the research
process, key stakeholders across government, civil society, and academia were engage (Table 1.1). Over
June and July 2014, key informant interviews were conducted with 18 individuals representing
stakeholders from civil society (7), academia (3), the federal government (3) and provincial governments
(6). Aboriginal Affairs and Northern Development Canada also provided written feedback on the targets
and indicators selected for the study. An inception workshop was held in April 2014 to launch the study.145
Throughout the research process, researchers also contacted Statistics Canada directly to request
additional information and clarifications on survey instruments, particularly on data for potential indicators
related to education, employment, income, energy, justice and personal security. Statistics Canada was
highly responsive to requests and provided input on comparability between datasets and data sources;
best sources for the indicators included in this study; and additional information on survey methodologies
such as data dictionaries (see Table 1.2 for further details).This information informed the application of
the quality assessment framework and the data strategy outlined in the report. In addition, researchers
also contacted Environment Canada, Public Safety, DFATD, the Canadian Revenue Agency, and the
Library of Parliament, regarding additional information on data availability and metadata where
appropriate.
144 The quality assessment framework was based on international standards developed by several international organisations that included the European Union, UN Statistics Division, and International Monetary Fund. Refer to the Methodology and Implementation Guide (Bhattacharya, Higgins and Kindornay 2014) for more information. 145 See Kindornay (2014b) for a report on the results of the Canada inception workshop.
Table 1.2 Requests made to statistics Canada throughout the research project
Goal area Indicator or source Request for information on… Poverty Proportion of people with disabilities living below the
national poverty line Best source
Education National Graduates Survey Data availability
Completion rates for primary and secondary school Data availability
Best Source
Proportion of school-aged children who report being bullied Data availability
Employment and Inclusive Growth
Longitudinal Immigration Database
Additional information on metadata
The average number of hours spent on unpaid work Best Source
Proportion of total income held by the top 1% Best Source
Energy and Infrastructure
Share of the population with access to modern cooking solutions (%)
Data availability
Share of renewable energy to total energy consumption Best source
Governance
Violent death per 100,000 people
Comparability between identified sources
Best source
Prevalence of violence against women, including domestic violence
Best source
Average time between filing a case and receiving a verdict
Comparability between sources
Possibility of computing indicator from sources
Proportion of parties appearing in court without legal counsel because they cannot afford it
Best source
Global Partnership
Proportion of Canadians who contribute to development efforts abroad through volunteer efforts (in Canada or abroad) or donations
Data availability
Share of trade in goods and services from low-income countries under duty-free, quota-free market access
Comparability between identified sources
Possibility of computing indicator from sources
Proportion of foreign direct investment to the productive sector
Possibility of computing indicator from sources

149
In addition to these efforts, as part of the peer review process, a draft version of the report was reviewed
by an international expert on the post-2015 process and the data revolution.
It is worth noting that a number of limitations exist to this study. While the research team made substantial
efforts to engage with a variety of stakeholders over the course of the project, given the timeframes,
available resources and breadth of issue areas included in the study, it was impossible to engage
thoroughly with all stakeholders. In addition, a significant number of interviewees and stakeholders
engaged were Ottawa-based, though their work is Canada-wide in scope. With additional time and
resources, it would have been useful to have additional consultations across Canada with stakeholders
from different localities to ensure that a broader range of perspective informed the report.

150
Annex 2. Targets and Indicators Examined for Canada
Table 2.1 End poverty: Targets and indicators
Target Indicator Definition/Note
Global
End extreme income poverty
Proportion of population below US$1.25 (PPP) per day
Refers to the percentage of the population living on less than USD 1.25 at 2005 prices (World Bank 2014d).
Reduce poverty Proportion of population below US$2 (PPP) per day
Refers to the percentage of the population living on less than USD 2.00 at 2005 prices (World Bank 2014e).
Proportion of population living below national poverty line
The Low Income Measure-After Tax is used to measure of the poverty line. The LIM is the most commonly used low income measure for making international comparisons (Statistics Canada 2013d). It is a fixed percentage (50%) of median adjusted household income (i.e., households’ needs are taken into account in the calculation). It is calculated with market income, before -tax income and after-tax income using the SLID. The LIM is derived and applied using a single income survey.
Share of employed persons living below the nationally-defined poverty line
The working poor or the number of employed persons living in households with incomes below the nationally-defined poverty line are based on real disposable income and refer to a nationally-defined real absolute poverty line, whenever possible. Data are presented in terms of the yearly annual average. Here, the income concept refers to the household disposable income. If a relative poverty line is used, data are expressed as the number of employed persons living in households with incomes below the nationally defined relative poverty line. The poverty line is defined as the threshold below which individuals in the population are considered poor and above which they are considered non-poor. The threshold is generally defined as the per-capita monetary requirements an individual needs to afford the purchase of a basic bundle of goods and services (ILO 2014).
Reduce the proportion of people who suffer from hunger
Prevalence of child stunting in boys and girls under 5, %
Stunting: Proportion of under-fives falling below minus 2 standard deviations (moderate and severe) and minus 3 standard deviations (severe) from the median height-for-age of the reference population (UNICEF 2014).
National
End extreme income poverty
Proportion of the population living below $12.50 USD (PPP) per day
Suggested income per day threshold for rich countries by Overseas Development Institute think piece on poverty in the post-2015 agenda (would be applied to all developed countries).
Reduce poverty Proportion of the population in low income according to the market basket measure
The market basket measure is a measure of low income based on the cost of a specific basket of goods and services representing a modest, basic standard of living. It includes the costs of food, clothing, footwear, transportation, shelter and other expenses for a reference family of two adults aged 25-49 and two children aged 9 and 13 (Statistics Canada 2013e).
Proportion of Aboriginal identity population living below national poverty line
Poverty line as defined by the LIM.
Proportion of people with disabilities living below national poverty line
Poverty line as defined by the LIM.

151
Proportion of female-headed households living below national poverty line
Poverty line as defined by the LIM.
Proportion of recent immigrants living below national poverty line
Poverty line as defined by the LIM. Immigrant defined as persons who are or have ever been a landed immigrant in Canada.
Proportion of people who are homeless
Proportion of people in shelters at the time of the census. In 2011 census, shelter defined as shelters for people lacking a fixed address, shelters for abused women and children, and other shelters and lodging with assistance.
Address chronic poverty
Persistence of low income Refer to the flows of persons into and out of low income between two adjacent years. For the percentage of persons: Immobility is the proportion of the population who stayed in low income in both years as a share of people who were in low income the previous year. Exit is the proportion of the population who exited low income as a share of people who were in low income the previous year. Entry is the proportion of the population who entered low income as a share of people were not in low income the previous year. Resistance is the proportion of the population who stayed out of low income in both years as a share of people who were not in low income the previous year (Statistics Canada 2010).
Table 2.2 Ensure quality education for all: Targets and indicators
Target Indicator Definition/Note
Global
Ensure all children have access to early childhood and quality primary and secondary education
% of girls and boys receiving at least one year in pre-primary programs
Refers to the proportion of children (girls and boys) who have at least one year of pre-primary programs. In the Canadian context, this includes kindergarten and junior kindergarten.
% of girls and boys who complete primary school
Refers to proportion of girls and boys who complete primary school.
% of girls and boys who complete secondary school
Refers to proportion of girls and boys who complete secondary school.
% of girls and boys who achieve a passing grade in national learning assessments at the primary school level
Assessment of learning outcomes: Evaluation of an individual’s achievement of learning objectives, using a variety of assessment methods (written, oral and practical tests/examinations, projects and portfolios) during or at the end of an education programme (UNESCO 2012). National [or sub-national] assessment: Large-scale assessment surveys designed to describe the achievement of students in a curriculum area and to provide an estimate of the achievement level in the education system as a whole at a particular age or grade level. This normally involves administration of tests either to a sample or population of students (Ho 2013).
Increase the number of adults with skills, including technical and vocational skills
Proportion of individuals enrolled in a Technical and Vocational Education and Training institution
Technical and Vocational Education and Training is concerned with the acquisition of knowledge and skills for the world of work. Various terms have been used to describe elements of the field that are now conceived as comprising Technical and Vocational Education and Training. These include: Apprenticeship Training, Vocational Education, Technical Education, Technical-Vocational Education, Occupational Education, Vocational Education and Training, Professional and Vocational Education, Career and Technical Education, Workforce Education, Workplace Education, etc. Several of these terms are commonly used in specific geographic areas (UNEVOC 2012).In the Canadian context, the

152
Registered Apprentice Information System compiles additional information about certificates granted to apprentices or trade qualifiers (challengers). According to the survey, "a trade qualifier (challenger) is an individual who received training within a trade where apprenticeship training is voluntary and did not register for the apprenticeship training but succeeded in obtaining their certification within that trade" (Statistics Canada 2014d).
National
Ensure a safe, secure and effective learning environment in the classroom
Student-educator ratio The term "educator" refers to not only a teacher, but to all employees in the public school system who are required to have teaching certification as a condition of their employment. This definition generally includes principals, vice-principals and professional non-teaching staff such as education consultants, guidance counsellors and religious and pastoral counsellors. Note that the student-educator ratio is not the same as the student-teacher ratio. The student-educator ratio accounts for personnel outside of the classroom, such as principals, counsellors and specialists as well as teachers' time outside of the classroom dedicated to classroom preparation and marking (Statistics Canada 2013o).
Proportion of school-aged children who report being bullied
The data are available both for verbal and physical bullying. Based on the proportion of children who indicate they have been bullied in the past couple of months at time of the survey.
Ensure all children have access to early childhood and quality primary and secondary education
Proportion of Aboriginals who complete secondary school
Refers to the proportion of Aboriginal boys and girls who complete secondary school.
% of children aged 0-5 for whom there is a regulated childcare space
Based on spaces available in licensed childcare programs.
Increase the number of young adults with skills for problem-solving and critical thinking
% of youth demonstrating proficient skills in problem-solving and critical thinking by the end of secondary school
Additional work would be needed to define an appropriate methodology for measuring this indicator, though some assessment frameworks exist, such as the International Critical Thinking Test developed by the Center for Critical Thinking at Sonoma State University (2013).
Increase the number of adults participating in life-long learning
Proportion of adults enrolled in post career, technical or professional training programs
Refers to the number of adults enrolled in post career, technical or professional training programs as a percentage of the total adult population minus adults enrolled in other tertiary education programs (including at universities, colleagues and other vocational training programs).
Average tuition fee for full-time students at degree-granting institutions
Canadian degree-granting institutions include all universities and degree-granting colleges across the country. Tuition fees and additional compulsory fees represent only a portion of all costs incurred for attending university at the undergraduate level.
Average student debt from all sources at graduation
Includes student debt from public and private sources.
Average length of time it takes to pay student debt, by income quintiles
Refers to the length of time it takes to pay public and private sources of student debt.
Proportion of adults who complete tertiary education
Includes graduates from university and colleagues.
Proportion of adults with student loans Refers to the number of adults with student loans as a percentage of the adult population.

153
Cross-cutting: Establish open, accountable, inclusive and effective institutions and rule of law and peaceful and inclusive society
Increase access to justice
Proportion of jurisdictions that have integrated legal education into secondary curricula
Education that promotes legal literacy (ability to use printed and written information to function in the course and to achieve one's goals related to the justice system) and enables people to recognize they have a legal right or responsibility, and to know when a problem or conflict is a legal conflict and when a legal solution is available (John Howard Society of Canada 1996).
Cross-cutting: Establish a sustainable, healthy and resilient environment for all
Safeguard ecosystems and biodiversity
# of jurisdictions who have integrated biodiversity into elementary and secondary curricula
This indicator is included as a possible indicator under the Target "By 2020, diversity is integrated into the elementary and secondary school criteria" under Canada's Biodiversity goals and targets for the Convention on Biological Diversity's 2011-2020 Strategic Plan.
Cross-cutting: Establish a global partnership for sustainable development
Promote global citizenship
# of jurisdictions that have integrated global citizenship into elementary and secondary curricula
Education that promotes cross-cultural dialogue, second language learning, exposure to and discussion of international issues, informed and responsible global citizenship and active involvement in international issues (Alberta Education 2014).
Table 2.3 Create jobs, sustainable livelihoods, and inclusive growth for all: Targets and indicators
Target Indicator Definition/Note
Global
Achieve full and productive employment for all, including women and young people
Labour force participation rate The labour force participation rate is the labour force as a percent of the working age population (ILO 2014). This definition is consistent with that used by Statistics Canada.
Time-related underemployment (thousands)
Persons in time-related underemployment comprise all persons in employment, who satisfy the following three criteria during the reference period: a) are willing to work additional hours; b) are available to work additional hours i.e., are ready, within a specified subsequent period, to work additional hours, given opportunities for additional work; and c) worked less than a threshold relating to working time i.e., persons whose hours actually worked in all jobs during the reference period were below a threshold, to be chosen according to national circumstances. For details, refer to the Resolution concerning the measurement of underemployment and inadequate employment situations (ILO 2014). Canada’s nationally defined threshold for part-time workers is individuals who work 30 hours or less in a week. For the Canada case study, this includes individuals who: did not work full time because of business conditions and did not look for full-time work in the past month; could find full-time work and did not look for full-time work in the last month; worked part-time due to business conditions and looked for full-time work in the last month; and could not find full-time work and looked for full-time work in the past month.
Ensure equal pay for equal work
Mean nominal monthly earnings of employees (local currency)
Data on earnings are presented, whenever possible, in nominal terms and on the basis of the mean of monthly earnings of all employees. The earnings of employees relate to the gross remuneration in cash and in kind paid to employees, as a rule at regular intervals, for time worked or work done together with remuneration for time not worked, such as annual vacation, other type of paid leave or holidays. Earnings exclude employers' contributions in respect of their employees paid to social security and pension schemes and also the benefits received by employees under these schemes. Earnings also exclude severance and termination pay. Statistics of earnings relate to the gross

154
remuneration of employees, i.e. the total before any deductions are made by the employer. Data are disaggregated by economic activity according to the latest version of the International Standard Industrial Classification of All Economic Activities (ISIC) available for that year. Economic activity refers to the main activity of the establishment in which a person worked during the reference period and does not depend on the specific duties or functions of the person's job, but on the characteristics of the economic unit in which this person works.
Support inclusive growth and reduce inequality
Palma ratio Refers to the ratio of the income share of the top 10% to the bottom 40%.
Gini coefficient The Gini coefficient is a number between zero and one that measures the relative degree of inequality in the distribution of income. The coefficient would register zero (minimum inequality) for a population in which each family (or unattached individual) received exactly the same income and it would register a coefficient of one (maximum inequality) if one family (or unattached individual) received all the income and the rest received none. Even though a single Gini coefficient value has no simple interpretation, comparisons of the level over time or between populations are very straightforward: the higher the coefficient, the higher the inequality of the distribution, and vice versa (definition provided by Statistics Canada 2013k).
Growth rate of income of the bottom 40%
After-tax income quintiles are used to measure the growth rate of the bottom 40% for all family units. All the persons of the population are ranked from lowest to highest by the value of their adjusted family after-tax income. Then, the ranked population is divided into five groups of equal numbers of units, called quintiles. The lowest income quintile represents the 20% of the population whose income is lowest. By the same token, the highest quintile represents the 20% of the population whose income is highest. After-tax income is total income less income tax (income from all sources including government transfers and before deduction of federal and provincial income taxes) (Statistics Canada 2013l).
Gross fixed capital formation (% of GDP)
Gross fixed capital formation (formerly gross domestic fixed investment) includes land improvements (fences, ditches, drains, and so on); plant, machinery, and equipment purchases; and the construction of roads, railways, and the like, including schools, offices, hospitals, private residential dwellings, and commercial and industrial buildings (World Bank 2014b).
National
Promote decent work
Union coverage rate (by collective agreement), %
Includes members of union and non-members who are covered by a union contract.
Proportion of employed with access to work-place benefits
Employee benefits may include: health and dental; life, accidental death and dismemberment; short-term disability; long-term disability; employee assistance plan; retirement benefits (pension plans, RRSPs, phased retirement).
Work-related injuries, per 1,000 employed workers
Definition to be inserted from Statistics Canada in final draft.

155
Support inclusive growth and reduce inequality
Earnings ratio between the bottom 90% and top 10%
Refers to the average earnings of the bottom 90 percent of the income earners as a percent of the top 10 percent of income earners.
Reduce share of income held by the top 1%
Proportion of total income held by the top 1%
Refers to the proportion of total income held by the top 1% of income earners.
Ensure equal pay for equal work
Wage gap between men and women Based on median hourly wage according to National Occupational Classification for full-time workers. Refers to women’s median hourly wage as percentage of men’s median hourly wage.
Achieve full and productive employment work for all, including women, youth and Aboriginal peoples
Unemployment rate for Aboriginal identity population
Refers to the number unemployed Aboriginals as a percentage of the Aboriginal labour force (employed and unemployed).
Unemployment rate for youth Refers to the number unemployed youth (15–24) as a percentage of the labour force (employed and unemployed) who are youth.
Unemployment rate for recent immigrants
Refers to the number of unemployed recent immigrants (individuals who have been in Canada for 10 years or less) as a percentage of the labour force (employed and unemployed).
Table 2.4 Ensure sustainable energy and develop infrastructure for all: Targets and indicators
Target Indicator Definition/Note
Global
Ensure full access to developed infrastructure and communication technology
Internet users (per 1000 people) This indicator measures the number of people that uses the internet for every 1,000 people.
Average bandwidth speed (megabits/second)
Measurement of the ability of an electronic communications device or system (such as a computer network) to send and receive information, measured in megabits per second (mbit/s).
% of the population with access to an all-season road
“With access” means that the distance from a village or household to an all-season road is no more than 2 km; otherwise, a walk of no more than 20 minutes or so is required to reach an all-season road. An “all-season road” is a road that is motorable by the prevailing means of rural transport (often a pick-up or a truck which does not have four-wheel-drive) all year round. Predictable interruptions of short duration during inclement weather (e.g. heavy rainfall) are permitted, particularly on low volume roads (World Bank 2005).
% of adults with an account at a formal financial institution
Denotes the percentage of population with an account (self or together with someone else) at a bank, credit union, another financial institution (e.g. cooperative, microfinance institution), or the post office (if applicable) (modified slightly from World Bank Global Index Glossary).
Ensure access to energy and improve efficiency
# of hours per day households have access to electricity on average
This indicator measures the number of hours for which electricity is available in a household within a given day. It is not directly applicable to Canada’s context and a proxy indicator has been included below to capture the number of person-days households do not have access to electricity.

156
and sustainability of energy supply, including renewable energy
Rate of improvement in energy intensity
Energy required per unit (currency) of GDP, measured in primary energy terms and GDP. Primary energy refers to energy sources as found in their natural state (as opposed to derived or secondary energy, which is the result of the transformation of primary or secondary sources) (OECD 2011).
Share of the population with access to modern cooking solutions (%)
Access to modern cooking solutions is defined as relying primarily on non-solid fuels for cooking. Non-solid fuels include: (i) liquid fuels (for example, kerosene, ethanol, or other biofuels); (ii) gaseous fuels (such as natural gas, liquefied petroleum gas [LPG], and biogas); and (iii) electricity. Solid fuels include: (i) traditional biomass (for example, wood, charcoal, agricultural residues, and dung); (ii) processed biomass (such as pellets, and briquettes); and (iii) other solid fuels (such as coal and lignite) (World Bank 2011b; Banerjee et al. 2013).
Share of renewable energy to total energy consumption
Energy that is derived from natural processes (e.g. sunlight and wind) that are replenished at a higher rate than they are consumed. Solar, wind, geothermal, hydro, and biomass are common sources of renewable energy (IEA 2014).
National
Ensure access to safe, efficient, and affordable mobility
Proportion of fuel consumed by private transportation
This indicator can provide a measure for fuel efficiency for the private transportation sector and it includes both household consumption of motor fuels and consumption by various transportation industries.
Energy used by the transportation sector
This indicator shows trend in energy usage of the transportation sector.
Average cost of transportation, by public and private transportation modes
This indicator looks at the average cost of public and private transportation. It has been included to provide a comparison between the affordability of public transits and private transportations.
Crash reduction after construction of safety improvement capital projects
This indicator has been suggested as a performance metric by the British Columbia Infrastructure Service Plan (British Columbia Ministry of Transportation and Infrastructure2012).
Improve maintenance of public transport infrastructure
Existence of municipal frameworks or guidelines for assessing road conditions and capacity, by jurisdiction
A major finding of the Canadian Infrastructure Report Card was the need to develop objectives and frameworks among municipalities to assess infrastructures (Félio et al. 2012). Based on this finding, this indicator has been included as it captures the capacity of municipalities as well as federal, provincial, and territorial agencies to assess road conditions.
Average commuting duration, by type of transportation mode
Commute time and cost is an important indicator for measuring mobility and capacity of transportation services. Two major publications on infrastructure, Model Framework for Assessment of State, Performance, and Management of Canada’s Core Public Infrastructure and The Canadian Infrastructure Report Card, have emphasised the relevance of commute time in assessing infrastructure condition (Félio et al. 2012; NRTSI and NRC 2009). It is particularly important for capturing the loss in productivity that results from poorly maintained road, water and rail transportation systems.
Annual public transit ridership Transit ridership is the number of rides taken by people using public transit over a set period of time. The British Columbia Infrastructure Service Plan has included ridership as a measure for monitoring the success of transit investments on a year-to-year basis (British Columbia Ministry of Transportation and Infrastructure2012).
Ratio of investment in operation and maintenance of infrastructure to capital investment
The ratio of investment in infrastructure to capital investment shows the extent to which governments are taking steps to maintain and improve local and national infrastructures.

157
Ensure access to energy and improve efficiency and sustainability of energy supply, including renewable energy
% of non-carbon, green energy to total energy consumption
This indicator shows the energy consumption share of non-carbon green energy. It has been separated from renewable energy consumption share because it excludes energy generated from biomass or any other carbon sources that is categorised by the International Energy Agency as a renewable source (IEA 2014).
Rate of change in total energy consumption, per capita
This indicator has been included to show the trend in energy consumption per capita. It indicates whether energy usage has reduced or grown over the years.
% of electricity being generated from renewable sources (wind, water, solar and bioenergy)
Ontario's 2013 Long-Term Energy Plan has included a target for 'increasing hydroelectricity generation by x MW by 2025 and phase in wind, solar, and bioenergy' (Ontario Ministry of Energy 2013). The indicator has been developed based on this target.
Total electricity available This indicator can serve as a proxy for measuring '# of hours per day households have access to electricity on average'.
# of person-days that people don't have access to electricity due to all causes, including weather
This indicator also serves as a proxy for measuring '# of hours per day households have access to electricity on average'. It should be noted that the data for the indicator does not exist currently and may be collected through administrative data from electricity suppliers.
Cross-cutting: Establish a sustainable, healthy and resilient environment for all
Address climate change
Rate of greenhouse gas emissions intensity, by industry
Greenhouse gases (GHG) are those gaseous constituents of the atmosphere, both natural and anthropogenic, that absorb and emit radiation at specific wavelengths within the spectrum of infrared radiation emitted by the Earth's surface, the atmosphere and clouds. This property causes the greenhouse effect. Water vapour (H2O), carbon dioxide (CO2), nitrous oxide (N2O), methane (CH4) and ozone (O3) are the primary GHGs in the earth's atmosphere (Environment Canada 2013c). Note: It should be noted that GHG emission intensity measures GHG emissions per unit of GDP.
Average price of gasoline and fuel oil An increase or a decrease in this indicator can be interpreted both in a negative or a positive light. From an environmental standpoint, a decrease in fuel prices may not necessarily be desirable as this can increase energy consumption, which in turn will have a negative impact on the environment.
Table 2.5 Establish a sustainable, healthy and resilient environment for all: Targets and indicators
Target Indicator Definition/Note
Global
Build resilience and reduce deaths from natural hazards
Disaster deaths per 1,000 inhabitants Hazard: A dangerous phenomenon, substance, human activity or condition that may cause loss of life, injury or other health impacts, property damage, loss of livelihoods and services, social and economic disruption, or environmental damage. Includes: Avalanche, Cold Wave, Cyclone, Drought, Earthquake, Epidemic and Pandemic; Flood, Heat Wave, Insect Infestation; Landslide; NBC – Nuclear, Biological, Chemical; Storm Surge; Tornado; Tsunami; Volcano; Wildfire (UNISDR 2007). Disaster: A serious disruption of the functioning of a community or a society involving widespread human, material, economic or environmental losses and impacts, which exceeds the ability of the affected community or society to cope using its own resources (UNISDR 2007).
Net loss in forest area (% of land area)
Forest: Land spanning more than 0.5 hectares with trees higher than 5 meters and a canopy cover of more than 10 percent, or trees able to reach these thresholds in situ. It does not include land that is predominantly under agricultural or urban land use (FAO 2012).

158
Safeguard ecosystems and biodiversity
Trends in coverage of protected areas
The protected area coverage indicator measures the policy response to biodiversity loss. An increase in protected area coverage indicates increased efforts by governments and civil society to protect land and sea areas with a view to achieve the long-term conservation of biodiversity with associated ecosystem services and cultural values (BIP 2014). Note: The data provided shows how protected areas are managed based on IUCN category and includes marine areas.
Publish and use economic, social and environmental accounts in all governments and companies
Share of large tax unit taxpayers using integrated reporting
Integrated Reporting is a process founded on integrated thinking that results in a periodic integrated report by an organisation about value creation over time and related communications regarding aspects of value creation. An integrated report is a concise communication about how an organisation’s strategy, governance, performance and prospects, in the context of its external environment, lead to the creation of value in the short, medium and long term (IIRC 2013). Large taxpayers are very different from other categories of taxpayers and present certain significant risks to effective tax administration. Major characteristics of large business segment include: concentration of revenues, complexity of the business and tax dealing, withhold agent or intermediary role, uses of professional tax advisors and possession of in-house tax organisation. Businesses may be publicly listed corporations, multinational companies or private groups (OECD 2009). The Canada Revenue Agency defines large taxpayers as businesses with gross revenues in excess of $250 million.
Existence of national and sub-national government publishing according to the System of Environmental-Economic Accounting
The System of Environmental-Economic Accounting (SEEA) contains the internationally agreed standard concepts, definitions, classifications, accounting rules and tables for producing internationally comparable statistics on the environment and its relationship with the economy. The SEEA framework follows a similar accounting structure as the System of National Accounts (SNA) and uses concepts, definitions and classifications consistent with the SNA in order to facilitate the integration of environmental and economic statistics (UNStats 2014).
National
Build resilience and reduce vulnerability to natural hazards
% of public infrastructure owners that have produced disaster mitigation plans
This indicator shows progress towards Canada's National Disaster Mitigation Strategy. This Strategy is based on the recognition by federal, provincial, and territorial governments that mitigation is an important part of a robust emergency management framework, and that all stakeholders are committed to working together to support disaster mitigation in Canada. A primary purpose of this document is to promote mitigation through a transparent National Strategy that integrates disaster mitigation into Canada's emergency management framework (Public Safety Canada).
# of people displaced by natural disasters
Natural disasters are those types of disasters that have a natural origin. However, it also takes reference from UNISDR’s socio-natural hazard that is caused by human activity – precisely relating to overexploitation or degradation of land and resources. It should be noted that disaster refers to a dangerous phenomenon that can cause loss of life or severe injury, property damage, loss of livelihoods and services, social and economic disruptions, or environmental damage (modified from UNISDR’s definition for hazard) (UNISDR 2009).
# of person-days people are displaced due to natural disasters
Currently, there are no data indicating how long people remain displaced due to natural disasters. There is only information about the date of the event.
Direct economic losses from natural disasters (% of GDP)
This indicator refers to any economic loss that an individual, person or institution, may incur as a result of a natural disaster. It is expressed as a percentage of the country’s Gross Domestic Product (GDP).
% of the population displaced by wildfire in the last five years
This indicator provides data for the proportion of the population who have been had to leave their homes due to wildfire within the last five years.

159
% of the population exposed to flooding in the last five years
This indicator provides data for the proportion of the population who have been affected or threatened by flooding within the last five years. Please note that impacts associated with exposure to flooding can include loss of life or severe injury, property damage, loss of livelihoods and services, social and economic disruptions, or environmental damage (modified from UNISDR’s definition for hazard) (UNISDR 2009).
Safeguard ecosystems and biodiversity
Area of terrestrial ecozones covered by forest land, disaggregated by forest type
An ecozone is an area of the Earth's surface representing large and very generalised ecological units characterised by interacting abiotic (non-living) and biotic (living) factors. Canada has 20 ecozones—15 terrestrial and 5 marine. The 15 terrestrial ecozones are subdivided into 53 ecoprovinces, which can be further subdivided into 194 ecoregions. Ecozones place Canada’s ecosystems in a North American and global context, as they are linked to the ecological regions of North America and the global ecological zones of the United Nations’ Food and Agriculture Organization. Ecozones, ecoprovinces and ecoregions are useful for reporting and planning purposes at national, provincial and regional levels. Regardless of its level in the hierarchy, each of these units is distinguished from the others by a unique interplay of geologic, climatic, vegetative, wildlife and human activity factors (Natural Resources Canada 2013c).
Proportion of the Arctic conserved This indicator shows the proportion of the Arctic that has been conserved. It should be noted that the area includes both landmass and marine bioregions.
Habitat secured for waterfowl (wetlands)
In Canada, 45 species of waterfowl rely on healthy wetlands for living and for raising their young. Habitat for waterfowl had been secured in Canada through the North American Waterfowl Management Plan (NAWMP). The NAWMP is a tri-national (Canada, United States and Mexico) partnership that aims to return waterfowl populations to their 1970s levels by securing and restoring, and sustainably managing wetland and associated upland habitat (United States of America, Canada and Mexico 2012).
Proportion of at-risk wildlife species whose status is upgraded to higher risk (annual)
This indicator helps measures conservation effectiveness and tracks changes in the level of risk for at-risk species. In Canada, the Committee on the Status of Endangered Wildlife in Canada (COSEWIC) determines the national status of Canadian wildlife species that are suspected of being at risk of extinction or extirpation. It was established through the Species At Risk Act - which is a federal government commitment to prevent wildlife species from becoming extinct and secure the necessary actions for their recovery (COSEWIC 2002).
Proportion of medium and large population centres that have developed biodiversity conservation strategies
This indicator is included as a possible indicator under the target "By 2020, biodiversity considerations are integrated into municipal planning and activities of major municipalities across Canada" - under Canada's Biodiversity goals and targets for the Convention on Biological Diversity’s 2011-2020 Strategic Plan (Federal- Provincial-Territorial Biodiversity Working Group 2011).
# of jurisdictions who have integrated biodiversity into elementary and secondary curricula
This indicator is included as a possible indicator under the target, "By 2020, diversity is integrated into the elementary and secondary school criteria" - under Canada's Biodiversity goals and targets for the Convention on Biological Diversity's 2011-2020 Strategic Plan (Federal- Provincial-Territorial Biodiversity Working Group 2011).
Area of forest disturbed annually by insects (three species: forest tent caterpillar, mountain pine beetle, spruce budworm), fire and harvesting
This indicator is recommended by Natural Resources Canada. It is found that "while disturbance is a healthy part of the forest ecosystem, it can also weaken or kill large numbers of trees, affecting productivity in commercial regions, with important social and economic consequences" (Natural Resources Canada 2013d).

160
Improve air and water quality
Outdoor concentrations of fine particulate matter (PM2.5), ground-level ozone (O3), sulphur dioxide (SO2), nitrogen dioxide (NO2) and volatile organic compounds (VOCs)
The Air Quality Indicators track the ambient concentrations of fine particulate matter (PM2.5), ozone (O3), sulphur dioxide (SO2), nitrogen dioxide (NO2), and volatile organic compounds (VOCs) at the national and regional level and at the local monitoring-station level. There are now two indicators for PM2.5: an annual average indicator and a peak (98th percentile) 24-hour indicator. The calculation of the annual average indicator is aligned with the CAAQS (Canadian Ambient Air Quality Standards) for PM2.5 and is based on the annual average concentrations, while the peak (98th percentile) 24-hour indicator is aligned with the 24-hour CAAQS for PM2.5 and is based on the 98th percentile of the daily 24-hour average concentrations. The 98th percentile is a measure of some of the highest 24-hour average concentrations (Environment Canada 2013b).
Degree of physical, chemical threats and/or biological impairments to freshwater sources
This indicator measures the quality of Canada's vast freshwater resource. Following provides an explanation of the different measures: "Water quality at a monitoring site is considered excellent when ambient water quality never, or very rarely, exceeds guidelines for any selected parameters. When water quality is rated poor, water quality measurements usually exceed their guideline; exceedances at these sites may be large" (Environment Canada 2014d).
Reduce per capita waste through prevention, reduction, recycling and reuse
Estimate of transboundary movement of hazardous waste and recyclable materials
Hazardous wastes and hazardous recyclable materials typically exhibit hazardous characteristics, such as toxicity, corrosivity or flammability to name just a few. In Canada, these characteristics are defined by taking into account the hazard criteria established under the Transportation of Dangerous Goods Act and Transportation of Dangerous Goods Regulations, as well as specifically listed wastes and materials in the schedules of the Export and Import of Hazardous Waste and Hazardous Recyclable Material Regulations (Environment Canada 2013d).
Estimate of solid municipal waste collected, disposed of and recycled
The responsibility for municipal solid waste (MSW) management in Canada is shared among the federal, provincial/territorial and municipal governments. MSW refers to recyclables and compostable materials, as well as garbage from homes, businesses, institutions, and construction and demolition sites. MSW collection, diversion (recycling and composting) and disposal operations are the responsibility of municipal governments, while the provinces and territories are responsible for approvals, licensing and monitoring of operations (Environment Canada 2013e).
Address climate change
Rate of greenhouse gas emissions intensity, by industry
Greenhouse gases (GHG) are those gaseous constituents of the atmosphere, both natural and anthropogenic, that absorb and emit radiation at specific wavelengths within the spectrum of infrared radiation emitted by the Earth's surface, the atmosphere and clouds. This property causes the greenhouse effect. Water vapour (H2O), carbon dioxide (CO2), nitrous oxide (N2O), methane (CH4) and ozone (O3) are the primary GHGs in the earth's atmosphere (Environment Canada 2013c). Note: It should be noted that GHG emission intensity measures GHG emissions per unit of GDP.
Improve the integration of biodiversity, ecosystem services and benefit-sharing into planning, policy formulation
Trends in land-use change and land tenure in the traditional territories of indigenous and local communities
The indicator on trends in land-use and land tenure in the traditional territories of indigenous and local communities under the Aichi Biodiversity Targets was adopted by the Conference of the Parties to the Convention on Biological Diversity in 2010 (CBD 2010). Would likely need to be collected by expert review.
Proportion of Aboriginals practicing traditional occupations
Aichi Biodiversity Targets include a target around respecting traditional knowledge. An indicator on the status and trends in the practice of traditional occupations was adopted by the Conference of the Parties to the Convention on Biological Diversity in 2010 (CBD 2010).
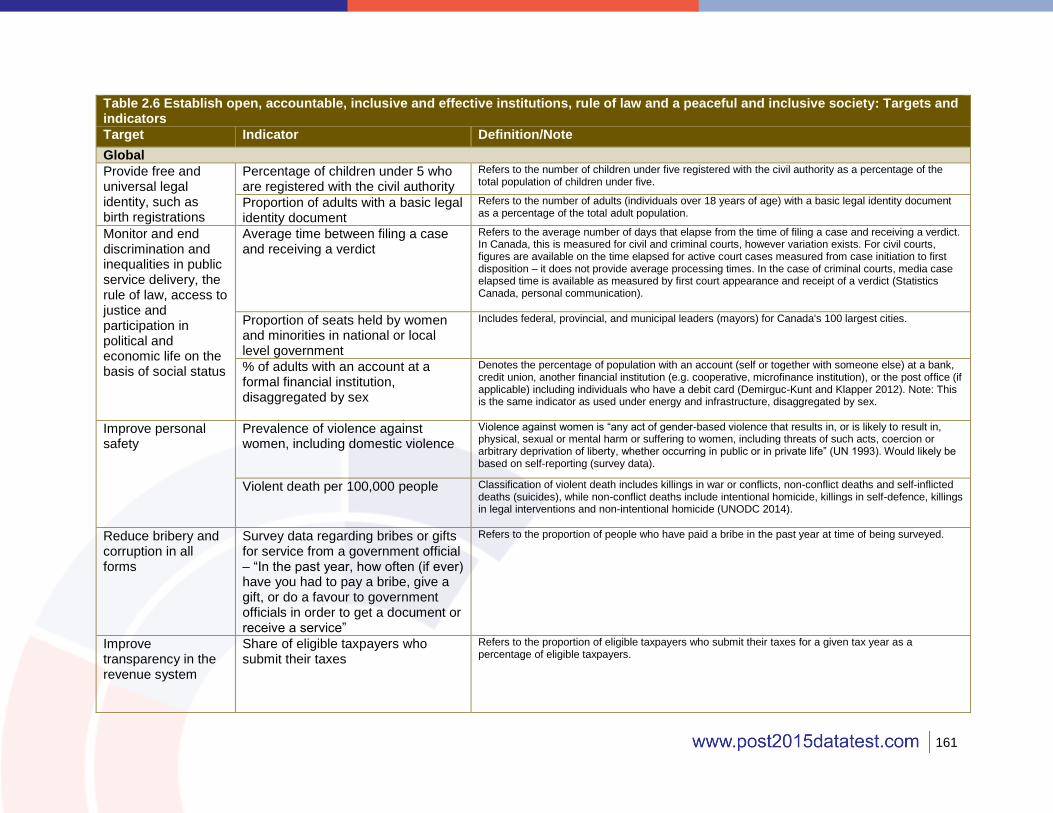
161
Table 2.6 Establish open, accountable, inclusive and effective institutions, rule of law and a peaceful and inclusive society: Targets and indicators
Target Indicator Definition/Note
Global
Provide free and universal legal identity, such as birth registrations
Percentage of children under 5 who are registered with the civil authority
Refers to the number of children under five registered with the civil authority as a percentage of the total population of children under five.
Proportion of adults with a basic legal identity document
Refers to the number of adults (individuals over 18 years of age) with a basic legal identity document as a percentage of the total adult population.
Monitor and end discrimination and inequalities in public service delivery, the rule of law, access to justice and participation in political and economic life on the basis of social status
Average time between filing a case and receiving a verdict
Refers to the average number of days that elapse from the time of filing a case and receiving a verdict. In Canada, this is measured for civil and criminal courts, however variation exists. For civil courts, figures are available on the time elapsed for active court cases measured from case initiation to first disposition – it does not provide average processing times. In the case of criminal courts, media case elapsed time is available as measured by first court appearance and receipt of a verdict (Statistics Canada, personal communication).
Proportion of seats held by women and minorities in national or local level government
Includes federal, provincial, and municipal leaders (mayors) for Canada's 100 largest cities.
% of adults with an account at a formal financial institution, disaggregated by sex
Denotes the percentage of population with an account (self or together with someone else) at a bank, credit union, another financial institution (e.g. cooperative, microfinance institution), or the post office (if applicable) including individuals who have a debit card (Demirguc-Kunt and Klapper 2012). Note: This is the same indicator as used under energy and infrastructure, disaggregated by sex.
Improve personal safety
Prevalence of violence against women, including domestic violence
Violence against women is “any act of gender-based violence that results in, or is likely to result in, physical, sexual or mental harm or suffering to women, including threats of such acts, coercion or arbitrary deprivation of liberty, whether occurring in public or in private life” (UN 1993). Would likely be based on self-reporting (survey data).
Violent death per 100,000 people Classification of violent death includes killings in war or conflicts, non-conflict deaths and self-inflicted deaths (suicides), while non-conflict deaths include intentional homicide, killings in self-defence, killings in legal interventions and non-intentional homicide (UNODC 2014).
Reduce bribery and corruption in all forms
Survey data regarding bribes or gifts for service from a government official – “In the past year, how often (if ever) have you had to pay a bribe, give a gift, or do a favour to government officials in order to get a document or receive a service”
Refers to the proportion of people who have paid a bribe in the past year at time of being surveyed.
Improve transparency in the revenue system
Share of eligible taxpayers who submit their taxes
Refers to the proportion of eligible taxpayers who submit their taxes for a given tax year as a percentage of eligible taxpayers.

162
National
Monitor and end discrimination and inequalities in economic life on the basis of social status
Proportion of Senior Managers who are women
As defined by the National Occupational Classification - A0.
Wage gap between immigrants and non-immigrants with comparable levels of education
Average income of very recent (0-5 years) and recent (5-10 years) immigrants holding a bachelor degree or higher as a percentage of average income for non-immigrants holding a bachelor degree or higher.
Increase access to justice
Proportion of legal aid applications approved
Refers to the number of legal aid applications approved as a percentage of total legal aid applications received.
Proportion of parties appearing in court without legal counsel because they cannot afford it
Refers to the number of parties that appear in court without legal counsel because they cannot afford it as a percentage of all parties appearing in court.
Proportion of people who are aware of their fundamental rights, the law and the legal system
Access to Justice Indicators in the Asia-Pacific Region describes this indicator as focusing on the awareness of citizens of their fundamental rights and their state’s legal system. A crucial component of access to justice includes the extent of knowledge of citizens about the legal and judicial system. The indicators used to measure this parameter are largely qualitative in character. Through surveys and governmental statistics, the overall legal awareness level of citizens can be further measured by assessing the knowledge/familiarity of citizens as regards their fundamental rights and freedoms, criminal matters that can brought to court, legal institutions that can handle justiciable cases, as well as court and legal procedures (La Salle Institute of Governance 2003).
Proportion of jurisdictions that have integrated legal education into secondary curricula
Education that promotes legal literacy (ability to use printed and written information to function in the course and to achieve one's goals related to the justice system) and enables people to recognise they have a legal right or responsibility, and to know when a problem or conflict is a legal conflict and when a legal solution is available (John Howard Society of Canada 1996).
Support realization of human rights
Compliance with recommendations from the Universal Periodic Review and UN Treaties
The indicator has been suggested by the Sustainable Development Solutions Network (2014). It assesses the extent to which states engage with the UN human rights mechanisms. The Universal Period Review is a peer review conducted by the member states of the UN Human Rights Council. The Universal Period Review working group scrutinises what states have done to improve human rights and fulfil their human rights obligations. Each UN member state is subject to review every 4.5 years. The UN Human Rights Treaty Bodies are quasi-legal expert bodies created by human rights treaties. When a state ratifies a treaty, it is obliged to periodically provide reports to the relevant treaty body. Both the Universal Period Review and the UN Human Rights Treaty Bodies issue recommendations, which can require states to make administrative, legislative, or judicial changes to enable the full realisation of human rights. This indicator would quantify these recommendations – they are easily accessible and can be collected and aggregated. The indicator would then measure the extent to which states have engaged and adopted the recommendations from both review processes.
Implementation of the UN Convention on the Rights of Persons with Disabilities
This indicator would examine, by expert review, actions to implement provisions contained in the convention in domestic jurisdictions, including adopting legislative and other measures to give effect to the obligations undertaken by the convention (see UN 2007).
Compliance with the UN Declaration on the Rights of Indigenous Peoples and recommendations by the Special
Through expert review, this indicator would include an assessment of actions taken implement the UN Declaration on the Rights of Indigenous Peoples and address recommendations by the Special Rapporteur. Recommendations by the Special Rapporteur could be quantified. In addition to the expert review, the indicator could measure the extent to which Canada has adopted the recommendations.

163
Rapporteur on the Rights of Indigenous Peoples
Increase public participation in political processes, including elections at all levels of government
Proportion of eligible voters who vote in federal elections
Measures the number of registered voters who voted in the last federal election.
Proportion of eligible voters who vote in provincial and territorial elections
Measures the number of registered voters who voted in the last provincial and territorial election.
Proportion of eligible voters who vote in municipal elections
Measures the number of registered voters who voted in the last municipal election.
Proportion of citizens who have engaged in non-voting political activities
Includes activities like: volunteering for a political party, expressing views in newspaper or to politician, signing a petition on paper/internet, attending a public meeting, participating in a demonstration, wearing a badge, displaying a lawn sign, etc.
Proportion of Canadian who demonstrate basic understanding of political processes and institutions in Canada
A survey instrument would have to be designed to measure this indicator. Following the 2011 federal election, Elections Canada supported a National Youth Survey to better understand why youth may or may not participate in electoral processes. The survey included questions related to political knowledge (R.A. Malatest & Associates Ltd. 2011).
Reduce bribery and corruption
Number of Canadian firms or individuals sanctioned under the World Banks fraud and corruption policy
The firms and individuals included in the World Bank Listing of Ineligible Firms & Individuals are ineligible to be awarded a World Bank-financed contract for the periods indicated because they have been sanctioned under the Bank's fraud and corruption policy as set forth in the Procurement Guidelines or the Consultant Guidelines (World Bank 2014c).
Survey capturing perceptions of corruption in Canada
Transparency International's index is one option but would not serve as an 'official source.' Additional work would be needed to develop an official measure corruption in Canada.
Table 2.7 Establish a global partnership for sustainable development: Targets and indicators
Target Indicator Definition/Note
Global
Create an enabling environment for sustainable development
Low-income country debt forgiveness or reduction (% of GDP)
Debt forgiveness or reduction shows the change in debt stock due to debt forgiveness. It is derived by subtracting debt forgiven and debt stock reduction from debt buyback (World Bank 2014a).
Share of trade in goods and services from low-income countries under duty-free, quota-free market access
This indicator tracks the proportion of goods and services from low-income countries that enter Canada under preferential market access.
Existence of laws for ensuring country by country reporting by multi-national corporations, disclosure of beneficial ownership and the prevention of money laundering
Meant to provide an indication of countries’ efforts to address tax evasion and prevent money laundering.

164
Increase financing to productive capacity in low- and middle-income countries
Share of aid to the productive sector Aid defined as ODA and OOF and productive sector defined as infrastructure, agriculture, and manufacturing.
Proportion of foreign direct investment to the productive sector
Productive sector defined as infrastructure, agriculture, manufacturing.
Share of South-South cooperation to the productive sector
Productive sector defined as infrastructure, agriculture, manufacturing.
National
Address the special needs of fragile, least developed, small island and landlocked states
Total aid allocated to least developed countries
Aid defined as ODA and OOF and least developed countries as defined by the UN-OHRLLS (2014).
Proportion of aid allocated to least developed countries
Aid defined as ODA and OOF and least developed countries as defined by the UN-OHRLLS (2014).
Total aid allocated to small island states for climate adaptation and mitigation
Aid defined as ODA and OOF and small island states as defined by the UN-OHRLLS.
Proportion of aid allocated to small island states for climate adaptation and mitigation
Aid defined as ODA and OOF and small island states as defined by the UN-OHRLLS.
Total aid-for-trade financing allocated to least developed, small island and landlocked states
Aid defined as ODA and OOF and land-locked states as defined by the UN-OHRLLS.
Proportion of aid-for-trade financing allocated to least developed, small island and landlocked states
Aid defined as ODA and OOF and land-locked states as defined by the UN-OHRLLS.
Promote better statistics for development
Total aid allocated to statistical capacity building in developing countries
Aid defined as ODA and OFF. Statistical capacity building captured by OECD Creditor Reporting System code 16062 which includes efforts in national statistical offices and any other government ministry (OECD-DAC 2013d).
Proportion of aid allocated to statistical capacity building in developing countries
Aid defined as ODA and OFF. Statistical capacity building captured by OECD-DAC Creditor Reporting System code 16062 which includes efforts in national statistical offices and any other government ministry (OECD-DAC 2013d).
Support climate change adaptation and mitigation in developing countries
Official climate financing that is incremental to ODA
This indicator has been suggested by the Sustainable Development Solutions Network (2014).
Developed countries have pledged under the Conference of Parties of the UN Framework Convention
on Climate Change to provide some US$100 billion per year in climate finance by 2020. This indicator
will track official (i.e., public) climate finance provided by each developed country as a contribution
towards the overall target of at least US$100 billion per year.
Strengthen domestic resource mobilisation in developing countries, providing
Total aid to support taxation Aid defined as ODA and OFF. Taxation falls under OECD-DAC Creditor Reporting System code 15111 for public finance management, which includes “fiscal policy and planning; support to ministries of finance; strengthening financial and managerial accountability; public expenditure management; improving financial management systems; tax policy and administration; budget drafting; inter-governmental fiscal relations, public audit, public debt” (OECD-DAC 2013d).

165
international support to improving tax collection, tax and natural resource revenue transparency
Proportion of aid to support taxation Aid defined as ODA and OFF. Taxation falls under OECD-DAC Creditor Reporting System code 15111 for public finance management, which includes “fiscal policy and planning; support to ministries of finance; strengthening financial and managerial accountability; public expenditure management; improving financial management systems; tax policy and administration; budget drafting; inter-governmental fiscal relations, public audit, public debt” (OECD-DAC 2013d).
Implement ODA commitments to provide 0.7% of GNI in ODA to developing countries
Ratio of ODA to GNI The 0.7% ODA/GNI target was established in 1970. A number of donor countries, excluding Canada, have repeatedly re-endorsed the commitment since through various high level meetings since. It is also included in the draft SDG framework prepared by the OWG. ODA as defined by the OECD-DAC.
Reduce the transaction costs of remittances from Canada to 5% or less, including regulatory and administrative costs
Average transaction cost of remitting money, %
Defined as the average cost across remittance corridors that individuals pay to remit funds.
Promote global citizenship
Proportion of Canadians who contribute to sustainable development efforts abroad through volunteer efforts (in Canada or abroad) or donations
Includes financial and in-kind donations (volunteering or provision of services for example) carried out within Canada or abroad with the aim of supporting international sustainable development efforts.
# of jurisdictions that have integrated global citizenship into elementary and secondary curricula
Education that promotes cross-cultural dialogue, second language learning, exposure to and discussion of international issues, informed and responsible global citizenship and active involvement in international issues (Alberta Education 2014).
Cross-cutting: Establish a sustainable, healthy and resilient environment for all
Reduce per capita waste through prevention, reduction, recycling and reuse
Estimate of transboundary movement of hazardous waste and recyclable materials
Hazardous wastes and hazardous recyclable materials typically exhibit hazardous characteristics, such as toxicity, corrosivity or flammability to name just a few. In Canada, these characteristics are defined by taking into account the hazard criteria established under the Transportation of Dangerous Goods Act and Transportation of Dangerous Goods Regulations, as well as specifically listed wastes and materials in the schedules of the Export and Import of Hazardous Waste and Hazardous Recyclable Material Regulations (Environment Canada 2013d).

166
Annex 3. Sources to Monitor Post-2015
146Sources from Statistics Canada, unless indicated otherwise.
Table 3.1 Potential sources for monitoring the post-2015 agenda in Canada
Sources146 Description Major changes Implication of changes Goal area Annual Income Estimates for Census Families and Individuals (T1 Family File, T1FF)
This survey collects administrative data from income tax returns that are submitted to the Canada Revenue Agency, showing income and demographic information. Data are provided annually, available from 2000 to 2011.
Improvements have been made to the process of identifying children. The introduction of the Universal Child Care Benefit program in 2006 has allowed the identification of more children under the age of six.
Relevance: These changes have resulted in improved coverage of children in the T1FF data compared to the official Statistics Canada population estimates.
Poverty
Annual Industrial Consumption of Energy Survey
This mandatory survey, funded by Natural Resources Canada and Environment Canada, provides estimates of energy consumption by manufacturing establishments in Canada on an annual basis. Data is available from 1995 to 2012.
A number of changes have been made to the survey. Starting in 2006, coal, coal coke, petroleum coke, coke on catalytic cracking catalyst, refinery fuel gas, butane and steam purchased are weighted which allows for estimates to be produced that represent the population. The North American Industry Classification System was adopted from 2006 – present.
Relevance: This change allows
the production of estimates that represent the population.
Energy and Infrastructure
Census of Population
The Census is designed to provide information about people in Canada by their demographic and social characteristics. It is a mandatory survey that is conducted every five years. Data is available online from 1996 to 2011.
In 2011, the mandatory long-form questionnaire was replaced by the voluntary National Household Survey.
Comparability and relevance:
The new methodology was introduced quite rapidly with limited testing, making it difficult to gauge data quality. Users expressed concerns over the break in historic datasets as a result of the changes.
Poverty
Education
Employment and Inclusive Growth
Canadian System of Environmental and Resource Accounts -
Material and Energy Flow Accounts
The Canadian System of Environmental and Resource Accounts have three components: (i) the Natural Resource Stock Accounts, which measures quantities of natural
resource stocks and annual changes in these stocks due to natural and human processes; (ii) the Material Energy and Flow Accounts, which record the flows of materials and energy between the economy and the environment; and (iii) the Environmental Protection Expenditure Accounts, which identify current and capital expenditures by business, governments and households for the purpose of protecting the environment.
The accounts use the same classifications and accounting methods as the System of National Accounts (SNA) to ensure that the data can be linked with the monetary data in
the national economic accounts. Classification changes and other improvements were introduced in the SNA with the implementation of the new international standards published in System of National Accounts 2008.
Comparability: The 2012 historical revision to the Canadian System of National
Accounts resulted in substantial impacts on the Input-Output tables published by Statistics Canada. As a result, the new tables are not fully comparable to previously published estimates for the period 1990 to 2008.
Energy and Infrastructure
Environment
Canadian Internet Use Survey (CIUS)
This is a hybrid survey that measures both household Internet access and the individual online behave ours of a selected household member. This is a voluntary survey that collects data occasionally, dating from 1995 to 2012.
The CIUS replaces the Household Internet Use Survey, conducted from 1997 to 2003, which focused on household Internet penetration. The survey questionnaire was again redesigned in 2010 from the older CIUS survey - a biennial survey conducted in 2005, 2007 and 2009.
Comparability: The target population changed with redesigns. In 1999, the age group of the target population was 15+. In 2005, the age group of the population changed to 18+. In 2007, the age group of the population was again changed to 16+.
Energy and Infrastructure
Canada's National Forest Inventory (NFI), Canadian Council of Forest Ministers
This is a forest monitoring program consisting of a network of sampling points covering one percent of Canada's land mass. It provides information on the state of Canada's forests and how they are changing over time. This program collects administrative data every 10 years.
The original design of the NFI was based on a 10-year measurement and reporting cycle. Changes to reporting have occurred as various design strategies were evaluated to address any gaps. Consequently, a 5-year measurement and reporting strategy has been adopted.
Accuracy and reliability: In order to track changes to the state of the forests, an ongoing measurement program is required. The adoption of the 5-
Environment

167
year measurement and reporting strategy will provide more frequent, timely, and up-to-date information.
Canadian Environmental Sustainability Indicators, Environment Canada
These indicators, prepared by Environment Canada, provide data and information to track Canada’s performance on key environmental sustainability issues. The three main indicators are: (i) air and climate indicators; (ii) water indicators; and (iii) nature indicators. This program collects administrative data annually. Data is available from 2001 to 2011.
No significant changes have been made to this statistical program that affect data quality.
Not applicable. Environment
Canada's International Investment Position
This statistical program measures Canada's asset and liability position with non-residents. This is a mandatory survey that collects quarterly data (as of 2003). Data is online from 1987 to 2013.
Survey collected annually from 1926-2002. 2003 was the first year information was released on a quarterly basis. Estimates for years 1990-2002 were produced.
Timeliness and punctuality: Data is available on a more frequent basis.
Global Partnership
Canadian International Merchandise Trade (Customs Basis)
This activity is part of the Canadian International Merchandise Trade Statistical Program and conducted to provide statistical information and analysis of the value of Canada's merchandise exports and imports by commodity and by partner country. This database collects administrative data monthly and data is available online from 1988 to 2014.
Some changes have been made with regard to coding of commodities and product classification. In 2012, Statistics Canada reduced the number of 10-digit Harmonized Commodity Coding and Description System classification codes that were used to report the commodity detail in Canada's merchandise import trade data. That same year, summary import and export groups’ classification structure switched to the North American Product Classification System.
Comparability: There has been little to no effect on the comparability of the data as Statistics Canada revised data dating back to 1988.
Global Partnership
Canada's International Transactions in Services
This statistical program records Canada's annual exports and imports of services by type of service rendered and by partner country. Quarterly estimates of Canada's international trade in services are available through Canada's International Balance of Payments (record no. 1534). Responding to the survey is mandatory and data is available online from 1990 to 2011.
No significant changes have been made to this statistical program that affect data quality.
Not applicable. Global Partnership
Climate Financing, Environment Canada
The database presents information on Canada’s climate financing. The dataset includes beneficiary countries, contributions, project descriptions and expected results/outcomes. Administrative data is collected biannually
and data is available from 2010 to 2012.
No major changes have occurred to this database. Not applicable. Global Partnership
Consumer Price Index
The Consumer Price Index (CPI) is an indicator of changes in consumer prices experienced by Canadians. It is obtained by comparing, over time, the cost of a fixed basket of goods and services purchased by consumers. This is a mandatory sample survey that collects monthly data. Data is available online from 1979 to 2014.
The CPI is updated on regular basis. The latest update was made to the Travel Tours Index that accounts for 0.80% of the 2011 CPI basket and belongs to the Recreation, Education and Reading Index of the CPI. Adjustments were made to methodology for calculating pricing of the most popular holiday packages.
Accuracy and relevance: These regular updates ensure that the CPI reflects current prices.
Energy and Infrastructure
Civil Court Survey (CCS)
This survey provides comparable, national level baseline data on civil court activity in Canada. Given the complex nature of civil justice procedures, the survey is designed to measure all activities both inside and outside the courtroom. It collects administrative data annually and data is available online from 2005 to 2012.
Survey data is obtained from existing civil court automated information systems that have not been developed in all jurisdictions.
Relevance and accuracy:
Since the automated information systems have not been developed in all jurisdictions, it will take time before full coverage is achieved.
Governance
Elementary-Secondary Education Survey
This is a national survey that provides information on enrolments, graduates, educators and finance of Canadian elementary-secondary public and private educational institutions. It also provides enrolment information for home-schooled students. It is a mandatory survey that collects data annually. Data is available online from 1997 to 2012.
This survey replaces and consolidates data that were earlier being collected by a number of different survey instruments. Changes were also made to data collection in 2010 and 2011 to collect data from private schools and home schooling respectively.
Comparability: The data is not strictly comparable to 2005-2006 and earlier years due to a change in data collection methods in 2006-2007 and onwards.
Education
Electricity Supply and Disposition – Annual
The survey provides data about the supply and disposition of electricity in Canada from utilities and industrial establishments that generate and/or distribute electrical energy in Canada. It collects administrative data annually and data is available online from 2005 to 2012.
As of 2003, the survey frequency has changed from quarterly to annual.
Comparability: The change from quarterly to annual collection period reduces comparability. This also means data is less timely.
Energy and Infrastructure
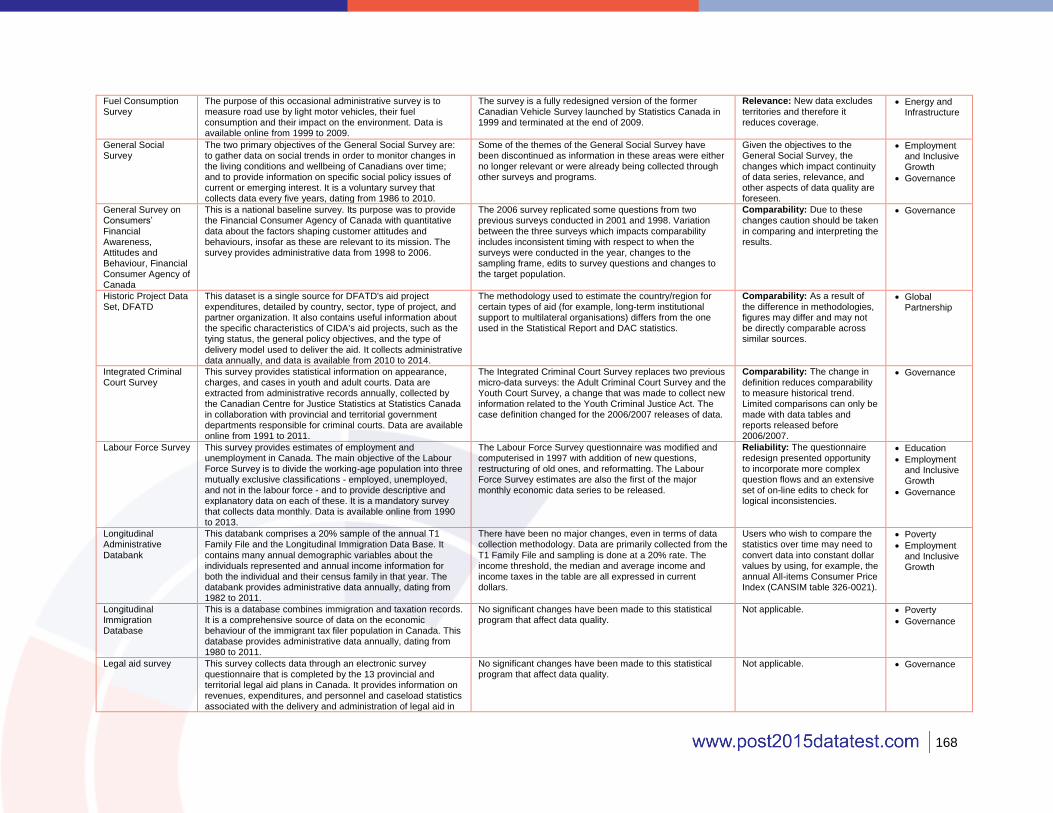
168
Fuel Consumption Survey
The purpose of this occasional administrative survey is to measure road use by light motor vehicles, their fuel consumption and their impact on the environment. Data is available online from 1999 to 2009.
The survey is a fully redesigned version of the former Canadian Vehicle Survey launched by Statistics Canada in 1999 and terminated at the end of 2009.
Relevance: New data excludes territories and therefore it reduces coverage.
Energy and Infrastructure
General Social Survey
The two primary objectives of the General Social Survey are: to gather data on social trends in order to monitor changes in the living conditions and wellbeing of Canadians over time; and to provide information on specific social policy issues of current or emerging interest. It is a voluntary survey that collects data every five years, dating from 1986 to 2010.
Some of the themes of the General Social Survey have been discontinued as information in these areas were either no longer relevant or were already being collected through other surveys and programs.
Given the objectives to the General Social Survey, the changes which impact continuity of data series, relevance, and other aspects of data quality are foreseen.
Employment and Inclusive Growth
Governance
General Survey on Consumers’ Financial Awareness, Attitudes and Behaviour, Financial Consumer Agency of Canada
This is a national baseline survey. Its purpose was to provide the Financial Consumer Agency of Canada with quantitative data about the factors shaping customer attitudes and behaviours, insofar as these are relevant to its mission. The survey provides administrative data from 1998 to 2006.
The 2006 survey replicated some questions from two previous surveys conducted in 2001 and 1998. Variation between the three surveys which impacts comparability includes inconsistent timing with respect to when the surveys were conducted in the year, changes to the sampling frame, edits to survey questions and changes to the target population.
Comparability: Due to these changes caution should be taken in comparing and interpreting the results.
Governance
Historic Project Data Set, DFATD
This dataset is a single source for DFATD's aid project expenditures, detailed by country, sector, type of project, and partner organization. It also contains useful information about the specific characteristics of CIDA's aid projects, such as the tying status, the general policy objectives, and the type of delivery model used to deliver the aid. It collects administrative data annually, and data is available from 2010 to 2014.
The methodology used to estimate the country/region for certain types of aid (for example, long-term institutional support to multilateral organisations) differs from the one used in the Statistical Report and DAC statistics.
Comparability: As a result of the difference in methodologies, figures may differ and may not be directly comparable across similar sources.
Global Partnership
Integrated Criminal Court Survey
This survey provides statistical information on appearance, charges, and cases in youth and adult courts. Data are extracted from administrative records annually, collected by the Canadian Centre for Justice Statistics at Statistics Canada in collaboration with provincial and territorial government departments responsible for criminal courts. Data are available online from 1991 to 2011.
The Integrated Criminal Court Survey replaces two previous micro-data surveys: the Adult Criminal Court Survey and the Youth Court Survey, a change that was made to collect new information related to the Youth Criminal Justice Act. The case definition changed for the 2006/2007 releases of data.
Comparability: The change in definition reduces comparability to measure historical trend. Limited comparisons can only be made with data tables and reports released before 2006/2007.
Governance
Labour Force Survey This survey provides estimates of employment and unemployment in Canada. The main objective of the Labour Force Survey is to divide the working-age population into three mutually exclusive classifications - employed, unemployed, and not in the labour force - and to provide descriptive and explanatory data on each of these. It is a mandatory survey that collects data monthly. Data is available online from 1990 to 2013.
The Labour Force Survey questionnaire was modified and computerised in 1997 with addition of new questions, restructuring of old ones, and reformatting. The Labour Force Survey estimates are also the first of the major monthly economic data series to be released.
Reliability: The questionnaire
redesign presented opportunity to incorporate more complex question flows and an extensive set of on-line edits to check for logical inconsistencies.
Education
Employment and Inclusive Growth
Governance
Longitudinal Administrative Databank
This databank comprises a 20% sample of the annual T1 Family File and the Longitudinal Immigration Data Base. It contains many annual demographic variables about the individuals represented and annual income information for both the individual and their census family in that year. The databank provides administrative data annually, dating from 1982 to 2011.
There have been no major changes, even in terms of data collection methodology. Data are primarily collected from the T1 Family File and sampling is done at a 20% rate. The income threshold, the median and average income and income taxes in the table are all expressed in current dollars.
Users who wish to compare the statistics over time may need to convert data into constant dollar values by using, for example, the annual All-items Consumer Price Index (CANSIM table 326-0021).
Poverty
Employment and Inclusive Growth
Longitudinal Immigration Database
This is a database combines immigration and taxation records. It is a comprehensive source of data on the economic behaviour of the immigrant tax filer population in Canada. This database provides administrative data annually, dating from 1980 to 2011.
No significant changes have been made to this statistical program that affect data quality.
Not applicable. Poverty
Governance
Legal aid survey This survey collects data through an electronic survey questionnaire that is completed by the 13 provincial and territorial legal aid plans in Canada. It provides information on revenues, expenditures, and personnel and caseload statistics associated with the delivery and administration of legal aid in
No significant changes have been made to this statistical program that affect data quality.
Not applicable. Governance

169
Canada. It is a mandatory survey that collects data annually, dating from 1983 to 2011.
National Graduates Survey
This survey was designed to determine such factors as: the success rate of graduates of post-secondary programmes in obtaining employment since graduation; the relationship between the graduates' programs of study and subsequent employment; the graduates' job and career satisfaction; the rates of under-employment and unemployment; and the influence of post-secondary education on occupational achievement. It is a voluntary survey that collects data occasionally, dating from 1984 to 2013.
Over the years, there have been some instrument redesigns, sampling changes, and change in target population. The latest modification to the survey added new concepts on lifelong learning, mobility, skills and qualifications mismatch, intended occupation at graduation, student loans, debt management and sources of support during graduate school.
Relevance: The addition of new
concepts reflects the changes in society and provides a more accurate representation of the current situation for the graduates.
Education
National Household Survey
The National Household Survey (NHS) is similar to the Census long-form questionnaire, however it is voluntary. It is designed to provide information about people in Canada by their demographic, social and economic characteristics as well as provide information about the housing units in which they live. The survey will be conducted every five years. Currently, information is available for 2011.
In 2010, the mandatory long-form questionnaire was replaced by the voluntary National Household Survey.
Comparability and relevance: The new methodology was introduced quite rapidly with limited testing, making it difficult to gauge data quality and comparability. Users expressed concerns over the break in historic datasets as a result of the changes.
Poverty
Education
Employment and Inclusive Growth
Energy and Infrastructure
Governance
National Inventory Report
As a signatory to the United Nations Framework Convention on Climate Change, Canada is obligated to submit a national inventory. It provides information on key emission trends for specific sources, sectors and regions; and provides a core set of data for setting baseline emissions and further analysis. The reports are submitted annually, dating from 1990 to 2011.
No significant changes have been made to this statistical program that affect data quality.
Not applicable. Environment
National Gross Domestic Product by Income and by Expenditure Accounts
These accounts are based on the concept of Gross Domestic Product (GDP) and its components. It is a measure of aggregate economic activity that represents the unduplicated value of production in two ways: (i) incomes arising from production and (ii) final expenditures on production. It provides administrative data that are collected quarterly, available online from 1991 to 2013.
Statistical revisions are carried out regularly to ensure the most current information, from censuses, public accounts, and other surveys is taken into account. This is also done to implement improved estimation methods. Statistics Canada carries out these annual revisions which are restricted to the most recent three to four years of annual estimates. Historic or comprehensive revisions are also carried out.
Statistics Canada provides full details on the revisions it undertakes, which aim to ensure that consistent data quality and comparability between periodicities.
Employment and Inclusive Growth
Global Partnership
Pan-Canadian Assessment Program (PCAP), Council of Ministers of Education
PCAP is overseen by the Council of Ministers of Education. It gathers information through cyclical tests on student achievement in mathematics, reading and science. The PCAP collects administrative data annually. Data is available from 1996-2013.
The first PCAP assessment took place in 2007. Prior to this, the School Achievement Indicators Program (SAIP) had been in place since 1993. The provinces and territories, through CMEC, developed SAIP to assess the performance of 13- and 16-year-old students.
Comparability: PCAP and SAIP results are not intended to replace provincial and territorial assessments - which differ significantly - but rather to complement them.
Education
Postsecondary Student Information System
The Postsecondary Student Information System is a national survey that enables Statistics Canada to provide detailed information on enrolments and graduates of Canadian post-secondary institutions. It replaces a number of previous surveys and collects administrative data annually, dating from 1999 to 2012.
Up to 2008, the enrolment count excluded students enrolled in programs related to pre-employment, apprenticeship, basic training or skills upgrading, second language training, job readiness or orientation programs. However, as of 2009 the enrolment count includes these programs but still excludes apprenticeship programs.
Relevance and comparability: The inclusion of these new programs to the survey enhances coverage, as it is possible to capture information on less conventional programs. However caution should be taken in comparing and interpreting the results before and after 2008.
Education
Parliament of Canada
The History of the Federal Electoral Ridings since 1967 provides information on electoral history of Canada. Includes names of candidates, description of ridings, and electoral results. As senators are appointed, does not include information on the Senate. The Parliament of Canada provides a historical overview of the Senate which includes when changes were made to the number of seats in the Senate.
No significant changes have been made to this statistical program that affect data quality.
Not applicable. Governance

170
Registered Apprenticeship Information System
The survey compiles data on the number of registered apprentices taking in-class and on-the-job training in trades that are either Red Seal or non-Red Seal and where apprenticeship training is either compulsory or voluntary. It is a mandatory survey that collects data annually, dating from 1991 to 2012.
In 2008, the survey went through a redesign and a number of new data elements have been added and requested from the jurisdictions.
Comparability and relevance: The redesign of the survey has meant that some information is not adequately comparable. However, it also means that more information is available.
Employment and Inclusive Growth
Survey of Labour and Income Dynamics
This is the first Canadian household survey to provide national data on the fluctuations in income that a typical family or individual experiences over time. It is the primary Canadian source for income data and supplements the Labour Force Survey. It is a voluntary survey that collects data annually. Data is available online from 1991 to 2011.
In 1997, SLID replaced Survey of Consumer Finances and for reference year 2012, it was replaced by the Canadian Income Survey (CIS) - data for which are still to be released. The CIS is a cross-sectional survey and not a longitudinal one.
Reduces comparability: CIS will not capture the same datasets as SLID.
Poverty
Employment and Inclusive Growth
Survey of Household Spending
This survey primarily collects detailed information on household expenditures. It also collects information on the annual income of household members, demographic characteristics, dwelling characteristics, and information on household equipment. It is voluntary survey and data is available online from 1999 to 2012.
A new methodology, which combines a questionnaire and a diary to collect household expenditures was introduced for the 2010 survey.
Comparability: Though the
expenditure data collected since 2010 are similar to those of previous years, the changes to data collection, processing and estimation methods have created a break in the data series.
Energy and Infrastructure
Statistical Report on International Assistance, DFATD/CIDA
These datasets represent statistics on Canada's assistance disbursed by country, by fiscal year. This data is produced as part of the Government of Canada's annual Statistical Report on International Assistance and corresponds to figures presented in Section D of the report, where international assistance expenditures are broken down by channel and recipient. Figures are administrative, available from 1998 to 2010.
No significant changes have been made to this statistical program that affect data quality.
Not applicable. Global Partnership
Uniform Crime Reporting Survey (UCRS)
The survey was designed to measure the incidence of crime in Canadian society and its characteristics. Information collected by the survey includes the number of criminal incidents, the clearance status of those incidents and persons-charged information. It is a mandatory survey that collects police-reported crime statistics annually. Data is available online from 1998 to 2012.
The survey produces a continuous historical record of crime and traffic statistics reported by every police agency in Canada since 1962. In 1988, a new version of the survey was created, UCR2, in which microdata on characteristics of incidents, victims and accused are captured. Over the 2000s coverage increased significantly.
Relevance: Reporting to the survey has improved over the 2000s. No other significant changes have been made to this statistical program that affect data quality.
Governance
Vital Statistics - Death
This is a mandatory administrative survey that collects demographic and medical information annually from all provincial and territorial vital statistics registries on all deaths in Canada. It collects administrative data annually. Data is available online from 2000 to 2011.
Prior to 2010, some data were also collected on Canadian residents who die in some American states. Starting with the reference year 2010, Canadian residents who die in American states are no longer accounted for.
The change in coverage has a negligible effect on data quality.
Environment, Governance
Vital Statistics - Birth This is a mandatory administrative survey that collects demographic information annually from all provincial and territorial vital statistics registries on all live births in Canada. It collects administrative data annually, dating from 1921 to 2013.
No significant changes have been made to this statistical program that affect data quality.
Not applicable. Governance
Waste Management Industry Survey
These surveys are comprised of two separate surveys: one survey that examines waste management within the government sector and another which on the business sector. In general, both surveys provide information pertaining to waste collection, disposal and recycling quantities. Some information is also provided on the financial and employment characteristics of waste management. Both surveys collect administrative data biennially. Data is available online from 2002 to 2010.
No significant changes have been made to this statistical program that affect data quality.
Not applicable. Environment

171
Annex 4. Data Quality Assessment Framework
Table 4.1.Data quality assessment framework
Criteria Components (scale) Sub-components (scale) Relevance Completeness
Main Question: How complete are the data?
Policy requirements for data collection
Guidelines for data collection
Procedures to coordinate statistical information
Procedures to perform regular programme reviews
Advisory council to advise on statistical priorities
Availability of meta-data
User needs Main Question: Do the data correspond with user needs?
Agreements with user about the data content and priorities
Procedures to track user needs and uses of the statistics
Information about the survey objectives
Legislative requirement to consult with the user on data collection
User satisfaction Main Question: Do the data satisfy user needs?
Regular follow-ups with users to ensure user satisfaction
Periodic consultations with users to obtain feedback
Post-collection evaluations to compare data outcomes with user needs
Accuracy and reliability
Sampling and non-sampling errors Main Question: What procedures are in place to reduce sampling and non-sampling errors?
Measurement, evaluation and systematic documentation of sampling and non-sampling errors
Mechanisms to ensure survey samples closely represent the population under study
Quality assurance plan to prevent, monitor and evaluate non-sampling errors
Compilation of user feedback to assess the relevance of the statistical study for user purposes
Systematic and random errors Main Question: What procedures are in place to reduce systematic and random errors?
Systems to assess source data, intermediate results and statistical outputs
Procedures to measure and reduce errors
Regular assessment of data sources
Systematic comparison of data and results with data and results from other existing sources to ensure validity
Assessment report of statistical discrepancies in intermediate data
Revisions analyzed to improve statistical process
Revision measures Main Question: What measures are in place to revise the data?
Policies for documenting principles and procedures for data revision
Transparent and standard procedures for revising data
Periodic quality reporting on the accuracy of data collected
Public access to revision policies
Information that clearly identifies preliminary and revised data
Information that shows timely correction of errors found in published statistics
Timeliness and punctuality
Timeliness Main Question: How quickly are the data released for dissemination or further processing?
Release policy distinguishing between statistical outputs and the corresponding release procedures and timeliness targets
Compliance with timeliness targets like the International Monetary Fund data dissemination standards
Official calendar to announce advance release dates of major statistics
Attainable schedule for the production process
Maximum time allowed to elapse between the end of the reference period and the availability of the data
Procedures to ensure timely and effective flow of data from providers
Procedures to consult with users about the periodicity of the statistics
Punctuality Main Question: Whether the data are delivered according to the official due date?
Action or contingency plans to address delays in data release date
Procedures to regularly monitor the punctuality of every release as per the release calendar
Notifications provided for any divergences from the advanced release time and publication of new release dates
Formal explanations provided in the event of a delay
Accessibility and clarity
Accessibility Main Question: How easily are the data accessible?
Data dissemination strategy and policy, including clear pricing policy for governing the dissemination
Policy or guideline to ensure that the data are made available to all users (including any restrictions that may apply)
Strategies to release data, metadata and microdata
Availability of publication catalogues for users

172
Table 4.1.Data quality assessment framework
Criteria Components (scale) Sub-components (scale) Application of information and communication technology to disseminate data (in addition to hard copy publications)
Navigable website that allows users to access data and metadata and facilitates self-tabulation in a variety of formats
Periodic consultation with users to ensure dissemination formats satisfy user needs
Procedures to request data that are not readily available to the public
Clarity Main Question: How clearly are the data presented to all users?
Guidelines describing the appropriate content and preferred formats and style of the agency's outputs
Presentation of statistics that facilitate proper interpretation and meaningful comparisons
Regular production of up-to-date methodological documents and quality reports
Staff training and development programmes for writing about statistics
User support or information services for handling questions related to the data
Procedure to annotate differences between international standards, guidelines or good practices
Statistics presented in a clear and understandable manner
Explanatory texts accompany the data
Meaningful comparisons included in the publication
Metadata and microdata Main Question: How accessible and readable are the metadata and microdata?
Policies to provide documentation on concepts, scope, classifications, data sources, basis of recording, compilation methods, etc. with the release of statistical results
Procedures to ensure metadata are documented according to standardised metadata systems
Procedures to ensure metadata are updated regularly
Availability of microdata
Rules and protocols for accessing microdata
Coherence and comparability
Consistency Main Question: How consistent are the data internally or cross-sectorally?
Policy promoting cooperation and exchange of knowledge between individual statistical programmes/domains
Specific guidelines for individual statistical programmes/domains to ensure outputs obtained from complementary sources are properly combined
Process-specific procedures to ensure outputs are internally coherent
Information provided to users on the effects of changes in methodologies on final estimates
Comparability Main Question: How comparable are the data over time?
Extent to which statistics derived from different sources or different periodicities are comparable
Clear explanation and reconciliation provided for any methodological changes or differences
Analysis of the major related statistics before designing a new individual statistical programme/domain
Comparison provided with other statistical sources that contain the same or similar information (including identification of divergences with explanations)
Standardisation Main Question: Are the data produced using common standards with respect to scope, definitions, classifications and units?
Common standards for concepts, definitions, units and classifications to promote coherence, consistency and comparability of the statistics
Periodic assessment of compliance with international and national standards for statistical production
Explanation provided for any deviations from international and national standards to users
Reference made to common repository of concepts, definitions and classifications when designing a new individual statistical programme/domain
Quality reporting includes assessment of internal consistency and comparability over time

173
Annex 5. Key Resources Consulted for the
Data Quality Assessment
Table 5.1. Overarching resources consulted for the Canadian data quality assessment
Source Date URL Statistics Canada
2013-2014 Report on Plans and Priorities 2013 http://www.statcan.gc.ca/about-apercu/rpp/index-eng.html
2014/2015 Report on Plans and Priorities 2014 http://www.statcan.gc.ca/about-apercu/rpp/2014-2015/index-eng.htm
Advisory Committees 2013 http://www.statcan.gc.ca/about-apercu/relevant-pertinente-eng.htm
Departmental Performance Report 2012/2013 2013 http://www.statcan.gc.ca/about-apercu/dpr-rmr/2012-2013/index-eng.htm
Data dissemination and communication 2014 http://www.statcan.gc.ca/pub/12-539-x/2009001/dissemination-diffusion-eng.htm
Policy on Standards 2004 http://www.statcan.gc.ca/about-apercu/policy-politique/standards-normes-eng.htm
Policy on Informing Users of Data Quality and Methodology 2000 http://www.statcan.gc.ca/about-apercu/policy-politique/info_user-usager-eng.htm#d
Statistics Canada Quality Guidelines 2009 http://www.statcan.gc.ca/pub/12-539-x/12-539-x2009001-eng.pdf
Statistics Act, Department of Justice 2005 http://laws-lois.justice.gc.ca/eng/acts/S-19/FullText.html
Other sources
Auditor General Report 2013, Office of the Auditor General 2013 http://www.oag-bvg.gc.ca/internet/English/parl_oag_201304_04_e_38189.html#hd4b
“Good Data and Intelligent Government,”Munir Sheikh 2011 http://www.csls.ca/festschrift/Sheikh.pdf
Table 5.2. Instrument-specific resources consulted for the Canadian data quality assessment
Source Date ULR or contact
Annual Industrial Consumption of Energy Survey, Statistics Canada
Annual Industrial Consumption of Energy Survey - Definitions, data sources and methods
2012 http://www23.statcan.gc.ca/imdb/p2SV.pl?Function=getSurvey&SDDS=5047
Annual Income Estimates for Census Families and Individuals (T1 Family File), Statistics Canada
Annual Income Estimates for Census Families and Individuals (T1 Family File) - Definitions, data sources and methods
2012 http://www23.statcan.gc.ca/imdb/p2SV.pl?Function=getSurvey&lang=en&db=imdb&adm=8&dis=2&SDDS=4105
Statistics Canada, Labour Statistics Division, personal communication
2014 [email protected]
Statistics Canada, Income Statistics Division, personal communication
2014 [email protected] [email protected]
Climate Financing, Environment Canada
Climate Financing 2014 http://www.climatechange.gc.ca/finance/
Environment Canada, personal communication 2014
Consumer Price Index, Statistics Canada
Guide to Consumer Price Index 1996 http://www.statcan.gc.ca/pub/62-557-x/62-557-x1996001-eng.pdf
Consumer Price Index Reference Paper 1992 http://www23.statcan.gc.ca/imdb-bmdi/pub/document/2301_D4_T9_V1_B.pdf
Consumer Price Index, Statistics Canada - Definitions, data sources and methods
2014 http://www23.statcan.gc.ca/imdb-bmdi/pub/2301-eng.htm
Statistics Canada, Consumer Price Division, personal communication
2014 [email protected]
Canadian Internet Use Survey, Statistics Canada
Canadian Internet Use Survey - Definitions, data sources and methods
2007 http://www23.statcan.gc.ca/imdb/p2SV.pl?Function=getSurvey&SurvId=49557&InstaId=31495&SDDS=4432
Canadian System of Environmental and Resource Accounts - Material and Energy Flow Accounts, Statistics Canada

174
Table 5.2. Instrument-specific resources consulted for the Canadian data quality assessment
Source Date ULR or contact
Concepts, Sources, and Methods of Canadian System of Environmental and Resource Accounts
2006 http://www.cbd.int/financial/values/canada-environaccount.pdf
Canadian System of Environmental and Resource Accounts - Material and Energy Flow Accounts - Definitions, data sources and methods
2002 http://www23.statcan.gc.ca/imdb/p2SV.pl?Function=getSurvey&SurvId=22716&InstaId=30549&SDDS=5115
Canadian Environmental Sustainability Indicators, Environment Canada
Canadian Environmental Sustainability Indicators – Website 2014 http://www.ec.gc.ca/indicateurs-indicators/
Evaluation of the Canadian Environmental Sustainability Indicators (CESI) Initiative
2009 http://ec.gc.ca/doc/ae-ve/2008-09/906/906_eng.html#_21
Canadian Environmental Sustainability Indicators, Environment Canada
2006 http://publications.gc.ca/Collection/Statcan/16-251-X/16-251-XIE2006000.pdf
Environment and Sustainable Development Indicators for Canada, The National Round Table on the Environment and the Economy
2003 http://neia.org/wp-content/uploads/2013/04/sustainable-development-indicators.pdf
Civil Court Survey, Statistics Canada
Civil Court Survey - Definitions, data sources and methods 2013 http://www23.statcan.gc.ca/imdb/p2SV.pl?Function=getSurvey&SDDS=5052
Canada's International Investment Position, Statistics Canada
Reporting Guide for Canada's Balance of International Payments and Investment Position Surveys, Statistics Canada
2014 http://www23.statcan.gc.ca/imdb-bmdi/document/1537_D5_T1_V2-eng.htm
Canada's International Investment Position - Definitions, data sources and methods
2014 http://www23.statcan.gc.ca/imdb/p2SV.pl?Function=getSurvey&lang=en&db=imdb&adm=8&dis=2&SDDS=1537
Summary methodology for the production of quarterly international investment positions, Canada’s international investment position - Third quarter, Statistics Canada
2005 http://www23.statcan.gc.ca/imdb-bmdi/document/1537_D2_T9_V1-eng.pdf
Canada's International Transactions in Services, Statistics Canada
Canada's International Trade in Services: Data quality, concepts and methodology (Catalogue no 67-203), Statistics Canada
2003 http://www23.statcan.gc.ca/imdb-bmdi/document/1536_D2_T9_V1-eng.pdf
Canada's International Transactions in Services - Definitions, data sources and methods
2012 http://www23.statcan.gc.ca/imdb/p2SV.pl?Function=getSurvey&lang=en&db=imdb&adm=8&dis=2&SDDS=1536
Canada's International Merchandise Trade (Customs Basis), Statistics Canada
Data quality, concepts and methodology: Technical notes, Canadian international merchandise trade statistical program, Statistics Canada
2013 http://www23.statcan.gc.ca/imdb-bmdi/document/2201_D9_T9_V1-eng.htm
Canada's International Merchandise Trade (Customs Basis) - Definitions, data sources and methods
2014 http://www23.statcan.gc.ca/imdb/p2SV.pl?Function=getSurvey&lang=en&db=imdb&adm=8&dis=2&SDDS=2201
Census of Population, Statistics Canada
Census of Population - Reference materials - Definitions, data sources and methods
2014 http://www12.statcan.gc.ca/census-recensement/2011/ref/index-eng.cfm
Statistics Canada, Labour Statistics Division, personal communication
2014 [email protected]
Statistics Canada, Income Statistics Division, personal communication
2014 [email protected] [email protected]
Electricity Supply and Disposition - Annual, Statistics Canada
Electricity Supply and Disposition - Annual - Definitions, data sources and methods
2012 http://www23.statcan.gc.ca/imdb/p2SV.pl?Function=getSurvey&SDDS=2194&lang=en&db=imdb&adm=8&dis=2
Elementary-Secondary Education Survey, Statistics Canada
Elementary-Secondary Education Survey (ESES): Definitions Document, Statistics Canada
2013 http://www23.statcan.gc.ca/imdb-bmdi/document/5102_D2_T9_V4-eng.htm
Elementary-Secondary Education Survey - Definitions, data sources and methods
2012 http://www23.statcan.gc.ca/imdb/p2SV.pl?Function=getSurvey&SDDS=5102
Statistics Canada, Tourism and the Centre for Education Statistics Division Education, personal communication
2014 [email protected]
Fuel Consumption Survey, Statistics Canada
Fuel Consumption Survey - Definitions, data sources and methods
2012 http://www23.statcan.gc.ca/imdb/p2SV.pl?Function=getSurvey&SDDS=2749
General Survey on Consumers’ Financial Awareness, Attitudes and Behaviour, Canada Revenue Agency

175
Table 5.2. Instrument-specific resources consulted for the Canadian data quality assessment
Source Date ULR or contact
General Survey on Consumers’ Financial Awareness, Attitudes and Behaviour, Canada Revenue Agency
2006 http://www.fcac-acfc.gc.ca/Eng/resources/researchSurveys/Documents/FCAC_GenSurvExec_2006-eng.pdf
General Social Survey, Statistics Canada
The General Social Survey: An Overview 2013 http://www.statcan.gc.ca/pub/89f0115x/89f0115x2013001-eng.htm
General Social Survey - General Social Survey - Victimization - Definitions, data sources and methods
2014 http://www23.statcan.gc.ca/imdb/p2SV.pl?Function=getSurvey&SDDS=4504
Statistics Canada, Labour Statistics Division, personal communication
2014 [email protected]
Statistics Canada, Production and Dissemination Unit, personal communication
2014 [email protected]
Statistics Canada, personal communication 2014 [email protected]
Historic Project Data Set, Department of Foreign Affairs, Trade and Development
Understanding the Data, Foreign Affairs, Trade and Development Canada
2013 http://www.acdi-cida.gc.ca/acdi-cida/acdi-cida.nsf/eng/CAR-616124527-MNG
Auditor General Report 2014, Office of the Auditor General 2014 http://www.oag-bvg.gc.ca/internet/English/parl_oag_201405_08_e_39339.html
Homicide Survey, Statistics Canada
Homicide Survey - Definitions, data sources and methods 2012 http://www23.statcan.gc.ca/imdb/p2SV.pl?Function=getSurvey&SDDS=3315
Integrated Criminal Court Survey, Statistics
Integrated Criminal Court Survey - Definitions, data sources and methods
2012 http://www23.statcan.gc.ca/imdb/p2SV.pl?Function=getSurvey&SDDS=3312
Legal Aid Survey, Statistics Canada
Legal Aid in Canada: Resource and Caseload Statistics, Statistics Canada
2012 http://www.statcan.gc.ca/pub/85f0015x/2012000/technote-notetech1-eng.htm
Legal Aid Survey - Definitions, data sources and methods 2013 http://www23.statcan.gc.ca/imdb/p2SV.pl?Function=getSurvey&SDDS=3308
Longitudinal Administrative Databank, Statistics Canada
Longitudinal Administrative Databank - Definitions, data sources and methods
2011 http://www23.statcan.gc.ca/imdb/p2SV.pl?Function=getSurvey&lang=en&db=imdb&adm=8&dis=2&SDDS=4107
Statistics Canada, Labour Statistics Division, personal communication
2014 [email protected]
Statistics Canada, Income Statistics Division, personal communication
2014 [email protected] [email protected]
Longitudinal Immigration Database, Statistics Canada
Longitudinal Immigration Database : An Introduction, Citizenship and Immigration Canada
1997 http://data.library.utoronto.ca/datapub/codebooks/ceris/guide.pdf
Longitudinal Immigration Database - Definitions, data sources and methods
2011 http://www23.statcan.gc.ca/imdb-bmdi/pub/5057-eng.htm
Labour Force Survey, Statistics Canada
Comparing Income Statistics from Different Sources: Aggregate Income, Eric Olson and Karen Maser
2005 http://www.statcan.gc.ca/pub/75f0002m/75f0002m2010002-eng.pdf
Guide to the Labour Force Survey 2012 http://www.statcan.gc.ca/pub/71-543-g/71-543-g2012001-eng.pdf
Labour Force Survey - Definitions, data sources and methods
2014
http://www23.statcan.gc.ca/imdb/p2SV.pl?Function=getSurvey&SurvId=152713&InstaId=178232&SDDS=3701
Statistics Canada, Labour Statistics Division, personal communication
2014 [email protected]
National Graduates Survey, Statistics Canada
National Graduates Survey - Microdata User Guide 2005 http://data.library.utoronto.ca/datapub/codebooks/cstdli/ngs/ngs05/ngs2005gid.pdf
National Graduates Survey - Definitions, data sources and methods
2014 http://www23.statcan.gc.ca/imdb/p2SV.pl?Function=getSurvey&SDDS=5012
Statistics Canada, Tourism and the Centre for Education Statistics Division Education, personal communication
2014 [email protected]
National Gross Domestic Product by Income and by Expenditure Accounts, Statistics Canada
National Gross Domestic Product by Income and by Expenditure Accounts - Definitions, data sources and methods
2014 http://www23.statcan.gc.ca/imdb/p2SV.pl?Function=getSurvey&SDDS=1901
National Forest Inventory, Canadian Council of Forest Ministers

176
Table 5.2. Instrument-specific resources consulted for the Canadian data quality assessment
Source Date ULR or contact
National Forest Inventory, Canadian Council of Forest Ministers – Website
2014 https://nfi.nfis.org/history.php?lang=en
Monitoring Canada’s Forest: The National Forest Inventory, The Forestry Chronicle
2005 https://nfi.nfis.org/publications/articles/Monitoring_NFI_2005.pdf
National Inventory Report, Environment Canada
National Inventory Report: Greenhouse gas sources and sinks in Canada - Part 1
2013 http://publications.gc.ca/collections/collection_2013/ec/En81-4-2011-1-eng.pdf
National Inventory Report: Greenhouse gas sources and sinks in Canada - Part 2
2013 http://publications.gc.ca/collections/collection_2013/ec/En81-4-2011-2-eng.pdf
National Household Survey, Statistics Canada
National Household Survey - Reference products - Definitions, data sources and methods
2011 http://www12.statcan.gc.ca/nhs-enm/2011/ref/index-eng.cfm
Statistics Canada, Labour Statistics Division, personal communication
2014 [email protected]
Statistics Canada, Income Statistics Division, personal communication
2014 [email protected] [email protected]
Other sources on justice data
Collecting Data on Aboriginal People in the Criminal Justice System: Methods and Challenges, Karen Beattie and Rebecca Kong
2005 http://www5.statcan.gc.ca/olc-cel/olc.action?ObjId=85-564-X&ObjType=2&lang=en&limit=0
Justice Efficiencies and Access to the Justice System, Department of Justice
2013 http://www.justice.gc.ca/eng/rp-pr/csj-sjc/esc-cde/eff/p5.html
Moving Forward on Legal Aid Research on Needs and Innovative Approaches, Melina Buckley, Canadian Bar Association
2010 http://www.cba.org/cba/Advocacy/PDF/CBA%20Legal%20Aid%20Renewal%20Paper.pdf
Postsecondary Student Information System, Statistics Canada
Postsecondary Student Information System - Definitions, data sources and methods
2012 http://www23.statcan.gc.ca/imdb/p2SV.pl?Function=getSurvey&SDDS=5017
Parliament of Canada
History of Federal Ridings Since 1967 2014 http://www.parl.gc.ca/About/Parliament/FederalRidingsHistory/hfer.asp
Parliament of Canada, personal communication 2014
Registered Apprenticeship Information System, Statistics Canada
Registered Apprenticeship Information System - Definitions, data sources and methods
2012 http://www23.statcan.gc.ca/imdb/p2SV.pl?Function=getSurvey&SDDS=3154
Statistical Report on International Assistance, Canadian International Development Agency
Statistical Report on International Assistance — by Country Spending
2014 http://www.acdi-cida.gc.ca/acdi-cida/acdi-cida.nsf/eng/CAR-616135752-P3Q
Auditor General Report 2014, Office of the Auditor General 2014 http://www.oag-bvg.gc.ca/internet/English/parl_oag_201405_08_e_39339.html
Survey of Labour and Income Dynamics, Statistics Canada
Survey of Labour and Income Dynamics - Definitions, data sources and methods
2011 http://www23.statcan.gc.ca/imdb/p2SV.pl?Function=getSurvey&SDDS=3889
Statistics Canada, Labour Statistics Division, personal communication
2014 [email protected]
Statistics Canada, Income Statistics Division, personal communication
2014 [email protected] [email protected]
Survey of Employment, Payroll and Hours, Statistics Canada
Guide to the Survey of Employment, Payroll and Hours 2014 http://www.statcan.gc.ca/pub/72-203-g/72-203-g2014001-eng.htm
Survey of Employment, Payroll and Hours - Definitions, data sources and methods
2014 http://www23.statcan.gc.ca/imdb/p2SV.pl?Function=getSurvey&SDDS=2612
Survey of Household Spending, Statistics Canada
User Guide for the Survey of Household 2012 http://www.statcan.gc.ca/pub/62f0026m/2014001/part-partie1-eng.htm#h2_6
Survey of Household Spending - Definitions, data sources and methods
2012 http://www23.statcan.gc.ca/imdb/p2SV.pl?Function=getSurvey&SDDS=3508
Statistics Canada, Income Statistics Division, personal communication
2014 [email protected] [email protected]
Transition Home Survey, Statistics Canada
Transition Home Survey - Definitions, data sources and methods
2012 http://www23.statcan.gc.ca/imdb/p2SV.pl?Function=getSurvey&SDDS=3328
Uniform Crime Reporting Survey, Statistics Canada

177
Table 5.2. Instrument-specific resources consulted for the Canadian data quality assessment
Source Date ULR or contact
Uniform Crime Reporting Survey - Definitions, data sources and methods
2013 http://www23.statcan.gc.ca/imdb/p2SV.pl?Function=getSurvey&SDDS=3302
Measuring Violence Against Women: Statistical Trends, Holly Johnson
2006 http://www5.statcan.gc.ca/olc-cel/olc.action?ObjId=85-570-X&ObjType=2&lang=en&limit=0
Vital Statistics, Statistics Canada
Vital Statistics- Birth Database - Definitions, data sources and methods
2011 http://www23.statcan.gc.ca/imdb/p2SV.pl?Function=getSurvey&lang=en&db=imdb&adm=8&dis=2&SDDS=3231
Vital Statistics- Death Database - Definitions, data sources and methods
2011 http://www23.statcan.gc.ca/imdb/p2SV.pl?Function=getSurvey&SurvId=144261&InstaId=144294&SDDS=3233#a4
Waste Management Industry Survey, Statistics Canada
Waste Management Industry Survey: Business and Government Sectors
2010 http://www.statcan.gc.ca/pub/16f0023x/16f0023x2013001-eng.pdf
Waste Management Industry Survey: Business Sector - Definitions, data sources and methods
2012 http://www23.statcan.gc.ca/imdb/p2SV.pl?Function=getSurvey&SDDS=2009
Waste Management Industry Survey: Government Sector - Definitions, data sources and methods
2012 http://www23.statcan.gc.ca/imdb/p2SV.pl?Function=getSurvey&SDDS=1736

178
Published on 23May 2014
Centre for Policy Dialogue (CPD)
House 40/C, Road 32, Dhanmondi R/A Dhaka 1209, Bangladesh
Telephone: (+88 02) 8124770, 9141734, 9141703 Fax: (+88 02) 8130951 Web: http://cpd.org.bd/
E-mail: [email protected]
The North-South Institute 100 Argyle Avenue, Suite 200
Ottawa, Ontario K2P 1B6, Canada Telephone: 613-241-3535
Fax: 613-241-7435 E-mail: [email protected]
Web: https://www.nsi-ins.ca/
Southern Voice on Post-MDG International Development Goals
House 40/C, Road 32, Dhanmondi R/A Dhaka 1209, Bangladesh
Telephone: (+88 02) 8124770, 9141734, 9141703 Fax: (+88 02) 8130951
Web: http://southernvoice-postmdg.org E-mail: [email protected]
Published on 25 February 2015
Centre for Policy Dialogue (CPD)
House 40/C, Road 32, Dhanmondi R/A Dhaka 1209, Bangladesh
Telephone: (+88 02) 8124770, 9141734, 9141703 Fax: (+88 02) 8130951
E-mail: [email protected] Web: http://cpd.org.bd/
The Norman Paterson School of International Affairs 5306 River Building
1125 Colonel By Drive Ottawa, Ontario K1S 5B6 Canada
Telephone: 613-520-6655 Fax: 613-520-2889
E-mail: [email protected] Web: https://carleton.ca/npsia/
Southern Voice on Post-MDG International Development Goals
House 40/C, Road 32, Dhanmondi R/A Dhaka 1209, Bangladesh
Telephone: (+88 02) 8124770, 9141734, 9141703 Fax: (+88 02) 8130951
E-mail: [email protected]
Web: http://southernvoice-postmdg.org