canada, montreal
DESCRIPTION
urbanism, brain powered economyTRANSCRIPT
GREATER MONTRÉAL
ATTRACTIVENESS INDICATORS 2011-2012
A BRAINPOWEREDECONOMY
SET-UP OR EXPANSION PROJECT IN GREATER MONTRÉAL?
As a one-stop organization, Montréal International (MI) offers a wide range of customized, free and confi dential services. The organization relies on the expertise of some fi fty professionals, all of whom are specialists in their respective fi eld.
OUR MISSION:
MI is a non-profi t organization created in 1996 as a result of a private-public partnership. Its mission is to contribute to the economic development of Greater Montréal and enhance its international status. MI is funded by some 100 mem-bers from the private and institutional sectors, as well as the Governments of Canada and Québec, the Communauté Métropolitaine de Montréal and the City of Montréal.
OUR MANDATES:
/ Attract, retain and expand foreign direct investment
/ Attract, retain and expand international organizations
/ Attract, welcome and retain foreign talent
/ Promote and reinforce Greater Montréal’s economic attractiveness and international status
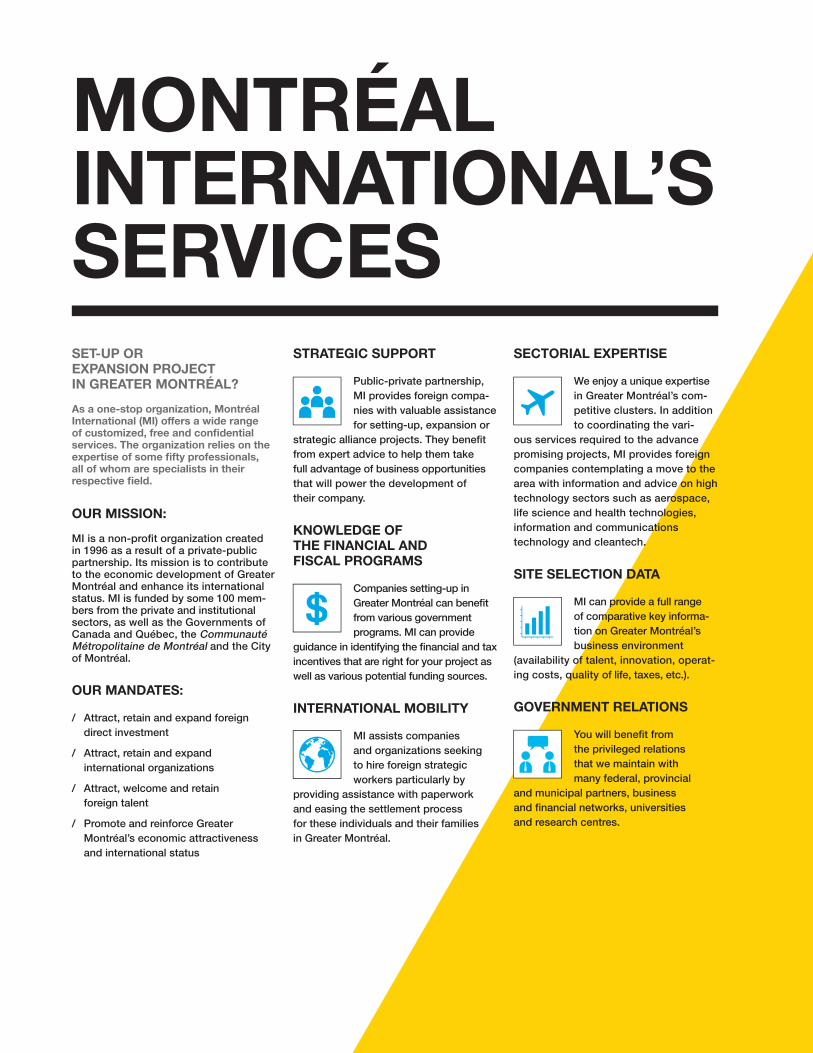
MONTRÉAL INTERNATIONAL’S SERVICES
STRATEGIC SUPPORT
Public-private partnership, MI provides foreign compa-nies with valuable assistance for setting-up, expansion or
strategic alliance projects. They benefi t from expert advice to help them take full advantage of business opportunities that will power the deve lopment of their company.
KNOWLEDGE OF THE FINANCIAL AND FISCAL PROGRAMS
Companies setting-up in Greater Montréal can benefi t from various government programs. MI can provide
guidance in identifying the fi nancial and tax incentives that are right for your project as well as various potential funding sources.
INTERNATIONAL MOBILITY
MI assists companies and organizations seeking to hire foreign strategic workers particularly by
providing assistance with paperwork and easing the settlement process for these individuals and their families in Greater Montréal.
SECTORIAL EXPERTISE
We enjoy a unique expertise in Greater Montréal’s com-petitive clusters. In addition to coordinating the vari-
ous services required to the advance promising projects, MI provides foreign companies contemplating a move to the area with information and advice on high technology sectors such as aerospace, life science and health technologies, information and communications technology and cleantech.
SITE SELECTION DATA
MI can provide a full range of comparative key informa-tion on Greater Montréal’s business environment
(availability of talent, innovation, operat-ing costs, quality of life, taxes, etc.).
GOVERNMENT RELATIONS
You will benefi t from the privileged relations that we maintain with many federal, provincial
and municipal partners, business and fi nancial networks, universities and research centres.
TABLE OF CONTENTSSUMMARY 4
01 / MARKET ACCESS
Greater Montréal – An Integral Part of the North American Market
Highlights 61.1 Information on the Area 71.2 Canada – A Natural Springboard
to the North American Market 101.3 Greater Montréal –
Strategic Transportation Infrastructure 11
02 / WORKFORCE
Greater Montréal – A Wide Array of Talent for Business and Industry
Highlights 122.1 Greater Montréal –
Canada’s University Capital 132.2 A Solid and Flexible Labour Market 152.3 A Multicultural Labour Force 172.4 A Linguistic Mosaic 18
03 / COSTS
Greater Montréal – The Most Competitive Operating Costs of Any Large North American Metropolitan Area
Highlights 193.1 Total Operation Costs 203.2 Labour Costs 213.3 Facilities Costs 223.4 Electricity Costs 23
04 / TAXES AND INCENTIVES
Greater Montréal – A Tax Burden among the Most Competitive in North America
Highlights 244.1 Corporate Taxes 254.2 Main Corporate Financial
and Tax Incentives 27
05 / INNOVATION
Greater Montréal – A Unique Blend of Creativity, Diversity and High Technology
Highlights 33 5.1 Solid High Technology Clusters 34 5.2 A Critical Mass of High
Technology Talent 35 5.3 Major Foreign Investment
in High Technology 36 5.4 An Ideal R&D Environment
for Businesses 37 5.5 A Thriving North American
Venture Capital Market 38
06 / QUALITY OF LIFE
Greater Montréal – A City with a Human Dimension and a Great Place to Live, Work and Enjoy Life
Highlights 39 6.1 An Exceptional Quality of Life 40 6.2 Superior Purchasing Power 42
APPENDICES
Appendix A: Sample of Announced Private-Sector Industrial Investment Projects 44
Appendix B: Sources 46 Appendix C: Methodological Notes 48
CREDITS 54
TABLE OF CONTENTSSUMMARY 4
01 / MARKET ACCESS
Greater Montréal – An Integral Part of the North American Market
Highlights 61.1 Information on the Area 71.2 Canada – A Natural Springboard
to the North American Market 101.3 Greater Montréal –
Strategic Transportation Infrastructure 11
02 / WORKFORCE
Greater Montréal – A Wide Array of Talent for Business and Industry
Highlights 122.1 Greater Montréal –
Canada’s University Capital 132.2 A Solid and Flexible Labour Market 152.3 A Multicultural Labour Force 172.4 A Linguistic Mosaic 18
03 / COSTS
Greater Montréal – The Most CompetitiveOperating Costs of Any Large North AmericanMetropolitan Area
Highlights 193.1 Total Operation Costs 203.2 Labour Costs 213.3 Facilities Costs 223.4 Electricity Costs 23
04 / TAXES AND INCENTIVES
Greater Montréal – A Tax Burden among the Most Competitive in North America
Highlights 244.1 Corporate Taxes 254.2 Main Corporate Financial
and Tax Incentives 27
05 / INNOVATION
Greater Montréal – A Unique Blend of Creativity, Diversity and High Technology
Highlights 335.1 Solid High Technology Clusters 345.2 A Critical Mass of High
Technology Talent 355.3 Major Foreign Investment
in High Technology 365.4 An Ideal R&D Environment
for Businesses 375.5 A Thriving North American
Venture Capital Market 38
06 / QUALITY OF LIFE
Greater Montréal – A City witha Human Dimension and a Great Place to Live, Work and Enjoy Life
Highlights 396.1 An Exceptional Quality of Life 406.2 Superior Purchasing Power 42
APPENDICES
Appendix A: Sample of Announced Private-Sector Industrial Investment Projects 44
Appendix B: Sources 46 Appendix C: Methodological Notes 48
CREDITS 54
4 / Montréal International
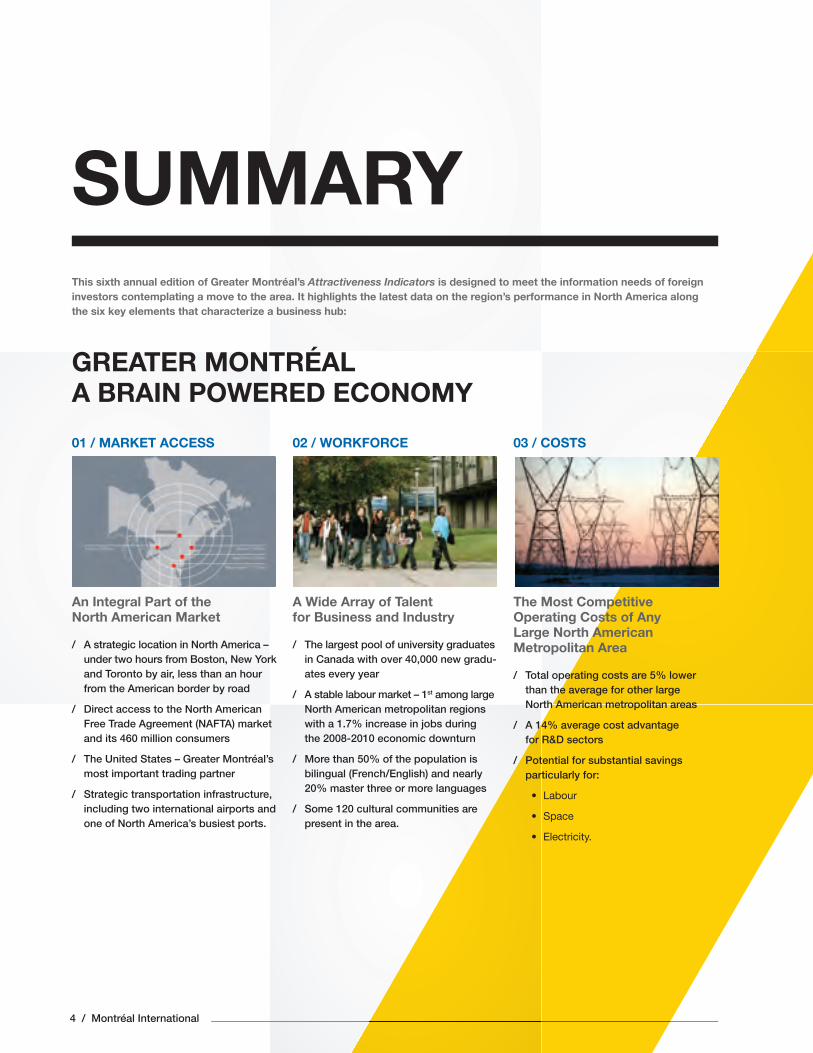
This sixth annual edition of Greater Montréal’s Attractiveness Indicators is designed to meet the information needs of foreign investors contemplating a move to the area. It highlights the latest data on the region’s performance in North America along the six key elements that characterize a business hub:
SUMMARY
01 / MARKET ACCESS
An Integral Part of the North American Market
/ A strategic location in North America – under two hours from Boston, New York and Toronto by air, less than an hour from the American border by road
/ Direct access to the North American Free Trade Agreement (NAFTA) market and its 460 million consumers
/ The United States – Greater Montréal’s most important trading partner
/ Strategic transportation infrastructure, including two international airports and one of North America’s busiest ports.
02 / WORKFORCE
A Wide Array of Talent for Business and Industry
/ The largest pool of university graduates in Canada with over 40,000 new gradu-ates every year
/ A stable labour market – 1st among large North American metropolitan regions with a 1.7% increase in jobs during the 2008-2010 economic downturn
/ More than 50% of the population is bilingual (French/English) and nearly 20% master three or more languages
/ Some 120 cultural commu nities are present in the area.
03 / COSTS
The Most Competitive Operating Costs of Any Large North American Metropolitan Area
/ Total operating costs are 5% lower than the average for other large North American metropolitan areas
/ A 14% average cost advantage for R&D sectors
/ Potential for substantial savings particularly for:
• Labour
• Space
• Electricity.
GREATER MONTRÉAL A BRAIN POWERED ECONOMY
Attractiveness Indicators 2011-2012 / 5
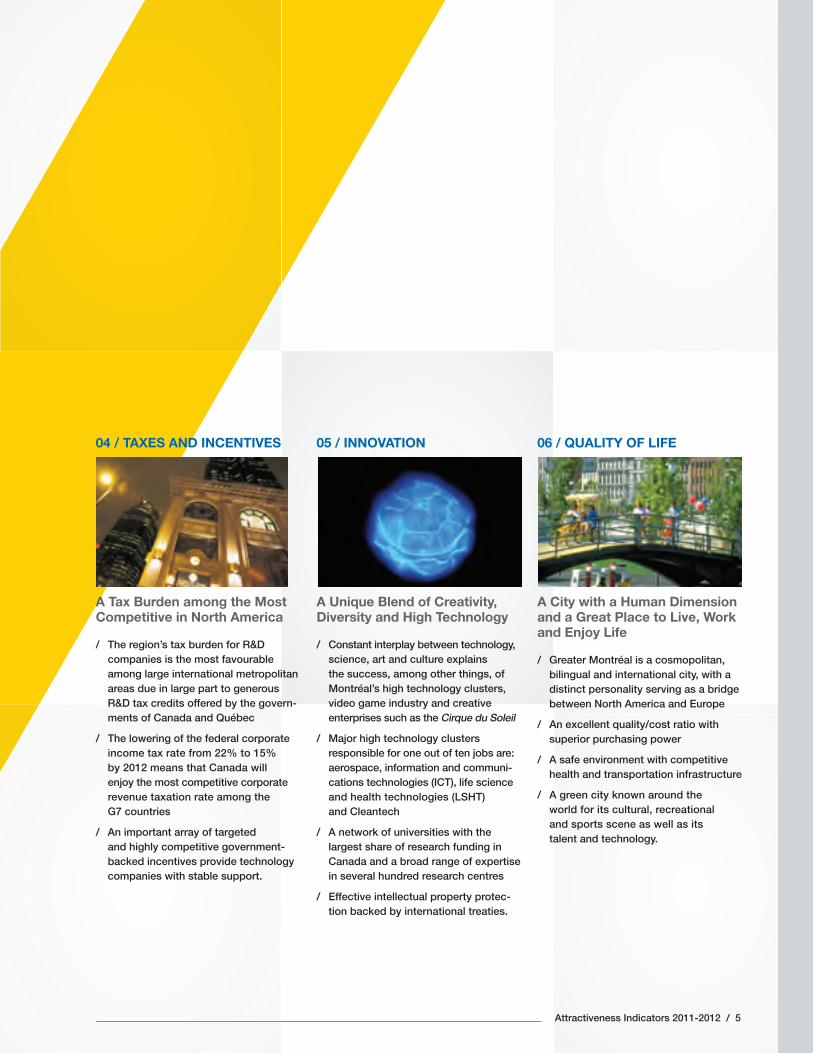
04 / TAXES AND INCENTIVES
A Tax Burden among the Most Competitive in North America
/ The region’s tax burden for R&D companies is the most favourable among large international metropolitan areas due in large part to generous R&D tax credits offered by the govern-ments of Canada and Québec
/ The lowering of the federal corporate income tax rate from 22% to 15% by 2012 means that Canada will enjoy the most competitive corporate revenue taxation rate among the G7 countries
/ An important array of targeted and highly competitive government-backed incentives provide technology companies with stable support.
05 / INNOVATION
A Unique Blend of Creativity, Diversity and High Technology
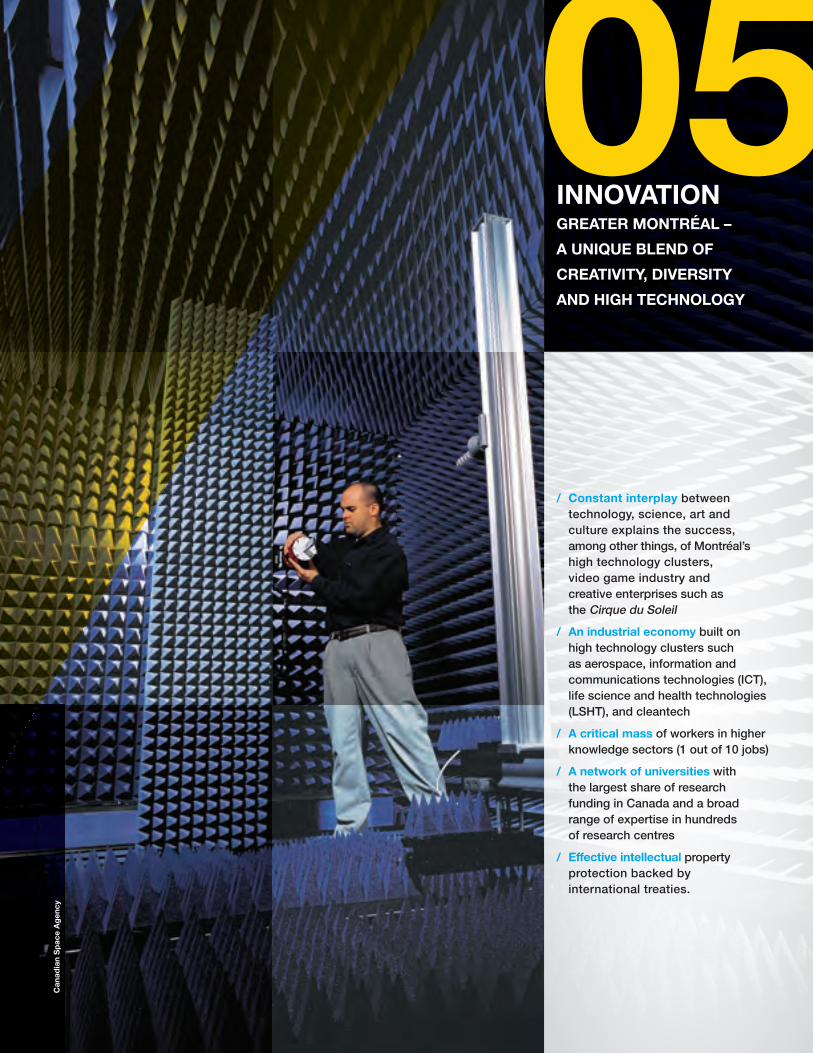
/ Constant interplay between technology, science, art and culture explains the success, among other things, of Montréal’s high technology clusters, video game industry and creative enterprises such as the Cirque du Soleil
/ Major high technology clusters responsible for one out of ten jobs are: aerospace, information and communi-cations technologies (ICT), life science and health technologies (LSHT) and Cleantech
/ A network of universities with the largest share of research funding in Canada and a broad range of expertise in several hundred research centres
/ Effective intellectual property protec-tion backed by international treaties.
06 / QUALITY OF LIFE
A City with a Human Dimension and a Great Place to Live, Work and Enjoy Life
/ Greater Montréal is a cosmopolitan, bilingual and international city, with a distinct personality serving as a bridge between North America and Europe
/ An excellent quality/cost ratio with superior purchasing power
/ A safe environment with competitive health and transportation infrastructure
/ A green city known around the world for its cultural, recreational and sports scene as well as its talent and technology.
Po
rt o
f M
ont
réal
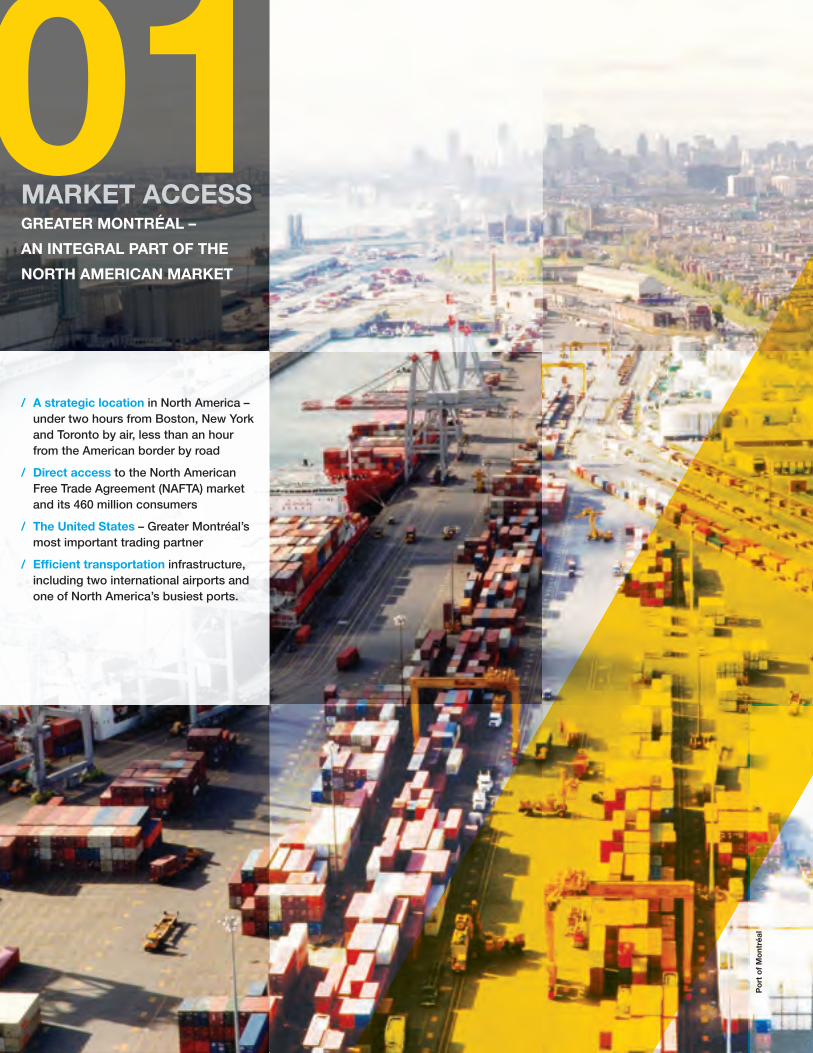
MARKET ACCESSGREATER MONTRÉAL –
AN INTEGRAL PART OF THE
NORTH AMERICAN MARKET
01/ A strategic location in North America –
under two hours from Boston, New York and Toronto by air, less than an hour from the American border by road
/ Direct access to the North American Free Trade Agreement (NAFTA) market and its 460 million consumers
/ The United States – Greater Montréal’s most important trading partner
/ Effi cient transportation infrastructure, including two international airports and one of North America’s busiest ports.
Attractiveness Indicators 2011-2012 / 7
1 Source: The Conference Board of Canada and Statistics Canada2 Source: Unless otherwise indicated, $ and ¢ signs refer to CA $3 Source: The Brookings Institution, London School of Economics and Political Science and Deutsche Bank Research, City of Montréal
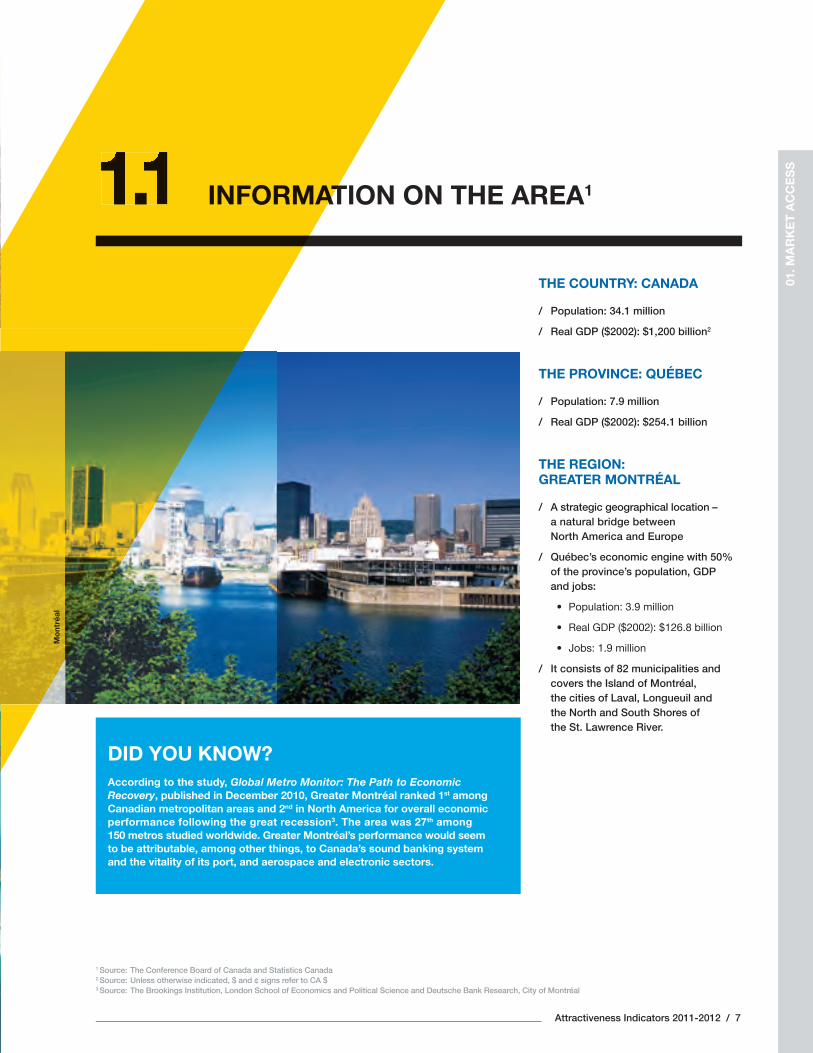
INFORMATION ON THE AREA11.11.1THE COUNTRY: CANADA
/ Population: 34.1 million
/ Real GDP ($2002): $1,200 billion2
THE PROVINCE: QUÉBEC
/ Population: 7.9 million
/ Real GDP ($2002): $254.1 billion
THE REGION: GREATER MONTRÉAL
/ A strategic geographical location – a natural bridge between North America and Europe
/ Québec’s economic engine with 50% of the province’s population, GDP and jobs:
• Population: 3.9 million
• Real GDP ($2002): $126.8 billion
• Jobs: 1.9 million
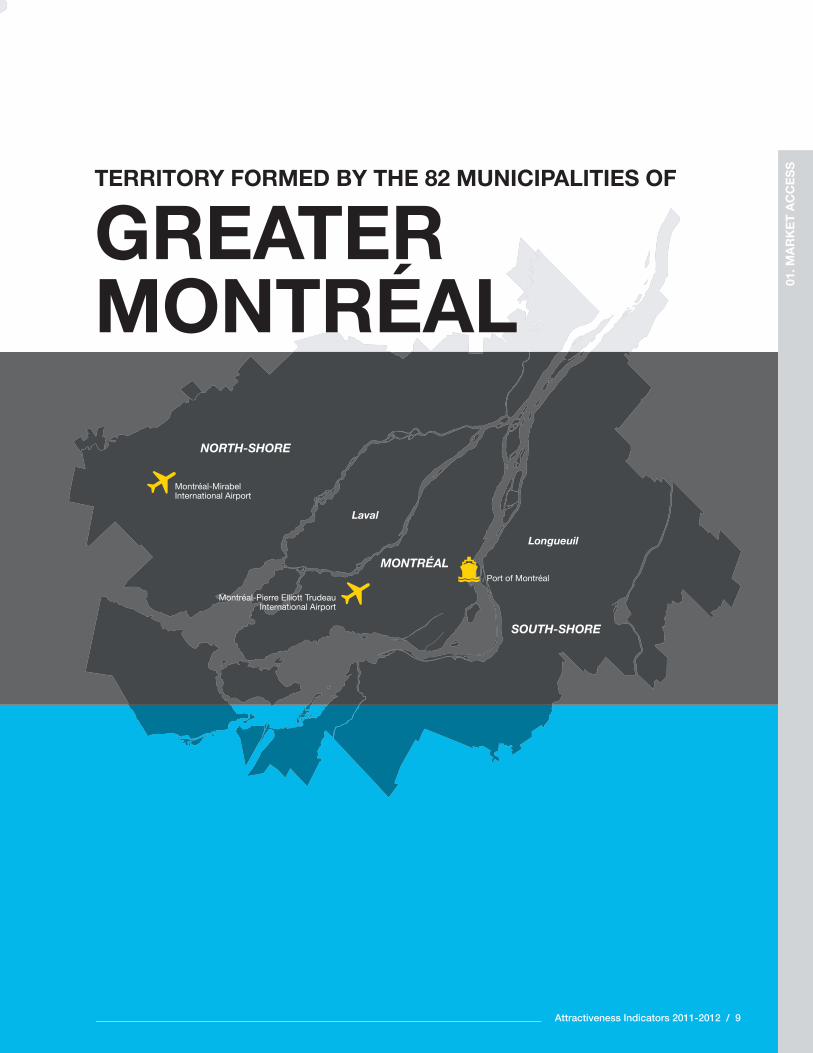
/ It consists of 82 municipalities and covers the Island of Montréal, the cities of Laval, Longueuil and the North and South Shores of the St. Lawrence River.
INFORMAT1.11.1
01. M
AR
KE
T A
CC
ES
S
DID YOU KNOW?According to the study, Global Metro Monitor: The Path to Economic Recovery, published in December 2010, Greater Montréal ranked 1st among Canadian metropolitan areas and 2nd in North America for overall economic performance following the great recession3. The area was 27th among 150 metros studied worldwide. Greater Montréal’s performance would seem to be attributable, among other things, to Canada’s sound banking system and the vitality of its port, and aerospace and electronic sectors.
Mo
ntré
al
8 / Montréal International
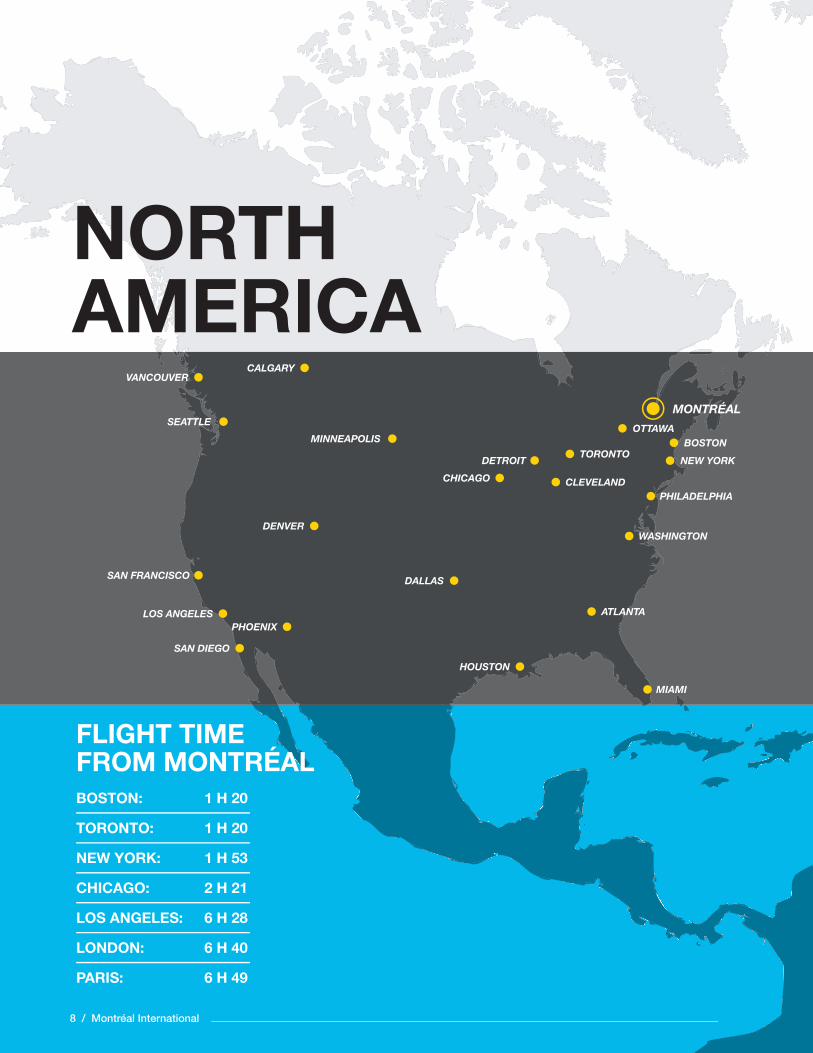
FLIGHT TIME FROM MONTRÉAL
HOUSTON
MONTRÉAL
OTTAWABOSTON
NEW YORK
PHILADELPHIA
WASHINGTON
ATLANTA
DALLAS
CLEVELAND
MINNEAPOLIS
TORONTO
MIAMI
BOSTON: 1 H 20
TORONTO: 1 H 20
NEW YORK: 1 H 53
CHICAGO: 2 H 21
LOS ANGELES: 6 H 28
LONDON: 6 H 40
PARIS: 6 H 49
CHICAGO
DENVER
PHOENIX
SAN DIEGO
LOS ANGELES
SAN FRANCISCO
VANCOUVERCALGARY
DETROIT
SEATTLE
NORTH AMERICA
Attractiveness Indicators 2011-2012 / 9
TERRITORY FORMED BY THE 82 MUNICIPALITIES OF
GREATER MONTRÉAL
NORTH-SHORE
SOUTH-SHORE
MONTRÉAL
Montréal-Mirabel International Airport
Montréal-Pierre Elliott Trudeau International Airport
Port of Montréal
Longueuil
Laval
01. M
AR
KE
T A
CC
ES
S
Mo
ntré
al-T
rud
eau
Air
po
rt
10 / Montréal International
“
CANADA – A NATURAL SPRINGBOARD TO THE NORTH AMERICAN MARKET 1.2
DIRECT ACCESS TO THE NORTH AMERICAN FREE TRADE AGREEMENT (NAFTA) MARKET
/ Approximately 460 million consumers and a GDP of US$17 trillion4
A FREE FLOW OF GOODS ACROSS NATIONAL BORDERS
/ One of the most effi cient border inspection systems in the world – usual wait time of less than ten minutes5.
THE UNITED STATES – GREATER MONTRÉAL’S LARGEST TRADING PARTNER6
/ The value of Greater Montréal’s exports to the United States (US) was over $30 billion in 2007, or nearly 60% of all of Québec’s exports to the US
/ The value of Greater Montréal’s exports to European Union (EU): almost $6 billion in 2007, or 70% of all of Québec’s exports to the EU
DIVERSIFICATION OF FREE-TRADE AGREEMENTS
/ The signing of free trade agreements between Canada and several countries (or groups of countries): the European Free Trade Association (EFTA), Chile, Columbia, Costa Rica, Israel, Jordan, Panama and Peru.
4 Source: Invest in Canada5 Source: Invest in Canada6 Source: Institut de la statistique du Québec
”
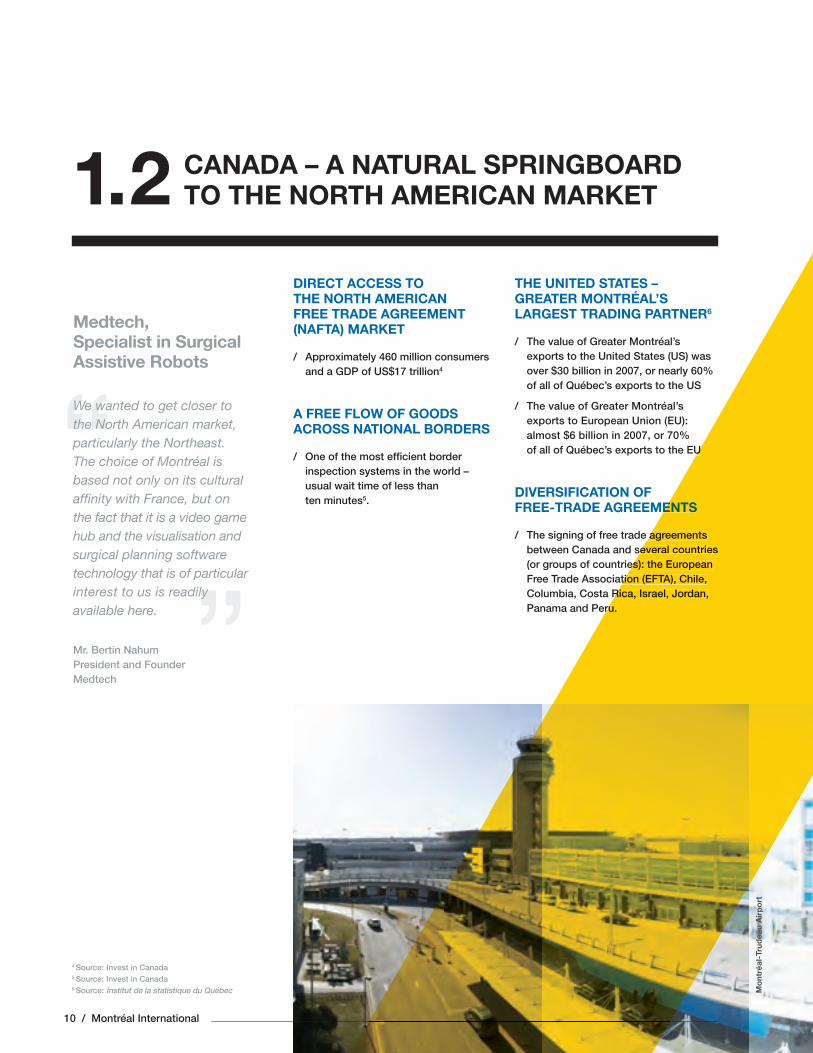
Medtech, Specialist in Surgical Assistive Robots
We wanted to get closer to the North American market, particularly the Northeast. The choice of Montréal is based not only on its cultural affi nity with France, but on the fact that it is a video game hub and the visualisation and surgical planning software technology that is of particular interest to us is readily available here.
Mr. Bertin NahumPresident and FounderMedtech
U
ENTS
agreementseveral countries
es): the European tion (EFTA), Chile,
Rica, Israel, Jordan, ru.
Attractiveness Indicators 2011-2012 / 11
GREATER MONTRÉAL – STRATEGIC TRANSPORTATION INFRASTRUCTURE 1.3
7 Source: Aéroports de Montréal8 Source: Port of Montréal9 Source: The World Economic Forum and Invest in Canada
GREATER MTRANSPO1.3
DID YOU KNOW?Canada is known for9:
/ The most favourable business environment forecast for 2011-2015: 1st among G7 countries and 7th among 82 countries (The Economist Intelligence Unit, 2011)
/ Market access, border management, transportation and communications infrastructure and business environment:1st among G7 countries and 8th among 125 countries measured on the Enabling Trade Index in 2010 (The World Economic Forum, 2010)
/ The least amount of paperwork required for exporting goods: 2nd among 125 countries (The World Economic Forum, 2010)
/ The fewest procedures required for creating an enterprise: 1st among 183 countries (The World Bank, 2010).
TWO MAJOR INTERNATIONAL AIRPORTS7
/ Montréal-Pierre-Elliott Trudeau International Airport
• Main Canadian airport east of the Great Lakes
• Natural hub for traffi c between North America and Europe
• Over 40 airlines, most of which are major North American or European carriers present
• 130 non-stop destinations in Canada, the United States and around the world
• Nearly 13 million passengers in 2010, a 6.1% increase over the year 2009.
/ Montréal-Mirabel International Airport
• A 24-hour, all-cargo airport
• Some of the best operating condi-tions in the American Northeast – no curfew, no congestion
• Regularly used by some 20 carriers and traffi c is growing
Nearly 200,000 of metric tons of goods transit through these two airports annually.
THE PORT OF MONTRÉAL – ONE OF THE WORLD’S BUSIEST8
/ Located on the Saint Lawrence River, 1,600 km from the Atlantic Ocean
/ The most important container port in Eastern Canada and 9th largest in North America
/ Served by seven of the world’s ten largest container lines
/ Recognized for its effi ciency in container transfer to and from ships, trains and trucks
/ Annual cargo volume of 25.9 metric tons in 2010, up by 5.7% over 2009.
01. M
AR
KE
T A
CC
ES
S
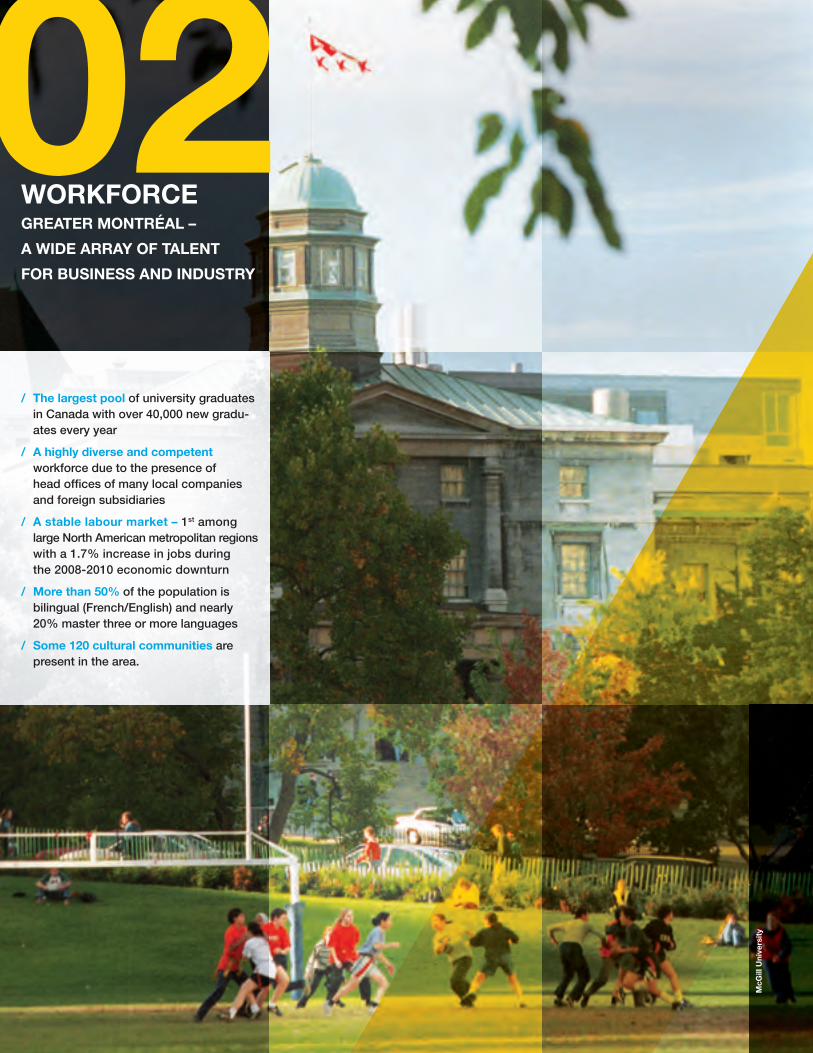
WORKFORCE GREATER MONTRÉAL –
A WIDE ARRAY OF TALENT
FOR BUSINESS AND INDUSTRY
02/ The largest pool of university graduates
in Canada with over 40,000 new gradu-ates every year
/ A highly diverse and competent workforce due to the presence of head offi ces of many local companies and foreign subsidiaries
/ A stable labour market – 1st among large North American metropolitan regions with a 1.7% increase in jobs during the 2008-2010 economic downturn
/ More than 50% of the population is bilingual (French/English) and nearly 20% master three or more languages
/ Some 120 cultural communities are present in the area.
McG
ill U
nive
rsit
y
Attractiveness Indicators 2011-2012 / 13
GREATER MONTRÉAL – CANADA’S UNIVERSITY CAPITAL 2.1
6%
5%
4%
3%
2%
1%
0%
Min
neap
olis
Mon
tréal
D
enve
rB
osto
nW
ashi
ngto
nPh
ilade
lphi
aSa
n D
iego
New
Yor
kD
etro
itC
hica
goM
iam
iC
leve
land
San
Fran
cisc
oTo
ront
o Ph
oeni
xLo
s An
gele
sAt
lant
aD
alla
sSe
attle
Hou
ston
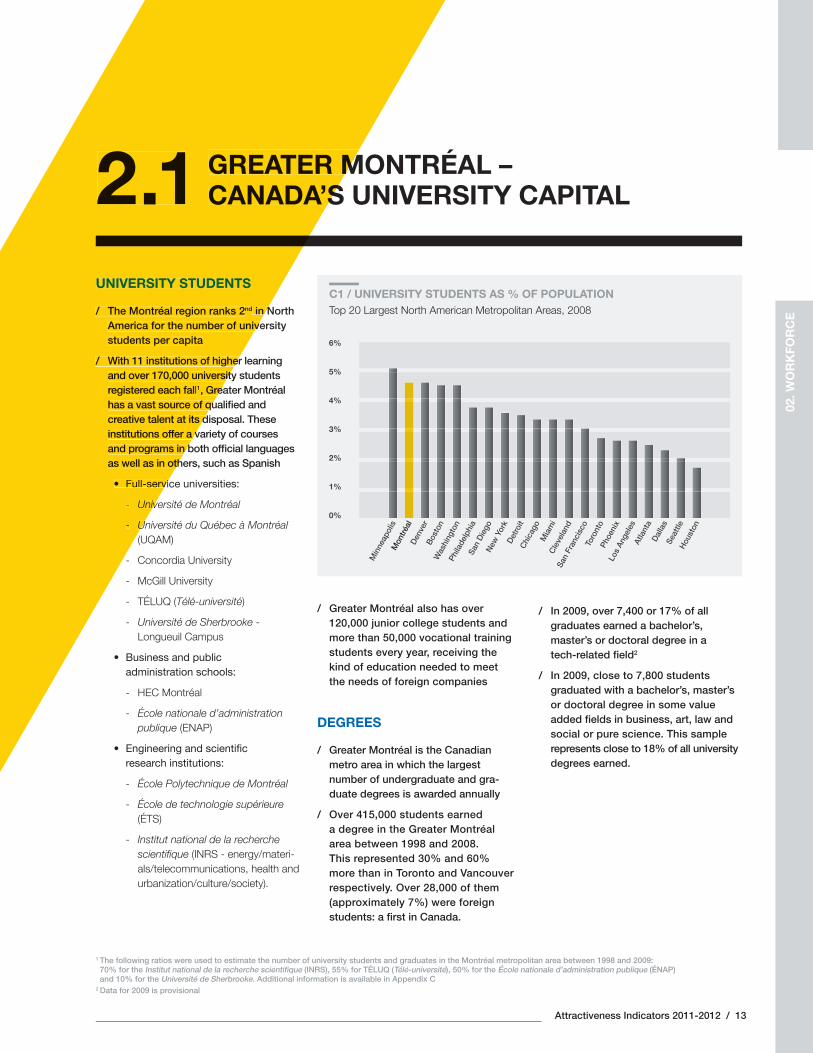
C1 / UNIVERSITY STUDENTS AS % OF POPULATIONTop 20 Largest North American Metropolitan Areas, 2008
/ Greater Montréal also has over 120,000 junior college students and more than 50,000 vocational training students every year, receiving the kind of education needed to meet the needs of foreign companies
DEGREES
/ Greater Montréal is the Canadian metro area in which the largest number of undergraduate and gra-duate degrees is awarded annually
/ Over 415,000 students earned a degree in the Greater Montréal area between 1998 and 2008. This represented 30% and 60% more than in Toronto and Vancouver respectively. Over 28,000 of them (approximately 7%) were foreign students: a fi rst in Canada.
/ In 2009, over 7,400 or 17% of all graduates earned a bachelor’s, master’s or doctoral degree in a tech-related fi eld2
/ In 2009, close to 7,800 students graduated with a bachelor’s, master’s or doctoral degree in some value added fi elds in business, art, law and social or pure science. This sample represents close to 18% of all university degrees earned.
UNIVERSITY STUDENTS
/ The Montréal region ranks 2nd in North America for the number of university students per capita
/ With 11 institutions of higher learning and over 170,000 university students registered each fall1, Greater Montréal has a vast source of qualifi ed and creative talent at its disposal. These institutions offer a variety of courses and programs in both offi cial languages as well as in others, such as Spanish
• Full-service universities:
- Université de Montréal
- Université du Québec à Montréal (UQAM)
- Concordia University
- McGill University
- TÉLUQ (Télé-université)
- Université de Sherbrooke - Longueuil Campus
• Business and public administration schools:
- HEC Montréal
- École nationale d’administration publique (ENAP)
• Engineering and scientifi c research institutions:
- École Polytechnique de Montréal
- École de technologie supérieure (ÉTS)
- Institut national de la recherche scientifi que (INRS - energy/materi-als/telecommunications, health and urbanization/culture/society).
02. W
OR
KFO
RC
E
1 The following ratios were used to estimate the number of university students and graduates in the Montréal metropolitan area between 1998 and 2009: 70% for the Institut national de la recherche scientifi que (INRS), 55% for TÉLUQ (Télé-université), 50% for the École nationale d’administration publique (ÉNAP) and 10% for the Université de Sherbrooke. Additional information is available in Appendix C
2 Data for 2009 is provisional
GREATER MCANADA’S2.1
UNIVERSITY STUDENTS
/ The Montréal region ranks 2nd in NAmerica for the number of univestudents per capita
/ With 11 institutions of higherand over 170,000 universityregistered each fall1, Grehas a vast source of qucreative talent at its dinstitutions offer a vand programs in bas well as in oth
• Full-servi
- Univ
- U
14 / Montréal International
3 Source: École Polytechnique de Montréal4 Source: Concordia University5 Source: McGill University6 Source: Université de Montréal7 Source: National Design and Animation Centre (NAD)8 Source: École de technologie supérieure (ÉTS)
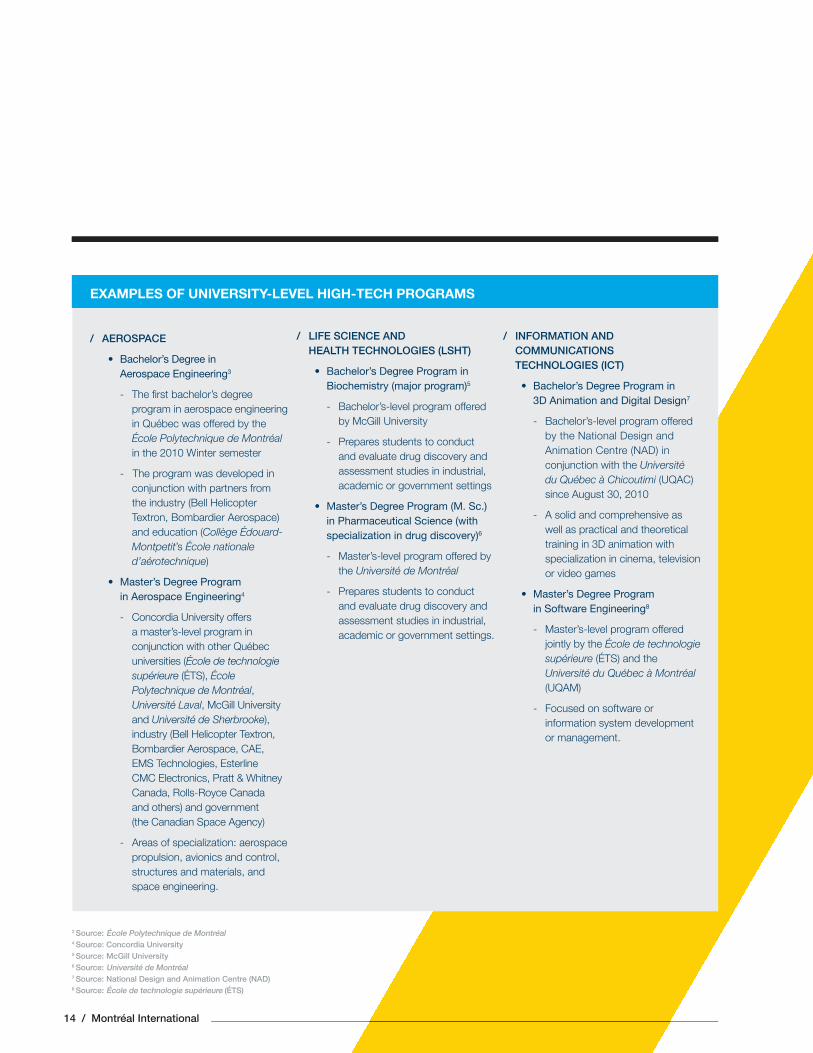
/ AEROSPACE
• Bachelor’s Degree in Aerospace Engineering3
- The fi rst bachelor’s degree program in aerospace engineering in Québec was offered by the École Polytechnique de Montréal in the 2010 Winter semester
- The program was developed in conjunction with partners from the industry (Bell Helicopter Textron, Bombardier Aerospace) and education (Collège Édouard-Montpetit’s École nationale d’aérotechnique)
• Master’s Degree Program in Aerospace Engineering4
- Concordia University offers a master’s-level program in conjunction with other Québec universities (École de technologie supérieure (ÉTS), École Polytechnique de Montréal, Université Laval, McGill University and Université de Sherbrooke), industry (Bell Helicopter Textron, Bombardier Aerospace, CAE, EMS Technologies, Esterline CMC Electronics, Pratt & Whitney Canada, Rolls-Royce Canada and others) and government (the Canadian Space Agency)
- Areas of specialization: aerospace propulsion, avionics and control, structures and materials, and space engineering.
/ LIFE SCIENCE AND HEALTH TECHNOLOGIES (LSHT)
• Bachelor’s Degree Program in Biochemistry (major program)5
- Bachelor’s-level program offered by McGill University
- Prepares students to conduct and evaluate drug discovery and assessment studies in industrial, academic or government settings
• Master’s Degree Program (M. Sc.) in Pharmaceutical Science (with specialization in drug discovery)6
- Master’s-level program offered by the Université de Montréal
- Prepares students to conduct and evaluate drug discovery and assessment studies in industrial, academic or government settings.
/ INFORMATION AND COMMUNICATIONS TECHNOLOGIES (ICT)
• Bachelor’s Degree Program in 3D Animation and Digital Design7
- Bachelor’s-level program offered by the National Design and Animation Centre (NAD) in conjunction with the Université du Québec à Chicoutimi (UQAC) since August 30, 2010
- A solid and comprehensive as well as practical and theoretical training in 3D animation with specialization in cinema, television or video games
• Master’s Degree Program in Software Engineering8
- Master’s-level program offered jointly by the École de technologie supérieure (ÉTS) and the Université du Québec à Montréal (UQAM)
- Focused on software or information system development or management.
EXAMPLES OF UNIVERSITY-LEVEL HIGH-TECH PROGRAMS
Attractiveness Indicators 2011-2012 / 15
Toro
nto
New
Yor
kM
ontré
alLo
s An
gele
sC
hica
goB
osto
nVa
ncou
ver
San
Fran
cisc
oPh
ilade
lphi
aAt
lant
aD
alla
sSa
n D
iego
Hou
ston
Mia
mi
Min
neap
olis
Was
hing
ton
Den
ver
Phoe
nix
Seat
tleD
etro
it
A SOLID AND FLEXIBLE LABOUR MARKET2.2
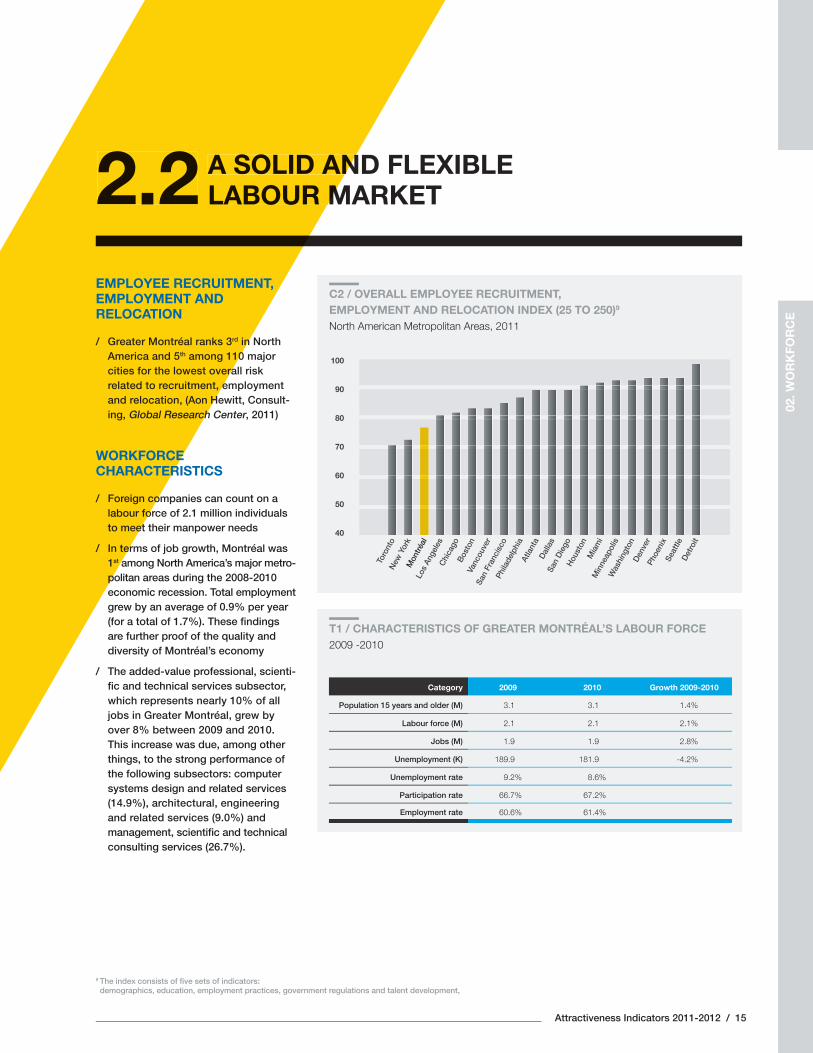
C2 / OVERALL EMPLOYEE RECRUITMENT, EMPLOYMENT AND RELOCATION INDEX (25 TO 250)9 North American Metropolitan Areas, 2011
Category 2009 2010 Growth 2009-2010
Population 15 years and older (M) 3.1 3.1 1.4%
Labour force (M) 2.1 2.1 2.1%
Jobs (M) 1.9 1.9 2.8%
Unemployment (K) 189.9 181.9 -4.2%
Unemployment rate 9.2% 8.6%
Participation rate 66 .7% 67.2%
Employment rate 60.6% 61.4%
T1 / CHARACTERISTICS OF GREATER MONTRÉAL’S LABOUR FORCE2009 -2010
9 The index consists of fi ve sets of indicators: demographics, education, employment practices, government regulations and talent development,
A SOLID ANLABOUR M2.2
EMPLOYEE RECRUITMENT, EMPLOYMENT AND RELOCATION
/ Greater Montréal ranks 3rd in North America and 5th among 110 major cities for the lowest overall risk related to recruitment, employment and relocation, (Aon Hewitt, Consult-ing, Global Research Center, 2011)
WORKFORCE CHARACTERISTICS
/ Foreign companies can count on a labour force of 2.1 million individuals to meet their manpower needs
/ In terms of job growth, Montréal was 1st among North America’s major metro-politan areas during the 2008-2010 economic recession. Total employment grew by an average of 0.9% per year (for a total of 1.7%). These fi ndings are further proof of the quality and diversity of Montréal’s economy
/ The added-value professional, scienti-fi c and technical services subsector, which represents nearly 10% of all jobs in Greater Montréal, grew by over 8% between 2009 and 2010. This increase was due, among other things, to the strong performance of the following subsectors: computer systems design and related services (14.9%), architectural, engineering and related services (9.0%) and management, scientifi c and technical consulting services (26.7%).
02. W
OR
KFO
RC
E
100
90
80
70
60
50
40
Qua
ys o
f th
e O
ld P
ort
, Mo
ntré
al
16 / Montréal International
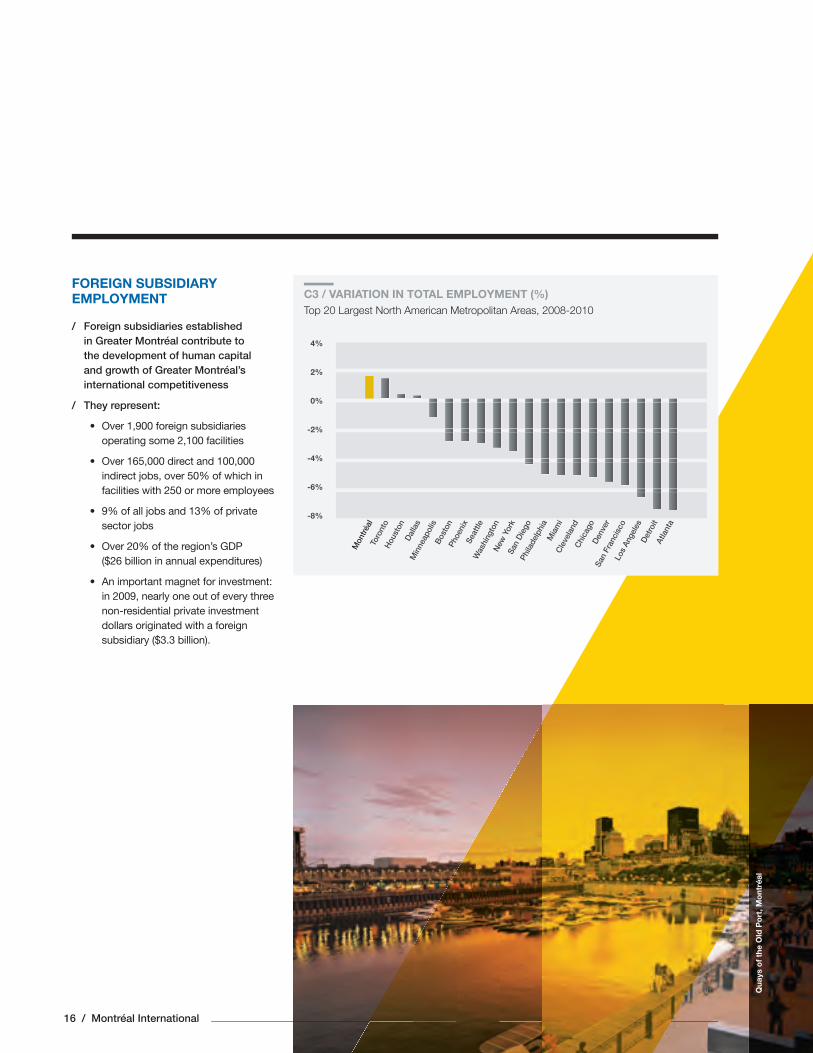
FOREIGN SUBSIDIARY EMPLOYMENT
/ Foreign subsidiaries established in Greater Montréal contribute to the development of human capitaland growth of Greater Montréal’s international competitiveness
/ They represent:
• Over 1,900 foreign subsidiaries operating some 2,100 facilities
• Over 165,000 direct and 100,000 indirect jobs, over 50% of which in facilities with 250 or more employees
• 9% of all jobs and 13% of private sector jobs
• Over 20% of the region’s GDP ($26 billion in annual expenditures)
• An important magnet for investment: in 2009, nearly one out of every three non-residential private investment dollars originated with a foreign subsidiary ($3.3 billion).
4%
2%
0%
-2%
-4%
-6%
-8%
C3 / VARIATION IN TOTAL EMPLOYMENT (%)Top 20 Largest North American Metropolitan Areas, 2008-2010
Mon
tréal
Toro
nto
Hou
ston
Dal
las
Min
neap
olis
Bos
ton
Phoe
nix
Seat
tleW
ashi
ngto
nN
ew Y
ork
San
Die
goPh
ilade
lphi
aM
iam
iC
leve
land
Chi
cago
Den
ver
San
Fran
cisc
oLo
s An
gele
sD
etro
itAt
lant
a
Attractiveness Indicators 2011-2012 / 17
A MULTICULTURAL LABOUR FORCE
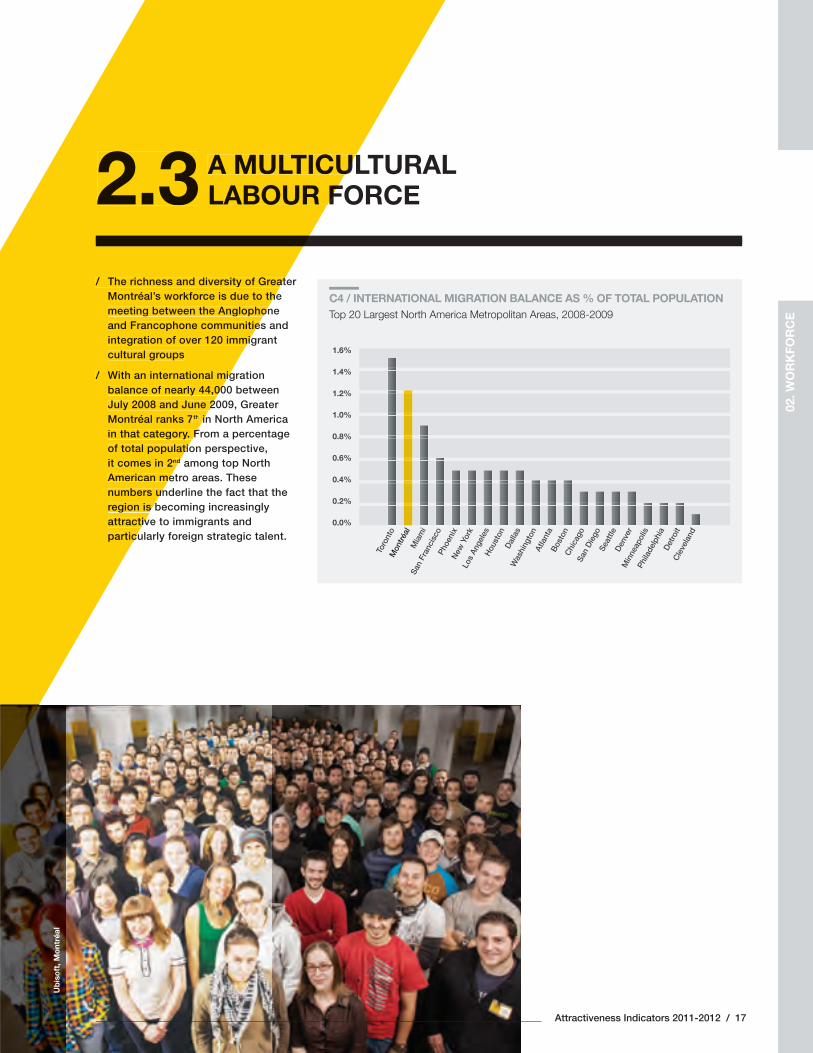
/ The richness and diversity of Greater Montréal’s workforce is due to the meeting between the Anglophone and Francophone communities and integration of over 120 immigrant cultural groups
/ With an international migration balance of nearly 44,000 between July 2008 and June 2009, Greater Montréal ranks 7th in North America in that category. From a percentage of total population perspective, it comes in 2nd among top North American metro areas. These numbers underline the fact that the region is becoming increasingly attractive to immigrants and particularly foreign strategic talent.
2.3
1.6%
1.4%
1.2%
1.0%
0.8%
0.6%
0.4%
0.2%
0.0%
Toro
nto
Mon
tréal
Mia
mi
San
Fran
cisc
oPh
oeni
xN
ew Y
ork
Los
Ange
les
Hou
ston
Dal
las
Was
hing
ton
Atla
nta
Bos
ton
Chi
cago
San
Die
goSe
attle
Den
ver
Min
neap
olis
Phila
delp
hia
Det
roit
Cle
vela
nd
C4 / INTERNATIONAL MIGRATION BALANCE AS % OF TOTAL POPULATION Top 20 Largest North America Metropolitan Areas, 2008-2009
A MULTICULLABOUR F
/ The richness and diversity of GreatMontréal’s workforce is due to themeeting between the Anglophonand Francophone communitieintegration of over 120 immigcultural groups
/ With an international migbalance of nearly 44,00July 2008 and June 2Montréal ranks 7th inin that category. Fof total populatiit comes in 2nd
American menumbers unregion is battractivparticu
2.3
02. W
OR
KFO
RC
E
Ub
iso
ft, M
ont
réal
18 / Montréal International
“
“ ””
A LINGUISTIC MOSAIC
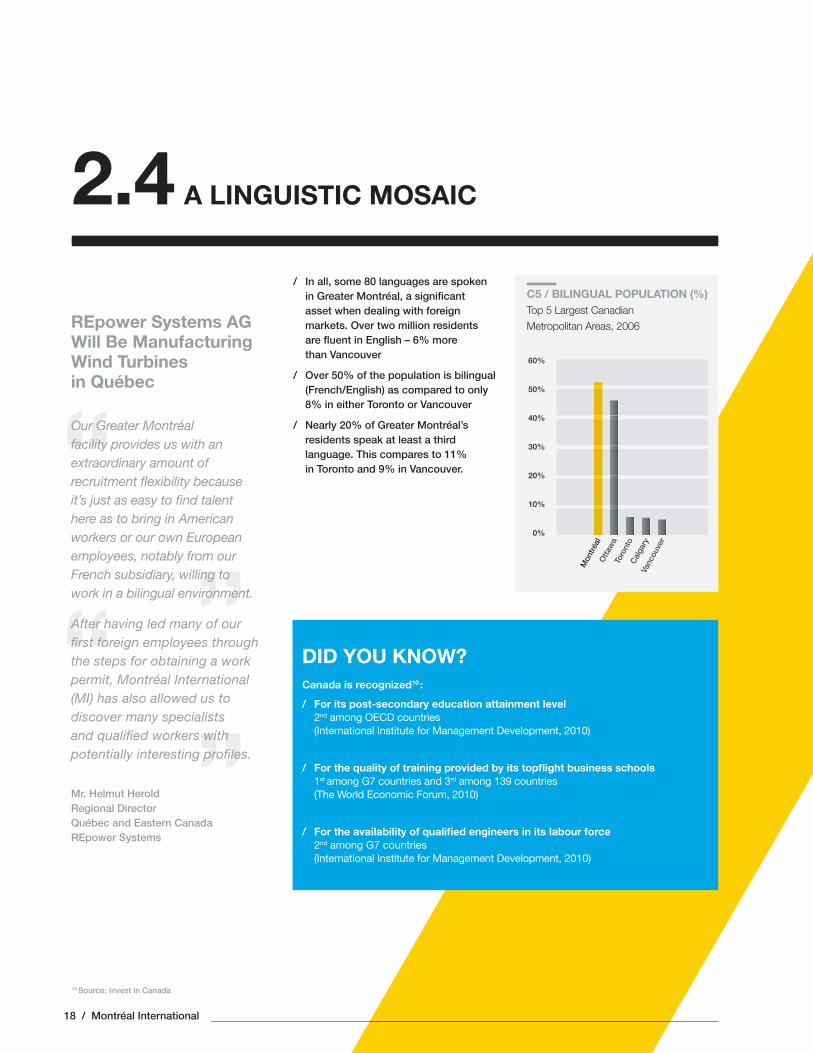
/ In all, some 80 languages are spoken in Greater Montréal, a signifi cant asset when dealing with foreign markets. Over two million residents are fl uent in English – 6% more than Vancouver
/ Over 50% of the population is bilingual (French/English) as compared to only 8% in either Toronto or Vancouver
/ Nearly 20% of Greater Montréal’s residents speak at least a third language. This compares to 11% in Toronto and 9% in Vancouver.
2.4
10 Source: Invest in Canada
REpower Systems AG Will Be Manufacturing Wind Turbines in Québec
Our Greater Montréal facility provides us with an extraordinary amount of recruitment fl exibility because it’s just as easy to fi nd talent here as to bring in American workers or our own European employees, notably from our French subsidiary, willing to work in a bilingual environment.
After having led many of our fi rst foreign employees through the steps for obtaining a work permit, Montréal International (MI) has also allowed us to discover many specialists and qualifi ed workers with potentially interesting profi les.
Mr. Helmut HeroldRegional DirectorQuébec and Eastern CanadaREpower Systems
DID YOU KNOW?Canada is recognized10 :
/ For its post-secondary education attainment level 2nd among OECD countries
(International Institute for Management Development, 2010)
/ For the quality of training provided by its topfl ight business schools 1st among G7 countries and 3rd among 139 countries
(The World Economic Forum, 2010)
/ For the availability of qualifi ed engineers in its labour force 2nd among G7 countries
(International Institute for Management Development, 2010)
Mon
tréal
Otta
wa
Toro
nto
Cal
gary
Vanc
ouve
r
C5 / BILINGUAL POPULATION (%) Top 5 Largest Canadian
Metropolitan Areas, 2006
60%
50%
40%
30%
20%
10%
0%
COSTS GREATER MONTRÉAL –
THE MOST COMPETITIVE
OPERATING COSTS OF ANY
LARGE NORTH AMERICAN
METROPOLITAN AREA
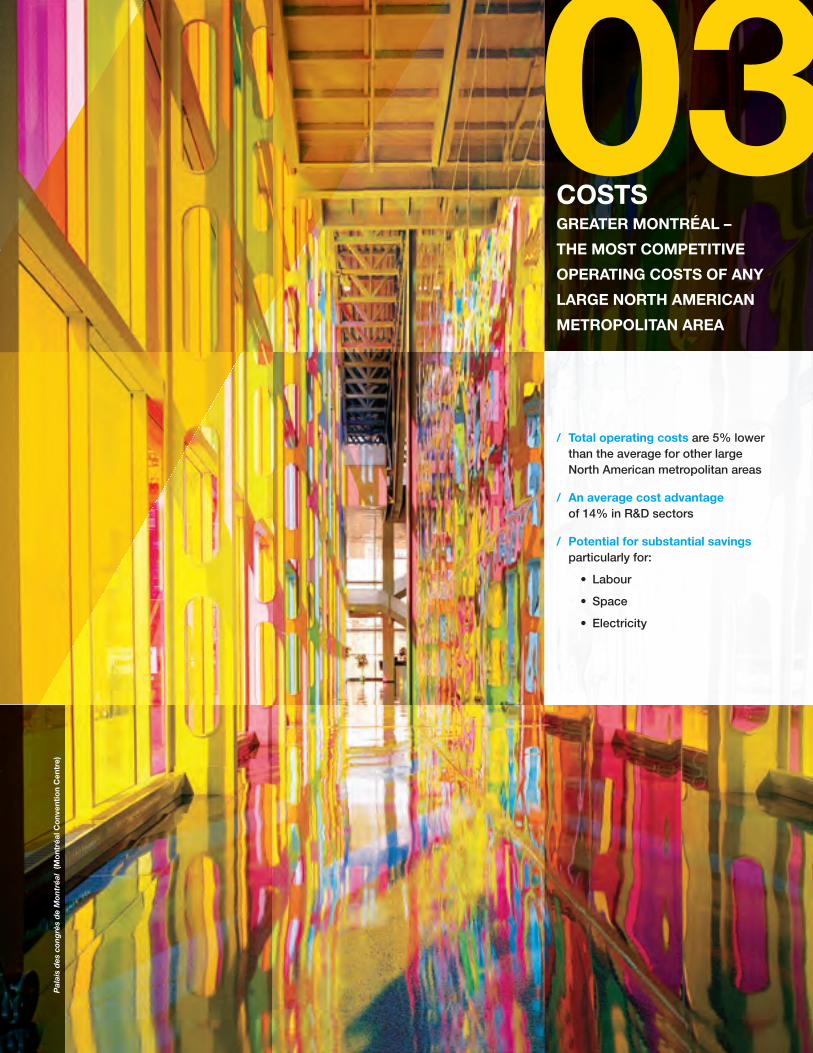
03/ Total operating costs are 5% lower
than the average for other large North American metropolitan areas
/ An average cost advantage of 14% in R&D sectors
/ Potential for substantial savings particularly for:
• Labour
• Space
• Electricity
Pal
ais
des
con
grè
s d
e M
ontr
éal
(Mo
ntré
al C
onv
enti
on
Cen
tre)
20 / Montréal International
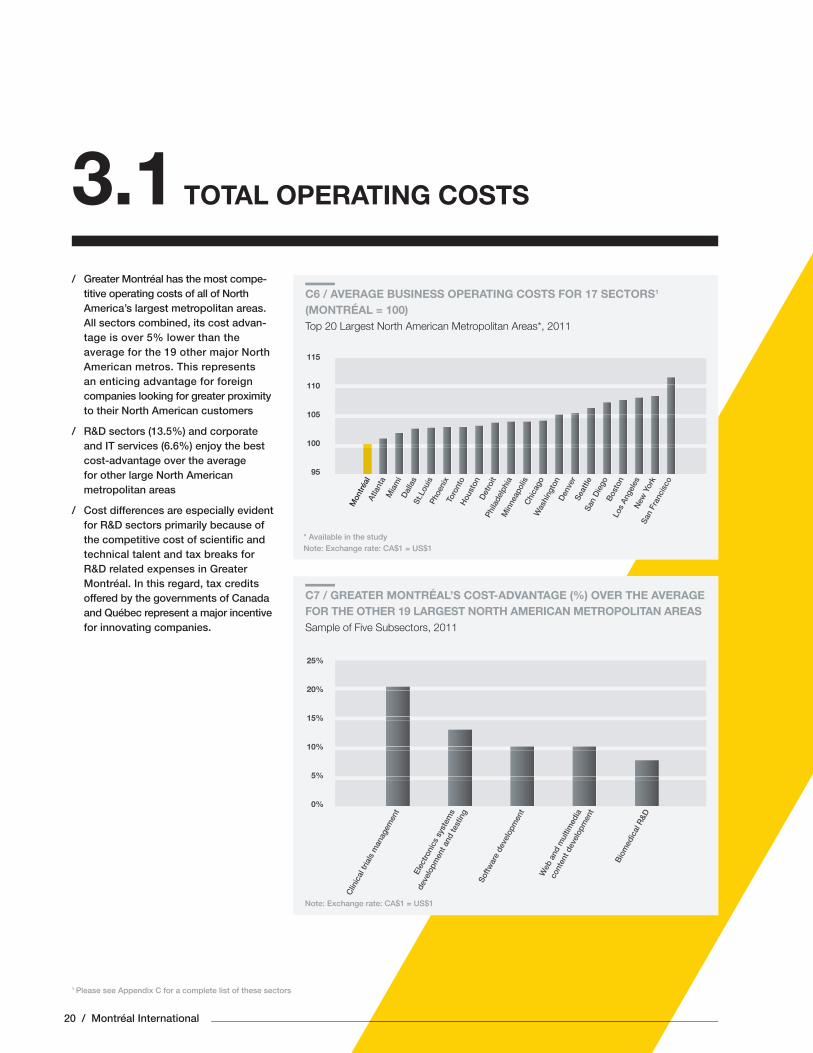
TOTAL OPERATING COSTS3.1/ Greater Montréal has the most compe-
titive operating costs of all of North America’s largest metropolitan areas. All sectors combined, its cost advan-tage is over 5% lower than the average for the 19 other major North American metros. This represents an enticing advantage for foreign companies looking for greater proximity to their North American customers
/ R&D sectors (13.5%) and corporate and IT services (6.6%) enjoy the best cost-advantage over the average for other large North American metropolitan areas
/ Cost differences are especially evident for R&D sectors primarily because of the competitive cost of scientifi c and technical talent and tax breaks for R&D related expenses in Greater Montréal. In this regard, tax credits offered by the governments of Canada and Québec represent a major incentive for innovating companies.
1 Please see Appendix C for a complete list of these sectors
25%
20%
15%
10%
5%
0%
Clin
ical
tria
ls m
anag
emen
t
Elec
troni
cs s
yste
ms
deve
lopm
ent a
nd te
stin
g
Softw
are
deve
lopm
ent
Web
and
mul
timed
ia
cont
ent d
evel
opm
ent
Bio
med
ical
R&D
C7 / GREATER MONTRÉAL’S COST-ADVANTAGE (%) OVER THE AVERAGE FOR THE OTHER 19 LARGEST NORTH AMERICAN METROPOLITAN AREASSample of Five Subsectors, 2011
Note: Exchange rate: CA$1 = US$1
C6 / AVERAGE BUSINESS OPERATING COSTS FOR 17 SECTORS1 (MONTRÉAL = 100)Top 20 Largest North American Metropolitan Areas*, 2011
115
110
105
100
95
Mon
tréal
Atla
nta
Mia
mi
Dal
las
St.L
ouis
Phoe
nix
Toro
nto
Hou
ston
Det
roit
Phila
delp
hia
Min
neap
olis
Chi
cago
Was
hing
ton
Den
ver
Seat
tleSa
n D
iego
Bos
ton
Los
Ange
les
New
Yor
kSa
n Fr
anci
sco
* Available in the study Note: Exchange rate: CA$1 = US$1
Attractiveness Indicators 2011-2012 / 21
03. C
OS
TS
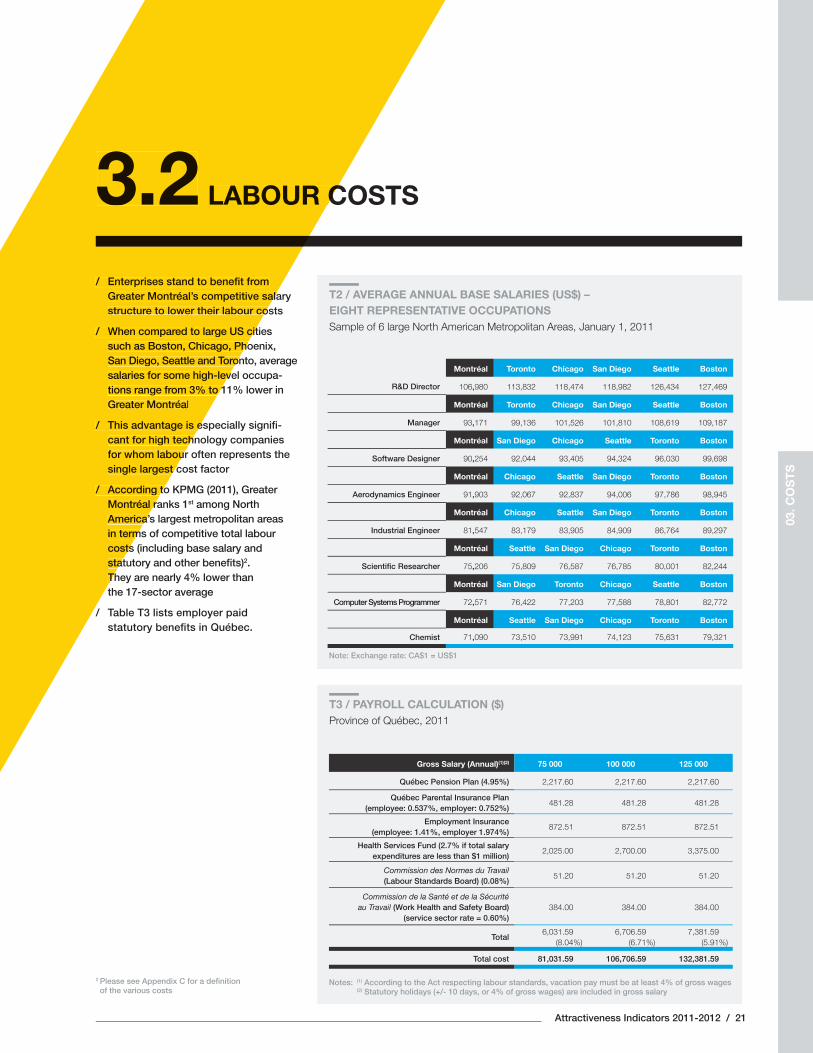
LABOUR COSTS3.2/ Enterprises stand to benefi t from
Greater Montréal’s competitive salary structure to lower their labour costs
/ When compared to large US cities such as Boston, Chicago, Phoenix, San Diego, Seattle and Toronto, average salaries for some high-level occupa-tions range from 3% to 11% lower in Greater Montréal
/ This advantage is especially signifi -cant for high technology companies for whom labour often represents the single largest cost factor
/ According to KPMG (2011), Greater Montréal ranks 1st among North America’s largest metropolitan areas in terms of competitive total labour costs (including base salary and statutory and other benefi ts)2. They are nearly 4% lower than the 17-sector average
/ Table T3 lists employer paid statutory benefi ts in Québec.
Gross Salary (Annual)(1)(2) 75 000 100 000 125 000
Québec Pension Plan (4.95%) 2,217.60 2,217.60 2,217.60
Québec Parental Insurance Plan (employee: 0.537%, employer: 0.752%)
481.28 481.28 481.28
Employment Insurance (employee: 1.41%, employer 1.974%)
872.51 872.51 872.51
Health Services Fund (2.7% if total salary expenditures are less than $1 million)
2,025.00 2,700.00 3,375.00
Commission des Normes du Travail (Labour Standards Board) (0.08%)
51.20 51.20 51.20
Commission de la Santé et de la Sécurité au Travail (Work Health and Safety Board)
(service sector rate = 0.60%)384.00 384.00 384.00
Total6,031
(8.59.04%)
6,706 (6
.59
.71%)7,381
(5.59.91%)
Total cost 81,031.59 106,706.59 132,381.59
Montréal Toronto Chicago San Diego Seattle Boston
R&D Director 106,980 113,832 118,474 118,982 126,434 127,469
Montréal Toronto Chicago San Diego Seattle Boston
Manager 93,171 99,136 101,526 101,810 108,619 109,187
Montréal San Diego Chicago Seattle Toronto Boston
Software Designer 90,254 92,044 93,405 94,324 96,030 99,698
Montréal Chicago Seattle San Diego Toronto Boston
Aerodynamics Engineer 91,903 92,067 92,837 94,006 97,786 98,945
Montréal Chicago Seattle San Diego Toronto Boston
Industrial Engineer 81,547 83,179 83,905 84,909 86,764 89,297
Montréal Seattle San Diego Chicago Toronto Boston
Scientifi c Researcher 75,206 75,809 76,587 76,785 80,001 82,244
Montréal San Diego Toronto Chicago Seattle Boston
Computer Systems Programmer 72,571 76,422 77,203 77,588 78,801 82,772
Montréal Seattle San Diego Chicago Toronto Boston
Chemist 71,090 73,510 73,991 74,123 75,631 79,321
T3 / PAYROLL CALCULATION ($)Province of Québec, 2011
T2 / AVERAGE ANNUAL BASE SALARIES (US$) – EIGHT REPRESENTATIVE OCCUPATIONS Sample of 6 large North American Metropolitan Areas, January 1, 2011
Note: Exchange rate: CA$1 = US$1
Notes: (1) According to the Act respecting labour standards, vacation pay must be at least 4% of gross wages (2) Statutory holidays (+/- 10 days, or 4% of gross wages) are included in gross salary
2 Please see Appendix C for a defi nition of the various costs
LABOUR C3.2/ Enterprises stand to benefi t from
Greater Montréal’s competitive salastructure to lower their labour co
/ When compared to large US citsuch as Boston, Chicago, PhoSan Diego, Seattle and Toronsalaries for some high-levtions range from 3% to 1Greater Montréal
/ This advantage is ecant for high techfor whom laboursingle largest c
/ According toMontréal rAmerica’in termcostsstatTh
22 / Montréal International
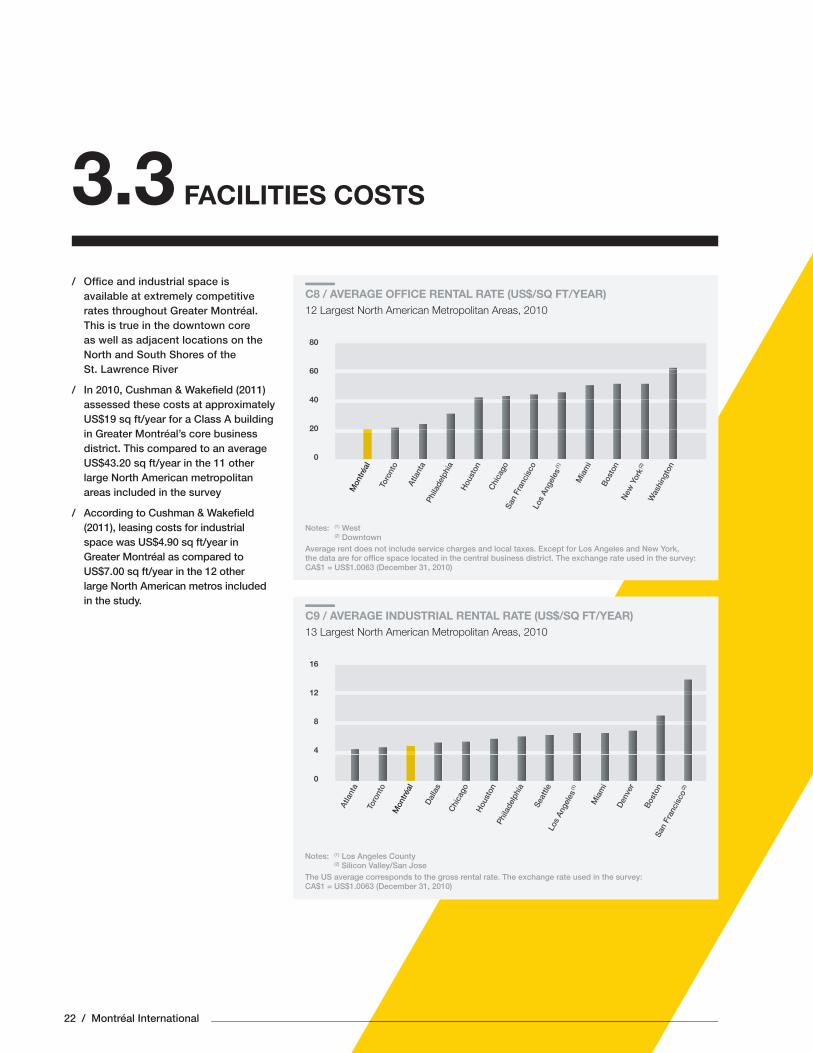
FACILITIES COSTS3.3/ Offi ce and industrial space is
available at extremely competitive rates throughout Greater Montréal. This is true in the downtown core as well as adjacent locations on the North and South Shores of the St. Lawrence River
/ In 2010, Cushman & Wakefi eld (2011) assessed these costs at approximately US$19 sq ft/year for a Class A building in Greater Montréal’s core business district. This compared to an average US$43.20 sq ft/year in the 11 other large North American metropolitan areas included in the survey
/ According to Cushman & Wakefi eld (2011), leasing costs for industrial space was US$4.90 sq ft/year in Greater Montréal as compared to US$7.00 sq ft/year in the 12 other large North American metros included in the study.
C9 / AVERAGE INDUSTRIAL RENTAL RATE (US$/SQ FT/YEAR)13 Largest North American Metropolitan Areas, 2010
Notes: (1) Los Angeles County (2) Silicon Valley/San Jose
The US average corresponds to the gross rental rate. The exchange rate used in the survey: CA$1 = US$1.0063 (December 31, 2010)
16
12
8
4
0
Atla
nta
Toro
nto
Mon
tréal
Dal
las
Chi
cago
Hou
ston
Phila
delp
hia
Seat
tleLo
s An
gele
s (1
)
Mia
mi
Den
ver
Bos
ton
San
Fran
cisc
o (2
)
C8 / AVERAGE OFFICE RENTAL RATE (US$/SQ FT/YEAR)12 Largest North American Metropolitan Areas, 2010
80
60
40
20
0
Mon
tréal
Toro
nto
Atla
nta
Phila
delp
hia
Hou
ston
Chi
cago
San
Fran
cisc
oLo
s An
gele
s (1
)
Mia
mi
Bos
ton
New
Yor
k (2
)
Was
hing
ton
Notes: (1) West (2) Downtown
Average rent does not include service charges and local taxes. Except for Los Angeles and New York, the data are for offi ce space located in the central business district. The exchange rate used in the survey: CA$1 = US$1.0063 (December 31, 2010)
Attractiveness Indicators 2011-2012 / 23
“
”
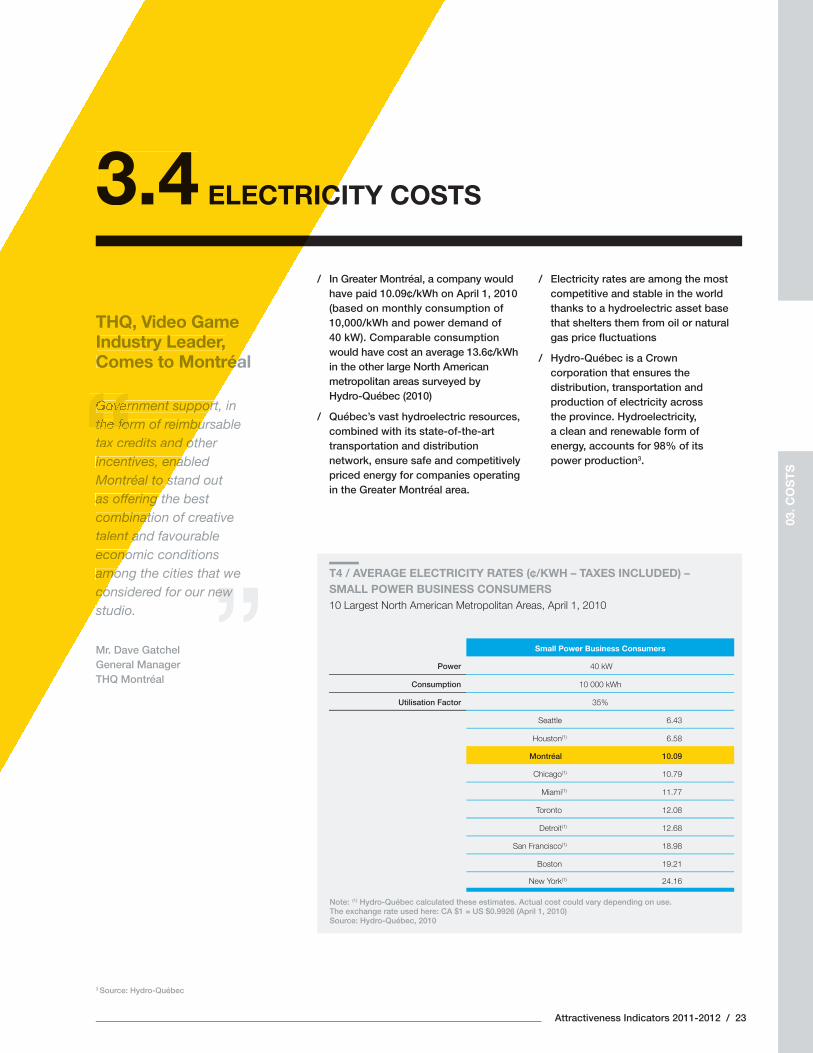
THQ, Video Game Industry Leader, Comes to Montréal
Government support, in the form of reimbursable tax credits and other incentives, enabled Montréal to stand out as offering the best combination of creative talent and favourable economic conditions among the cities that we considered for our new studio.
Mr. Dave GatchelGeneral ManagerTHQ Montréal
ELECTRICITY COSTS3.4/ In Greater Montréal, a company would
have paid 10.09¢/kWh on April 1, 2010 (based on monthly consumption of 10,000/kWh and power demand of 40 kW). Comparable consumption would have cost an average 13.6¢/kWh in the other large North American metropolitan areas surveyed by Hydro-Québec (2010)
/ Québec’s vast hydroelectric resources, combined with its state-of-the-art transportation and distribution network, ensure safe and competitively priced energy for companies operating in the Greater Montréal area.
/ Electricity rates are among the most competitive and stable in the world thanks to a hydroelectric asset base that shelters them from oil or natural gas price fl uctuations
/ Hydro-Québec is a Crown corporation that ensures the distribution, transportation and production of electricity across the province. Hydroelectricity, a clean and renewable form of energy, accounts for 98% of its power production3.
Small Power Business Consumers
Power 40 kW
Consumption 10 000 kWh
Utilisation Factor 35%
Seattle 6.43
Houston(1) 6.58
Montréal 10.09
Chicago(1) 10.79
Miami(1) 11.77
Toronto 12.08
Detroit(1) 12.68
San Francisco(1) 18.98
Boston 19.21
New York(1) 24.16
T4 / AVERAGE ELECTRICITY RATES (¢/KWH – TAXES INCLUDED) – SMALL POWER BUSINESS CONSUMERS10 Largest North American Metropolitan Areas, April 1, 2010
Note: (1) Hydro-Québec calculated these estimates. Actual cost could vary depending on use. The exchange rate used here: CA $1 = US $0.9926 (April 1, 2010)Source: Hydro-Québec, 2010
3 Source: Hydro-Québec
“THQ, Video Game Industry Leader,Comes to Montréa
rnment suppor
““the form of reimbu““tax credits and oincentives, enaMontréal to sas offering combinattalent aneconoamoco
ELECTRIC3.4
03. C
OS
TS
24 / Montréal International
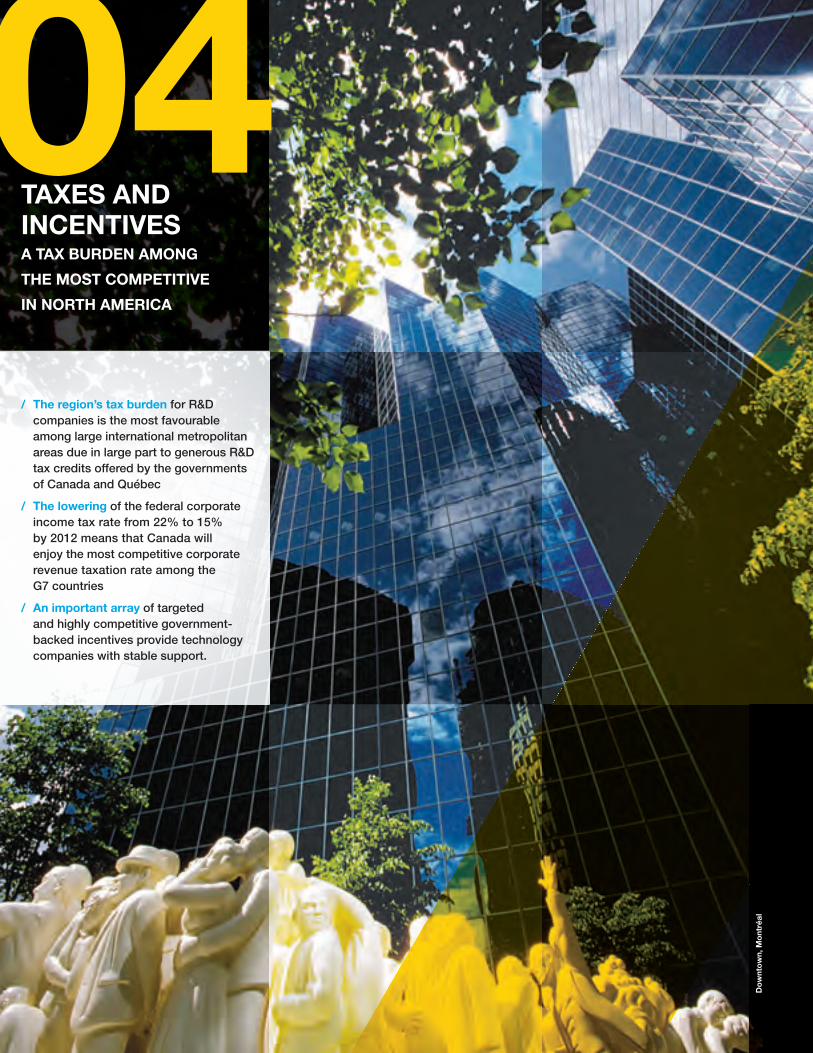
TAXES AND INCENTIVES A TAX BURDEN AMONG
THE MOST COMPETITIVE
IN NORTH AMERICA
04/ The region’s tax burden for R&D
companies is the most favourable among large international metropolitan areas due in large part to generous R&D tax credits offered by the governments of Canada and Québec
/ The lowering of the federal corporate income tax rate from 22% to 15% by 2012 means that Canada will enjoy the most competitive corporate revenue taxation rate among the G7 countries
/ An important array of targeted and highly competitive government-backed incentives provide technology companies with stable support.
Do
wnt
ow
n, M
ont
réal
Attractiveness Indicators 2011-2012 / 25
“”
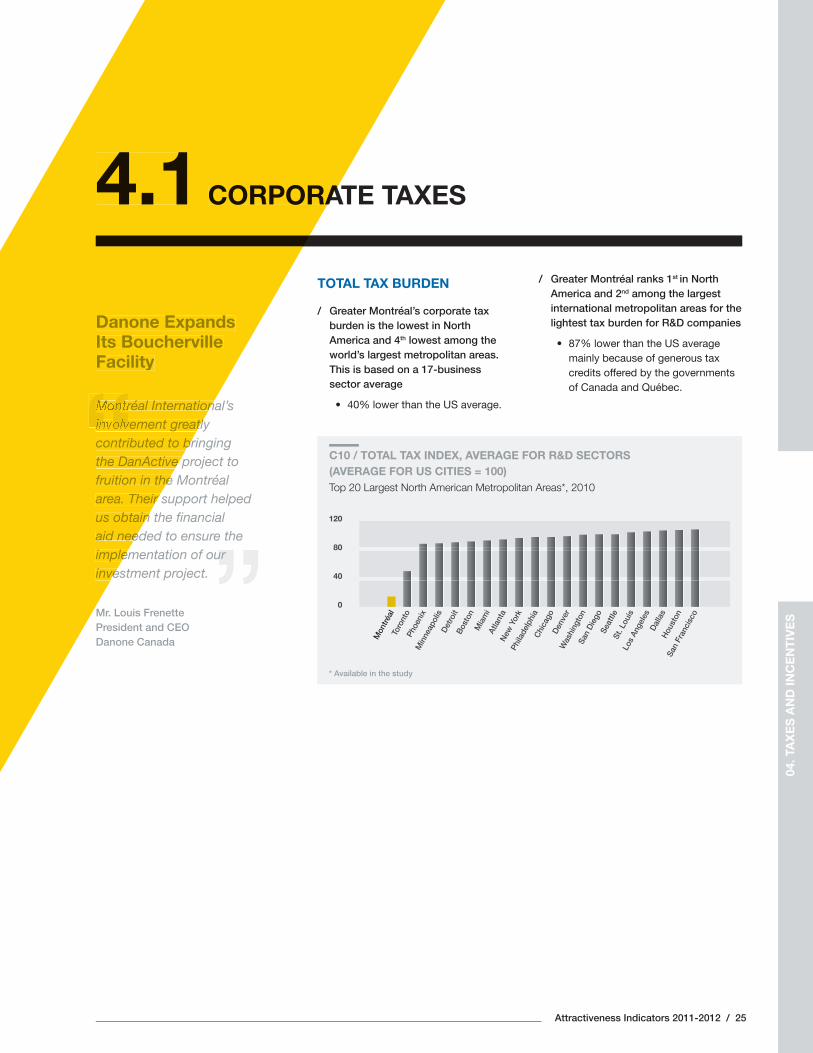
Danone Expands Its Boucherville Facility
Montréal International’s involvement greatly contributed to bringing the DanActive project to fruition in the Montréal area. Their support helped us obtain the fi nancial aid needed to ensure the implementation of our investment project.
Mr. Louis FrenettePresident and CEODanone Canada
CORPORATE TAXES4.1
04. T
AX
ES
AN
D IN
CE
NT
IVE
S
C10 / TOTAL TAX INDEX, AVERAGE FOR R&D SECTORS (AVERAGE FOR US CITIES = 100)Top 20 Largest North American Metropolitan Areas*, 2010
120
80
40
0
Mon
tréal
Toro
nto
Phoe
nix
Min
neap
olis
Det
roit
Bos
ton
Mia
mi
Atla
nta
New
Yor
kPh
ilade
lphi
a C
hica
goD
enve
rW
ashi
ngto
nSa
n D
iego
Seat
tleSt
. Lou
isLo
s An
gele
sD
alla
sH
oust
onSa
n Fr
anci
sco
“Danone ExpandsIts BouchervilleFacility
réal Internation
““involvement greatly““contributed to brthe DanActive pfruition in thearea. Their us obtainaid needimpleminve
CORPORA4.1TOTAL TAX BURDEN
/ Greater Montréal’s corporate tax burden is the lowest in North America and 4th lowest among the world’s largest metropolitan areas. This is based on a 17-business sector average
• 40% lower than the US average.
/ Greater Montréal ranks 1st in North America and 2nd among the largest international metropolitan areas for the lightest tax burden for R&D companies
• 87% lower than the US average mainly because of generous tax credits offered by the governments of Canada and Québec.
* Available in the study
26 / Montréal International
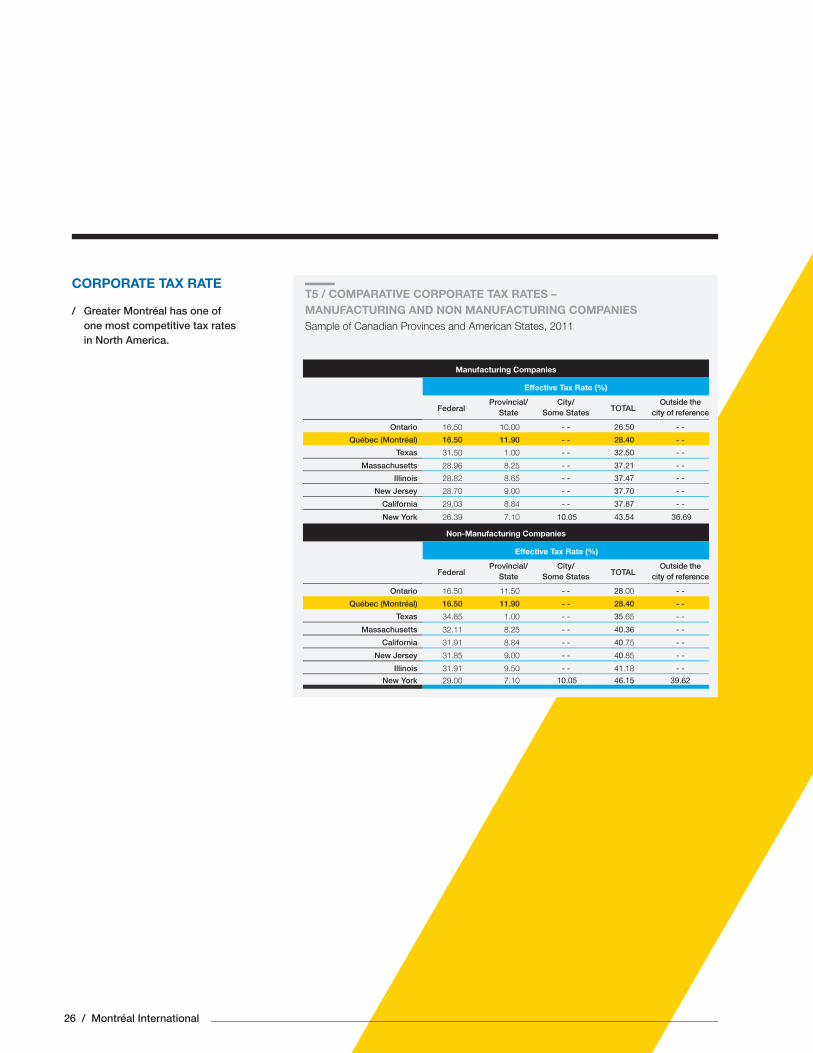
T5 / COMPARATIVE CORPORATE TAX RATES – MANUFACTURING AND NON MANUFACTURING COMPANIES Sample of Canadian Provinces and American States, 2011
Manufacturing Companies
Effective Tax Rate (%)
FederalProvincial/
State City/
Some States TOTALOutside the
city of reference
Ontario 16.50 10.00 - - 26.50 - -
Québec (Montréal) 16.50 11.90 - - 28.40 - -
Texas 31.50 1.00 - - 32.50 - -
Massachusetts 28.96 8.25 - - 37.21 - -
Illinois 28.82 8.65 - - 37.47 - -
New Jersey 28.70 9.00 - - 37.70 - -
California 29.03 8.84 - - 37.87 - -
New York 26.39 7.10 10.05 43.54 36.69
Non-Manufacturing Companies
Effective Tax Rate (%)
FederalProvincial/
State City/
Some States TOTALOutside the
city of reference
Ontario 16.50 11.50 - - 28.00 - -
Québec (Montréal) 16.50 11.90 - - 28.40 - -
Texas 34.65 1.00 - - 35.65 - -
Massachusetts 32.11 8.25 - - 40.36 - -
California 31.91 8.84 - - 40.75 - -
New Jersey 31.85 9.00 - - 40.85 - -
Illinois 31.91 9.50 - - 41.18 - -
New York 29.00 7.10 10.05 46.15 39.62
CORPORATE TAX RATE
/ Greater Montréal has one of one most competitive tax rates in North America.
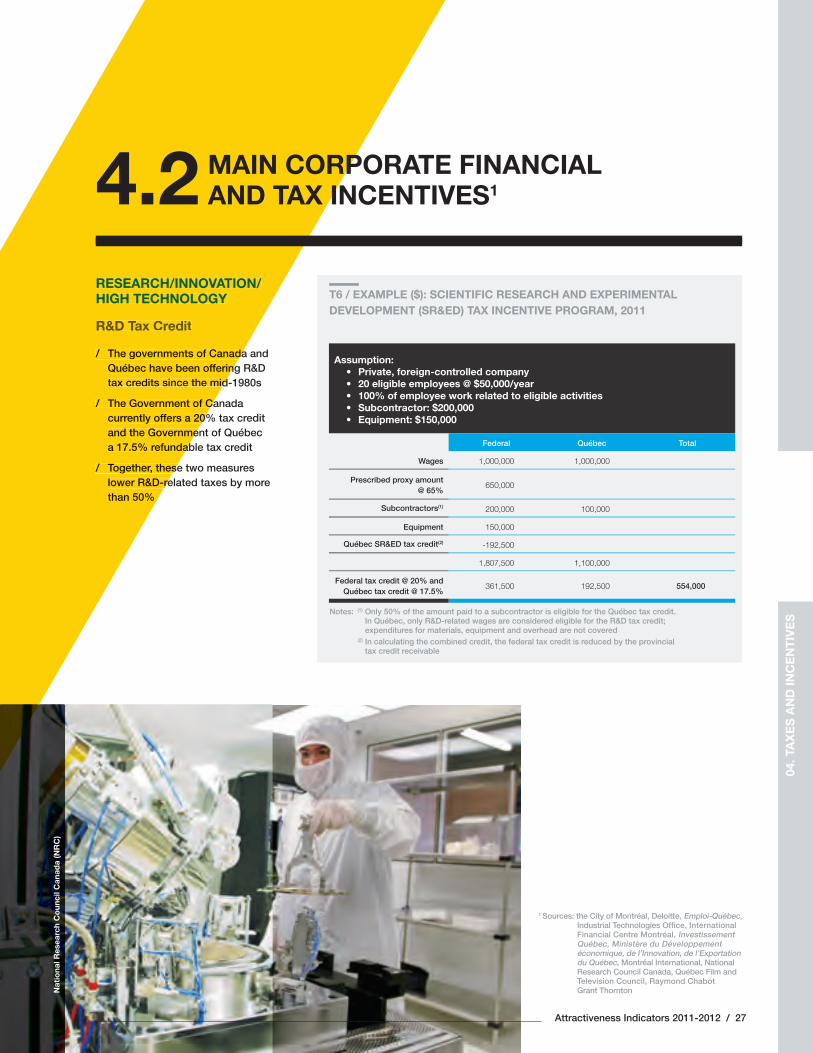
RESEARCH/INNOVATION/HIGH TECHNOLOGY
R&D Tax Credit
/ The governments of Canada and Québec have been offering R&D tax credits since the mid-1980s
/ The Government of Canada currently offers a 20% tax credit and the Government of Québec a 17.5% refundable tax credit
/ Together, these two measures lower R&D-related taxes by more than 50%
RESEARCH/INNOVATION/HIGH TECHNOLOGY
R&D Tax Credit
/ The governments of CanadaQuébec have been offeringtax credits since the mid
/ The Government of Cacurrently offers a 20%and the Governmea 17.5% refundab
/ Together, theselower R&D-rethan 50%
Attractiveness Indicators 2011-2012 / 27
MAIN CORPORATE FINANCIAL AND TAX INCENTIVES14.2
Assumption:• Private, foreign-controlled company• 20 eligible employees @ $50,000/year• 100% of employee work related to eligible activities• Subcontractor: $200,000• Equipment: $150,000
Federal Québec Total
Wages 1,000,000 1,000,000
Prescribed proxy amount @ 65%
650,000
Subcontractors(1) 200,000 100,000
Equipment 150,000
Québec SR&ED tax credit(2) -192,500
1,807,500 1,100,000
Federal tax credit @ 20% and Québec tax credit @ 17.5%
361,500 192,500 554,000
T6 / EXAMPLE ($): SCIENTIFIC RESEARCH AND EXPERIMENTAL DEVELOPMENT (SR&ED) TAX INCENTIVE PROGRAM, 2011
Notes: (1) Only 50% of the amount paid to a subcontractor is eligible for the Québec tax credit. In Québec, only R&D-related wages are considered eligible for the R&D tax credit; expenditures for materials, equipment and overhead are not covered
(2) In calculating the combined credit, the federal tax credit is reduced by the provincial tax credit receivable
1 Sources: the City of Montréal, Deloitte, Emploi-Québec, Industrial Technologies Offi ce, International Financial Centre Montréal, Investissement Québec, Ministère du Développement économique, de l’Innovation, de l’Exportation du Québec, Montréal International, National Research Council Canada, Québec Film and Television Council, Raymond Chabot Grant Thornton
04. T
AX
ES
AN
D IN
CE
NT
IVE
S
Nat
iona
l Res
earc
h C
oun
cil C
anad
a (N
RC
)
Bel
l Can
ada
28 / Montréal International
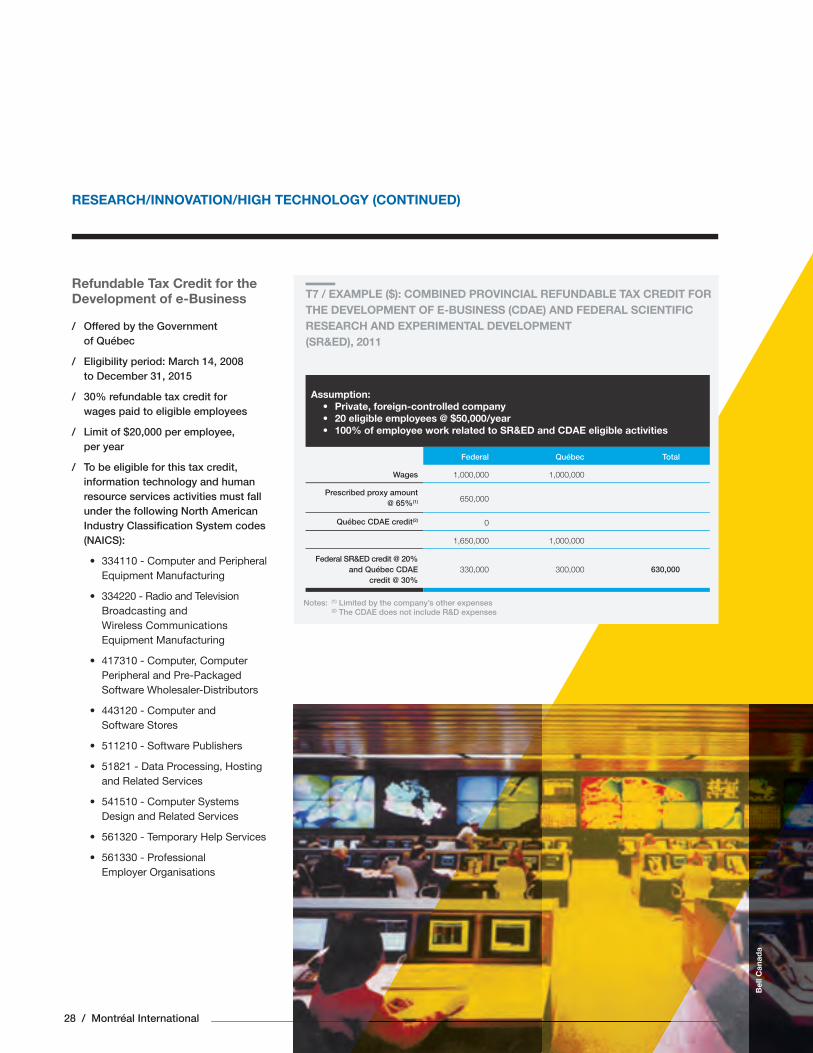
Refundable Tax Credit for the Development of e-Business
/ Offered by the Government of Québec
/ Eligibility period: March 14, 2008 to December 31, 2015
/ 30% refundable tax credit for wages paid to eligible employees
/ Limit of $20,000 per employee, per year
/ To be eligible for this tax credit, information technology and human resource services activities must fall under the following North American Industry Classifi cation System codes (NAICS):
• 334110 - Computer and Peripheral Equipment Manufacturing
• 334220 - Radio and Television Broadcasting and Wireless Communications Equipment Manufacturing
• 417310 - Computer, Computer Peripheral and Pre-Packaged Software Wholesaler-Distributors
• 443120 - Computer and Software Stores
• 511210 - Software Publishers
• 51821 - Data Processing, Hosting and Related Services
• 541510 - Computer Systems Design and Related Services
• 561320 - Temporary Help Services
• 561330 - Professional Employer Organisations
T7 / EXAMPLE ($): COMBINED PROVINCIAL REFUNDABLE TAX CREDIT FOR THE DEVELOPMENT OF E-BUSINESS (CDAE) AND FEDERAL SCIENTIFIC RESEARCH AND EXPERIMENTAL DEVELOPMENT (SR&ED), 2011
Notes: (1) Limited by the company’s other expenses (2) The CDAE does not include R&D expenses
Assumption:• Private, foreign-controlled company• 20 eligible employees @ $50,000/year• 100% of employee work related to SR&ED and CDAE eligible activities
Federal Québec Total
Wages 1,000,000 1,000,000
Prescribed proxy amount @ 65%(1) 650,000
Québec CDAE credit(2) 0
1,650,000 1,000,000
Federal SR&ED credit @ 20% and Québec CDAE
credit @ 30%330,000 300,000 630,000
RESEARCH/INNOVATION/HIGH TECHNOLOGY (CONTINUED)
Attractiveness Indicators 2011-2012 / 29
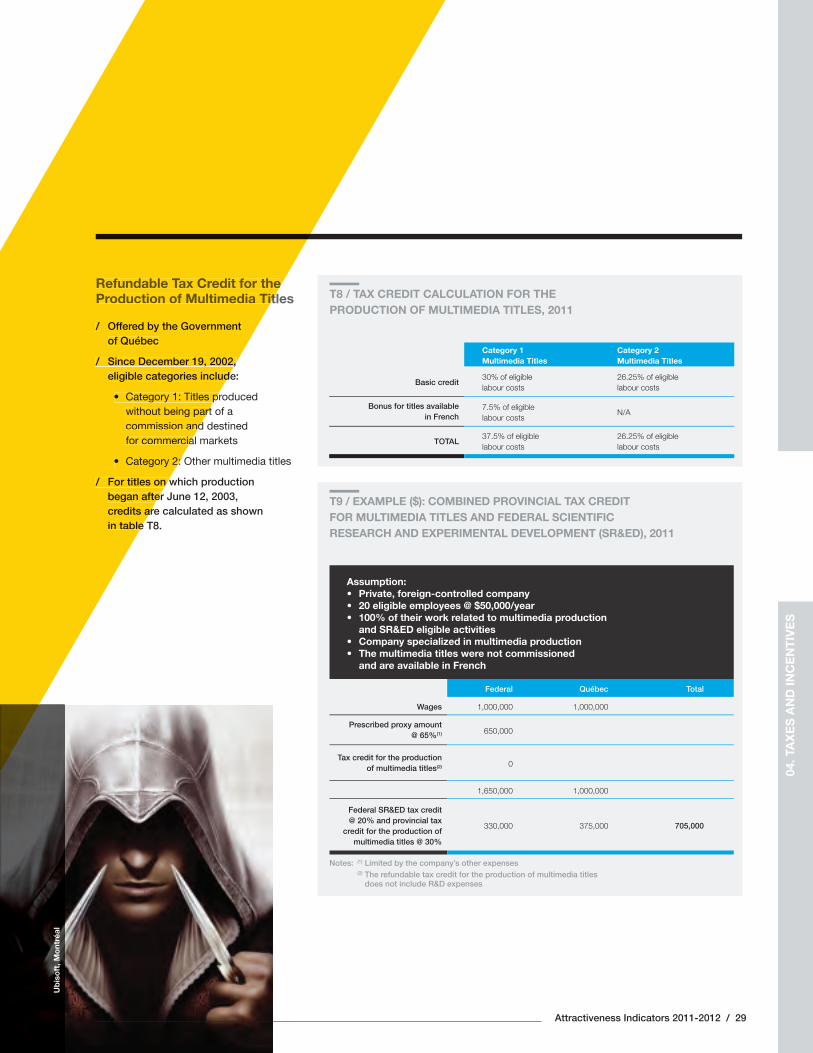
Refundable Tax Credit for the Production of Multimedia Titles
/ Offered by the Government of Québec
/ Since December 19, 2002, eligible categories include:
• Category 1: Titles produced without being part of a commission and destined for commercial markets
• Category 2: Other multimedia titles
/ For titles on which production began after June 12, 2003, credits are calculated as shown in table T8.
T8 / TAX CREDIT CALCULATION FOR THE PRODUCTION OF MULTIMEDIA TITLES, 2011
T9 / EXAMPLE ($): COMBINED PROVINCIAL TAX CREDIT FOR MULTIMEDIA TITLES AND FEDERAL SCIENTIFIC RESEARCH AND EXPERIMENTAL DEVELOPMENT (SR&ED), 2011
Category 1 Multimedia Titles
Category 2 Multimedia Titles
Basic credit30% of eligible labour costs
26.25% of eligible labour costs
Bonus for titles available in French
7.5% of eligible labour costs
N/A
TOTAL37.5% of eligible labour costs
26.25% of eligible labour costs
Notes: (1) Limited by the company’s other expenses (2) The refundable tax credit for the production of multimedia titles
does not include R&D expenses
Assumption:• Private, foreign-controlled company• 20 eligible employees @ $50,000/year• 100% of their work related to multimedia production and SR&ED eligible activities • Company specialized in multimedia production• The multimedia titles were not commissioned and are available in French
Federal Québec Total
Wages 1,000,000 1,000,000
Prescribed proxy amount @ 65%(1) 650,000
Tax credit for the production of multimedia titles(2) 0
1,650,000 1,000,000
Federal SR&ED tax credit @ 20% and provincial tax
credit for the production of multimedia titles @ 30%
330,000 375,000 705,000
Ub
iso
ft, M
ont
réal
Refundable Tax Credit for theProduction of Multimedia Tit
/ Offered by the Government of Québec
/ Since December 19, 2002,eligible categories include
• Category 1: Titles pwithout being partcommission andfor commercia
• Category 2:
/ For titles on wbegan aftercredits arin table
04. T
AX
ES
AN
D IN
CE
NT
IVE
S
30 / Montréal International
Tax Holiday for Foreign Researchers and Experts
/ The Government of Québec established a tax holiday for foreign researchers. It became permanent in 1996 and was extended to cover foreign experts in 1999
/ It consists of a fi ve-year Québec income tax exemption allowing eligible individuals to deduct the following:
• 100% of their wages for years 1 and 2
• 75% for year 3
• 50% for year 4
• 25% for year 5
Strategic Aerospace and Defence Initiative (SADI)
/ Close to $900 million invested by the Government of Canada between 2007 and 2011
/ In its 2011 budget, the Government of Canada announced that it would ensure stable funding for SADI following a 12-18 month consultative review
/ Repayable contribution equal to 30% of a strategic R&D project’s eligible costs for Canadian aerospace and defence industries.
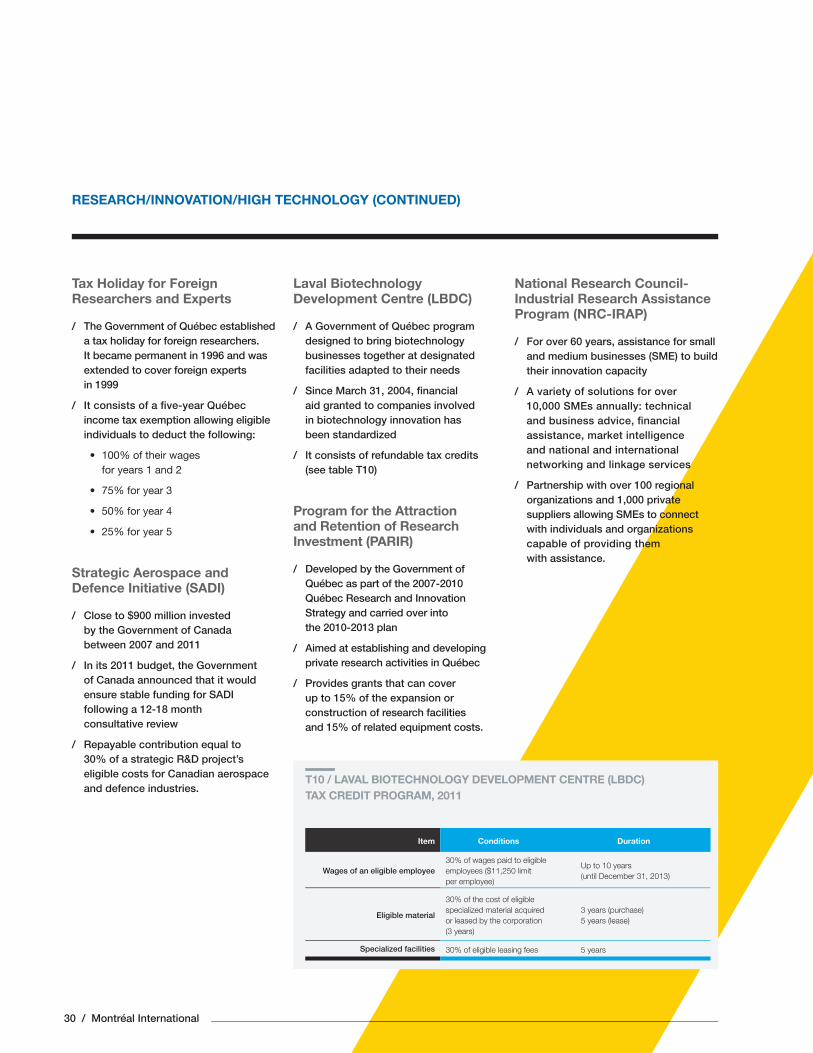
Laval Biotechnology Development Centre (LBDC)
/ A Government of Québec program designed to bring biotechnology businesses together at designated facilities adapted to their needs
/ Since March 31, 2004, fi nancial aid granted to companies involved in biotechnology innovation has been standardized
/ It consists of refundable tax credits (see table T10)
Program for the Attraction and Retention of Research Investment (PARIR)
/ Developed by the Government of Québec as part of the 2007-2010 Québec Research and Innovation Strategy and carried over into the 2010-2013 plan
/ Aimed at establishing and developing private research activities in Québec
/ Provides grants that can cover up to 15% of the expansion or construction of research facilities and 15% of related equipment costs.
National Research Council-Industrial Research Assistance Program (NRC-IRAP)
/ For over 60 years, assistance for small and medium businesses (SME) to build their innovation capacity
/ A variety of solutions for over 10,000 SMEs annually: technical and business advice, fi nancial assistance, market intelligence and national and international networking and linkage services
/ Partnership with over 100 regional organizations and 1,000 private suppliers allowing SMEs to connect with individuals and organizations capable of providing them with assistance.
T10 / LAVAL BIOTECHNOLOGY DEVELOPMENT CENTRE (LBDC) TAX CREDIT PROGRAM, 2011
Item Conditions Duration
Wages of an eligible employee30% of wages paid to eligible employees ($11,250 limit per employee)
Up to 10 years (until December 31, 2013)
Eligible material
30% of the cost of eligible specialized material acquired or leased by the corporation (3 years)
3 years (purchase) 5 years (lease)
Specialized facilities 30% of eligible leasing fees 5 years
RESEARCH/INNOVATION/HIGH TECHNOLOGY (CONTINUED)
Attractiveness Indicators 2011-2012 / 31
INVESTMENT
Strategic Support for Investment (PASI)
/ A program created by the Government of Québec in 2004
/ Assistance in the form of interest-free loans, equity-type loans, loans with interest repayable through royalties, contributions repayable through royalties or loans guarantee – a non-repayable contribution is also a possibility
/ Two types of eligible projects:
• Investments
• Development of unique products
/ Some targeted sectors: manufactur-ing, software publishing, call centres and waste recovery and processing
/ A loan guarantee can cover up to 70% of an investment’s net loss.
/ The minimum amount required is $5 million for investments and $2 million for product development projects; the Government of Québec’s Economic Project Support Program (PSPE) remains an attractive option for projects worth less these amounts
/ Government fi nancial assistance shall not exceed 50% of a project’s total cost
/ Duration of fi nancial support shall not to exceed 10 years.
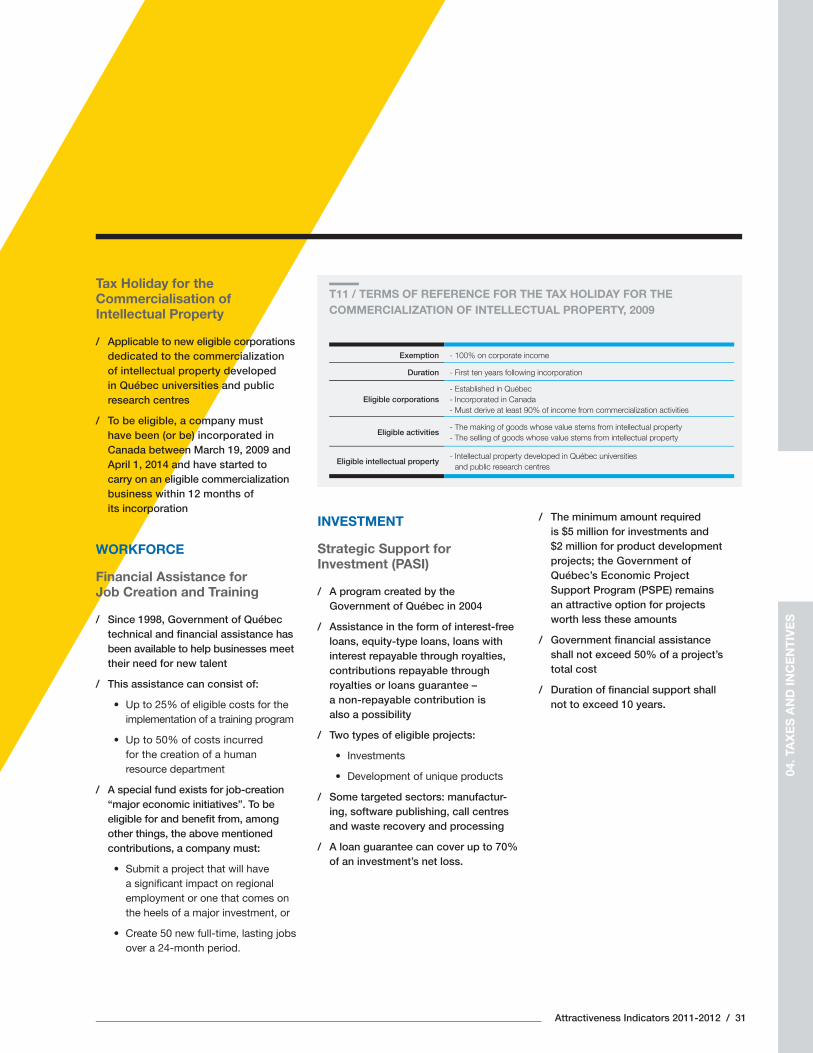
T11 / TERMS OF REFERENCE FOR THE TAX HOLIDAY FOR THE COMMERCIALIZATION OF INTELLECTUAL PROPERTY, 2009
Exemption - 100% on corporate income
Duration - First ten years following incorporation
Eligible corporations- Established in Québec - Incorporated in Canada - Must derive at least 90% of income from commercialization activities
Eligible activities- The making of goods whose value stems from intellectual property- The selling of goods whose value stems from intellectual property
Eligible intellectual property- Intellectual property developed in Québec universities
and public research centres
Tax Holiday for the Commercialisation of Intellectual Property
/ Applicable to new eligible corporations dedicated to the commercialization of intellectual property developed in Québec universities and public research centres
/ To be eligible, a company must have been (or be) incorporated in Canada between March 19, 2009 and April 1, 2014 and have started to carry on an eligible commercial ization business within 12 months of its incorporation
WORKFORCE
Financial Assistance for Job Creation and Training
/ Since 1998, Government of Québec technical and fi nancial assistance has been available to help businesses meet their need for new talent
/ This assistance can consist of:
• Up to 25% of eligible costs for the implementation of a training program
• Up to 50% of costs incurred for the creation of a human resource department
/ A special fund exists for job-creation “major economic initiatives”. To be eligible for and benefi t from, among other things, the above mentioned contributions, a company must:
• Submit a project that will have a signifi cant impact on regional employment or one that comes on the heels of a major investment, or
• Create 50 new full-time, lasting jobs over a 24-month period.
04. T
AX
ES
AN
D IN
CE
NT
IVE
S
32 / Montréal International
REAL ESTATE
PR@M-Industry
/ A program created in 2008; its eligibility period ends on December 31, 2012
/ The City of Montréal offers owners of non-residential buildings a fi ve-year general property tax rebate on the increase in property value resulting from the construction, conversion or expansion of an industrial building
/ How it works:
• A subsidy paid over a period of fi ve years as follows: 100% - 100% - 100% - 80% - 80%
• An annual subsidy ceiling of $1 million
• A three-year deadline for project completion after the eligibility date
• Eligible activities include: manufac-turing (in general); fi lm and video production; information system design; packaged software design; call centres; head offi ces (and related activities); physical science, engineering and life science R&D; architecture, engineering, specialized design and environmental consulting services; the performing arts and theatre and museum operation.
FINANCE
Refundable Tax Credits for Inter national Finance Centres (IFC)
/ Created in 1986 by the Government of Québec and amended in its 2010-2011 budget
/ Provides an annual refundable tax credit of 30% on wages paid to eligible employees
/ An IFC must have at least six employees
/ Employees must work full-time for the IFC and 75% of their duties must be devoted to carrying out qualifi ed inter-national fi nancial transactions (QIFT)
/ A refundable tax credit is allowed up to a maximum of $20,000 per employee, per year
/ Foreign specialists employed by an eligible corporation operating an IFC can claim a deduction on their Québec income tax for a period of fi ve years – the annual deduction is: 100% for years one and two, and 75%, 50% and 37.5% for years three, four and fi ve, respectively.
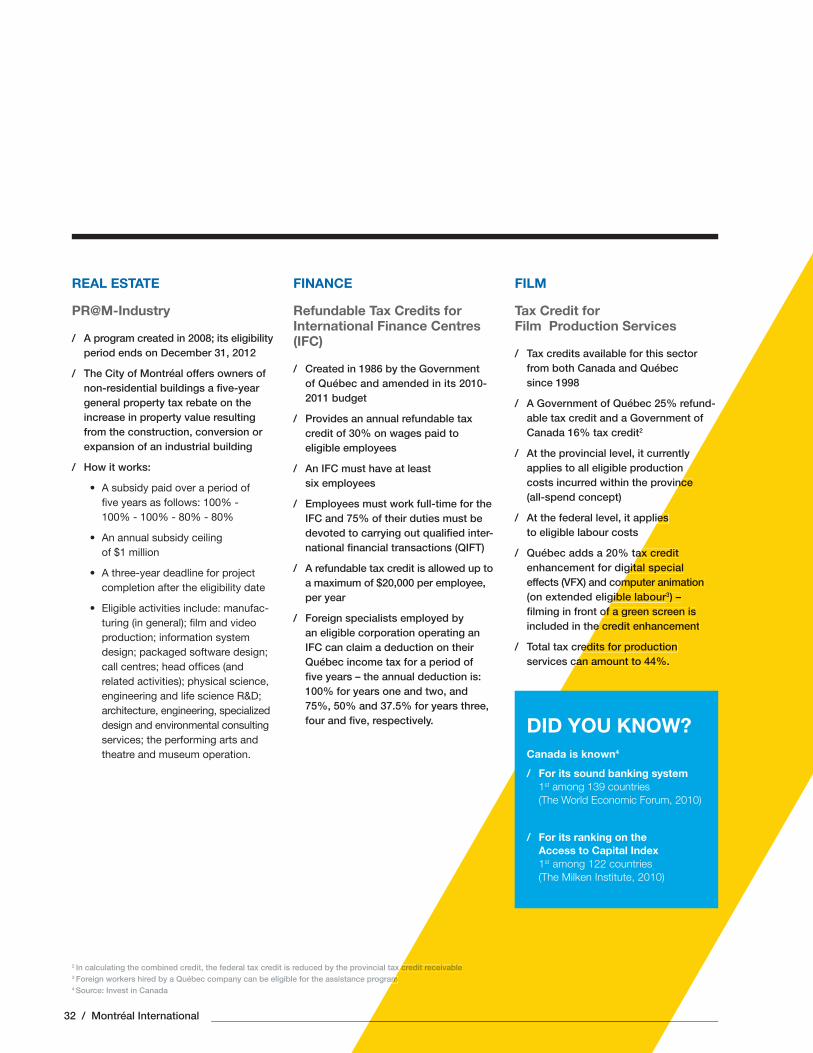
FILM
Tax Credit for Film Production Services
/ Tax credits available for this sector from both Canada and Québec since 1998
/ A Government of Québec 25% refund-able tax credit and a Government of Canada 16% tax credit2
/ At the provincial level, it currently applies to all eligible production costs incurred within the province (all-spend concept)
/ At the federal level, it applies to eligible labour costs
/ Québec adds a 20% tax credit enhancement for digital special effects (VFX) and computer animation (on extended eligible labour3) – fi lming in front of a green screen is included in the credit enhancement
/ Total tax credits for production services can amount to 44%.
2 In calculating the combined credit, the federal tax credit is reduced by the provincial tax credit receivable3 Foreign workers hired by a Québec company can be eligible for the assistance program4 Source: Invest in Canada
nce
es
ax creditgital special
omputer animation gible labour3) –
of a green screen is e credit enhancement
edits for production can amount to 44%.
x credit receivablem
DID YOU KNOW?Canada is known4
/ For its sound banking system 1st among 139 countries
(The World Economic Forum, 2010)
/ For its ranking on the Access to Capital Index
1st among 122 countries (The Milken Institute, 2010)
INNOVATIONGREATER MONTRÉAL –
A UNIQUE BLEND OF
CREATIVITY, DIVERSITY
AND HIGH TECHNOLOGY
05/ Constant interplay between
techno logy, science, art and culture explains the success, among other things, of Montréal’s high technology clusters, video game industry and creative enterprises such as the Cirque du Soleil
/ An industrial economy built on high technology clusters such as aerospace, information and communications technologies (ICT), life science and health technologies (LSHT), and cleantech
/ A critical mass of workers in higher knowledge sectors (1 out of 10 jobs)
/ A network of universities with the largest share of research funding in Canada and a broad range of expertise in hundreds of research centres
/ Effective intellectual property protection backed by international treaties.
Can
adia
n S
pac
e A
gen
cy
34 / Montréal International
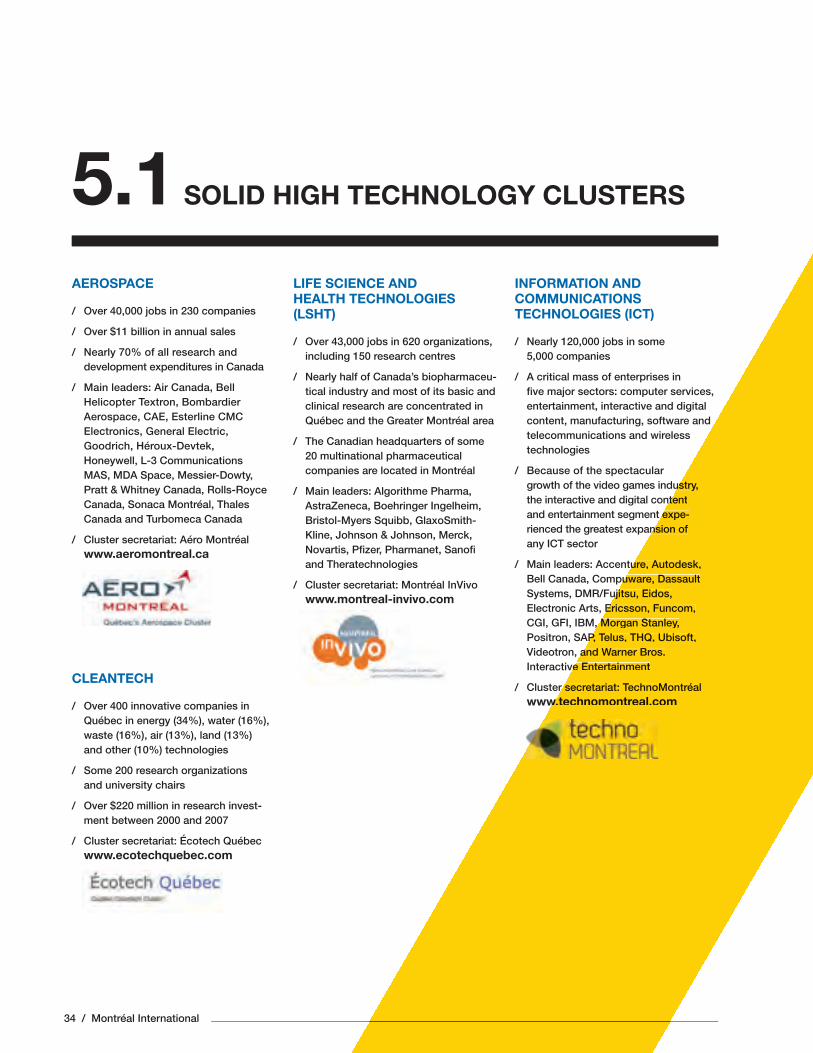
SOLID HIGH TECHNOLOGY CLUSTERS5.1AEROSPACE
/ Over 40,000 jobs in 230 companies
/ Over $11 billion in annual sales
/ Nearly 70% of all research and development expenditures in Canada
/ Main leaders: Air Canada, Bell Helicopter Textron, Bombardier Aerospace, CAE, Esterline CMC Electronics, General Electric, Goodrich, Héroux-Devtek, Honeywell, L-3 Communications MAS, MDA Space, Messier-Dowty, Pratt & Whitney Canada, Rolls-Royce Canada, Sonaca Montréal, Thales Canada and Turbomeca Canada
/ Cluster secretariat: Aéro Montréalwww.aeromontreal.ca
CLEANTECH
/ Over 400 innovative companies in Québec in energy (34%), water (16%), waste (16%), air (13%), land (13%) and other (10%) technologies
/ Some 200 research organizations and university chairs
/ Over $220 million in research invest-ment between 2000 and 2007
/ Cluster secretariat: Écotech Québec www.ecotechquebec.com
LIFE SCIENCE AND HEALTH TECHNOLOGIES (LSHT)
/ Over 43,000 jobs in 620 organizations, including 150 research centres
/ Nearly half of Canada’s biopharmaceu-tical industry and most of its basic and clinical research are concentrated in Québec and the Greater Montréal area
/ The Canadian headquarters of some 20 multinational pharmaceutical companies are located in Montréal
/ Main leaders: Algorithme Pharma, AstraZeneca, Boehringer Ingelheim, Bristol-Myers Squibb, GlaxoSmith-Kline, Johnson & Johnson, Merck, Novartis, Pfi zer, Pharmanet, Sanofi and Theratechnologies
/ Cluster secretariat: Montréal InVivo www.montreal-invivo.com
INFORMATION AND COMMUNICATIONS TECHNOLOGIES (ICT)
/ Nearly 120,000 jobs in some 5,000 companies
/ A critical mass of enterprises in fi ve major sectors: computer services, entertainment, interactive and digital content, manufacturing, software and telecommunications and wireless technologies
/ Because of the spectacular growth of the video games industry, the interactive and digital content and entertainment segment expe-rienced the greatest expansion of any ICT sector
/ Main leaders: Accenture, Autodesk, Bell Canada, Compuware, Dassault Systems, DMR/Fujitsu, Eidos, Electronic Arts, Ericsson, Funcom, CGI, GFI, IBM, Morgan Stanley, Positron, SAP, Telus, THQ, Ubisoft, Videotron, and Warner Bros. Interactive Entertainment
/ Cluster secretariat: TechnoMontréal www.technomontreal.com
ustry,ntent
t expe-nsion of
ure, Autodesk, uware, Dassault
ujitsu, Eidos,Ericsson, Funcom,
, Morgan Stanley, P, Telus, THQ, Ubisoft,
and Warner Bros. ve Entertainment
r secretariat: TechnoMontréal w.technomontreal.com
“”
Attractiveness Indicators 2011-2012 / 35
05. I
NN
OVA
TIO
N
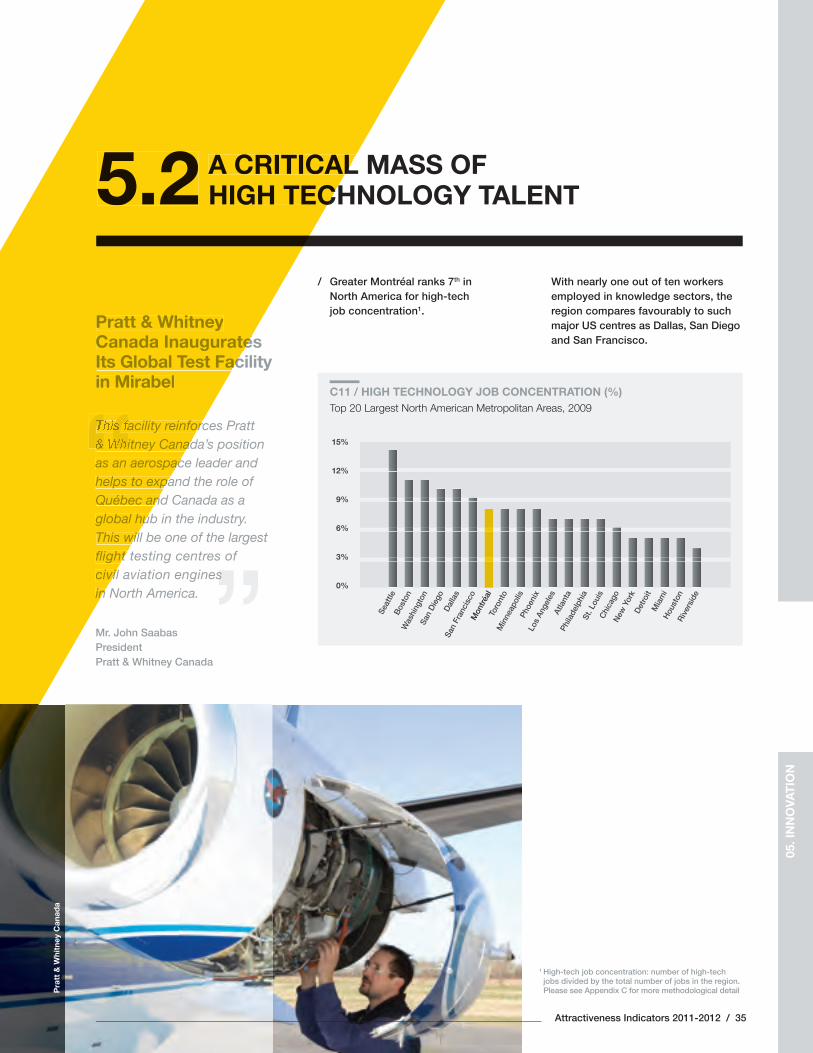
A CRITICAL MASS OF HIGH TECHNOLOGY TALENT5.2
/ Greater Montréal ranks 7th in North America for high-tech job concentration1.
With nearly one out of ten workers employed in knowledge sectors, the region compares favourably to such major US centres as Dallas, San Diego and San Francisco.
1 High-tech job concentration: number of high-tech jobs divided by the total number of jobs in the region. Please see Appendix C for more methodological detail
15%
12%
9%
6%
3%
0%
Seat
tleB
osto
nW
ashi
ngto
nSa
n D
iego
Dal
las
San
Fran
cisc
oM
ontré
alTo
ront
oM
inne
apol
isPh
oeni
xLo
s An
gele
sAt
lant
aPh
ilade
lphi
aSt
. Lou
isC
hica
goN
ew Y
ork
Det
roit
Mia
mi
Hou
ston
Riv
ersi
de
C11 / HIGH TECHNOLOGY JOB CONCENTRATION (%) Top 20 Largest North American Metropolitan Areas, 2009
Pratt & Whitney Canada Inaugurates Its Global Test Facilityin Mirabel
This facility reinforces Pratt & Whitney Canada’s position as an aerospace leader and helps to expand the role of Québec and Canada as a global hub in the industry. This will be one of the largest fl ight testing centres of civil aviation engines in North America.
Mr. John SaabasPresidentPratt & Whitney Canada
“
A CRITICALHIGH TECH5.2
Pratt & Whitney Canada InaugurateIts Global Test Facin Mirabel
facility reinforc
““& Whitney Canad““as an aerospachelps to expaQuébec anglobal huThis wilfl ight civilin
Pra
tt &
Whi
tney
Can
ada
La v
itri
ne,
Mo
ntré
al
36 / Montréal International
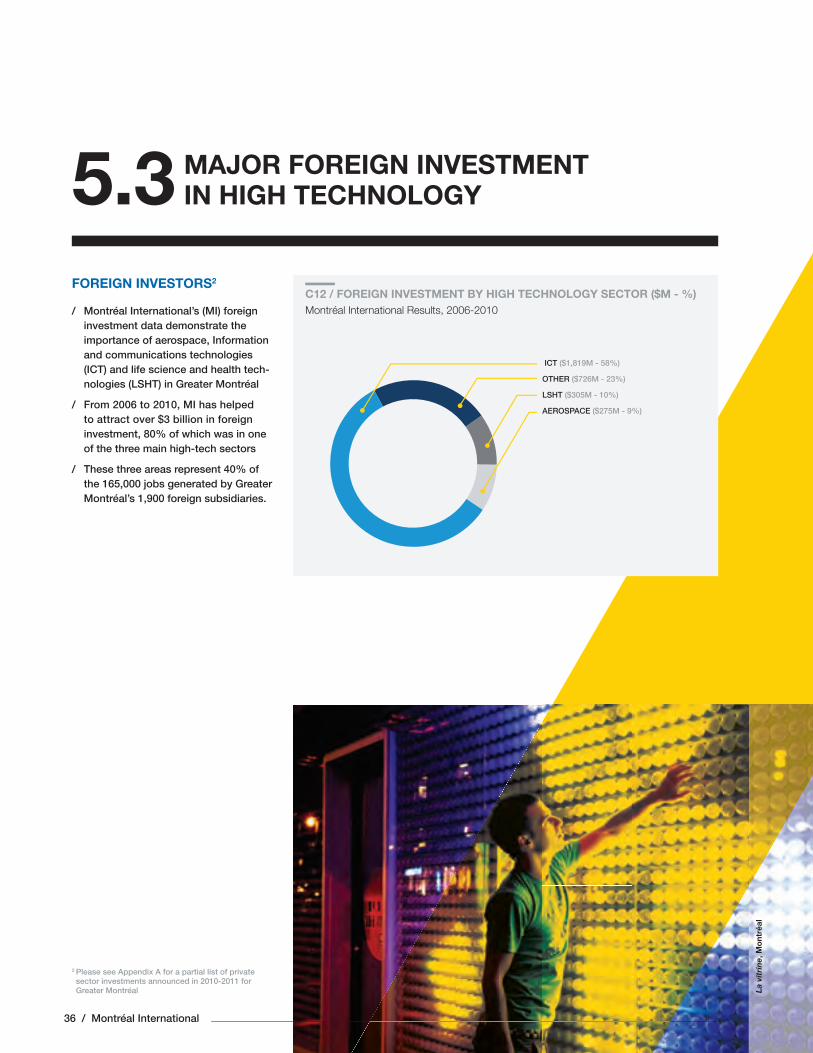
MAJOR FOREIGN INVESTMENT IN HIGH TECHNOLOGY5.3
2 Please see Appendix A for a partial list of private sector investments announced in 2010-2011 for Greater Montréal
FOREIGN INVESTORS2
/ Montréal International’s (MI) foreign investment data demonstrate the importance of aerospace, Information and communications technologies (ICT) and life science and health tech-nologies (LSHT) in Greater Montréal
/ From 2006 to 2010, MI has helped to attract over $3 billion in foreign investment, 80% of which was in one of the three main high-tech sectors
/ These three areas represent 40% of the 165,000 jobs generated by Greater Montréal’s 1,900 foreign subsidiaries.
ICT ($1,819M - 58%)
OTHER ($726M - 23%)
LSHT ($305M - 10%)
AEROSPACE ($275M - 9%)
C12 / FOREIGN INVESTMENT BY HIGH TECHNOLOGY SECTOR ($M - %) Montréal International Results, 2006-2010
Attractiveness Indicators 2011-2012 / 37
AN IDEAL R&D ENVIRONMENT FOR BUSINESSES5.4 AN IDEAL RFOR BUSIN5.4
Mon
tréal
Toro
nto
Vanc
ouve
rO
ttaw
aC
alga
ry
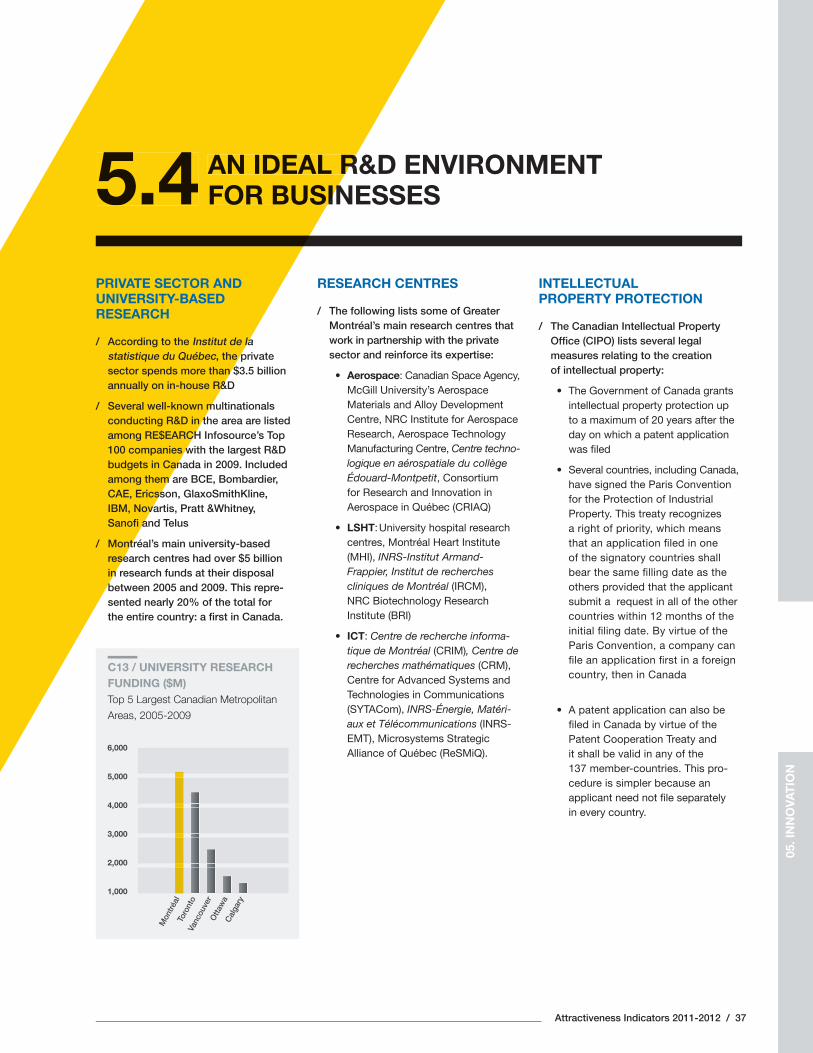
C13 / UNIVERSITY RESEARCH FUNDING ($M)Top 5 Largest Canadian Metropolitan
Areas, 2005-2009
6,000
5,000
4,000
3,000
2,000
1,000
PRIVATE SECTOR AND UNIVERSITY-BASED RESEARCH
/ According to the Institut de la statistique du Québec, the private sector spends more than $3.5 billion annually on in-house R&D
/ Several well-known multinationals conducting R&D in the area are listed among RE$EARCH Infosource’s Top 100 companies with the largest R&D budgets in Canada in 2009. Included among them are BCE, Bombardier, CAE, Ericsson, GlaxoSmithKline, IBM, Novartis, Pratt &Whitney, Sanofi and Telus
/ Montréal’s main university-based research centres had over $5 billion in research funds at their disposal between 2005 and 2009. This repre-sented nearly 20% of the total for the entire country: a fi rst in Canada.
RESEARCH CENTRES
/ The following lists some of Greater Montréal’s main research centres that work in partnership with the private sector and reinforce its expertise:
• Aerospace: Canadian Space Agency, McGill University’s Aerospace Materials and Alloy Development Centre, NRC Institute for Aerospace Research, Aerospace Technology Manufacturing Centre, Centre techno-logique en aérospatiale du collège Édouard-Montpetit, Consortium for Research and Innovation in Aerospace in Québec (CRIAQ)
• LSHT: University hospital research centres, Montréal Heart Institute (MHI), INRS-Institut Armand-Frappier, Institut de recherches cliniques de Montréal (IRCM), NRC Biotechnology Research Institute (BRI)
• ICT: Centre de recherche informa-tique de Montréal (CRIM), Centre de recherches mathématiques (CRM), Centre for Advanced Systems and Technologies in Communications (SYTACom), INRS-Énergie, Matéri-aux et Télécommunications (INRS-EMT), Microsystems Strategic Alliance of Québec (ReSMiQ).
INTELLECTUAL PROPERTY PROTECTION
/ The Canadian Intellectual Property Offi ce (CIPO) lists several legal measures relating to the creation of intellectual property:
• The Government of Canada grants intellectual property protection up to a maximum of 20 years after the day on which a patent application was fi led
• Several countries, including Canada, have signed the Paris Convention for the Protection of Industrial Property. This treaty recognizes a right of priority, which means that an application fi led in one of the signatory countries shall bear the same fi lling date as the others provided that the applicant submit a request in all of the other countries within 12 months of the initial fi ling date. By virtue of the Paris Convention, a company can fi le an application fi rst in a foreign country, then in Canada
• A patent application can also be fi led in Canada by virtue of the Patent Cooperation Treaty and it shall be valid in any of the 137 member-countries. This pro-cedure is simpler because an applicant need not fi le separately in every country.
05. I
NN
OVA
TIO
N
38 / Montréal International
A THRIVING NORTH AMERICAN VENTURE CAPITAL MARKET 5.5
/ In an economy centred on high technology clusters, access to venture capital is essential for stimulating innovation.
/ Over $5 billion in venture capital was invested in the region between 2000 and 2010. This represented 20% of all Venture Capital funding in Canada. It is worth noting that Greater Montréal’s life sciences sector attracted almost 35% of this money: a fi rst in Canada.
/ Greater Montréal ranked 2nd for the largest amount of investment money among Canadian metropolitan areas in 2010 with a total of $292 million or 26% of the total for the entire country.
3 Source: MONTRÉAL F1RST, 2011
DID YOU KNOW?Greater Montréal is the source of many innovations. Here are 12 compelling examples3:
/ In April 2008, CAE designed and built the fi rst A380 simulator for Airbus, which obtained a D level certifi cation, the highest awarded for fl ight simulators
/ In April 2009, a team at the Université de Montréal’s Institut de recherche en immunologie et en cancérologie (IRIC) succeeded in producing a large quantity of laboratory stem cells from a small number of blood stem cells obtained from bone marrow
/ Genia Photonics has developed a new generation of fi bre-optic based pulsed laser system that offer the capability to switch rapidly between imaging, diagnostic and treatment functions
/ Sensio Technologies led the way in making the 2010 FIFA World Cup available in live 3D in theatres around the world
/ Object Research System (ORS) designed ORS Visual, a software solution that allows the review and analysis of images generated by different medical scanning devices
/ Effenco’s patented Head system can convert new and used trucks into hybrid vehicles and generate a 15% to 25% reduction in fuel consumption per vehicle
/ Longueuil-based D-BOX Techno-logies designs and manufactures leading edge high technology motion systems mainly suited to the needs of the entertainment industry
/ Caprion Proteomics developed CellCarta, a unique proteomic platform for profi ling proteins in solid tissues and plasma and pre-dicting drug treatment effectiveness
/ The City of Montréal’s BIXI is the world’s fi rst self-serve, solar energy powered bicycle system
/ René Roy, professor and researcher in the Department of Chemistry of the Université du Québec à Montréal (UQAM), and his team developed and marketed a synthetic vaccine for meningitis and pneumonia
/ The Montréal company, gsmprjct°, invented an interactive electronic high resolution telescope, Tellscope, which is currently installed on the 124th-fl oor observatory of the world’s tallest building, the Burj Khalifa, in Dubai
/ To decontaminate underground water, Golder Associates installed a reactive barrier in the soil, made up of shafts into which they injected iron powder suspended in a liquid mixture consisting of, among other things, soy milk and food additives.
Attractiveness Indicators 2011-2012 / 39
QUALITY OF LIFE GREATER MONTRÉAL –
A CITY WITH A HUMAN
DIMENSION AND A GREAT
PLACE TO LIVE, WORK
AND ENJOY LIFE
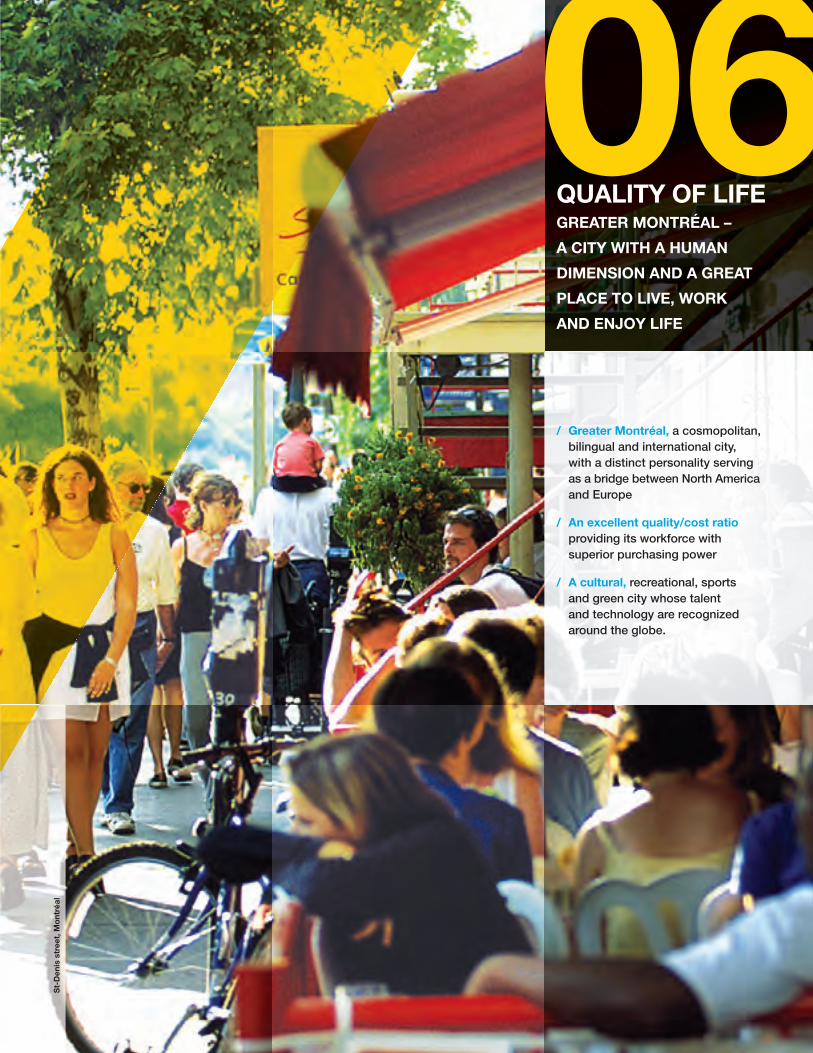
06/ Greater Montréal, a cosmopolitan,
bilingual and international city, with a distinct personality serving as a bridge between North America and Europe
/ An excellent quality/cost ratio providing its workforce with superior purchasing power
/ A cultural, recreational, sports and green city whose talent and technology are recognized around the globe.
St-
Den
is s
tree
t, M
ont
réal
40 / Montréal International
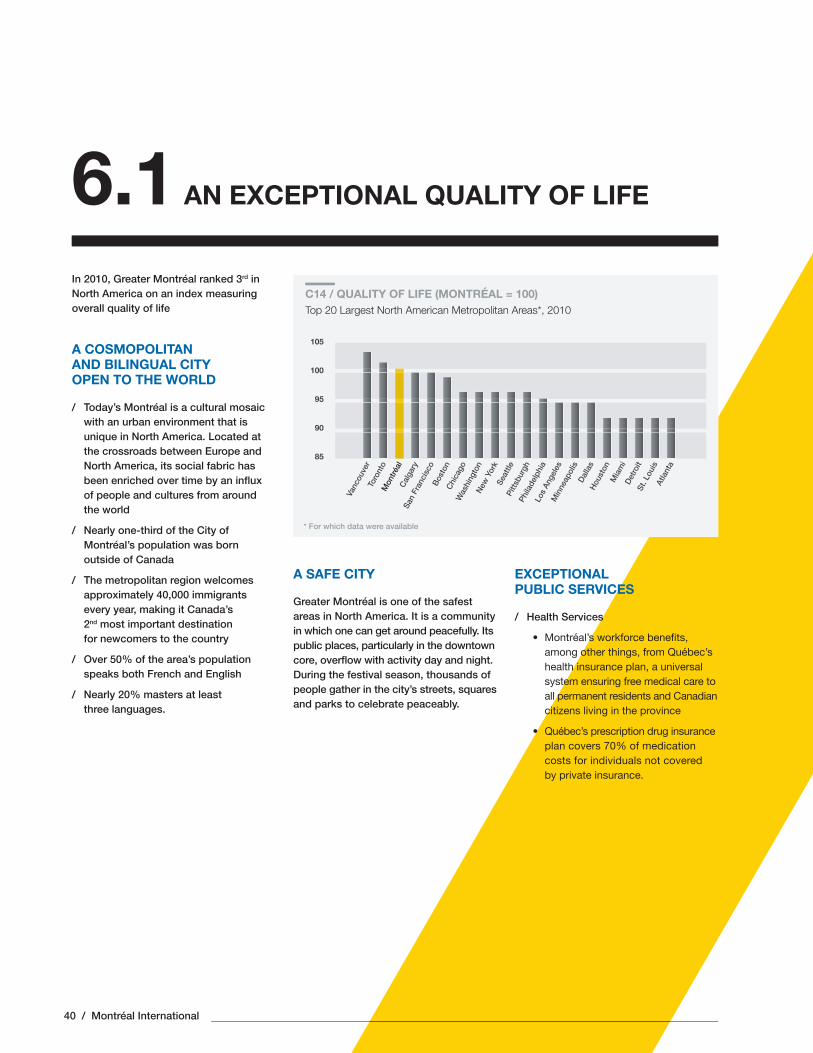
AN EXCEPTIONAL QUALITY OF LIFE6.1In 2010, Greater Montréal ranked 3rd in North America on an index measuring overall quality of life
A COSMOPOLITAN AND BILINGUAL CITY OPEN TO THE WORLD
/ Today’s Montréal is a cultural mosaic with an urban environment that is unique in North America. Located at the crossroads between Europe and North America, its social fabric has been enriched over time by an infl ux of people and cultures from around the world
/ Nearly one-third of the City of Montréal’s population was born outside of Canada
/ The metropolitan region welcomes approximately 40,000 immigrants every year, making it Canada’s 2nd most important destination for newcomers to the country
/ Over 50% of the area’s population speaks both French and English
/ Nearly 20% masters at least three languages.
C14 / QUALITY OF LIFE (MONTRÉAL = 100)Top 20 Largest North American Metropolitan Areas*, 2010
Vanc
ouve
rTo
ront
oM
ontré
alC
alga
rySa
n Fr
anci
sco
Bos
ton
Chi
cago
Was
hing
ton
New
Yor
kSe
attle
Pitts
burg
hPh
ilade
lphi
aLo
s An
gele
sM
inne
apol
isD
alla
sH
oust
onM
iam
iD
etro
itSt
. Lou
isAt
lant
a
* For which data were available
A SAFE CITY
Greater Montréal is one of the safest areas in North America. It is a community in which one can get around peacefully. Its public places, particularly in the downtown core, overfl ow with activity day and night. During the festival season, thousands of people gather in the city’s streets, squares and parks to celebrate peaceably.
EXCEPTIONAL PUBLIC SERVICES
/ Health Services
• Montréal’s workforce benefi ts, among other things, from Québec’s health insurance plan, a universal system ensuring free medical care to all permanent residents and Canadian citizens living in the province
• Québec’s prescription drug insurance plan covers 70% of medication costs for individuals not covered by private insurance.
105
100
95
90
85
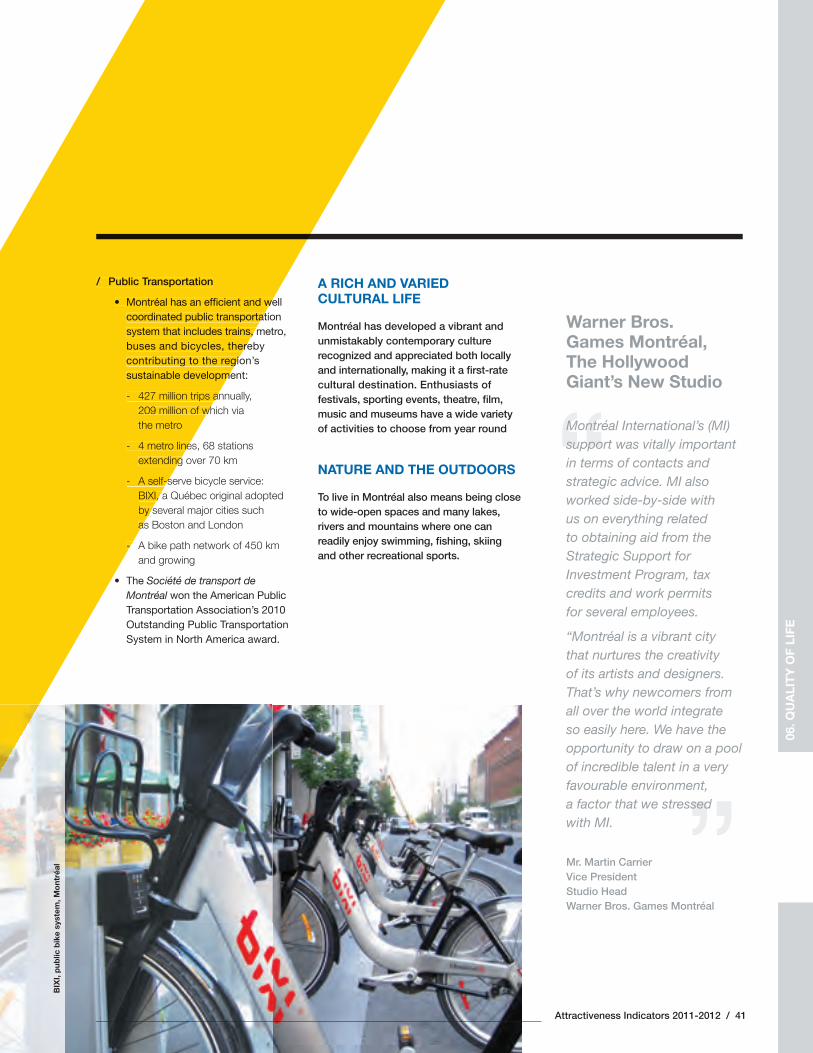
Attractiveness Indicators 2011-2012 / 41
“
”06
. QU
ALI
TY
OF
LIFE
/ Public Transportation
• Montréal has an effi cient and well coordinated public transportation system that includes trains, metro, buses and bicycles, thereby contributing to the region’s sustainable development:
- 427 million trips annually, 209 million of which via the metro
- 4 metro lines, 68 stations extending over 70 km
- A self-serve bicycle service: BIXI, a Québec original adopted by several major cities such as Boston and London
- A bike path network of 450 km and growing
• The Société de transport de Montréal won the American Public Transportation Association’s 2010 Outstanding Public Transportation System in North America award.
A RICH AND VARIED CULTURAL LIFE
Montréal has developed a vibrant and unmistakably contemporary culture recognized and appreciated both locally and internationally, making it a fi rst-rate cultural destination. Enthusiasts of festivals, sporting events, theatre, fi lm, music and museums have a wide variety of activities to choose from year round
NATURE AND THE OUTDOORS
To live in Montréal also means being close to wide-open spaces and many lakes, rivers and mountains where one can readily enjoy swimming, fi shing, skiing and other recreational sports.
/ Public Transportation
• Montréal has an effi cient and wecoordinated public transportatsystem that includes trains, buses and bicycles, therecontributing to the regiosustainable developme
- 427 million trips an209 million of whthe metro
- 4 metro lineextending
- A self-sBIXI, by sas
-
Warner Bros. Games Montréal, The Hollywood Giant’s New Studio
Montréal International’s (MI) support was vitally important in terms of contacts and strategic advice. MI also worked side-by-side with us on everything related to obtaining aid from the Strategic Support for Investment Program, tax credits and work permits for several employees.
“Montréal is a vibrant city that nurtures the creativity of its artists and designers. That’s why newcomers from all over the world integrate so easily here. We have the opportunity to draw on a pool of incredible talent in a very favourable environment, a factor that we stressed with MI.
Mr. Martin CarrierVice PresidentStudio HeadWarner Bros. Games Montréal
BIX
I, p
ublic
bik
e sy
stem
, Mo
ntré
al
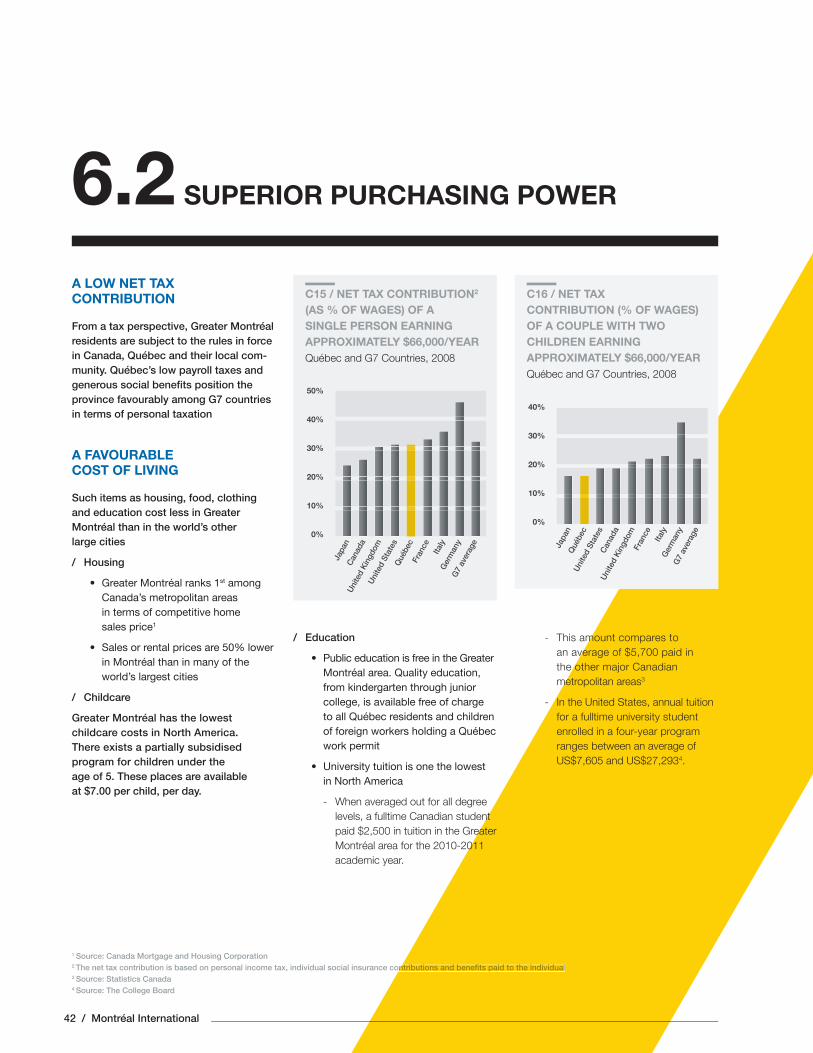
1 Source: Canada Mortgage and Housing Corporation 2 The net tax contribution is based on personal income tax, individual social insurance contributions and benefi ts paid to the individual3 Source: Statistics Canada4 Source: The College Board
ontributions and benefi ts paid to the individual
42 / Montréal International
SUPERIOR PURCHASING POWER6.2A LOW NET TAX CONTRIBUTION
From a tax perspective, Greater Montréal residents are subject to the rules in force in Canada, Québec and their local com-munity. Québec’s low payroll taxes and generous social benefi ts position the province favourably among G7 countries in terms of personal taxation
A FAVOURABLE COST OF LIVING
Such items as housing, food, clothing and education cost less in Greater Montréal than in the world’s other large cities
/ Housing
• Greater Montréal ranks 1st among Canada’s metropolitan areas in terms of competitive home sales price1
• Sales or rental prices are 50% lower in Montréal than in many of the world’s largest cities
/ Childcare
Greater Montréal has the lowest childcare costs in North America. There exists a partially subsidised program for children under the age of 5. These places are available at $7.00 per child, per day.
/ Education
• Public education is free in the Greater Montréal area. Quality education, from kindergarten through junior college, is available free of charge to all Québec residents and children of foreign workers holding a Québec work permit
• University tuition is one the lowest in North America
- When averaged out for all degree levels, a fulltime Canadian student paid $2,500 in tuition in the Greater Montréal area for the 2010-2011 academic year.
- This amount compares to an average of $5,700 paid in the other major Canadian metropolitan areas3
- In the United States, annual tuition for a fulltime university student enrolled in a four-year program ranges between an average of US$7,605 and US$27,2934.
Japa
n C
anad
aU
nite
d K
ingd
omU
nite
d St
ates
Qué
bec
Fra
nce
Italy
Ger
man
yG
7 av
erag
e
C15 / NET TAX CONTRIBUTION2 (AS % OF WAGES) OF A SINGLE PERSON EARNING APPROXIMATELY $66,000/YEARQuébec and G7 Countries, 2008
50%
40%
30%
20%
10%
0%
C16 / NET TAX CONTRIBUTION (% OF WAGES) OF A COUPLE WITH TWO CHILDREN EARNING APPROXIMATELY $66,000/YEARQuébec and G7 Countries, 2008
40%
30%
20%
10%
0%
Japa
nQ
uébe
cU
nite
d St
ates
Can
ada
Uni
ted
Kin
gdom
Fra
nce
Italy
Ger
man
yG
7 av
erag
e
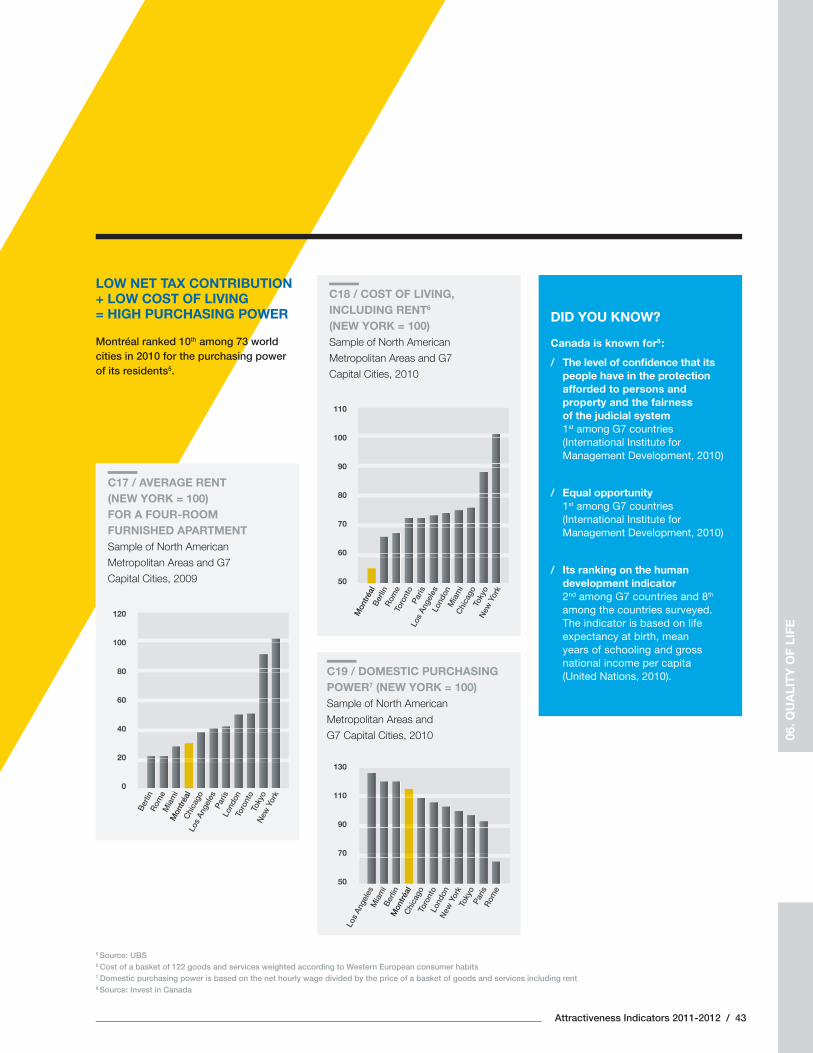
Attractiveness Indicators 2011-2012 / 43
LOW NET TAX CONTRIBUTION+ LOW COST OF LIVING= HIGH PURCHASING POWER
Montréal ranked 10th among 73 world cities in 2010 for the purchasing power of its residents5.
5 Source: UBS6 Cost of a basket of 122 goods and services weighted according to Western European consumer habits7 Domestic purchasing power is based on the net hourly wage divided by the price of a basket of goods and services including rent8 Source: Invest in Canada
DID YOU KNOW?
Canada is known for8 :
/ The level of confi dence that its people have in the protection afforded to persons and property and the fairness of the judicial system 1st among G7 countries (International Institute for Management Development, 2010)
/ Equal opportunity1st among G7 countries (International Institute for Management Development, 2010)
/ Its ranking on the human development indicator 2nd among G7 countries and 8th among the countries surveyed. The indicator is based on life expectancy at birth, mean years of schooling and gross national income per capita (United Nations, 2010).
C18 / COST OF LIVING, INCLUDING RENT6 (NEW YORK = 100)Sample of North American
Metropolitan Areas and G7
Capital Cities, 2010
C19 / DOMESTIC PURCHASING POWER7 (NEW YORK = 100)Sample of North American
Metropolitan Areas and
G7 Capital Cities, 2010
Los
Ange
les
Mia
mi
Ber
linM
ontré
alC
hica
goTo
ront
oLo
ndon
New
Yor
kTo
kyo
Paris
Rom
e
Mon
tréal
Ber
linR
ome
Toro
nto
Paris
Los
Ange
les
Lond
onM
iam
iC
hica
goTo
kyo
New
Yor
k
C17 / AVERAGE RENT (NEW YORK = 100)FOR A FOUR-ROOM FURNISHED APARTMENTSample of North American
Metropolitan Areas and G7
Capital Cities, 2009
120
100
80
60
40
20
0
Ber
linR
ome
Mia
mi
Mon
tréal
Chi
cago
Los
Ange
les
Paris
Lond
onTo
ront
oTo
kyo
New
Yor
k
06. Q
UA
LIT
Y O
F LI
FE
130
110
90
70
50
110
100
90
80
70
60
50
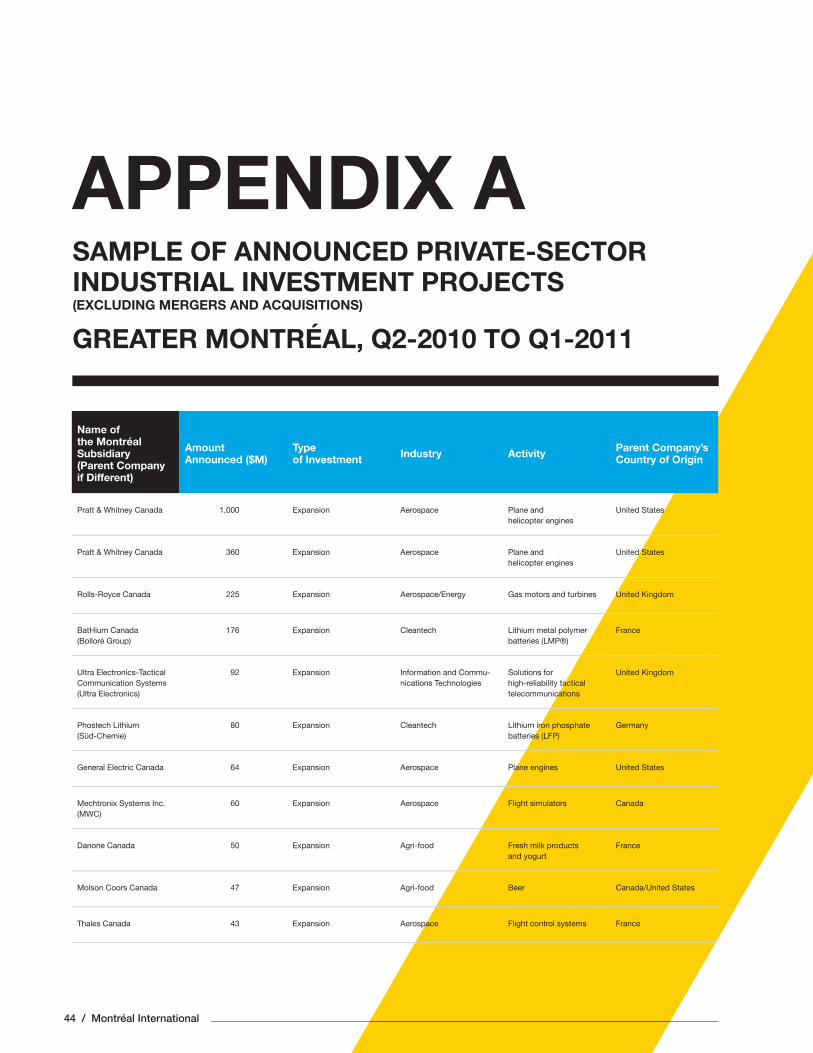
44 / Montréal International
SAMPLE OF ANNOUNCED PRIVATE-SECTOR INDUSTRIAL INVESTMENT PROJECTS(EXCLUDING MERGERS AND ACQUISITIONS)
GREATER MONTRÉAL, Q2-2010 TO Q1-2011
APPENDIX A
Name of the Montréal Subsidiary (Parent Company if Different)
Amount Announced ($M)
Type of Investment Industry Activity Parent Company’s
Country of Origin
Pratt & Whitney Canada 1,000 Expansion Aerospace Plane and helicopter engines
United States
Pratt & Whitney Canada 360 Expansion Aerospace Plane and helicopter engines
United States
Rolls-Royce Canada 225 Expansion Aerospace/Energy Gas motors and turbines United Kingdom
BatHium Canada (Bolloré Group)
176 Expansion Cleantech Lithium metal polymer batteries (LMP®)
France
Ultra Electronics-Tactical Communication Systems(Ultra Electronics)
92 Expansion Information and Commu-nications Technologies
Solutions for high-reliability tactical telecommunications
United Kingdom
Phostech Lithium (Süd-Chemie)
80 Expansion Cleantech Lithium iron phosphate batteries (LFP)
Germany
General Electric Canada 64 Expansion Aerospace Plane engines United States
Mechtronix Systems Inc. (MWC)
60 Expansion Aerospace Flight simulators Canada
Danone Canada 50 Expansion Agri-food Fresh milk products and yogurt
France
Molson Coors Canada 47 Expansion Agri-food Beer Canada/United States
Thales Canada 43 Expansion Aerospace Flight control systems France
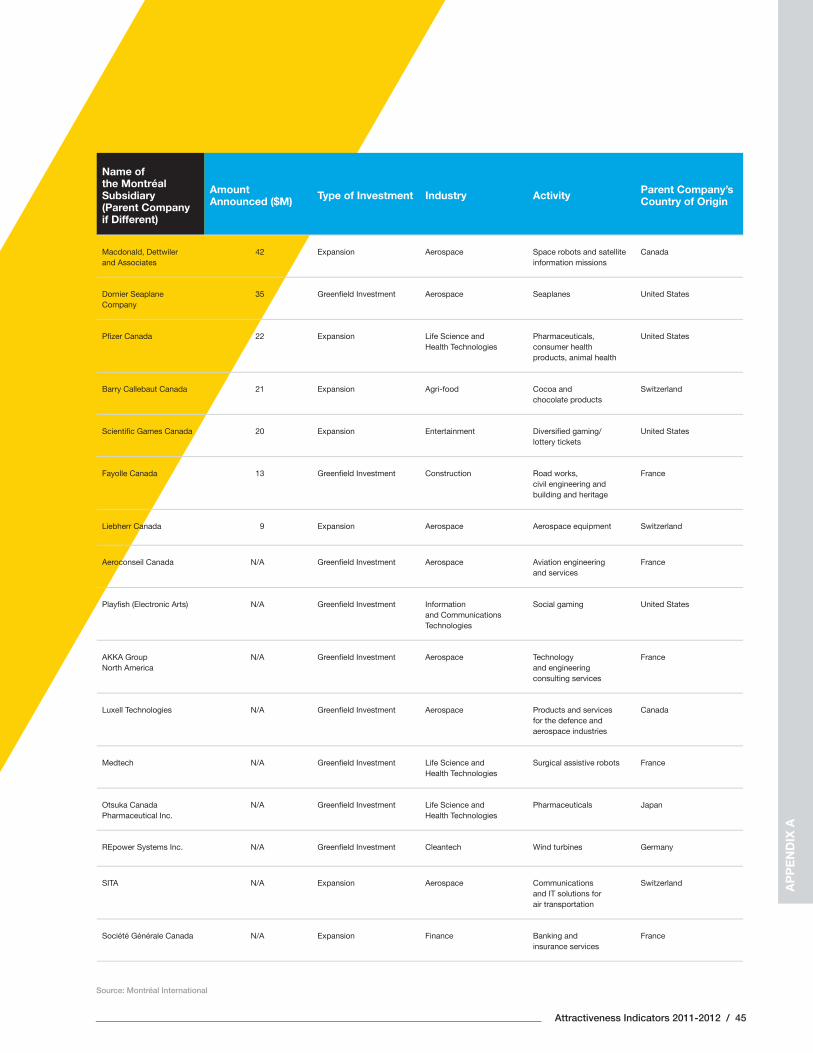
Attractiveness Indicators 2011-2012 / 45
AP
PE
ND
IX A
Name of the Montréal Subsidiary (Parent Company if Different)
Amount Announced ($M) Type of Investment Industry Activity Parent Company’s
Country of Origin
Macdonald, Dettwiler and Associates
42 Expansion Aerospace Space robots and satellite information missions
Canada
Dornier Seaplane Company
35 Greenfi eld Investment Aerospace Seaplanes United States
Pfi zer Canada 22 Expansion Life Science and Health Technologies
Pharmaceuticals, consumer health products, animal health
United States
Barry Callebaut Canada 21 Expansion Agri-food Cocoa and chocolate products
Switzerland
Scientifi c Games Canada 20 Expansion Entertainment Diversifi ed gaming/lottery tickets
United States
Fayolle Canada 13 Greenfi eld Investment Construction Road works, civil engineering and building and heritage
France
Liebherr Canada 9 Expansion Aerospace Aerospace equipment Switzerland
Aeroconseil Canada N/A Greenfi eld Investment Aerospace Aviation engineering and services
France
Playfi sh (Electronic Arts) N/A Greenfi eld Investment Information and Communications Technologies
Social gaming United States
AKKA Group North America
N/A Greenfi eld Investment Aerospace Technology and engineering consulting services
France
Luxell Technologies N/A Greenfi eld Investment Aerospace Products and services for the defence and aerospace industries
Canada
Medtech N/A Greenfi eld Investment Life Science and Health Technologies
Surgical assistive robots France
Otsuka Canada Pharmaceutical Inc.
N/A Greenfi eld Investment Life Science and Health Technologies
Pharmaceuticals Japan
REpower Systems Inc. N/A Greenfi eld Investment Cleantech Wind turbines Germany
SITA N/A Expansion Aerospace Communications and IT solutions for air transportation
Switzerland
Société Générale Canada N/A Expansion Finance Banking and insurance services
France
Source: Montréal International
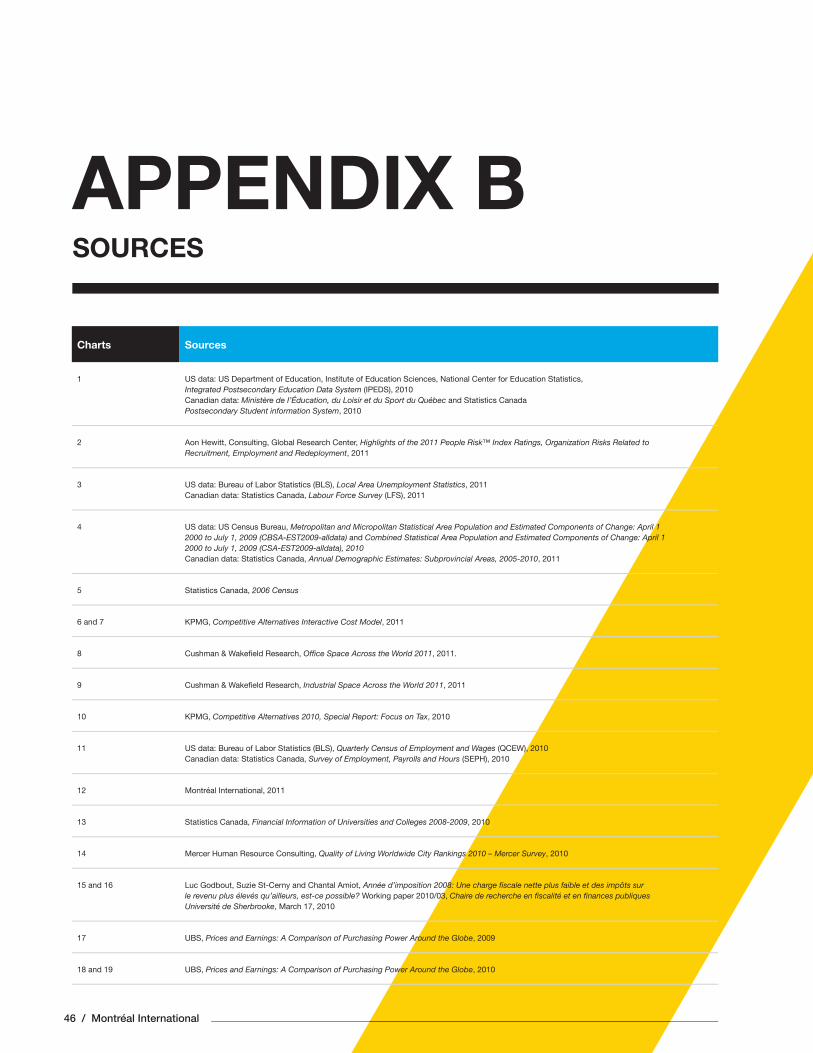
46 / Montréal International
SOURCES
APPENDIX B
Charts Sources
1 US data: US Department of Education, Institute of Education Sciences, National Center for Education Statistics, Integrated Postsecondary Education Data System (IPEDS), 2010Canadian data: Ministère de I’Éducation, du Loisir et du Sport du Québec and Statistics CanadaPostsecondary Student information System, 2010
2 Aon Hewitt, Consulting, Global Research Center, Highlights of the 2011 People Risk™ Index Ratings, Organization Risks Related to Recruitment, Employment and Redeployment, 2011
3 US data: Bureau of Labor Statistics (BLS), Local Area Unemployment Statistics, 2011Canadian data: Statistics Canada, Labour Force Survey (LFS), 2011
4 US data: US Census Bureau, Metropolitan and Micropolitan Statistical Area Population and Estimated Components of Change: April 1 2000 to July 1, 2009 (CBSA-EST2009-alldata) and Combined Statistical Area Population and Estimated Components of Change: April 1 2000 to July 1, 2009 (CSA-EST2009-alldata), 2010Canadian data: Statistics Canada, Annual Demographic Estimates: Subprovincial Areas, 2005-2010, 2011
5 Statistics Canada, 2006 Census
6 and 7 KPMG, Competitive Alternatives Interactive Cost Model, 2011
8 Cushman & Wakefi eld Research, Offi ce Space Across the World 2011, 2011.
9 Cushman & Wakefi eld Research, Industrial Space Across the World 2011, 2011
10 KPMG, Competitive Alternatives 2010, Special Report: Focus on Tax, 2010
11 US data: Bureau of Labor Statistics (BLS), Quarterly Census of Employment and Wages (QCEW), 2010Canadian data: Statistics Canada, Survey of Employment, Payrolls and Hours (SEPH), 2010
12 Montréal International, 2011
13 Statistics Canada, Financial Information of Universities and Colleges 2008-2009, 2010
14 Mercer Human Resource Consulting, Quality of Living Worldwide City Rankings 2010 – Mercer Survey, 2010
15 and 16 Luc Godbout, Suzie St-Cerny and Chantal Amiot, Année d’imposition 2008: Une charge fi scale nette plus faible et des impôts sur le revenu plus élevés qu’ailleurs, est-ce possible? Working paper 2010/03, Chaire de recherche en fi scalité et en fi nances publiques Université de Sherbrooke, March 17, 2010
17 UBS, Prices and Earnings: A Comparison of Purchasing Power Around the Globe, 2009
18 and 19 UBS, Prices and Earnings: A Comparison of Purchasing Power Around the Globe, 2010
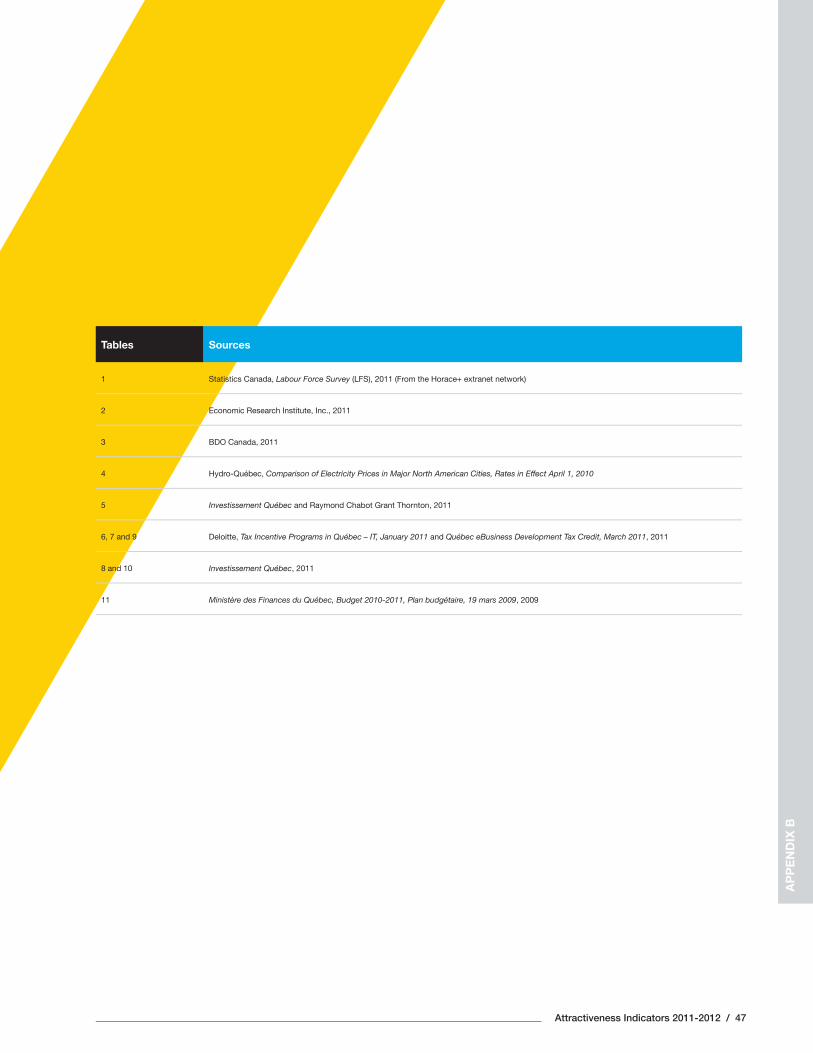
Attractiveness Indicators 2011-2012 / 47
Tables Sources
1 Statistics Canada, Labour Force Survey (LFS), 2011 (From the Horace+ extranet network)
2 Economic Research Institute, Inc., 2011
3 BDO Canada, 2011
4 Hydro-Québec, Comparison of Electricity Prices in Major North American Cities, Rates in Effect April 1, 2010
5 Investissement Québec and Raymond Chabot Grant Thornton, 2011
6, 7 and 9 Deloitte, Tax Incentive Programs in Québec – IT, January 2011 and Québec eBusiness Development Tax Credit, March 2011, 2011
8 and 10 Investissement Québec, 2011
11 Ministère des Finances du Québec, Budget 2010-2011, Plan budgétaire, 19 mars 2009, 2009
AP
PE
ND
IX B
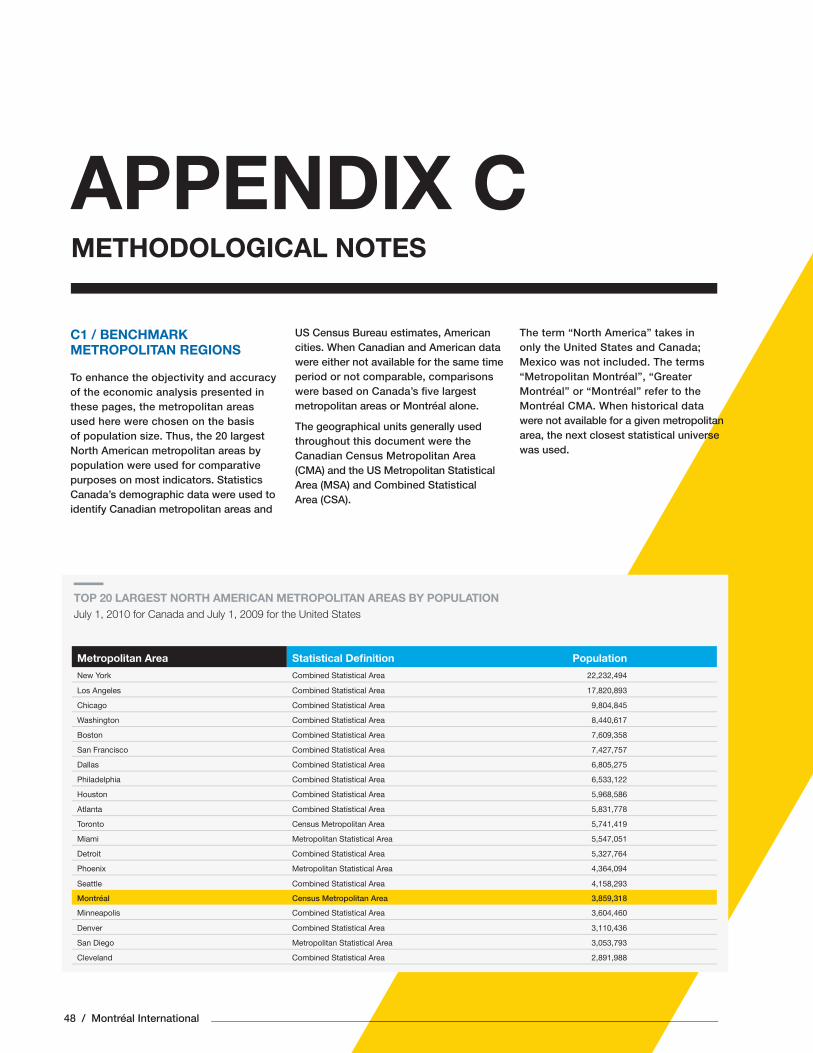
48 / Montréal International
METHODOLOGICAL NOTES
APPENDIX C
C1 / BENCHMARK METROPOLITAN REGIONS
To enhance the objectivity and accuracy of the economic analysis presented in these pages, the metropolitan areas used here were chosen on the basis of population size. Thus, the 20 largest North American metropolitan areas by population were used for comparative purposes on most indicators. Statistics Canada’s demographic data were used to identify Canadian metropolitan areas and
US Census Bureau estimates, American cities. When Canadian and American data were either not available for the same time period or not comparable, comparisons were based on Canada’s fi ve largest metropolitan areas or Montréal alone.
The geographical units generally used throughout this document were the Canadian Census Metropolitan Area (CMA) and the US Metropolitan Statistical Area (MSA) and Combined Statistical Area (CSA).
The term “North America” takes in only the United States and Canada; Mexico was not included. The terms “Metropolitan Montréal”, “Greater Montréal” or “Montréal” refer to the Montréal CMA. When historical data were not available for a given metropolitan area, the next closest statistical universe was used.
Metropolitan Area Statistical Defi nition Population
New York Combined Statistical Area 22,232,494
Los Angeles Combined Statistical Area 17,820,893
Chicago Combined Statistical Area 9,804,845
Washington Combined Statistical Area 8,440,617
Boston Combined Statistical Area 7,609,358
San Francisco Combined Statistical Area 7,427,757
Dallas Combined Statistical Area 6,805,275
Philadelphia Combined Statistical Area 6,533,122
Houston Combined Statistical Area 5,968,586
Atlanta Combined Statistical Area 5,831,778
Toronto Census Metropolitan Area 5,741,419
Miami Metropolitan Statistical Area 5,547,051
Detroit Combined Statistical Area 5,327,764
Phoenix Metropolitan Statistical Area 4,364,094
Seattle Combined Statistical Area 4,158,293
Montréal Census Metropolitan Area 3,859,318
Minneapolis Combined Statistical Area 3,604,460
Denver Combined Statistical Area 3,110,436
San Diego Metropolitan Statistical Area 3,053,793
Cleveland Combined Statistical Area 2,891,988
TOP 20 LARGEST NORTH AMERICAN METROPOLITAN AREAS BY POPULATIONJuly 1, 2010 for Canada and July 1, 2009 for the United States
Attractiveness Indicators 2011-2012 / 49
C2 / TYPES OF INDICATORS ANALYSED: VOLUME AND INTENSITY
Since Montréal ranks 16th for population among the 20 largest North American metropolitan areas, it does not always compare well on volume indicators. All things being equal, the larger a metro-politan area’s population, the greater its chances of developing a critical mass of businesses, students, jobs, etc.
At times, intensity is as important as volume when assessing an area’s attractiveness. Thus, in this report, some indicators measure both volume and intensity (per capita or per job).
C3. ADDITIONAL METHODOLOGICAL INFORMATION
01. Market Access
VALUE OF GREATER MONTRÉAL’S EXPORTS
The data presented in Section 1.2 on Greater Montréal’s exports were derived from those of the Institut de la statistique du Québec and were estimated from the following administrative regions: Lanaudière, Laurentides, Laval, Montérégie and Montréal.
02. Workforce
CANADIAN UNIVERSITY DATA
The university data compiled for this report were those for institutions located in the Greater Montréal area. For institu-tions with only partial operations in the Greater Montréal area, namely the Université de Sherbrooke, École nationale d’administration publique (ENAP), lnstitut national de la recherche scientifi que (INRS) and Télé-université (TÉLUQ), ratios were used to estimate the size of their Montréal-based student body.
Even though these numbers were established on the basis of information collected from the region’s universities, the estimates presented in this report may differ from each university’s offi cial statistics because data supplied by the Ministère de I’Éducation, du Loisir et du Sport du Québec were also used. The objective was to provide as accurate an approximation as possible of the actual number of students and graduates in Greater Montréal between 1998 and 2009.
THE PEOPLE RISK INDEX
Aon Hewitt’s Highlights of the 2011 People Risk™ Index Ratings, Organiza-tion Risks Related to Recruitment, Employment and Redeployment is a global survey assessing comparative people risk by location in relation to workforce recruitment, employment and redeployment. It looks at fi ve major types of indicators: demographic, government support, education, talent development, and employment practices.
NET INFLOW FROM INTERNATIONAL MIGRATION
In Canada and the United States, the net infl ow from international migration was established between July 2008 and July 2009. According to Statistics Canada, international migration represents move-ment of population between Canada and a foreign country accompanied by a change in the usual place of residence. A distinction is made between immi-grants, emigrants, returning emigrants, net temporary emigrants and net non-permanent residents.
According to the US Census Bureau, net infl ow from international migration includes international migration of US- and foreign-born persons. More specifi -cally, it consists of: (a) the net infl ow of international migration of foreign-born persons, (b) the net migration infl ow between the United States and Puerto Rico, (c) the net migration of US-born persons and (d) the net movement of armed forces personnel between the United States and foreign countries.
AP
PE
ND
IX C
50 / Montréal International
0.3 Costs
TOTAL BUSINESS OPERATING COSTS
These data were taken from KPMG’s biennial comparative study, Competitive Alternatives, published in 2010, but updated by Montréal International based on KPMG’s Competitive Alternatives Interactive Cost Model. This study compares business competiveness in over 100 cities in 10 countries: Australia, Canada, France, ltaly, Japan, Germany, Mexico, the Netherlands, the United Kingdom, and the United States. It measures the combined impact of 26 signifi cant cost components that are likely to vary by location, as applied to 17 different business operations over a 10-year period (aircraft parts, auto parts, biomedical R&D, clinical trials management, electronics assembly, electronics systems development, food processing, medical devices, metal machining, pharmaceutical products, plastic products, precision compo-nents, shared services centres, software design, specialty chemicals, telecom equipment and web and multimedia content development).
For more information on the survey, please go to the Competitive Alternatives 2010 website at http://www.competitivealternatives.com.
TOTAL LABOUR COSTS
In addition to wages, labour costs include, according to KPMG, the following:
/ Statutory plans: government pension and health plans, unemployment insu rance and workers compensation; and
/ Other benefi ts: paid time not worked (holidays and vacations), private health insurance and other discretionary benefi ts.
AVERAGE ELECTRICITY RATES
These data are based on a survey conducted among 16 companies and estimates prepared by Hydro-Québec and subsequently validated, for the most part, with the respondents (source: Hydro-Québec, 2010).
04. Taxes and Incentives
CORPORATE TAX BURDEN
ln its Competitive Alternatives 2010 – Special Report: Focus on Tax, KPMG assessed the general tax competitive-ness of 95 cities in 10 countries in the 17 following industries: aircraft parts, auto parts, biomedical R&D, clinical trials management, electronics assembly, electronics systems development, food processing, medical devices, metal machining, pharmaceutical products, plastic products, precision components, shared services centres, software design, specialty chemicals, telecom equipment and web and multimedia content development.
KPMG also assessed the average tax load for three types of R&D com-panies: biomedical R&D, clinical trials management and electronic systems development and testing.
The total tax burden of a company in a given city includes the sum of three components, namely corporate income tax, other corporate taxes and statutory labour costs. Corporate income tax (at the national, regional and local levels) is a function of a company’s sector and geographical location. Other corporate taxes include, among others, capital, sales, property and other miscellaneous taxes. Salary taxes include statutory plan costs and other wage-based taxes. The two latter categories vary by company sector and geographical location.
ision centres,
hemicals, b and
opment.
e averages of R&D com-
R&D, clinical trials electronic systems testing.
urden of a company inncludes the sum of three
s, namely corporate incomecorporate taxes and statutory
osts. Corporate income tax (attional, regional and local levels)
function of a company’s sector and ographical location. Other corporate
axes include, among others, capital,sales, property and other miscellaneoustaxes. Salary taxes include statutory plancosts and other wage-based taxes. Thetwo latter categories vary by companysector and geographical location.
Attractiveness Indicators 2011-2012 / 51
KPMG’s analysis is based on informa-tion collected between July 2009 and January 2010. All of the above mentioned taxes are those that were in effect on January 1, 2010 and refl ect the changes announced during the data collection period that subsequently came into force. The real tax rate takes into account tax credits, subsidies and across the board tax breaks.
KPMG presents detailed fi ndings for 41 cities with a metro population of at least 2 million. lt is in relation to them (as well as the largest North American metropolitan areas) that Greater Montréal’s relative competitive position is discussed in Section 4 of this report.
Please go to the offi cial Competitive Alternatives website at: http://www.competitivealternatives.com.
CORPORATE TAX RATE
In Canada, the federal tax rate is 11% for private Canadian-controlled companies with taxable income of less than $500,000. In certain provinces, reduced rates are also applicable to small businesses. The 2011 general rate of 16.50% (18% before that date) will pass to 15% as of 2012.
In the United States, the general tax rate of 35% varies depending on the corporation’s taxable income. For U.S. manufacturing companies, a deduction of 9% of the profi t related to production activities or taxable income is available for 2011 and thereafter, which means an actual rate reduction of 3.15%. This deduction was 3% for 2005, 2006, 6% for 2007, 2008 and 2009 and 9% for tax year 2010 and later.
Certain States, such as Arkansas, California, Connecticut, District of Columbia, Georgia, Hawaii, Indiana, Maine, Maryland, Massachusetts, Michigan, Minnesota, Mississippi, New Hampshire, New Jersey, New York, North Carolina, North Dakota, Oregon, South Carolina, Tennessee, Texas, West Virginia and Wisconsin do not apply the federal deduction for manu facturing production. For the taxable years beginning on or after January 1, 2010, Kentucky and Virginia apply a 6% rate in regards to the deduc-tion for manufacturing production.
City and state taxes are generally deductible from U.S. federal tax. The actual U.S. federal tax rate takes this deduction into account.
ONTARIO
Non-manufacturing companies: rate will be reduced to 11% and 10% respectively as of July 1, 2012 and 2013.
ILLINOIS
For the tax year beginning after January 1, 2011 and before Jan 1, 2015, the state corporate income tax rate is 7%. The income tax rate prior to January 1, 2011 was 4.8%. In addition, a personal property replacement income tax of 2.5% applies to corporations other than S corporations.
MASSACHUSSETTS
For tax years beginning on or after January 1, 2011, the state rate on corporate taxable income is 8.25% and will be reduced to 8% for the tax years beginning on or after January 2012. Moreover, a tax on corporate capital calculated at the rate of 0.26% must be added to the 8.25% tax.
NEW JERSEY
The state rate applies to the taxable income exceeding US$100,000. A surtax of 4% was added to the income tax for privilege periods ending on or after July 1, 2006 but before July 1, 2010. Gradual rates apply to taxable income under US$100,000.
KPMG’s analysis is based on informa-tion collected between July 2009 andJanuary 2010. All of the above menttaxes are those that were in effectJanuary 1, 2010 and refl ect the cannounced during the data coperiod that subsequently caforce. The real tax rate takaccount tax credits, subacross the board tax bre
KPMG presents deta41 cities with a metleast 2 million. lt i(as well as the lametropolitan aMontréal’s reis discusse
Please gCompehttp:/
AP
PE
ND
IX C
52 / Montréal International
NEW YORK
Companies are subject to a state tax based on the highest of four amounts. The income tax rate is 7.1%.
New York City: a surtax of 17%, applied to the state tax (7.1%) for the New York metropolitan area, has been added to the city’s rate of 8.85%. The three rates may not apply to all companies.
TEXAS
The State imposes a Franchise Margin Tax at a rate of 1%. The “Margin” equals the lesser of the three following calcula-tions: (1) Total revenues minus cost of good sold; (2) Total revenues minus compensation; and (3) 70% of total revenues. For tax years 2010 and 2011, if the revenue is less than US$1,000,000, the entity is exempt to the tax liability. The threshold will be reduced to US$600,000 after January 1, 2012.
05. Innovation
CONCENTRATION OF HIGH TECHNOLOGY JOBS
Data for Canadian metropolitan areas were taken from Statistics Canada’s Survey of Employment, Payroll and Hours (SEPH). It was chosen over the Labour Force Survey (LFS) because its methodology is similar to that used by the US Bureau of Labor Statistics’ (BLS) Quarterly Census of Employment and Wages (QCEW) that was used as a source of information on American metro-politan areas. Neither the SEPH nor the QCEW include self-employed workers.
It should be noted that US data are by Metropolitan Statistical Area (MSA).
For all 20 major metropolitan areas, Montréal International compiled data on high technology jobs as defi ned by the North American Industry Classifi cation System codes (NAICS):
/ Aerospace
• 3364 Aerospace Product and Parts Manufacturing
/ Life Sciences and
health technologies (LSHT)
• 3254 Pharmaceutical and Medicine Manufacturing
• 3391 Medical Equipment and Supplies Manufacturing
• 4145 Pharmaceuticals, Toiletries, Cosmetics and Sundries Wholesaler-Distributors (code 4242 in the United States)
• 5417 Scientifi c Research and Development Services
• 6215 Medical and Diagnostic Laboratories
/ Information and Communications Technologies (ICT)
• 3333 Commercial and Service Industry Machinery Manufacturing
• 334 Computer and Electronic Product Manufacturing
• 3359 Other Electrical Equipment and Component Manufacturing
• 4173 Computer and Communications Equipment and Supplies Wholesaler-Distributors (code 4234 in the United States)
• 4179 Other Machinery, Equipment and Supplies Wholesaler-Distributors (code 4236 in the United States)
• 5112 Software Publishers
ications
and Serviceery Manufacturing
r and Electronicnufacturing
er Electrical Equipmentmponent Manufacturing
Computer and Communicationsipment and Supplies Wholesaler-
stributors (code 4234 in theUnited States)
• 4179 Other Machinery, Equipment and Supplies Wholesaler-Distributors (code 4236 in the United States)
• 5112 Software Publishers
Attractiveness Indicators 2011-2012 / 53
• 517 Telecommunications
• 518 Data Processing, Hosting and Related Services
• 5324 Commercial and Industrial Machinery and Equipment Rental and Leasing
• 5415 Computer Systems Design and Related Services
• 6114 Business Schools and Computer and Management Training
• 8112 Electronic and Precision Equipment Repair and Maintenance
PRIVATE SECTOR RESEARCH
Data for the Greater Montréal metro-politan area reported in Section 5.4 were supplied by the Institut de la statistique du Québec (2004) and estimated on the basis of information for the fi ve following administrative regions: Lanaudière, Lau-rentides, Laval, Montérégie and Montréal.
UNIVERSITY RESEARCH FUNDING
Statistics Canada supplied data on research funding awarded to Canadian universities by federal and provincial agencies and the private sector.
Montréal International calculated the amount of university research funding in each Canadian metropolitan area by aggregating data on the universities located in each CMA.
For Greater Montréal, data were collected on the École nationale d’administration publique (ÉNAP), École Polytechnique de Montréal, École de technologie superieure (ÉTS), lnstitut national de la recherche scientifi que (INRS), Université de Montréal, McGill University, Université du Québec à Montréal (UQAM), Concordia University, HEC Montréal and Télé-université (TÉLUQ).
For the INRS, ENAP and TÉLUQ, only data on their Greater Montréal operations were considered. The ratios used were: 70% for the INRS, 50% for the ENAP and 55% for TÉLUQ. These ratios are based on student body.
06. Quality of Life
OVERALL QUALITY OF LIVING INDEX
Mercer’s annual survey compares quality of living in 215 countries based on 39 factors in ten categories. These include: political and social environment, economic environment, socio-cultural environment, health and sanitation, schools and education, public services and transportation, recreation, consumer goods, housing and natural environment.
COST OF EDUCATION
In Section 6.2, the other major Canadian metropolitan areas that were considered in calculating the $5,700 average tuition fee were Calgary, Ottawa, Toronto and Vancouver.
• 517 Telecommunications
• 518 Data Processing,Hosting and Related Services
• 5324 Commercial and InduMachinery and Equipmenand Leasing
• 5415 Computer Systeand Related Service
• 6114 Business Sand Computer Management
• 8112 ElectEquipme
PRIVATE S
Data fopolitasupdub
AP
PE
ND
IX C
CredITsGreater Montréal Attractiveness Indicators 2011-2012 is published by Montréal International
Conception // quatuor.ca
Cover page photos (Left to right, from top to bottom)
• bombardier aerospace • Tourisme montréal • biosphère, environment museum • ubisoft, montréal • national research Council Canada • Tourisme montréal • ubisoft, montréal
The electronic version of this document is available at: www.montrealinternational.com
Business in Greater Montréal - Montréal International
@investmtl @intorgmontreal @talentmontreal
leGal dePosIT
Bibliothèque nationale du Québec National Library of Canada 3rd Quarter 2011
PrInTed In Canada
© Montréal International, 2011