canada research canadian tire corporation - raymond · pdf filecanada research published by...
TRANSCRIPT

Canada Research Published by Raymond James Ltd.
Please read domestic and foreign disclosure/risk information beginning on page 44 and Analyst Certification on page 43. Raymond James Ltd. | 2100 – 925 West Georgia Street | Vancouver BC Canada V6C 3L2
Canadian Tire Corporation April 29, 2015 CTC.A-TSX Company Report - Initiation of Coverage Kenric S. Tyghe MBA | 416.777.7188 | [email protected]
Krisztina Katai (Associate) | 416.777.7060 | [email protected]
Consumer & Retail
Switching to Summer Tires and Expecting Better Traction
Recommendation We are initiating coverage of Canadian Tire Corporation (CTC) with an Outperform rating and $145.00 target price. Our Outperform rating is reflective of the underlying momentum within both key segments and select banners. While continued share gains in sport and better levering (though eCanadian Tire Money attached loyalty analytics) of its iconic brands underpin the growth strategy, it is the changes in the bench, ethos, and focus that support our positive bias. We are mindful of CTC’s misses (against select performance targets through 2014), but we are of the opinion that on the new mantra (and changes to the bench across key businesses), CTC through 2017E will prove to be a far more agile and adept player. While we are not expecting a series of home runs, we believe that as confidence builds on fewer strikeouts (relative to performance targets), that CTC’s ticket price will move higher (on further multiple expansion). The strategic partnerships with both Scotiabank and the SCENE loyalty program are, in our opinion, right on the money in terms of CTC’s brand positioning with a younger (target) demographic.
Analysis As the Tim Hortons of Canadian Retail, there exists in We the North a tremendous
affinity for and loyalty to CTC, which we believe is (finally) being better leveraged. In an always on world the dumb (but beloved) paper money in a smart money retail loyalty landscape was particularly expensive (but has finally been addressed).
In increasingly competitive markets, playing to your strengths (brand, footprint, home field advantage) is a better strategy than playing your competitors’ games. In automotive, compete on service competitors can’t offer; in living, on national brands, and in sport, on a this-is-our-game basis. We think CTC is increasingly on the money.
With the recent exit of a key competitor likely giving new entrants pause, it’s time for CTC to swing for the fences, and reassert its iconic status (across all banners). With a new dealer agreement and the requisite technology and talent in the game, we believe that CTC is likely better positioned than at any point in the last decade.
Valuation
Our $145.00 target price is based on our SOTP calculation (see Exhibit 38), which applies a 10.0x multiple to our 2016E EBITDA, and the value of Canadian Tire Corporation’s interest in CT REIT. Our target multiple is essentially in line with CTC’s trailing 12-month average of 9.9x, and slightly above its 3-year average multiple of 8.6x. We believe the premium appropriately reflects (i) CTC’s increased traction in the sporting goods market, (ii) improved brand and competitive positioning, and (iii) loyalty initiatives and increasing data analytics competencies.
EPS 1Q 2Q 3Q 4Q Full Revenue EBITDA Mar Jun Sep Dec Year (mln) (mln)
2014A US$0.88 US$2.26 US$2.17 US$2.65 US$7.94 US$12,463 US$1,376
2015E 0.91 2.34 2.24 2.80 8.28 12,746 1,422
2016E 0.97 2.48 2.36 3.11 8.92 13,315 1,507
Source: Raymond James Ltd., Thomson One
Outperform 2
C$145.00 target price
Current Price ( Apr-24-15 ) C$131.54 Total Return to Target 12% 52-Week Range C$137.48 - C$100.01 Suitability Growth
Market Data Market Capitalization (mln) C$10,341 Current Net Debt (mln) C$2,071 Enterprise Value (mln) C$12,413 Shares Outstanding (mln, f.d.) 79.0 10 Day Avg Daily Volume (000s) 146 Dividend/Yield C$2.10/1.6%
Key Financial Metrics 2014A 2015E 2016E
P/E 16.6x 15.9x 14.8x
EV/EBITDA 9.0x 8.7x 8.2x
Company Description Canadian Tire Corporation (CTC), with approximately 1,700 retail and gasoline outlets (and Financial Services and CT REIT segments), is one of Canada’s largest and most iconic retailers.

Canada Research | Page 2 of 48 Canadian Tire Corporation
Raymond James Ltd. | 2100 – 925 West Georgia Street | Vancouver BC Canada V6C 3L2
Table of Contents
Executive Summary ............................................................................................................................................. 4
Company Overview .............................................................................................................................................. 5
Investment Thesis ................................................................................................................................................ 7
The Macro Market Dynamics and Model Imperatives ......................................................................................... 25
Corporate Structure, Financial Analysis, and Outlook ......................................................................................... 33
Valuation and Recommendation ......................................................................................................................... 35
Appendix A: Financial Statements ....................................................................................................................... 37
Appendix B: Management and Board of Directors .............................................................................................. 40
Risks ..................................................................................................................................................................... 41

Canadian Tire Corporation Canada Research | Page 3 of 48
Raymond James Ltd. | 2100 – 925 West Georgia Street | Vancouver BC Canada V6C 3L2
Canadian Tire Tear Sheet
CANADIAN TIRE TSX:CTC.A
F2012A F2013A F2014A F2015E F2016E
Price $131.54 Financial Summary 12/31/2012 12/31/2013 12/31/2014 12/31/2015 12/30/2016
Target Price $145.00
52-week Range $100.01 $137.48 EPS (Diluted) $6.10 $7.02 $7.94 $8.28 $8.92
Return to Target 11.8% DPS $1.40 $1.75 $2.10 $2.10 $2.10
Market Cap (mln) $10,341 BVPS $58.50 $67.57 $71.31 $78.08 $86.27
Valuation Metrics
Price/Sales 0.9x 0.9x 0.8x 0.8x 0.8x
P/E 21.6x 18.8x 16.6x 15.9x 14.8x
Price/BV 2.2x 1.9x 1.8x 1.7x 1.5x
FCF Yield 4.6% 4.8% 0.5% 2.7% 4.1%
Dividend Yield 2.0% 1.8% 1.7% 1.6% 1.6%
EV/Sales 1.3x 1.2x 1.2x 1.1x 1.1x
EV/Adj. EBITDA 10.9x 10.0x 9.0x 8.7x 8.2x
EV/EBIT 17.9x 16.2x 14.4x 13.4x 12.7x
81.4 80.7 79.0 77.0 76.6
Top 10 Institutional Holders Shares (mln) % Held Income Statement (C$ mln)
Beutel Goodman & Company Ltd. 1.53 1.97% Sales $11,427 $11,786 $12,463 $12,746 $13,315
Manulife Asset Management Limited 1.48 1.91% EBITDA (Adj) $1,139 $1,236 $1,376 $1,422 $1,507
Albikin Management Inc 1.44 1.86% EBIT $803 $890 $1,004 $1,075 $1,134
Ctc Dealer Holdings Ltd 1.41 1.82% Pre-Tax Profit $677 $785 $895 $983 $1,047
Tire N Me Pty. Ltd 1.40 1.81% Net Income (Adj) $499 $569 $632 $644 $690
Canadian Tire Corporation, Ltd. Profit-Sharing Plan 1.20 1.55% Cash Flow (C$ mln)
BlackRock, Inc. 1.07 1.38% CFO $702 $901 $586 $1,047 $1,093
RBC Global Asset Management Inc. 1.03 1.33% CAPEX $222 $404 $539 $770 $665
Mackenzie Financial Corporation 0.74 0.96% Free Cash Flow (FCF) $479 $497 $47 $277 $428
TD Asset Management, Inc. 0.72 0.93% Dividends $98 $112 $141 $163 $162
Δ in Working Capital -$429 $270 -$84 -$16 -$34
Balance Sheet (C$ mln)
Cash and Equivalents $1,016 $643 $662 $565 $946
Total Assets $13,229 $13,630 $14,553 $14,946 $15,740
Long Term Debt $2,336 $2,339 $2,132 $1,867 $1,867
Total Liabilities $8,464 $8,180 $8,922 $8,932 $9,134
Net Debt $2,068 $2,037 $2,071 $1,904 $1,523
Investment Highlights Key Company Metrics
SSS Growth
CTR 0.6% 1.4% 2.1% 2.6% 2.8%
FGL Sports 4.8% 8.8% 7.0% 5.9% 7.3%
Mark's 3.8% 4.4% 3.5% 3.6% 1.8%
Retail Sales Growth
CTR 0.9% 2.6% 4.3% 2.9% 3.0%
FGL Sports 3.9% 6.8% 11.2% 9.2% 8.9%
Mark's 4.0% 4.8% 4.5% 4.9% 4.4%
Sales per sq. ft.
Rating Outperform CTR $385.0 $389.0 $398.0 $408.3 $417.3
Target Price $141.15 FGL Sports N/M $275.0 $284.8 $304.1 $313.8
SALES ($'mln) $12,749 Mark's $305.3 $315.3 $328.3 $342.7 $353.3
EBITDA ($'mln) $1,411
EPS $7.95 ROE 10.9% 11.2% 12.0% 12.2% 11.9%
ROA 3.9% 4.3% 4.7% 4.8% 4.9%
Market
Price Cap.
Company Name Apr-24-15 (mln) LFY FY1E FY2E LFY FY1E FY2E1000 1001 1002 1000 1001 1002
Canadian Tire Corp. Ltd. $131.54 $10,341 $12,413 TSX:CTC.A 16.6x 15.9x 14.8x 9.0x 8.7x 8.2x
US Home Improvement Retailers
The Home Depot, Inc. $113.70 $147,623 $163,097 HD 24.1x 21.8x 19.0x 13.8x 12.7x 11.7x
Lowe's Companies Inc. $73.16 $69,627 $80,403 LOW 27.0x 22.1x 18.6x 13.0x 11.8x 10.8x
Group Average 25.6x 21.9x 18.8x 13.4x 12.2x 11.2x
Canadian Home Improvement Retailers/Distributors
Richelieu Hardware Ltd. $63.35 $1,241 $1,234 TSX:RCH 24.1x 21.5x 19.5x 16.2x 14.3x 13.1x
Rona Inc. $16.13 $1,743 $2,098 TSX:RON 29.3x 17.9x 16.6x 10.9x 8.1x 7.7x
Group Average 26.7x 19.7x 18.0x 13.6x 11.2x 10.4x
US General Merchandizers
Costco Wholesale Corporation $148.12 $65,169 $62,965 COST 31.9x 28.2x 26.0x 14.9x 13.3x 12.4x
Target Corp. $82.70 $53,072 $63,658 TGT 21.6x 18.2x 16.5x 9.4x 8.7x 8.4x
Wal-Mart Stores Inc. $79.84 $257,524 $303,923 WMT 16.1x 16.2x 15.4x 8.3x 8.3x 8.1x
The TJX Companies, Inc. $66.29 $45,307 $44,216 TJX 21.0x 20.2x 17.9x 10.9x 10.6x 9.8x
Group Average 22.6x 20.7x 19.0x 10.9x 10.2x 9.7x
US Auto Parts Aftermarket
Advance Auto Parts Inc. $148.61 $10,872 $12,426 AAP 22.1x 17.4x 15.3x 10.0x 9.3x 8.5x
AutoZone, Inc. $702.00 $22,270 $26,561 AZO 22.2x 19.6x 17.4x 13.1x 12.3x 11.7x
O'Reilly Automotive Inc. $229.35 $23,244 $24,167 ORLY 31.2x 26.4x 23.3x 17.0x 14.9x 13.8x
Group Average 25.2x 21.1x 18.7x 13.4x 12.2x 11.3x
US Sporting Goods Retailers
Cabela's Incorporated $54.19 $3,879 $7,609 CAB 19.3x 17.2x 15.0x 17.0x 15.3x 13.5x
Callaway Golf Co. $9.89 $767 $838 ELY 49.5x 247.3x 38.6x 16.1x 23.8x 14.3x
Dick's Sporting Goods Inc. $56.59 $6,693 $6,478 DKS 19.9x 17.8x 15.9x 8.8x 8.1x 7.5x
Hibbett Sports, Inc. $48.97 $1,219 $1,134 HIBB 17.1x 16.1x 14.5x 8.7x 8.4x 7.7x
Group Average 26.4x 74.6x 21.0x 12.7x 13.9x 10.8x
Total Group Average 25.3x 31.6x 19.1x 12.8x 12.0x 10.7x
OUTPERFORM 2
Canadian Tire Corporation, with approximately 1,700 retail and gasoline
locations, is one of Canada's largest and most iconic retailers. Our
constructive thesis is supported by the underlying momentum within key
segments and banners. While continued share gains in sport and better
levering of its iconic brands are supportive of continued growth, it is the
changes in the bench, ethos and focus that support our positive thesis. In
addition, the strategic partnerships with both Scotiabank and the SCENE
loyalty program are, in our opinion, right on the money, particularly in the
context of CTC's brand positioning with a younger (target) demographic.
Consensus
Enterprise
Value
(mln)
EV/ EBITDA RatiosPrice/Earnings Ratios
0
1
2
3
4
5
6
7
8
85
100
115
130
145
160
175
190
205
Jan-10 Jan-11 Jan-12 Jan-13 Jan-14 Jan-15V
olu
me
(m
ln)
CTC
& S
&P
TSX
Re
bas
ed
CTC S&P TSX
Source: Canadian Tire Corporation, Capital IQ, Raymond James Ltd.

Canada Research | Page 4 of 48 Canadian Tire Corporation
Raymond James Ltd. | 2100 – 925 West Georgia Street | Vancouver BC Canada V6C 3L2
Executive Summary
Canadian Tire Corporation (CTC), with 493 dealer-owned Canadian Tire stores, 436 FGL Sports banner stores, 297 gasoline outlets, and 383 Mark’s stores, is one of Canada’s largest and most iconic retailers. While CTC’s core business is Retail with Canadian Tire Retail (CTR) as its core platform, the generational shift CTC is embarking on places increased focus on FGL Sports, with Sport Chek as its super brand.
Building a Sport(chek) Empire
With the August 2011 acquisition of the Forzani Group (FGL Sports), Canadian Tire emerged as the largest sporting goods retailer in Canada, commanding an approximate 31.5% of the sporting goods market. FGL Sports’ largest banner, Sport Chek, accounted for approximately 11.4% of the sporting goods market in Canada, followed by its Sports Experts banner at 4.3% at the end of 2012, both of which increased market share through 2014. The acquisition not only served to reinforce CTC’s leadership position within the Canadian sporting goods market, but to also stave off (or at a minimum materially delay) the entrance of US-based Dick’s Sporting Goods. The Canadian sporting goods industry is relatively concentrated with the 10 largest sporting goods retailers commanding an estimated 54.2% of the market, versus the more competitive US market, where the top 10 retailers represent approximately 40.6%. Within the sporting goods market, the apparel and footwear segments are poised to see the fastest growth rate through 2017E. According to estimates by Trendex North America, sales of sports apparel are expected to grow at an annual CAGR of 2.7%, followed by the sports footwear industry at a CAGR of 2.5%.
CTC has leveraged its existing position in the sporting goods market, and continues to gain momentum in both key growth segments and demographics. The planned 12-14 HERO stores (and additional Sport Chek flagship stores), and the efficacy of the cascading of the learnings from these stores across the broader base, will be key determinants of the momentum trends.
Show Me the (e)Canadian Tire Money
While Canadian Tire has long had a loyalty program in place through Canadian Tire Money (in fact it is Canada’s oldest loyalty program), it lagged those offered by key peers, as it was a paper versus smart currency. Given the competitive dynamics (and increased competitive intensity), every basis point of market share is that much more valuable, which further highlights the imperative that is a compelling, data analytics underpinned loyalty program. dunnhumby was an integral player in the initial loyalty program analytics design and specification. Following an Oct-28-14 national rollout, CTC customers can earn and redeem either digital or paper Canadian Tire Money (paper Canadian Tire ‘Money’, remains in circulation).
e-Canadian Tire Money (just like the paper Canadian Tire Money in your sock drawer and glove box) has no expiry date and can be shared with other members. In addition (in a similar vein to key competitor programs), customers who use their Canadian Tire Options MasterCard collect 10x the e-Canadian Tire ‘Money’ across Canadian Tire’s family of companies. Canadian Tire e-Money is a critical, and long overdue evolution of Canadian Tire’s loyalty offering, in a smart always on world, where real-time insights and digital rewards fulfillment are critical elements of the customer experience. Further complementing CTC’s loyalty initiatives, and most importantly the resonance of its banners with the (younger) target demographic, are key strategic initiatives attached to the SCENE Loyalty program.
Automotive – The Heart and the Margin
While sport is the cornerstone of growth, and loyalty analytics the powerful glue that not only holds the model together but makes it stronger (the currency is a means to and end), Automotive is the not-so-little engine that could. Automotive and Living are the two largest categories for Canadian Tire. With the increase in the competitive intensity within these categories (and the imperative that is an acceleration of organic growth), CTC has allocated significant capital over the last 5-plus years to these categories. While the Automotive category represents approximately 34% of Canadian Tire’s Point of Sale (POS), versus the Living category at approximately 33%, Automotive is the heart (and margin).
The single biggest change within Automotive is, in our opinion, the placing of service (versus product) at the centre of Canadian Tire’s offering, as the service element (done right) will create an ever-larger moat around this invaluable crown jewel. We are cautiously optimistic that after a number of false starts in Automotive, the team, the tools, and alignment of interests are such that CTC is poised to get back on offence (versus defense) through 2017E.

Canadian Tire Corporation Canada Research | Page 5 of 48
Raymond James Ltd. | 2100 – 925 West Georgia Street | Vancouver BC Canada V6C 3L2
Company Overview
Canadian Tire Corporation (CTC), with approximately 1,700 retail and gasoline outlets (and Financial Services and CT REIT segments), is one of Canada’s largest and most iconic retailers. While CTC’s core business is Retail and its core platform is Canadian Tire Retail (CTR), the relatively recent shift in strategic priorities places increased focus on FGL Sports (specifically, the Sport Chek banner) as the proverbial tip of the spear for CTC.
CTC has six business categories – Automotive, Living, Fixing, Playing (Sport), Apparel, and Financial Services – all positioned to prepare Canadians for the jobs and joys of everyday living in Canada (to paraphrase a management mantra). The CTR operated network comprises 584 (including 91 corporate PartSource) dealer-operated stores representing 20.5 mln sq. feet of retail space.
The FGL and Mark’s banners comprise 436 (7.2 mln sq. feet) and 383 stores (3.5 mln sq. feet), respectively. Canadian Tire Gas bar locations currently number 297.
Exhibit 1: CTC Business Categories – 2014 Revenues
Source: Canadian Tire Corporation, Raymond James Ltd.
The evolution (20-years in the making) of CTR’s store concepts continues. The most recent iteration began in 2008, with a focus on Smart Stores. As of December-2014, CTR has converted 337 (68.4%) and 22 (4.5%) of its base to the Smart Store and Small Market Store concepts, respectively. The Smart Store format integrates a number of new store features designed to enhance operating productivity and improve the customer experience. What we believe is worth noting (based on discussions with management), in terms of the evolution of the footprint, is the tighter focus on working formats versus experimenting with all manner of formats. The stores feature a racetrack layout, easier-to-read navigational signage, customer help buttons, price check stations, and additional customer assistance desks in key areas of the store, in addition to CTC banner stores-within-stores and ProShops. The Smart Store concept is capital light and converted stores have demonstrated a modest improvement in same-store sales performance (relative to traditional Canadian Tires stores).
Exhibit 2: Canadian Tire Retail (CTR) SSS Performance
Source: Canadian Tire Corporation, Raymond James Ltd.

Canada Research | Page 6 of 48 Canadian Tire Corporation
Raymond James Ltd. | 2100 – 925 West Georgia Street | Vancouver BC Canada V6C 3L2
While CTC commands leading market shares in numerous key product lines, and is a leading sporting goods retailer with particular strength in Automotive, consistency of its financial performance (despite its extensive reach and scale) has been challenging.
CTC’s strategic objectives serve as the foundation for meeting targeted financial aspirations. Where CTC previously provided 5-year targets, effective 2015E, it is now providing 3-year targets. Given the accelerating pace of change in the Canadian retail landscape, and the challenged history in meeting targets, the shift to 3-year aspirations appears prudent. Through 2017E, CTC has outlined 3 strategic priorities, namely to: (i) attract and retain world class talent; (ii) develop best- in-class digital and analytics capabilities; and, (iii) leverage the strength of its brand. Exhibit 3 details Canadian Tire’s financial aspirations for the periods: 2005-2009; 2010-2014, and 2015-2017.
Exhibit 3: CTC Aspirations
2015-2017 Target 2015E 2016E 2017E RJL Est.
Retail Sales growth
Canadian Tire 3%+ 3.1% 3.0% 2.8% 2.9%
FGL Sports 9%+ 10.5% 9.7% 9.3% 9.8%
Mark's 5%+ 5.1% 5.4% 5.8% 5.4%
ROIC 9% 9.5% 9.4% 9.6% 9.5%
EPS growth 8%-10% 5.8% 7.0% 8.8% 7.2%
CTFS Return on Receivables 6%+ 7.6% 7.6% 7.4% 7.5%
2010-2014 Target 2010 2011 2012 2013 2014 Actual
Retail Sales growth 3%-5% 1.4% 2.0% 0.8% 2.5% 4.4% 2.4%
Return to shareholders 10%-12% 19.8% -1.7% 6.8% 46.5% 24.3% 17.5%
ROIC 10%+ 8.0% 7.7% 7.4% 8.1% 8.1% 8.1%
Adj. EPS growth 8%-10% 18.5% 5.3% 6.9% 13.5% 10.0% 13.3%
CTFS Return on Receivables 4.5%-5% 5.0% 5.5% 6.8% 7.3% 7.4% 7.4%
2005-2009 Target 2005 2006 2007 2008* 2009* Actual
Comparable store sales 3%-4% 3.0% 2.3% -0.6% 0.3% -2.6% 0.5%
ROIC 10% 9.3% 9.3% 10.5% 8.9% 7.7% 9.1%
Adj. EPS growth 12%-15% 16.2% 11.0% 18.1% -2.2% -12.4% 6.1%
Adj. EBITDA growth 10%-15% 14.6% 6.3% 9.7% 1.3% -2.0% 6.0%
*Aspirations were re-assessed due to the credit market disruption and subsequent economic downturn Source: Canadian Tire Corporation, Raymond James Ltd.
In order to better deliver against its financial aspirations, CTC is focused on making what, in our opinion, is a critical generational shift, centered around both the brand and the experience. The chosen cornerstone, upon which CTC has chosen to build its next generation brand, is the sporting goods category.
For CTR, this translates into acting less like a general merchant, and more like a specialty retailer with store-within-store and dedicated category-specific ProShops (currently led by Hunting and Fishing). The opportunity in Automotive (specifically in the growth of service and assortment) remains material, as are the stakes given the current (and expected) changes in the competitive landscape.
With sporting goods as the cornerstone, FGL mind and market share gains, and specifically the accelerated growth of the Sport Chek banner are strategic imperatives. The fight for increased relevance with younger consumers will not be fought (or won) in the aisles of either a CTR or Mark’s store. To win, CTC needs to deliver a knockout with Sport Chek, the halo effect of which will impact multiple banners.

Canadian Tire Corporation Canada Research | Page 7 of 48
Raymond James Ltd. | 2100 – 925 West Georgia Street | Vancouver BC Canada V6C 3L2
Investment Thesis
Perspective on Canadian Tire’s Business Model
It is impossible to do justice to a discussion of Canadian Tire without detailing (something of a misnomer given the very limited disclosure) the newly strengthened Associate Dealer Agreement. A new agreement (the culmination of a 2-year negotiation), which expires in 2024, was signed on April-17-13, and is expected to provide a framework for a new era of cooperation between Canadian Tire Corporation and its Associate Dealers. The Associate Dealer model is unique.
Canadian Tire stores are operated by independent third parties known as Associate Dealers. Canadian Tire’s relationship with each Dealer is governed by an individual Dealer contract pursuant to which each Dealer agrees to operate the retail business of a Canadian Tire store under the Canadian Tire name and to use his or her best efforts personally to manage his or her Canadian Tire store at its maximum capacity and efficiency. Each Dealer owns the fixtures, equipment and inventory of, and is responsible for the store staff and operating expenses for, the Canadian Tire store he or she operates. Each Dealer agrees to comply with the policies, marketing plans and operating standards prescribed by Canadian Tire, including purchasing merchandise primarily from Canadian Tire and offering merchandise for sale at prices not exceeding those set by Canadian Tire. In return, Canadian Tire supports Associate Dealers with marketing, supply chain management, purchasing, administrative, financial and information services. Except in limited circumstances, the premises on which the Canadian Tire stores are located are owned or leased by CTC and licensed to individual Associate Dealers. Individual Dealer contracts are all in a standard form, each of which generally expires on December 31, 2024.
Canadian Tire’s model, operated through its Associate Dealers, is a pull system. In Canadian Tire’s pull system, the Associate dealers determine what they want in the store, and corporate (CTC) does its best to meet the dealers’ requirements, versus in a push system where corporate makes the decisions and pushes inventory into the system. The primary benefit of a pull system is that it allows each Dealer to leverage local knowledge and expertise in determining preferred inventory. The offset is that a pull system is inherently inefficient (relative to a push system).
The pull system, in our opinion, plays to the Retail as Art model of yesterday, versus the Retail as Science model of the best-in-class global retailers of tomorrow. As such, the increased flexibility of the new dealer agreement is, we believe, less about a new era of cooperation, and more about the strategic imperative that is Retail as Science, Data as Art. While dealers are undoubtedly invaluable in determining timing on when to get snow shoes in stock up North, versus out West, the specific inventory levels and assortment are, in our opinion, best left to data-driven decisions by corporate.
The specifics on the road to a becoming a dealer are relatively scant; the process begins with an online application, followed by a pre-screen, and a three-stage interview (the final interview involves both senior management and representatives from the dealer network). The journey is also relatively (given the economics) capital light, with successful applicants required to cover up to 25% of the value of initial store inventory and fixed asset costs, or an estimated minimum of $125,000 in accessible capital (and additional $125,000 for dealer training and development).
An approved dealer enters a minimum 6-month (can be extended for another 6 months if warranted) dealer training program, which includes a number of store placements. In addition, new dealers receive an elevated level of support from CTC for the first 2 years. A key component of the dealer contract is upward mobility. While each Dealer receives training on store operations, performance, and inventory and staff management (after which they are placed in a pool and assigned a smaller store), the dealers laddered progression to larger and more profitable stores is dependent on meeting performance targets (most specifically, sales targets). In addition to improving dealer mobility (dealers are required to retire after 40 years in the system), the new contract brings an increased (and critical) focus on the relationship (versus the contract specifics), which allows for better flexibility in collaboratively working together to face the rapidly changing face of Canadian Retail.
While the change in tone in the relationship to conversations, versus finger pointing, is undeniably a critical (and positive) departure from the finger pointing of old, the billion dollar question in our opinion is whether the conversations translate into the requisite sense of urgency and alignment, under the CEO versus management by a committee of 493 CEOs.

Canada Research | Page 8 of 48 Canadian Tire Corporation
Raymond James Ltd. | 2100 – 925 West Georgia Street | Vancouver BC Canada V6C 3L2
As previously noted, sport is both the cornerstone of the targeted generation shift and earnings growth. The reality is that sport is not only faster growing than core CTR categories, but it is also a higher margin business. Given Canadian Tire’s success as a hi-lo (versus every-day low price) retailer, and a growth strategy increasingly tied to all things automotive and sport, understanding the swings and roundabouts of the new agreement becomes all the more important.
A dealer’s upward mobility (and primary motivators) in the network are: (i) sales growth and, (ii) continuous engagement in personally running their store. The dealer of today whose average age is now believed to be in excess of 50 years of age, while undoubtedly a savvy retailer in core Canadian Tire categories, is likely significantly less experienced in the growth drivers of tomorrow. The risks of this new reality is that dealers who previously were poised for the next step up the ladder, are going to either have to hurry hard to stay on the ladder (a positive), or are simply going to tap out of the race and dedicate less time to the store, and more time to the sun (a negative). By its very nature, a pull-ordering system facilitates a mismatch of both strategic and economic imperatives between dealers and corporate, as a dealer’s orders do not need to match with the dealer’s retail sales. The dealer, as a rational individual (and business owner) acts in his own economic self-interest first, and in the interest of CTC second. With dealers controlling both what and how much inventory they order, and earning a spread between what they pay the corporation and receive from customers, the incentive to order excess inventory (when on promotion by the corporation) and sell (the excess) at regular prices when the promotion ends is real (and creates ripples through the system). Given that hockey is Canada’s Game, and that Canadian Tire was recently advertising a $99.99 (we’ll call it $100.00) Bauer Nexus 600 for $69.99 (we’ll call it $70.00), we decided to use a hockey stick to illustrate the above dynamic.
We assume that CTC’s COGS on the hockey stick is $40.00 with a retail price of $100.00 for total gross margin dollars of $60.00, of which we assume CTC takes $25.00 and the dealer takes $35.00, for CTC gross margins of 38.5% ($25.00/$65.00) and dealer gross margins of 35.0% ($35.00/$100.00). At full price, the margin dollars are split 41.6% CTC/58.3% Dealers.
If the dealer did not have an incentive (incremental risk for incremental dollars), then when the hockey stick is on promotion (assuming no excess inventory is ordered because of the promotion), the gross margin hit (of promotional prices) would be relatively balanced. However, if the dealer knowing their market, and loving the game purchases excess inventory on promotion from CTC, and sells it at regular prices, the implications are numerous.
The dealer over-purchases the promotion priced stick at $52.50 ($40.00 COGS plus $12.50 margin) in the belief that he can sell the excess inventory at $100.00, versus the promotional price of $70.00. In this scenario, CTC generates gross margin dollars of $12.50 and margins of 20.0% ($12.50/$62.50), while the dealer secures $37.50 and margins of 37.5% ($37.50/$100.00) on the excess inventory. The kicker however, is that this is not free money for the dealer, but rather a double-edged sword for both parties.
At the risk of stating the obvious, the supply chain inefficiencies the above scenario creates are manifold, and the ripple effect through the system profound. Not only is inventory risk higher (the dealer may not know their market as well as they like to think), but forecasting and replenishment are complicated (and inventory at corporate is necessarily higher than is ideal). In addition, consumers were too often met with sold out promotional products, which was often more a function of the model, than actually being sold out. We believe that the above dynamics were one of the drivers behind too much time spent on finger pointing and on the minutiae of previous contracts, versus the current contract, which according to management, is focused on the relationship and constructive dialogues about how to move forward together. A number of key differences highlighted include:
Flexibility to Face the Future (Evolution of Digital and Loyalty)
Sharing of the right costs in the business
Allows for increased collaboration
Contract is the longest ever secured

Canadian Tire Corporation Canada Research | Page 9 of 48
Raymond James Ltd. | 2100 – 925 West Georgia Street | Vancouver BC Canada V6C 3L2
Canadian Tire
Canadian Tire Retail’s (CTR) flagship banner, Canadian Tire, is one of the most shopped retailers in Canada with 493 dealer-owned Canadian Tire stores (complemented by 91 PartSource stores and 297 gas bars) at Dec-31-14. Canadian Tire represents 50% of CTC’s revenues and 60% of CTR’s retail sales. Canadian Tire is one of Canada’s most iconic brands, with commanding market share in most categories, and Canada’s most-read flyer. The average Canadian Tire bannered store is 41,580 square feet.
Automotive – The Heart and the Margin
Automotive and Living are the two largest categories for Canadian Tire. With the increase in the competitive intensity within these categories (and the imperative that is an acceleration of organic growth), CTC has allocated significant capital over the last 5-plus years to these categories. While the Automotive category represents approximately 34% of Canadian Tire’s Point of Sale (POS), versus the Living category at approximately 33%, Automotive is the heart (and margin). The reality of quite how appealing the economics of the Automotive (tires, accessories, parts, and service) business are, has not been lost on key competitors of all shapes and sizes (Walmart continues to accelerate the build out of its auto parts offering and has 1,000-plus SKUs available online, while Amazon Canada launched its auto parts push in October 2013).
As such, we believe that the capital deployed to the Automotive category has at best served to buttress the fortress, rather than expand the empire, leading to disappointing ROIC metrics from the category. The Living category is, to our mind, a traffic-driving investment in margin.
The Canadian automotive aftermarket is an approximately $23.1 bln business according to Statistics Canada. Sales in the Do-It-For-Me (DIFM) categories represent approximately 74% of the market, with the Do-It-Yourself (DIY) market the balance. As depicted in Exhibit 4, labour receipts make up the largest part of the aftermarket for auto parts, followed by installed parts and tires, accessories and DIY parts. Sales of DIY auto parts account for an estimated 13% of aftermarket retail sales, which according to Automotive Industries Association of Canada, Canadian Tire continues to lead with an estimated 46.7% market share in 2012 (its highest share in recent years).
The balance of auto parts is sold to dealerships and independent repair outlets that are supplied by Wholesale Distributors (WD). The WD channel is dominated by Uni-Select, NAPA, and Advance Auto Parts-owned CARQUEST. The commercial install market is necessarily dominated by new car dealerships with an estimated 36.6% share of the DIFM market, followed closely by independent repair shops at 32.2%. In our opinion, there are a number of tangible growth opportunities in the DIFM market upon which we expect Canadian Tire to capitalize. Exhibit 4 details the size and composition of the Canadian Automotive Aftermarket.
Exhibit 4: Size of Automotive Aftermarket – DIFM and DIY
Source: Canadian Tire Corporation, Statistics Canada, Raymond James Ltd.
Canada Research | Page 10 of 48 Canadian Tire Corporation
Raymond James Ltd. | 2100 – 925 West Georgia Street | Vancouver BC Canada V6C 3L2
Canadian Tire is the largest player in the aftermarket DIY auto parts industry in Canada, commanding an estimated 9.2% share of total auto aftermarket sales, and the leading online tire and wheels retailer. Canadian Tirebannered stores cater to the light to medium Do-It-Yourself (DIY) customers, while PartSource caters to the hard-core DIY and the previously untapped commercial installers markets. With the increase in the competitive intensity in the auto parts market, particularly on the expansion of AutoZone, Canadian Tire responded with the creation of PartSource, which caters to the hard-core DIY demographic. Additionally, Canadian Tire also addressed in-store availability of parts and faster and more efficient part delivery through the creation of a PartSource hub system. At approximately 15,000 square feet, a PartSource hub store is more than twice the size of a regular PartSource store, and carries a broader product assortment which enables better product availability and faster delivery to nearby Canadian Tire and PartSource locations. There are currently 91 PartSource locations.
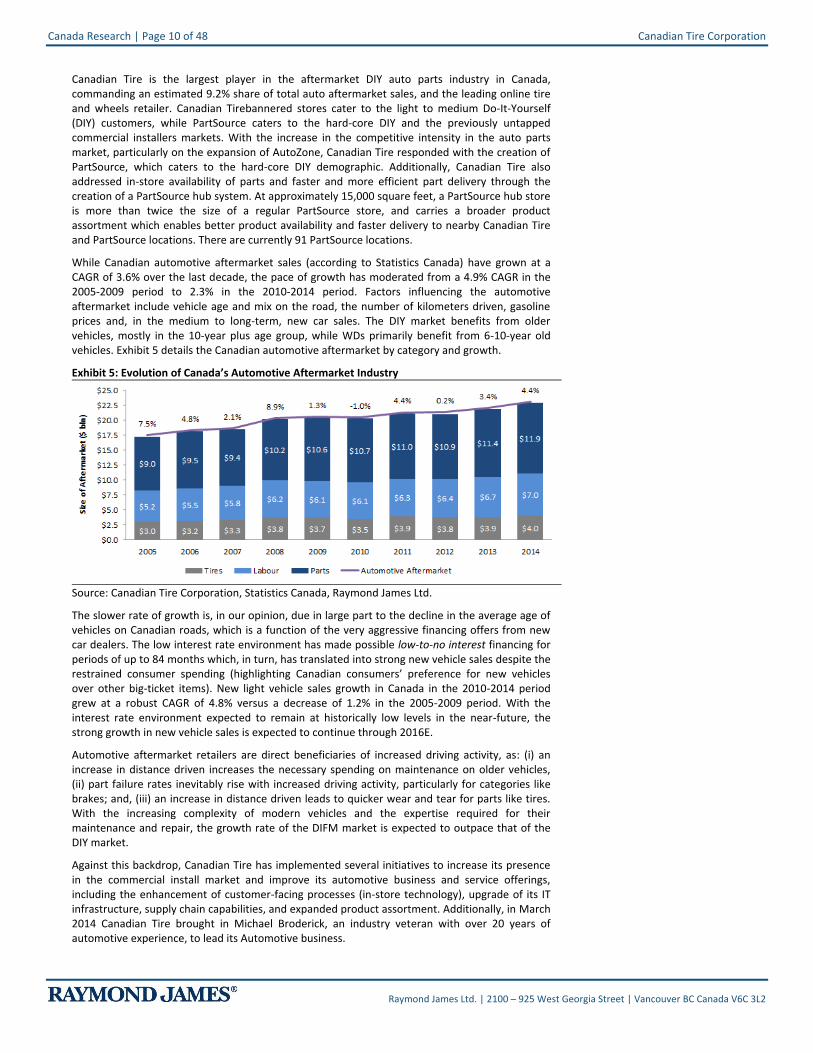
While Canadian automotive aftermarket sales (according to Statistics Canada) have grown at a CAGR of 3.6% over the last decade, the pace of growth has moderated from a 4.9% CAGR in the 2005-2009 period to 2.3% in the 2010-2014 period. Factors influencing the automotive aftermarket include vehicle age and mix on the road, the number of kilometers driven, gasoline prices and, in the medium to long-term, new car sales. The DIY market benefits from older vehicles, mostly in the 10-year plus age group, while WDs primarily benefit from 6-10-year old vehicles. Exhibit 5 details the Canadian automotive aftermarket by category and growth.
Exhibit 5: Evolution of Canada’s Automotive Aftermarket Industry
Source: Canadian Tire Corporation, Statistics Canada, Raymond James Ltd.
The slower rate of growth is, in our opinion, due in large part to the decline in the average age of vehicles on Canadian roads, which is a function of the very aggressive financing offers from new car dealers. The low interest rate environment has made possible low-to-no interest financing for periods of up to 84 months which, in turn, has translated into strong new vehicle sales despite the restrained consumer spending (highlighting Canadian consumers’ preference for new vehicles over other big-ticket items). New light vehicle sales growth in Canada in the 2010-2014 period grew at a robust CAGR of 4.8% versus a decrease of 1.2% in the 2005-2009 period. With the interest rate environment expected to remain at historically low levels in the near-future, the strong growth in new vehicle sales is expected to continue through 2016E.
Automotive aftermarket retailers are direct beneficiaries of increased driving activity, as: (i) an increase in distance driven increases the necessary spending on maintenance on older vehicles, (ii) part failure rates inevitably rise with increased driving activity, particularly for categories like brakes; and, (iii) an increase in distance driven leads to quicker wear and tear for parts like tires. With the increasing complexity of modern vehicles and the expertise required for their maintenance and repair, the growth rate of the DIFM market is expected to outpace that of the DIY market.
Against this backdrop, Canadian Tire has implemented several initiatives to increase its presence in the commercial install market and improve its automotive business and service offerings, including the enhancement of customer-facing processes (in-store technology), upgrade of its IT infrastructure, supply chain capabilities, and expanded product assortment. Additionally, in March 2014 Canadian Tire brought in Michael Broderick, an industry veteran with over 20 years of automotive experience, to lead its Automotive business.

Canadian Tire Corporation Canada Research | Page 11 of 48
Raymond James Ltd. | 2100 – 925 West Georgia Street | Vancouver BC Canada V6C 3L2
Living the National Brand Life
The second largest component of CTR’s sales is the Living category, accounting for an estimated 33% of CTR’s revenues (approximately $2,069 mln business). The Living category comprises of home décor, home organization, and household essentials (cleaning supplies, personal hygiene products), in addition to kitchen appliances, gardening, outdoor tools, and seasonal items.
According to Statistics Canada, the retailing of indoor furniture, household appliances (two-thirds of which we moved to the Fixing market), home furnishings, housewares, lawn and garden equipment, and pet food was $40.2 bln in 2014 (which represents a 10-year CAGR of 2.8%). We estimate Canadian Tire’s 2014 market share at 5.1% (on revenues of approximately $2,069 mln) versus 3.9% in 2010. The increase in market share is primarily attributed to Canadian Tire’s expanded offering versus increased share in existing categories. Exhibit 6 details CTR’s Living category sales and market share in the period 2010-2014.
Exhibit 6: Evolution of Living Revenues and CTR’s Market Positioning
Source: Canadian Tire Corporation, Statistics Canada, Raymond James Ltd.
The marked deceleration of sales growth in the living category in the 5-year period through 2014 masked (relatively) solid continued growth of pet food and accessories. While living category sales growth decelerated from a 3.8% CAGR in the 5 years through 2009, to 1.8% through 2014, pet food (and accessories) and housewares sales CAGR were 3.4% and 3.1%, respectively.
The pet food market in Canada is a $3.5 bln industry, and accounts for approximately 8.7% of overall Living retail sales. Consumers are treating pets as members of the family and, as such, consumer demand for high-quality, natural and nutritious products, continues to grow. According to the Pet Industry Joint Advisory Council of Canada, approximately half of Canadian households own a pet. In addition, the pet food market appears to be less cyclical, which is evidenced by the reality that during the last economic downturn, pet-owners of all income levels cut back more on personal spending than on pet-related expenditures (according to Ibisworld).
As such, it does not come as a surprise that sales of pet food grew at the fastest rate in the 5 years to 2014, increasing at a CAGR of 3.4% versus the overall Living retail sales CAGR of 1.8%. Despite outpacing the overall industry, the 3.4% CAGR reflects a meaningful deceleration from the very robust 11.2% CAGR recorded in the 5 years through 2009. According to market research group Packaged Facts, the total pet-related market (food, accessories, veterinary) through 2018 is expected to grow at a 3.9% CAGR, led by growth in accessories.
The strong growth in the 2005-2009 period reflects both mass merchandizers and discounters meaningfully expanding their product assortment, with a broad price range of pet food and accessories, bringing premium offerings (we use the term loosely) to the mass channel. The increased competitive intensity in pet food and accessories that this expansion created necessarily resulted in increased bite in pet product pricing (driving prices and segment growth rates lower). We believe that the rebalancing (or shake out) of the pet product market has largely run its course given current share (and share trends in the last 5 years). Exhibit 7 details the evolution of pet-related spending and market share of the Retail Living category.

Canada Research | Page 12 of 48 Canadian Tire Corporation
Raymond James Ltd. | 2100 – 925 West Georgia Street | Vancouver BC Canada V6C 3L2
Exhibit 7: Retail Sales Growth of Pet Food and Accessories
Source: Statistics Canada, Raymond James Ltd.
A decade ago, if looked hard you would find a shelf or two of canned pet food in CTR, whereas today, the pet product offering is on occasion a full aisle (or two). The push into expanded pet product offerings was particularly opportune, as it is both a traffic-driving and margin-expanding category with the best growth profile within CTR’s Living segment. We believe that pet product sales are positioned to, at a minimum, maintain their current growth trajectory, as even within the department and mass channels, there is a want for premium offerings (the mix impact of which offsets the ticket pressures on basics). Heaven forbid our four-legged fiends (sorry, friends) don’t get a new toy or Kong every second time we do a Canadian Tire (or dog food) run.
The $9.3 bln housewares segment’s 5-year CAGR of 3.1% through 2014 reflects a meaningful acceleration from the more modest 1.8% CAGR recorded in the preceding 5 years to 2009. The relative performance of housewares is all the more impressive, in the context of the paltry 1.2% CAGR through 2014 of the Living category excluding housewares and pets, versus 3.8% in the 2005-2009 period. We believe the acceleration in sales of housewares reflects the disruption driven merchandising innovation and new product introductions, necessitated by increased competitive intensity in the space.
CTR revamped its Living strategy to include a wider assortment of merchandize from prominent brands (such as KitchenAid, Lagostina, Cuisinart, and Miele), in addition to inspirational displays and improved product adjacencies in order to enhance Canadian Tire’s brand image as a destination for kitchen, home organization, and cleaning supplies. In fact, kitchen accounts for the largest part of CTR’s Living sales at an estimated $690 mln (approximately a third of Living sales), with kitchen appliances and cookware the two largest components. We estimate CTR had sales of kitchen appliances of approximately $310 mln, followed by cookware sales of approximately $276 mln. Exhibit 8 below illustrates the 5-year CAGR’s of the Living category.
Exhibit 8: Retail Sales CAGR’s of the Living Segment through 2014
Source: Statistics Canada, Raymond James Ltd.

Canadian Tire Corporation Canada Research | Page 13 of 48
Raymond James Ltd. | 2100 – 925 West Georgia Street | Vancouver BC Canada V6C 3L2
CTR’s expanded Living strategy continues to resonate with consumers, with the performance in the kitchen category proving particularly robust. In addition, the sales performance of stores with the full living and associated merchandizing strategy is significantly better than CTR stores without the full living offering. Further underpinning the appeal of the strategy is the low capital intensity of the enhanced Living strategy. While the Living category (with exception of pet products) is largely an investment in margin (lower margin contributor), we believe that the low capital intensity and traffic-driving nature served to strengthen CTR’s business, and protect its market share in the face of increased competitive intensity.
Fixing to Play and Playing to Fix
Within CTR, the combined fixing and playing segments represent approximately 33% of revenues, with fixing edging playing on a percent of revenue basis. We estimate fixing represents 17% of revenues and playing 16%. While fixing is the slightly larger of the two segments, it is playing that is the higher margin business (and of particular import in terms of CTR’s strategy, brand image and repositioning).
CTR is a leading destination for the do-it-yourself home repairer, offering home renovation and repair tools, and paint and accessories. According to Statistics Canada, total home renovation spending (at Retail) was an estimated $29.0 bln in 2014, which grew at a 10-year CAGR of 3.1% through 2014. The market is dominated by The Home Depot (HD-N, RJA: Market Perform) with an estimated market share of 21.2%, followed by Home Hardware at 14.6%, Rona at 11.3%, Canadian Tire at 3.7%, and Lowe’s (LOW-N, RJA: Market Perform) a distant fifth at an estimated 2.4%. We estimate Canadian Tire’s Fixing revenues totaled approximately $1,066 mln in 2014 (17% of CTR’s revenues). With a four-firm concentration ratio of 50.5%, the fixing market is relatively concentrated.
At the risk of stating the obvious, the biggest differentiator is that the hardware stores (The Home Depot, Home Hardware, Rona, and Lowe’s) carry dry wall, lumber, heavy-duty repair materials (and a higher percentage of national brands), while CTR stores focus on the DIY customer demographic. We would not be surprised (given the scale of the addressable opportunity) to see CTR further up the ante in the Fixing segment with similar strategies to those effectively used in the expanded Living category offering.
The home improvement industry is highly correlated with the housing market. Sale of existing houses is one of the most important drivers of future home improvement spending. This is due to the reality that many homeowners now routinely undertake minor renovations prior to putting their homes on the market for sale, in addition to the future homeowners who generally embark on renovation projects following a home purchase. According to a CMHC survey, an estimated 40% of households were planning on making improvements to their homes in 2014 with an average project price tag of $20,000 (versus $15,000 in 2013). Exhibit 9 details actual and expected total renovation spending through 2016E. We expect renovation expenditures to increase 3.0% in 2015E, and 2.7% in 2016E.
Exhibit 9: Home Sales and Total Renovation Spending
Source: CREA, Statistics Canada, Raymond James Ltd.

Canada Research | Page 14 of 48 Canadian Tire Corporation
Raymond James Ltd. | 2100 – 925 West Georgia Street | Vancouver BC Canada V6C 3L2
The Canadian housing market has experienced significant growth over the last decade, supported by an interest rate environment that has made home ownership (outside of Vancouver and Toronto) more feasible for a greater swathe of the population. In spite of the negative impact of declining oil on Canada’s economy, economic conditions appear to remain supportive of continued housing demand, which is a function of continued low mortgage rates (by historical standards) and demographic trends. Canada continues to attract a high level of immigrants, which has been the major driver of Canadian population growth.
Sharply higher housing prices are also forcing many home buyers, particularly the prime new household formation group of those aged between 25-34 years, to look for less expensive (read, fixer-upper) properties. In addition, Canada’s population is also aging – the proportion of Canadians aged 65-plus is expected to rise from 15% in 2013 to 23% by 2030. With an aging population that is more likely to stay put in their existing homes, combined with the reality that a rising proportion of homeowners are squeezed out of the red hot housing market in major Canadian cities, demand for renovation spending (despite the expected 1.1% dip in home sales in 2015) is likely to stay strong through our forecast window.
Total renovation spending at Retail, with the exception of modest decreases in 2009 and 2011, has increased every year over the last 10 years. During this 10-year period, the market grew at a CAGR of 3.1% to an estimated $29.0 bln. Sales in the last 5-year period through 2014, however, grew at a CAGR of 0.9% versus the preceding 5-year period CAGR of 5.4%. The more modest growth, in our opinion, largely reflects an increasingly stretched consumer (on an increasingly rich housing market buy-in), leaving less room for renovations.
Exhibit 10: Total Renovation Spending 2005-2016E ($ bln)
Source: Statistics Canada, Raymond James Ltd.
The growth in total renovation spending has, however, exceeded that of Canada’s GDP growth, which in the 10-year period through 2014, increased at a CAGR of 1.9%. Home improvement sales accounted for an estimated 1.8% of Canada’s GDP in 2014, up from an estimated 1.6% in 2005. In addition, renovation spending has been the fastest growing component of residential investments in Canada over the last 10-years, outstripping the growth in both new construction and home resale-related expenditures.
While part of the growth in renovation spending is attributed to the growth in Canada’s housing stock, the majority of the growth reflects increased expenditures per household. In fact, the average Canadian household now spends close to $4,600 on home renovation projects annually versus $2,500 in the 1994-1998 period. While the negative impact of lower oil prices will necessarily dampen renovation spending in Alberta, the reality that approximately two-thirds of renovation dollars are generated from Ontario and Quebec (where home sales are forecast to increase by low single digits in both 2015E and 2016E) is supportive of continued home improvement spending.

Canadian Tire Corporation Canada Research | Page 15 of 48
Raymond James Ltd. | 2100 – 925 West Georgia Street | Vancouver BC Canada V6C 3L2
While an estimated 42% of Canadians identify CTR stores as their first choice for tools, this number drops significantly to 10% for small-home renovation and maintenance projects. Against this backdrop, CTR has revisited its Fixing business (with the same approach as in Automotive), with an emphasis on fundamentals such as optimizing product assortment, and introducing higher-quality brands, accompanied with marketing campaigns. By way of illustration, CTR’s wood stain TV commercial that aired during 2Q14 resonated particularly well with consumers, which is evidenced in the strong uplift in paint sales during the quarter.
As such, CTR’s product assortment is, we believe, sufficient to accommodate many small-home renovation and maintenance-related projects. The medium to longer-term outlook on home renovation spending is, we believe, more subdued. Housing affordability will necessarily decline as borrowing costs increase off their historic lows, and consumers find themselves more financially stretched. In the interim, Canadian households appear focused on managing down their mortgage debt.
The $8.7 bln Canadian sporting goods market is characterized by intense competition between existing retailers, exacerbated by increasing competition from online sales channels. The Playing segment accounts for an estimated 16% of CTR’s revenues. The approximately $1,003 mln Playing business has a strong focus on hardgoods, specifically sporting and recreational equipment, with leading market positions in several key categories including hockey, camping, hunting, fishing, and bicycles. Canadian Tire offers a broad range of sporting and recreational equipment, with a more limited footwear and apparel product mix.
The Canadian sporting goods industry is comprised of four primary channels:
Traditional Sport Stores;
Mass Merchandizers and Department Stores;
Canadian Tire/Costco/Other;
Athletic Footwear Retailers.
Sport stores represent the largest piece of the Canadian sporting goods pie, commanding a 65.4% share, followed by mass merchandizers (department stores and discount stores) in a distant second place. FGL Sports’ Sport Chek banner (owned by CTC) is not only the largest player in the Canadian sporting goods market, but it is also the only retailer among the top three players in all three segments (equipment, footwear, and apparel) of the sporting goods market.
Mass merchandizers and department stores account for 14.9% of the Canadian sporting goods market with Walmart Canada commanding a 9.6% market share, while other notable participants, such as Sears and The Bay, are significantly smaller.
The third-largest segment, which includes Canadian Tire and Costco, represents 12.9% of the Canadian sporting goods market.
The remainder of the market is serviced by the collection of athletic footwear stores, accounting for 6.8%, including the likes of Foot Locker, and The Running Room. Exhibit 11 depicts sales of Canadian sporting goods by retail channel.
Exhibit 11: Breakdown of the Canadian Sporting Goods Market – 2013
Source: Trendex North America, Raymond James Ltd.

Canada Research | Page 16 of 48 Canadian Tire Corporation
Raymond James Ltd. | 2100 – 925 West Georgia Street | Vancouver BC Canada V6C 3L2
With an estimated 8.7% market share, Canadian Tire is the third-largest player in the approximately $8.7 bln Canadian sporting goods market. In the preceding decade, CTR was squeezed by Walmart, whose market share essentially doubled from 5.4% in 2003 to 9.6% in 2012, while CTR’s share decreased modestly from 9.1% to 8.7% according to Trendex data. While an estimated 57% of Canadian sporting goods buyers made a purchase at one of CTC’s banners in 2014, only 24% were made at CTR. In response, CTR made changes that included bringing in the top sporting goods merchant from FGL Sports (CTC acquired FGL in 2011) to run CTR’s Playing business. The focus and mandate were clear – increase CTR’s relevance as a sporting goods destination. Exhibit 12, below, highlights the evolution of the Canadian sporting goods industry and its largest players.
Exhibit 12: Evolution of Canadian Sporting Goods Market – 2012 versus 2003
Source: Trendex North America, Raymond James Ltd. (CTC banners marked in red)
The largest component of the Canadian sporting goods industry is equipment, which accounts for an estimated 53.2%, with athletic footwear at 27.1% and apparel at 19.8%. The mass merchandizers tend to compete most effectively at an entry level in the hardgoods market, given their souring reach and the reality that price tends to trump either service or the shopping experience at this end of the market. Canadian Tire is the largest player in the hardgoods (sports equipment) market with an estimated 14.9% market share. Exhibit 13 details CTR’s sporting goods market share.
Exhibit 13: Largest Canadian Sporting Goods Retailers – Market Share
Canadian Tire 14.9% Sport Chek 18.5% Lululemon 11.0%
Walmart 12.5% Foot Locker 6.2% Sport Chek 9.2%
Sport Chek 9.0% Running Room 6.1% Walmart 7.3%
Golf Town 6.6% Walmart 5.4% Sears 6.0%
MEC 3.9% Sports Experts 5.3% Sports Experts 5.9%
Sports Experts 3.3% Sears 1.7% Mark's 5.9%
Costco 3.0% Golf Town 1.7% Winners 5.1%
Sears 1.7% Athletes World 1.7% Costco 2.1%
Total CTC 27.2% 25.5% 21.0%
Equipment Footwear Apparel
Source: Trendex North America, Raymond James Ltd. (CTC banners marked in red)
Canadian Tire’s sporting goods selection is largely comprised of hardgoods (70% of assortment), with leading market positions in hunting, fishing, and camping, as well as strong market presence in hockey equipment, biking, and biking accessories. CTR’s 14.9% equipment market share imputes equipment sales of approximately $690.3 mln which, given market dynamics, was necessarily the most exposed market in the last 10 years to the mass merchants’ share grab. CTR has rolled out hunting and fishing store-within-store ProShops in key markets (following a successful test in 2011). CTR’s 30 Fishing ProShops, 62 Hunting ProShops, and 104 combined Fishing and Hunting ProShops, generated approximately 15% of Playing revenues in 2014, implying revenues of approximately $150.4 mln. While CTR leads the equipment market of the sporting goods industry, it does not have a meaningful footwear and apparel offering. CTC owned FGL Sports banner Sport Chek is the leading player in the Footwear Market (and number two in the Apparel Market).

Canadian Tire Corporation Canada Research | Page 17 of 48
Raymond James Ltd. | 2100 – 925 West Georgia Street | Vancouver BC Canada V6C 3L2
FGL Sports
The Cornerstone of Growth
The Canadian sporting goods industry is relatively concentrated with the 10 largest sporting goods retailers commanding an estimated 54.2% of the market, versus the more competitive US sporting goods market, where the top 10 retailers represent approximately 40.6%. In addition, the sporting goods by retail channel in Canada differ from that of the US, with sport stores representing 65.4% of sales in Canada versus 51.2% in the US. Another striking difference between the two markets is the spend per capita on sporting goods, with the average Canadian spending 28% more annually at $240 versus the average American at $187. The higher spend per individual is most likely attributable to Canadians’ love for sports with higher capital intensity – specifically hockey, skiing, skating, and cycling. Exhibit 14 details the Canada versus US dynamic by channel and spend.
Exhibit 14: Canadian versus US Sporting Goods Distribution Channels
Source: Trendex North America, Raymond James Ltd.
With the August 2011 acquisition of the Forzani Group (FGL Sports), Canadian Tire emerged as the largest sporting goods retailer in Canada, commanding an approximate 31.5% of the sporting goods market. FGL Sports’ largest banner, Sport Chek, accounted for approximately 11.4% of the sporting goods market in Canada, followed by its Sports Experts banner at 4.3% at the end of 2012, both of which increased market share through 2014. The acquisition not only served to reinforce CTC’s leadership position within the Canadian sporting goods market, but to also stave off (or at a minimum materially delay) the entrance of US-based Dick’s Sporting Goods (which was rumoured to have been eyeing FGL as the preferred platform to build a Canadian footprint). Exhibit 15 details Sporting goods industry growth and FGL Sport market share growth.
Exhibit 15: FGL Market Share and Sporting Goods Industry Growth
Source: Forzani Group, Trendex North America, Statistics Canada, Raymond James Ltd.

Canada Research | Page 18 of 48 Canadian Tire Corporation
Raymond James Ltd. | 2100 – 925 West Georgia Street | Vancouver BC Canada V6C 3L2
In addition to becoming the largest player in the sporting goods industry in Canada, FGL Sports was a complementary addition to the CTC family, with very minimal product overlap. When historically an FGL Sports store opened in the vicinity of a CTR store, the sales impact on CTR was (according to CTR management) negligible at 1%. Prior to the FGL Sports acquisition, CTR tended to play in price-driven entry level sport equipment categories, with very little to offer in terms of either sports apparel and footwear. The mix at FGL, with over 70% of revenues derived from softgoods and footwear (Exhibit 16), is essentially the opposite of CTR. In addition, FGL’s hardgoods offerings are tailored to the more serious athlete (higher price point, higher service expectation) as opposed to the typical recreational sport enthusiast at CTR. Exhibit 16 below highlights the complementary nature of the FGL Sports acquisition.
Exhibit 16: Comparison of Canadian Tire and FGL Sports, and FGL Sports’ Sales Mix
Source: Canadian Tire Corporation, Raymond James Ltd.
While CTR was historically strong in kid (recreational) and adult (recreational) segments, the offering struggled to resonate (due to its offering, experience, and location) with the critical 18-35 demographic. With FGL, it was essentially game on with CTC in the mall and finally able to target this demographic. Driving the appeal and brand resonance of FGL (and capitalizing on the halo effect for other CTC banners) is a critical element of CTC’s growth strategy. FGL Sports’ banners attract a relative young demographic (80% of Sport Chek’s customers are under the age of 40) and have above-average incomes.
CTR’s playing merchandize assortment now targets a wider range of sports enthusiasts and covers essentially all income and skill levels in the majority of key sports. We do believe that there remains an untapped opportunity for FGL (and by extension CTC) in the high (or rather higher end) of the cycling market, which continues to be serviced by the Independent Bike Dealer (IBD) network or brand-specific stores (TREK). While we think it a stretch for CTC to successfully retail the super-premium (Cervelo, Pinarello) end of the market, an opportunity exists in our opinion in premium brands (Cannondale, TREK). An increased share in this growing segment could necessarily be achieved in a number of ways. Exhibit 17 details the positioning of key players in the Canadian sporting goods market.
Exhibit 17: Canadian Sporting Goods Retail Positioning
Source: Trendex North America, Raymond James Ltd. (CTC banners marked in red)

Canadian Tire Corporation Canada Research | Page 19 of 48
Raymond James Ltd. | 2100 – 925 West Georgia Street | Vancouver BC Canada V6C 3L2
The combination of the continuous update of retail store concepts, revamp of store aesthetics, and superior customer service, play a critical role in delivering a shopping environment that complements that of the products offered. In fact, FGL Sports only hires sports enthusiasts with thorough product knowledge. Additionally, it is necessary for retailers to cater to consumers’ constantly-evolving lifestyles and tastes. By way of illustration, sports apparel, including footwear and clothing, has become particularly fashionable over the last few years. Sport Chek stores, with their high proportion of athletic footwear, have been direct beneficiaries of this trend.
In May 2012, Canadian Tire announced an accelerated growth plan for FGL Sports, on the basis of three strategic pillars. The first pillar is the focus on strategic banners, with Sport Check as its super brand, and Atmosphere as its outdoor lifestyle banner. Sport Chek has been rolling out its new concept flagship stores across Canada, with the latest addition in Burnaby, B.C. The second pillar is the accelerated growth of FGL’s footprint, under which Sport Chek and Atmosphere will add approximately 50% more square feet to their existing footprint by 2017. The third pillar focuses on building customer connection and improving customer experiences.
As part of the accelerated growth plan, FGL Sports also embarked on a banner rationalization initiative, under which the number of banners were reduced to three main banners (with the latest acquisition of Pro Hockey Life the number of banners increased to four), and several underperforming banners were closed (e.g., Sports Mart and Athlete’s World). The August 2013 acquisition of Pro Hockey Life added 23 high-end specialty hockey stores to the FGL Sports umbrella. FGL’s Sports Experts banner (primarily located in Quebec) was unaffected by the restructuring. Exhibit 18, below, illustrates the evolution of FGL Sports’ banners.
Exhibit 18: Evolution of FGL Sports Banners
2010 2011 2012 2013 2014 2015E 2017E
Sport Chek 140 150 161 171 189 195 205
Sports Experts 72 70 72 72 73 74 76
Atmosphere 65 68 57 66 66 67 69
Pro Hockey Li fe - - - 23 14 14 14
L’Entrepôt du Hockey - - - - 9 9 9
Sport Mart 64 59 41 - - - -
Intersport 53 51 47 45 44 44 44
Hockey Experts 17 19 22 17 15 15 15
National 19 18 18 18 18 18 18
Athletes World 54 53 44 - - - -
Nevada Bob's Gol f 6 1 - - - - -
Fi tness Source 1 - 2 - - - -
S3 7 11 11 9 8 7 7
Tech Shop 3 - - - - - -
Other 15 15 - - - - -
Buying Members 18 19 20 - - - -
Total 534 534 495 421 436 443 457 Source: Forzani Group Ltd., Canadian Tire Corporation, Raymond James Ltd.
FGL will also invest in the creation of 12-14 HERO stores (and additional Sport Chek flagship stores) over the next several years. The HERO stores will incorporate the learnings from the existing flagship stores, in addition to ongoing digital enhancements, increased customization capabilities (e.g., personalized sneakers), and greater connection with the local community through event boards and mobile engagement.
The reality of how appealing the economics of the upgraded stores are is highlighted in the performance of the West Edmonton flagship store, which has seen a material 20% lift in average basket since its opening in January 2014. Exhibit 19 details FGL’s SSS performance through 2014.

Canada Research | Page 20 of 48 Canadian Tire Corporation
Raymond James Ltd. | 2100 – 925 West Georgia Street | Vancouver BC Canada V6C 3L2
Exhibit 19: FGL Sports Same-store Sales Performance
Source: Canadian Tire Corporation, Raymond James Ltd.
In terms of the sporting goods market, sales growth has been muted relative to broader Retail sales. In 2014, the sporting goods industry is estimated to have grown 2.5% to $8.7 bln versus retail sales growth of 4.6%. Within the sporting goods market, the apparel and footwear segments are poised to see the fastest growth rate through 2017E.
According to estimates by Trendex North America, sales of sports apparel are expected to grow at an annual CAGR of 2.7%, followed by the sports footwear industry at a CAGR of 2.5%. Conversely, should sports participation rates for capital-intensive sports such as hockey and skiing continue to stagnate, sales of sports equipment are forecast to grow at a much slower 0.8% CAGR. CTC (through both CTR and FGL) is very actively involved in driving renewed growth in participation rates in sports (and key sports in particular). The key initiatives aimed at getting kids active are Canadian Tire Jumpstart, Active at School, and the announcement on Jan-23-13 that CTC had signed an 8-year deal as a premier partner of the Canadian Olympic Committee.
In addition, on Jan-23-13 CTC announced that it has inked a four-year partnership with the Canadian Paralympic Committee, a new partnership with Hockey Canada (including sponsorship of the World Juniors), the Canadian Soccer Association and Canada Snowboard. An expanded partnership with Alpine Canada was also announced, which compliments the recently announced partnership with Skate Canada.
Exhibit 20: Canadian Sporting Goods Market Outlook – 2012 through 2017E
Source: Trendex North America, Raymond James Ltd.

Canadian Tire Corporation Canada Research | Page 21 of 48
Raymond James Ltd. | 2100 – 925 West Georgia Street | Vancouver BC Canada V6C 3L2
Mark’s
Generational Shift Underway
Mark’s offers affordable industrial and casual apparel and accessories, and is one of the largest specialty retailers in Canada. The store network at the end of 2014 was 383 of which 348 were corporate stores (including 65 store-within-stores), and 35 were franchise stores. While Mark’s is generally associated with industrial wear, it also offers men and women’s business, casual, and active wear. In order to increase its appeal in the casual wear market, Canadian Tire launched a network refresh initiative, which included converting its Marks Work Wearhouse stores to Mark’s and offering an enhanced customer shopping experience with wider aisles, brighter interiors, interactive features in addition to revamped product assortment in its casual wear line.
Mark’s 2014 revenues were $1,122 mln (9.9% of CTC revenues). In pursuit of building out its brand, Mark’s key strategic initiatives since 2010 have been the rebranding of its stores, the expansion of Imagewear and the launch of improved e-commerce capabilities. The rebranding initiative involved new logos, taglines and an improved customer experience (underpinned by a new store format, improved product assortment, clear navigational signage, and wider and brighter aisles). The rebranding initiative saw Mark’s replacing Mark’s Work Wearhouse.
The end-game of the rebranding and store experience reset was to increase the appeal of the brand, such that it begins to resonate with a younger, more urban consumer in the 35-50 age group (as opposed to its current 50-year-old plus customer demographic). The tagline reset dovetailed with the rebranding, supporting both new marketing campaigns and the formation of a strategic partnership with Cineplex’s SCENE loyalty program, the membership base of which skews to young and urban (perhaps too young and too urban for Mark’s today, but invaluable in the longer term given the Scotiabank partnership). The average SCENE member is between the ages of 18 and 35, with the majority of the member base under 40.
Mark’s management has moved to capitalize on the SCENE partnership. As part of Mark’s Everything in Jeans campaign, SCENE members could earn 500 points with any jean purchase (the promotion ran through March-2015). The Everything in Jeans campaign kicked off on Aug-10-14, and drove double-digit jeans sales growth in the last two quarters of 2014 (jeans sales increased 38% in the August to October time frame). The campaign was the primary driver of Mark’s positive 4Q14 SSS growth surprise of 1.2% on a tough year ago comp of 5.2%. In addition, the growth of Mark’s assortment is being driven by National Brands, including, Helly Hansen, Merrell and Columbia (to name a few). While these brands resonate better with the target demographic, the challenge is to get the message to that demographic.
With the learnings from Sport Chek in mind, Canadian Tire has also been testing digital marketing at Mark’s. The increased digital prowess is best illustrated by a digital flyer that Mark’s ran for winter boots and jackets in response to an early snowstorm in September 2014 in Calgary. The flyer generated a comp sales increase of 403% on target items in the relevant market. On the heels of several successful pilots, Mark’s continues to ramp its digital marketing spend, and e-commerce capabilities, driving an expected lift in brand resonance. Exhibit 21 below details the evolution of Mark’s same-store sales performance overlaid with the strategic initiatives undertaken.
Exhibit 21: Mark’s Same-store Sales Performance
Source: Canadian Tire Corporation, Raymond James Ltd.

Canada Research | Page 22 of 48 Canadian Tire Corporation
Raymond James Ltd. | 2100 – 925 West Georgia Street | Vancouver BC Canada V6C 3L2
Petroleum
More Marketing than Margin Play
Canadian Tire Petroleum is one of Canada’s largest independent gasoline retailers, with 297 gas bar locations across the country. In the 5 years through 2014, Petroleum has opened 38 new gas bars, rebranded 20 competitor gas stations, and performed major rebuilds at 15 sites. The majority of the gas bar sites are located adjacent to a CTR store, which serves to drive increased traffic to these stores. Fuel is sourced from several Canadian suppliers, and all of the gas bars are operated by independent retailers.
While the Petroleum business is a traffic driver for CTR stores, it is not a material contributor to earnings, which given the vagaries (and volatility) of fuel retail is a positive for CTC. The fuel retail market is both price sensitive and highly competitive. Petroleum maintains tight controls over its cost structure and enters into long-term gasoline purchase agreements with integrated gasoline wholesalers. Petroleum also engages in a cross-marketing strategy with other Canadian Tire banners, in addition to cross-promotional activities with grocer(s).
The largest driver of profitability for Canadian Tire Petroleum is the margins of the attached convenience stores operations attached to the petroleum retail apron. The gross margin on gasoline of 7%-9% is significantly lower than on c-store sales of 30%-plus. As such, Petroleum continues to push sales of ancillary products and non-gasoline service offerings such as convenience store items and car washes.
Financial Services
Not All Credit Cards are Created Equal
The Financial Services segment or Canadian Tire Financial Services (CTFS), while a key driver of CTC’s profitability with a solid track record, has found driving growth relatively challenging in the 5 years through 2014. While Financial Services represents only 8.6% of total revenues, the segment generates much higher margins and, as such, accounts for approximately 39.3% of EBT. Canadian credit card purchase volumes increased by 7.9% to $387.4 bln in 2014, of which MasterCard represented approximately 31.7% (or $122.7 bln) according to Nilson data (VISA continues to dominate with an approximate 60.3% share). While based on purchase volumes, RBC with $77.7 bln would the largest issuer in Canada, applying the more widely used measure of Outstandings, TD is Canada’s largest card issuer. On total market Outstandings of $81.4 bln in 2014, TD’s market share was 19.5%. CTB’s market share, on Outstandings of $4.3 bln, was approximately 5.3% in 2014, ranking CTB as the eighth largest card issuer in Canada.
Through Canadian Tire Bank (CTB), the corporation has continued to strengthen its Canadian Tire branded credit card business, which now issues the co-branded (MasterCard) Options World Card and (MasterCard) Sport Chek card, in addition to expanded deferred and equal payment programs. On May-08-14, Canadian Tire announced that Financial Services has struck a strategic partnership deal with Scotiabank for a cash consideration of $500 mln. The agreement also includes a credit card funding facility, where Scotiabank will provide Financial Services with credit card receivable financing of up to $2.25 billion, and an option to sell an additional 29% of the portfolio to Scotiabank within the next 10 years, at fair market value. Scotiabank’s market share based on Outstandings of $11.7 bln was 13.9%, ranking it third behind TD and RBC.
As part of this transaction (which closed on Oct-01-14), CTC reorganized its Financial Services business by transferring substantially all of its domestic insurance, identity theft, and other optional products from CTFS to CTB. Scotiabank is now the exclusive partner for new financial products for CTB customers, such as mortgages, with both partners aggressively looking to monetize the opportunities for new products, services and improved customer loyalty (both Scotiabank and CTC are SCENE Loyalty partners) that the partnership is expected to generate. The SCENE Loyalty program is a good fit for Scotiabank and CTC, in our opinion, given who they bank today and the target demographic of tomorrow.
While the competitive intensity in the premium card market experienced a step-function change late in 2013, the competitive dynamics in the mass (or more specifically sub-prime as it relates to CTB) market were largely unchanged. We are not saying this market was not competitive, but rather that it was not subject to the same level of disruption as in the premium and super premium markets. We estimate (adjusted for the potential overlap in the Aerogold portfolio through the transition year that was 2014) that there were approximately 84 mln credit cards in circulation, of which CTB represents an estimated 4.2% or 3.5 mln cards (1.8 mln active accounts).

Canadian Tire Corporation Canada Research | Page 23 of 48
Raymond James Ltd. | 2100 – 925 West Georgia Street | Vancouver BC Canada V6C 3L2
The challenge of both the competitive intensity and repositioning of the CTB credit card book is highlighted by the deceleration in the growth of Gross Average Receivables (GAR) over the last decade. In the 5-year period through 2009, the GAR CAGR was 9.6%, versus 2.8% in the 5-year period through 2014. The deceleration in growth largely reflects the increased competitive intensity in the Canadian credit card market, moderation in the risk profile following the 2008-2009 financial crisis, and new government regulations, such as changes in balance transfer policies. While receivables experienced a brief period of negative growth in the 2010-2011 time frame (largely attributable to a shift in CTB’s risk tolerance), growth resumed in 2012 (and accelerated further in 2013 and 2014), albeit at a modest pace. The acceleration was primarily due to CTB’s ongoing investments in new account acquisition, process enhancements (reduction in approval timing, optimization of credit limit strategies), and new product offerings.
While approximately 10% of the Canadian lending market is sub-prime, it accounts for roughly 20% of CTB’s portfolio. Sub-prime accounts are generally charged higher interest rates due to their higher risk nature. As a result, sub-prime accounts generally have higher net write-off rates. Due to Canadian Tire’s above average weight of sub-prime accounts, its net write-off rate sits well above the national Canadian average of 3.1%. While net write-off rate necessarily peaked in 2009 (at 7.8% versus the national average of 4.9%) at the height of the economic downturn, it has been on a steady decline ever since. CTB’s net write-off rate exited 2014 at 6.0%. Exhibit 22 details CTB’s GAR and Net Write off rate through our forecast window.
Exhibit 22: Financial Services Gross Average Accounts Receivable
Source: Canadian Tire Corporation, Raymond James Ltd.
CTB’s average account balance growth CAGR was 8.5% in the 5-years through 2009, which on tighter (absolute and relative) risk management (and increased competitive intensity led by Capital One) decreased to 3.2% in the 5-year period through 2014. The growth rate of account balances has, however, increased from 1.3% in 2012 to 3.4% in 2014. Exhibit 23 details the growth in average account balances and the number of accounts carrying a balance from 2005 to 2014.
Exhibit 23: Financial Services Average Account Balance and Number of Accounts with Balance
Source: Canadian Tire Corporation, Raymond James Ltd.

Canada Research | Page 24 of 48 Canadian Tire Corporation
Raymond James Ltd. | 2100 – 925 West Georgia Street | Vancouver BC Canada V6C 3L2
CT REIT
CT REIT, one of Canada’s largest REITs, was created in October 2013 through the spin-off of approximately 18.9 mln square feet of Canadian Tire’s geographically diverse portfolio of properties, comprised of 255 retail properties and one distribution centre. The aggregate gross proceeds of the initial public offering were $3.6 bln, which the REIT financed through a $1.8 bln equity issuance to Canadian Tire and public investors, in addition to $1.8 bln in preferred instruments issued to Canadian Tire. Canadian Tire holds an 83.2% ownership in CT REIT.
Exhibit 24: Well Diversified Portfolio Spans Across Canada
Source: Canadian Tire Corporation
CT REIT’s principal tenant is Canadian Tire, which represents more than 96% of CT REIT’s base minimum rent and approximately 97.9% of gross leasable area. Outside of Canadian Tire, CT REIT’s largest tenants include Overwaitea Food Group, Best Buy, Precise Parklink, Marshalls, RBC, and Shoppers Drug Mart, although each comprises less than 0.4% of annual base minimum rent. CT REIT, with a weighted average remaining lease term of 14.5 years (longest in the industry), arguably has one of the most stable lease profiles among Canadian REITs. Its portfolio of CTC leases contains average contractual annual rent escalations of 1.5% annually over the initial term of the leases, with a weighted average rental rate of $13.03 per square foot. In terms of acquisitions, CT REIT completed 13 property and 2 land acquisitions in 2014, in addition to 2 developments and 6 property intensifications, bringing its total gross leasable area to in excess of 20.3 mln.
All geographies are well represented within CT REIT’s portfolio, with 43% of base minimum rent generated in Ontario, 26% in Western Canada, 23% in Quebec, and the balance in Atlantic Canada. In addition, CT REIT’s portfolio is mainly tilted to large urban centres (69% of base minimum rent) with approximately 88% of the portfolio consisting of stand-alone Canadian Tire retail stores (multi-tenant, CTC-anchored properties make up approximately 10% of the portfolio).
In terms of financial flexibility, CT REIT has a strong balance sheet that is largely unsecured, with approximately 98% of its properties unencumbered. In effect, CT REIT’s indebtedness is comprised of the $1.85 bln in Class C LP Units, $58.5 mln in mortgage payable, and $78 mln drawn on its revolving bank credit facility, for total indebtedness of $1.98 bln. CT REIT’s debt to enterprise ratio of 47.0% at the end of 2014 was essentially in line with the industry (mid 40%).
Canadian Tire and CT REIT operate under a Right of First Offer agreement, under which CT REIT has the right of first offer to purchase any property CTC intends to sell. In return, Canadian Tire also has the right of first offer to lease any property owned by CT REIT.
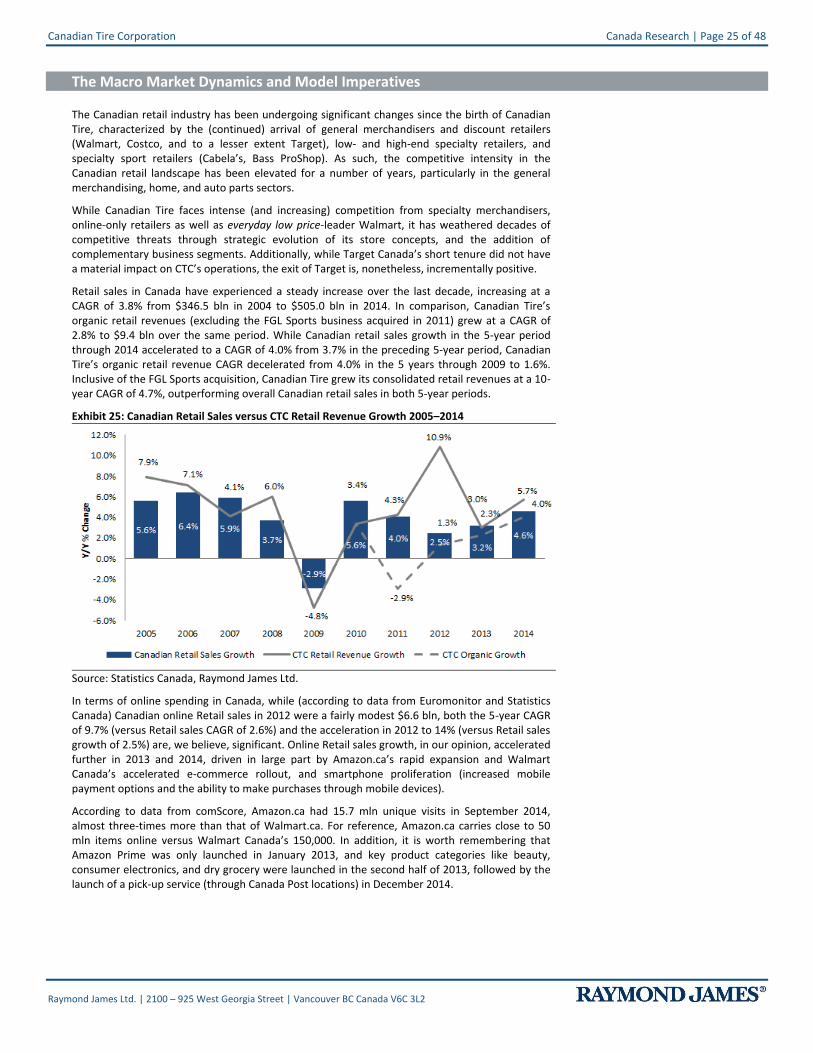
Canadian Tire Corporation Canada Research | Page 25 of 48
Raymond James Ltd. | 2100 – 925 West Georgia Street | Vancouver BC Canada V6C 3L2
The Macro Market Dynamics and Model Imperatives
The Canadian retail industry has been undergoing significant changes since the birth of Canadian Tire, characterized by the (continued) arrival of general merchandisers and discount retailers (Walmart, Costco, and to a lesser extent Target), low- and high-end specialty retailers, and specialty sport retailers (Cabela’s, Bass ProShop). As such, the competitive intensity in the Canadian retail landscape has been elevated for a number of years, particularly in the general merchandising, home, and auto parts sectors.
While Canadian Tire faces intense (and increasing) competition from specialty merchandisers, online-only retailers as well as everyday low price-leader Walmart, it has weathered decades of competitive threats through strategic evolution of its store concepts, and the addition of complementary business segments. Additionally, while Target Canada’s short tenure did not have a material impact on CTC’s operations, the exit of Target is, nonetheless, incrementally positive.
Retail sales in Canada have experienced a steady increase over the last decade, increasing at a CAGR of 3.8% from $346.5 bln in 2004 to $505.0 bln in 2014. In comparison, Canadian Tire’s organic retail revenues (excluding the FGL Sports business acquired in 2011) grew at a CAGR of 2.8% to $9.4 bln over the same period. While Canadian retail sales growth in the 5-year period through 2014 accelerated to a CAGR of 4.0% from 3.7% in the preceding 5-year period, Canadian Tire’s organic retail revenue CAGR decelerated from 4.0% in the 5 years through 2009 to 1.6%. Inclusive of the FGL Sports acquisition, Canadian Tire grew its consolidated retail revenues at a 10-year CAGR of 4.7%, outperforming overall Canadian retail sales in both 5-year periods.
Exhibit 25: Canadian Retail Sales versus CTC Retail Revenue Growth 2005–2014
Source: Statistics Canada, Raymond James Ltd.
In terms of online spending in Canada, while (according to data from Euromonitor and Statistics Canada) Canadian online Retail sales in 2012 were a fairly modest $6.6 bln, both the 5-year CAGR of 9.7% (versus Retail sales CAGR of 2.6%) and the acceleration in 2012 to 14% (versus Retail sales growth of 2.5%) are, we believe, significant. Online Retail sales growth, in our opinion, accelerated further in 2013 and 2014, driven in large part by Amazon.ca’s rapid expansion and Walmart Canada’s accelerated e-commerce rollout, and smartphone proliferation (increased mobile payment options and the ability to make purchases through mobile devices).
According to data from comScore, Amazon.ca had 15.7 mln unique visits in September 2014, almost three-times more than that of Walmart.ca. For reference, Amazon.ca carries close to 50 mln items online versus Walmart Canada’s 150,000. In addition, it is worth remembering that Amazon Prime was only launched in January 2013, and key product categories like beauty, consumer electronics, and dry grocery were launched in the second half of 2013, followed by the launch of a pick-up service (through Canada Post locations) in December 2014.

Canada Research | Page 26 of 48 Canadian Tire Corporation
Raymond James Ltd. | 2100 – 925 West Georgia Street | Vancouver BC Canada V6C 3L2
Canada continues to attract a high level of immigrants (the major driver of Canadian population growth) which, combined with modest job creation and GDP growth, provides some incremental lift for sales growth. However, Canadian consumers appear to be increasingly stretched financially, as evidenced by elevated leverage levels (debt to disposable income of 163% at the end of 4Q14 above pre-recession levels).
Exhibit 26: Debt to Disposable Income – Canada versus US
Source: Statistics Canada, BEA, Federal Reserve Board, Raymond James Ltd.
While approximately 75% of Canadians live within 160 km of the US border, combined with the reality that gasoline and goods in general cost significantly less south of the border, purchases made in the US account for a small portion of Canadian retail sales. According to Statistics Canada, while cross-border shopping increased from $4.7 bln in 2006 to an estimated $8.0 bln in 2012, purchases made in the US accounted for a negligible 1.7% of Canadian retail sales.
The recession in 2008-2009 resulted in a 12.2% decline in the number of day trips Canadians made to the US. The number of trips to the US rebounded sharply following the recession, with same-day car trips increasing steadily through the end of 2012 (coinciding with the Canadian dollar reaching parity with the US dollar). The 2013-2014 timeframe saw a meaningful weakening of the Canadian dollar, which also drove a decline in the number of day trips to the US.
With current exchange rates (CAD/USD spot price of 0.8233, versus the 2014 exit of 0.8601), we expect the number of same-day trips to the US to continue to decline in 2015E (purchases made in US dollars are increasingly becoming more expensive for Canadian consumers), which should positively impact Canadian retail sales growth.
Exhibit 27: Cross-border Shopping and Foreign Exchange
Source: Statistics Canada, Raymond James Ltd.

Canadian Tire Corporation Canada Research | Page 27 of 48
Raymond James Ltd. | 2100 – 925 West Georgia Street | Vancouver BC Canada V6C 3L2
Show me the (Canadian Tire) Money
While Canadian Tire has long had a loyalty program in place through Canadian Tire Money (in fact it is Canada’s oldest loyalty program), it lagged those offered by key peers, as it was a paper versus smart currency. Given the competitive dynamics (and increased competitive intensity) every basis point of market share is that much more valuable, which further highlights the imperative that is a compelling, data analytics backed loyalty program. Against this backdrop, Canadian Tire embarked on a digital transformation initiative which included the revamp of the loyalty program it launched in 1958. Today, consumers can earn and redeem Canadian Tire Money on smartphones and online. The digital rewards program complements paper Canadian Tire ‘Money’, which remains in circulation. The enhanced loyalty program, which is offered in addition to Canadian Tire’s iconic paper currency, was initially launched in Nova Scotia on Oct-10- 2014 (following the 2012 pilot of the Canadian Tire Money Advantage program), followed by a national rollout on Oct-24-2014. Exhibit 28 below depicts the evolution of Canadian Tire’s loyalty program from its inception in 1958 to the new digital roadmap in 2014.
Exhibit 28: Evolution of Canadian Tire Money
Source: Canadian Tire Corporation, Raymond James Ltd.
Customers simply show their Canadian Tire Mobile App, program card or key fob with their method of payment, or pay with a Canadian Tire Options MasterCard to collect e-Canadian Tire Money. e-Canadian Tire Money (just like the paper Canadian Tire Money in your sock drawer and glove box) has no expiry date and can be shared with other members. In addition (in a similar vein to key competitor programs), customers who use their Canadian Tire Options MasterCard collect 10x the e-Canadian Tire ‘Money’ across Canadian Tire’s family of companies.
The digital loyalty program also features a mobile app, My Canadian Tire Money, which allows users to collect and redeem Canadian Tire Money, track transactions, view bonus offers, and return products without a printed receipt. Canadian Tire e-Money is a critical and long overdue evolution of Canadian Tire’s loyalty offering, in a smart always on world, where real-time insights and digital rewards fulfillment are critical elements of the customer experience. Exhibit 29 details the paper currency and the smart currency.
Exhibit 29: Canada’s Oldest Loyalty Program Goes Digital
Source: Canadian Tire Corporation, Raymond James Ltd.

Canada Research | Page 28 of 48 Canadian Tire Corporation
Raymond James Ltd. | 2100 – 925 West Georgia Street | Vancouver BC Canada V6C 3L2
CTC’s initial April 2010 data analytics partnership with British data science company, dunnhumby (which is one of the leading retail loyalty analytics players globally with a client list that includes Tesco, Kroger, Macy’s, Nestle, Coca Cola, and Canadian grocer Metro) was a strategic imperative (necessary to jumpstart the rethink of loyalty and loyalty analytics within CTC). Through the analysis of unique customer identifier (Loyalty Card Membership) attached POS data, dunnhumby essentially creates a 360˚ view of consumers, which enables Retailers to divide them into segments based on their specific shopping behaviour. This, in turn, helps Retailers better understand the motivations behind the specific behaviour (whether consumers’ purchase decisions were influenced by price, promotion, availability), and reward them with more relevant offers to keep them engaged and satisfied. Exhibit 30 below illustrates the customer centric approach that dunnhumby applies, which provides some insight into the loyalty framework of CTC.
Exhibit 30: Customer Centricity Approach
Source: dunnhumby, Raymond James Ltd.
This deep level of customer understanding facilitates a more personal, one-to-one relationship with consumers, which in turn helps Retailers make better business decisions on promotions, pricing, assortment, and in-store availability, and thus reward them with meaningful and more relevant offers. This is particularly challenging (and therefore all the more important) for a general merchandiser the likes of Canadian Tire versus a grocer. The path to purchase, the rationale behind that purchase (and what to infer about the consumer and hence how to incentivize them) is a lot harder when they buy a brush one week, a BBQ the next (than when they buy berries week after week). More relevant and meaningful offers in turn increase customers’ tendency to shop the whole store (as opposed to cherry-picking promotions from the flyer), resulting in improved promotional effectiveness and customer experiences. Exhibit 31 below depicts dunnhumby’s loyalty approach.
Exhibit 31: dunnhumby’s Loyalty Approach
1. Customer data enables… 2. Customer insight informs… 3. Customer experience drives…4. Desired customer
behavior
Loyalty program
dataBasket segmentation
Enabling better
business decisions
Increased customer
lifetime value
• Basket size/value • Pricing • Sales growth
• Affluence • Promotions • Margin growth
EPOS data • Shopping missions • Assortment • Market share
• Availability
Traditional research
methods
Customer
segmentation
Building relationships
with customers
• Value & loyalty • Rewards
• Lifestyles • Relevant marketing
• Lifestages Source: dunnhumby, Raymond James Ltd.

Canadian Tire Corporation Canada Research | Page 29 of 48
Raymond James Ltd. | 2100 – 925 West Georgia Street | Vancouver BC Canada V6C 3L2
While Canadian Tire Money helped to drive customers back into the stores, it did not generate any data. Thus, Canadian Tire historically did not know who its most loyal customers were, and which were just cherry-picking promotions from the flyer. In addition, the traditional Canadian Tire MasterCard product provided relatively limited data on its customers. The addition of digital loyalty is set to change this – the new loyalty card offers a much wider array of data that Canadian Tire, in conjunction with its data analytics competencies, is now able to collect, analyze, and combine into more meaningful insights on customers’ purchasing behavior. The applied insights and resulting meaningful consumer segments in turn drive personalized promotions and content, which is a key way for Retailers to deliver relevance and a compelling value proposition. In addition, the more meaningful and relevant offers in turn reduce waste from mass promotions (sending out one-fits-all flyers to consumers). Retailers can then reinvest the savings in more targeted offers, driving incremental top-line growth, as depicted in Exhibit 32, below.
Exhibit 32: Loyalty Approach Creates Incremental Value for Retailers
Source: dunnhumby, Raymond James Ltd.
The national launch on Oct-28-14 followed an initial 2-year pilot in Atlantic Canada. The initial results showed that those with a loyalty card did not necessarily have larger baskets on each visit, but they shopped more frequently. In addition to not being able to track customer purchases, consumers who paid with a non-Canadian Tire Financial Services (CTFS) credit card previously did not receive any Canadian Tire Money.
Exhibit 33: Comparison of Canadian Tire Options MasterCard and Walmart Reward MasterCard Fundamentals Economics Features
Members of the Canadian Tire Money program
earn Canadian Tire Money at a rate of 0.4% of
purchases. Canadian Tire Options MasterCard
holders earn 10x the e-Canadian Tire Money on
purchases made across CTC banners, inlcuding
on automotive service. For purchases made
outside the CTC family of businesses,
cardholders collect 2x the e-Canadian Tire
Money.
Value of a Point:
0.40-cents
Issuance:
0.40 cents per $1 spend
Redemption:
5-, 10-, 25-, 50-cent, $1
and $2 increments
e-Canadian Tire Money does not have an
expiry date. Promotional "Money" and
multipliers are used.
Members can sign up for a Walmart Reward
MasterCard credit card to earn 1% in Walmart
Rewards for every dollar spent on purchases
made on the account and an additional 0.25% in
Walmart Rewards for every dollar spent at
Walmart stores in Canada. Minimum
redemption hurdle rate is at $5.00
Value of a Point:
1.25-cents
Issuance:
1.25 cents per $1 spend
Redemption:
20 points per $20
Walmart Rewards are earned in dollar
equivalents (not points) with the minimum
hurdle rate set at $5.00. Walmart rewards
don't have expiry dates. Promotional points
and points multipliers are used.
Source: Canadian Tire Corporation, Wal-Mart Stores Inc., Raymond James Ltd.

Canada Research | Page 30 of 48 Canadian Tire Corporation
Raymond James Ltd. | 2100 – 925 West Georgia Street | Vancouver BC Canada V6C 3L2
Omni-channel as the Channel
A recent PwC survey found that consumers are not focusing on only one channel for their purchases, but instead are integrating all available options and spending more time with those retailers that provide multiple channels. The same survey also found that while consumers are increasingly researching products online, they still prefer to make their purchases at physical stores. As such, online-only retailers Amazon and eBay are opening physical stores in order to complement their online presence – as it turns out, there are merits to meeting the customer face-to-face. Canadian retailers, despite the recent flurry of activity by key players (including CTC), remain laggards in e-commerce. Online Retail sales in Canada represented a paltry 1.4% of Retail sales (according to data from Euromonitor and Statistics Canada), particularly when compared to the US at approximately 5.0%, and the UK at approximately 12.0.
According to data from Euromonitor and Statistics Canada, while Canadian online Retail sales in 2012 were a fairly modest $6.6 bln, both the 5-year CAGR of 9.7% (versus Retail sales CAGR of 2.6%) and the acceleration in 2012 to 14% (versus Retail sales growth of 2.5%), are, we believe, significant. Online Retail sales growth, in our opinion, accelerated further in 2013 and 2014, driven in large part by Amazon.ca’s rapid expansion and Walmart Canada’s accelerated e-commerce rollout, and smartphone proliferation (increased mobile payment options and the ability to make purchases through mobile devices).
Canada has one of the highest rates of Internet and smartphone penetration in the developed world; however, this dominance has not translated into e-commerce leadership, as many Canadian retailers were reluctant to develop their online sales channels. This reluctance has created a window of opportunity for US retailers to capture a growing segment of the market, which resulted in US retailers dominating the online retail channel in Canada. As depicted in Exhibit 34 below, Indigo Books is leading the Made in Canada charge with a 1.5% online market share, followed by Longo Brothers Fruit Markets (Longo’s) owned Grocery Gateway. Canadian Tire, despite being one of the most frequented retailers in Canada, commands a paltry 0.1% of the online sales market.
Exhibit 34: Online Retailers' Canadian Market Share
Source: Business Development Bank of Canada, Raymond James Ltd.
The 800-pound gorilla of online-only retailers, Amazon, has a head start over other retailers entering the world of e-commerce, as it first launched service in Canada in 2002. Amazon continues to lead in Canada, commanding a 32.1% share of online sales, a position which does appear to be at risk in the foreseeable future. According to data from comScore, Amazon.ca had 15.7 mln unique visits in September 2014, almost three-times more than that of Walmart.ca (Amazon.ca now boasts close to 50 mln items online versus Walmart Canada’s 150,000). In addition, it is worth noting that Amazon Prime was only launched in January 2013, and key product categories like beauty, consumer electronics, and dry grocery were launched in the second half of 2013 (as illustrated in Exhibit 35 below).

Canadian Tire Corporation Canada Research | Page 31 of 48
Raymond James Ltd. | 2100 – 925 West Georgia Street | Vancouver BC Canada V6C 3L2
Exhibit 35: Amazon.ca’s Expansion Timeline
Source: Amazon Inc., Raymond James Ltd.
Online Retail sales are poised to accelerate in Canada (both Amazon and Walmart quickly ramping their e-commerce capabilities) as many Canadian brick-and-mortar companies are rushing to enter the world of e-commerce (to play catch up with their US counterparts). According to the Ipsos Canadian Interactive Reid Report, 82% of Canadian Internet users made a purchase online in the last year. Against this backdrop, Canadian Tire has embarked upon a digital transformation initiative, making it the cornerstone of its new 3-year strategic roadmap announced in October 2014. The omni-channel push by the more than 90-year old Canadian retailer comes after an initial failed attempt to build a meaningful online presence, as Canadian Tire scrapped its online website in 2009 following low utilization.
With digital retail only becoming more prevalent in recent years, Canadian Tire reassessed the merits of having an online presence and, as a result, began a cautious foray into e-commerce in 2011 by selling tires online. The initial e-commerce venture was followed by a national rollout of its new website. While admittedly coming off a low base, the strong double-digit website traffic growth in recent quarters is particularly encouraging.
As outlined at its 2014 Investor Day, Canadian Tire is focused on a generational shift, facilitated by: (i) attracting and retaining world class talent; (ii) creating a best-in-class digital ecosystem and analytics competencies; and, (iii) leveraging the strength of CTC’s brands, with Sport Chek and sporting goods as its cornerstone. With Sport Chek as the preferred path for CTC’s generational shift, the accelerated growth plan of the Sport Chek banner and digitally-savvy flagship stores, Sport Chek is making strides in digital marketing and ecommerce. In 2014, Sport Chek replaced its paper flyer with a digital flyer four times, and in each case the digital flyer generated significantly higher sales, in addition to providing incremental flexibility for stores (e.g., adjust for weather), than the traditional paper flyer. As part of Sport Chek’s road to digitization, in excess of 20% of adspend will be allocated to the digital flyer in 2015.
In an attempt to mitigate the growing threat of online Retailers, brick-and-mortar Retailers are finding creative ways to leverage their physical stores by creating more in-store human interactions, a feature online shopping is missing. A more meaningful relationship with consumers, and the ability to connect consumers to the products, in turn facilitate (and maintain) brand loyalty. Thus, many Retailers are pushing to integrate the physical store into the omni-channel experience – redevelop the retail strategy by managing the store network to complement the online strategy. The re-introduction of canadiantire.ca also brought its “Pay & Pick Up” service, where customers can shop Canadian Tire products online and then pick them up at their local store. The appeal of a pick-up service is further highlighted by its average 20%-30% margin advantage over home delivery.
While Canadian Tire also tested much smaller urban stores, called Canadian Tire Express, we believe the format (based on performance to date) is likely to see limited (if any) further expansion. At 6,100 sq. ft., the Express store offers approximately 25% of the assortment available at its big-box parent. The store’s focus on the assortment is home repair, kitchen, seasonal items and recreational sports. Approximately 30% of product assortment is devoted to kitchen and household goods, with more than half of products allocated to Fixing for smaller household projects (e.g. small tools, lightbulbs, paint, and nuts and bolts).

Canada Research | Page 32 of 48 Canadian Tire Corporation
Raymond James Ltd. | 2100 – 925 West Georgia Street | Vancouver BC Canada V6C 3L2
The Express store will also operate as a pick-up location for online shoppers. This is a feature Canadian Tire has been testing with the revamp of its e-commerce website (recall the first attempt was shut down in 2009), in which shoppers can place an order for an item online and have it delivered to the closest Canadian Tire store. Exhibit 36 details a CTR online pick-up location.
Exhibit 36: Canadian Tire Pay and Pick Up
Source: Retail Category Consultants, Raymond James Ltd.
In addition, Canadian Tire is also continuing to upgrade its Retail store network to a “Smart Store” format. The new format integrates a number of new store features designed to enhance operating productivity and improve the in-store customer experience. The stores feature a racetrack layout, easier-to-read navigational signage, customer help buttons, price check stations, and additional customer assistance desks in key areas of the store, all designed to help customers comfortably navigate through the aisles. The stores also feature special boutiques departments, such as automotive, sporting goods, and tools.

Canadian Tire Corporation Canada Research | Page 33 of 48
Raymond James Ltd. | 2100 – 925 West Georgia Street | Vancouver BC Canada V6C 3L2
Corporate Structure, Financial Analysis, and Outlook
CTC Major Holders
Canadian Tire was founded in 1922 as an automotive service garage in Toronto by Alfred and John William Billes. It was listed on the Toronto Stock Exchange in 1945 under a dual-class system, consisting of common voting shares and Class A non-voting shares. Common shares represent 4.4% of total shares outstanding, with Class A non-voting shares representing the majority at 95.6%. The holders of the common shares are entitled to select 13 of the 16 directors for CTC’s board, while holders of the Class A non-voting shares elect the remaining 3 directors.
The Billes family continues to hold a controlling interest of 61.4%; CTC co-founder Alfred Billes’ daughter Martha G. Billes holds 1.4 mln voting shares (40.9% of outstanding common shares), while Owen G. Billes holds 0.7 mln voting shares (20.5% of outstanding common shares). The Associate Dealers, as represented by CTC Dealers Holdings Ltd., hold an effective 20.6% interest in the company, with CTC’s Deferred Profit Sharing Plan representing the balance (12.2% interest). Exhibit 37 depicts the major shareholders of the company.
Exhibit 37: Major CTC Shareholders
Source: Canadian Tire Corporation, Raymond James Ltd.
Recent Financial Results
Canadian Tire’s revenue increased a better-than-expected 9.8% to $3,653.8 mln (versus consensus of $3,533.0 mln) in 4Q14, on strong Christmas sales, winter tires, and sports gear. The strong revenue growth primarily reflected same-store sales increases across its portfolio of retail banners. The combination of continued retail banner repositioning and focus on improved merchandizing is facilitating particularly solid performance across CTC’s retail banners.
CTC’s revenue increased a stronger-than-expected 9.8% to $3,653.8 mln, which was primarily driven by same-store sales increases of increases of 2.8% at CTR, 4.9% at FGL Sports, and 1.2% at Mark’s.
Consolidated gross profit dollars increased 12.1% from $1,082.5 mln to $1,213.2 mln, for a gross margin of 33.2%. The 68 bp gross margin increase reflects CTC’s tight focus on managing costs, despite the materially weaker Canadian dollar.
Consolidated EBITDA totaled $437.5 mln, for an EBITDA margin of 12.0%, which was a solid beat relative to consensus of $420.8 mln. The 53 bp EBITDA margin expansion reflects higher gross margins slightly offset by lower SG&A leverage (SG&A margin of 21.1% versus 21.0% in 4Q13).

Canada Research | Page 34 of 48 Canadian Tire Corporation
Raymond James Ltd. | 2100 – 925 West Georgia Street | Vancouver BC Canada V6C 3L2
Outlook
We are initiating 2015E EPS of $8.28, and 2016E EPS of $8.92, versus consensus of $7.97 and $8.78, respectively. We believe that CTC is well positioned to benefit from a recovery in both the macro backdrop and consumer confidence through our forecast window. In addition, we expect what increasingly appears to be lower gas prices for longer (and low current levels of confidence) to represent a tailwind for the high-margin Automotive business (as lower gas prices translate into higher mileage driven, which translates into higher wear and tear on vehicles). Within FGL sports, the cascading of the HERO and flagship store learnings through the broader footprint, and the untapped opportunity in key verticals and demographics will, we believe, generate a material further lift in market share. The above (combined with assumed steady share in the segment category) is, in our opinion, supportive of solid FCF growth, which in turn (in the absence of any suitably compelling potential acquisition opportunities) is supportive of further increases in the dividend (and modestly elevated buyback activity). In addition, with a new (strengthened) dealer agreement and the necessary technology and talent in place, we believe CTC is better positioned than at any point in the last decade, which (on improved execution and fewer aspirational misses) we believe is supportive of further multiple expansion. Our earnings forecasts are based on the following assumptions. 2015E Estimates
Revenue of $12,745.5 mln reflects a 2.3% increase from the prior year primarily reflecting revenue growth of 2.1% at CTR, 7.3% at FGL Sports, and 4.5% at Mark’s, partially offset by lower Petroleum revenues (driven by lower gasoline prices).
Consolidated gross margin of 32.3%, down a very modest 14 bp from the prior year, on our expectations of continued cost discipline more than offset by the material weakening of the Canadian dollar.
EBITDA margin improvement of 11 bp to $1,422.3 mln, reflecting our expectations of very modest 14 bp gross margin decrease, more than offset by improved SG&A leverage (SG&A margin of 21.2% versus 21.6% in 2014).
EPS growth of 4.3% to $8.28, on 2.2% fewer diluted shares outstanding and a 28.0% effective tax rate (versus 26.7% in 2014).
2016E Estimates
Revenue growth of 4.5% to $13,314.6 mln primarily reflects retail revenue increases of 3.4% at CTR, 9.9% at FGL, and 4.8% at Mark’s (and essentially unchanged Petroleum revenues).
We expect modest gross margin expansion of 49 bp to 32.8%, reflecting our expectations of continued distribution, logistics and promotional tailwinds, and a more stable Canadian dollar. While favourable mix impacts are possible through 2016E they are not explicitly baked into our assumptions.
A 16 bp increase in EBITDA margin to 11.3% (consolidated EBITDA of $1,506.5 mln), on our expectations of a 43 bp gross margin expansion partially offset by lower SG&A leverage (SG&A margin of 21.6% versus 21.2% in 2015E).
EPS of $8.92, for a 7.7% increase from the prior year, reflecting 0.6% less diluted shares outstanding and unchanged effective tax rate assumption of 28.0%.
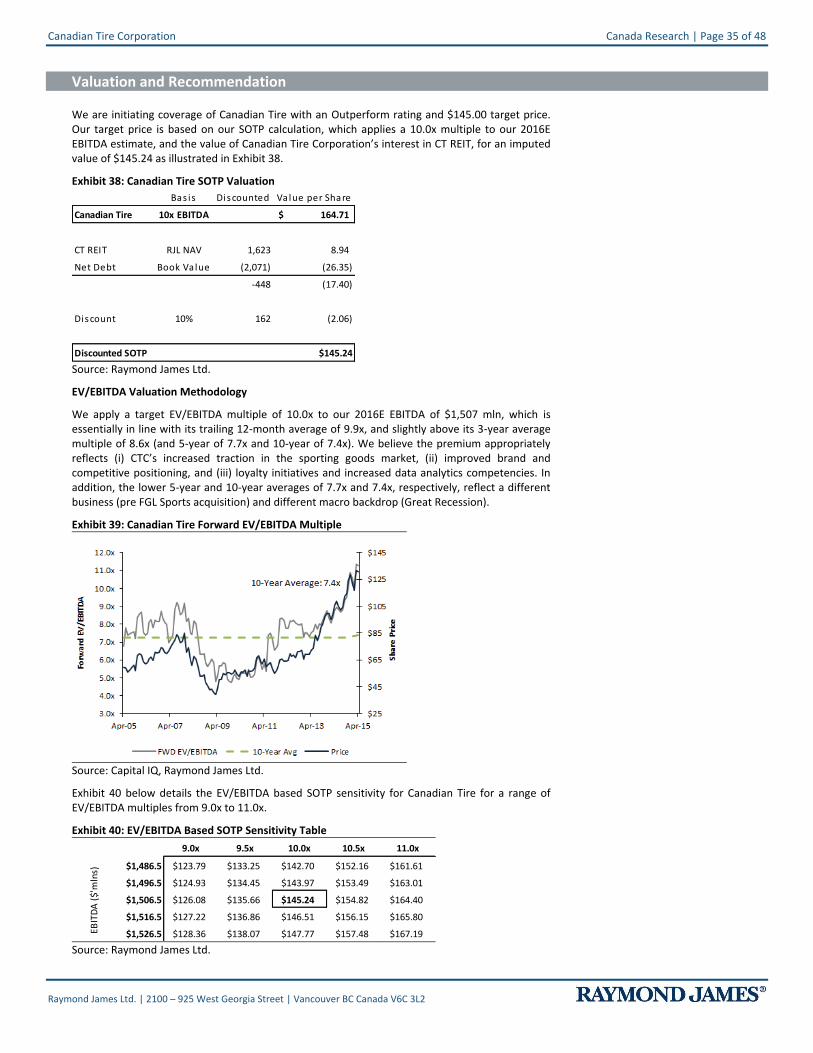
Canadian Tire Corporation Canada Research | Page 35 of 48
Raymond James Ltd. | 2100 – 925 West Georgia Street | Vancouver BC Canada V6C 3L2
Valuation and Recommendation
We are initiating coverage of Canadian Tire with an Outperform rating and $145.00 target price. Our target price is based on our SOTP calculation, which applies a 10.0x multiple to our 2016E EBITDA estimate, and the value of Canadian Tire Corporation’s interest in CT REIT, for an imputed value of $145.24 as illustrated in Exhibit 38.
Exhibit 38: Canadian Tire SOTP Valuation
Bas is Discounted Value per Share
Canadian Tire 10x EBITDA 164.71$
CT REIT RJL NAV 1,623 8.94
Net Debt Book Value (2,071) (26.35)
-448 (17.40)
Discount 10% 162 (2.06)
Discounted SOTP $145.24 Source: Raymond James Ltd.
EV/EBITDA Valuation Methodology
We apply a target EV/EBITDA multiple of 10.0x to our 2016E EBITDA of $1,507 mln, which is essentially in line with its trailing 12-month average of 9.9x, and slightly above its 3-year average multiple of 8.6x (and 5-year of 7.7x and 10-year of 7.4x). We believe the premium appropriately reflects (i) CTC’s increased traction in the sporting goods market, (ii) improved brand and competitive positioning, and (iii) loyalty initiatives and increased data analytics competencies. In addition, the lower 5-year and 10-year averages of 7.7x and 7.4x, respectively, reflect a different business (pre FGL Sports acquisition) and different macro backdrop (Great Recession).
Exhibit 39: Canadian Tire Forward EV/EBITDA Multiple
Source: Capital IQ, Raymond James Ltd.
Exhibit 40 below details the EV/EBITDA based SOTP sensitivity for Canadian Tire for a range of EV/EBITDA multiples from 9.0x to 11.0x.
Exhibit 40: EV/EBITDA Based SOTP Sensitivity Table
145.24$ 9.0x 9.5x 10.0x 10.5x 11.0x
$1,486.5 $123.79 $133.25 $142.70 $152.16 $161.61
$1,496.5 $124.93 $134.45 $143.97 $153.49 $163.01
$1,506.5 $126.08 $135.66 $145.24 $154.82 $164.40
$1,516.5 $127.22 $136.86 $146.51 $156.15 $165.80
$1,526.5 $128.36 $138.07 $147.77 $157.48 $167.19EBIT
DA
($'
mln
s)
Source: Raymond James Ltd.

Canada Research | Page 36 of 48 Canadian Tire Corporation
Raymond James Ltd. | 2100 – 925 West Georgia Street | Vancouver BC Canada V6C 3L2
While we are not inclined to value Canadian Tire on an EPS basis, we believe it is pertinent to include its 10-year forward and average P/E multiples (in terms of peer comparison). As illustrated in Exhibit 41, Canadian Tire’s 10-year P/E multiple is 12.7x versus its 5-year average P/E multiple of 11.9x (and TTM P/E multiple of 15.4x).
Exhibit 41: Canadian Tire Forward P/E Multiple
Source: Capital IQ, Raymond James Ltd.
Exhibit 42: Peer Group Comparison Shrs Market 1000 1001 1002 Enterprise Value /
Price O/S Cap. EBITDA Ratios
Company Name 4/24/2015 (mln) (mln) LFY FY1E FY2E LFY FY1E FY2E LFY FY1E FY2E LFY FY1E FY2E
Canadian Tire Corp. Ltd. $131.54 78.6 $10,341 7.94 8.28 8.92 16.6 15.9 14.8 $1,376 $1,422 $1,507 9.0 8.7 8.2
US Home Improvement Retailers LAST 1000 1001 1002
The Home Depot, Inc. $113.70 1,346.0 $153,040 4.71 5.23 6.00 24.1 21.8 19.0 $12,225 $13,288 $14,432 13.8 12.7 11.7
Lowe's Companies Inc. $73.16 990.0 $72,428 2.71 3.31 3.94 27.0 22.1 18.6 $6,420 $7,076 $7,726 13.0 11.8 10.8
Group Average 25.6 21.9 18.8 13.4 12.2 11.2
Canadian Home Improvement Retailers/Distributors LAST 1000 1001 1002
Richelieu Hardware Ltd. $63.35 19.8 $1,257 2.63 2.95 3.26 24.1 21.5 19.5 $77 $87 $95 16.2 14.3 13.1
Rona Inc. $16.13 118.5 $1,911 0.90 0.90 0.97 17.9 17.9 16.6 $191 $256 $269 10.9 8.1 7.7
Group Average 21.0 19.7 18.0 13.6 11.2 10.4
US General Merchandizers LAST 1000 1001 1002
Costco Wholesale Corporation $148.12 442.4 $65,533 4.65 5.25 5.70 31.9 28.2 26.0 $4,249 $4,747 $5,102 14.9 13.3 12.4
Target Corp. $82.70 640.1 $52,936 3.83 4.55 5.00 21.6 18.2 16.5 $6,728 $7,298 $7,578 9.4 8.7 8.4
Wal-Mart Stores Inc. $79.84 3,243.0 $258,921 4.96 4.93 5.18 16.1 16.2 15.4 $36,320 $36,153 $37,296 8.3 8.3 8.1
The TJX Companies, Inc. $66.29 703.5 $46,638 3.15 3.29 3.71 21.0 20.2 17.9 $4,195 $4,280 $4,646 10.9 10.6 9.8
Group Average 22.6 20.7 19.0 10.9 10.2 9.7
US Auto Parts Aftermarket
Advance Auto Parts Inc. $148.61 73.4 $10,910 6.71 8.52 9.74 22.1 17.4 15.3 $1,243 $1,335 $1,460 10.0 9.3 8.5
AutoZone, Inc. $702.00 33.0 $23,147 31.57 35.86 40.24 22.2 19.6 17.4 $2,089 $2,224 $2,354 13.1 12.3 11.7
O'Reilly Automotive Inc. $229.35 104.8 $24,045 7.34 8.68 9.86 31.2 26.4 23.3 $1,468 $1,672 $1,809 17.0 14.9 13.8
Group Average 25.2 21.1 18.7 13.4 12.2 11.3
US Sporting Goods Retailers
Cabela's Incorporated $54.19 71.8 $3,893 2.81 3.15 3.61 19.3 17.2 15.0 $449 $498 $563 17.0 15.3 13.5
Callaway Golf Co. $9.89 77.7 $768 0.20 0.04 0.26 49.5 247.3 38.6 $52 $35 $59 16.1 23.8 14.3
Dick's Sporting Goods Inc. $56.59 121.2 $6,861 2.84 3.18 3.55 19.9 17.8 15.9 $754 $815 $892 8.8 8.1 7.5
Hibbett Sports, Inc. $48.97 25.6 $1,255 2.87 3.04 3.39 17.1 16.1 14.5 $134 $140 $151 8.7 8.4 7.7
Group Average 26.4 74.6 21.0 12.7 13.9 10.8
Overall Group Average 24.2 31.6 19.1 12.8 12.0 10.7
* Estimates for Canadian Tire are from RJL, all other estimates are consensus from Capital IQ
Earnings
Per Share Price/Earnings Ratios EBITDA ('mln)
Source: Capital IQ, Raymond James Ltd.

Canadian Tire Corporation Canada Research | Page 37 of 48
Raymond James Ltd. | 2100 – 925 West Georgia Street | Vancouver BC Canada V6C 3L2
Appendix A: Financial Statements
Exhibit 43: Canadian Tire Income Statement (C$ mln, unless otherwise stated) Canadian Tire F2012 F2013 1Q14 2Q14 3Q14 4Q14 F2014 1Q15E 2Q15E 3Q15E 4Q15E F2015E F2016E
(Year ended December)
Revenue $11,427 $11,786 $2,573 $3,166 $3,070 $3,654 $12,463 $2,630 $3,208 $3,142 $3,765 $12,746 $13,315
Cost of Sales $7,929 $8,063 $1,738 $2,153 $2,085 $2,441 $8,417 $1,789 $2,187 $2,130 $2,520 $8,626 $8,946
Selling and Administrative Expenses $2,700 $2,829 $706 $744 $729 $874 $3,053 $696 $742 $725 $893 $3,056 $3,246
Total Operating Expenses $10,630 $10,892 $2,444 $2,898 $2,814 $3,314 $11,470 $2,485 $2,929 $2,854 $3,413 $11,681 $12,192
Other Income $6 ($3) ($2) $18 $0 ($6) $11 ($2) $18 $0 ($6) $11 $11
Gross Profit $3,498 $3,722 $835 $1,013 $985 $1,213 $4,046 $841 $1,021 $1,012 $1,245 $4,120 $4,369
Gross Profit Margin (%) 30.6% 31.6% 32.5% 32.0% 32.1% 33.2% 32.5% 32.0% 31.8% 32.2% 33.1% 32.3% 32.8%
Gross Profit Margin (bp) Change 114 97 154 75 64 68 88 (50) (16) 15 (13) (14) 49
Adjusted EBITDA $1,139 $1,236 $212 $375 $352 $438 $1,376 $226 $366 $382 $448 $1,422 $1,507
Adjusted EBITDA Margin (%) 10.0% 10.5% 8.3% 11.8% 11.5% 12.0% 11.0% 8.6% 11.4% 12.2% 11.9% 11.2% 11.3%
Adjusted EBITDA Margin (bp) Change (22) 52 (28) 112 66 53 56 34 (44) 70 (6) 11 16
Same Store Sales (SSS)
CTR 0.6% 1.4% -0.5% 2.8% 3.2% 2.8% 2.1% 4.0% 2.0% 2.4% 2.0% 2.6% 2.8%
FGL Sports 4.8% 8.8% 6.4% 8.2% 8.5% 4.9% 7.0% 5.0% 6.2% 6.0% 6.5% 5.9% 7.3%
Mark's 3.8% 4.4% 2.9% 3.2% 6.8% 1.2% 3.5% 1.8% 2.7% 3.4% 6.3% 3.6% 1.8%
Retail Sales per Sq. Ft.
CTR $385.0 $389.0 $388.0 $388.0 $391.0 $398.0 $398.0 $392.7 $390.7 $396.1 $408.3 $408.3 $417.3
FGL Sports $0.0 $275.0 $282.0 $282.0 $284.0 $291.0 $284.8 $289.1 $290.7 $292.0 $304.1 $304.1 $313.8
Mark's $305.3 $315.3 $324.0 $325.0 $329.0 $335.0 $328.3 $335.7 $334.1 $340.8 $342.7 $342.7 $353.3
Revenue Growth (%) 10.0% 3.1% 3.8% 4.8% 3.9% 9.8% 5.7% 2.2% 1.3% 2.4% 3.1% 2.3% 4.5%
SG&A Margin (%) 20.5% 21.1% 24.1% 20.8% 20.7% 21.1% 21.6% 23.3% 20.6% 20.1% 21.1% 21.2% 21.6%
SG&A Margin Change (bp) 176 60 146 42 (1) 16 45 (87) (27) (58) (8) (41) 43
Depreciation & Amortization $335 $345 $85 $88 $96 $104 $372 $84 $82 $93 $100 $360 $373
Operating Income $803 $890 $128 $287 $256 $334 $1,004 $143 $297 $288 $347 $1,075 $1,134
Total Interest (net) ($126) ($106) ($24) ($40) ($21) ($23) ($109) ($23) ($22) ($24) ($23) ($92) ($87)
EBT $677 $785 $104 $247 $235 $310 $895 $120 $275 $264 $323 $983 $1,047
Income Taxes $178 $220 $28 $68 $56 $87 $239 $34 $77 $74 $91 $275 $293
Minority Interest $0 $3 $5 $9 $6 $15 $35 $16 $16 $16 $16 $64 $64
Adjusted Net Earnings $499 $569 $71 $181 $172 $208 $632 $71 $182 $174 $217 $644 $690
EPS (Basic) $6.13 $7.06 $0.88 $2.27 $2.19 $2.68 $8.00 $0.92 $2.36 $2.26 $2.83 $8.36 $9.01
Adjusted EPS (Diluted) $6.10 $7.02 $0.88 $2.26 $2.17 $2.65 $7.94 $0.91 $2.34 $2.24 $2.80 $8.28 $8.92
Basic Shares Outstanding (mln) 81.4 80.7 79.9 79.5 78.7 77.8 79.0 77.5 77.2 76.9 76.6 77.0 76.6
Diluted Shares Outstanding (mln) 81.8 81.2 80.5 80.1 79.2 78.6 79.6 78.3 78.0 77.7 77.4 77.8 77.4 Source: Canadian Tire Corporation, Raymond James Ltd.

Canada Research | Page 38 of 48 Canadian Tire Corporation
Raymond James Ltd. | 2100 – 925 West Georgia Street | Vancouver BC Canada V6C 3L2
Exhibit 44: Canadian Tire Balance Sheet (C$ mln) Canadian Tire F2012 F2013 F2014 F2015E F2016E
(Year ended December)
Assets:
Current Assets:
Cash & Cash Equivalents $1,016 $643 $662 $565 $946
Short-Term Investments $169 $417 $289 $289 $289
Trade & Other Receivables $751 $759 $880 $907 $956
Loans Receivables $4,266 $4,570 $4,906 $4,906 $4,906
Merchandise Inventories
Income Tax Recoverable $48 $32 $32 $32 $32
Prepaid Expenses & Deposits $39 $68 $105 $105 $105
Assets Held For Sale $6 $9 $13 $13 $13
Total Current Assets $7,796 $7,978 $8,510 $8,493 $8,995
Non-Current Assets:
LT Receivables & Other Assets $681 $686 $684 $684 $684
LT Investments $183 $135 $176 $176 $176
Goodwill & Intangible Assets $1,090 $1,186 $1,252 $1,163 $1,069
Investment Properties $95 $94 $149 $149 $149
Property & Equipment $3,344 $3,516 $3,743 $4,243 $4,628
Deferred Income Taxes $40 $36 $39 $39 $39
Total Assets $13,229 $13,630 $14,553 $14,946 $15,740
Liabilities & Shareholders' Equity
Current Liabilities:
Bank Indebtedness $86 $69 $14 $14 $14
Deposits $1,311 $1,178 $951 $951 $951
Trade & Other Payables $1,631 $1,817 $1,961 $2,025 $2,113
Provisions $186 $196 $206 $206 $206
Short-Term Borrowing $119 $120 $200 $410 $525
Loans Payable $624 $611 $604 $604 $604
Income Taxes Payable $53 $58 $55 $55 $55
Current Portion of Long-Term Debt $662 $272 $588 $588 $588
Total Current Liabilities $4,672 $4,322 $4,579 $4,852 $5,055
Long-Term Provisions $55 $38 $44 $44 $44
Long-Term Debt $2,336 $2,339 $2,132 $1,867 $1,867
Long-Term Deposits $1,112 $1,152 $1,286 $1,286 $1,286
Deferred Income Taxes $78 $100 $94 $94 $94
Other Long-Term Liabilities $212 $228 $788 $788 $788
Liabilities $3,793 $3,858 $4,344 $4,079 $4,079
Total Liabilities $8,464 $8,180 $8,922 $8,932 $9,134
Shareholders' Equity
Capital Stock $688 $587 $696 $535 $535
Contributed Surplus $3 $6 $3 $3 $3
Accumulated Other Comprehensive Income ($2) $47 $82 $82 $82
Retained Earnings $4,075 $4,527 $4,075 $4,620 $5,211
Non-controlling Interest $0 $283 $775 $775 $775
Total Shareholders' Equity $4,764 $5,450 $5,631 $6,015 $6,606
Total Liabilities & Shareholders' Equity $13,229 $13,630 $14,553 $14,946 $15,740 Source: Canadian Tire Corporation, Raymond James Ltd.

Canadian Tire Corporation Canada Research | Page 39 of 48
Raymond James Ltd. | 2100 – 925 West Georgia Street | Vancouver BC Canada V6C 3L2
Exhibit 45: Canadian Tire Statement of Cash Flows (C$ mln) Canadian Tire F2012 F2013 F2014 F2015E F2016E
(Year ended September)
Operating Activities:
Net Income $499 $573 $650 $708 $754
Non-Cash Items:
Gross Impairment Loss on Loans Receivable $324 - - (4.9) -
Depreciation on Property & Equipment & Investment Property $249 $254 $279 $271 $279
Income Tax Expense $178 $220 $239 $275 $293
Net Finance Costs $126 $106 $109 $92 $87
Amortization of Intangible Assets $86 $92 $93 $89 $93
Changes in Fair Value of Derivative Instruments ($1) ($38) ($34) - -
Deferred Income Taxes $16 - - - -
Change in Fair Value of Redeemable Financial Instrument - - $17 - -
Other $6 $15 $25 - -
Change in Operating Working Capital and Other ($429) $270 ($84) ($16) ($34)
Change in Loans Receivable ($46) ($274) ($332) - -
Interest Paid ($155) ($127) ($122) ($110) ($101)
Interest Received $9 $12 $10 17.9 14.7
Income Taxes Paid ($161) ($191) ($257) ($275) ($293)
Cash Flow from Operating Activities $702 $901 $586 $1,047 $1,093
Investing Activities:
Business Acquisitions - ($58) - - -
Acquisitions of Short-Term Investments ($264) ($339) ($432) - -
Proceeds from the Maturity and Disposition of ST Investments $361 $194 $665 - -
Acquisitions of Long-Term Investments ($130) ($55) ($156) - -
Proceeds from the Disposition of ST Investments $7 $1 $8 - -
Additions to PP&E + Investment Property ($222) ($404) ($539) ($770) ($665)
Proceeds from Assets Held for Sale $30 $20 $21 - -
Additions to Intangible Assets ($64) ($106) ($150) - -
Long-Term Receivables & Other Assets $30 ($22) $3 - -
Purchases of Stores - ($12) - - -
Other ($8) ($5) ($11) - -
Cash Flow from Investing Activities ($262) ($786) ($590) ($770) ($665)
Financing Activities:
Net Issuance of Short-Term Borrowing ($234) ($20) $79 $210 $115
Issuance of Loans Payable $235 $236 $236 - -
Repayment of Loans Payable ($240) ($249) ($242) - -
Issuance of Share Capital $12 $4 - - -
Repurchase of Share Capital ($33) ($106) ($291) (160.7) -
Issuance of LT Debt $637 $265 $564 - -
Repayment of LT Debt and Finance Lease Liabilities ($30) ($658) ($474) ($264) -
Dividends Paid ($98) ($112) ($141) ($163) ($162)
Issuance of Trust Units to Non-controlling Interest - $303 - - -
Trust Unit Issue Costs - ($24) - - -
Distributions Paid to Non-controlling Interest - ($4) ($20) $0 $0
Proceeds on sale of ownership in Financial Services - - $500 - -
Transaction costs on sale of ownership in Financial Services - - ($23) - -
Payment of Transaction Costs Related to LT Debt ($3) ($1) ($2) - -
Change in Deposit $41 ($96) ($97) - -
Cash Flow From Financing Activities $288 ($462) $89 ($378) ($47)
Net Change in Cash & Cash Equivalents $729 ($347) $85 ($102) $381
Cash & Cash Equivalents at Beginning of Period $201 $930 $583 $667 $565
Effect of Exchange Rate Fluctuations on Cash Held - ($0.2) ($0.3) - -
Cash & Cash Equivalents at End of Period $1,016 $643 $662 $565 $946 Source: Canadian Tire Corporation, Raymond James Ltd.

Canada Research | Page 40 of 48 Canadian Tire Corporation
Raymond James Ltd. | 2100 – 925 West Georgia Street | Vancouver BC Canada V6C 3L2
Appendix B: Management and Board of Directors
Maureen J. Sabia, Non-executive Chairman of the Board
Ms. Sabia has served on Canadian Tire’s board since March 2007. She has been the Principal of her own consulting practice since 1986. Ms. Sabia has an extensive background with both private and public organizations. Prior to joining Canadian Tire’s board of directors, Ms. Sabia served on the boards of O&Y FPT and Medway Capital. She also served as Director of several companies, including Gulf Canada, Laurentian General Insurance, and Skyjack. Ms. Sabia holds an Honours Bachelor of Arts degree in English and History from McGill University, and Juris Doctor degree from the Faculty of Law, University of Toronto.
Stephen G. Wetmore, Non-executive Deputy Chairman of the Board
Mr. Wetmore served as Canadian Tire’s Chief Executive Officer from January 2009 to December 2014. Prior to joining Canadian Tire, Mr. Wetmore served as the Head of New Bell Aliant Income Fund of BCE Inc. He also served as Chairman at Atlantic Provinces Economic Council, Chairman-Nova Scotia Council at Scouts Canada, Executive Vice President at BCE, Inc., and Managing Director at Scotia Holdings Plc. He is a Chartered Accountant and Member of the Canadian Institute of Chartered Accountants. Mr. Wetmore holds Bachelor Degree in Commerce from Acadia University.
Michael B. Medline, President and Chief Executive Officer
Mr. Medline has served as President since November 2013, and was appointed Chief Executive Officer effective December 2014 in conjunction with the departure of Stephen G. Wetmore. During his 13-year tenure at Canadian Tire, Mr. Medline has led the company through various strategic initiatives and acquisitions, including Mark’s, Forzani Group, Pro Hockey Life, and the May 2014 partnership with Scotiabank. Mr. Medline holds an MBA from the College of William and Mary in Virginia, an LL.B. from the University of Toronto, and a BA from the University of Western Ontario.
Dean McCann, Executive Vice-President and Chief Financial Officer
Mr. McCann was appointed Executive Vice President and Chief Financial Officer in March 2012. Mr. McCann joined Canadian Tire in 1996, and held various senior positions at Canadian Tire Financial Services and Canadian Tire Bank. Under his leadership, CT REIT was formed. Dean is a Chartered Accountant and a graduate of the McMaster Chartered Director program. In addition, he has held senior positions with the Boards of Niagara College and YMCA Niagara.
Allan MacDonald, Chief Operating Officer
Mr. MacDonald has served as Chief Operating Officer since May 2013. In his current role, Mr. MacDonald is responsible for Canadian Tire’s operations including merchandizing, marketing, supply chain, information technology, automotive, and digital and social integration. Previously, Mr. MacDonald led the turnaround of Canadian Tire’s heritage Automotive business, and served as the company’s Chief Marketing Officer. Prior to joining Canadian Tire, Mr. MacDonald held several senior positions at Bell Canada, Aliant Inc., and British Telecom. He holds a Bachelor’s degree in Business Administration from Acadia University and an MBA from Henley Management College in England.
James R. Christie, Executive Vice-President
Mr. Christie has served in his current role since October 2013. Prior to joining Canadian Tire, Mr. Christie was a Partner at Blake, Cassels & Graydon LLP. From 1995 to 2001, Mr. Christie was Managing Partner of Blake’s and served as Chairman of the Firm from 2001 to 2009. Mr. Christie graduated with a Bachelor of Laws Degree from the University of Toronto and was called to the Bar of Ontario in 1978.
Eugene O. Roman, Senior Vice-President and Chief Technology Officer
Mr. Roman has served as Canadian Tire’s Chief Technology Officer since 2012. Previously, he held the positions of Group President, Systems and Technology at Bell Canada (2002-2008) and Chief Information and Technology Officer at Open Text (2008-2012). He holds a Master’s Degree in Administration, Bachelor’s Degree in Economics, is a Certified Management Accountant, and is a graduate of the Institute of Corporate Directors program. Mr. Roman is also an industry professor in Design Engineering at McMaster University.

Canadian Tire Corporation Canada Research | Page 41 of 48
Raymond James Ltd. | 2100 – 925 West Georgia Street | Vancouver BC Canada V6C 3L2
Risks
General Economic Conditions
The company’s business and operating performance may be adversely affected by economic forces beyond its control. Rising consumer debt levels and changes in consumer preferences and buying patterns, as well as changes in unemployment rate and labour costs could negatively impact the company’s performance. External factors that affect global and/or regional economies, interest rates, exchange rates, or major segments of the economy could alter investor confidence and investment prospects; an increase in minimum wage could have an adverse impact on operating costs and earnings.
Competitive Landscape
The Canadian retail landscape is highly competitive and continues to attract new entrants. The industry has been undergoing significant changes over the years, with the most recent entrants including US retail giants Target (first store opened in Ontario in 2013), and Nordstrom (first store opened in Calgary in 2014). An increase in competition may result in price wars, market share loss, and reduced sales and profitability.
Unfavourable Extreme Weather
Canadian Tire’s retail stores offer a large selection of seasonal merchandize. Unseasonable weather can result in lower traffic to Canadian Tire stores and deter consumers from purchasing seasonal products related to weather, such as snow blowers and gardening tools.
Supply Chain Disruption
Disruptions or delays in store inventory replenishment could negatively impact operations and profitability. Factors resulting in disruptions of supply chain could include, but are not limited to, shipping slowdown or disruption due to extreme weather conditions.
Commodity Price and Disruption
The operating performance of Canadian Tire Petroleum may be adversely impacted by the fluctuations in the price of oil. The price of oil is subject to geopolitical, global supply, and demand conditions, in addition to market speculation.
Foreign Currency
Canadian Tire sourced approximately 43% of its purchases in 2013 from global vendors, in particular Asia. As purchases are made in US dollars, unfavourable currency fluctuations relative to the Canadian dollar may adversely impact the company’s profitability. In order to mitigate the impact of fluctuating foreign exchange rates, Canadian Tire has a comprehensive foreign exchange hedge portfolio in place.

Canada Research | Page 42 of 48 Canadian Tire Corporation
Raymond James Ltd. | 2100 – 925 West Georgia Street | Vancouver BC Canada V6C 3L2
Company Citations
Company Name Ticker Exchange Currency Closing Price RJ Rating RJ Entity
Advance Auto Parts, Inc. AAP NYSE US$ 148.61 1 RJ & Associates Amazon.com Inc. AMZN NASDAQ US$ 445.10 2 RJ & Associates Apple Inc. AAPL NASDAQ US$ 130.28 3 RJ & Associates AutoZone, Inc. AZO NYSE US$ 702.00 1 RJ & Associates Best Buy Company, Incorporated BBY NYSE US$ 35.39 3 RJ & Associates Cabela’s Inc. CAB NYSE US$ 54.19 2 RJ & Associates Callaway Golf Co. ELY NYSE US$ 9.89 3 RJ & Associates Cineplex Inc. CGX TSX C$ 49.11 2 RJ LTD. Costco Wholesale Corporation COST NASDAQ US$ 148.12 3 RJ & Associates CT Real Estate Investment Trust CRT.UN TSX C$ 12.74 3 RJ & Associates Dick`s Sporting Goods Inc. DKS NYSE US$ 56.59 3 RJ & Associates eBay Inc. EBAY NASDAQ US$ 59.20 2 RJ & Associates Hibbett Sports, Inc. HIBB NASDAQ US$ 48.97 3 RJ & Associates Loblaw Companies Ltd. L TSX C$ 62.99 2 RJ LTD. Lowe`s Companies, Inc. LOW NYSE US$ 73.16 3 RJ & Associates MasterCard, Inc. MA NYSE US$ 90.72 3 RJ & Associates Metro MEOG.DE XETRA € 33.30 2 RJ Europe Metro, Inc. MRU TSX C$ 35.48 2 RJ LTD. NetSuite, Inc. N NYSE US$ 91.45 3 RJ & Associates O`Reilly Automotive, Inc. ORLY NASDAQ US$ 229.35 1 RJ & Associates Open Text OTEX NASDAQ US$ 55.83 2 RJ LTD. Retail Opportunity Investments Corp. ROIC NASDAQ US$ 17.71 3 RJ & Associates The Home Depot Inc. HD NYSE US$ 113.70 3 RJ & Associates Visa, Inc. V NYSE US$ 67.48 3 RJ & Associates Wal-Mart Stores Inc. WMT NYSE US$ 79.84 2 RJ & Associates Whirlpool Corp. WHR NYSE US$ 196.49 3 RJ & Associates
Notes: Prices are as of the most recent close on the indicated exchange and may not be in US$. See Disclosure section for rating definitions. Stocks that do not trade on a U.S. national exchange may not be registered for sale in all U.S. states. NC=not covered.

Canadian Tire Corporation Canada Research | Page 43 of 48
Raymond James Ltd. | 2100 – 925 West Georgia Street | Vancouver BC Canada V6C 3L2
IMPORTANT INVESTOR DISCLOSURES Raymond James & Associates (RJA) is a FINRA member firm and is responsible for the preparation and distribution of research created in the United States. Raymond James & Associates is located at The Raymond James Financial Center, 880 Carillon Parkway, St. Petersburg, FL 33716, (727) 567-1000. Non-U.S. affiliates, which are not FINRA member firms, include the following entities which are responsible for the creation and distribution of research in their respective areas; In Canada, Raymond James Ltd., Suite 2100, 925 West Georgia Street, Vancouver, BC V6C 3L2, (604) 659-8200; In Latin America, Raymond James Latin America, Ruta 8, km 17, 500, 91600 Montevideo, Uruguay, 00598 2 518 2033; In Europe, Raymond James Euro Equities, SAS, 40, rue La Boetie, 75008, Paris, France, +33 1 45 61 64 90.
This document is not directed to, or intended for distribution to or use by, any person or entity that is a citizen or resident of or located in any locality, state, country, or other jurisdiction where such distribution, publication, availability or use would be contrary to law or regulation. The securities discussed in this document may not be eligible for sale in some jurisdictions. This research is not an offer to sell or the solicitation of an offer to buy any security in any jurisdiction where such an offer or solicitation would be illegal. It does not constitute a personal recommendation nor does it take into account the particular investment objectives, financial situations, or needs of individual clients. Information in this report should not be construed as advice designed to meet the individual objectives of any particular investor. Investors should consider this report as only a single factor in making their investment decision. Consultation with your investment advisor is recommended. Past performance is not a guide to future performance, future returns are not guaranteed, and a loss of original capital may occur.
The information provided is as of the date above and subject to change, and it should not be deemed a recommendation to buy or sell any security. Certain information has been obtained from third-party sources we consider reliable, but we do not guarantee that such information is accurate or complete. Persons within the Raymond James family of companies may have information that is not available to the contributors of the information contained in this publication. Raymond James, including affiliates and employees, may execute transactions in the securities listed in this publication that may not be consistent with the ratings appearing in this publication.
With respect to materials prepared by Raymond James Ltd. (“RJL”), all expressions of opinion reflect the judgment of the Research Department of RJL, or its affiliates, at this date and are subject to change. RJL may perform investment banking or other services for, or solicit investment banking business from, any company mentioned in this document.
All Raymond James Ltd. research reports are distributed electronically and are available to clients at the same time via the firm’s website (http://www.raymondjames.ca). Immediately upon being posted to the firm’s website, the research reports are then distributed electronically to clients via email upon request and to clients with access to Bloomberg (home page: RJLC), Capital IQ and Thomson Reuters. Selected research reports are also printed and mailed at the same time to clients upon request. Requests for Raymond James Ltd. research may be made by contacting the Raymond James Product Group during market hours at (604) 659‐8000.
In the event that this is a compendium report (i.e., covers 6 or more subject companies), Raymond James Ltd. may choose to provide specific disclosures for the subject companies by reference. To access these disclosures, clients should refer to: http://www.raymondjames.ca (click on Equity Capital Markets / Equity Research / Research Disclosures) or call toll‐free at 1‐800‐667‐2899.
ANALYST INFORMATION
Analyst Compensation: Equity research analysts and associates at Raymond James are compensated on a salary and bonus system. Several factors enter into the compensation determination for an analyst, including i) research quality and overall productivity, including success in rating stocks on an absolute basis and relative to the local exchange composite Index and/or a sector index, ii) recognition from institutional investors, iii) support effectiveness to the institutional and retail sales forces and traders, iv) commissions generated in stocks under coverage that are attributable to the analyst’s efforts, v) net revenues of the overall Equity Capital Markets Group, and vi) compensation levels for analysts at competing investment dealers.
Analyst Stock Holdings: Effective September 2002, Raymond James equity research analysts and associates or members of their households are forbidden from investing in securities of companies covered by them. Analysts and associates are permitted to hold long positions in the securities of companies they cover which were in place prior to September 2002 but are only permitted to sell those positions five days after the rating has been lowered to Underperform.
The views expressed in this report accurately reflect the personal views of the analyst(s) covering the subject securities. No part of said person's compensation was, is, or will be directly or indirectly related to the specific recommendations or views contained in this research report. In addition, said analyst has not received compensation from any subject company in the last 12 months.
RATINGS AND DEFINITIONS
Raymond James Ltd. (Canada) definitions: Strong Buy (SB1) The stock is expected to appreciate and produce a total return of at least 15% and outperform the S&P/TSX Composite Index over the next six months. Outperform (MO2) The stock is expected to appreciate and outperform the S&P/TSX Composite Index over the next twelve months. Market Perform (MP3) The stock is expected to perform generally in line with the S&P/TSX Composite Index over the next twelve months and is potentially a source of funds for more highly

Canada Research | Page 44 of 48 Canadian Tire Corporation
Raymond James Ltd. | 2100 – 925 West Georgia Street | Vancouver BC Canada V6C 3L2
rated securities. Underperform (MU4) The stock is expected to underperform the S&P/TSX Composite Index or its sector over the next six to twelve months and should be sold.
Raymond James & Associates (U.S.) definitions: Strong Buy (SB1) Expected to appreciate, produce a total return of at least 15%, and outperform the S&P 500 over the next six to 12 months. For higher yielding and more conservative equities, such as REITs and certain MLPs, a total return of at least 15% is expected to be realized over the next 12 months. Outperform (MO2) Expected to appreciate and outperform the S&P 500 over the next 12-18 months. For higher yielding and more conservative equities, such as REITs and certain MLPs, an Outperform rating is used for securities where we are comfortable with the relative safety of the dividend and expect a total return modestly exceeding the dividend yield over the next 12-18 months. Market Perform (MP3) Expected to perform generally in line with the S&P 500 over the next 12 months. Underperform (MU4) Expected to underperform the S&P 500 or its sector over the next six to 12 months and should be sold. Suspended (S) The rating and price target have been suspended temporarily. This action may be due to market events that made coverage impracticable, or to comply with applicable regulations or firm policies in certain circumstances, including when Raymond James may be providing investment banking services to the company. The previous rating and price target are no longer in effect for this security and should not be relied upon.
Raymond James Latin American rating definitions: Strong Buy (SB1) Expected to appreciate and produce a total return of at least 25.0% over the next twelve months. Outperform (MO2) Expected to appreciate and produce a total return of between 15.0% and 25.0% over the next twelve months. Market Perform (MP3) Expected to perform in line with the underlying country index. Underperform (MU4) Expected to underperform the underlying country index. Suspended (S) The rating and price target have been suspended temporarily. This action may be due to market events that made coverage impracticable, or to comply with applicable regulations or firm policies in certain circumstances, including when Raymond James may be providing investment banking services to the company. The previous rating and price target are no longer in effect for this security and should not be relied upon.
Raymond James Euro Equities, SAS rating definitions: Strong Buy (1) Expected to appreciate, produce a total return of at least 15%, and outperform the Stoxx 600 over the next 6 to 12 months. Outperform (2) Expected to appreciate and outperform the Stoxx 600 over the next 12 months. Market Perform (3) Expected to perform generally in line with the Stoxx 600 over the next 12 months. Underperform (4) Expected to underperform the Stoxx 600 or its sector over the next 6 to 12 months. Suspended (S) The rating and target price have been suspended temporarily. This action may be due to market events that made coverage impracticable, or to comply with applicable regulations or firm policies in certain circumstances, including when Raymond James may be providing investment banking services to the company. The previous rating and target price are no longer in effect for this security and should not be relied upon.
In transacting in any security, investors should be aware that other securities in the Raymond James research coverage universe might carry a higher or lower rating. Investors should feel free to contact their Financial Advisor to discuss the merits of other available investments.
Suitability Categories (SR): Total Return (TR) Lower risk equities possessing dividend yields above that of the S&P 500 and greater stability of principal. Growth (G) Low to average risk equities with sound financials, more consistent earnings growth, at least a small dividend, and the potential for long-term price appreciation. Aggressive Growth (AG) Medium or higher risk equities of companies in fast growing and competitive industries, with less predictable earnings and acceptable, but possibly more leveraged balance sheets. High Risk (HR) Companies with less predictable earnings (or losses), rapidly changing market dynamics, financial and competitive issues, higher price volatility (beta), and risk of principal. Venture Risk (VR) Companies with a short or unprofitable operating history, limited or less predictable revenues, very high risk associated with success, and a substantial risk of principal.
RATING DISTRIBUTIONS
Coverage Universe Rating Distribution Investment Banking Distribution
RJL RJA RJ LatAm RJEE RJL RJA RJ LatAm RJEE
Strong Buy and Outperform (Buy) 65% 54% 50% 47% 46% 24% 0% 0%
Market Perform (Hold) 33% 40% 50% 28% 16% 9% 0% 0%
Underperform (Sell) 2% 6% 0% 25% 0% 0% 0% 0%
RAYMOND JAMES RELATIONSHIP DISCLOSURES
Raymond James Ltd. or its affiliates expects to receive or intends to seek compensation for investment banking services from all companies under research coverage within the next three months.
Company Name Disclosure
Canadian Tire Corporation Raymond James Ltd - the analyst and/or associate has viewed the material operations of Canadian Tire Corporation.

Canadian Tire Corporation Canada Research | Page 45 of 48
Raymond James Ltd. | 2100 – 925 West Georgia Street | Vancouver BC Canada V6C 3L2
STOCK CHARTS, TARGET PRICES, AND VALUATION METHODOLOGIES
Valuation Methodology: The Raymond James methodology for assigning ratings and target prices includes a number of qualitative and quantitative factors including an assessment of industry size, structure, business trends and overall attractiveness; management effectiveness; competition; visibility; financial condition, and expected total return, among other factors. These factors are subject to change depending on overall economic conditions or industry- or company-specific occurrences.
Target Prices: The information below indicates our target price and rating changes for the stock over the past three years.
Valuation Methodology: We value Canadian Tire on a sum-of-parts valuation based on historical and peer EV/EBITDA multiples, and the imputed value of CT REIT.
RISK FACTORS
General Risk Factors: Following are some general risk factors that pertain to the projected target prices included on Raymond James research: (1) Industry fundamentals with respect to customer demand or product / service pricing could change and adversely impact expected revenues and earnings; (2) Issues relating to major competitors or market shares or new product expectations could change investor attitudes toward the sector or this stock; (3) Unforeseen developments with respect to the management, financial condition or accounting policies or practices could alter the prospective valuation.
Consumer & Retail - Risks The projected 6-12 month target prices in our Consumer & Retail coverage universe are exposed to a diverse set of risks due to the broad range of included industries and verticals. The risks include, but are not limited to, commodity (input) cost volatility (cotton, coffee, corn), increased competitive intensity, supply chain disruptions, management changes, regulatory changes and environmental, interest rate, hedging and political risks. In addition, changes in key macro-economic economic indicators, including GDP, CPI, PPI, personal consumption expenditure, consumer confidence, consumer debt levels and changes in labour market dynamics, can materially affect the earnings power, applicable valuation metrics, and target prices of companies in our coverage universe.
Risks -- Canadian Tire Corporation General Economic Conditions The company’s business and operating performance may be adversely affected by economic forces beyond its control. Rising consumer debt levels and changes in consumer preferences and buying patterns, as well as changes in unemployment rate and labour costs could negatively impact the company’s performance. External factors that affect global and/or regional economies, interest rates, exchange rates, or major segments of the economy could alter investor confidence and investment prospects; an increase in minimum wage could have an adverse impact on operating costs and earnings. Competitive Landscape The Canadian retail landscape is highly competitive and continues to attract new entrants. The industry has been undergoing significant changes over the years, with the most recent entrants including US retail giants Target (first store opened in Ontario in 2013), and

Canada Research | Page 46 of 48 Canadian Tire Corporation
Raymond James Ltd. | 2100 – 925 West Georgia Street | Vancouver BC Canada V6C 3L2
Nordstrom (first store opened in Calgary in 2014). An increase in competition may result in price wars, market share loss, and reduced sales and profitability. Unfavourable Extreme Weather Canadian Tire’s retail stores offer a large selection of seasonal merchandize. Unseasonable weather can result in lower traffic to Canadian Tire stores and deter consumers from purchasing seasonal products related to weather, such as snow blowers and gardening tools. Supply Chain Disruption Disruptions or delays in store inventory replenishment could negatively impact operations and profitability. Factors resulting in disruptions of supply chain could include, but are not limited to, shipping slowdown or disruption due to extreme weather conditions. Commodity Price and Disruption The operating performance of Canadian Tire Petroleum may be adversely impacted by the fluctuations in the price of oil. The price of oil is subject to geopolitical, global supply, and demand conditions, in addition to market speculation. Foreign Currency Canadian Tire sourced approximately 43% of its purchases in 2013 from global vendors, in particular Asia. As purchases are made in US dollars, unfavourable currency fluctuations relative to the Canadian dollar may adversely impact the company’s profitability. In order to mitigate the impact of fluctuating foreign exchange rates, Canadian Tire has a comprehensive foreign exchange hedge portfolio in place.
Additional Risk and Disclosure information, as well as more information on the Raymond James rating system and suitability categories, is available for Raymond James at rjcapitalmarkets.com/Disclosures/index and for Raymond James Limited at www.raymondjames.ca/researchdisclosures.
INTERNATIONAL DISCLOSURES
FOR CLIENTS IN THE UNITED STATES:
Any foreign securities discussed in this report are generally not eligible for sale in the U.S. unless they are listed on a U.S. exchange. This report is being provided to you for informational purposes only and does not represent a solicitation for the purchase or sale of a security in any state where such a solicitation would be illegal. Investing in securities of issuers organized outside of the U.S., including ADRs, may entail certain risks. The securities of non-U.S. issuers may not be registered with, nor be subject to the reporting requirements of, the U.S. Securities and Exchange Commission. There may be limited information available on such securities. Investors who have received this report may be prohibited in certain states or other jurisdictions from purchasing the securities mentioned in this report. Please ask your Financial Advisor for additional details and to determine if a particular security is eligible for purchase in your state.
Raymond James Ltd. is not a U.S. broker‐dealer and therefore is not governed by U.S. laws, rules or regulations applicable to U.S. broker‐dealers. Consequently, the persons responsible for the content of this publication are not licensed in the U.S. as research analysts in accordance with applicable rules promulgated by the U.S. Self Regulatory Organizations.
Any U.S. Institutional Investor wishing to effect trades in any security should contact Raymond James (USA) Ltd., a U.S. broker‐dealer affiliate of Raymond James Ltd.
FOR CLIENTS IN THE UNITED KINGDOM:
For clients of Raymond James & Associates (London Branch) and Raymond James Financial International Limited (RJFI): This document and any investment to which this document relates is intended for the sole use of the persons to whom it is addressed, being persons who are Eligible Counterparties or Professional Clients as described in the FCA rules or persons described in Articles 19(5) (Investment professionals) or 49(2) (High net worth companies, unincorporated associations etc) of the Financial Services and Markets Act 2000 (Financial Promotion) Order 2005 (as amended) or any other person to whom this promotion may lawfully be directed. It is not intended to be distributed or passed on, directly or indirectly, to any other class of persons and may not be relied upon by such persons and is therefore not intended for private individuals or those who would be classified as Retail Clients.
For clients of Raymond James Investment Services, Ltd.: This report is for the use of professional investment advisers and managers and is not intended for use by clients.
For purposes of the Financial Conduct Authority requirements, this research report is classified as independent with respect to conflict of interest management. RJA, RJFI, and Raymond James Investment Services, Ltd. are authorised and regulated by the Financial Conduct Authority in the United Kingdom.
FOR CLIENTS IN FRANCE:
This document and any investment to which this document relates is intended for the sole use of the persons to whom it is addressed, being persons who are Eligible Counterparties or Professional Clients as described in “Code Monétaire et Financier” and Règlement Général de l’Autorité des Marchés Financiers. It is not intended to be distributed or passed on, directly or indirectly, to any other class of persons and may not be relied upon by such persons and is therefore not intended for private individuals or those who would be classified as Retail Clients.

Canadian Tire Corporation Canada Research | Page 47 of 48
Raymond James Ltd. | 2100 – 925 West Georgia Street | Vancouver BC Canada V6C 3L2
For institutional clients in the European Economic Area (EEA) outside of the United Kingdom: This document (and any attachments or exhibits hereto) is intended only for EEA institutional clients or others to whom it may lawfully be submitted.
Raymond James International and Raymond James Euro Equities are authorized by the Autorité de contrôle prudentiel et de résolution in France and regulated by the Autorité de contrôle prudentiel et de résolution and the Autorité des Marchés Financiers.
Proprietary Rights Notice: By accepting a copy of this report, you acknowledge and agree as follows:
This report is provided to clients of Raymond James only for your personal, noncommercial use. Except as expressly authorized by Raymond James, you may not copy, reproduce, transmit, sell, display, distribute, publish, broadcast, circulate, modify, disseminate or commercially exploit the information contained in this report, in printed, electronic or any other form, in any manner, without the prior express written consent of Raymond James. You also agree not to use the information provided in this report for any unlawful purpose.
This report and its contents are the property of Raymond James and are protected by applicable copyright, trade secret or other intellectual property laws (of the United States and other countries). United States law, 17 U.S.C. Sec.501 et seq, provides for civil and criminal penalties for copyright infringement.
Additional information is available upon request. This document may not be reprinted without permission.
RJL is a member of the Canadian Investor Protection Fund. ©2015 Raymond James Ltd.

Canada Research | Page 48 of 48 Canadian Tire Corporation
Raymond James Ltd. | 2100 – 925 West Georgia Street | Vancouver BC Canada V6C 3L2
RAYMOND JAMES LTD. CANADIAN INSTITUTIONAL EQUITY TEAM WWW.RAYMONDJAMES.CA EQUITY RESEARCH HEAD OF EQUITY RESEARCH
DARYL SWETLISHOFF, CFA 604.659.8246
CONSUMER
CONSUMER & RETAIL KENRIC TYGHE, MBA 416.777.7188 KRISZTINA KATAI (ASSOCIATE) 416.777.7060
ENERGY
OIL & GAS ENERGY SERVICES, HEAD OF ENERGY RESEARCH ANDREW BRADFORD, CFA 403.509.0503 TIM MONACHELLO (ASSOCIATE) 403.509.0562
OIL & GAS PRODUCERS KURT MOLNAR 403.221.0414 BRADEN PURKIS (SR ASSOCIATE) 403.509.0518 GORDON STEPPAN, CFA (ASSOCIATE) 403.221.0411
SR. OIL & GAS PRODUCERS | OIL SANDS CHRIS COX, CFA 403.509.0523 MICHAEL BARTH (ASSOCIATE) 403.509.0511
INDUSTRIAL & TRANSPORTATION
INDUSTRIAL | TRANSPORTATION, HEAD OF INDUSTRIAL RESEARCH BEN CHERNIAVSKY 604.659.8244 THEONI PILARINOS, CFA 604.659.8234 EDWARD GUDEWILL (ASSOCIATE) 604.659.8280
INFRASTRUCTURE & CONSTRUCTION FREDERIC BASTIEN, CFA 604.659.8232 SAMIR GHAFIR (ASSOCIATE) 604.659.8470
TRANSPORTATION | AGRIBUSINESS & FOOD PRODUCTS STEVE HANSEN, CMA, CFA 604.659.8208 DANIEL CHEW (ASSOCIATE) 604.659.8238
MINING
BASE & PRECIOUS METALS ALEX TERENTIEW, MBA, P.GEO 416.777.4912
PRECIOUS METALS PHIL RUSSO 416.777.7084 LUC TROIANI (ASSOCIATE) 416.777.7098
PRECIOUS METALS CHRIS THOMPSON, M.SC. (ENG), P.GEO 604.659.8439 BRIAN MARTIN, CFA (ASSOCIATE) 604.654.1236
URANIUM | JR EXPLORATION & DEVELOPMENT DAVID SADOWSKI 604.659.8255 MILTON-ANDRES BERNAL (ASSOCIATE) 604.659.8028
FINANCIAL SERVICES
DIVERSIFIED FINANCIALS MICHAEL OVERVELDE, CFA, CPA, CA 416.777.4943 BRENNA PHELAN, CFA, CPA, CA (ASSOCIATE) 416.777.7042
FOREST PRODUCTS
FOREST PRODUCTS DARYL SWETLISHOFF, CFA 604.659.8246 DAVID QUEZADA, CFA (ASSOCIATE ANALYST) 604.659.8257
REAL ESTATE
REAL ESTATE & REITS KEN AVALOS, MBA 727.567.1756 JOHANN RODRIGUES (ASSOCIATE ANALYST) 416.777.7189
TECHNOLOGY & COMMUNICATIONS
TECHNOLOGY, ALTERNATIVE ENERGY & CLEAN TECH STEVEN LI, CFA 416.777.4918 JONATHAN LO (ASSOCIATE) 416.777.6414
EQUITY RESEARCH PUBLISHING SENIOR SUPERVISORY ANALYST
HEATHER HERRON 403.509.0509 HEAD OF PUBLISHING | SUPERVISORY ANALYST
CYNTHIA LUI 604.659.8210
TYLER BOS (SUPERVISORY ANALYST | EDITOR) 416.777.4948 INDER GILL (RESEARCH EDITOR) 604.659.8202 KATE MAJOR (RESEARCH PRINCIPAL | EDITOR) 416.777.7173 CHRISTINE MARTE (RESEARCH EDITOR) 604.659.8200 ASHLEY RAMSAY (SUPERVISORY ANALYST |EDITOR) 604.659.8226
INSTITUTIONAL EQUITY SALES HEAD OF SALES
MIKE WESTCOTT 416.777.4935 GREG JACKSON (ECM, BUSINESS MANAGER) 416.777.7172 MICHELLE MARGUET ( ECM, INSTITUTIONAL MARKETING) 416.777.4951
TORONTO (CAN 1.888.601.6105 | USA 1.800.290.4847)
LAURA ARRELL (U.S. EQUITIES) 416.777.4920 SEAN BOYLE 416.777.4927 JEFF CARRUTHERS, CFA 416.777.4929 RICHARD EAKINS 416.777.4926 JONATHAN GREER 416.777.4930 DAVE MACLENNAN 416.777.4934 ROBERT MILLS, CFA 416.777.4945 BRADY PIMLOTT (ASSOCIATE) 416.777.4993 NICOLE SVEC-GRIFFIS, CFA (U.S. EQUITIES) 416.777.4942 NEIL WEBER 416.777.4931 ORNELLA BURNS (ASSISTANT) 416.777.4928 SATBIR CHATRATH (ASSISTANT) 416.777.4915
VANCOUVER (1.800.667.2899)
SCOT ATKINSON, CFA 604.659.8225 NICK POCRNIC 604.659.8230 TERRI MCEWAN (ASSISTANT) 604.659.8228
MONTREAL (514.350.4450 | 1.866.350.4455)
JOHN HART 514.350.4462 DAVID MAISLIN, CFA 514.350.4460 TANYA HATCHER (ASSISTANT) 514.350.4458
LONDON
ADAM WOOD 0.207.426.5612
INSTITUTIONAL EQUITY TRADING
CO-HEAD OF TRADING BOB MCDONALD, CFA 604.659.8222 ANDREW FOOTE, CFA 416.777.4924
TORONTO (CANADA 1.888.601.6105 | USA 1.800.290.4847) PAM BANKS 416.777.4923 OLIVER HERBST 416.777.4947 ANDY HERRMANN 416.777.4937 ERIC MUNRO, CFA 416.777.4983 JAMES SHIELDS 416.777.4941 BOB STANDING 416.777.4921 PETER MASON (ASSISTANT) 416.777.7195
VANCOUVER (1.800.667.2899) NAV CHEEMA 604.659.8224 FRASER JEFFERSON 604.659.8218 DEREK ORAM 604.659.8223
MONTREAL (514.350.4450 | 1.866.350.4455) JOE CLEMENT 514.350.4470 PATRICK SANCHE 514.350.4465
INSTITUTIONAL EQUITY OFFICES
Calgary Suite 4250 525 8th Avenue SW Calgary, AB T2P 1G1 403.509.0500
Montreal Suite 3000 1800 McGill College Montreal, PQ H3A 3J6 514.350.4450 Toll Free: 1.866.350.4455
Vancouver Suite 2100 925 West Georgia Street Vancouver, BC V6C 3L2 604.659.8000 Toll Free: 1.800.667.2899
Toronto Suite 5400, Scotia Plaza 40 King Street West Toronto, ON M5H 3Y2 416.777.4900 Toll Free Canada: .888.601.6105 Toll Free USA: 1.800.290.4847
International Headquarters The Raymond James Financial Center 880 Carillon Parkway St.Petersburg, FL USA 33716 727.567.1000