canadaÕs second national report on climate changeunfccc.int/resource/docs/natc/cannce2.pdf ·...
TRANSCRIPT
Actions to MeetCommitments
Under theUnited Nations
FrameworkConvention on
Climate Change
Canada’s SecondNational Report onClimate Change
1997Updated,
November, 1997

CANADA�S SECOND NATIONAL REPORT ON CLIMATE CHANGE
I
Canada�s Second National Reporton Climate Change
Actions to Meet Commitments Under the United NationsFramework Convention on Climate Change
May 1997Updated November 1997
CANADA�S SECOND NATIONAL REPORT ON CLIMATE CHANGE
II
Canadian Cataloguing in Publication Data
Canada�s Second National Report on Climate Change
�Actions to meet commitments under the United NationsFramework Convention on Climate Change�Issued by Environment Canada.ISBN 0-662-25665-4Cat. no. En21-125/1997E
Environment Canada�s GreenLane: http://www.ec.gc.ca
To order: 1-800-668-6767
1. Climatic changes � Government policy � Canada.2. Greenhouse gases � Government policy � Canada.3. Greenhouse gases � Canada.4. Greenhouse effect, Atmospheric � Canada.I. Canada. Environment Canada.
HC120.C5C32 1997 551.5'25'0971 C97-980141-9
Également disponible en français sous le titre : Deuxième rapport national du Canada surles changements climatiques

CANADA�S SECOND NATIONAL REPORT ON CLIMATE CHANGE
III
Table of Contents
List of Acronyms, Abbreviations, and Units ...................................................................... IX
Executive Summary ................................................................................................................. XI
CHAPTER 1: Introduction ..................................................................................................... 1Climate Change ........................................................................................................... 1Canada�s Commitments Under the Framework Convention on Climate
Change (FCCC) ........................................................................................................ 2National Communications Under the FCCC .......................................................... 3
Canada�s First National Report on Climate Change � 1994 ................... 3Canada�s National Action Program on Climate Change (NAPCC) ....... 3Canada�s Second National Report on Climate Change � 1997 .............. 3
References ..................................................................................................................... 4
CHAPTER 2: National Circumstances ................................................................................. 5Physical Characteristics .............................................................................................. 5Socioeconomic Context ............................................................................................... 6Greenhouse Gas Emissions ........................................................................................ 7
Political Context .............................................................................................. 7Energy Sector�s Role in the Economy.......................................................... 8
Performance Indicators ............................................................................................... 9Key Determinants of Greenhouse Gas Emissions ..................................... 9Population and GDP Indicators ................................................................... 9Energy Export Indicators .............................................................................. 10Secondary Energy Use and Emission Indicators ....................................... 10
Evolution of Secondary Energy Use andIts Major Determinants ................................................................. 12
Trend in the Carbon Dioxide Intensityof Secondary Energy Use ............................................................. 13
Summary and Conclusions .............................................................. 14Agriculture ...................................................................................................... 15Summary .......................................................................................................... 15
References ..................................................................................................................... 15
CHAPTER 3: Canada�s National Greenhouse Gas Emission Inventory ...................... 17Greenhouse Gas Emission Estimates, 1990�1995.................................................... 17
Changes to Canada�s 1992 Greenhouse Gas Inventory ............................ 17Recent Trends in Emissions........................................................................................ 20Greenhouse Gases and Global Warming Potentials (GWPs) ................................ 20Structure of the Inventory .......................................................................................... 21
Energy Sources ................................................................................................ 23Bunkers ............................................................................................................ 23Non-Energy Sources....................................................................................... 24
Industrial Processes .......................................................................... 25Forestry and Land-Use Change ..................................................... 27
CANADA�S SECOND NATIONAL REPORT ON CLIMATE CHANGE
IV
Agriculture ......................................................................................... 27Waste ................................................................................................... 28Solvents and Other Products .......................................................... 29
Uncertainties ................................................................................................... 29References ..................................................................................................................... 30
CHAPTER 4: Policies and Measures .................................................................................... 33The National Action Program on Climate Change (NAPCC) .............................. 33Measuring the Impacts of NAPCC Initiatives ........................................................ 35
Emissions from Direct End Use of Energy ................................................. 36Emissions from Electricity Generation ........................................................ 37Emissions from Fossil Fuel Production ....................................................... 38Non-Energy Emissions .................................................................................. 39Results for Total Greenhouse Gas Emissions ............................................. 39
References ..................................................................................................................... 39
CHAPTER 5: The Emission Projection to 2020 .................................................................. 41Introduction .................................................................................................................. 41Modelling Structure .................................................................................................... 42Major Assumptions ..................................................................................................... 43
Energy Prices ................................................................................................... 43Macroeconomic and Demographic Assumptions ..................................... 44The Policy Setting ........................................................................................... 45
Results for Total Greenhouse Gas Emissions .......................................................... 46Sensitivity Analysis ..................................................................................................... 50Summary and Conclusions ........................................................................................ 51References ..................................................................................................................... 52
CHAPTER 6: Possible Impacts of Climate Change on Canada ...................................... 53Climate Model Predictions ......................................................................................... 53Integrated Studies of Possible Impacts of Climate Change .................................. 54Implications for Canadian Ecosystems .................................................................... 55
Hydrology and Water Supply....................................................................... 55Human Health ................................................................................................ 56Ecology ............................................................................................................. 56Infrastructure/Activities/Settlements ........................................................ 57Coastal Zones/Margins ................................................................................. 58Agriculture ...................................................................................................... 58Forestry ............................................................................................................ 58
CHAPTER 7: Adaptation ........................................................................................................ 59Introduction .................................................................................................................. 59The Nature of Adaptation .......................................................................................... 59Canada�s Response ...................................................................................................... 60
CANADA�S SECOND NATIONAL REPORT ON CLIMATE CHANGE
V
CHAPTER 8: Financial Assistance and Technology Transfer .................................... 65Canada�s FCCC Commitments ................................................................................ 65Activities Implemented Jointly (AIJ): the Canadian Joint Implementation
Initiative (CJII) ......................................................................................................... 66Technology Transfer and Capacity-Building Initiatives ...................................... 67
Climate Technology Initiative (CTI) ........................................................... 68Canadian Consultant Trust Fund for the Global Environment
(CCTF-GE) ................................................................................................... 68Canadian Environmental Solutions (CES) ................................................ 68International Model Forest Program .......................................................... 68Energy Efficiency and Renewable Energy Joint Ventures ...................... 69Changes to Canadian Export Financing ................................................... 69Clean Coal Technologies .............................................................................. 69Canadian International Business Strategy (CIBS) ................................... 69Canadian Environmental Industry Strategy (CEIS) ............................... 70Canadian Environmental Technology Advancement Centres
(CETACs) ..................................................................................................... 70Other Multilateral and Bilateral Initiatives ............................................................ 70
Commission for Environmental Cooperation (CEC) .............................. 70Canada�Costa Rica Study on the Advantages of Joint
Implementation .......................................................................................... 70Asia-Pacific Economic Cooperation (APEC) Committee on
Harmonization of Equipment Standards ................................................ 71Hemispheric Project on Building and Equipment Efficiency .................. 71Canada�Mexico Memorandum of Understanding (MOU) on Energy
Efficiency and Alternative Energy ........................................................... 71Canada�Mexico�U.S. Statement of Intent to Cooperate on Climate
Change and Joint Implementation ......................................................... 71Conferences and Workshops .................................................................................... 71
GLOBE �96 � March/April 1996 ............................................................... 71OECD Sustainable Transportation Conference�March/April 1996 . 71IEA International Conference: �Technologies for Activities
Implemented Jointly (AIJ)� ...................................................................... 72Workshops ...................................................................................................... 72
CHAPTER 9: Research and Systematic Observations .................................................. 73Data Collection and Monitoring .............................................................................. 73
Climate Monitoring ....................................................................................... 73Ecological Monitoring ................................................................................... 74Monitoring Atmospheric Composition ...................................................... 74Past Climates .................................................................................................. 74National Energy Use Database ................................................................... 74
Canadian Research on Climate Change ................................................................ 74Improved Research Networks ..................................................................... 74New Developments in Climate Process Research ................................... 75
Greenhouse Gas Fluxes .................................................................... 75Climate Processes .............................................................................. 75Climate Modelling ............................................................................ 76
Climate Change Detection ........................................................................... 76Impacts of Climate Change ......................................................................... 76

CANADA�S SECOND NATIONAL REPORT ON CLIMATE CHANGE
VI
Energy Technology Research and Development .................................................. 77Industrial Sector ............................................................................................. 78Buildings Sector .............................................................................................. 78Renewables ..................................................................................................... 79Transportation Sector .................................................................................... 79
PERD�s Energy and Climate Change Task ............................................................ 80Greenhouse Gas Cycles and Storage .......................................................... 80Climate Change Prediction and Detection ............................................... 80Capture of Greenhouse Gases and Their Disposal .................................. 81Impact of Climate Change on the Canadian Energy Sector ................. 81
Other Initiatives ........................................................................................................... 81Climate Change Voluntary Challenge and Registry (VCR) Program.. 81Pollution Prevention ...................................................................................... 82Canadian Directory of Energy Efficiency and Renewable Energy
Programs in Canada ................................................................................... 82Summary ....................................................................................................................... 82
CHAPTER 10: Education, Training, and Public Awareness ........................................... 83Introduction .................................................................................................................. 83Federal Government Actions ..................................................................................... 83
Environment Canada: Action 21 .................................................................. 83Environment Canada: Atmospheric Environment Service ...................... 84Natural Resources Canada (NRCan) ........................................................... 84
Provincial/Territorial Activities ................................................................................ 85Municipal Governments............................................................................................. 85Non-Governmental Organizations ........................................................................... 86
Environmental Groups .................................................................................. 86Canadian Global Change Program (CGCP) ............................................... 86Private Sector Associations and Companies .............................................. 86
Appendix I ................................................................................................................................ 87Table 1 Summary of policies and measures affecting emissions
of CO2 and other GHGs .......................................................................................... 89Government of Canada ................................................................................. 89British Columbia ............................................................................................ 96Alberta ............................................................................................................. 98Saskatchewan ................................................................................................. 102Manitoba ......................................................................................................... 104Ontario ............................................................................................................. 106Quebec ............................................................................................................. 111New Brunswick .............................................................................................. 114Nova Scotia ..................................................................................................... 116Prince Edward Island ................................................................................... 118Newfoundland ............................................................................................... 119Yukon ............................................................................................................... 120Northwest Territories .................................................................................... 122Municipalities ................................................................................................. 124
Table 1 (a) Summary of policies and measures: effects on CO2 emissions ...... 127Table 1 (b) Summary of policies and measures: effects on CH4 emissions ..... 128

CANADA�S SECOND NATIONAL REPORT ON CLIMATE CHANGE
VII
Table 1 (c) Summary of policies and measures: effects on N2O emissions ..... 129Table 2 (a) Summary of projections of anthropogenic greenhouse gas
emissions ................................................................................................................... 130Table 2 (b) Summary of projections of anthropogenic CO2 emissions ............. 131Table 3 Summary of projections of removals of CO2 by sinks .......................... 132Table 4 Summary of projections of anthropogenic CH4 emissions .................. 133Table 5 Summary of projections of anthropogenic N2O emissions .................. 134Table 6 Summary of projections of anthropogenic emissions of other
greenhouse gases ..................................................................................................... 135Table 7 Summary of projections of anthropogenic emissions of precursors
and SOx .................................................................................................................... 136Table 8 Summary of key variables and assumptions in the projections
analysis ..................................................................................................................... 137Table 9 Financial contributions to the operating entity or entities of the
financial mechanism, regional and other multilateral institutionsand programs .......................................................................................................... 138
Table 10 Bilateral financial contributions related to the implementation ofthe Convention, (Canadian dollars) .................................................................... 139
Table 11 (a) Projects or programs that promote, facilitate and/or financetransfer of or access to «hard» and «soft» technologies ................................. 140
Table 11 (b) Projects or programs that promote, facilitate and/or financetransfer of or access to «hard» and «soft» technologies ................................. 141

CANADA�S SECOND NATIONAL REPORT ON CLIMATE CHANGE
VIII
List of Figures
1.1 The Greenhouse Effect ................................................................................................ 12.1 Canadian Energy Production, 1995 .......................................................................... 82.2 Canadian Primary Energy Demand, 1995 ............................................................... 82.3 End-Use Energy Demand by Sector, 1990 and 1995 ............................................... 92.4 Canadian Energy Trade, 1995 .................................................................................... 112.5 Secondary Energy Fuel Shares, 1990 and 1995 ........................................................ 133.1 Canada�s Greenhouse Gas Emissions, by Gas, by Sector, and by Fuel/
Source, 1995 .................................................................................................................. 203.2 Trends in Per Capita Carbon Dioxide Emissions and Gross Domestic
Product, 1990�1995 ...................................................................................................... 213.3 Canada�s National Greenhouse Gas Emission Inventory, 1995............................ 224.1 Greenhouse Gas End-Use Emissions, 1990�2020 .................................................... 374.2 Fossil Fuel Production Emissions and Initiatives Impact ..................................... 385.1 NRCan�s Forecasting Process .................................................................................... 425.2 The Gap: 1990�2000 ..................................................................................................... 475.3 Greenhouse Gas Emissions, 1990�2020 .................................................................... 485.4 Greenhouse Gas Emissions by Sector, 1990�2020 ................................................... 495.5 Impact of Initiatives on Greenhouse Gas Emissions, 1990�2020 .......................... 495.6 Greenhouse Gas Emissions by Province, 1990�2020 .............................................. 50
List of Tables
1.1 Changes in Concentrations of Key Greenhouse Gases Since Pre-IndustrialTimes ............................................................................................................................. 2
2.1 Average Annual Heating Degree-Days in Cities in Canada and OtherNorthern-Latitude Countries ..................................................................................... 6
2.2 Changes in Canada�s Greenhouse Gas Emissions and Related Factors.............. 72.3 Changes in Major Emissions-Related Indicators, 1990�1995 ................................ 112.4 Factors Influencing Growth in Secondary Energy Use, 1990�1995...................... 133.1 Greenhouse Gas Emission Estimates in Canada by Sector, 1990�1995 ............... 193.2 Global Warming Potentials of Various Greenhouse Gases ................................... 223.3 Canada�s Greenhouse Gas Emissions from Energy Sources, 1990�1995 ............. 243.4 Emissions from Bunker Fuel Use in Canada, 1990�1995 ....................................... 253.5 Canada�s Greenhouse Gas Emissions from Non-Energy Sources, 1990�1995.... 254.1 NAPCC: Identified Quantifiable Initiatives ............................................................ 354.2 End-Use Sector: Impact of Initiatives on Greenhouse Gas Emissions................. 374.3 The Gap � Greenhouse Gas Emissions in 2000 vs. 1990 ...................................... 395.1 Energy Pricing Assumptions ..................................................................................... 445.2 Macroeconomic Assumptions ................................................................................... 455.3 Current Policy � Some Important Elements .......................................................... 465.4 Sensitivity Analysis: Projected Change in Greenhouse Gas Emissions
Relative to 1990 ............................................................................................................ 51
CANADA�S SECOND NATIONAL REPORT ON CLIMATE CHANGE
IX
List of Acronyms, Abbreviations, and Units
AIJ activities implementedjointly
APEC Asia-Pacific EconomicCooperation
ARNEWS Acid Rain National EarlyWarning System
bbl barrel
BOREAS Boreal EcosystemAtmosphere Study
C2F6 carbon hexafluoride orperfluoroethane
CAFE corporate average fueleconomy
CANMET Canada Centre for Mineraland Energy Technology
CAPP Canadian Association ofPetroleum Producers
CCCGCM Canadian Climate ChangeGeneral Circulation Model
CCS-CIA Canada Country Study:Climate Impacts andAdaptation
CCTF-GE Canadian Consultant TrustFund for the GlobalEnvironment
CEC Commission onEnvironmental Cooperation
CEIS Canadian EnvironmentalIndustry Strategy
CEPA Canadian Energy PipelineAssociation
CES Canadian EnvironmentalSolutions
CETACs Canadian EnvironmentalTechnology AdvancementCentres
CF4 carbon tetrafluoride orperfluoromethane
CFCs chlorofluorocarbons
CGCP Canadian Global ChangeProgram
CH4 methane
CIBS Canadian InternationalBusiness Strategy
CIDA Canadian InternationalDevelopment Agency
CIPEC Canadian Industry Programon Energy Conservation
CJII Canadian JointImplementation Initiative
cm centimetre
CO carbon monoxide
CO2 carbon dioxide
CoP Conference of the Parties
CTI Climate TechnologyInitiative
EMAN Ecological Monitoring andAssessment Network
EPA Environmental ProtectionAgency
eq. equivalent
FCCC Framework Convention onClimate Change
FCM Federation of CanadianMunicipalities
GCM general circulation model
GCOS Global Climate ObservingSystems
GDP gross domestic product
GHG greenhouse gas
GLSLB Great Lakes�St. LawrenceBasin
GST Goods and Services Tax

CANADA�S SECOND NATIONAL REPORT ON CLIMATE CHANGE
X
Gt gigatonne
GWh gigawatt-hour
GWP global warming potential
HCFCs hydrochlorofluorocarbons
HFCs hydrofluorocarbons
HNO3 nitric acid
IEA International EnergyAgency
IPCC Intergovernmental Panel onClimate Change
JI Joint Implementation
K thousand
kg kilogram
km kilometre
kt kilotonne
kWh kilowatt-hour
L litre
LPGs liquefied petroleum gases
m metre
m2 square metre
M million
MBIS Mackenzie Basin ImpactStudy
mcf thousand cubic feet
MJ megajoule
mm millimetre
MOU Memorandum ofUnderstanding
Mt megatonne
MW megawatt
N2O nitrous oxide
NA not applicable
NAFTA North American Free TradeAgreement
NAPCC National Action Program onClimate Change
NEUD National Energy UseDatabase
NH3 ammonia
NMVOCs non-methane volatileorganic compounds
NOx nitrogen oxides
NRCan Natural Resources Canada
O3 ozone
OECD Organisation for EconomicCo-operation andDevelopment
PERD Program on EnergyResearch and Development
PFCs perfluorocarbons
PJ petajoule
ppbv parts per billion by volume
ppmv parts per million by volume
pptv parts per trillion by volume
R&D research and development
REEAC Regional Ecosystem Effectsof Atmospheric Change
SF6 sulphur hexafluoride
SMEs small and medium-sizedenterprises
SO2 sulphur dioxide
t tonne
TPC Technology PartnershipsCanada
UQCN Union québécoise pour laconservation de la nature
UV-B ultraviolet B
VCR Voluntary Challenge andRegistry
ZEVs zero-emission vehicles

CANADA�S SECOND NATIONAL REPORT ON CLIMATE CHANGE
XI
This
map
is b
ased
on
info
rmat
ion
take
n fr
om th
e N
atio
nal A
tlas D
igita
l Bas
e M
ap, a
nd m
ore
part
icul
arly
des
crib
ed a
s Can
ada
at th
e sc
ale
of :
1:30
M. ©
199
7. H
er M
ajes
ty th
e Q
ueen
in R
ight
of C
anad
a w
ith p
erm
issi
onof
Nat
ural
Res
ourc
es C
anad
a.

SASK
.
MA
NIT
OB
AA
LBE
RT
A
ON
TA
RIO
QU
EB
EC
P.E.I.
N.B
.
N.S
.
NO
RT
HW
ES
TT
ER
RIT
OR
IES
U.S.A
.
AR
CT
ICO
CEAN
NEW
FOU
ND
LAN
D
BRIT
ISH
CO
LUM
BIA
HU
DSO
N
BAY
Victo
ria
Edm
onto
n
Regi
naW
inni
peg
UN
ITE
DS
TA
TE
SO
FA
ME
RI C
A
Yello
wkn
ife
Whi
tehor
se
OTT
AWA
Toro
nto
Qué
bec
Fred
erict
onHa
lifax
Char
lotte
town
St Jo
hn’s
RR
R
R
R
R
R
RR
R
RR
R
YUKO
NTER
RITO
RY
OCE
ANAT
LAN
TIC
PAC
IFIC
OC
EAN
km
km
300
300
0600

CANADA�S SECOND NATIONAL REPORT ON CLIMATE CHANGE
XIII
In 1992, Canada and more than 150other nations signed the United NationsFramework Convention on ClimateChange (FCCC), which has as itsobjective for developed countries to aimto return net greenhouse gas emissions to1990 levels by the year 2000. In 1994,Canada tabled its first National Report tothe Conference of the Parties of theFCCC, outlining its responses to climatechange. In 1995, Canada tabled itsNational Action Program on ClimateChange (NAPCC), which outlined thestrategic directions for governments andthe private sector to address climatechange science, greenhouse gas emissionmitigation, and adaptation to climatechange. This Second National Report,dated May 1997, provides an update ofCanada�s situation and responses toclimate change, as required by the FCCC.
If climate change occurs to the extentpredicted by current models, there will bea significant risk to Canada�senvironment, with potentially seriousconsequences for the health of theCanadian economy, particularlyagriculture, forestry, and fisheries.
As a modern industrial nation, Canadadepends on energy production,transformation, and consumption tomaintain economic growth and meet theneeds of its fast-growing population.Canada is also a northern country, withclimate extremes, vast distances to cover,and a heavy dependence on energy-intensive natural resource development,most of which is destined for export toother countries. These unique features ofCanada, and the relative importance thatenergy plays in Canada, help explainwhy emissions associated with energy useaccounted for 89% of the country�sgreenhouse gas emissions in 1995. Thebalance of emissions arose from certain
industrial, agricultural, and wastemanagement processes. Energy�scontribution to both the economy andgreenhouse gas emissions necessitatesthat mitigative responses to the challengesof climate change adhere to the preceptsof sustainable development. Canada�senvironment and economic interests bothneed to be protected.
Canada (i.e., federal, provincial,territorial, and municipal governments,the private sector, and other stakeholders)has made progress since 1990 in takingmitigative actions to reduce greenhousegas emissions from the principal source,energy production and consumption. Forexample, in the secondary energy usesector (i.e., energy used by the finalconsumer), improvements in energyintensity have meant that despite anincrease in energy consumption,primarily as a result of population growthand an expanding economy, carbondioxide emissions were 3.5 percentagepoints lower than they otherwise wouldhave been over the period 1990�1995.Nevertheless, growth in economic activityhas meant that total greenhouse gasemissions from all sectors were about 9%higher in 1995 than in 1990, rising from567 Mt of carbon dioxide equivalent in1990 to 619 Mt in 1995, or about 2% ofthe world�s total.
It is projected that Canadian greenhousegas emissions will decline slightly from1995 levels by the year 2000 but willremain above the 1990 stabilization level.Current response strategies will be offsetby continued population and economicgrowth. When the NAPCC was tabled in1995, it was projected that greenhousegas emissions for Canada would be 13%higher in the year 2000 than in 1990.Progress is being made in lowering theprojected �gap� to 8% by 2000, as a result
Executive Summary

CANADA�S SECOND NATIONAL REPORT ON CLIMATE CHANGE
XIV
other forecasting assumptions. Most otherindustrialized countries, like Canada, areforecasted not to stabilize their greenhousegas emissions at 1990 levels by the end ofthe decade.
Canada is continuing to take action in theareas of improving our understanding ofthe science of climate change, its potentialimpacts on the country, and how toaddress climate change through mitigativeand adaptive responses.
Global climate change modelling suggestsgreater average warming trends over landthan over oceans, in high latitudes than inlow latitudes, and in winter than insummer. The projected rate of warming isfrom 0.1 to 0.45°C per decade, but thiscould be reduced to 0.1�0.35°C as a resultof increases in aerosol concentrations. Theaverage rate of global sea rise is projectedto be between 1.5 and 9.5 cm per decade.
For Canada, most models project greaterwarming in interior regions than on thecoasts and greater winter warming in theArctic than in the south, with increasedaverage winter precipitation across thecountry and decreased net soil moistureand water resources in the Canadianinterior in the summer. The frequency andintensity of storms are also projected toincrease. The confidence of modelprojections for regions is low, but to datethey suggest net average warming forcentral and northern Canada of 4�6°C by2050 and 3�4°C along the east and westcoasts. Canada�s agricultural, fishery, andforestry sectors could be adverselyaffected, as could human health and thenation�s infrastructure. Canadians wouldface important socioeconomicrepercussions should these changesmaterialize as predicted.
Canada has also been studying the tactical,strategic, and policy foundations foradaptive responses to climate change. It iscurrently conducting the Canada CountryStudy: Climate Impacts and Adaptation tofurther assess the impacts of climatechange on the regions and sectors of theeconomy and to assess adaptive responses.
Canada is active in supportinginternational climate change research andactions under the FCCC. Especiallyimportant is the research, development,and dissemination of new technologies forgreenhouse gas abatement through anumber of multilateral and bilateralinitiatives. Canada launched its program insupport of the international pilot programon activities implemented jointly byopening the office of the Canadian JointImplementation Initiative in 1996. Canadais also active in researching historicalchanges to the climate, modelling futureclimate scenarios, understandinggreenhouse gas fluxes in the naturalenvironment, and developing thenecessary databases for scientific researchand indicators to explain trends in energyuse. As well, Canada plans to augment itsactivities with respect to public educationand information on climate change.
The prospect of climate change and theneed for measures to address it make thisthe preeminent global sustainabledevelopment challenge for decades tocome. The problems of, and the solutionsto, climate change are integral to theenvironmental, economic, and social well-being of all Canadians. Canada willcontinue to work both internationally anddomestically to develop timely andappropriate responses to this challenge.

CANADA�S SECOND NATIONAL REPORT ON CLIMATE CHANGE
1
The combustion of fossil fuels for theproduction of electricity and for industrialuse (including production oftransportation fuels) generated about 54%of the greenhouse gas emissions in 1995,whereas the transportation sectorgenerated 27%.
Land and water surfaces have aconsiderable influence on climateprocesses, absorbing and reflecting solarradiation and affecting the flow of airacross the Earth�s surface. Vegetationproduces carbon dioxide throughrespiration, removes it throughphotosynthesis, and releases moisturethrough transpiration. In a balancedsystem, all removal of carbon dioxide byphotosynthesis is offset by emissionsthrough respiration and decay. Humanactivity has affected this precariousbalance.
CHAPTER 1: Introduction
Climate Change
The atmosphere is essential for life onEarth. For more than three billionyears, Earth�s atmosphere has beenshaped and modified by interactionswith living things. Until the coming ofthe industrial revolution, however,human beings did not have much ofan effect on these processes. Sincethen, human activities have resulted inincreasingly significant changes to thecomposition of the atmosphere. In1995, Canadians released an estimated619 Mt of greenhouse gases (GHG) (on acarbon dioxide, or CO2, equivalent1 basis)into the atmosphere.
Heat-retaining greenhouse gases, such aswater vapour, carbon dioxide, methane(CH4), and nitrous oxide (N2O), warm theEarth by allowing solar energy to reach theEarth�s surface, where it is absorbed andre-emitted as heat. Greenhouse gases trapsome of this heat in the atmosphere andprevent its escape into space (Figure 1.1).Known as the greenhouse effect, this heat-trapping process keeps the averagetemperature of the Earth at about 15°C.Without it, the average temperature wouldbe -18°C, and life as we know it would notexist.
Numerous human activities have animpact on greenhouse gas emissions, butby far the most important is thecombustion of fossil fuels, whichcontributed approximately 89% ofCanada�s total emissions in 1995.
1 In order to compare emissions of different gases, global warming potentials (GWPs) are used todevelop carbon dioxide equivalent emissions (Table 3.2 in Chapter 3 summarizes current globalwarming potentials; IPCC, 1996).
FIGURE 1.1 THE GREENHOUSE EFFECT

CHAPTER 1: INTRODUCTION
2
Globally, greenhouse gas emissions haverisen significantly since pre-industrialyears. Atmospheric contaminants ofhuman origin range from commonsubstances, such as oxides of carbon,nitrogen, and sulphur, to more exotic, oftensynthetic substances, such aschlorofluorocarbons (CFCs). Table 1.1indicates how much the atmosphericconcentrations of some of the maingreenhouse gases have risen from those ofpre-industrial years.
In 1995, total Canadian emissions ofgreenhouse gases reached 619 Mt,composed primarily of carbon dioxide(81%), methane (12%), and nitrous oxide(5%).
Canada�s Commitments Underthe Framework Convention onClimate Change (FCCC)
The ultimate objective of the UnitedNations Framework Convention onClimate Change (FCCC) is the stabilizationof greenhouse gas concentrations in theatmosphere at a level that would preventdangerous anthropogenic interference with
the climate system. Such a level should beachieved within a time frame sufficient toallow ecosystems to adapt naturally toclimate change, to ensure that foodproduction is not threatened, and to enableeconomic development to proceed in asustainable manner.
While the FCCC does not include legallybinding targets and schedules to controlgreenhouse gas emissions, it does requiregovernments to undertake a number ofactions within a range of options.Governments have an opportunity tochoose the climate change mitigationmeasures that are the mostenvironmentally effective andeconomically cost-effective. Under theFCCC, Canada is committed to:
� implement policies and measures thatmitigate climate change by limitinganthropogenic emissions of greenhousegases and by protecting and enhancingnatural sinks;
� adopt policies and measures that willfacilitate its ability to adapt to thepossible future impact of climatechange;
TABLE 1.1 CHANGES IN CONCENTRATIONS OF KEY GREENHOUSE GASES SINCE PRE-INDUSTRIAL TIMES
Pre-industrial Concentration ConcentrationGas Concentration in 1992 Change Remarks
CO2
280 ppmv 355 ppmv 19.64% Increase is almost entirely due to human
activities
CH4
700 ppbv 1 714 ppbv 144.86% Natural and anthropogenic causes
N2O 275 ppbv 311 ppbv 13.09% Natural and anthropogenic causes
CFC-12 0 pptv 503 pptv NA Entirely human origin
HCFC-22 (a CFC substitute) 0 pptv 105 pptv NA Anthropogenic; low concentrations now but
rising
CF4 (a perfluorocarbon) 0 pptv 70 pptv NA Anthropogenic; very long lifetime; effectively a
permanent atmospheric resident
ppmv = parts per million by volumeppbv = parts per billion by volumepptv = parts per trillion by volumeNA = not applicable
Source: IPCC (1995, 1996).

CANADA�S SECOND NATIONAL REPORT ON CLIMATE CHANGE
3
� develop and implement educationaland public awareness programs onclimate change and its effects bothnationally and internationally;
� promote and cooperate in the exchangeof information related to climatechange by working nationally on datacollection, research, and systematicobservation to further theunderstanding of climate change andreduce the scientific uncertaintiessurrounding it;
� take into account climate change ineconomic and environmental decisionmaking to support a sustainabledevelopment approach;
� provide new and additional financialresources to developing countries tohelp them meet their owncommitments under the FCCC;
� promote, facilitate, and finance thetransfer of environmentally soundtechnologies while working to enhancethe technological capacity ofdeveloping countries; and
� cooperate with other countries toensure that the policy instruments theyadopt to mitigate climate changecomplement, rather than counteract,measures taken elsewhere.
National CommunicationsUnder the FCCC
Canada�s First National Report onClimate Change � 1994
Canada�s First National Report on ClimateChange, produced in 1994, was a snapshotat that time of what had been done bygovernments, communities, and theprivate sector with respect to Canada�scommitments in areas of climate changemitigation, adaptation, research, education,
and international cooperation. The reportevaluated Canada�s efforts to meet itscommitments under the FCCC and gaveCanadians a basis for planning futureaction.
Canada�s National Action Program onClimate Change (NAPCC)
Canada�s National Action Program onClimate Change (NAPCC), outlines theprinciples and strategic directions onclimate change. It was agreed to by allfederal, provincial, and territorial energyand environment ministers in February1995 and was presented at the firstConference of the Parties (CoP) to theFCCC, held in Berlin in the spring of 1995.
Canada�s Second National Report onClimate Change � 1997
This Second National Report on ClimateChange was drafted under a detailed set ofguidelines provided by the SubsidiaryBody for Scientific and TechnologicalAdvice and the Subsidiary Body forImplementation under the FCCC. Theseguidelines have three principal purposes:
� to assist Member Countries in theircommitments to develop, update,publish, and make available to the CoPnational inventories of anthropogenicemissions by source, and removal bysink, of all greenhouse gases notcontrolled by the Montreal Protocolusing comparable technologies;
� to facilitate the process of developingnational communications (i.e., nationalreports), including the preparation ofuseful technical analysisdocumentation, by encouraging thepresentation of information in waysthat are consistent, transparent, andcomparable; and
� to ensure that the CoP has sufficientinformation to carry out itsresponsibilities to review the

CHAPTER 1: INTRODUCTION
4
implementation of the FCCC and theadequacy of the commitments.
This report addresses actions to implementthe FCCC�s obligations, including thoserelating to adaptation, research, andeducation, in addition to those to limitemissions and enhance sinks. It has beenprepared by officials in the federalgovernment with input from officials fromprovincial and territorial governments andnon-government stakeholders.
References
Government of Canada (1994). Canada�sNational Report on Climate Change.Actions to Meet Commitments Underthe United Nations FrameworkConvention on Climate Change.Ottawa.
IPCC (Intergovernmental Panel on ClimateChange) (1995). Guidelines for NationalGreenhouse Gas Inventories, Volume 3.
IPCC (Intergovernmental Panel on ClimateChange) (1996). Climate Change 1995,The Science of Climate Change �Contribution of Working Group 1 to theSecond Assessment Report of theIntergovernmental Panel on ClimateChange.
National Air Issues CoordinatingCommittee (1995). Canada�s NationalAction Program on Climate Change.
CANADA�S SECOND NATIONAL REPORT ON CLIMATE CHANGE
5
As a northern-latitude country, Canada isparticularly vulnerable to the potentialimpacts of climate change. At the sametime, Canada�s northern and diverseclimate, sparsely populated land mass,regional differences, high rate ofpopulation growth, resource-based andexport-oriented economy, lifestyles, andhigh standard of living all serve to create ahigh demand for energy, with itsassociated greenhouse gas (GHG)emissions. The responsibility for publicpolicy on climate change is shared amongall orders of government in Canada �federal, provincial, territorial, andmunicipal.
Canada�s economy relies in large part onits renewable and non-renewableresources. The importance of agriculture,forestry, fisheries, water resources, andenergy and mineral resources to our nationis well known. Although the magnitude,timing, and regional impacts of climatechange are uncertain, current predictionsare that climate change could have far-reaching and mostly negative implications.Climate change during the next century isprojected to bring about warming trends,precipitation changes, and a greaterfrequency of storms and unusual weatherpatterns. This has ramifications for coastalcommunities, the vulnerable ecosystems ofour far north, and the health of someCanadians. Droughts, hot spells, and insectinfestations may become more frequent onthe prairies, water resources in southernregions of the country may come understress, the boreal forest may be unable toadapt to relatively rapid changes inclimate, and coastal fisheries may beadversely affected. Likewise, givenCanada�s dependence on internationaltrade, the nation�s energy-intensive
industries and energy resource sector couldalso be adversely affected if the mitigativepolicies and measures chosen to addressclimate change and greenhouse gasemissions do not adequately take intoaccount Canada�s economic interests.While the magnitude of impacts of climatechange continues to be assessed, there is arisk that the general well-being ofCanadians could be jeopardized ifgreenhouse gas emissions are not curbedon a global basis.
In Canada, energy production,transformation, and consumption are themajor producers of carbon dioxide (CO2)and methane (CH4), which togetheraccounted for 93% of Canada�s totalgreenhouse gas emissions in 1995. Carbondioxide is the dominant greenhouse gas,accounting for 81% of emissions in 1995,and fossil fuel combustion and productionare the dominant sources, accounting forabout 89% of greenhouse gas emissions inthe same year. Other greenhouse gasemissions (mainly methane, nitrous oxide[N2O], and fluorocarbons) come mostlyfrom non-energy sources, such asindustrial processes, agriculture, and wastedisposal.
Physical Characteristics
Canada is a land of extremes and contrasts.Its surface area (land plus fresh water) of9 970 620 km2 occupies 7% of the world�sland mass and is second only to that of theRussian Federation. Canada extendsroughly 5 300 km east to west, the distancebetween Paris and New York, and nearly4 600 km south to north. As a consequence,Canada faces long freight haulagedemands, which contribute to greenhousegas emissions in the transportation sector.
CHAPTER 2: National Circumstances

CHAPTER 2: NATIONAL CIRCUMSTANCES
6
Many nations are shaped to a large extentby their climate, but few can match theclimatic diversity of Canada. The size andvariety of Canada�s land mass and theeffects of its three ocean boundaries help tocharacterize many of its 15 terrestrialecozones, from the Arctic Cordillera, withits extremely cold and dry climate andcontinuous permafrost, to the MixedwoodPlains, with its cool to mild and moistclimate.
Overall, Canada is characterized by short,intense summers with wide temperaturevariations and long, cold winters, whichplace a heavy demand on energyconsumption, especially for heatingbuildings. Table 2.1 presents the annualheating degree-day values for severalCanadian cities and other cities around theworld.
TABLE 2.1 AVERAGE ANNUAL HEATING DEGREE-DAYS IN CITIES IN CANADA AND
OTHER NORTHERN-LATITUDE
COUNTRIES
City Heating Degree-Daysa
Winnipeg 5 923
Helsinki 4 930
Moscow 4 840
Montreal 4 540
Stockholm 4 160
Toronto 4 140
Berlin 3 300
Beijing 3 050
Vancouver 3 030
Paris 2 720
Washington 2 160
Tokyo 1 620
a Calculated by multiplying the number of days the averagetemperature is less than 18ºC by the number of degrees theaverage temperature is below 18ºC over a year-long period.
Heating degree-days can vary from year toyear, which may lessen or increase thedemand for energy in the residential andcommercial sectors. In Canada in 1994, 61%of the energy demand for the residentialsector was used for space heating, as was55% of the energy demand for the
commercial sector. Energy required forsummer cooling places a growing demandon energy systems.
Socioeconomic Context
Despite its geographic immensity, Canadasupports only a relatively modestpopulation � more than 29 million in 1995,or 0.5% of the world�s people � but emits2% of the global greenhouse gas emissions.Average population density is low �about 3.0 persons per square kilometre �but this figure is misleading, as thepopulation is highly concentrated in majorurban areas in the south near the Canada�U.S. border.
Developed countries, including Canada,represent only about 20% of the world�spopulation but use about 80% of theworld�s resources. Canada has the secondhighest population growth rate amongindustrialized countries (due mainly to netimmigration). Over the period 1973�1993,Canada�s population grew at an annualrate of 1.22%, compared with 0.98% for theUnited States, 0.14% for the UnitedKingdom and Germany, and 0.69% forJapan. This population growth puts ademand on the production of goods andservices. Infrastructure changes in thenumber of dwellings, commercialbuildings and services, roads, and vehiclesall contribute to increasing demands forenergy, with its associated greenhouse gasemissions.
Canada is a highly urbanized country. Interms of land area, occupied urban areasaccount for less than 20 000 km2, orroughly 0.2% of the country�s total landarea. In terms of population, however,about 80% of the people live in urbanareas. Increasingly, Canadians havecongregated in the largest cities; nearly60% of Canada�s urban population lives incentres of 500 000 or more.

CANADA�S SECOND NATIONAL REPORT ON CLIMATE CHANGE
7
Despite Canada�s low population density,cities provide more opportunities forenvironmental protection and resourceconservation than dispersed patterns ofsettlement. Potentially, at least, the citypermits economies and efficiencies in theprovision of water, sewage, and wastedisposal; in energy use; and in the use ofland. The city also provides opportunitiesto substitute walking, bicycling, and publictransit for car use, but personal automobileuse is heavy, owing in part to urbansprawl. Canada�s low population densityand long distances between populationcentres contribute to high energy use inCanada�s transportation sector. Canadamoves five times as much freight(measured in tonnes per kilometre) asFrance, Germany, and Japan.
Canadians, in general, enjoy a high qualityof life, as measured on a variety of socialand economic scales. Gross domesticproduct (GDP) is one measure of acountry�s ability to generate wealth. From1990 to 1995, Canada�s GDP rose by 8.2%(Table 2.2). Canadians use energy at ratessimilar to those of residents of other
per capita emissions attributed toCanadians, even though they do notconsume these products. Canada�s naturalgas exports play a significant role in theincreased use of high-efficiencycogeneration in many areas of the UnitedStates, resulting in reduced overall airemissions within North America.
Greenhouse Gas Emissions
Following a small reduction in 1991,Canada�s greenhouse gas emissionsincreased steadily from the 1990 level of567 Mt of carbon dioxide equivalent to 599Mt in 1994 and 619 Mt in 1995. Thisrepresents an increase of 9.0% over 1990levels in 1995 while the population grewby 6.5% over the same period, representinga per capita increase of almost 3%.Canada�s GDP increased by 8.2% over thesame period (Table 2.2), leading to anincrease in emissions per unit of GDP of1.2%.
Political Context
Addressing climate change is the sharedresponsibility of all Canadiangovernments, industries, and citizens. Eachgovernment has certain responsibilities asdefined by the division of powers underthe Constitution. Each jurisdiction has its
developed countries, but countries likeJapan, with a slightly higher GDP percapita, use much less energy. Part of thereason is that Canada exports energy-intensive products. Greenhouse gasemissions associated with the productionof these products are attributed to Canada,not the importing country. This raises the
TABLE 2.2 CHANGES IN CANADA�S GREENHOUSE GAS EMISSIONS AND RELATED FACTORS
GHG Emissions % Change Population % Change GDP % Change Energy % Change
Year (kt CO2 eq.) from 1990 (000s) from 1990 (1986 $M) from 1990 (PJ) from 1990
1990 567 000 0.0 27 790.6 0.0 565 000 0.0 7 866 0.0
1991 559 000 �1.4 28 119.6 1.2 555 052 �1.8 7 765 �1.3
1992 575 000 1.4 28 542.2 2.7 559 305 �1.0 7 930 0.8
1993 581 000 2.5 28 940.6 4.1 571 722 1.2 8 191 4.1
1994 599 000 5.6 29 248.1 5.2 597 936 5.8 8 307 5.6
1995 619 000 9.0 29 606.1 6.5 611 300 8.2 8 587 9.2

CHAPTER 2: NATIONAL CIRCUMSTANCES
8
own priorities and needs. All levels ofgovernment are currently facingfinancial restraint and are prioritizingexpenditures. Consistent with theprinciple of sustainable development,initiatives to limit greenhouse gasemissions have to complement otherpriorities, such as job creation andeconomic growth. This is an ongoingchallenge.
Energy Sector�s Role in the Economy
Canada�s energy production anddemand are dominated by fossil fuels,as shown in Figures 2.1 and 2.2. Energyproduction and consumption areintegral to a modern economy such asCanada�s. Employment in the energysector and energy-intensive industries(e.g., pulp and paper,1 iron and steel,smelting and refining, cement, andchemicals) totalled close to 500 000people in 1995; the energy sectorcontributed 2.7% of the country�s totalemployment, and energy-intensiveindustries contributed 2%. Thesesectors also accounted for $77 billion ofGDP � the energy sector contributed7.5% of total GDP, and energy-intensive industries contributed 3.9%.
Energy contributed 16.1% to totalinvestments in Canada in 1995 and
a LPG = liquefied petroleum gas.
b Hydro included at 3.6 MJ/kWh.
c Nuclear included at 11.6 MJ/kWh.
d "Others" includes wood and other renewables.
Natural Gas 36%
Crude Oil/LPGsa 33%
Hydrob 8%
Nuclearc 7%
Coal 12%
Othersd 4%
a Hydro included at 3.6 MJ/kWh.
b Nuclear included at 11.6 MJ/kWh.
c "Others" includes wood and other renewables.
Natural Gas 27%Petroleum Products 36%
Hydroa 10%
Nuclearb 10%
Coal 11%
Othersc 4%
FIGURE 2.2 CANADIAN PRIMARY ENERGY DEMAND, 1995
natural gas, often reduce emissionselsewhere by replacing more carbon-intensive fuels. Greenhouse gas emissionsassociated with the production andtransportation of these resources for exportare attributed to Canada.
9.5% of the value of exports. Energy�scontribution to the trade balance was42.3%. In 1995, over 50% of Canada�s crudeoil/liquefied petroleum gases (LPGs) andnatural gas production were exported.Together, they accounted for 6 236 PJ,resulting in a net export of 4 538 PJ (seeFigure 2.4). These exports, particularly
1 The pulp and paper industry currently gets about 56% of its energy requirements from biomass andbiofuels, which are part of the natural carbon cycle and not included in greenhouse gas emissionestimates.
FIGURE 2.1 CANADIAN ENERGY PRODUCTION, 1995

CANADA�S SECOND NATIONAL REPORT ON CLIMATE CHANGE
9
The energy sector isimportant to Canada�seconomic well-being andis relatively larger thanother natural resourcesectors, such as forestry,agriculture, and fisheries.New measures to limit orreduce greenhouse gasemissions could affect thefossil fuel sector, whichmeets over 70% ofCanada�s primary energydemand and which isresponsible for themajority of greenhousegas emissions in Canada(Figure 2.2). Sectordemands for energy in1990 and 1995 areillustrated in Figure 2.3.More detailed end-useenergy information maybe found in Energy Efficiency Trends inCanada: 1990�1995.
Performance Indicators
Key Determinants of Greenhouse GasEmissions
There are five major factors that, throughtheir interaction, determine the nature andextent of anthropogenic greenhouse gasemissions: (1) population size and growth,(2) economic activity, (3) energy intensity(i.e., amount of energy consumed by agiven population or level of economicactivity), (4) greenhouse gas intensity ofenergy requirements (i.e., the extent towhich carbon-based fuels are used inenergy consumption), and (5) land use (i.e.,urban development, agricultural andforestry practices). Understanding thesefactors or indicators helps to reveal whygreenhouse gas emissions are rising orfalling for a particular sector over aspecified time period. Proper under-
standing of indicators can reveal trends and aidin determining appropriate mitigative andadaptive responses.
The production and consumption of fossil fuels(petroleum products, natural gas, and coal) arethe main sources of the chief anthropogenicgreenhouse gas emissions (carbon dioxide,methane, nitrous oxide). Therefore, both theextent to which and the way in whichCanadians use energy or produce it for exportare pivotal for Canada�s greenhouse gasemissions.
Population and GDP Indicators
Our modern economy and lifestyles are energydependent. As population grows, a higherdemand for goods and services has traditionallyfollowed. Meeting these needs requires energy,much of which is fossil fuel based (especiallythe transportation sector, as well as electricityproduction in certain regions). Canada�spopulation grew by 6.5% over the period1990�1995, outpacing that of all other G-7
FIGURE 2.3 END-USE ENERGY DEMAND BY SECTOR, 1990 AND 1995
150421%
0
2,000
4,000
6,000
8,000
10,000
12,000
PJ
27%
39%
13%
6 882
27%
39%
13%
7 400
1990 1995
21%
Commercial
Transportation
Residential & Farm
Industrial

CHAPTER 2: NATIONAL CIRCUMSTANCES
10
countries, and it is projected to grow at anannual rate of 0.9% to 2020, raising thepopulation from 29.6 million to 36.8million. Canada�s GDP increased by 8.2%from 1990 to 1995 and is projected to be12% higher in 2000 than it was in 1995, and70% higher in 2020.
Given this historic link betweenpopulation, economic growth, and energydemand, energy intensity and thegreenhouse gas intensity of fuels are keyindicators of where progress, or the lackthereof, is being made in reducingemissions, and where potential forreduction may lie.
It should be noted, however, that even ifcertain trends are identified, there can besudden short-term shifts in emissions as aresult of other factors. A recent example iswhat happened in the electricity-generating sector in 1995. In that year,power production from several units ofnuclear stations was interrupted forbetween 2 and 12 months. This disruptionmeant that, for the most part, electricitywas instead generated from fossil fuels,which resulted in a 6- to 8-Mt increase ingreenhouse gas emissions above normal.Likewise, weather changes (e.g.,fluctuations in temperature with respect toheating and cooling demands, andprecipitation changes with respect tomaintaining hydroelectric reservoir levels)can influence emissions from fossil fuel useon a year-to-year basis.
Energy Export Indicators
Greenhouse gas emissions from energyproduction and use can be divided intoemissions resulting from energy used inthe domestic market and those resultingfrom energy produced for export. The bulkof exported energy resources are crude oiland natural gas � over 50% of domesticproduction in 1995 � followed by coal(about 45% of domestic production) andelectricity (about 6% of domestic
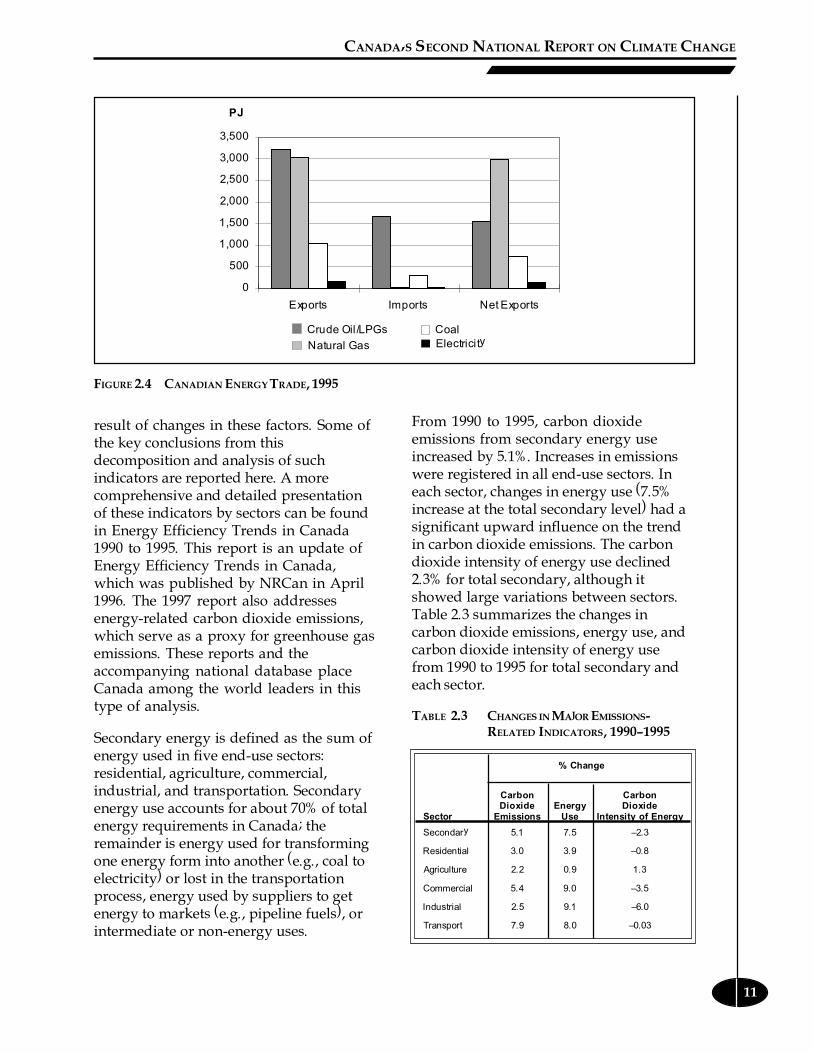
production, much of it hydroelectric)(Figure 2.4).
Between 1990 and 1995, oil and gasproduction increased by 35%, and exportsdoubled. The emissions associated withthis production were the single mostimportant cause of the increase inCanada�s greenhouse gas emissions overthe 1990�1995 period, accounting for 31%of the total increase in emissions. Despitethe very significant decrease in the amountof energy consumption required per unit ofproduction, the sheer volume of exportactivity overwhelmed any energyefficiency improvements insofar asgreenhouse gas emissions were concerned.
As the review of the National ActionProgram on Climate Change (NAPCC)concluded, had it not been for the growthin oil and gas exports, the petroleumindustry�s emissions in Canada wouldhave been approximately stable over the1990�1995 period. This raises important,and as yet unresolved, questions about theattribution of emissions between exportersand importers of energy. Canada�s naturalgas exports are playing a significant role inthe increased use of high-efficiencycogeneration in many areas of the UnitedStates, resulting in reduced air emissionswithin North America. Although Canadadoes not consume these energy resourcesbound for export and so important to oureconomy, the emissions associated withtheir production, partial processing, andtransportation to the United States andelsewhere are attributed to Canada.
Secondary Energy Use and EmissionIndicators
Changes in energy-related greenhouse gasemissions arise from changes in theprincipal factors that influence energy useand emissions over time. NaturalResources Canada (NRCan) has developedsome notable indicators of changes inenergy use at the secondary level as a
CANADA�S SECOND NATIONAL REPORT ON CLIMATE CHANGE
11
result of changes in these factors. Some ofthe key conclusions from thisdecomposition and analysis of suchindicators are reported here. A morecomprehensive and detailed presentationof these indicators by sectors can be foundin Energy Efficiency Trends in Canada1990 to 1995. This report is an update ofEnergy Efficiency Trends in Canada,which was published by NRCan in April1996. The 1997 report also addressesenergy-related carbon dioxide emissions,which serve as a proxy for greenhouse gasemissions. These reports and theaccompanying national database placeCanada among the world leaders in thistype of analysis.
Secondary energy is defined as the sum ofenergy used in five end-use sectors:residential, agriculture, commercial,industrial, and transportation. Secondaryenergy use accounts for about 70% of totalenergy requirements in Canada; theremainder is energy used for transformingone energy form into another (e.g., coal toelectricity) or lost in the transportationprocess, energy used by suppliers to getenergy to markets (e.g., pipeline fuels), orintermediate or non-energy uses.
From 1990 to 1995, carbon dioxideemissions from secondary energy useincreased by 5.1%. Increases in emissionswere registered in all end-use sectors. Ineach sector, changes in energy use (7.5%increase at the total secondary level) had asignificant upward influence on the trendin carbon dioxide emissions. The carbondioxide intensity of energy use declined2.3% for total secondary, although itshowed large variations between sectors.Table 2.3 summarizes the changes incarbon dioxide emissions, energy use, andcarbon dioxide intensity of energy usefrom 1990 to 1995 for total secondary andeach sector.
TABLE 2.3 CHANGES IN MAJOR EMISSIONS-RELATED INDICATORS, 1990�1995
% Change
Carbon CarbonDioxide Energy Dioxide
Sector Emissions Use Intensity of Energy
Secondary 5.1 7.5 �2.3
Residential 3.0 3.9 �0.8
Agriculture 2.2 0.9 1.3
Commercial 5.4 9.0 �3.5
Industrial 2.5 9.1 �6.0
Transport 7.9 8.0 �0.03
FIGURE 2.4 CANADIAN ENERGY TRADE, 1995
PJ
0
500
1,000
1,500
2,000
2,500
3,000
3,500
Exports Imports Net Exports
Crude Oil/LPGs
Natural Gas
CoalElectricity

CHAPTER 2: NATIONAL CIRCUMSTANCES
12
within sectors increased energy use by193 PJ.
Weather also contributed to the increase insecondary energy use, as 1995 was colderthan 1990. The effect of this colder weatheris most relevant in the residential andcommercial sectors, where space heatingrepresents a major part of energy use.Combined residential and commercialspace heating requirements increased by52 PJ as a result of colder weather.
Energy intensity was the only factor thatkept secondary energy use from increasingmore than it actually did from 1990 to 1995.Had energy intensity remained at its 1990level and only activity levels, structure, andweather changed, secondary energy usewould have been 308 PJ higher in 1995than it was. Energy intensity declined inall sectors, except for industry, where itincreased. However, the increase inintensity in industry hides a significantdecline in the intensity of energy use forthe manufacturing sector, which accountsfor 86% of industry energy use. Theincrease in industry energy intensity can beattributed to a relatively large increase inmining sector energy intensity.
The energy intensity effect is due to manyfactors, one of which is energy efficiency. Itis important to note that when analyzingthe factors that underlie changes in energyintensity and the energy efficiencyimprovements over a given period, it isnecessary to extend the analysis of causalfactors beyond the period under review.For example, although steps have beentaken to realize energy efficiency gains inthe products available to consumers overthe 1990�1995 period, these improvementshave not had enough time to have had asignificant impact on the change in energyintensity over this period. Only a smallfraction of today�s capital stock iscomposed of products that have enteredthe market since 1990. On the other hand,the energy efficiency improvements in
The following two subsections explain theevolution of secondary energy use and thetrend in the carbon dioxide intensity ofsecondary energy use. In these subsections,reference will be made to sectoral trendswhere these trends have had a significanteffect.
Evolution of Secondary Energy Use and ItsMajor Determinants
Table 2.4 presents the effect of growth inactivity, structure, weather, and energyintensity on growth in secondary energyuse from 1990 to 1995. The table�s columnsattribute the change in sectoral energy use(shown in column 1 and measured inpetajoules) to four separate effects: activity,structure, weather, and energy intensity. Thistable shows that growth in secondaryenergy use was most influenced by growthin activity levels in each end-use sector.This effect is particularly large inhousehold activity and transport (bothpassenger and freight).
Had only the level of activity changed ineach sector from 1990 to 1995, whilestructure, weather, and energy intensityremained at their 1990 levels, secondaryenergy use would have increased by637 PJ, rather than the actual 518 PJ.
In aggregate, structural shifts withinsectors have increased secondary energyuse since 1990; however, on a sector-specific basis, this effect varied. Thelargest structural effects occurred in theindustrial and freight transportationsectors.
In the industrial sector, the shift in activitytowards more energy-intensive industries(especially smelting and refining andmining) increased energy use by 68 PJ. Infreight transport, the mode shift frommarine and rail to road transport had asimilar effect, increasing energy use by104 PJ. In aggregate, the results show thatstructural shifts in the mix of activity
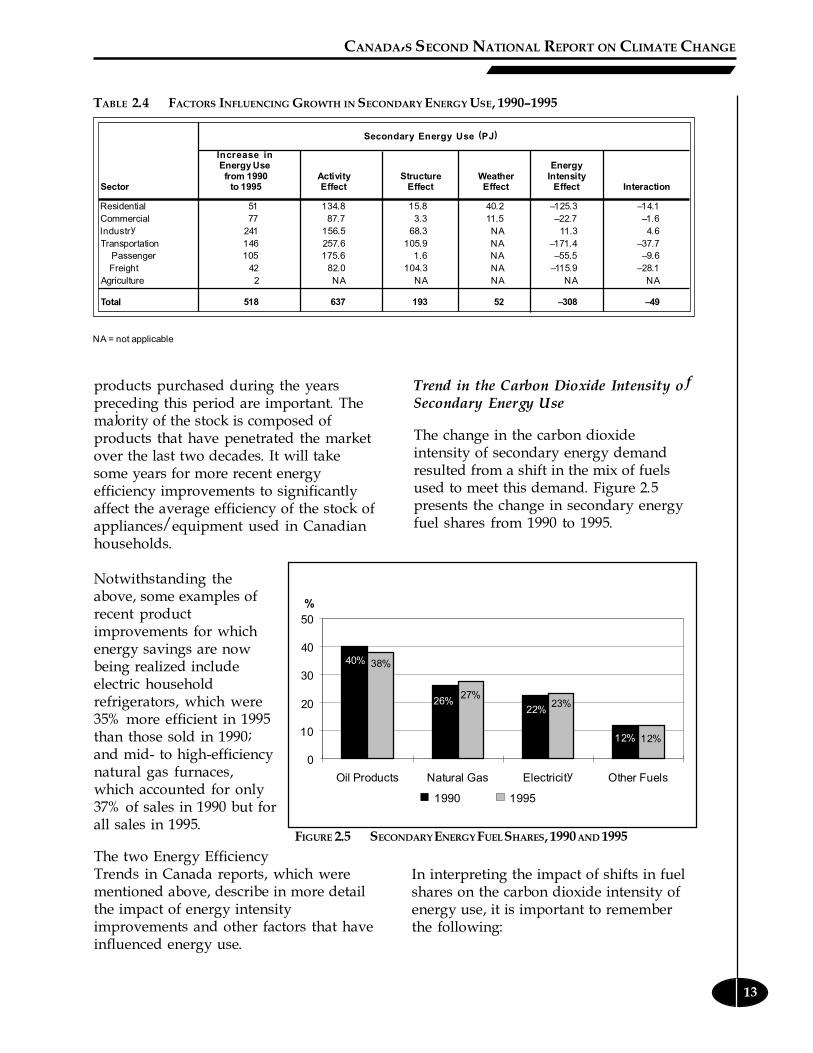
CANADA�S SECOND NATIONAL REPORT ON CLIMATE CHANGE
13
products purchased during the yearspreceding this period are important. Themajority of the stock is composed ofproducts that have penetrated the marketover the last two decades. It will takesome years for more recent energyefficiency improvements to significantlyaffect the average efficiency of the stock ofappliances/equipment used in Canadianhouseholds.
Notwithstanding theabove, some examples ofrecent productimprovements for whichenergy savings are nowbeing realized includeelectric householdrefrigerators, which were35% more efficient in 1995than those sold in 1990;and mid- to high-efficiencynatural gas furnaces,which accounted for only37% of sales in 1990 but forall sales in 1995.
The two Energy EfficiencyTrends in Canada reports, which werementioned above, describe in more detailthe impact of energy intensityimprovements and other factors that haveinfluenced energy use.
Trend in the Carbon Dioxide Intensity ofSecondary Energy Use
The change in the carbon dioxideintensity of secondary energy demandresulted from a shift in the mix of fuelsused to meet this demand. Figure 2.5presents the change in secondary energyfuel shares from 1990 to 1995.
TABLE 2.4 FACTORS INFLUENCING GROWTH IN SECONDARY ENERGY USE, 1990�1995
Secondary Energy Use (PJ)
Increase inEnergy Use Energy from 1990 Activity Structure Weather Intensity
Sector to 1995 Effect Effect Effect Effect Interaction
Residential 51 134.8 15.8 40.2 �125.3 �14.1Commercial 77 87.7 3.3 11.5 �22.7 �1.6Industry 241 156.5 68.3 NA 11.3 4.6Transportation 146 257.6 105.9 NA �171.4 �37.7 Passenger 105 175.6 1.6 NA �55.5 �9.6
Freight 42 82.0 104.3 NA �115.9 �28.1Agriculture 2 NA NA NA NA NA
Total 518 637 193 52 �308 �49
NA = not applicable
40%
26%22%
12% 12%
23%27%
38%
0
10
20
30
40
50
Oil Products Natural Gas Electricity Other Fuels
%
1990 1995
FIGURE 2.5 SECONDARY ENERGY FUEL SHARES, 1990 AND 1995
In interpreting the impact of shifts in fuelshares on the carbon dioxide intensity ofenergy use, it is important to rememberthe following:

CHAPTER 2: NATIONAL CIRCUMSTANCES
14
� The carbon intensities of natural gasand wood waste are lower than thoseof most oil products.
� No carbon dioxide is emitted from theuse of electricity at the end-use level.Thus, a shift from fossil fuels, such asfuel oil or natural gas, to electricitywill result in a reduction in carbondioxide intensity at the end-use level.(However, depending on thegeneration source of electricity, theremay be a corresponding increase inemissions from electricity production.)
� For wood wastes and pulping liquor,emissions are reported as zero, asCanada�s forests are considered to bemanaged in a sustainable manner.Thus, a shift to biomass reducescarbon dioxide intensity at thesecondary level.
From 1990 to 1995, there was a significantincrease in the shares of natural gas and�other fuels.� The share of electricityincreased marginally, while the share ofoil products declined (Figure 2.5).
While the share of electricity increasedonly slightly, this trend hides offsettingchanges in the industrial and residentialsectors. Industry�s share of electricityincreased largely because of thesignificant output growth of thealuminum industry, which is responsiblefor the bulk of the smelting and refiningindustry�s energy use and relies almostsolely on electricity, most of it hydropower. Primary production of aluminumincreased by more than 40% since thebeginning of the 1990s. In the residentialsector, the share of electricity decreased,owing mainly to a shift from electricity tonatural gas to meet water-heating needs.The share of natural gas also increasedbecause of the shift from oil products tonatural gas to meet space-heating needs.
The decline in the share of oil productsreflects a continuing trend that began in
the early 1980s in the residential,commercial, and industrial sectors.However, the above-average growth inenergy used in the transport sector, whichuses mostly oil products, slowed thedecline in the share of oil products at thesecondary level.
The share of other fuels increased from1990 to 1995, especially in industry. This ismainly a result of a shift from oil productsto other fuels in the pulp and papersector. Almost 90% of �other fuels� in theindustrial sector are wood wastes andpulping liquor used in the pulp and paperindustry.
Summary and Conclusions
In conclusion, from 1990 to 1995, carbondioxide emissions from secondary energyuse increased by 5.1%. Increases inemissions were registered in all end-usesectors. While the carbon dioxide intensityof energy use declined, emissionsincreased, because energy use increasesmore than offset this change.
The increase in secondary energy use waslargely driven by activity growth,structural shifts, and weather. Of thesefactors, the increase in activity was themost significant force pushing energy useupward in each sector of the economyover the period.
Although improvements in energyintensity (a proxy for energy efficiency inthis study) mitigated the increase inenergy use and carbon dioxide emissions,other factors more than offset this impact,and secondary energy use continued toincrease over the 1990�1995 period.
However, in the absence of energyintensity declines, secondary energy usewould have increased by 308 PJ morethan it actually did from 1990 to 1995 �energy use would have increased by 12 %rather than 8% from 1990 to 1995.
CANADA�S SECOND NATIONAL REPORT ON CLIMATE CHANGE
15
Carbon dioxide emissions from secondaryenergy use would also have been higherin the absence of the decline in energyintensity. Rather than increase by 5.1%(about 15 Mt) from 1990 to 1995, theseemissions would have risen by 8.6%(about 26 Mt).
Agriculture
Net greenhouse gas emissions fromCanadian agriculture are expected todecrease slightly as a result of theincreased use of a number of economicallyviable practices and measures. The totalarea in cultivation (cropland plus summerfallow in a given year) has remainedrelatively stable: 41 million hectares in1991 versus an estimated 42 millionhectares in 1995 (Agriculture and Agri-Food Canada, 1996).
The major contributions to reductions ingreenhouse gas emissions are projected toarise from the continuation of severalsectoral trends: increased use of no-tillseeding, reduced summer fallowing ofcultivation lands, increased biomassthrough higher rates of fertilizer use,additional land in forage crops,introduction of crop strains with higheryields, improved efficiency in fossil fueluse and greater use of ethanol, andreduced methane emissions from livestockand manure owing to improved feeds andmanagement practices. It should be notedthat the net effect of increased fertilizeruse requires further study: carbon dioxideemissions are reduced by enhanced plantgrowth, but nitrous oxide emissionsincrease. The production of fertilizer,particularly nitrogen fertilizers, requiresenergy and natural gas as a raw material.
Summary
In summary, from the above analysis ofoverall performance indicators, it ispossible to have a better understanding ofthe factors affecting greenhouse gasemissions. This will aid in appropriatepolicy responses. Canada is continuing todevelop databases and analyses so thatlong-term, sustainable solutions can bedeveloped to address greenhouse gasemissions and climate change.
References
Agriculture and Agri-Food Canada(1996). Medium Term Estimates.
NRCan (Natural Resources Canada)(1996). Energy Efficiency Trends inCanada.
NRCan (Natural Resources Canada)(1997). Energy Efficiency Trends inCanada 1990 to 1995.
CANADA�S SECOND NATIONAL REPORT ON CLIMATE CHANGE
17
Under the United Nations FrameworkConvention on Climate Change (FCCC),specifically Article 4(1)(a), Article 12(1)(a),and Decision 3/CP.1, which requiresannual reporting of inventories, nationalcommunications (i.e., national reports)must include an inventory ofanthropogenic (human-induced) emissionsby sources, and removals by sinks, of allgreenhouse gases (GHGs) not controlledby the Montreal Protocol. This chapterprovides a summary of trends in netanthropogenic sources (emissions) of andsinks (removals) for greenhouse gases inCanada, as well as a brief description of themethodologies used to estimate them andthe associated uncertainties.
Greenhouse Gas EmissionEstimates, 1990�1995
Changes to Canada�s 1992 Greenhouse GasInventory
As science identifies trace gases that affectclimate change and methods are developedfor estimating emissions, the emissions areadded to our national inventory. Since1992, the last year in which our inventorywas published, the new gases that havebeen added include sulphur hexafluoride(SF6) (from magnesium manufacture) andhydrofluorocarbons (HFCs) (used forclimate control, solvents, propellants, andfire extinguishers). In addition, moreaccurate estimates of the perfluorocarbons(PFCs) carbon tetrafluoride (CF4) andcarbon hexafluoride (C2F6) (from primaryaluminum smelting) have been made.
Emissions from wastewater treatment andcomposting (sources of methane [CH4]and nitrous oxide [N2O]) have been added,
the former based on the methodologydeveloped by ORTECH International(1994). Environment Canada conducted asurvey on composting in 1993, whichallowed its inclusion in the inventory. AnAgriculture Canada model to calculatecarbon dioxide (CO2) from soils(�Century�) has allowed this source to beincorporated. Studies currently under wayon nitrous oxide from manure and soilsmay reveal additional emissions that needto be accounted for.
Inventoried values for methane emissionshave improved as a result of a number ofnew studies. King (1994) updated themethodology for fugitive emissions fromcoal mines. A Canadian Gas Association(1995) study of emissions from pipelinesallowed the calculation of new �naturalgas distribution� numbers. A soon to bereleased study of methane losses fromnatural gas distribution and transmissionsystems indicates that current emissionestimates may be low. Canada�s landfillmodel has been modified since 1992 toincorporate new regional data, including,most recently, emissions from landfilledwood wastes. Newer agricultural studies,showing lower generation rates of methanefrom farm animals, have changed ourestimate for �livestock/manure�emissions.
The recent introduction in 1996 of anupdated model for determining emissionsfrom mobile sources has improved theoverall accuracy of transportation sectorestimates. It incorporates more recentresearch data from Environment Canadaand the U.S. Environmental ProtectionAgency (EPA) and primarily affectsinventoried values for nitrous oxide. Anew methodology for calculating
CHAPTER 3: Canada�s National Greenhouse GasEmission Inventory

CHAPTER 3: CANADA�S NATIONAL GREENHOUSE GAS EMISSION INVENTORY
18
emissions of nitrous oxide from propellantuse has been incorporated into theinventory as well.
The 1995 Guidelines for NationalGreenhouse Gas Inventories (InventoryGuidelines) of the IntergovernmentalPanel on Climate Change (IPCC, 1995)have also required some adjustments to bemade. International air and marinebunker emissions, formerly included inthe national totals, have been removedfrom the inventory and are now listedunder a separate category. The 1996 IPCCInventory Guidelines, completed only afew months ago, contain a number of newmethodologies. Thus, additional emissionsources may be identified and added tothe Canadian inventory in the near future.
Finally, updates to the 100-year globalwarming potentials (GWPs) (IPCC, 1996)have caused large changes in the effectivecarbon dioxide equivalent emissions ofmethane and nitrous oxide, resulting in asignificantly different greenhouse gasemission total for Canada.
More extensive information on theinventory is provided in the backgrounddocument Trends in Canada�s GreenhouseGas Emissions (1990�1995) and associatedappendices (Jaques et al., 1997). Thisdocument provides detailed sectoralbreakdowns and additional informationon the methodologies and assumptionsused in compiling the emission estimates.For the most part, emission inventorymethodologies utilized are the same as orsimilar to those provided in the 1995 IPCCInventory Guidelines and in some casesinclude methodologies outlined in theRevised 1996 Guidelines for NationalInventories of the Secretariat to the FCCC.
Where methods differ from the IPCCInventory Guidelines, explanations andreferences are provided.
The radiative gases for which emissionestimates have been made are carbondioxide, methane, nitrous oxide, sulphurhexafluoride, carbon tetrafluoride, carbonhexafluoride, and HFCs. A summary ofemission estimates by sector for the period1990�1995 is provided in Table 3.1.A complete inventory in standard IPCCformat, including estimates of �precursorgases,� nitrogen oxides (NOx), non-methane volatile organic compounds(NMVOCs), carbon monoxide (CO), andsulphur dioxide (SO2), is provided in aseparate addendum.
In 1995, Canadians contributed about 619Mt of greenhouse gases to the atmosphere,about 2% of total global emissions. Carbondioxide contributed the largest share,about 81% or 500 Mt, methane the nextlargest share, 12%, followed by nitrousoxide, 5%, perfluorocarbons (PFCs), 1%,and sulphur hexafluoride and HFCs theremainder (Figure 3.1).
Approximately 89% of the total greenhousegas emissions in 1995 were attributable tofossil fuel production, transportation, andconsumption. On a sectoral basis, energyindustries accounted for about 34%,industry (fuel combustion and processemissions) 20%, transportation 27%,residential 10%, commercial andinstitutional 5%, and agricultural sources5% of the total greenhouse gas emissions in1995.

CANADA�S SECOND NATIONAL REPORT ON CLIMATE CHANGE
19
TABLE 3.1 GREENHOUSE GAS EMISSION ESTIMATES IN CANADA BY SECTOR, 1990�1995
Emission Estimates (kt CO 2 equivalent)
Source 1990 1991 1992 1993 1994 1995
Global Warming Potential Multiplier
Industrial ProcessesNatural Gas Distribution 2 200 2 400 2 600 2 800 3 000 3 200Upstream Oil and Gas 31 600 33 000 36 600 38 400 41 100 43 600Cement/Lime Production 7 720 6 570 6 180 6 580 7 220 7 350Undifferentiated Industrial Processes 23 100 25 600 25 100 27 800 27 300 25 700Coal Mining 1 900 2 100 1 800 1 800 1 800 1 700Chemical Production 11 000 11 000 11 000 9 900 12 000 12 000
Subtotal 78 000 80 900 82 500 87 400 92 400 93 400
Fuel Combustion � StationaryPower Generation 94 800 96 100 104 000 93 300 94 800 103 000Industrial 75 700 73 500 71 700 72 900 73 800 77 400
Pulp and Paper and Sawmills 11 500 11 700 11 200 11 000 11 200 10 200Iron and Steel 14 100 15 200 15 600 15 200 14 500 15 000Other Smelting and Refining 3 470 2 880 3 070 3 060 2 960 2 790Cement 3 790 3 330 2 880 2 720 3 090 3 690Petroleum Refining 3 290 3 620 2 950 2 470 2 640 2 070Chemicals 7 830 7 740 7 560 8 160 8 800 7 580
Commercial 24 100 23 900 24 300 26 600 25 300 27 200 Residential 40 800 39 000 38 600 42 900 43 500 42 000 Agriculture 2 480 2 700 5 170 2 950 2 400 2 580 Public Administration 2 060 2 000 2 130 2 150 2 820 2 780 Steam Generation 379 309 256 369 666 656 Producer Consumption 40 300 38 800 41 000 41 800 42 700 44 000 Other 6 850 7 560 9 740 10 200 10 600 11 800 Firewood (Residential)a 760 820 760 750 700 700 Fuel Wood (Industrial) 372 362 372 330 372 489 Spent Pulping Liquors 0 0 0 0 0 0
Subtotal 289 000 285 000 298 000 295 000 298 000 313 000
Fuel Combustion � MobileAutomobiles 56 100 55 100 56 100 59 600 61 600 62 000Light-Duty Gasoline Trucks 23 000 23 000 24 800 24 600 26 100 26 900Heavy-Duty Gasoline Trucks 2 370 2 250 2 280 2 170 2 140 2 050Motorcycles 179 177 182 184 189 187Off-Road Gasoline 5 380 4 610 4 000 3 840 3 940 3 960Light-Duty Diesel Automobiles 839 841 856 861 892 898Light-Duty Diesel Trucks 952 904 928 941 1 020 1 090Heavy-Duty Diesel Vehicles 24 300 23 500 24 100 25 400 27 800 29 900Off-Road Diesel 11 500 10 300 9 610 10 800 12 400 13 900Air 10 600 9 570 9 720 9 030 10 100 10 800Rail 6 610 6 130 6 410 6 380 6 610 5 980Marine 5 990 6 440 6 390 5 550 5 850 5 600Other 1 680 1 870 1 890 2 090 2 290 2 360
Subtotal 149 000 144 000 147 000 151 000 161 000 165 000
IncinerationMunicipal Solid Waste 749 759 770 777 786 796
Subtotal 749 759 770 777 786 796
AgricultureLivestock/Manure 19 000 19 000 19 000 20 000 20 000 21 000Fertilizer Use 3 300 3 400 3 700 4 000 4 100 4 100Soils (Net Source) 7 090 5 820 5 000 3 940 3 490 2 480
Subtotal 29 400 28 200 27 700 27 900 27 600 27 600
MiscellaneousPrescribed Burninga 1 160 1 480 1 160 1 050 400 400Wastewater/Compost 361 361 371 381 391 411Landfills 17 000 17 000 17 000 18 000 18 000 18 000Anaesthetics/Propellants 420 420 430 440 440 470HFCs in Refrigeration/
Air Conditioning/Foam 0 0 0 0 0 500
Subtotal 18 800 18 900 19 800 19 800 19 600 20 100
National Totals a 567 000 559 000 575 000 581 000 599 000 619 000
Note: Individual values may not add up to totals owing to rounding.a National totals do not include carbon dioxide from the combustion of biomass.
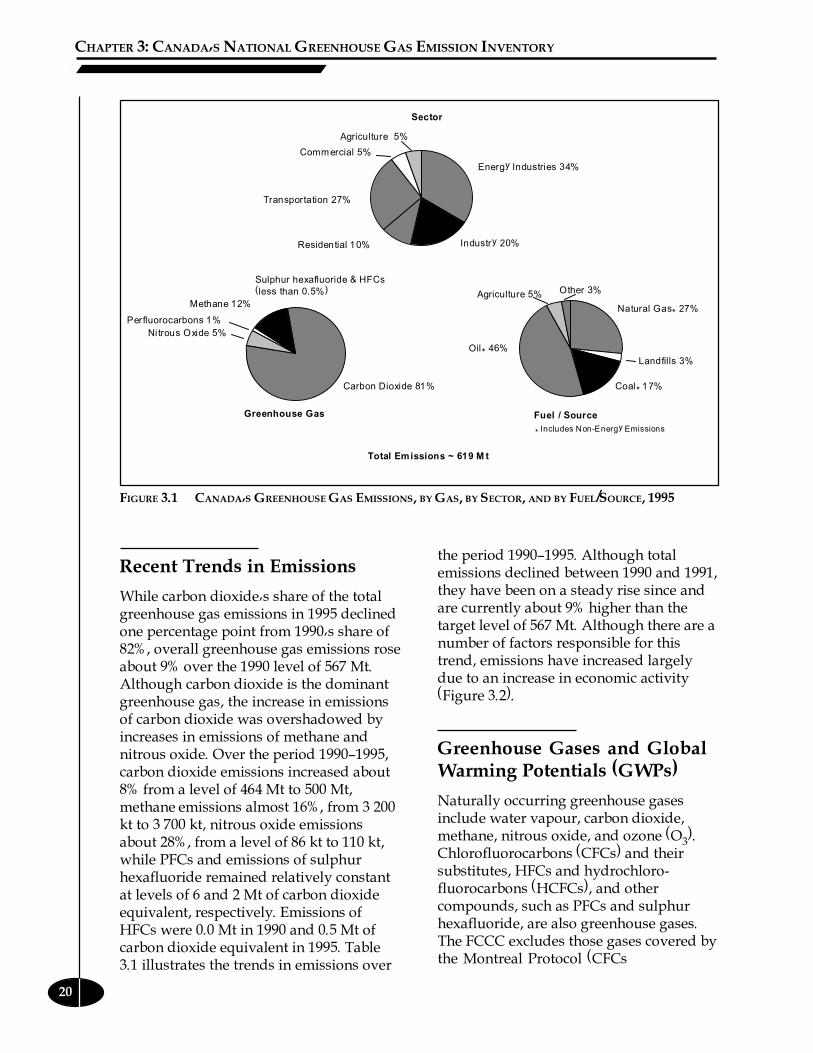
CHAPTER 3: CANADA�S NATIONAL GREENHOUSE GAS EMISSION INVENTORY
20
Recent Trends in Emissions
While carbon dioxide�s share of the totalgreenhouse gas emissions in 1995 declinedone percentage point from 1990�s share of82%, overall greenhouse gas emissions roseabout 9% over the 1990 level of 567 Mt.Although carbon dioxide is the dominantgreenhouse gas, the increase in emissionsof carbon dioxide was overshadowed byincreases in emissions of methane andnitrous oxide. Over the period 1990�1995,carbon dioxide emissions increased about8% from a level of 464 Mt to 500 Mt,methane emissions almost 16%, from 3 200kt to 3 700 kt, nitrous oxide emissionsabout 28%, from a level of 86 kt to 110 kt,while PFCs and emissions of sulphurhexafluoride remained relatively constantat levels of 6 and 2 Mt of carbon dioxideequivalent, respectively. Emissions ofHFCs were 0.0 Mt in 1990 and 0.5 Mt ofcarbon dioxide equivalent in 1995. Table3.1 illustrates the trends in emissions over
the period 1990�1995. Although totalemissions declined between 1990 and 1991,they have been on a steady rise since andare currently about 9% higher than thetarget level of 567 Mt. Although there are anumber of factors responsible for thistrend, emissions have increased largelydue to an increase in economic activity(Figure 3.2).
Greenhouse Gases and GlobalWarming Potentials (GWPs)
Naturally occurring greenhouse gasesinclude water vapour, carbon dioxide,methane, nitrous oxide, and ozone (O3).Chlorofluorocarbons (CFCs) and theirsubstitutes, HFCs and hydrochloro-fluorocarbons (HCFCs), and othercompounds, such as PFCs and sulphurhexafluoride, are also greenhouse gases.The FCCC excludes those gases covered bythe Montreal Protocol (CFCs
FIGURE 3.1 CANADA�S GREENHOUSE GAS EMISSIONS, BY GAS, BY SECTOR, AND BY FUEL/SOURCE, 1995
Total Emissions ~ 619 Mt
Sector
Agriculture 5%
Oil* 46%
Other 3%
Natural Gas* 27%
Landfills 3%
Coal* 17%
Fuel / Source
Agriculture 5%
Commercial 5%
Transportation 27%
Residential 10% Industry 20%
Energy Industries 34%
* Includes Non-Energy Emissions
Carbon Dioxide 81%
Sulphur hexafluoride & HFCs
(less than 0.5%)
Methane 12%
Nitrous Oxide 5%
Greenhouse Gas
Perfluorocarbons 1%

CANADA�S SECOND NATIONAL REPORT ON CLIMATE CHANGE
21
and their substitutes). However, otherphotochemically important gases, such ascarbon monoxide, oxides of nitrogen, andNMVOCs, although not direct greenhousegases, do contribute indirectly to thegreenhouse effect by creating troposphericozone and, as such, are included underthe FCCC. Direct effects occur when thegas itself is a greenhouse gas, whereasindirect radiative forcing occurs whenchemical transformation of the originalgas produces a gas or gases that aregreenhouse gases, or when a gasinfluences the atmospheric lifetimes ofother gases.
The concept of GWP has been developedto allow scientists and policy-makers tocompare the ability of each greenhouse gasto trap heat in the atmosphere relative toanother gas. By definition, a GWP is thetime-integrated change in radiative forcingdue to the instantaneous release of 1 kg ofa trace gas expressed relative to theradiative forcing from the release of 1 kg ofcarbon dioxide. In other words, a GWP is arelative measure of the warming effect thatthe emission of a radiative gas might haveon the surface troposphere. The GWP of a
greenhouse gas takes into account boththe instantaneous radiative forcing due toan incremental concentration increaseand the lifetime of the gas. Although anytime period can be chosen for comparison,the 100-year GWPs recommended by theIPCC are used in this report (IPCC, 1996)(Table 3.2).
Structure of the Inventory
Canada�s national greenhouse gasemission inventory has been structured tomatch the reporting requirements of theIPCC and has been divided into six majorcategories: Energy, Industrial Processes,Agriculture, Land-Use Change & Forestry,Waste, and Solvents & Other Products(Figure 3.3). Each of these categories isfurther subdivided within the inventory �for example, energy into fuel combustionand fugitive fuel-related emissions, andindustrial processes into non-combustion-related emissions from the production,processing, and use of various mineral,chemical, metal, and non-energy products� and care has been taken to ensure thatno double-counting of emissions has takenplace between or within categories. For
19.0
19.5
20.0
20.5
21.0
1990 1991 1992 1993 1994 1995
530
580
630
t of GHG per capita GDP ($billion)
Emissions per capita ------- Gross domestic product
FIGURE 3.2 TRENDS IN PER CAPITA CARBON DIOXIDE EMISSIONS AND GROSS DOMESTIC PRODUCT, 1990�1995

CHAPTER 3: CANADA�S NATIONAL GREENHOUSE GAS EMISSION INVENTORY
22
TABLE 3.2 GLOBAL WARMING POTENTIALS OF VARIOUS GREENHOUSE GASES
GWP
Chemical Lifetime (Time Horizon in Years)
Species Formula (Years) 20 100 500
CO2
CO2
Variable 1 1 1
Methane CH4
12±3 56 21 6.5
Nitrous Oxide N2O 120 280 310 170
HFC-23 CHF3
264 9 100 11 700 9 800
HFC-32 CH2F
25.6 2 100 650 200
HFC-125 C2HF
532.6 4 600 2 800 920
HFC-134a CH2FCF
314.6 3 400 1 300 420
HFC-152a C2H
4F
21.5 460 140 42
HFC-143a C2H
3F
348.3 5 000 3 800 1 400
HFC-227ea C3HF
736.5 4 300 2 900 950
Sulphur Hexafluoride SF6
3 200 16 300 23 900 34 900
Perfluoromethane CF4
50 000 4 400 6 500 10 000
Perfluoroethane C2F
610 000 6 200 9 200 14 000
Note: Global warming potential referenced to the updated decay response for the Bern carbon cycle model and future CO2 atmosphericconcentrations held constant at current levels.
Source: IPCC (1996).
0
100
200
300
400
500
600
Ene
rgy
Indu
stria
lP
roce
sses
Sol
vent
s
Agr
icul
ture
For
estr
y
Wa
ste
Assumes No Net Emissions of CO2
Mt of CO2 equivalent
Total Emissions ~ 619 Mt
HFCs
Sulphur HexafluoridePFCs
Nitrous Oxide
MethaneCarbon Dioxide
FIGURE 3.3 CANADA�S NATIONAL GREENHOUSE GAS EMISSION INVENTORY, 1995

CANADA�S SECOND NATIONAL REPORT ON CLIMATE CHANGE
23
purposes of discussion here and forsimplification, emission sources aredivided into two general categories:energy and non-energy.
Energy Sources
Emissions from energy activities, asdefined by the IPCC Inventory Guidelines(IPCC, 1995), include total emissions of allgreenhouse gases from all combustionactivities1 as well as all fugitive fuel-related emissions. For combustion-relatedemissions, a methodology upon which theIPCC Reference Approach is based wasused. Carbon dioxide emissions wereestimated in a top-down2 format bymultiplying emission factors3 specific tothe fuels used in Canada by the quantitiesof fuels consumed in various sectors of theeconomy. Emissions of methane andnitrous oxide from combustion activitieswere estimated in a similar fashion, usingemission rates derived from source testmeasurements reported in the IPCCInventory Guidelines (IPCC, 1995) andfrom a number of studies conducted inthe United States and Canada (U.S. EPA,1985; DeSoete, 1989; Ballantyne et al.,1994).
Fugitive emissions associated with theproduction, processing, transmission, anddistribution of fossil fuels were estimatedbased on emission rates specific toCanada and are described in more detailin the published national inventory(Jaques et al., 1997). Specific studies were
undertaken in Canada that examinedgreenhouse gas emissions from theupstream oil and gas sector, coal mining,oil sands mining, and natural gasdistribution (Picard et al., 1992; Augstenet al., 1994; CGA, 1995). Although theresults of these studies indicated thatemissions from all sources were wellwithin the bounds of the emission ratesprovided in the IPCC guidelines, they alsoserved to illustrate the importance ofusing country-specific information whenand where it is available, especially incases where reported emission rates coverextremely wide ranges. Aggregatedemission rates, activity data, andassociated emissions have beensummarized and are provided in aseparate addendum in the standard IPCCreporting format.
A summary of emissions from energy-related sources, by gas and by sector forthe period 1990�1995, is shown in Table3.3.
Bunkers
Emissions from bunker fuels (fuels notconsumed in the country of origin) havebeen excluded from the nationalinventory (as per IPCC guidelines) andare reported here separately. The emissionestimates are based on reported fuel salesto air and marine vessels of foreignregistration and include emissions fromthe three main greenhouse gases (i.e.,carbon dioxide, methane, and nitrousoxide) (Table 3.4).
1 Carbon dioxide emissions from the combustion of biomass fuels are not included in totals from theenergy sector.
2 Top-down and bottom-up are terms used to describe the level of detail within an inventory. Here,bottom-up is defined to include point or establishment-level discrete sources, whereas top-downusually refers to a sectoral level of detail.
3 Emission factors can be defined as the rate at which a pollutant is released to the atmosphere as aresult of some process activity or unit throughput and, for carbon dioxide, are mass balance derivedand based on the carbon contents of the fuels and the quantity of the carbon in the fuel oxidizedupon combustion (generally 99%).

CHAPTER 3: CANADA�S NATIONAL GREENHOUSE GAS EMISSION INVENTORY
24
TABLE 3.3 CANADA�S GREENHOUSE GAS EMISSIONS FROM ENERGY SOURCES, 1990�1995
1990 1991 1992 1993 1994 1995
CO2 (thousand kt)Stationary Combustion
Power and Steam Generation 94 500 95 700 103 000 93 000 94 800 103 000 Industrial 75 300 73 100 71 300 72 500 73 400 77 000 Residential and Agricultural 43 200 41 600 43 700 45 700 45 800 44 500 Commercial 26 000 25 800 26 300 28 600 28 100 29 900 Refined Petroleum Products 345 429 629 609 641 649 Producer Consumption 40 300 38 800 41 000 41 800 42 700 44 000 Pipelines 6 670 7 9 550 10 000 10 400 11 600
Mobile Fuel Combustion 140 000 134 000 136 000 139 000 147 000 150 000
Total CO 2 426 000 417 000 431 000 431 000 443 000 461 000
CH4 (kt)Stationary Combustion
Power and Steam Generation 1 0.8 0.8 0.7 0.7 0.8Industrial 2 1.6 2.7 1.6 1.7 1.7Residential and Agricultural 2 1.6 1.4 1.7 1.7 1.5Commercial 1 0.5 0.5 0.5 0.5 0.6Other 0 0.2 0.0 0.1 0.2 0.2Producer Consumption 1 1.0 0.0 1.1 1.2 1.2Prescribed Fires 38 48 37 34 13 13Wood/Wood Waste 19 20 18 18 17 18Upstream Oil 1 200 1 200 1 300 1 400 1 500 1 600Gas Transmission 110 110 130 130 140 150Coal Mining 91 99 87 87 84 82
Mobile Fuel Combustion 23 21.0 20.0 20.0 20.0 20.0
Total CH4 1 500 1 500 1 600 1 700 1 800 1 900
Total CH4 (kt CO2 eq.) 30 000 32 000 34 000 35 000 37 000 39 000
N2O (kt)Stationary Combustion
Power and Steam Generation 2 2 2 2 2 3Industrial 1 1 1 1 1 1Residential and Agricultural 0 0 0 0 0 0Commercial 0 0 0 0 0 0Producer Consumption 0 0 0 0 0 0Other 1 1 1 1 1 1Prescribed Fires 1 2 1 1 0 0Wood/Wood Waste 2 3 2 2 2 3
Mobile Fuel Combustion 29 31 35 40 45 48
Total N2O 37 40 43 48 52 56
Total N2O (kt CO2 eq.) 11 000 12 000 14 000 15 000 16 000 17 000
Sum: Energy GHGs (kt CO 2 eq.) 468 000 461000 479 000 481 000 496 000 517 000
Sum: Energy and Non-Energy a 567 000 559 000 575 000 581 000 599 000 619 000
Change from1990 �1% 1% 2% 6% 9%
a See Table 3.5.
Non-Energy Sources
In 1995, emissions associated with non-energy4 activities were estimated to beabout 102 Mt, or about 16.5% of the total.As a category, they can be defined as total
emissions of all greenhouse gases fromindustrial processes, agriculture, forestry,and waste management processes, wheregreenhouse gases are a by-product of thevarious production processes, and excludegreenhouse gas emissions from the
4 Non-energy emission sources also include emissions associated with the use of fossil fuels asfeedstocks, as reported in Canada�s �Energy Statistics Handbook� (Statistics Canada, 1990�1995),including emissions associated with the production and use of chemicals, lubricants, and variousproducts used in the production of commodities such as steel and aluminum. However, if the fossilfuels used as feedstock are excluded from this category, the non-energy emissions are reducedsubstantially, representing about 12% of the total greenhouse gas emissions.

CANADA�S SECOND NATIONAL REPORT ON CLIMATE CHANGE
25
TABLE 3.4 EMISSIONS FROM BUNKER FUEL USE INCANADA, 1990�1995
Emissions (kt CO 2 equivalent)
Bunker 1990 1991 1992 1993 1994 1995
Aviation 2 949 2 536 2 773 2 506 2 536 2 681Marine 2 164 2 248 2 039 1 934 2 175 2 133
combustion of fuels for energy purposes.The sources that contribute to the non-energy sector are shown in Table 3.5.
Industrial Processes
Cement and lime production
Carbon dioxide is emitted during theprocess of cement manufacture and limeproduction. These sources togetheraccounted for about 8% of the total non-
energy greenhouse gas emissions in 1995.Carbon dioxide is produced during theproduction of clinker, an intermediateproduct from which cement is made,whereas calcined limestone (or quicklime)is formed by heating limestone todecompose the carbonates. As withcement production, this is usually done athigh temperatures in a rotary kiln, andthe process releases carbon dioxide.
Limestone and soda ash consumption
Limestone is used in a number ofindustries. In addition to its consumptionin the production of cement and lime forresale, two other processes requiring thematerial are metallurgical smelting andglass making. As these industries
TABLE 3.5 CANADA�S GREENHOUSE GAS EMISSIONS FROM NON-ENERGY SOURCES, 1990�1995
1990 1991 1992 1993 1994 1995
CO2 (kt)Lime Production 1 850 1 880 1 880 1 880 1 930 1 990Cement Production 5 870 4 690 4 300 4 700 5 290 5 360Raw Limestone Consumption 371 362 389 235 216 216Soda Ash Consumption 68 56 64 64 64 64Soils 7 090 5 820 5 000 3 940 3 490 2 480Municipal Solid Waste Incineration 691 700 710 720 728 737Undifferentiated Non-Energy Petroleum Uses 21 200 23 200 24 000 26 500 27 700 27 800
Total CO 2 37 200 36 700 36 300 38 000 39 400 38 600
CH4 (kt)Landfills 821 812 826 845 855 869Animals 646 650 641 671 701 725Manure 246 248 247 257 263 271Wastewater Treatment 17 17 17 17 18 18Composting 0 0 1 1 1 2Municipal Solid Waste Incineration 1 1 1 1 1 1
Total CH4 1 730 1 730 1 730 1 790 1 840 1 880
Total CH4 (kt CO2 eq.) 36 300 36 300 36 400 37 600 38 600 39 600
N2O (kt)Anaesthetics & Propellants (Non-HFC) 1 1 1 1 1 1Municipal Solid Waste Incineration 0 0 0 0 0 0Wastewater Treatment 0 0 0 0 0 0Nitric Acid Production 3 2 3 3 2 3Adipic Acid Production 35 32 32 29 35 35Fertilizer Use 11 11 12 13 13 13
Total N2O 49 47 48 46 53 52
Total N2O (kt CO2 eq.) 15 300 14 600 14 900 14 300 16 400 16 100
CF4 (kt) 1 1 1 1 1 1
C2F
6 (kt) 0.08 0.08 0.08 0.09 0.08 0.07
SF6 (kt) 0.1 0.1 0.1 0.1 0.1 0.1
HFC � all uses (kt CO2 eq.) 0 0 0 0 0 500
Total Other Gases (kt CO 2 eq.) 9 000 10 000 9 000 10 000 9 000 9 000
Sum: Non-Energy GHGs (kt CO 2 eq.) 97 700 97 600 96 600 100 000 103 400 102 300

CHAPTER 3: CANADA�S NATIONAL GREENHOUSE GAS EMISSION INVENTORY
26
utilize limestone at high temperature, thelimestone is calcined to lime, producingcarbon dioxide by the same reaction asdescribed above. Carbon dioxideemissions are associated with the use ofsoda ash in industries such as chemicaland glass manufacturing. In Canada,soda ash is used in the glass industry�shigh-temperature production processes.Carbon dioxide is emitted as the soda ashdecomposes in the glass furnace. In 1995,emissions attributable to the use oflimestone and soda ash contributed lessthan 0.5% of the total non-energyemissions and have remained relativelystable over the last few years.
Non-energy uses � Undifferentiated
A number of petroleum-based products,considered non-energy uses or by-products from combustion, sequestercarbon and should not be considered asemission sources of carbon dioxide. Theseinclude plastics, rubber, asphalt, bitumen,and formaldehyde (Okken and Kram,1990). On the other hand, there are anumber of non-energy sources that releasecarbon relatively quickly, includingnaphthas, lubricants, liquefied petroleumgases (LPGs) and natural gas used asfeedstocks (e.g., ammonia [NH3]production and carbon black), and cokeand coals.
Emissions were estimated for theseproducts using the following assumptionsabout the percentage of carbon notsequestered in the product: forpetrochemical feedstocks, LPGs, andnaphthas, 20%; for lubricants, 50%; andfor non-energy uses of natural gas, 67%.For coals, coke, and coke oven gases usedfor non-energy purposes, it has beenassumed that 100% of the carbon isemitted. Total emissions from non-energyuses of these feedstocks and substances,including emissions associated withammonia and aluminum production,were estimated to be about 13.6 Mt in
1990 and 16.7 Mt in 1995, an increase ofabout 27%.
Nitric acid manufacturing
Nitric acid (HNO3) is an intermediateproduct formed during the manufactureof nitrogen fertilizers. During itsproduction from ammonia, a largeamount of nitrous oxide is emitted. Overthe period 1990�1995, emissions from thissource remained relatively constant atabout 780 kt of carbon dioxide equivalent.
Adipic acid production
A major technology change in Dupont�smanufacturing process will reduce theemission rate of nitrous oxide from theadipic acid production process by 95%.The projected phase-in period for thisnew technology, between 1997 and 2000,was obtained from the sole producer, andthis initiative represents an emissionreduction in the non-energy sector ofabout 10 Mt, or about 11% of total non-energy-related emissions.
Primary aluminum industry (source of CF4 andC2F6)
Primary aluminum is produced in twosteps. First, bauxite ore is ground,purified, and calcined to producealumina, which is imported by Canada.Following this, the alumina is electricallyreduced to aluminum by smelting in largepots. Three greenhouse gases � carbondioxide, carbon tetrafluoride orperfluoromethane, and carbonhexafluoride or perfluoroethane � areknown to be emitted during the reductionprocess. In 1995, these by-productemissions were responsible for about 6 Mtof (carbon dioxide equivalent) greenhousegas emissions. This figure representsapproximately 7% of total non-energyemissions. The Canadian industry iscurrently in the process of upgrading andimproving its technology. This willgradually reduce the emission rate.
CANADA�S SECOND NATIONAL REPORT ON CLIMATE CHANGE
27
Technology penetration rates werededuced from statements made by Alcanand the Association de l�Industrie del�Aluminium de Québec (UnisearchAssociates, 1994).
Magnesium production (source of SF6)
Sulphur hexafluoride is used as a covergas in the manufacture of magnesium andis emitted. Emissions are based on thequantities of sulphur hexafluoridereported consumed by the magnesiumindustry.
Forestry and Land-Use Change
Although it is not possible to reportCanada�s net greenhouse gas emissionsfrom the forestry sector in a fashion thatfits the IPCC inventory framework, it isimportant to provide some information onthe results of the work that has takenplace, which are currently being used todevelop forest sector indicators inCanada. Canada has a total land area of997 million hectares, of which the totalforest area is about 418 million hectares.Of the total forested area, approximately82% is in the boreal forest zone and 18%in the temperate zone (Vineberg andBoyle, 1991).
Statistics for the mid-1970s to the mid-1980s indicate that the change in forestedarea due to changes in land use wasnegligible. Canadian forests coverapproximately 50% of Canada�s landsurface and represent 10% of the Earth�sforested area. Analysis of the carbonbudget for all Canadian forests is not yetcomplete; however, results for variousforest zones, including the boreal and sub-Arctic forests, which represent about 75%of Canada�s forest area, are available.Estimates of the carbon currently stored inCanadian forests and changes in thecarbon budget for the boreal and sub-Arctic zones over the period 1920�1990have been developed by Kurz and Apps
(Apps and Kurz, 1991; Kurz et al., 1991)and are reported here. Year-to-year trendsfor the period 1990�1994 are not yetavailable.
In Canada, the amount of carbon storedin all Canadian forests is estimated to beapproximately 221 Gt. This includes 14.5Gt in standing vegetation biomass (trunks,branches, roots, etc.), 70.6 Gt in forestsoils, 135 Gt in peatland soils, andapproximately 0.6 Gt in forest products.Forest products (i.e., lumber, furniture,etc.) represent the total carbonaccumulated from forest harvesting overthe last 40 years; although it is a smallcarbon pool relative to the other forestcarbon pools (0.3% of the total), it isimportant in terms of the annual flux, ormovement of carbon between pools.
Agriculture
Emissions from all anthropogenicactivities within the agriculture sector,excluding fuel combustion, are covered inthis section. Ongoing research suggeststhat in 1995, emissions from theagriculture sector, as defined by the IPCCwere about 5% of the total greenhouse gasemissions in Canada. However, ongoingresearch suggests that emissions may behigher. Nitrous oxide was the primarygreenhouse gas in 1991, accounting for45% of the total agriculture sectoremissions, followed by methane (30%)and carbon dioxide (25%). The majorsources of emissions were direct soilemissions, enteric fermentation, and soiloxidation.
Carbon dioxide from agricultural soils
In order to develop an estimate of carbondioxide emissions that adequately reflectsthe diverse and myriad complexities thataffect carbon fluxes in agricultural soils, acomputer modelling approach (theCentury model) was used. This modelcontains inputs for multiple soil organic
CHAPTER 3: CANADA�S NATIONAL GREENHOUSE GAS EMISSION INVENTORY
28
matter compartments, estimatesdecomposition rates that vary as afunction of soil temperature andprecipitation, and provides data for bothcarbon and nitrogen flows (Smith et al.,1997). Carbon loss from agricultural soilsis approaching zero (equilibrium), andsoils may become a small sink by the year2000.
Methane production from herbivores
Methane is produced by herbivores as aby-product of enteric fermentation, adigestive process by which carbohydratesare broken down by microorganisms intosimple molecules for absorption into thebloodstream. This process results inmethanogenesis in the rumen, and themethane is emitted by eructation andexhalation. Some methane is released laterin the digestive process by flatulation.Animal eructation and manure methaneemissions are directly proportional toanimal populations. Emission estimateshave been made based on animalpopulations and emission rates that reflectconditions in Canada.
Fertilizer use
Nitrous oxide can be released from soilsunder either anaerobic or aerobicconditions. Liberation of nitrous oxidefrom soils is associated with the oxidationof mineral nitrogen. When either organicor inorganic nitrogen fertilizers areapplied, most of the nitrogen is oxidizedto nitrates before it is taken up by theplants. This oxidation process is known asnitrification. Emissions from the use offertilizers increased about 18% over theperiod 1990�1995.
Waste
This section discusses emissions from allsources of waste, including landfills,
incineration, wastewater treatment, andcomposting. Carbon dioxide emissionsattributable to biomass are not included inthis section, as in theory there may be nonet emissions if the biomass is sustainablyproduced.
Municipal solid waste incineration andwastewater treatment
Several municipalities in Canada utilizesolid waste incinerators to reduce thequantities of waste sent to landfills andthe impact of toxics on the environment.Typical municipal solid waste incineratorsare either refractory-lined or water-walledwith a grate on which refuse is burned.The details of the emission factorderivation are contained in a previouspublication (Jaques, 1992). Carbondioxide emissions are influenced mainlyby the carbon content of the waste,whereas methane and nitrous oxideemissions are affected more by the type ofincinerator and any emission controltechnologies that may be installed. Datawere obtained on the quantities of wastegenerated, the percentage derived fromorganic matter, and the quantitiesincinerated. The IPCC methodology hasbeen followed, in that emissions of carbondioxide exclude emissions from organicwaste combustion but include emissionsderived from fossil-fuel-based products.
Methane is produced in domesticwastewater when the organic materialthat is present is allowed to decompose inan anaerobic environment. Nitrous oxidecan also be produced in wastewaterthrough the microbial denitrification ofthe organic matter present. Themethodology utilized, although similar tothat outlined by the IPCC, has beenderived for conditions specific to Canada.
Landfills
Landfill gas, which is composed mainly ofmethane and carbon dioxide, is produced

CANADA�S SECOND NATIONAL REPORT ON CLIMATE CHANGE
29
by anaerobic decomposition of organicdegradable wastes. This process beginsafter the waste has been in the landfill for10�50 days. Although the majority ofmethane and carbon dioxide is generatedwithin 20 years of landfilling, emissionscan continue for 100 years or more.Methane emissions from landfills inCanada were estimated using the U.S.EPA landfill gas generation (SchollCanyon) model and data on the quantityof refuse deposited each year in Canadianlandfills over the past 50 years.
Landfills are a significant source ofmethane emissions in Canada andaccount for about 18% of current non-energy greenhouse gas emissions. Inkeeping with the IPCC methodology,emissions of carbon dioxide from organicwaste decomposition in landfills wereexcluded from the inventory.
Composting
Emissions from composting are arelatively small component of theinventory and represent, along with woodwaste landfills, a new source to Canada�sinventory. Anaerobic decomposition offood and yard waste from compostingresults in the formation of methane.Emission estimates were derived based onthe quantities of waste diverted fromlandfills and an emission rate of 7.2 kg ofmethane per tonne of waste composted(Proctor & Redfern Limited and OrtechCorporation, 1993).
Solvents and Other Products
Nitrous oxide is used in medicalapplications, primarily as a carrier gas.Although it has anaesthetic and analgesicproperties, nitrous oxide is primarily usedin carrier gases with oxygen to administermore potent inhalation anaesthetics forgeneral anaesthesia. It is also used as ananaesthetic in various dental and
veterinary applications. Nitrous oxide isused as a propellant for pressure andaerosol products, primarily in the foodindustry. It is often used in conjunctionwith carbon dioxide, as it helps toneutralize the acidic taste imparted by thecarbon dioxide. In addition, it stabilizesthe product so that it is not ejected as athin stream.
Uncertainties
Of particular concern with emissioninventories is their accuracy. Althoughthere are many causes of uncertainties,most are due to the following:
� differences in the interpretation ofsource and sink category definitions,assumptions, units, etc.;
� inadequate and incorrectsocioeconomic activity data used todevelop the emission estimates;
� inappropriate application of emissionfactors to situations and conditions forwhich they do not apply; and
� actual empirical uncertainty ofmeasured emission data and the basicprocesses leading to emissions.
Use of the mean and standard deviationof the normal distribution of sectoralexpert estimates (obtained from industryexperts across Canada) for each sectorand then for each case permitted theaddition of sectoral emissions to developthe overall uncertainty. A full discussionof the methodology can be found inMcCann et al. (1994). Overalluncertainties for the three maingreenhouse gases were developed basedon a stochastic model and are estimatedto be about 4% for carbon dioxide, 30%for methane, and 40% for nitrous oxide. Itshould be noted that individual sector

CHAPTER 3: CANADA�S NATIONAL GREENHOUSE GAS EMISSION INVENTORY
30
uncertainties can be even greater.Nevertheless, the overall uncertaintiesassociated with the carbon dioxideemission estimates, which dominate thegreenhouse gas inventory, are consideredextremely low.
References
Apps, M.J. and W.A. Kurz (1991). Therole of Canadian forests and forestsector activities in the global carbonbalance. World Resources Review, 3(4):333�343.
Augsten, R., K.C. Cheng, and K.K. Feng(1994). Methane Content Versus Depthfor Greenhills Seams at Fording RiverMine. Canadian Explosives ResearchLaboratory.
Ballantyne, V.F., P. Howes, and L.Stephenson (1994). Nitrous OxideEmissions from Light Duty Vehicles.Society of Automotive EngineersTechnical Paper Series 940304.
Canadian Gas Association (1995). 1990Air Emissions Inventory for theNatural Gas Industry of GreenhouseGas Emissions.
DeSoete, G. (1989). Updated Evaluationof Nitrous Oxide Emissions fromIndustrial Fossil Fuel Combustion.Draft Final Report prepared for theEuropean Atomic Energy Community,Institut français du petrole, Ref. 37-559.
IPCC (Intergovernmental Panel onClimate Change) (1995). Guidelines forNational Greenhouse Gas Inventories,Volume 3.
IPCC (Intergovernmental Panel onClimate Change) (1996). ClimateChange 1995, The Science of ClimateChange � Contribution of WorkingGroup 1 to the Second AssessmentReport of the Intergovernmental Panelon Climate Change.
IPCC (Intergovernmental Panel onClimate Change) Guidelines forNational Greenhouse Gas Inventories,Revised, December 1996.
Jaques, A.P. (1992). Canada�s GreenhouseGas Emissions: Estimates for 1990.Report EPS 5/AP/4, EnvironmentCanada.
Jaques, A., F. Neitzert, and P. Boileau(1997). Trends in Canada�s GreenhouseGas Emissions (1990�1995) (in press).
King, B. (1994). Management of MethaneEmissions from Coal Mines:Environmental, Engineering, Economicand Institutional Implications ofOptions. Neil and Gunter Ltd.,Dartmouth, Nova Scotia.
Kurz, W.A., M.J. Apps, S.J. Beukema, andT. Lekstrum (1991). 20th centurycarbon budget of Canadian forests.Tellus, 47B: 170�177.
McCann, T. & Associates (1994).Uncertainties in Canada�s 1990Greenhouse Gas Emission Estimates, AQuantitative Assessment. March.
Okken, P.A. and T. Kram (1990).Calculation of Actual CO2 Emissionsfrom Fossil Fuels. Paper presented atIntergovernmental Panel on ClimateChange Preparatory Workshop, Paris,February.

CANADA�S SECOND NATIONAL REPORT ON CLIMATE CHANGE
31
ORTECH International (1994). InventoryMethods Manual for EstimatingCanadian Emissions of GreenhouseGases. Report to Greenhouse Gas DataDivision, Environment Canada,Ottawa, Ontario.
Picard, D.J., B.D. Ross, and D.W.H. Koon(1992). A Detailed Inventory ofMethane and VOC Emissions fromUpstream Oil and Gas Operations inAlberta, Volumes 1, 2, and 3. Preparedfor the Canadian PetroleumAssociation, Calgary, Alberta, March.
Proctor & Redfern Limited and OrtechCorporation (1993). Estimation of theEffects of Various Municipal WasteManagement Strategies on GreenhouseGas Emissions. Part II of Final DraftReport prepared for EnvironmentCanada and Energy, Mines andResources Canada, November.
Smith, W.N., P. Rochette, C. Monreal,R.L. Desjardins, E. Pattey, and A.Jaques (1997). The rate of carbonchange in agricultural soils in Canadaat the landscape level. CanadianJournal of Soil Science (in press).
Statistics Canada (1990�1995). EnergyStatistics Handbook. CatalogueNo. 57-601.
Unisearch Associates (1994).Measurements of CF4 and C2F6 in theEmissions from Canadian AluminumSmelters by Tunable Diode AbsorptionLaser Spectroscopy. Report to theCanadian Aluminum Association,April, and presentation to thePerfluorocarbon (PFC) Workshop,London, March 9�11.
U.S. EPA (Environmental ProtectionAgency) (1985). Compilation of AirPollutant Emission Factors. Volume 1,Stationary Point and Area Sources.U.S. EPA AP-42, 4th edition,September.
Vineberg, R. and T. Boyle (1991). ClimateChange and Forests. BackgroundPaper prepared for Canadian GlobalClimate Change Negotiations, Ottawa,Ontario (1991).

CANADA�S SECOND NATIONAL REPORT ON CLIMATE CHANGE
33
The National Action Program onClimate Change (NAPCC)
The National Action Program on ClimateChange (NAPCC) is Canada�s response tothe United Nations FrameworkConvention on Climate Change (FCCC).This program, which was developed as afederal, provincial, and territorialgovernment initiative and was approvedby federal, provincial, and territorialministers of energy and environment onFebruary 20, 1995, sets the strategicdirections for pursuing the nation�sobjective of meeting its currentcommitment of stabilizing greenhouse gas(GHG) emissions at 1990 levels by the year2000. The program also provides guidancefor actions beyond 2000.
The NAPCC is a living plan � one thatpursues sectoral and broad-basedopportunities through the development ofappropriate actions and measures byprivate and public jurisdictions. It includesa formal review process, which will allowadjustments to be made as required. TheNAPCC recognizes Canada�s three-pronged approach to addressing the issueof climate change. This approach includestaking actions to mitigate greenhouse gasemissions (including sequestrations),improving our scientific understanding ofthe issue, and taking action to adapt topotential climate change.
The NAPCC reflects Canada�s intention tomanage climate change within the overallcontext of sustainable development. Suchan approach demonstrates an ability totake effective action on environmentalissues while pursuing economicdevelopment. This can also serve as animportant example to stimulate furtherinternational action.
This emphasis on sustainable developmentis manifested through several principlesthat help describe the environmental,economic, social, and politicalconsiderations that need to be taken intoaccount in formulating a plan on climatechange and in providing guidance in theselection of measures. These principles arethe precautionary principle, sharedresponsibility, effectiveness,competitiveness, transparency andaccountability, flexibility, and internationalcooperation.
In addition to these principles, the NAPCCis based on several process-related�strategic directions� that are intended toguide Canada as it works towards meetingits climate change commitments. Thestrategic directions provide parameters forjudging the quality of the program itself.They include a dynamic program, an openand transparent review, building onsuccesses, identifying new opportunities,removing barriers, supporting voluntaryactions, developing technologies andexpertise, and covering a wide range ofactions.
Based upon the above principles andstrategic directions, the following broad-based mitigative actions have beenidentified: the Voluntary Challenge andRegistry (VCR) program, JointImplementation (JI), a nationalcommunications program, andinternational cooperation. The NAPCCalso outlines the mitigation activitiesplanned or under way in a number ofdifferent sectors, including government,industry, residential, commercial,agricultural, and forestry sectors. TheNAPCC also sets the strategic directionsfor actions related to science andadaptation.
CHAPTER 4: Policies and Measures
CHAPTER 4: POLICIES AND MEASURES
34
Built into the NAPCC is a review processthat aims to inform stakeholders andpolicy-makers of progress being made andto identify areas of opportunity for furtheractions. These reviews will utilizeindicators of progress and other analysisto:
� track changes in Canada�s greenhousegas emissions;
� identify broad-scale factors influencingchanges in emissions;
� assess the impacts of mitigative actionson greenhouse gas emissions;
� assess the economic implications ofactions to limit emissions; and
� identify areas of opportunity forfurther action to address climatechange.
The first review of the NAPCC waspublished by the National Air IssuesCoordinating Committee in late November1996. It is entitled 1996 Review of Canada�sNational Action Program on ClimateChange. Canada�s Second National Reporton Climate Change to the FCCC reflectsthe findings of this review of the NAPCC.
Governments are undertaking initiativesin the areas of energy efficiency,renewable and alternative energy,education, electricity policy, and wastemanagement. Besides these governmentinitiatives, an important component of theNAPCC is the VCR program, whichengages the private sector, governments,and other organizations to undertake, ona voluntary basis, initiatives to limit orreduce greenhouse gas emissions. Thesecommitments and action plans areregistered with the VCR for publicscrutiny and information sharing. TheVCR, which is less than two years old,has over 619 companies andorganizations registered (as of December1996), and they account for over half of
the greenhouse gas emissions in Canada.Of those registered with the VCR, 319have action plans that generally addressenergy efficiency, energy demand-sidemanagement, fuel substitution, processredesign, management practices, orcarbon offsets. Details of progress of theVCR program may be found in the reportVoluntary Challenge and Registry,December 1996 Progress Report. Furtherdetails of individual companies� actionscan be found on the Internet sitehttp://www.vcr-mvr.ca. Individuals(homeowners, drivers of vehicles) are notregistered with the VCR but areaddressed through government programsand VCR action plans of electric andnatural gas utilities on the abatement ofgreenhouse gas emissions.
For more details on policies and measures,refer to Appendix I, Table 1. It gives anoverview of some of the policies andprograms in effect among federal,provincial, territorial, and municipalgovernments in Canada. It is not anexhaustive list (over 475 policies andprograms were identified, and theseinvolved thousands of initiatives), but it ismeant to be a representative list of thetypes of activities taking place. Most of theprograms had their origin primarily asenergy efficiency programs and were notdesigned to account for reductions ingreenhouse gas emissions.
The most probable impact of initiativesthrough the year 2020 has been estimatedin the Natural Resources Canada (NRCan)publication Canada�s Energy Outlook:1996�2020 (NRCan, 1997). In developingthis estimate, rather than attributingspecific impacts to each initiative, anapproach was adopted that provides anassessment of the impact of sets ofmeasures on segments of energy use. Thisapproach was chosen in order to avoid thedouble-counting that characterizes theattribution of unique impacts tocomplementary initiatives.

CANADA�S SECOND NATIONAL REPORT ON CLIMATE CHANGE
35
TABLE 4.1 NAPCC: IDENTIFIED QUANTIFIABLE INITIATIVES
Initiatives
Information & FinancialMajor Sectors Suasion R&D Regulations Incentives VCR
End Use
� Residential 46 16 19 6 �
� Commercial 87 18 11 2 �
� Industry 24 17 6 4 127a
� Transport 11 4 0 0 �
Fossil Fuel � � � � 86b
Electricity � � � � 11c
Non-Energy � 1 � � 1d
Total 168 56 36 12 235
CIPEC = Canadian Industry Program on Energy Conservation
CAPP = Canadian Association of Petroleum Producers
CEPA = Canadian Energy Pipeline Association
a CIPEC commitment of 1% energy efficiency was reflected.b CAPP, CEPA, and Oil Sands Operation proposed GHG emissions were used.c Canadian Electrical Association submission was used.d Dupont Chemical�s commitment to reduce N2O emissions from adipic acid production process.
Measuring the Impacts ofNAPCC Initiatives
The reference case outlook produced byNRCan incorporates estimates of theimpact of announced and likely to beannounced federal, provincial, andmunicipal initiatives focused on energyefficiency, alternative energy, andreductions of greenhouse gas emissions.These initiatives include all measureseither directly related to or reflecting theobjectives of the NAPCC, in particular thecommitments to the VCR program by theprivate sector and other organizations forgreenhouse gas abatement initiatives.
The methodology to develop the impact ofinitiatives is complex. In brief, however,the process involves three steps: anunderstanding of the characteristics ofeach initiative, a translation of thisinformation into a judgement about marketeffects, and a calculation of the ultimateimpact of each initiative on energy use orlevels of emissions.
The review of the NAPCC identified over475 policies and programs among federal,provincial, territorial, and municipalgovernments geared primarily topromoting energy efficiency, which alsocould have impacts on greenhouse gasemissions. NRCan has reviewed severalthousand initiatives under these policiesand programs and identified 272 that canreasonably be expected to achievedefinable energy efficiency and/oremission reduction results. In addition, 235VCR submissions with quantifiable actionplans were examined. These initiatives arecategorized by type and sector in Table 4.1.
It is evident that the bulk of the initiativesidentified are voluntary in nature. Itshould be noted, however, that the smallnumber of regulatory measures along withVCR commitments account for a largepercentage of the total impact of NAPCCinitiatives.
CHAPTER 4: POLICIES AND MEASURES
36
The impacts of initiatives, or groups ofrelated initiatives, were developed byidentifying the major drivers, such asregulations governing the increased energyefficiency of purchased equipment and theconsequences of this increased efficiency asthe stock of equipment turns over.
Several points should be noted in theassessment of the impact of initiatives onemissions:
� Conceptually, the estimates areincremental, in the sense that theresults would not be expected to occurin the absence of the initiative.
� In general, the results reflect theincremental impact from 1995.Initiatives in place prior to 1996 areassumed to be already embodied in thehistorical data. Only additional activityassociated with a particular initiative(e.g., a further ratcheting up of energyefficiency standards or additionalfunding for an ongoing program) isincluded in the impacts.
� Given the complementarity of manyinitiatives, the results typically reflectthe impacts of related measures ratherthan the individual effect.
� The VCR, in particular, is viewed as amechanism that complements otherinitiatives and accelerates their take-up.The exceptions are the fossil fuelproduction, electricity generation, andnon-energy VCR commitments, whichare the only initiatives in these sectorsand are separately identified.
� All initiatives are assumed to remain inplace (or be replaced by similarmeasures) and continue to receive thesame level of funding throughout theprojection period.
Emissions from Direct End Use of Energy
Emissions from the direct end use ofenergy are those generated from thecombustion of fossil fuels in the four end-use subsectors: residential, commercial(including institutions and publicadministration), industrial,1 andtransportation.2 Carbon dioxide (CO2)accounts for the overwhelming share ofthese emissions, with small volumes ofnitrous oxide (N2O), principally from roadtransportation.
Figure 4.1 shows the projections forgreenhouse gas emissions by the end-usesectors. The emissions portrayed are thoseassociated with the direct combustion offossil fuels (principally refined petroleumproducts and natural gas). Emissions fromthe generation of electricity to satisfy end-use demand are discussed in the nextsection.
End-use emissions are projected to increasefrom 315 Mt in 1990 to 348 Mt in 2000 and412 Mt in 2020, an overall growth of justover 30%. The largest source is thetransport sector, obviously linked to thelevels of gasoline, diesel, and other motivefuels. Emissions from the industrial sectorgrow despite significant declines in energyintensity. The commercial sectorcontributes a constant and the residentialsector a declining share.
1 Emissions from non-combustion uses of energy (feedstocks, asphalt, etc.) and from fuel use inpetroleum refining are included in the industrial sector.
2 Transportation includes emissions from road, railway, air, and marine traffic. Energy used fortransportation in 1995, by fuel type, was as follows: 60% gasoline (automobiles and light-dutytrucks), 26% diesel (heavy trucks, railway, buses), 9% aviation fuels, 3% heavy fuel oil (marine),and 2% other.

CANADA�S SECOND NATIONAL REPORT ON CLIMATE CHANGE
37
TABLE 4.2 END-USE SECTOR: IMPACT OF
INITIATIVES ON GREENHOUSE GAS
EMISSIONS
Emissions(Mt of CO2
equivalent)
1990 2000 2010 2020
Pre-Initiatives Level 315 360 401 475
Impact of Initiatives from
Residential, Commercial,
and Industrial Sectorsa � 10 22 54
Impact of Transportation
Initiatives � 2 5 9
Post-Initiatives Levela 315 348 374 412
a Includes impact of initiatives that reduce electricity use bythese sectors.
The projections in Table 4.2 reflect theimpact of the many initiatives targeted tothe end-use sector and the VCRcommitments by the industrial sector. Thetable also provides the estimates of theimpact of these measures on greenhousegas emissions.
The level of emissions for the end-usesector, in the absence of initiatives, isestimated to grow from 315 Mt in 1990 to360 Mt in 2000 and 475 Mt by 2020.Initiatives directed at the residential,
0
50
100
150
200
250
300
350
400
450
500
1990 2000 2010 2020
14% 13% 10% 9%
8% 9% 9% 9%
30% 30% 31% 31%
47% 49%50%
51%315
348374
412
M t of CO2 Equivalent
Residential
Industrial
Com mercial
Transportation
FIGURE 4.1 GREENHOUSE GAS END-USE EMISSIONS, 1990�2020
commercial, and industrial sectors,including associated reductions inelectricity requirements, would reducethese levels by 10 Mt in 2000 and 54 Mt in2020. Transportation initiatives wouldreduce levels by a further 2 Mt in 2000and 9 Mt in 2020. The overall impact ofinitiatives in this sector is to reduceemissions by about 3% in 2000 and 14%in 2020 over projected emissions.
Emissions from Electricity Generation
Over 80% of Canada�s electricityproduction is generated by non-emittingsources: principally hydro and nuclearpower, but also biomass and otherrenewables. Of the greenhouse-gas-emitting sources, coal (14% of electricityproduction and 82% of emissions)accounts for the largest component,followed by natural gas (3% and 10% ofemissions) and fuel oil (1% and 8% ofemissions).
The Canadian electricity industry iscurrently responding to increasingcompetitive pressures and will likely

CHAPTER 4: POLICIES AND MEASURES
38
undergo significant restructuring over thenext decade, which may change fuelchoices.
In its VCR submission, the CanadianElectricity Association, representingCanada�s electrical utilities, announcedplanned reductions ingreenhouse gasemissions fromoperations ofapproximately 3 Mt by2000 as a result ofmitigative actions.
Emissions from FossilFuel Production
Greenhouse gasemissions in this sectorare derived from twoprincipal sources:
� from fossil fuel usein the exploration,development,production, andtransport of crudeoil, natural gas,and coal; and
� from fugitive emissions (e.g., carbondioxide and methane, or CH4) fromthe production and transport of theseraw materials.
Trends in both sources are closely relatedto the volume of oil and natural gasproduction. They can also be modified byimproved monitoring and the applicationof technology.
The carbon dioxide and methaneemissions associated with fossil fuelproduction and transport are presented inFigure 4.2. As expected, the increase inproduction volumes generates significantincreases in levels of emissions. Carbondioxide emissions, largely related tonatural gas and oil sands production,would grow from 49 Mt in 1990 to 72 Mt
in 2000 and to 88 Mt in 2020. Consistentwith increased gas production, especiallyfor the export market, methane emissions,which grew 25% between 1990 and 1995,would increase further by 2000 beforeplateauing at about 45 Mt after 2010 (a55% increase over 1990 levels).
All of the above results are beforeconsideration of the initiatives by thefossil fuel industry to reduce emissions.Based on an analysis of the VCRsubmissions of the industry and relatedevidence, a methodology has beendeveloped that suggests that significantreductions, particularly for fugitivemethane emissions, are likely. For carbondioxide, these initiatives, principallyrelated to improved practice and newtechnologies employed by oil sandsoperations, are sufficient to hold levels ofemissions to about 75 Mt per year after2010, despite considerable increases inproduction. For methane, the expectedactions of producers and transporters aresufficient to reduce and then stabilizeemissions from 1995 onward. This occursdespite an increase in natural gasproduction of some 30% over the sameperiod.
49
29
65
36
69
32
71
28
76
28
912
3
9 15 17
0
10
20
30
40
50
60
70
80
90
100
1990 1995 2000 2010 2020
Mt of CO2 Equivalent
Net CO2 Emissions
Initiatives Impact on CO2
Net CH4 Emissions
Initiatives Impact on CH4
FIGURE 4.2 FOSSIL FUEL PRODUCTION EMISSIONS AND INITIATIVES IMPACT

CANADA�S SECOND NATIONAL REPORT ON CLIMATE CHANGE
39
The review of actions to date, entitled1996 Review of Canada�s National ActionProgram on Climate Change, concludedthat progress is being made. Actions takenby governments and the private sector areestimated to reduce greenhouse gasemissions from what they wouldotherwise be, resulting in the projected�gap� between emissions at the 1990stabilization level and the year 2000 nowbeing 8% rather than 13%. It identifiedareas of opportunity for progress ingreenhouse gas mitigation, adaptation,and science.
The NAPCC is a dynamic and evolvingprogram. New policies and programs willbe developed by governments and theprivate sector in the ongoing attempt topromote the abatement of greenhouse gasemissions in Canada.
References
National Air Issues CoordinatingCommittee (1995). Canada�s NationalAction Program on Climate Change.
National Air Issues CoordinatingCommittee (1996). 1996 Review ofCanada�s National Action Program onClimate Change.
NRCan (Natural Resources Canada)(1997). Canada�s Energy Outlook:1996�2020.
Voluntary Challenge and Registry Office(1996). Canada�s Climate ChangeVoluntary Challenge and Registry:December 1996 Progress Report.
Non-Energy Emissions
Non-energy emissions (about 12% of totalemissions) include a variety of industrial,agricultural, and waste managementprocesses in which greenhouse gases are adirect by-product. Overall, non-energyemissions in 2000 are projected to be 4%lower than 1990 levels before increasingto 39% above 1990 levels by 2020. Themain source of the decline is the majorchange in Dupont�s adipic acidmanufacturing process, to be phased inbetween 1997 and 2000, which willreduce nitrous oxide emissions byapproximately 10 Mt of carbon dioxideequivalent. Emissions from cement andlime production experience only modestgrowth owing to the greater use of fly-ashand further efficiencies in the processingof clinker. All other non-energy sourcesexperience growth in emissions more orless in line with economic and populationtrends.
Results for Total Greenhouse GasEmissions
The impact of the NAPCC is accountedfor in Table 4.3. The �gap� � thedifference between the level of emissionsin 1990 and 2000 � reported in the 1995NAPCC document was 73 Mt, or 13%above 1990 levels. The current projectionhas the difference declining to 46 Mt, or8.2% above 1990 levels. (Note: Emissionsfor the base year 1990 in this projectionare 564 Mt, not 567 Mt as given inChapter 3, due to the fact that Canada�sEnergy Outlook was developed prior toconfirmation of revisions to the inventorydata. The next projection will reflectchanges in the base year figure.)
TABLE 4.3 THE GAP � GREENHOUSE GAS EMISSIONS IN 2000 VS. 1990
Emissions(Mt of CO2 equivalent)
1990 2000 Difference % Increase
1994 Projection in NAPCC 564 637 73 13.0
Current Projection 564 610 46 8.2
CANADA�S SECOND NATIONAL REPORT ON CLIMATE CHANGE
41
Introduction
This chapter offers a reference projectionfor Canada�s greenhouse gas (GHG)emissions over the next 25 years. Theprojection covers emissions both fromenergy use, about 90% of the total, andfrom non-energy sources. Estimates for theformer were developed by NaturalResources Canada (NRCan)1 and for thelatter by Environment Canada.
The projection provided in this chapter isnot the only possible outcome. It is,however, a considered view, based on a setof reasonable assumptions concerningfactors that influence future emissiontrends. This said, the use of any alternativesubset of assumptions concerning thefuture will yield a different result.Obviously, also, the estimates are morereliable in the shorter to mid-term giventhe difficulty of envisioning specificchanges in technology over a long span oftime.
It should also be stressed that this emissionprojection is not, in the strict sense of theterm, a forecast. This is because oneimportant set of variables � namely,federal and provincial energy,environment, and related policies � isheld constant over the projection period.
Maintenance of current policy is not anassumption. Rather, it is a deliberatelyimposed constraint employed both toexamine the implications of the currentpolicy mix and to provide a reference toevaluate the need for, and, if warranted,the impact of, new policies.
The remainder of the chapter is organizedas follows:
� Modelling Structure describes themodelling framework employed todevelop the projection.
� Major Assumptions briefly reviews themajor framework assumptionsunderlying the projection.
� Results for Total Greenhouse GasEmissions provides the short- and long-term trends for total greenhouse gasemissions from various perspectives.
� Sensitivity Analysis explores thesensitivity of the results to changes inmajor assumptions.
� The final section, Summary andConclusions, summarizes the majorconclusions of the projection andsuggests its implications for policy.
CHAPTER 5: The Emission Projection to 2020
1 The energy-related estimates are included in Canada�s Energy Outlook: 1996�2020, published byNRCan (1997).
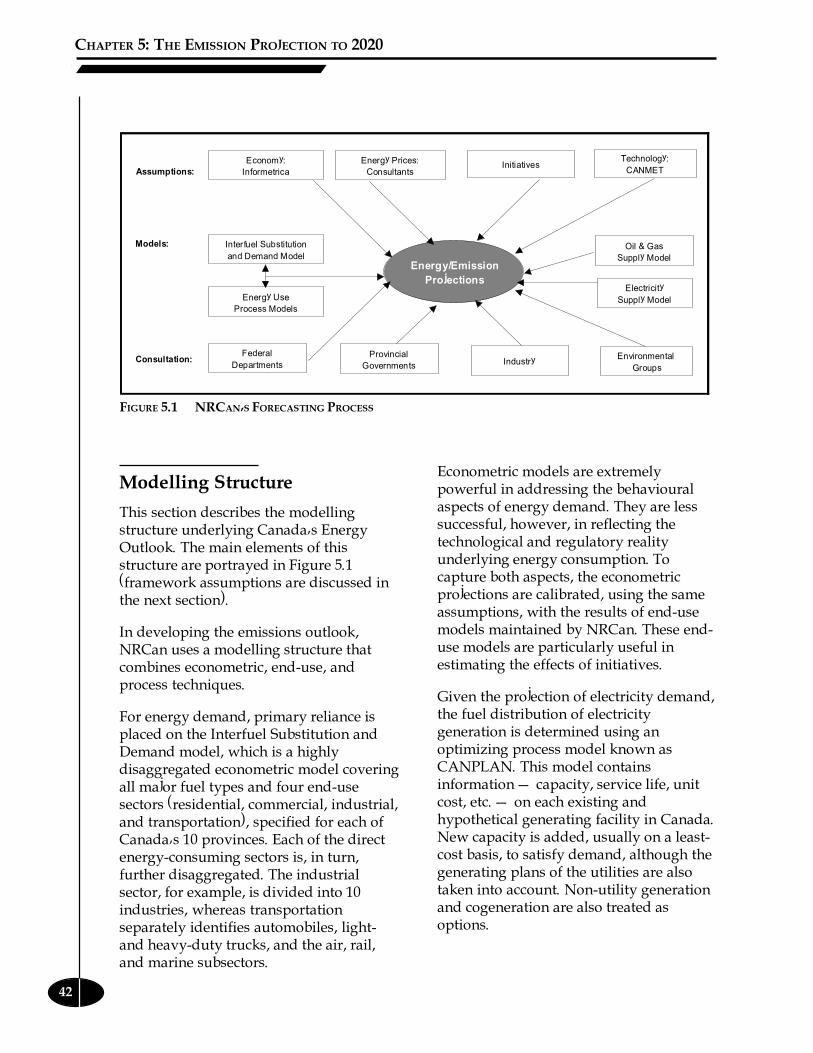
CHAPTER 5: THE EMISSION PROJECTION TO 2020
42
Modelling Structure
This section describes the modellingstructure underlying Canada�s EnergyOutlook. The main elements of thisstructure are portrayed in Figure 5.1(framework assumptions are discussed inthe next section).
In developing the emissions outlook,NRCan uses a modelling structure thatcombines econometric, end-use, andprocess techniques.
For energy demand, primary reliance isplaced on the Interfuel Substitution andDemand model, which is a highlydisaggregated econometric model coveringall major fuel types and four end-usesectors (residential, commercial, industrial,and transportation), specified for each ofCanada�s 10 provinces. Each of the directenergy-consuming sectors is, in turn,further disaggregated. The industrialsector, for example, is divided into 10industries, whereas transportationseparately identifies automobiles, light-and heavy-duty trucks, and the air, rail,and marine subsectors.
Econometric models are extremelypowerful in addressing the behaviouralaspects of energy demand. They are lesssuccessful, however, in reflecting thetechnological and regulatory realityunderlying energy consumption. Tocapture both aspects, the econometricprojections are calibrated, using the sameassumptions, with the results of end-usemodels maintained by NRCan. These end-use models are particularly useful inestimating the effects of initiatives.
Given the projection of electricity demand,the fuel distribution of electricitygeneration is determined using anoptimizing process model known asCANPLAN. This model containsinformation � capacity, service life, unitcost, etc. � on each existing andhypothetical generating facility in Canada.New capacity is added, usually on a least-cost basis, to satisfy demand, although thegenerating plans of the utilities are alsotaken into account. Non-utility generationand cogeneration are also treated asoptions.
Assumptions:
Models:
Consultation:
Economy:
Informetrica
Energy Prices:
ConsultantsInitiatives
Technology:
CANMET
Interfuel Substitution
and Demand Model
Energy Use
Process Models
Federal
Departments
Provincial
Governments IndustryEnvironmental
Groups
Electricity
Supply Model
Oil & Gas
Supply ModelEnergy/Emission
Projections
FIGURE 5.1 NRCAN�S FORECASTING PROCESS

CANADA�S SECOND NATIONAL REPORT ON CLIMATE CHANGE
43
Crude oil, natural gas, and coal supply areprojected using a more eclectic modellingstructure. First, major oil and natural gasprojects are considered, based on theireconomics and industry announcements.Conventional oil and gas supply is thendetermined by relating exploration anddevelopment costs and the industry�sreinvestment behaviour to its cash flowposition. Coal supply projections aredeveloped from projected industryrequirements. In all three cases, exportlevels are established by an in-depthexamination of domestic and foreignassessments of potential.
For the most part, calculation ofgreenhouse gas emissions related to fossilfuel consumption is straightforward.Emission factors for each fuel type havebeen developed by NRCan andEnvironment Canada based oninternationally accepted conventions. Forsome sources, however, such as fugitivemethane emissions from oil and gasproduction and nitrous oxide (N2O)emissions from industrial processes,specific assumptions are made, based onstudies of technological potential, of thefuture trend in emissions per unit ofoutput.
A crucial aspect of the outlook process isconsultation with experts from the federaland provincial governments, industryassociations, and other stakeholders. Thisinvolves both informal discussions on theframework assumptions and a moreextensive review of the initial results witha wide range of groups. For Canada�sEnergy Outlook, consultations have beenheld with all provincial energydepartments; with regulatory bodies; withindustry organizations representing oil andgas producers, natural gas distributors,electricity generators, major industrialenergy users, and automotive
manufacturers; and with environmentalgroups. These consultations do not implyfull endorsement of the Outlook by eachorganization. We believe, however, thatthey have produced a broad consensusconcerning the reasonableness of theresults.
Major Assumptions
This section summarizes the majorassumptions � energy prices,macroeconomic and demographic factors,and the characterization of current policy� that frame the projection. It concludeswith a brief discussion of the approach tomeasuring the impact of initiativesdeveloped under the National ActionProgram on Climate Change (NAPCC).
Energy Prices
The Outlook is predicated on continuedlow energy prices over the next decades.For crude oil, the price of which isdetermined internationally, and for naturalgas, whose price reflects the NorthAmerican market, the low prices reflectsignificant resource availability andimproved economics as a result ofattractive fiscal terms and the continuingapplication of technology. As shown inTable 5.1, the specific assumptions are forconstant real oil prices, at US$20.00 perbarrel, and for slightly rising real naturalgas prices (from US$1.90/mcf [thousandcubic feet] in 2000 to US$2.05/mcf in 2020).The upward trend in the latter reflectsincreased North American natural gasdemand for electricity generation.

CHAPTER 5: THE EMISSION PROJECTION TO 2020
44
TABLE 5.1 ENERGY PRICING ASSUMPTIONS
Energy Prices ($1995)
1995 2000 2010 2020
Crude Oil ($US/bbl ) � WTI at Cushing 18.40 20.00 20.00 20.00
Natural Gas ($US/mcf) � at Henry Hub 1.70 1.90 2.05 2.05
Electricity (¢Cdn/kWh) � Residential
Sector
Ontario 10.1 9.1 8.4 8.4
Canada 8.3 8.0 7.7 7.7
Coal ($Cdn/t)
Alberta (Domestic Production) 10 10 10 10
Ontario (Imported Coal) 55 55 55 55
Electricity prices will continue to bedetermined largely at the provincial level.The electricity industry will, however, beincreasingly subject to competitivepressures and the consequent need torestructure.2
Despite the introduction of competitivewholesale pricing, it is assumed, probablyconservatively, that electricity prices for allconsumers will remain constant, in realterms, over the projection period. The oneexception is in Ontario, where OntarioHydro has committed to maintain currentrates, in nominal terms, until 2005 (OntarioHydro, 1996) and will reduce its industrialprices, by about 20%, to respond tocompetitive pressures.
Coal prices are also projected to remainconstant in real terms over the projectionperiod. This assumption likely understatesthe downward pressure on prices fromincreasing international competition. Thelarge differential between Alberta domesticand Ontario imported coal largely reflectstransportation costs.
Macroeconomic and DemographicAssumptions
Macroeconomic and demographic trendsare powerful determinants of energyconsumption.3 As shown in Table 5.2,Canada�s gross domestic product (GDP) isexpected to grow, on average, by 2.2% peryear, a rate slightly below that of the U.S.economy. Until the end of the century,growth in the industrial sector is assumedto be strong relative to that in services. Thisdifferential reflects both an export-ledrecovery and the fiscal restraint imposedupon the public administration, education,and health segments of the service sector(which collectively account for 50% ofservices). Thereafter, industrial growthslows to about 2% per year while theservice sector expands slightly morerapidly (albeit from a much reduced base).
It is important not to underestimate thecumulative effect of these small growthrates. By 2000, for example, the Canadianeconomy is projected to be 12% larger thanit was in 1995; by 2020, it is projected to be70% larger.
2 The views concerning electricity expressed in this chapter were developed from a consultant�sreport commissioned by NRCan (Snelson, 1996).
3 The macroeconomic and demographic assumptions are from the Informetrica Winter 1996forecast. Some elements of the forecast, in particular relating to the growth prospects of specificindustries, have been modified following discussions with industry associations.
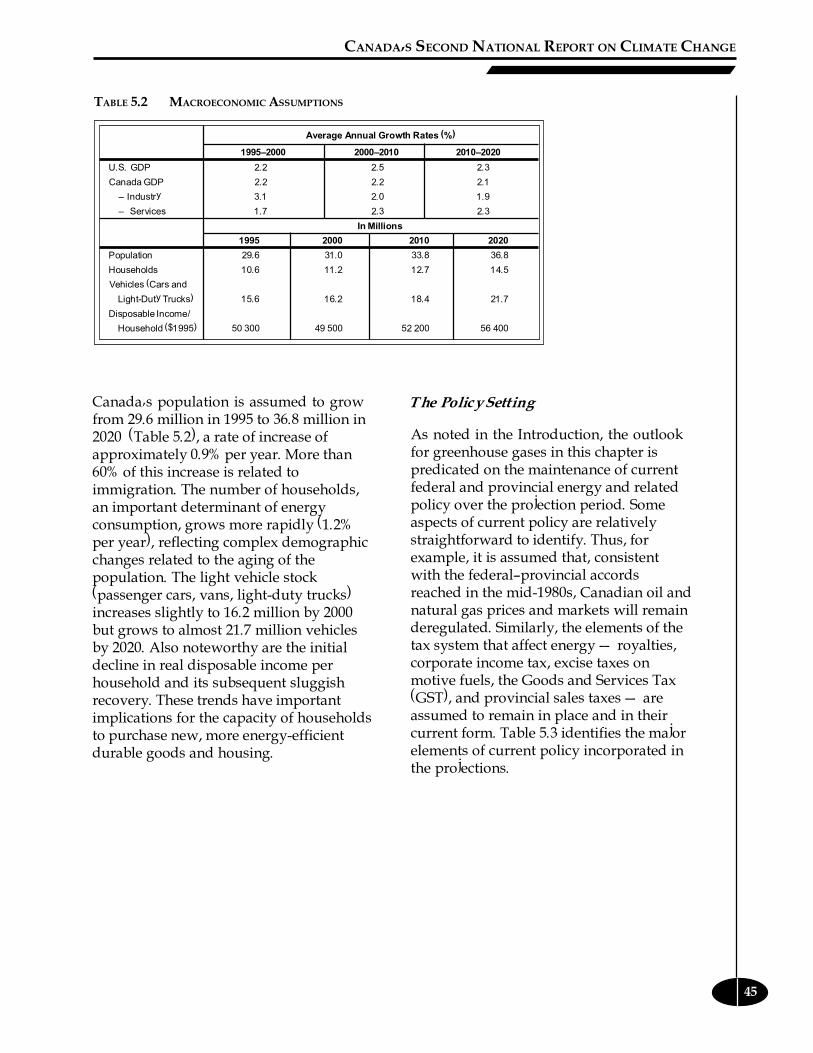
CANADA�S SECOND NATIONAL REPORT ON CLIMATE CHANGE
45
TABLE 5.2 MACROECONOMIC ASSUMPTIONS
Average Annual Growth Rates (%)
1995�2000 2000�2010 2010�2020
U.S. GDP 2.2 2.5 2.3
Canada GDP 2.2 2.2 2.1
� Industry 3.1 2.0 1.9
� Services 1.7 2.3 2.3
In Millions
1995 2000 2010 2020
Population 29.6 31.0 33.8 36.8
Households 10.6 11.2 12.7 14.5
Vehicles (Cars and
Light-Duty Trucks) 15.6 16.2 18.4 21.7
Disposable Income/
Household ($1995) 50 300 49 500 52 200 56 400
The Policy Setting
As noted in the Introduction, the outlookfor greenhouse gases in this chapter ispredicated on the maintenance of currentfederal and provincial energy and relatedpolicy over the projection period. Someaspects of current policy are relativelystraightforward to identify. Thus, forexample, it is assumed that, consistentwith the federal�provincial accordsreached in the mid-1980s, Canadian oil andnatural gas prices and markets will remainderegulated. Similarly, the elements of thetax system that affect energy � royalties,corporate income tax, excise taxes onmotive fuels, the Goods and Services Tax(GST), and provincial sales taxes � areassumed to remain in place and in theircurrent form. Table 5.3 identifies the majorelements of current policy incorporated inthe projections.
Canada�s population is assumed to growfrom 29.6 million in 1995 to 36.8 million in2020 (Table 5.2), a rate of increase ofapproximately 0.9% per year. More than60% of this increase is related toimmigration. The number of households,an important determinant of energyconsumption, grows more rapidly (1.2%per year), reflecting complex demographicchanges related to the aging of thepopulation. The light vehicle stock(passenger cars, vans, light-duty trucks)increases slightly to 16.2 million by 2000but grows to almost 21.7 million vehiclesby 2020. Also noteworthy are the initialdecline in real disposable income perhousehold and its subsequent sluggishrecovery. These trends have importantimplications for the capacity of householdsto purchase new, more energy-efficientdurable goods and housing.
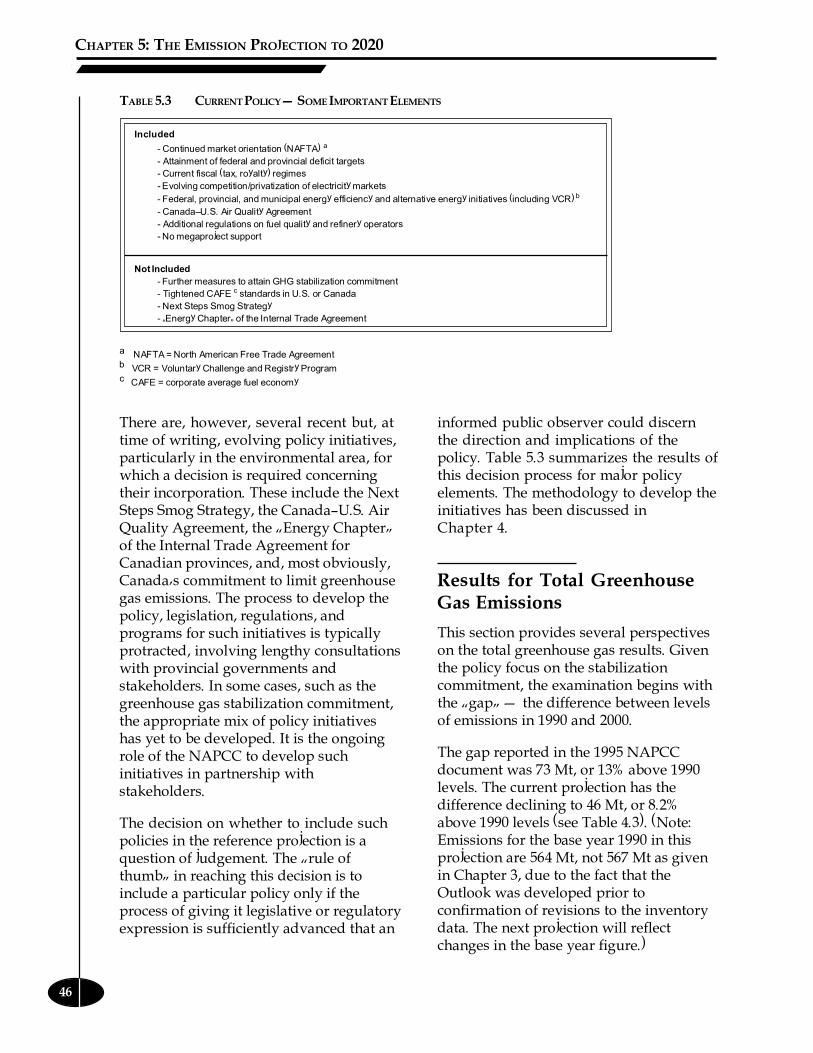
CHAPTER 5: THE EMISSION PROJECTION TO 2020
46
There are, however, several recent but, attime of writing, evolving policy initiatives,particularly in the environmental area, forwhich a decision is required concerningtheir incorporation. These include the NextSteps Smog Strategy, the Canada�U.S. AirQuality Agreement, the �Energy Chapter�of the Internal Trade Agreement forCanadian provinces, and, most obviously,Canada�s commitment to limit greenhousegas emissions. The process to develop thepolicy, legislation, regulations, andprograms for such initiatives is typicallyprotracted, involving lengthy consultationswith provincial governments andstakeholders. In some cases, such as thegreenhouse gas stabilization commitment,the appropriate mix of policy initiativeshas yet to be developed. It is the ongoingrole of the NAPCC to develop suchinitiatives in partnership withstakeholders.
The decision on whether to include suchpolicies in the reference projection is aquestion of judgement. The �rule ofthumb� in reaching this decision is toinclude a particular policy only if theprocess of giving it legislative or regulatoryexpression is sufficiently advanced that an
informed public observer could discernthe direction and implications of thepolicy. Table 5.3 summarizes the results ofthis decision process for major policyelements. The methodology to develop theinitiatives has been discussed inChapter 4.
Results for Total GreenhouseGas Emissions
This section provides several perspectiveson the total greenhouse gas results. Giventhe policy focus on the stabilizationcommitment, the examination begins withthe �gap� � the difference between levelsof emissions in 1990 and 2000.
The gap reported in the 1995 NAPCCdocument was 73 Mt, or 13% above 1990levels. The current projection has thedifference declining to 46 Mt, or 8.2%above 1990 levels (see Table 4.3). (Note:Emissions for the base year 1990 in thisprojection are 564 Mt, not 567 Mt as givenin Chapter 3, due to the fact that theOutlook was developed prior toconfirmation of revisions to the inventorydata. The next projection will reflectchanges in the base year figure.)
TABLE 5.3 CURRENT POLICY � SOME IMPORTANT ELEMENTS
Included
- Continued market orientation (NAFTA) a
- Attainment of federal and provincial deficit targets
- Current fiscal (tax, royalty) regimes
- Evolving competition/privatization of electricity markets
- Federal, provincial, and municipal energy efficiency and alternative energy initiatives (including VCR) b
- Canada�U.S. Air Quality Agreement
- Additional regulations on fuel quality and refinery operators
- No megaproject support
Not Included
- Further measures to attain GHG stabilization commitment
- Tightened CAFE c standards in U.S. or Canada
- Next Steps Smog Strategy
- �Energy Chapter� of the Internal Trade Agreement
a NAFTA = North American Free Trade Agreementb VCR = Voluntary Challenge and Registry Programc CAFE = corporate average fuel economy

CANADA�S SECOND NATIONAL REPORT ON CLIMATE CHANGE
47
Figure 5.2 provides various perspectiveson the gap � pre- and post-initiatives, byemission type, fuel, and sector. Severalpoints are worth noting:
� In the NAPCC projection, the impact ofinitiatives known at that time, in 2000,was approximately 16 Mt. The currentestimate, reflecting both increasingeffort and the role of the VoluntaryChallenge and Registry (VCR)program, is 38 Mt. Thus, progress inaddressing the stabilizationcommitment has been on the order of22 Mt.
� By emission, carbon dioxide (CO2) isthe largest contributor to the gap.Reflecting their small absolutecontribution, methane (CH4) andnitrous oxide account for smallercomponents of the increase.
� By fuel, the important role of naturalgas, from production for export andadditional domestic demand, isevident. Oil�s contribution is small,whereas those for coal and from non-energy sources are slightly negative.
The latter reflects the significantreduction in nitrous oxide emissionsdue to the change in the process foradipic acid production at the Dupontplant in Maitland, Ontario.
� By sector, both end-use and fossil fuelproduction contribute significantly tothe gap. The latter is due to increasednatural gas production for export.Electricity generation and non-energysources record negligible contributions(see discussion on coal and adipic acidabove).
Figure 5.3 provides a view of the long-termtrend in greenhouse gas emissions by typeof emission. Following a slight decline in2000, largely as a result of lower coal use inOntario and the process change for adipicacid production, the growth in emissions isinexorably upward. By 2010, emissions are105 Mt (19%) higher than in 1990. By 2020,they are 203 Mt (36%) higher. The primarysources of these increases are populationand economic growth, coupled with lowenergy prices and a shift to fossil fuels,particularly natural gas, for electricitygeneration.
0 10 20 30 40 50 60 70 80 90
NAPCC 1994 Projection
Current Projection
By Emissions
By Fuel
By Sector
CO2
73
Initiatives 38
End Use Fossil Fuel
Other
46
Init. 16
Natural Gas
Mt of CO2 Equivalent
Other
Other
FIGURE 5.2 THE GAP: 1990�2000
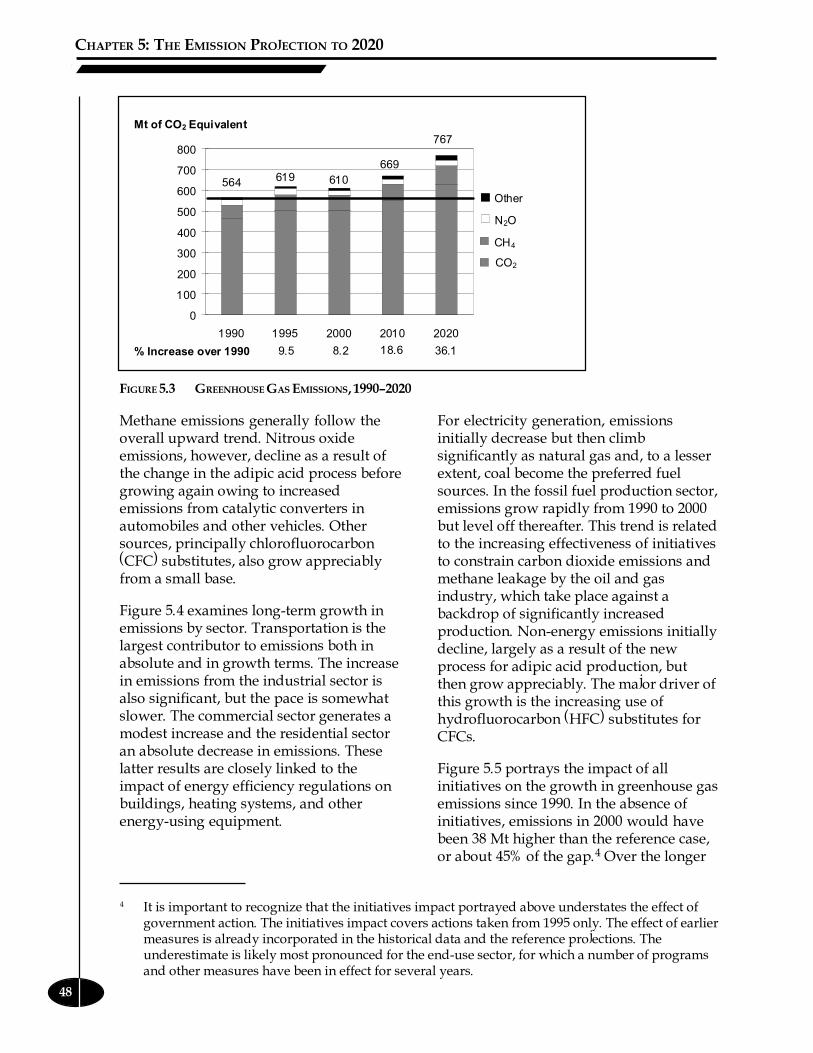
CHAPTER 5: THE EMISSION PROJECTION TO 2020
48
For electricity generation, emissionsinitially decrease but then climbsignificantly as natural gas and, to a lesserextent, coal become the preferred fuelsources. In the fossil fuel production sector,emissions grow rapidly from 1990 to 2000but level off thereafter. This trend is relatedto the increasing effectiveness of initiativesto constrain carbon dioxide emissions andmethane leakage by the oil and gasindustry, which take place against abackdrop of significantly increasedproduction. Non-energy emissions initiallydecline, largely as a result of the newprocess for adipic acid production, butthen grow appreciably. The major driver ofthis growth is the increasing use ofhydrofluorocarbon (HFC) substitutes forCFCs.
Figure 5.5 portrays the impact of allinitiatives on the growth in greenhouse gasemissions since 1990. In the absence ofinitiatives, emissions in 2000 would havebeen 38 Mt higher than the reference case,or about 45% of the gap.4 Over the longer
0
100
200
300
400
500
600
700
800
1990 1995 2000 2010 2020
Mt of CO2 Equivalent
% Increase over 1990 9.5 8.2 18.6 36.1
619564 610
669
767
Other
N2O
CH4
CO2
4 It is important to recognize that the initiatives impact portrayed above understates the effect ofgovernment action. The initiatives impact covers actions taken from 1995 only. The effect of earliermeasures is already incorporated in the historical data and the reference projections. Theunderestimate is likely most pronounced for the end-use sector, for which a number of programsand other measures have been in effect for several years.
FIGURE 5.3 GREENHOUSE GAS EMISSIONS, 1990�2020
Methane emissions generally follow theoverall upward trend. Nitrous oxideemissions, however, decline as a result ofthe change in the adipic acid process beforegrowing again owing to increasedemissions from catalytic converters inautomobiles and other vehicles. Othersources, principally chlorofluorocarbon(CFC) substitutes, also grow appreciablyfrom a small base.
Figure 5.4 examines long-term growth inemissions by sector. Transportation is thelargest contributor to emissions both inabsolute and in growth terms. The increasein emissions from the industrial sector isalso significant, but the pace is somewhatslower. The commercial sector generates amodest increase and the residential sectoran absolute decrease in emissions. Theselatter results are closely linked to theimpact of energy efficiency regulations onbuildings, heating systems, and otherenergy-using equipment.

CANADA�S SECOND NATIONAL REPORT ON CLIMATE CHANGE
49
0
20
40
60
80
100
120
140
160
180
200
220
Resi
dential
Com
merc
ial
Indust
rial
Tra
nsport
ation
Ele
ctrici
ty
Genera
tion
Fossil
Fuel
Pro
duct
ion
Non-E
nerg
y
Mt of CO2 Equivalent
Direct
End Use
FIGURE 5.4 GREENHOUSE GAS EMISSIONS BY SECTOR, 1990�2020
term, the initiatives are increasinglyeffective in constraining growth inemissions (reflecting in part the workingthrough of improved standards andpractices as energy-using and energy-producing capital stock turns over). By2020, for example, initiatives areresponsible for reducing emissions by108 Mt, or about 35%of the growth ofemissions since 1990that would haveotherwise takenplace.
In terms of thevarious categories ofinitiatives, thoserelated to end-useenergy consumptionare increasinglyeffective over time.Fossil fuel productioninitiatives make alarge difference earlyin the period, but,thereafter, the impactstabilizes as
economic limits for methane capture areexhausted. The electricity generationinitiatives remain constant at 3.3 Mtthroughout, a possibly conservativeassumption. In the non-energy category,the main element is the change in theprocess for adipic acid production.
0255075
100125150175200225250275300325
1990 2000 2010 2020
Stabilization at
1990 Level
Pre-Initiative Case
Post-Initiative Case
54
46
83
105
171
203
311
Initiatives
Mt of CO2 Equivalent
Relative to 1990 Level
1995
Non-Energy
Fossil Fuel Producti
Electricity
End Use
FIGURE 5.5 IMPACT OF INITIATIVES ON GREENHOUSE GAS EMISSIONS, 1990�2020

CHAPTER 5: THE EMISSION PROJECTION TO 2020
50
Figure 5.6 portrays long-term growth in emissionson a provincial basis. Theinformation is organized soas to indicate, for eachprovince, the percentgrowth in emissions in2000, 2010, and 2020,relative to the 1990 level.Several points are worthnoting:
� In the short term, to2000, growth inemissions is greaterthan the nationalaverage inSaskatchewan, Alberta,and British Columbia.
� In the longer term,however, growth inemissions is moreevenly distributed across provinces,with Ontario and British Columbiarecording above-average increases. Forthe former, the chief reasons for theincrease are the retirement of somenuclear plants and the greater use ofnatural gas and coal for electricitygeneration.
� The results for Alberta and, to a lesserextent, Saskatchewan suggest adeceleration in the growth of emissionsafter 2000. This is largely the result ofthe increasing effectiveness of the oiland gas industry initiatives to constrainemissions.
� Although Quebec and the Atlanticregion have minimal growth inemissions to 2000, thereafter theirresults are more in line with nationaltrends.
Sensitivity Analysis
Given the many assumptions required forits construction, it is almost inevitable thatthe reference projection will notaccurately reflect the future. To provide asense of the range of outcomes, Table 5.4examines the impact of a number ofchanges in assumptions.5 Some of thesechanges � different economic growthprospects, higher world oil prices �reflect plausible alternative externaldevelopments. The others are highlystylized representations of possible policydirections.
5 It is important to emphasize that these sensitivities are rough approximations. In each case, onlyone assumption is changed � everything else is held constant. Obviously, cases such as a onepercentage point change in economic growth or a doubling of energy intensity decline implyassociated significant changes in Canada�s economic structure.
-10
0
10
20
30
40
50
60
% Difference from 1990 Level
British
Colu
mbia
Atlantic
Regio
n
Quebec
Onta
rio
Manitoba
Sa
ska
tche
wa
n
Alb
ert
a
Canada
2000�1990 2010�1990 2020�1990
FIGURE 5.6 GREENHOUSE GAS EMISSIONS BY PROVINCE, 1990�2020
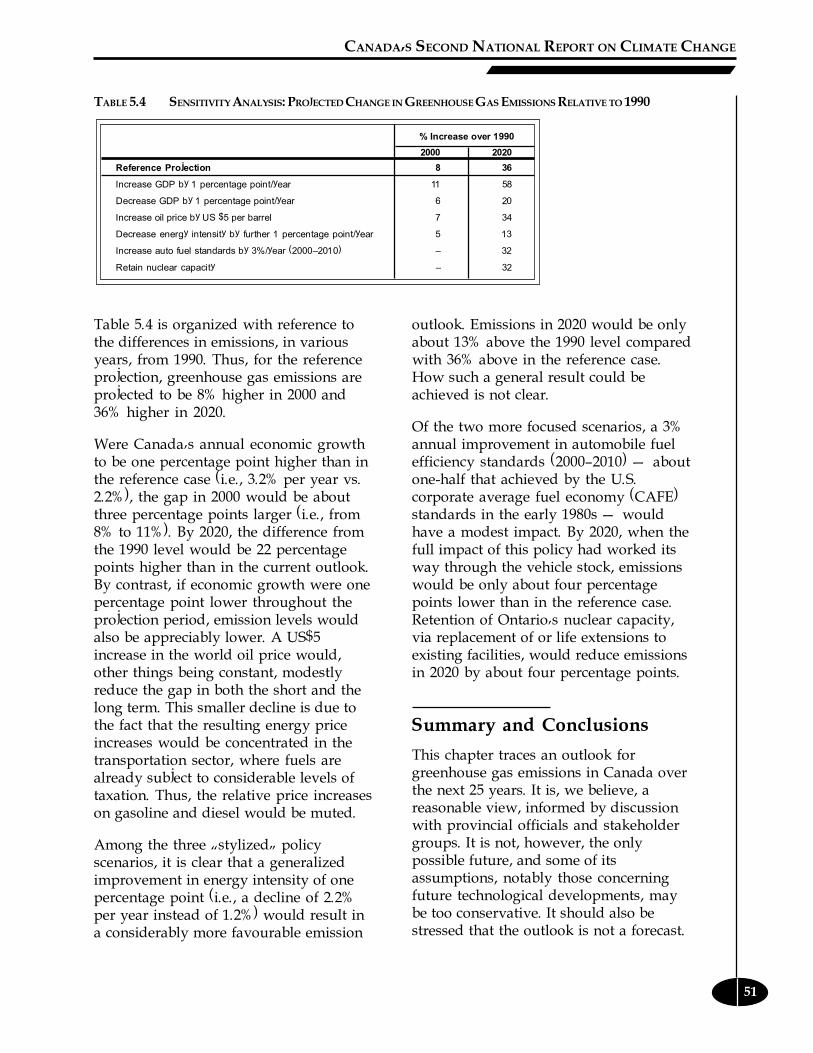
CANADA�S SECOND NATIONAL REPORT ON CLIMATE CHANGE
51
TABLE 5.4 SENSITIVITY ANALYSIS: PROJECTED CHANGE IN GREENHOUSE GAS EMISSIONS RELATIVE TO 1990
% Increase over 1990
2000 2020
Reference Projection 8 36
Increase GDP by 1 percentage point/year 11 58
Decrease GDP by 1 percentage point/year 6 20
Increase oil price by US $5 per barrel 7 34
Decrease energy intensity by further 1 percentage point/year 5 13
Increase auto fuel standards by 3%/year (2000�2010) � 32
Retain nuclear capacity � 32
outlook. Emissions in 2020 would be onlyabout 13% above the 1990 level comparedwith 36% above in the reference case.How such a general result could beachieved is not clear.
Of the two more focused scenarios, a 3%annual improvement in automobile fuelefficiency standards (2000�2010) � aboutone-half that achieved by the U.S.corporate average fuel economy (CAFE)standards in the early 1980s � wouldhave a modest impact. By 2020, when thefull impact of this policy had worked itsway through the vehicle stock, emissionswould be only about four percentagepoints lower than in the reference case.Retention of Ontario�s nuclear capacity,via replacement of or life extensions toexisting facilities, would reduce emissionsin 2020 by about four percentage points.
Summary and Conclusions
This chapter traces an outlook forgreenhouse gas emissions in Canada overthe next 25 years. It is, we believe, areasonable view, informed by discussionwith provincial officials and stakeholdergroups. It is not, however, the onlypossible future, and some of itsassumptions, notably those concerningfuture technological developments, maybe too conservative. It should also bestressed that the outlook is not a forecast.
Table 5.4 is organized with reference tothe differences in emissions, in variousyears, from 1990. Thus, for the referenceprojection, greenhouse gas emissions areprojected to be 8% higher in 2000 and36% higher in 2020.
Were Canada�s annual economic growthto be one percentage point higher than inthe reference case (i.e., 3.2% per year vs.2.2%), the gap in 2000 would be aboutthree percentage points larger (i.e., from8% to 11%). By 2020, the difference fromthe 1990 level would be 22 percentagepoints higher than in the current outlook.By contrast, if economic growth were onepercentage point lower throughout theprojection period, emission levels wouldalso be appreciably lower. A US$5increase in the world oil price would,other things being constant, modestlyreduce the gap in both the short and thelong term. This smaller decline is due tothe fact that the resulting energy priceincreases would be concentrated in thetransportation sector, where fuels arealready subject to considerable levels oftaxation. Thus, the relative price increaseson gasoline and diesel would be muted.
Among the three �stylized� policyscenarios, it is clear that a generalizedimprovement in energy intensity of onepercentage point (i.e., a decline of 2.2%per year instead of 1.2%) would result ina considerably more favourable emission

CHAPTER 5: THE EMISSION PROJECTION TO 2020
52
Rather, it is a scenario in which currentpolicy is deliberately held constant. Thisconstraint permits the examination ofemission trends in the absence of newpolicy initiatives.
There are a number of implications forpolicy that flow from the analysis in thischapter:
� Current actions are not sufficient tomeet Canada�s goal of stabilizingemissions at 1990 levels by the year2000.
� The above conclusion appears to holdeven if, from an emission perspective,more optimistic assumptions � lowereconomic growth, higher oil prices �are employed. The greater risk is thatthe assumptions concerning economicgrowth and electricity prices are tooconservative, with the result that thegap will be larger.
� Although the policy response, to date,has had an impact, a considerablygreater effort would seem to berequired, within a very short timeframe, to achieve the stabilizationobjective. It is very unlikely thatfurther large opportunities, such asthe change in the process forproducing adipic acid, exist.
� Of particular note is thetransportation sector, a major and
growing source of emissions. Theremay be considerable potential in thissector, but it is very difficult to accessby policy means. A somewhat similarconclusion applies to the industrialsector. Electricity generation mayprovide considerable opportunities,but they are not achievable in theshort term.
The long term may provide greater scopefor technological innovations to reducegreenhouse gas emissions. The outlook,however, suggests that one should not betoo sanguine about this prospect. Thecombined effects of population andeconomic growth, coupled with lowenergy prices, produce an inexorablegrowth in emissions. Without significanttechnological breakthroughs, evenachievement of long-term stabilizationwould require major structural andlifestyle changes.
References
NRCan (Natural Resources Canada)(1997). Canada�s Energy Outlook:1996�2020.
Ontario Hydro (1996). Corporate Budget& 1996�1999 Business Plan. January.
Snelson, J.K. (1996). Competition inElectricity Supply: Implications for theNRCan Energy Outlook. June.

CANADA�S SECOND NATIONAL REPORT ON CLIMATE CHANGE
53
global sea level rise are between 1.5 and 9.5cm per decade. In addition, a generallyslower ocean circulation system inresponse to warmer climates is likely toreduce net warming over ocean regionssuch as the North Atlantic, the NorthPacific, and parts of the southern ocean.Confidence in these predictions on aregional scale continues to be low, withsignificant differences apparent betweenthe different model projections. Modellersalso note that global temperatures and sealevels would continue to rise long aftergreenhouse gas concentrations arestabilized.
For Canada, projections continue tosuggest greater warming in interior regionsthan for the offshore and greater winterwarming in the Arctic than in the south.New results from the coupled Canadianmodel, for example, suggest that increasedgreenhouse gas and aerosol concentrationsare likely to cause a net average warmingfor central and northern Canada of 4�6°Cby 2050 AD, decreasing to 3�4°C along itseastern and western coastlines. Most,although not all, models continue toproject increased average winterprecipitation across Canada and decreasednet soil moisture and water resources ininterior Canada in summer. Projectionsfurther suggest that the frequency andintensity of both heat spells and convectivestorms in summer will increase, but thatthe number of dry days and hencepotential for drought periods may also rise.In winter, cold spells will be less intense,but the frequency of intense snowstormsmay increase. Such changes in extremeevents are likely to be significantly moredangerous to ecosystems and Canadiansociety than the changes in mean climateconditions that cause them.
CHAPTER 6: Possible Impacts of Climate Changeon Canada
Canada strongly supports the UnitedNations Framework Convention onClimate Change (FCCC). Several studieshave been undertaken to assess thepossible impact of climate change onCanada. They represent only the beginningof work in this area, but they clearlydemonstrate that Canadians should beconcerned about climate change.
Climate Model Predictions
Recent simulations of climates usingatmospheric general circulation models(GCMs) coupled to ocean circulationmodels have become increasingly realisticand hence have significantly increasedscientific confidence in their use forprojecting future climates. Several of thesehave now also been used to address therole of increased regional emissions ofsulphate aerosols in partially masking thewarming effects of greenhouse gases andmodifying the global response ofatmospheric circulation to such warming.
Results from these advanced, more realisticexperiments are in broad agreement withthose from previous climate changeprojections obtained from equilibriummodels. They continue to show greateraverage warming over land than overoceans, in high latitudes than in lowlatitudes, and in winters than in summers.The projected rate of warming foranticipated increases in greenhouse gasesalone continues to be in the range of 0.1�0.45°C per decade. However, adding themasking effects of further increases inaerosol concentrations, for example, couldreduce the net rate of average globalwarming to 0.1�0.35°C, with greaterreductions in heavily polluted regions.Related estimates for the average rate of

CHAPTER 6: POSSIBLE IMPACTS OF CLIMATE CHANGE ON CANADA
54
One of the reasons that Canada isinterested in assessing the impacts ofclimate change is related to the possibilityof positive impacts (e.g., a longer growingseason) to various sectors and/or regions;unless they and the means of takingadvantage of them are identified, thepositive return may be diminished througha lost opportunity or maladaptation.Canada is also interested because of thepotential international impacts (i.e., as amember of the global community).
Integrated Studies of PossibleImpacts of Climate Change
Impacts of climate change have beenstudied at the regional and national levelsfor a number of years, with a move to moreintegrated assessments. At the regionallevel, this move to integrated assessmentsis obvious in the approaches used inconducting the Mackenzie Basin ImpactStudy (MBIS) and the Great Lakes�St.Lawrence Basin (GLSLB) Project.
The Mackenzie Basin extends across partsof British Columbia, Alberta,Saskatchewan, Yukon, and the NorthwestTerritories. The MBIS was initiated in 1990by Environment Canada to produce anintegrated assessment of climate changescenarios for the entire watershed. Resultsof this study indicate that this basin hasalready experienced a warming trend of1.5°C this century and that there isevidence that this has led to permafrostthaw and lower lake levels in some areas.Climate projections suggest that this regioncould experience a warming of 4�5°C bythe middle of the 21st century.
The Great Lakes�St. Lawrence Basin is animportant regional focal point, as itcontains 20% of the world�s fresh water, ishome to over 42.5 million people, and is aregion rich in human and naturalresources, with diverse economic activitiesand complex infrastructures. The GLSLB
Project was initiated by EnvironmentCanada as a second-generation integratedclimate impact assessment and built uponearlier work by the International JointCommission. The first progress report ofthe GLSLB Project was recently releasedand particularly recognized the need tofocus on economic shifts and dislocationscaused by potential climate change withina region.
The recent move to integrated assessmentsof climate change impacts andvulnerability is also taking place at thenational level, with two complementarynational studies. The first is a broad-basedintegrated assessment of the impacts ofclimate change on Canadianenvironmental, economic, and socialsystems: The Canada Country Study:Climate Impacts and Adaptation (CCS-CIA). This two-phased study will provideCanadians with a better understanding oftheir vulnerabilities to climate change andidentify adaptation options. The conceptfor the Canada-wide study emerged fromthe growing recognition that the existingbody of climate impacts and adaptationresearch is deficient in several respects. It isbelieved that these deficiencies perpetuatethe lack of awareness of Canadians as tothe associated risks and vulnerabilities andthe need to identify and implementappropriate adaptive measures. Phase I ofthe CCS-CIA will integrate existingresearch for particular regions and climate-sensitive sectors into a national synthesis.Phase II will address knowledge gaps andestablish new directions for climateimpacts and adaptation research.
The second national study, complementingthe CCS-CIA, is the Regional EcosystemEffects of Atmospheric Change (REEAC)Study. This study is a national initiativeaimed at the coordination of research intothe ecosystem effects of atmosphericchange and the integration of relatedregional studies. It is currently in its initialstages. Using regional scenarios of climate
CANADA�S SECOND NATIONAL REPORT ON CLIMATE CHANGE
55
These projected changes in water supplywould threaten:
� water availability for agriculture,livestock, industry (e.g., dilution ofeffluents and cooling), humanconsumption, and the health of littoraland wetland habitat for fish andwaterfowl;
� spring flows and related recharge ofsoil moisture, wetlands, andimpoundments;
� channel and harbour water levels (i.e.,increasing requirements for dredging);
� shoreline property values (values mayplummet along with retreatingshorelines); and
� hydroelectricity generation.
An increased possibility of periods ofabrupt high flows is associated withprojected increases in the frequency andseverity of summer storms, which wouldthreaten to overtop dams, impoundments,and flood control structures, to exceed thecapacity of culverts, and to increase theoccurrence of spills from urban sewagesystems.
Specific examples of the socioeconomicimpacts of water supply changes includethe following:
� In 1964, low water levels resulted in a$35-million loss for Great Lakesshipping and hydroelectric power.One-third of municipalities along thelakes had water supply problems.
� In the Atlantic provinces and otherregions susceptible to spring flooding,changes in late-winter or early-springprecipitation patterns may result in
1 Ecological impacts dependent on hydrological responses to climate change are still relativelyuncertain.
change and UV-B irradiation over thecoming years, a detailed assessment of theeffects on hydrology and water quality willbe developed, as well as an understandingof probable impacts on natural andmanaged ecosystems. Evaluation of theenvironmental, social, and economiceffects, as well as identification of actionsor policies to minimize or adapt to impacts,will follow.
Implications for CanadianEcosystems
The results of these integrated regionalstudies and from various specific sectoral/ecosystem assessments indicate thatCanada�s ecological and socioeconomicsystems are vulnerable and therefore atrisk as a result of projected changes in theclimate. These vulnerabilities andassociated risks can be categorizedaccording to the affected systems:hydrology and water supply, humanhealth, ecology, infrastructure/activities/settlements, coastal zones/margins,agriculture, and forestry. The rate ofchange and regional impacts, however,remain uncertain.
Hydrology and Water Supply1
In many regions, according to climatemodelling, summer lake levels and riverflows are expected to decline or fluctuatemore widely owing to changes inprecipitation and/or increases inevapotranspiration. In the WesternCordillera region of British Columbia andAlberta, an acceleration of glacier retreatwould eventually result in diminished late-season runoff.
CHAPTER 6: POSSIBLE IMPACTS OF CLIMATE CHANGE ON CANADA
56
increased frequency of ice jams andflooding. Damages caused by theseevents are currently estimated to costCanadians $60 million annually.
� The surface area of Lake St. Clair undertypical scenarios for future climatesdecreases by as much as 15%, and thevolume of the lake is reduced by up to35% or more relative to the presentclimate. These water level declines maydisplace the shoreline up to 6 km fromits present location, exposing expansiveareas of lake bottom.
Human Health
According to climate change projections,the health of Canadians would be affectedby more frequent heat waves (or hotspells), especially in cities (heat stress andmortality). People with respiratoryproblems and older people who are lessable to cope with the heat are mostsusceptible. Cities that experience smogepisodes along with the heat are likely tosee the greatest increases in hospitaladmissions and mortality.
Ecology
Changes in Canadian terrestrial,agricultural, forest, and marine ecosystemsthat are projected to occur in response tocurrent climate change projections over thenext century include the following:
� A 100- to 500-km northward shift inmajor ecosystem boundaries(vegetative, wildlife, insect, andmarine) is predicted. For example, theboreal and tundra ecoclimatic zones areexpected to be reduced in size, whereasthe grassland and temperateecoclimatic zones are expected toexpand. The climate suitability foragriculture is expected to expandnorthward, particularly in the Clay Beltof central Ontario, the Peace Riverregion of Alberta, and several areasnorth of 60°N latitude (e.g., the
Mackenzie Valley). Soil capability,however, will limit this expansion.
� Changes in ocean circulation andtemperature will significantly affectfish stocks, migration patterns, andspawning. Scientists suggest that oceantemperature may be an importantfactor in the current disappearance ofthe Atlantic cod stocks and may haveimplications for Pacific salmon as well.The development and persistence ofcoastal aquaculture will be affected.
� The rate of climate change is expectedto be faster than the rate at which mostspecies can adapt, resulting inconsiderable disruption in ecosystemfunctioning. For example, currentmigration rates for forest tree speciesrange from 4 to 200 km per century,whereas climate projections suggestthat a migration rate of 100�500 kmwould be required over the nextcentury.
Changes in climate system characteristicsthat are projected to contribute to theshifting of ecosystem boundaries anddisruption of ecosystem functioninginclude:
� decreases in ocean and lake ice coverand duration;
� decreases in permafrost area andglacier retreat in northern andnorthwestern Canada. The boundarybetween discontinuous and continuouspermafrost is projected to slowly shiftnorthward, resulting in greaterinfiltration of surface water into theground. Current observations suggestthat, over the last century, thepermafrost boundary has retreatednearly 140 km in the central boreal andMackenzie District;
� changes in vegetative growth rates,increasing in some areas anddecreasing in others as the climatebecomes more or less suitable;
CANADA�S SECOND NATIONAL REPORT ON CLIMATE CHANGE
57
� increased severity and frequency ofdrought: agricultural yield will becomemore variable, and forest losses to fireare projected to increase owing to agreater frequency and severity ofdroughts. The 1988 drought on thePrairies, for example, resulted in a 31%reduction in grain production. Thereturn period for this magnitude ofdrought is 35 years. With currentclimate projections, the return periodfor this severity of drought is about17.5 years, or half the current value.Changes in drought may lead toincreased fire frequency and severity inmajor forest areas;
� increased severity and frequency ofstorms: examples of current weatheractivity that may provide an indicationof possible things to come in the way ofstorms are numerous. These storms canrange in severity. An example of anextreme weather event occurred in July1996 in the Saguenay region of Quebec,which was hit with record rainfalls. Asmuch as 280 mm of rain fell over a 72-hour period, resulting in severeflooding, soil and stream bank erosion,property damage in excess of $1 billion,and the loss of 10 lives;
� changes in disturbances and increasedsusceptibility to pests and disease;expansion in the range of current pestsand diseases; the introduction of newwildlife, vegetative, and insect species;and increased competition withunwanted species. As an example,spruce budworm, a major forest insectpest, has been observed in northernforest areas during the 1990s in areaswhere it has never been seen before;and
� changes in Arctic and sub-Arcticpeatlands, as warmer temperatureslead to melting of the permafrost layer,thereby affecting their hydrology �lowered water tables in some areas,
flooded thaw lakes in others, as well aspermafrost erosion � and deliveringincreased sediment loads to rivers.
Projected implications for biodiversityinclude the following:
� Loss of habitats and migrationopportunities are expected to occur,particularly in some populatedmountainous regions, which couldresult in a loss of biodiversity (e.g., lossof breeding areas for waterfowl in theGreat Plains) and therefore haveimplications for waterfowl, tourism,and subsistence lifestyles.
� Local extinctions and extirpations ofnorthern species of fish andinvertebrates may occur as a result ofwarming in the temperate zone (morepronounced in shallow waters).
Climate change can also exacerbate otherenvironmental impacts (e.g., pollution,human stresses, etc.) on ecosystems. Forinstance, it has been found that thewarming and drying in the ExperimentalLakes Area of Ontario have led toincreased acidity of the lakes and declininglevels of dissolved organic carbon. This, inturn, has led to increased clarity of thewater, which allows damaging UV-B raysto penetrate deeper into the lake.
Infrastructure/Activities/Settlements
Water transport changes are projected as aresult of climate change � longer seasonfor Great Lakes�St. Lawrence waterwayand Arctic shipping, greater number of ice-free days, and reduced ice breaking costs,but lower water levels in the Great Lakes�St. Lawrence Seaway system, withincreased transportation costs.
Projected changes in permafrost couldimpact on northern transportation systemsand communities and may require changesin the design of roadways, structures, andpipelines in order to avoid impacts of

CHAPTER 6: POSSIBLE IMPACTS OF CLIMATE CHANGE ON CANADA
58
landslides, slumping, breaks, and leaks. Aswell, winter roads could face reducedseason and/or carrying capacity.
Warmer summer temperatures couldprovide conditions for more severethunderstorms and an increased frequencyof tornadoes, with the attendant risk to lifeand property. The insurance andreinsurance industries are likely to beburdened with greater risks associatedwith investment in property, infrastructure,and resource-based industry shouldclimate change projections materialize.
Climate change could also cause changesin seasonal patterns of energy demand forheating/cooling.
Coastal Zones/Margins
Projected sea level rise would increasecoastal erosion and damage from stormsurges, particularly in low-lying coastalregions like the coast of Prince EdwardIsland and other sensitive areas such asriver deltas.
The projected change in sea levels wouldpresent problems for some coastalinfrastructure, such as harbours andsewage disposal systems. The current sealevel rise of 3.5 mm per year is alreadycausing erosion problems in some areas,with an average rate of shoreline retreat insuch places currently at 0.3 m per year.
Agriculture
Temperature changes may shift much ofthe wheat�maize�soybean-producingcapacity northward, suggesting an increasein production in those areas whereshallow, infertile soils are not a limitingfactor.
Agricultural yields may increase in someareas; however, losses may be experiencedbecause of the projected increase infrequency and severity of droughts andsevere storms.
Changes in food production in Canadaalong with other food-producing regions ofthe globe not only will have potentialimplications for food producers, but willaffect Canadian consumers and exporters.
Forestry
The implications of climate change forCanadian forests and sustainable forestmanagement are considerable. Some of theprojections include the following:
� Growth rates, which depend on anumber of factors, including climate,are expected to be impacted. In somecases they may increase and in othersthey may decrease, depending onwhether or not the current climate is alimiting factor.
� There may be problems with existingspecies regeneration.
� Overwinter dormancy may be affected,and cold damage may increase.
� The natural disturbance regimeinvolving fire may change. Wildfiresare expected to increase, with largerand more intense fires. Most existingforests trace their origins to wildfires,and fire is the primary natural agentthat maintains many forest types oversuccessive generations. Fire, inaddition to causing forest losses andaffecting human safety and health, willbe an important catalyst in speedingecosystem migration and change.
� Changes in insect species (i.e., theirpopulation dynamics and ranges) aswell as disease are likely to increaseforest damage and losses.
The impacts described are projectionsbased on current information from climatemodelling. They will be subject to furtherrefinement and modification as confidencein climate change modelling increases.
CANADA�S SECOND NATIONAL REPORT ON CLIMATE CHANGE
59
Introduction
The United Nations Framework Conventionon Climate Change (FCCC) calls on allParties to �formulate, implement, publishand regularly update national and, whereappropriate, regional programmescontaining measures to � facilitateadequate adaptation to climate change.�This chapter examines adaptation andactivities under way in Canada to meet thisFCCC commitment.
The Nature of Adaptation
Adaptation refers to adjustments inpractices, processes, and structures insystems in response to projected or actualchanges in attributes of climate. Importantattributes include changes to climatevariability and extreme events, as well asan increase in mean conditions such astemperature. Impacts of these climateattributes can be offset by a variety ofadaptive responses, including a wide arrayof measures designed to reduce thevulnerability of systems to climate changeand variability, to enhance the capacity ofsystems to respond in a resilient manner,and to allow people to take advantage ofthe opportunities that their climaticenvironment provides.
Adaptive measures can be broadlycategorized at three different levels �tactical, strategic, and policy/foundation:
� Tactical � actions/decisions taken bythose immediately affected (i.e., at thelevel closest to exposure); these aremore often, but not necessarily limitedto, reactions to external changes.Examples include farmers choosing togrow different crops or choosing to use
different practices (tillage, fertilizer,irrigation, timing, etc.).
� Strategic � actions/decisions,including government interventions(changes in regulations or policy),taken at the system or sector level (e.g.,farming system, fishery, or forestproducts industry). Examples includeactions/decisions taken at the industrylevel by associations of producers,suppliers, and equipmentmanufacturers.
� Policy/foundation � fundamental(broader, multi-sectoral) changes insocioeconomic systems, lifestyles,behaviour, social values, and ethics(consistent with the concept ofsustainable development).
It is also useful to classify adaptivemeasures using the following overallframework:
� Bear losses � where there is nocapacity to respond in any other way orwhere the costs of adaptive measuresare considered to be high in relation tothe risks or the expected damages.
� Share losses � involves sharing thelosses among a wider community andincludes actions adopted by traditionalsocieties and by larger-scale societies(e.g., public relief, rehabilitation, andreconstruction paid from the publicfunds). It can also include sharing oflosses through private insurance.
� Prevent effects � reducingvulnerabilities through increasing theresilience of the affected systems (e.g.,resource management andtechnological solutions).
CHAPTER 7: Adaptation

CHAPTER 7: ADAPTATION
60
� Change use � where the threat makesthe continuation of an economic orsocial activity impossible or extremelyrisky (e.g., more drought-tolerant crop,withdraw development from exposedcoastal areas, etc.).
� Change location � includes relocationof economic or social activities andproviding opportunities for relocationof natural ecosystems.
� Education/awareness.
� Research.
Adaptation is not seen as an alternative tothe required mitigation. Adaptivemeasures will be required, even if globalmitigation is successful, because of thelong lag times in the response of theatmosphere and oceans to theaccumulation of greenhouse gases (GHGs)to date. It should also be recognized that ifemissions go unchecked in the long run,the impacts will become far greater andput more demands on adaptation.Furthermore, unless the projected pace ofclimate change can be slowed down (e.g.,through mitigation), adaptation may bemore difficult, or there may not be enoughtime to adapt.
It is essential, when developing andimplementing a range or portfolio ofresponse options, to recognize thatadaptation takes time and is not cost free.In addition, in developing this responseportfolio, one should consider theapplicability of a particular adaptivemeasure to the environmental, social, andeconomic situation of the nation/region.The fact that this measure has beensuccessfully implemented across a widerange of climate conditions does not meanthat the same adaptive measures can betransferred rapidly from region to region.
Canada�s Response
Within Canada, the following areas havebeen identified for action, includingresearch, to identify adaptation potentialand/or implementation strategies/measures:
� agriculture, specifically includingtechnological development;
� water resources;
� forestry and forest management;
� hazard and coastal zones;
� urban infrastructure and constructionindustry; and
� economics.
The Environmental Adaptation ResearchGroup within Environment Canada wasestablished specifically to provide a federalfocus for atmospheric change researchrelated to generating knowledge that willhelp to improve decision making andfacilitate the development andimplementation of adaptive responses.Included within this aspect of the Group�sresearch agenda are:
� the identification and social andeconomic assessment of adaptivemeasures that can reduce damage fromatmospheric change, increase resilienceor adaptive capacity, and identifypotential social and economicopportunities;
� research on the risks of extremeatmospheric events and changingsocial vulnerabilities; and
� research on the processes ofsocioeconomic adaptation toatmospheric change and the decision-making processes under uncertainty.

CANADA�S SECOND NATIONAL REPORT ON CLIMATE CHANGE
61
A focal point for much of this research isbeing provided through the CanadaCountry Study: Climate Impacts andAdaptation (CCS-CIA). This study is afederal initiative, led by EnvironmentCanada�s Environmental AdaptationResearch Group, which engages a widerange of collaborators in federal andprovincial levels of government, theuniversity community, non-governmentalorganizations, and the private sector. Theobjective of the CCS-CIA is to evaluate theimpacts of climate variability and climatechange on Canada as a whole and toidentify and evaluate adaptive responses.
A two-phased approach has been adoptedfor the CCS-CIA, the first being anevaluation of existing research andinformation and identification of researchgaps, which is to be completed by the fallof 1997. The second phase, beginning inthe winter of 1997/98 and extending overthe next 4�5 years, will address priorityresearch needs identified in the first phase.
Other regional research initiatives beingconducted by the EnvironmentalAdaptation Research Group also have asignificant adaptation component. TheGreat Lakes�St. Lawrence Basin (GLSLB)Project was initiated in 1992 to improveour understanding of the complexinteractions between climate, environment,and society, so that regional adaptivestrategies could be developed in responseto potential climate change and variability.A symposium and report entitled�Adapting to Climate Change andVariability in the Great Lakes�St. LawrenceBasin,� scheduled for 1997, will report onresearch results regarding assessing therisks of climate change and variability inthe basin and identifying sustainableadaptive responses through integration ofscience, governance, industry, and non-governmental perspectives.
Adaptation research was incorporated intothe GLSLB Project to begin addressingsuch questions as: What is adaptation?Why should society adapt? How doessociety adapt? How can adaptiveresponses be developed and assessed? andWhat are the barriers to implementingadaptive strategies?
As a result of this research, factors havebeen identified that should be consideredin the assessment criteria, including:
� Economic feasibility � what are thecosts/benefits, and who pays?
� Technical feasibility � is thetechnology available, and how muchtime is required to implement theadaptation?
� Social acceptability � does societywant it?
� Legal acceptability � are there anylaws, agreements, or policiespreventing or that can facilitateadaptation?
� Political and institutional acceptability� do political representatives want toadapt, and can existing institutionsimplement the measures?
� Environmental sustainability � willthe environment be enhanced forfuture generations?
� Flexibility � do the proposed adaptiveoptions prevent or enhance adoption ofother corrective measures in the future?
The Mackenzie Basin Impact Study (MBIS)was initiated in 1990 and required thecooperation and collaboration of scientistsfrom many disciplines and stakeholdersfrom the region located in Canada�s farnorth (representatives of Aboriginalgroups, industry, colleges, and institutes),as well as representatives from municipal,territorial, provincial, and federal

CHAPTER 7: ADAPTATION
62
governments. The purpose of the studywas to produce an integrated regionalassessment of climate change scenarios forthe entire watershed.
At the MBIS Final Workshop, held inYellowknife, Northwest Territories, fromMay 5 to 8, 1996, the results of research on�what if� scenarios were presented inpaper and poster sessions. Reactions fromstakeholders to �so what� and �whatshould be done� questions were solicitedduring a series of round-table sessions.Comments by participants at the round-table discussions can be characterized by afew observations:
� When asked if the scenarios of whatwould happen if the climate changedmade a difference to their vision of thefuture, most round-table participantssaid �yes� or �yes, in the long term.�
� Some participants said the scenarioresults were new to them and raisednew questions to be addressed �especially for people in the forestindustry or involved in fisheriesmanagement and engineering inpermafrost environments.
� Some stakeholders suggested thatperhaps the only response was to waitand see what happened, but othersencouraged the development of moreproactive responses.
In general, members of northerncommunities said that they could adapt aslong as the climate did not change toorapidly.
A number of natural resourcedepartments/faculties within Canadianuniversities have researchers that haveincluded consideration of adaptive optionsas part of their research agenda. Forexample, researchers within theDepartment of Geography at theUniversity of Montreal have focused theirresearch on evaluating crop yield changes
deriving from a greenhouse gas climatechange and on assessment of adaptivestrategies to such a climate change. Insofaras the studies of adaptation are concerned,researchers conducted farmerreconnaissance surveys and focus groupmeetings with samples of farmers. Theresults of these studies show that, based onclimate change and crop yield informationpresented, although climate change andvariability do not rank high in terms ofadaptation at the farm level, farmerswould modify their strategies if certainagroclimatic indicators in addition to thecommonly used ones (e.g., variabilitymeasures) were available to them.
The agricultural community withinCanada is focusing its attentions ontechnological developments including bio-engineering to increase the resilience ofcrops and farming practices to addressconcerns with respect to climate variabilityand changes. The history of farmingadaptation to climatic variations has beendocumented, and those adaptive strategiesmay shed some light on likely futureoptions given specified climatic andexternal conditions. Among the commonfarm-level adaptive measures identifiedare:
� abandonment of crops in risky areas;
� reductions in farming intensity;
� diversification of products and inputs;
� spatial diversification;
� using new technology; and
� buying private insurance.
Risk management associated with climatechange is expected to become anincreasingly important issue for this sector.
The Canadian forest research community isanalyzing the possible impacts of climatechange and variability on Canadian

CANADA�S SECOND NATIONAL REPORT ON CLIMATE CHANGE
63
forests. The intent of much of this researchis to provide an improved understandingof the processes at work and the resultingvulnerabilities and risks and to obtaininformation required to formulateappropriate adaptive and mitigative policyand management decisions.
Researchers at the Faculty of Forestry atthe University of Toronto are studyingforest management planning underuncertainty and have developedmathematical models that can be used todevelop strategies that account for firelosses and other disturbances. Theirmodels suggest that, when potentiallysignificant fire losses occur, short-termharvest levels should be reduced. Theresult will be an increase in expected long-term harvest levels and harvest flowstability at the expense of some reductionsin profits. Such models can be used tosupport adaptive forest managementstrategies.
Within the Canadian Climate ProgramBoard, the Socio-Economic ImpactsCommittee is addressing aspects of theadaptation to global climate change,including human health, environment,security, and long-term ecosystem researchand monitoring.
In addition, the Canadian NationalCommittees for the InternationalGeosphere-Biosphere Programme and theInternational Human Dimensions ofGlobal Environmental Change Programand the Scientific Committee on Problemsof the Environment have met inconjunction with the Canadian GlobalChange Program (CGCP) Board ofDirectors. This level of integration hasafforded opportunities to link efforts ofcommon interest where there is mutualbenefit to be achieved throughcooperation. Examples include activitiesrelated to human health, environment, andsecurity and concerns regarding land useand change in rural and urban areas.

CANADA�S SECOND NATIONAL REPORT ON CLIMATE CHANGE
65
The global nature of climate changeunderlines the need for the developmentand implementation of international,cooperative solutions.
The United Nations FrameworkConvention on Climate Change (FCCC)recognizes that developed country(Annex I) Parties have traditionally beenthe major source of the build-up ofgreenhouse gas (GHG) concentrations. Asa result, and given their greater financialand technical resources to deal with theproblem, Annex I Parties have shoulderedthe initial responsibility for findingsolutions to the problem of climatechange.
However, forecasts indicate that thefuture trend in emissions may besignificantly altered by the expandingeconomies of developing country (non-Annex I) Parties and the attendantemissions that accompany thisdevelopment. There is growing concernthat non-Annex I country emissions maysoon be of a magnitude to outweighmitigative measures adopted by Annex IParties. As a result, engagement of non-Annex I Parties is critical.
Canada�s FCCC Commitments
The FCCC provides the frameworkthrough which an international,cooperative, long-term effort to addressclimate change can be established. To thisend, Article 4 , and in particularparagraphs 3,4 and 5, commit developedcountry Parties to:
� provide new and additional financialresources to meet the agreed fullincremental costs incurred bydeveloping country Parties incomplying with their obligationsunder Article 12 of the FCCC;
� promote, facilitate, and finance asappropriate the transfer of, or accessto, innovative, efficient, and state-of-the-art environmentally soundtechnologies and know-how to otherParties, particularly developingcountry Parties, while simultaneouslysupporting the development andenhancement of their endogenouscapacities and technologies, in orderto enable them to implement theprovisions of the FCCC; and
In addition, developed country Parties areencouraged to provide financial resourcesto developing country Parties through thenegotiation and development of bilateral,regional, and other multilateralagreements.
Canada contributes to the United Nations(UN) development agencies and otherinternational financial institutions and isinvolved in bilateral projects in developingcountries that work towards theimplementation of the Convention. Asummary of the Canadian contributionsto multilateral institutions andprogrammes from 1994 to 1996 ispresented in Appendix I, Table 9.Appendix I, Table 10 outlines a list ofclimate change related bilateral projectsundertaken in developing countries. Thedetails of two projects with China andIndia are outlined in Appendix I, Tables11a and b.
CHAPTER 8: Financial Assistance and TechnologyTransfer
CHAPTER 8: FINANCIAL ASSISTANCE AND TECHNOLOGY TRANSFER
66
Canada contributes to the annual budgetof the permanent Secretariat of the FCCC.The purpose of the Canadian contributionis to support the costs associated with thefunctioning of the FCCC Secretariat, asthey are specified in Article 8 of theFCCC. In 1996, the Canadiancontribution totalled Cdn $315 000.
Activities Implemented Jointly(AIJ): the Canadian JointImplementation Initiative (CJII)
On July 3, 1996, the Canadian JointImplementation Initiative (CJII) waslaunched as part of Canada�s NationalAction Program on Climate Change(NAPCC).
The CJII Office, which aims to encouragethe broad participation of Canadianindustries in voluntary internationalactions to limit greenhouse gas emissionsas a complement to their domestic actions,is housed at Natural Resources Canada(NRCan). It is supervised by aninterdepartmental steering committee thatincludes representatives from NRCan,Environment Canada, Foreign Affairs andInternational Trade Canada, and theCanadian International DevelopmentAgency (CIDA).
The CJII Office acts as a clearinghouse forproject and funding advice on potentialpilot-phase �activities implementedjointly� (AIJ) opportunities for Canadianindustry. It provides assistance to sponsorsin such areas as the establishment ofgreenhouse gas emission baselines, theidentification of potential sources offunding, as well as the securing of hostcountry approval.
Since the opening of the CJII Office, CJIIofficials have worked with 10 Canadiancompanies on 15 potential projects ineight different host countries. All of these
projects are in the energy sector, and mostof them are in power generation (e.g.,energy efficiency, renewable energy,micro-hydro development, cogeneration� see the project proposal abstractsbelow). The main host countries arePoland, Jordan, Zimbabwe, Indonesia,India, and China.
In addition, the Government of Canadahas concluded and continues to pursue anumber of bilateral and multilateralcooperation agreements on AIJ tofacilitate the development of AIJ projectsbetween Canadian companies and foreignentities.
To date, Canada has concluded fourstatements of intent to cooperate on AIJ.The first statement of intent was signed atthe end of 1995 with Mexico and theUnited States. Under this three-partystatement, the feasibility study of fourpotential AIJ projects in Mexico iscurrently being financed (two in theenergy sector and two in the forestrysector). The second statement was signedwith China (the Ministry of WaterResources) on August 1996 and coverscooperation on energy efficiency,renewable energy � mainly small andmedium-sized hydroelectric powerprojects � and AIJ. The third statement,signed with Korea on January 1997,covers cooperation in the same areas, inaddition to calling for joint Korean�Canadian cooperation on AIJ with a thirdcountry. The fourth was concluded withthe Republic of Latvia. It includescooperation on energy efficiency,alternative transportation fuel, renewableenergy and AIJ. Other cooperationagreements on AIJ are currently beingpursued with Poland, Georgia Costa Rica,and Ukraine.

CANADA�S SECOND NATIONAL REPORT ON CLIMATE CHANGE
67
Some current project proposals are asfollows:
Atlantic Orient Canada has submittedone project proposal to the CJII Office.The project involves the installation ofwind turbines to existing diesel generatorfacilities on a remote island. The projectwill reduce greenhouse gas emissions byincreasing the use of wind power forelectricity generation.
Canadian Hydro Components hassubmitted one project proposal to the CJIIOffice. The project involves thedevelopment of ultra low head hydro siteson existing dams. The project will avoidcarbon dioxide (CO2) emissions bydisplacing the need for new coal-firedenergy generation.
Environmental Technologies China Ltd.has submitted two project proposals tothe CJII Office. Both projects will recovermethane (CH4) from municipal landfillsand utilize the landfill gas to generate atotal of 2.7 MW of power, increasing to8.4 MW in future years. The projects areexpected to reduce carbon dioxideemissions by 120 000 t per year,eventually increasing to 500 000 t peryear.
Merol Power Corporation has submittedone project proposal to the CJII Office.The project involves replacing andupgrading a small hydro facility toprovide electrical power to an industrialoperation. The project will displace newcoal-fired generation.
Ontario Hydro and Hydro-Québec areinvolved in three joint implementationprojects through the E-7, an internationalorganization of eight major electricalutilities from G-7 countries. Each of theseprojects is officially recognized by the hostcountry government. The first project, ledby Ontario Hydro, involves theimprovement of the energy efficiency ofselected oil-fired units in Jordan. The
second project involves the developmentof a renewable energy system in Indonesiabased on photovoltaic solar home systems,a 20-kW photovoltaic�wind hybridsystem, and a 200-kW micro-hydrosystem. The third project involves theconstruction of a 400-kW micro-hydropower station on an existing dam in aremote area of Zimbabwe.
Ontario Hydro Technologies hassubmitted one project proposal to the CJIIOffice and is considering others. The firstproposal involves the development ofsmall hydroelectric resources in remotevillages to reduce carbon dioxideemissions and deforestation. A secondproject involves developing mini-hydrosites attached to particular agricultural orindustrial developments, therebyreplacing diesel generation.
TransAlta Corporation has submitted oneproject proposal to the CJII Office. Theproject involves the enhancement of milkproduction from dairy cattle. This projectwill reduce methane emissions by 450 ktof carbon dioxide equivalent by the year2000.
Woodrising Consulting Inc. has submittedone project proposal to the CJII Office.The project includes carbon sequestrationthrough planted and natural afforestationof marginal lands currently under cornproduction and carbon storage throughcontinuous selective harvests and thegeneration of wood products. Thismoney-making afforestation project willsequester 49 kt of carbon over its 18-yearlife.
Technology Transfer andCapacity-Building Initiatives
Technology is expected to play a criticalrole in reducing greenhouse gas emissionsand in helping to increase greenhouse gassinks. The wider adoption of existing

CHAPTER 8: FINANCIAL ASSISTANCE AND TECHNOLOGY TRANSFER
68
climate-friendly technologies and thedevelopment and deployment of new andimproved technologies will be importantaspects of a market-based response toclimate change concerns.
Climate Technology Initiative (CTI)
The Climate Technology Initiative (CTI)was established during the first CoP to theUnited Nations FCCC in April 1995.Managed by the OECD and theInternational Energy Agency (IEA), theCTI has received endorsement from 23OECD member states, Canada included.
The CTI acts as a clearinghouse topromote and accelerate the development,application, and diffusion of �climate-friendly� technologies. In specific regardto private sector activities, the CTI�smandate includes providing improvedmarket access for emerging technologiesin order to ensure that requiredtechnologies are available and are beingefficiently deployed.
Canadian Consultant Trust Fund for theGlobal Environment (CCTF-GE)
The Canadian Consultant Trust Fund forthe Global Environment (CCTF-GE), a $2-million fund announced in March 1996,aims to enhance global marketopportunities for Canadianenvironmental technologies in all fields.The World Bank uses the CCTF-GE tosupport preparatory work related toprojects that are financed by the GlobalEnvironment Facility.
The CCTF-GE is funded jointly byEnvironment Canada and CIDA.Canadian government officials work inpartnership with Canadian industryassociation representatives and WorldBank officials to:
� identify qualified Canadian consultingexpertise and suppliers; and
� develop mechanisms to strategicallydisseminate intelligence arising fromproject preparation work.
Canadian Environmental Solutions (CES)
Industry Canada has produced aninnovative multi-media informationproduct called the CanadianEnvironmental Solutions (CES) database,which is available on CD-ROM and theInternet (http://strategis.ic.gc.ca/sc_indps/canenvir/engdoc/openscrn.html). The CES identifiestechnological solutions to a wide range ofenvironmental problems and directs theuser to companies in Canada that developtechnologies capable of providing therequired solutions.
Included in the CES is information onenergy efficiency and renewable energyoptions for reducing the environmentalimpacts (including climate change) ofenergy use. The CES also providesinformation on research and development(R&D) related to energy use and the fullrange of air quality issues, climate changeincluded.
International Model Forest Program
Canada has long been cognizant of thevalue of global cooperation inimplementing sustainable developmentpractices as they apply to forest resources.In this context, Canada�s domestic ModelForest Program has been expanded into aglobal network of model forests. Theresultant International Model ForestProgram is designed to promoteinternational partnerships in thesustainable development andmanagement of forest resources. Theprogram encompasses a number ofsustainable forest management anddevelopment objectives; with regard toclimate change, it fosters internationalcooperation and exchange of ideas onforest offsets and their use as carbondioxide sinks.

CANADA�S SECOND NATIONAL REPORT ON CLIMATE CHANGE
69
To date, Mexico, Russia, and Malaysiahave joined in this internationalpartnership led by Canada.
Energy Efficiency and Renewable EnergyJoint Ventures
The Canadian government is assisting indeploying renewable energy and energyefficiency technologies by providingtechnical support to Canadian companies.Recently, the federal government led aseven-company small hydro technologyand industry mission team to Poland.Joint ventures for the manufacturing andcommercialization of Canadiantechnologies will be established that canaddress some of Poland�s keyenvironmental issues. The federalgovernment, in partnership with theCanadian Manufactured HousingAssociation and key Japanesedepartments, is assisting in exportinghigh-quality, energy-efficientmanufactured houses to Japan.
Changes to Canadian Export Financing
New equity financing has been earmarkedby the Canadian Export DevelopmentCorporation to support the developmentof new export sales financing mechanismsand new partnerships with exportersthrough the commercial banks. Suchfinancing is critical to ensure thatCanadian companies can fully realize theopportunities before them in internationalmarkets. This support will be available toall sectors, including Canadian companiesdealing with the export of environmentaltechnologies, ensuring that high-qualityCanadian technologies are available todeveloping nations.
Clean Coal Technologies
In the area of clean coal technologies,Canada continues to work with keyindustry players to develop leading-edgetechnologies to reduce the levels of
pollutant emissions such as organics andtrace elements from combustion processes.
As part of Canada�s international effortsaimed at reducing greenhouse gasemissions, the Advanced CombustionResearch group within NRCan hasrecently transferred its furnace modellingexpertise to the Thermal Power ResearchInstitute in China. In China, the need toimprove the performance of existing coal-fired power plants has never been greater.The demand for electrical power isexpected to grow at a rate of 6�8%annually over the next decade. Pilot-scaleresearch and furnace modelling arerecognized as very cost-effective tools totroubleshoot, optimize, and increase theenergy efficiency of existing facilities aswell as provide a sound foundation tointroduce new designs or design changesto existing facilities. This initiative tookplace under a British Columbia Hydrocontract as part of CIDA�s bilateralagreement with China.
Canadian International Business Strategy(CIBS)
The environmental industry is one of 23key industry sectors contributing to theCanadian International Business Strategy(CIBS). Through the involvement ofNational Sector Teams consisting ofgovernment and private sectorrepresentatives, CIBS gives Canadianindustry an opportunity to influencegovernment�s international businesspriorities. Each sector-specific strategyidentifies Canada�s priorities for capturingemerging global trade, technology, andinvestment business. Alternative fuels andnatural-gas-fuelled vehicles represent twoexamples of CIBS strategies with climatechange implications.

CHAPTER 8: FINANCIAL ASSISTANCE AND TECHNOLOGY TRANSFER
70
Canadian Environmental IndustryStrategy (CEIS)
The Canadian Environmental IndustryStrategy (CEIS) is designed to assist the�green� industry in three main areas:improving the delivery of governmentservices to the industry; helping todevelop and commercializeenvironmental technologies; and, inparticular, expanding markets for thisindustry here in Canada and around theworld. Under the auspices of the CEIS,Environment Canada and IndustryCanada administer a number of bilateralenvironmental cooperation agreementsaimed at implementing joint projects inthe areas of capacity building and cleanenvironmental technologies andprocesses. With respect to climate change,Canadian firms are, for example, workingon a small-scale hydroelectric project inPoland, developing an emission testingfacility in Mexico, and updating Russia�sbuilding code to foster energy-efficienthousing construction. A study has alsobeen prepared documenting opportunitiesfor Canadian energy and energyconservation technologies.
Canadian Environmental TechnologyAdvancement Centres (CETACs)
The federal government, in partnershipwith provincial governments,environmental industry associations, andthe private sector, has established threeCanadian Environmental TechnologyAdvancement Centres (CETACs) inresponse to findings contained in Buildinga Stronger Environmental TechnologyExploitation Capability in Canada, astudy of the Canadian environmentalindustry conducted by EnvironmentCanada in 1992. CETAC organizationsare private sector, not-for-profitcorporations that are committed tohelping small and medium-sizedenterprises (SMEs) overcome the barriersinvolved in the commercialization of new
environmental technologies. They alsooffer comprehensive technical andbusiness services to help SMEs capturedomestic and international markets.
There are currently three CETACorganizations running in Canada: theOntario Centre for EnvironmentalTechnology Advancement, CETAC-WEST,located in Calgary, Alberta, and Enviro-Access Inc., the Quebec and Maritimearm of the CETAC organization.
Other Multilateral and BilateralInitiatives
Commission for EnvironmentalCooperation (CEC)
The Commission for EnvironmentalCooperation (CEC), with support fromthe Canadian government, is undertakingfour pre-feasibility studies for greenhousegas mitigation projects in Mexico � twoemission reduction projects and twocarbon sequestration projects. Thesestudies are being carried out in order todetermine the environmental, economic,and operational feasibility of the projects,as well as to facilitate the implementationof AIJ projects in the North American FreeTrade Agreement (NAFTA) region. Theresults of these pre-feasibility studies areexpected in late 1997.
Canada�Costa Rica Study on theAdvantages of Joint Implementation
CIDA and Environment Canada arefunding a study that will assess thedevelopmental and environmentaladvantages of joint implementation forCosta Rica. The study will identifyopportunities for Canadian investment,both financial and technology based, ingreenhouse gas limitation projects thathave developmental benefits for CostaRica and that contribute to the overallabatement of global greenhouse gasemissions.

CANADA�S SECOND NATIONAL REPORT ON CLIMATE CHANGE
71
Canada�Mexico�U.S. Statement of Intentto Cooperate on Climate Change and JointImplementation
In October 1995, Canada, Mexico, andthe United States signed a statement ofintent to cooperate on climate change andjoint implementation (JI). In signing thestatement of intent, the Parties agreed tofacilitate cooperation on issues of mutualinterest in the area of climate change,including JI, the transfer of greenhousegas mitigation technologies, andeducation, training, and informationexchange.
Conferences and Workshops
GLOBE �96 � March/April 1996
The governments of Canada and theProvince of British Columbia, along withthe United Nations Development Programand a number of private sector partners,sponsored the Globe �96 Trade Fair andConference on Business and theEnvironment in Vancouver, BritishColumbia. During Globe �96,environmental technologies wereshowcased alongside corporate andpublic policy sessions on global andregional sustainable development issues.Renewable energy and sustainabletransportation systems were featured. Inaddition, there was a session devotedexclusively to climate change innovations.The event was attended by over 7 000international business leaders from thePacific Rim, Asia, the Americas, andEurope.
OECD Sustainable TransportationConference � March/April 1996
Over the past half century, our ability tomove individuals and goods longdistances at relatively low costs has maderemarkable progress. However, thisadvancement has its associated costs. The
Asia-Pacific Economic Cooperation(APEC) Committee on Harmonization ofEquipment Standards
In recognition of its expertise indeveloping, implementing, and enforcingequipment energy efficiency standards,Canada will chair the new Asia-PacificEconomic Cooperation (APEC)Committee on Harmonization ofEquipment Standards. The committee willseek to harmonize test methods andassessment systems. Harmonizationamong APEC nations could reduce thecosts of trade in energy-efficient products,which in turn would mean lower pricesfor consumers and increased use of theseproducts.
Hemispheric Project on Building andEquipment Efficiency
Canada is taking the lead in aHemispheric Energy Initiative project onbuilding and equipment efficiency, one ofseven areas that have been identified forpotential action to reduce trade barriers inthe western hemisphere. To launch thisproject, Canada issued a discussion paperand hosted a workshop on building andequipment efficiency for all westernhemisphere nations and four multilateraldevelopment banks in the spring of 1997.
Canada�Mexico Memorandum ofUnderstanding (MOU) on EnergyEfficiency and Alternative Energy
In June 1996, Canada and Mexico signeda Memorandum of Understanding (MOU)on Energy Efficiency and AlternativeEnergy. The MOU commits NRCan toshare information with Mexico onCanada�s energy efficiency andalternative energy programs and toexamine ways to increase trade andinvestment with Mexico in these areas.Government officials from both countriesare now developing initiatives to carry outthese undertakings.

CHAPTER 8: FINANCIAL ASSISTANCE AND TECHNOLOGY TRANSFER
72
growth in demand for transport servicesis rapidly outpacing the ability ofgovernments to provide infrastructure, aswell as posing significant risks to publichealth and the environment at local,regional, national, and global scales.
In response to these concerns, Canadahosted, in conjunction with the Globe �96Trade Fair and Conference on Businessand the Environment (see above), anOECD Sustainable TransportationConference.
IEA International Conference:�Technologies for Activities ImplementedJointly (AIJ)�
The IEA Greenhouse Gas R&DProgramme, established in 1991 toevaluate technologies that can be used tomitigate greenhouse gas emissions fromthe use of fossil fuels and identify targetsfor useful R&D, hosted a �Technologiesfor Activities Implemented Jointly (AIJ)�Conference in Vancouver, BritishColumbia, in May 1997. The main aim ofthe conference was to provide theaudience with examples of practical AIJexperiences that highlight the innovativeuse of climate change technologies.
Workshops
In 1996, Canada contributed US$9 000towards the organization of an informalFCCC workshop on the development ofguidelines for national communications(i.e., national reports) from non-Annex 1Parties to the FCCC.
Canada contributed both financially (Cdn$50 000) and substantively to thedevelopment and organization of aCaribbean Basin�Canada Workshop onAdaptation to Climate Change, whichwas held in Port of Spain, Trinidad, fromOctober 21 to 23, 1996.
Canada also participated, andcontributed US$20 000, to theorganization of the InternationalWorkshop on Greenhouse Gas MitigationTechnologies and Measures organized bythe U.S. Country Studies Program, whichwas held in Beijing, China, on November12�15, 1996. The Canadian contributionprovided funding for the participation ofrepresentatives from developing countriesand countries with economies intransition.
Canada co-sponsored the organization ofa series of three regional workshops ontechnology transfer, held in the fall of1997 in Bangladesh, Brazil and Senegal.Financial contribution amounted Cdn$60 000. The purpose of these events wasto increase knowledge about theexperience with, and the needs fortechnology transfer from the recipient�spoint of view and to acknowledge theclimate change actions already in place indeveloping countries. Results will bereported to the Third Conference of theParties in Kyoto in December 1997.

CANADA�S SECOND NATIONAL REPORT ON CLIMATE CHANGE
73
Canada recognizes that the best availablescientific knowledge already provides asound basis for initiating domestic andinternational action to mitigate the risks ofclimate change. Even so, it also recognizesthat many areas of scientific uncertaintystill remain, that these uncertainties mustbe addressed in order to make informeddecisions on future policy response, andthat it has a commitment under the UnitedNations Framework Convention onClimate Change (FCCC) to promote andcooperate in relevant research andsystematic observation. Equally important,such improvements in scientificunderstanding will also better enableCanadians to utilize their current climateresources effectively and adjust to achanging environment with minimumdisruption to the national economy. InCanada�s National Action Program onClimate Change (NAPCC), four relatedstrategic �thrusts� for such work have beenidentified, as follows:
� improve research networks withinCanada;
� improve evaluation and coordinationof systematic observations;
� enhance statistical and analytical toolsto better understand the causes offluctuations and changes in Canada�sclimate; and
� develop appropriate tools to assessCanadian options and opportunities formeasures aimed at reducing the risks ofclimate change.
In a time of fiscal restraint and programreview, achieving the above objectives hasbeen a significant challenge. However,substantial progress has been made in each
of the four major thrusts, with consequentbenefits in incremental knowledge ofclimate processes and behaviour and of thepossible implications of climate change forCanadians. These are summarized in thefollowing sections.
Data Collection and Monitoring
Canada is a vast country involving a largerange of climate regimes and ecosystemtypes, many of which are in inhospitablelocations remote from populated areas.Hence, systematic observations andmonitoring by traditional means of directhuman data collection are increasinglydifficult and costly, and the need foreffective coordination is ever moreimportant.
Climate Monitoring
Canada continues to maintain a nationalnetwork of climate observing stations(many of which are operated on avolunteer or cooperative basis) and acomprehensive climate data managementsystem to provide timely access to qualitydata. A process for rationalizing thesemonitoring activities in an effort to reduceoverall costs is now under way and hasraised serious concerns about the potentialfor deterioration of the quality, quantity,and accessibility of such data. Theestablishment, in 1996, of the CanadianNational Committee for the Global ClimateObserving Systems (GCOS) is one newinitiative that is expected to help addressthis and other concerns. This committee,consisting of representatives of theCanadian scientific and data collectioncommunities, provides a nationalmechanism for coordinating systematicobservations and data collection activities
CHAPTER 9: Research and SystematicObservations
CHAPTER 9: RESEARCH AND SYSTEMATIC OBSERVATIONS
74
within and adjacent to Canada and forexploring ways in which the critical dataneeds of Canadian and internationalresearchers can be adequately met.
Ecological Monitoring
Complementing the GCOS initiative arethe Acid Rain National Early WarningSystem (ARNEWS) and the EcologicalMonitoring and Assessment Network(EMAN). ARNEWS is a nationalbiomonitoring system designed to detectearly signs of the effects of atmosphericchange on forests so that action can betaken to forestall anticipated damage. Itwas established in 1984, with 100permanent sample plots located across theecozones of Canada. Since 1992, thenetwork has been expanded to 151 plots.The EMAN, an integrated ecologicallybased observing system, is currently beingestablished to increase scientificunderstanding of the ecological impacts ofa changing environment. To date, some 72sites, with at least one in each ecologicalregion of Canada, have been tentativelyidentified for the network.
Monitoring Atmospheric Composition
Canada now continuously monitorsgreenhouse gas (GHG) concentrations andair chemistry at three long-term stationsalong the eastern, northern, and westerncoastlines. A fourth station has operated ininterior regions for several years, but itsfuture is now questionable because of fiscalconstraints. Periodic measurements ofcarbon dioxide (CO2) in Pacific surfacewaters are also being continued through aships-of-opportunity program.
Past Climates
A national effort is under way to obtainadequate data from paleogeologicalsources to reconstruct the last 20 000 yearsof Canada�s climates at 1 000-yearintervals. Particular attention has been
given to the most recent 6 000 years toprovide a sound basis for verifying theaccuracy of general circulation models(GCMs).
National Energy Use Database
Canada has had in place, since 1991, aNational Energy Use Database (NEUD)with the objective of improving knowledgeabout energy consumption at the end-uselevel. NEUD is a partnership among thefederal department Natural ResourcesCanada (NRCan), other governments, andthe academic community. NEUDencourages the regular collection of dataon energy consumption at the end-uselevel, the characteristics of energy-usingequipment and buildings, the attitudes andbehaviour of Canadian consumers towardsenergy use, and the adoption of energy-efficient technologies. This data collectionis important, as the data can be used toassess progress in energy efficiencyimprovements and to identify areas ofopportunity for further action. The data arealso relevant for developing indicators ofchanges in energy-related greenhouse gasemissions and opportunities for mitigativeactions. NEUD is helping Canada tobecome a world leader in this type ofinformation collection and analysis.
Canadian Research on ClimateChange
Improved Research Networks
The Canadian Climate Program Board andits subsidiary committees continue to playimportant roles in coordinating researchwithin Canada into climate change and itsimpacts. Important progress has also beenmade in formalizing the networkingbetween scientists in academic andgovernment institutions involved inclimate-change-related research in Canada.The most visible aspect of this progress hasbeen the development and implementation
CANADA�S SECOND NATIONAL REPORT ON CLIMATE CHANGE
75
of a formal Climate Research Network,which links research efforts withinEnvironment Canada with those in almostall of the major Canadian universities inorder to better understand key chemical,physical, and biological processesimportant to the climate system and toparameterize these for inclusion in theCanadian GCM. Other governmentdepartments have also adopted similar,although less formal, cooperative effortswith academic institutions. In addition, theNatural Sciences and Engineering ResearchCouncil (the primary source of researchgrants to the university-based scientificcommunity) has identified several keyclimate change research priorities,including studies in ocean circulation, thecarbon cycle, paleoclimates, and watercycle processes. Finally, the nationalProgram on Energy Research andDevelopment (PERD) has established anew Energy and Climate Change Task tocoordinate and provide a significantincrement in funding to climate changeresearch projects within federalgovernment agencies that are particularlyrelevant to policies with respect to energysupply and demand in Canada.
New Developments in Climate ProcessResearch
Greenhouse Gas Fluxes
Results from the Boreal EcosystemAtmosphere Study (BOREAS, acooperative Canada�U.S. project into therole of central Canada�s boreal forest in theclimate system), together with those fromother studies into carbon and methane(CH4) fluxes from Canada�s boreal forests,wetlands, and agricultural regions, havehelped clarify the role of Canada�s naturalecosystems in global cycles of greenhousegases. Canadian forests, for example, werea significant sink for atmospheric carbonuntil the 1970s, consistent with evidencefrom global carbon cycle models of a majormid-northern hemisphere terrestrial
carbon sink. However, this regional borealforest sink has become a net source foratmospheric carbon dioxide during thepast decade owing to a significant increasein biomass loss from wildfires and insects.Models predict that this trend willcontinue for at least the next few decades.Efforts are currently under way todetermine the effects of climate change onthe carbon cycle of Canadian forests.
Studies into methane fluxes from Canadiannorthern wetlands have shown netemissions well below previous estimatesbased on lower-latitude wetlands and havethus helped to revise estimates for globalemissions from high-latitude wetlands.Studies are also under way to assess theextent of gas hydrates in sediments ofCanada�s north and their potential forreleasing large volumes of methane as aresult of regional warming. Finally, carbonflux studies over the Pacific Ocean haveindicated a large regional sink in thenorthern Pacific, similar to that of theNorth Atlantic and counter to pastconclusions. Meanwhile, two global carboncycle modelling groups are using theseresults in developing simulations of thebehaviour of the global carbon budget andits response to change.
Climate Processes
Canada�s participation in the World OceanCirculation Experiment and the JointGlobal Ocean Flux Study has helpedimprove international understanding ofboth physical and biological oceanprocesses and contributed to thedevelopment of the ocean component ofCanada�s atmosphere�ocean GCM. Plansare also under way for Canada�sparticipation in international studies of theArctic Ocean system, although fundingapproval has not yet been achieved.Meanwhile, Canadian research intohydrological processes in the permafrost-saturated and largely snow-covered landsof the Mackenzie River Basin, a unique
CHAPTER 9: RESEARCH AND SYSTEMATIC OBSERVATIONS
76
contribution to the international GlobalEnergy and Water Cycle Experiment, hashelped to specifically address Canadianpriority interests in the region and to betterdefine the role of northern hydrologicalprocesses, including related cloudformations, in the global climate system.
Climate Modelling
The Canadian general circulationmodelling group is currently completing amulti-century experimental transient runwith the Canadian Climate ChangeGeneral Circulation Model (CCCGCM II)atmospheric model coupled to an oceanmodel. Estimated trends in radiativeforcing due to increased concentrations inboth greenhouse gases and sulphateaerosols are included. Results to date showexcellent agreement between modelprojections for the past century andobserved climate trends and predict acontinued increase in global temperaturesat rates of about 0.2°C per decade to theyear 2040. Analyses of model resultsrelative to future trends in frequency andseverity of extreme weather events are nowin progress. The development of the thirdgeneration of the Canadian GCM,incorporating many aspects of the resultsof climate process research noted above, isnear completion, with assessment of modelperformance and subsequent climatechange experiments planned for early1997. Meanwhile, models to incorporatelocal-scale surface interactions for high-resolution simulations of regional climates,for simulating chemical and dynamicprocesses in the middle atmosphere, andfor studying paleoclimates are underdevelopment at three different universitycentres. Studies are also continuing on themeasurements of surface and atmosphericradiation budgets and on the effect ofclouds and aerosols on radiative forcing,using satellite data.
Climate Change Detection
Analyses of observed climate conditions inCanada indicate an average increase inannual temperatures of 1°C during the pastcentury, with greatest warming in winterand spring seasons. Some regions havewarmed by almost 2°C, while others havecooled. There appears to be an increase inthe frequency of tornadoes in westernCanada in recent years, but there is noconclusive evidence to suggest thatextreme wind and rainfall events havechanged significantly or that snowlines incentral Canada have retreated. Analyses ofsynoptic patterns in the northernhemisphere show indications of asignificant increase in intense winterstorms during the past two decades.Meanwhile, there is further evidence ofglacier retreat in the Canadian Rockies andof permafrost retreat in Canada�s north. Anetwork for detectors for monitoringyearly thaw has recently been establishedthroughout the Mackenzie Valley.
Efforts to better understand the naturalbehaviour of extreme weather events andhow such may respond to climate changeare being enhanced. New analyticaltechniques developed for the analysis oftemperature extremes from climate datarecords are now also being applied toprecipitation. Studies in paleoclimates ofregions such as the drought-pronesouthern Prairies are providing additionalinformation on these variables for previousdecades, centuries, and millennia.
Impacts of Climate Change
Canadian studies into how climate changemay affect ecosystems and society haveprogressed to a second generation ofanalysis focused on integrated regionalstudies, rather than simpler single-sectoranalysis. The first such study (theMackenzie Basin Impact Study, or MBIS),focused on the Mackenzie Basin inCanada�s north, is near completion. Results
CANADA�S SECOND NATIONAL REPORT ON CLIMATE CHANGE
77
suggest a net decline in basin runoff andlake levels, earlier snowmelt and ice break-up, and receding permafrost. Theseprimary effects would collectively causeincreased land instability and majorecological changes to peatlands, forests,wildlife, and communities in the region. Asimilar integrated study is now under wayin the Great Lakes�St. Lawrence Basin (theGLSLB Project), in cooperation with U.S.researchers, and a third for the CanadianPrairies is under development. Theambitious Canada Country Study: ClimateImpacts and Adaptation (CCS-CIA), whichwill consider the integrated effects ofclimate change for all of Canada, is now inthe planning stage.
Other studies into the impacts on specificcommunities and economic sectors alsocontinue. These include efforts to betterunderstand the effects of climate change onnatural hazards (e.g., landslides andcoastal erosion) and the insurance industry,the implications for human health inCanada, and the vulnerability of resourcessuch as renewable energy, forests, oceanfisheries, and agriculture.
Since 1993, Canada has made substantialprogress in the development of satellite,aircraft, and ground-based tools for theassessment of terrestrial ecosystems andthe interactions of ecosystems with climateon a seasonal and interannual basis.Satellite, aircraft, and ground-based dataproducts are being developed andvalidated as a key feature of the BOREASstudy and in other parts of Canada. Theresulting data products will serve inmodelling studies and for the detection ofecosystem changes at various spatialscales, from the landscape to national level.Results to date indicate large spatial andinterannual variability in ecosystemcharacteristics, necessitating dense andlocation-specific monitoring approaches.
Energy Technology Researchand Development
The federal department NRCan providesnational leadership in energy technologyresearch and development (R&D) throughthe following approaches:
� Through its laboratories, thedepartment works in close cooperationwith industrial, provincial, andinternational partners to develop andtransfer scientific knowledge andtechnologies in energy efficiency,renewable energy, and alternativetransportation fuels.
� Through the federal PERD, thedepartment supports some of the aboveresearch in its laboratories as well asresearch in other participatingdepartments (including agriculture,fisheries) on hydrocarbons, climatechange, transportation, and energyefficiency, recognizing that energy cutsacross the mandates of many federaldepartments.
� Through the International EnergyAgency�s (IEA) Greenhouse GasResearch and Development program,which Canada is currently chairing,NRCan works to evaluate technologiesfor the mitigation of greenhouse gasemissions from the use of fossil fuels.In addition to holding a successfulconference on mitigative options inLondon, England, in 1995, the programundertook a series of studies in theareas of power generation technologies,advanced capture techniques, oceanstorage of carbon dioxide, chemicalutilization of carbon dioxide, and fullfuel cycle studies. Future work of theprogram will expand on the abovetopics and will also look at additionalissues such as monitoring andcontrolling methane emissions, forestryfor carbon storage, and practical R&D

CHAPTER 9: RESEARCH AND SYSTEMATIC OBSERVATIONS
78
in the area of carbon dioxide recyclecombustion. Provinces such as Albertaalso provide funding support for theprogram.
NRCan currently manages a balancedportfolio to accelerate the marketintroduction of proven technologies whileat the same time investing with partners innew technologies that will significantlycontribute to reduced greenhouse gasemissions in the future.
What follows is an overview of NRCan�stechnology transfer and R&D activities.
Industrial Sector
The industrial sector is one of the areaswhere research and technology transferefforts will yield the largest impact oncarbon dioxide reduction. It is a largeenergy-consuming sector in Canada andaccounts for 23% of Canada�s total carbondioxide emissions.
Even though the potential for reduction issignificant, diversity in industrial energyuse and the fact that energy is a relativelysmall portion of production costs make itdifficult to fully tap this potential.
Canada focuses its industrial energyefficiency activities on key industrialprocesses such as combustion, drying, anddewatering, in addition to process analysisand optimization.
The industry R&D consists of a targetedcost-shared program supporting thedevelopment and use of new energy-efficient processes, products, systems, andequipment proposed by industry. Theprogram forges links between technologydevelopers and end users to encourage thewidest possible application oftechnologies.
The in-house activities of NRCan�sindustrial research efforts focus onadvanced combustion work, thereby
helping industrial and energy utilitycompanies reduce their energy use byoptimizing combustion processes. Work isalso undertaken in developing advancednatural gas technologies.
In the area of clean coal technologies, thefederal government is continuing to workwith key industry players to developleading-edge technologies to reduce thelevels of pollutant emissions such asorganics and trace elements fromcombustion processes. A verticalcombustor was built in 1995 and forms anintegral part of NRCan�s research activities.This facility will be used in studying theeffects of chemical additives andparticulate capture devices on thedistribution of trace elements, as well asmodifying the production process toproduce concentrated carbon dioxide forsequestration and enhanced oil recovery.
Canada has also established a NationalCombustion Network on the Internet(http://www.combustion-net.com) toassist in creating linkages among keyplayers interested in the development anddeployment of high-efficiency, low-emission combustion processes. Thisnetwork will, for example, assist increating strategic alliances to undertakenew research or to enhance public�privatesector partnerships in seeking newnational and international opportunities.
An example of international collaborationis the assistance that NRCan, together withB.C. Hydro and CIDA, is providing toChina in conducting R&D to increase coal-fired plant performance. By transferringknow-how on modelling and pilot plantoperation, China will improve theperformance of its boilers in terms of bothincreased energy efficiency and reducedemissions.
Buildings Sector
There are still many issues to be addressedand many opportunities to be explored in
CANADA�S SECOND NATIONAL REPORT ON CLIMATE CHANGE
79
both the residential and commercial areas.Energy efficiency and cost-effectivenessimprovements are still needed for heating,ventilation, air conditioning, insulation,windows, lighting, and buildingassemblies, as well as heat managementand life-cycle performance of buildingsand their components.
Research efforts focus on residential andcommercial buildings by developing anddeploying technologies, providing supportfor standards, and providing analytical andsimulation capabilities.
Canada will continue to emphasize the keysustainable housing elements that haveexisted in the past. The �building as asystem� approach will focus on producingheat efficiently, minimizing thermal losses,efficiently distributing energy, andincreasing the comfort and health of theoccupants. This approach will improve thesustainability of buildings over time, byimproving the lifetime of the stock whileminimizing waste production. All of theseobjectives will help maximize thereduction of carbon dioxide from bothresidential and commercial buildings.
Efforts are being made to makecommunities more energy efficient byapplying technologies such as districtheating and cooling and the combinedproduction of heat and power.
Renewables
Canada�s strategy in the development ofrenewable energy technologies is to assistindustry in improving the cost/performance and reliability of existing andemerging renewable energy technologiesand in commercializing them in Canadaand international markets. Thegovernment is assisting in deployingrenewable and energy efficiencytechnologies by providing technicalsupport to Canadian companies.
Research efforts of the past have resultedin reliable technologies that are cost-effective in niche markets. Canada hasbeen successful in applying leading-edgetechnologies in world markets. We are alsotaking advantage of increased demand forphotovoltaics, wind, and small hydro inremote communities and in newlyemerging economies. R&D investments arebeing made to further reduce the cost orincrease the reliability of existingtechnologies and to develop newcompetitive products such as wind energyequipment for cold climates or micro-hydro. This will ensure that renewablesplay a prominent role in reducing futuregreenhouse gas emissions, both nationallyand internationally.
To encourage renewable energyinvestments, Canadian tax rules have beenchanged to create an essentially levelplaying field for all energy investments inCanada. Changes improve tax rules for thefinancing of some renewable energy andconservation projects, including theextension of flow-through shareprovisions, originally available to oil, gas,and mining investments.
Recently, Canada�s Minister of NaturalResources and Minister of Environmentannounced the Green Power ProcurementInitiative, a program to promote the use ofrenewable energy in Canadian governmentbuildings. This program will help test anddeploy leading-edge renewable energytechnologies in photovoltaics, wind, smallhydro, and bioenergy.
In Alberta, the electricity generation sectorhas been restructured, allowing for cost-effective renewable electricity sources tocompete against conventional sources.Other provinces are also reviewing thestructure of their electricity generationsectors.

CHAPTER 9: RESEARCH AND SYSTEMATIC OBSERVATIONS
80
Transportation Sector
Within the transportation field, there areseveral mechanisms for reducing climatechange effects. These include improvedefficiency of vehicles, substitution ofalternative fuels, and development of zero-emission vehicles (ZEVs).
The Motor Vehicles Manufacturers�Association signed a Memorandum ofUnderstanding with NRCan in November1995 to improve fuel efficiency through abalanced approach aimed at vehicleowners and operators as well as vehicletechnology. The aim is to contribute togreenhouse gas emission limitation byhelping drivers realize the benefits of fuelsavings, influencing on-road energyefficiency through vehicle inspection andmaintenance programs and on-boarddiagnostic equipment on new vehicles, andpromoting technological progress in thefuel efficiency of new vehicles.
Efforts in the alternative fuel area arefocused on electronic controls, light-weightnatural gas cylinders, heavy-duty vehicleapplications, cost reduction, performance,standards, and infrastructure development.These are contributing to removingtechnical and institutional barriers toapplications of alternative fuels.
The strategic thrust of Canada�s efforts willbuild on existing Canadian technologiesand expertise and will centre around theZEV technologies, focusing on thedevelopment of components rather thanvehicles. This will include efforts inadvanced energy storage systems(flywheels, batteries, light-weightcylinders), hybrid vehicles, advancedmaterials, and advanced power systems.Focus will be on developing and takingthese technologies to the marketplace. Inthe short term, technology developmentwill be focused on those fuels that willresult in ultra-low-emission vehicles.
PERD�s Energy and ClimateChange Task
The new Energy and Climate Change Taskof PERD will target its activities to nicheareas where it can build on Canadianexpertise and strengths previouslydeveloped. The Task has identified fourmain areas of study. Common to them all isthe principle, driven by limited resources,that the Task will not fund widespreadbaseline data collection work.
Greenhouse Gas Cycles and Storage
Greenhouse gas cycles and storage that areaffected by the energy production and usesectors need to be better understood.Methodologies and tools for themeasurement and assessment of the effectsof anthropogenic greenhouse gasemissions on these cycles will bedeveloped. Carbon dioxide and methanewill be emphasized, as these are mostclosely associated with the energy sectorand are the major greenhouse radiativeforcing gases.
Climate Change Prediction and Detection
The systematic observation of Canada�sclimate and the investigation of climateprocesses particularly relevant to Canada�sterritory (such as those related to snow andice, boreal forests, permafrost, and adjacentoceans) are important contributions tointernational efforts. This work willcontinue. Work will also be initiated on therecent and increasing importance of thecooling effects of aerosols that mask theradiative forcing effect of increasedconcentrations of greenhouse gases. TheTask will also support specific studies ontechniques for understanding historicalrecords, for present-day detection, and forprediction of climate change in the areas ofland cover, water, biota, and theatmosphere. Studies will be carefully
CANADA�S SECOND NATIONAL REPORT ON CLIMATE CHANGE
81
chosen to complement the greater body ofclimate work organized within Canadaand internationally by groups such as theClimate Change Program Board and theIntergovernmental Panel on ClimateChange (IPCC).
Capture of Greenhouse Gases and TheirDisposal
The Task will address the development oftechnologies for the capture of greenhousegases (after their formation) and theirdisposal. There are two broad means ofcapturing greenhouse gases: (1) from thegreenhouse-gas-forming process, usuallycombustion, before they are released, and(2) from the atmosphere, after they arereleased. The work in both areas is in theearly stages, and large resources cannot yetbe assigned to them. Capture before releaseis most advantageous from large stationarysources, such as electric power stations; itis also expensive. Thus, work is necessaryto reduce the cost of capture and to modifyprocesses so that the exhaust stream has ashigh a concentration of carbon dioxide aspossible. The subsequent sale of carbondioxide, potentially for improved oilrecovery, provides a partial incentive forthe development and deployment ofcapture technologies. The concentration ofcarbon dioxide in the atmosphere is verylow. Stimulating natural uptakes, in eitherland- or ocean-based processes, is seen as amore viable means of taking carbondioxide directly from the atmosphere. As astep in this direction, the Task will firstfocus its attention on the forests, as theyrepresent an established source for land-based uptake.
Impact of Climate Change on theCanadian Energy Sector
Finally, the Task will study the possibleimpact of climate change on the Canadianenergy sector and identify appropriateadaptive strategies. Although some studieshave been done, they are few and
scattered. An initiative for a morecomprehensive attack has been launchedas the CCS-CIA, which could help the Taskfocus on areas of greatest need. It is clearthat there are many areas of concern,including changes to water availability forhydroelectricity, changes to electricitydemand in summer for space cooling andin winter for space heating, and changes tothe stability of permafrost, which isimportant for resource exploration overmuch of Canada�s north.
Over the coming years, greenhouse gasabatement activities and impact studieswill become increasingly important, andthere should be greater emphasis on thesewithin the PERD Task.
Other Initiatives
Climate Change Voluntary Challenge andRegistry (VCR) Program
The Voluntary Challenge and Registry(VCR) program is an integral part ofCanada�s NAPCC. It challengesorganizations, primarily industry, business,government, and public institutions, totake voluntary actions to reducegreenhouse gas emissions. The programcalls on participants to confirm theircommitment to voluntarily limitgreenhouse gas emissions, to develop anaction plan, to encourage others to take upthe challenge, and to work with anindustry association and/or throughexisting government voluntary programs.The VCR program builds on existingstrengths and capacities of Canadianbusiness sectors and governments todevelop flexible and cost-effective actions,including the development and use of newtechnologies to address greenhouse gasemissions. The VCR is evolving, with over600 registrants as of December 1996,representing over half of Canada�sgreenhouse gas emissions.

CHAPTER 9: RESEARCH AND SYSTEMATIC OBSERVATIONS
82
Pollution Prevention
The Canadian federal Pollution PreventionStrategy is an economic and environmentalinitiative that shifts the focus ofenvironmental protection from reacting topollution towards preventing pollution atthe source. One element of the strategyfocuses on participation in internationalpollution prevention strategies bystimulating the shift to pollutionprevention through technology transfer,voluntary agreements, and energyconservation; incorporating pollutionprevention into international standards;and advancing pollution preventionthrough international protocols andagreements. The Canadian Council ofMinisters of the Environment has adoptedpollution prevention planning as a guidingprinciple.
Canadian Directory of Energy Efficiencyand Renewable Energy Programs inCanada
This computerized database, assembled byNRCan with provincial cooperation, coversall Canadian federal, provincial, andterritorial programs and initiatives in theenergy efficiency and renewable energyarea. The computerized database (DOS, PCand Macintosh) of the 1994�1996 CanadianDirectory of Energy Efficiency and
Alternative Energy Technologies isavailable upon request. It also includessimilar programs delivered by Canadiannatural gas companies. Hard copies of theDirectory are available through NRCanand Trade Officers of Foreign Affairs andInternational Trade Canada.
Summary
Canada has made good progress indeveloping its programs for monitoringclimate and ecosystems, in improvingknowledge of the scientific informationbase required for informed policy responseto the risks of climate change, and intechnology R&D. This progress is broadlyconsistent with that proposed in itsNAPCC. Several key concerns include themaintenance of an effective monitoringprogram while addressing the need forfiscal restraint; the enhanced participationof the private sector in research networks;inadequate levels of research related to theArctic climate, particularly inoceanography, and into the socioeconomicconsequences of actions to reduce risks ofclimate change; full multi-sector/multi-government participation in the CCS-CIA;and more effective communication ofrelevant science to policy-makers and thegeneral public.

CANADA�S SECOND NATIONAL REPORT ON CLIMATE CHANGE
83
Introduction
The United Nations FrameworkConvention on Climate Change (FCCC)recognizes the important role of educationin the international response to globalwarming. The FCCC refers explicitly toeducation, training, and public awareness.Article 4(1)(a) indicates that all Partiesshould �promote and cooperate ineducation, training, and public awarenessrelated to climate change and encouragethe widest participation in this process,including that of non-governmentalorganizations.�
Article 6 of the FCCC expands on Article4(1)(a), indicating that Parties mustpromote:
� the development and implementationof educational and public awarenessprograms on climate change and itseffects;
� public access to information on climatechange and its effects;
� public participation in addressingclimate change and its effects and indeveloping adequate responses; and
� the training of scientific, technical, andmanagerial personnel.
In keeping with Canada�s commitment todevelop a national communicationprogram on climate change, all levels ofgovernment and a number of non-governmental organizations haveundertaken a range of initiatives to furtherpublic awareness and understanding onthis urgent issue.
Federal Government Actions
Canadians� level of concern about climatechange has grown in the past few years.However, surveys consistently show that alack of awareness exists in terms of whatindividuals can do to help reduce thelevels of greenhouse gas (GHG) emissionsproduced by our country. In recognition ofthis problem, a number of initiatives havebeen undertaken by the federalgovernment.
The federal government has also initiatedan alliance-building approach to workwith partners in key sectors to reach theirconstituents with messages on the need foraction on climate change. Work will takeplace with these sectors to developoutreach materials and messages for theirtarget audiences. A strategy to move thisoutreach initiative forward and to liaisewith potential partners is being developedand will be implemented shortly.
Actions that are part of Canada�s nationaloutreach program on climate change arebriefly described below.
Environment Canada: Action 21
In 1995, Environment Canada launchedAction 21. This national program has bothpublic awareness and funding componentsto encourage local action in support ofnational environmental priorities. In 1995and 1996, the public awareness componentwas designed to support EnvironmentCanada�s climate change program areas.
Market research found the public�sunderstanding of climate change to belimited. Although many individuals hadcertainly heard of the term �global
CHAPTER 10: Education, Training, and PublicAwareness

CHAPTER 10: EDUCATION, TRAINING, AND PUBLIC AWARENESS
84
warming� and were very concerned withair issues, few were able to explain theissue in any detail. Sustainabletransportation was chosen as the focus ofthe climate change public awarenessactivities.
Using the creative platform �Canada�sHealthy Neighbourhoods,� this national,bilingual awareness campaign relies ondonated air time and print space. Thestrategic approach is to encourageindividual action in support of a healthierenvironment by highlighting successstories of real people taking action in theirday-to-day lives or taking the lead in theircommunity to reduce car use. The linkbetween the automobile, climate change,and smog is very prominent in theawareness campaign.
In addition to this national campaign,several complementary social marketingactivities are being implemented by Action21 to increase awareness andunderstanding of climate change and theactions individuals can take to reduce theirdependence on the automobile. Forexample, in partnership with HealthCanada, Action 21 also launched �HealthyEnvironment� spots on the nationaltelevision weather network and funded aseries of active transportation workshops,delivered by a non-governmentalorganization.
In 1995 and 1996, the funding componentof Action 21 also provided financialassistance to a number of organizationsaddressing air issues in their communities.The majority of projects funded in this areafocused on encouraging alternativetransportation modes, reducing vehicleemissions through responsible vehicle care,and energy conservation. For example,with financial assistance from Action 21,the Alberta Lung Association iscoordinating vehicle emission tests atautomotive service centres in Edmonton,and Pollution Probe has involved
organizations in Ottawa, Toronto, andEdmonton in a clean air challenge (�CleanAir Commute�) and vehicle emissiontesting clinics.
The focus in 1997 will be on sustaining themessage on climate change and sustainabletransportation through producing a secondbatch of air segments and print space;developing or maintaining media,corporate, interdepartmental, and non-governmental organization partnerships toimplement complementary awarenessactivities; and continuing with the weathernetwork programs. The major newaddition to the campaign will be theintroduction of a radio programmingcomponent, using national network radioto reach listeners across the country.
Environment Canada: AtmosphericEnvironment Service
In June 1995, as an element of activitiesaimed at raising Canadians� awareness ofclimate change, Environment Canada�sAtmospheric Environment Servicedeveloped the concept of releasing to themedia seasonal summaries of temperaturetrends and extreme weather events. Theintent of these summaries was to providemore information on the extreme weatherthat Canadians have recently experienced.The summaries to date have generatedextensive media coverage, and a recentsurvey indicates that many Canadians arenow more aware of climate change.
Natural Resources Canada (NRCan)
One of Natural Resources Canada�s(NRCan) key responsibilities is helpingCanadians become more energy efficient.NRCan has several public awarenessprograms aimed at improving energyefficiency and expanding use of renewableenergy and thereby limiting greenhousegas emissions across the country. NRCanproduces and markets numerouspublications aimed at the general public aswell as more specific audiences. These

CANADA�S SECOND NATIONAL REPORT ON CLIMATE CHANGE
85
publications offer information on a widerange of topics, including alternativetransportation fuels, home energyefficiency, and energy-efficient officeequipment, heating systems, appliances,lighting products, and vehicles.
Each year, NRCan distributes about 1.5million copies of more than 300 energyefficiency and alternative energypublications to individuals and programallies. Recently, the department produced aseries of seven award-winning animatedpublic service announcements featuringthe Enercat cartoon character. Thesemessages, broadcast by television stationsacross the country, remind Canadians touse energy efficiently.
With help from Canada Mortgage andHousing Corporation, NRCan producedarticles on energy efficiency for newspapersupplements. These articles discussedhome energy renovations, renewableenergy technologies, and other topics.These supplements were distributed toalmost 2.5 million households.
NRCan has also developed programs suchas Auto$mart, to provide Canadianmotorists with helpful tips on buying,driving, and maintaining their vehicles inways that will reduce fuel consumption,save money, and protect the environment.
The FleetWise and FleetSmart programshave also been developed to encouragemanagers of vehicle fleets both within thefederal government and outsidegovernment to reduce their environmentalimpacts and operating costs throughenergy-efficient practices and the use ofalternative fuels.
Provincial/Territorial Activities
Provincial and territorial governmentscontinue to work to increase publicawareness of climate change and toencourage action by individuals to reduce
greenhouse gas emissions. For example,the province of British Columbia has a FuelSmart program in place to raise awarenessabout transportation energy efficiency andwill work with utilities and other partnersto expand the government�s energyeducation and consumer informationprograms. The Alberta Clean Air StrategicAlliance has introduced a Clean Air Weekand is encouraging reduction of public andprivate sector greenhouse gas emissions,through initiatives such as Eco-EfficientCommunities.
A �Green Communities� program initiatedby the Ontario government helpscommunities to increase energy and waterefficiency. A total of 15 Ontariocommunities are currently participating inthis initiative, with substantial energy andwater savings being realized.
A number of provinces also have plans todevelop new educational material tobroaden the general public�sunderstanding of the climate change issue.
Other provincial and territorial programscan be found in Appendix I, Table 1.
Municipal Governments
The federal government has workedclosely with the Federation of CanadianMunicipalities (FCM) to assist in thedevelopment of the Federation�s �20%Club,� and Environment Canada hasprovided funding for the 20% ClubSecretariat. The Club�s primary objective isto encourage municipalities to reduce theirgreenhouse gas emissions that contributeto climate change by 20% of 1990 levels bythe year 2005. The 20% Club currently has30 members, including municipal andregional governments from across Canada,representing 32% of the population. One ofthe objectives of the 20% Club is to high-light municipal government leadershipand initiatives. Over a dozen case studiesprofiling municipal initiatives can be

CHAPTER 10: EDUCATION, TRAINING, AND PUBLIC AWARENESS
86
viewed on the FCM web site, www.fcm.ca.The Secretariat for the 20% Club has set atarget of 50 new members by the end of1997.
NRCan is collaborating with FCM todevelop and implement an energyefficiency building retrofit program thatwill replicate the Federal BuildingInitiative, which has been very successfulin supporting energy efficiency projects infederal facilities.
Non-GovernmentalOrganizations
Environmental Groups
Environmental groups continue to play avital role in informing the public aboutclimate change and building the capacityof local communities to address the issue.A number of national and regionalCanadian environmental groups wereactively promoting public awareness of theclimate change issue in 1995 and 1996.Many of these groups received fundingfrom Environment Canada for their climatechange activities.
For example, the Sierra Club of Canadaundertook a national capacity-buildingtour, meeting with local environmentalgroups to update them on the issue. Thegoal was to enable them to take action tobuild awareness and action in theircommunities. Pollution Probeimplemented a �Clean Air Commute�challenge during the month of June inToronto in 1995, and in 1996 the challengewas expanded to Edmonton and Ottawa.The Union québécoise pour la conservationde la nature (UQCN), a Quebec-basedenvironmental group, has held severalclimate change and transportationworkshops. The Pembina Institute hasdeveloped an education kit for climatechange, including a Web site that willassist their future work with students andeducators.
Canadian Global Change Program (CGCP)
The Canadian Global Change Program(CGCP) of the Royal Society of Canada hasbeen an active player in communicatingrelevant information on climate change tothe Canadian public. The CGCP producesa bulletin entitled Changes, which providesconcise information on key globalenvironmental issues. Two issuespublished recently � Canada and ClimateChange: What Is It and What Can We DoAbout It? and Reducing Greenhouse GasEmissions: The Additional Benefits � havefocused on climate change. Workshops andconferences are also organized periodicallyto create venues where information can bepresented and discussed. Important eventshave included a symposium forparliamentarians and their advisors atwhich both the Canadian EnvironmentMinister and the U.S. Under-Secretary forGlobal Affairs spoke about climate change.The CGCP has also developed specificmaterial and services for the educationalcommunity, including a book entitledGlobal Change and Canadians and anaccompanying teachers� guide.
Private Sector Associations andCompanies
A number of private sector associationsand companies in the energy production,transmission, and distribution sectors haveeducation programs for employees andtheir customers that promote the efficientuse of energy. Examples are educationaland information material produced byelectrical and natural gas utilities and byassociations such as the CanadianAssociation of Petroleum Producers(CAPP) and the Canadian Energy PipelineAssociation (CEPA). For example, the gasand the electricity distribution utilitiesprovide information to over four millionhomes each month, and all sectors(production, transmission, anddistribution) of both the gas and electricityindustries have information and trainingprograms for their employees.

CANADA�S SECOND NATIONAL REPORT ON CLIMATE CHANGE
87
APPENDIX I
�SODQQ
HG��LPSOHP
HQWHG��OH
JLVODWLRQ�SD
VVHG
�RU�QR
W��VWDWXV
�RI�IXQ
GLQJ
�*
�1RWH��LQ
�RUGHU�WR
�DYR
LG�GRX
EOH�FR
XQWLQ
J��LQ
�PRV
W�FDV
HV�WK
H�HIIHFWV�RI�LQ
GLYLGX
DO�P
HDVX
UHV�DUH�QR
W�TXD
QWLILHG
�GXH
�WR�WK
HLU�LQWHU�UHODWLR
QVKLS�DQ
G�FR
PELQH
G�LP
SDFW�ZLWK
�VLP
LODU�RU�RWKHU
**
FRPSOHP
HQWDU\�P
HDVX
UHV��7KH
�FRP
ELQH
G�HIIHFWV�RI�P
RVW�R
I�WKH
�PHD
VXUHV�DUH�DF
FRXQ
WHG�IRU�LQ�WK
H�HP
LVVLRQ
V�RX
WORRN
�WR����
��DQ
G�EH
\RQG
���VHH
�$SS
HQGL[����7DE
OHV���D����E����F���
89$SSHQGL[�,��7DEOH���6XPPDU\�RI�SROLFLHV�DQG�P
HDVXUHV�DIIHFWLQJ�HPLVVLRQV�RI�&2
�DQG�RWKHU�*+*V
�
1DP
H�RI
7\SH�RI
2EMHFWLYH�DQ
G�RU�PHWKRG�RI�DFKLHYLQJ�UHG
XFWLRQ
6HFWRU
6WDWXV�RI
(VWLP
DWH�RI�PLWLJDWLRQ
0RQLWRULQJ��LQWHUP
HGLDWH
SROLF\�P
HDVXUH
LQVWUXPHQ
W�LQFOXGLQJ�GHVFULSWLRQ�RI�KRZ�HIIHFWV�WDNH�SODFH�
LPSOHPHQ
WDWLRQ��
LPSDFW
LQGLFDWRU�RI�SURJUHVV
����
����
*29(510(17�2)
&$1$'$
)HG
HUDO�%XLOGLQJ
$ZDUHQ
HVV
$�SURJUDP
�GHV
LJQH
G�WR�DVVLVW�IHG
HUDO�JRY
HUQP
HQW
�,QVWLW�
)XOO�V
FDOH�VWDWXV�
1$
3ULY
DWH�VH
FWRU�FRP
PLWP
HQWV�KDY
H
,QLWLDWLYH
,QIRUP
DWLRQ
GHSD
UWPHQ
WV�LQ
�LPSOHP
HQWLQ
J�HQ
HUJ\
�HIILFLHQ
F\6WDUWHG
�LQ����
���
EHHQ
�PDG
H�WR�LQ
YHVW����
�
(GX
FDWLR
QLP
SURY
HPHQ
WV��(
QHUJ\�UHWURILWV�DUH�ILQD
QFHG
�IURP
�HQH
UJ\
PLOOLRQ��ZKLFK
�ZLOO�\LHOG����
'HP
RQVWUDWLR
QVD
YLQJ
V�PLOOLRQ�LQ�DQQ
XDO�H
QHUJ\�VD
YLQJ
V�
%\���
����H
VWLP
DWHG
�HQH
UJ\
LQWHQV
LW\�VDY
LQJV
�RI��
���0
-�P
�
IURP
����
��OHYH
OV��D
QG����
�0-�P
�
E\����
��
)HG
HUDO�,Q
GXVWULD
O$ZDUHQ
HVV
$VVLVWV�IH
GHUDO�G
HSDUWP
HQWV��D
JHQF
LHV��DQG
�&URZQ
&RP
P�
)XOO�V
FDOH�VWDWXV�
1$�
6SH
FLILF�VHUYLFH
V�LQFOXG
H
%RLOHU�3URJUDP
,QIRUP
DWLRQ
FRUSRUDWLRQV
�LQ�UHG
XFLQJ�*+*�HPLVVLRQ
V��LQ
FUHD
VLQJ
,QVWLW�
6WDUW������
��������
�HIILFLHQF
\�DX
GLWV��Q
RQ�GHV
WUXF
WLYH
(GX
FDWLR
QHQ
HUJ\
�HIILFLHQ
F\��D
QG�UHG
XFLQJ�RS
HUDWLQJ�FR
VWV�
,QGX
VW�
([S
HQG�����
����
��PHWDOOXUJLFDO�H[D
PLQDWLRQV
��DQG
5'�DQG
OLIH�F\FOH�FR
VWLQJ�VWXG
LHV��&2
'HP
RQVWUDWLR
QHP
LVVLRQ
V�ZHUH�UHGX
FHG�E\
����NW
�
LQ����
����
�
,QGX
VWULD
O�(QH
UJ\
$ZDUHQ
HVV
(PSK
DVL]HV
�D�YROXQ
WDU\�FKD
OOHQJ
H�DS
SURD
FK�ZKH
UHE\
&RP
P�
)XOO�V
FDOH�VWDWXV�
1$
6LQFH
����
���WK
H�,QGX
VWULD
O�(QH
UJ\
,QQR
YDWRUV�,Q
LWLDWLYH
,QIRUP
DWLRQ
RUJD
QL]D
WLRQV
�FRP
PLW�WR�XSJ
UDGH
�WKH�HIILFLHQF
\�RI�WK
HLU
,QGX
VW�
,PSOHP
HQWHG�LQ
,QQR
YDWRUV�,Q
LWLDWLYH�KD
V�HQ
UROOHG
(GX
FDWLR
QEX
LOGLQJV
�DQG
�UHS
RUW�R
Q�WKH�HQ
HUJ\
�VDY
LQJV
�DFK
LHYH
G�0XQ
LF�
����
�PRUH�WKDQ
����
�RUJDQ
L]DWLRQV
�
0DQ
\�RI�WK
H�UHWURILWV�DUH�LP
SOHP
HQWHG�E\
�HQH
UJ\�VH
UYLFH
ZKLFK
�KDY
H�FR
PPLWWHG
�WR�WK
H
FRPSD
QLHV
�DQG
�ILQD
QFHG
�XVLQJ
�WKLUG
�SDUW\�IX
QGV��ZKLFK
LPSOHP
HQWDWLR
Q�RI�VXV
WDLQHG
DUH�UHSD
LG�IURP
�HQH
UJ\�VD
YLQJ
V�HF
RQRP
LF�SURMHFWV�WR�UHG
XFH
HQHUJ\
�ZDV
WH�
,QGX
VWULD
O�(QH
UJ\
$ZDUHQ
HVV
3URJUDP
�FDS
LWDOL]HV
�RQ�IHGH
UDO�H
[SHUWLVH�LQ�KHD
W,QGX
VW�
)XOO�V
FDOH�VWDWXV�
1$
%HQ
HILWV�RQJ
RLQJ
�
(IILFLHQ
F\,QIRUP
DWLRQ
PDQ
DJHP
HQW�D
QG�SURFH
VV�DQD
O\VLV�DQ
G
7HF
KQRORJ
\(GX
FDWLR
QRS
WLPL]DWLRQ�WR�UHG
XFH�HQ
HUJ\
�XVH
�DQG
�LQFUHD
VH
3URJUDP
5'
SURG
XFW�T
XDOLW\�DQ
G�SURG
XFWLYLW\�

901DP
H�RI
7\SH�RI
2EMHFWLYH�DQ
G�RU�PHWKRG�RI�DFKLHYLQJ�UHG
XFWLRQ
6HFWRU
6WDWXV�RI
(VWLP
DWH�RI�PLWLJDWLRQ
0RQLWRULQJ��LQWHUP
HGLDWH
SROLF\�P
HDVX
UHLQVWUXPHQW
�LQFOXGLQJ�GHVFULSWLRQ�RI�KRZ�HIIHFWV�WDNH�SODFH�
LPSOHPHQ
WDWLRQ��
LPSDFW
LQGLFDWRU�RI�SURJUHVV
����
����
*29(510(17�2)
&$1$'$��FR
QW��
0RE
LOH�)RX
QGU\
$ZDUHQ
HVV
/DER
UDWRU\�WR
�FRQ
GXFW�HQH
UJ\�DX
GLWV�DW��
�,QGX
VW�
)XOO�VFDOH�VWDWXV�
1$
%HQ
HILWV�RQJ
RLQJ
�
/DER
UDWRU\
,QIRUP
DWLRQ
IRXQ
GDULH
V�D�\HDU�IR
U�WKH�QH
[W���\HD
UV�
0DQ
XI�
(GX
FDWLRQ
5'
´*UHHQ
µ�3RZ
HU'HP
RQVWUDWLRQ
7ZR�IHGH
UDO�GHS
DUWP
HQWV��(
QYLUR
QPHQ
W�&DQ
DGD
,QVWLW�
3LORW�S
URMHFW�
1$
7KLV�LV�D�SLORW�S
URMHFW��Z
KLFK
3XUFKDVH
DQG�15&DQ
��KDYH�FRQWUDFWHG
�WR�SXUFKDVH�HOHFWULFLW\
6WDUW����
��ZLOO�EH�PRQ
LWRUHG�WR�DVVHVV�LWV
SURG
XFHG
�IURP
�UHQ
HZDE
OH�HQH
UJ\�IRU�WKHLU�EX
LOGLQJV
ZLGHU�DSS
OLFDWLRQ�ZLWKLQ�WK
H
LQ�WZ
R�SURYLQFHV�LQ�RUGHU�WR
�SURPRWH�UHQH
ZDE
OHIHGH
UDO�JRYHUQP
HQW�
HQHUJ\�FRQ
WUDFWLQJ�
(QH
UJ\�IURP
�WKH
5'�DQG
5HVHD
UFK�RQ
�ELRPDVV�VXSS
O\�IR
U�HQ
HUJ\��
)RUHVW�
)XOO�VFDOH�VWDWXV�
1$
3ULP
DU\�IRFXV�LV�RQ�ELRP
DVV
)RUHVW��(1)25�
'HP
RQVWUDWLRQ
6WDUW������
��(QG
SURG
XFWLRQ�IURP
�IRUHVW
����������
�UHVLGX
HV�
([SHQ
G�
������
����
�
1DWLRQD
O�(QH
UJ\
6WDQG
DUGV�DQG
'HYHORS
�QDWLRQD
O�PRG
HO�HQH
UJ\�FRGH
V�WKDW�VSH
FLI\
5HVLG�
7KH
�FRG
HV��X
QGHU
1$
7KH
�FRG
HV�ZLOO�EH�SX
EOLVKH
G
&RG
HV�IR
U�%XLOGLQJV
5HJ
XODWLRQV
PLQLPXP
�OHYHOV�RI�WKH
UPDO�SHUIRUP
DQFH�IR
U&RP
P�
GHYHORSP
HQW�VLQFH
HDUO\�LQ����
��DQ
G�FRQVLGHUHG
DQG�+RX
VHV
FRPPHUFLDO�DQG
�UHVLGHQ
WLDO�EXLOGLQJV��+
HOS
����
��ZHUH
E\�SURYLQFHV�DQG
SURYLQFHV�DQ
G�PXQ
LFLSDOLWLHV�SXW�WK
HP�LQWR
UHFHQWO\
PXQ
LFLSDOLWLHV�IR
U�DG
RSWLRQ�
RSHUDWLRQ�
FRPSOHWHG
�
,QGX
VWULD
O�(QH
UJ\
$ZDUHQ
HVV
7KH
�0LQLVWHU�RI�15&DQ
��ZRUNLQJ
�ZLWK�D�FRX
QFLO�RI
,QGX
VW�
)XOO�VFDOH�VWDWXV�
1$
7KLUWHH
Q�LQGX
VWULD
O�WDVN�IRUFHV
(IILFLHQ
F\,QIRUP
DWLRQ
LQGX
VWU\�&KLHI�([HFXWLYH�2IILFHUV��&(2V��
6WDUWHG
�LQ����
��KD
YH�FRP
PLWWHG
�WR�HQH
UJ\
(GX
FDWLRQ
FKDOOHQJ
HG�LQGX
VWU\�WR
�VHW�HQH
UJ\�HIILFLHQF\�WDUJHWV
HIILFLHQF\�LPSURYHP
HQW
IRU�WKH�PDMRU�HQH
UJ\�XVLQJ�LQGX
VWULD
O�VHFWRUV�
WDUJHWV��UDQ
JLQJ
�IURP
������WR
15&DQ
�ZRUNV�ZLWK�P
HPEH
UV�RI�WKH
�&DQ
DGLDQ
����
�SHU�DQQ
XP�EHWZHH
Q
,QGX
VWU\�3URJUDP
�RQ�(QH
UJ\�&RQ
VHUYDWLRQ��&,3(&�
����
�DQG
����
���0
RUH�WKDQ
LQ�GHYHORS
LQJ�WKH�VHFWRU�WD
UJHWV�DQ
G�LQ�REWDLQLQJ
����FRPSD
QLHV��UHS
UHVHQWLQJ
FRPSD
Q\�OH
YHO�FRP
PLWP
HQWV�WK
URXJ
K�WKH�,QGX
VWULD
O��
��RI�H
QHUJ\�XVH�LQ�WK
H
(QH
UJ\�,QQR
YDWRUV�,Q
LWLDWLYH�
PDQ
XIDFWXULQ
J�DQ
G�PLQLQJ
VHFWRUV��DUH�SDUWLFLSDWLQJ�LQ
WKH�LQLWLDWLYH�
911DP
H�RI
7\SH�RI
2EMHFWLYH�DQ
G�RU�PHWKRG�RI�DFKLHYLQJ�UHG
XFWLRQ
6HFWRU
6WDWXV�RI
(VWLP
DWH�RI�PLWLJDWLRQ
0RQLWRULQJ��LQWHUP
HGLDWH
SROLF\�P
HDVX
UHLQVWUXPHQW
�LQFOXGLQJ�GHVFULSWLRQ�RI�KRZ�HIIHFWV�WDNH�SODFH�
LPSOHPHQ
WDWLRQ��
LPSDFW
LQGLFDWRU�RI�SURJUHVV
����
����
*29(510(17�2)
&$1$'$��FR
QW��
)OHHW:LVH
$ZDUHQ
HVV
+HOSV�IH
GHUDO�JRYHUQP
HQW�LQVWLWXWLRQV�EHFRP
H�PRUH
7UDQVS�
)XOO�VFDOH�VWDWXV�
1$
3URMHFWHG
����
�UHG
XFWLRQ�RI
,QIRUP
DWLRQ
HQHUJ\�HIILFLHQ
W�DQG
�XVH�$7)V�
6WDUWHG
�LQ�ODWH
&2
�IURP
����
��OHYHOV�E\���
��
(GX
FDWLRQ
����
�DQ
G���
��E\���
���
�
$XWR�
PDUW
$ZDUHQ
HVV�
3URYLGH
V�PRWRULVWV�ZLWK�HQH
UJ\�HIILFLHQF\
7UDQVS�
)XOO�VFDOH�VWDWXV�
1$
,Q�WK
H�ILUVW�\HD
U�RI�WK
H
,QIRUP
DWLRQ
LQIRUP
DWLRQ�RQ
�WKH�SX
UFKD
VH��P
DLQWHQ
DQFH��D
QG�SULYDWH�
6WDUWHG
�LQ����
��LQLWLDWLYH·V�RS
HUDWLRQ�
(GX
FDWLRQ
RSHUDWLRQ�RI�YHK
LFOHV�
LQWHUHVWHG
�SDUWLHV�PDG
H
DOPRVW��
����
�WHOHSK
RQH
HQTX
LULHV�WR
�WKH�WROO�IUHH
QXPEH
U�
,QGX
VWULD
O$ZDUHQ
HVV
,QGX
VWULD
O�HVWDE
OLVKP
HQWV�ZLOO�EH�SURYLGHG
�ZLWK�D
,QGX
VW�
7R�EH
1$
,QLWLDWLYH�EH
LQJ�GH
VLJQ
HG�
%HQ
FKPDUNLQJ
,QIRUP
DWLRQ
FRQILGHQ
WLDO�EHQ
FKPDUNLQJ
�UHS
RUW�R
Q�WKHLU�HQ
HUJ\
LPSOHP
HQWHG�LQ
5HS
RUWV
HIILFLHQF\�SURJ
UHVV��LQFOXGLQJ
�KRZ
�WKH\�FRP
SDUH�WR
����
�
QDWLRQD
O�DQG
�LQWHUQDWLRQD
O�DYHUDJH
V�IRU�WKHLU�VHFWRU�
,QIRUP
DWLRQ�ZLOO�DOVR�EH
�SURYLGH
G�RQ
�EHVW�S
UDFWLFHV
LQ�HQH
UJ\�PDQ
DJHP
HQW�IRU�WK
HLU�LQGX
VWULH
V�
6XVWDLQDE
OH$ZDUHQ
HVV�
'HYHORS
�SROLFLHV��SULQ
LFLSOHV��DQG
�SURJUDP
V�WKDW
7UDQVS�
)XOO�VFDOH�VWDWXV�
1$
%HQ
HILWV�RQJ
RLQJ
�
7UDQVSR
UWDWLRQ
,QIRUP
DWLRQ
OHDG
�WR�VXVWDLQDE
OH�WUDQ
VSRUWDWLRQ�DQ
G�UHGX
FHG
(GX
FDWLRQ
*+*�HPLVVLRQ
V��
7UHH�3ODQ�&DQ
DGD
$ZDUHQ
HVV
7KH
�VWUDWHJ
\�FDOOV�IR
U�WKH�SODQ
WLQJ�RI�WUHH
V�E\
$OO
���P
LOOLRQ�WUHH
V1$
$W�P
DWXULW\��Z
LOO�KDYH
,QIRUP
DWLRQ
FRPSD
QLHV�DQG
�RUJDQ
L]DWLRQV�WR
�VHT
XHVWHU�&2
DQG
SODQ
WHG�VLQFH
VHTX
HVWHUHG�DQ
G�UHGX
FHG
(GX
FDWLRQ
RWKH
U�UDGLDWLYHO\�DFWLYH�JD
VHV�
����
�&2
�HPLVVLRQ
V�E\�����0
W���
�
$FWLRQ���
$ZDUHQ
HVV
3XE
OLF�DZDUHQ
HVV�SURJ
UDP�IR
FXVLQJ
�RQ�WKH
7UDQVS�
)XOO�VFDOH�VWDWXV�
1$
*RYHUQP
HQW�LV�SURYLGLQJ
,QIRUP
DWLRQ
DXWRPRE
LOH�DQG
�LWV�FRQWULE
XWLRQ�WR�DLU�SR
OOXWLRQ�
ZRUNVKR
SV�RQ�DOWHUQDWLYH
(GX
FDWLRQ
3URJUDP
�HQFRX
UDJH
V�&DQ
DGLDQV�WR
�XVH�DOWHUQDWLYH
PRG
HV�RI�WUDQVSR
UWDWLRQ�
PRG
HV�RI�WUDQVSR
UWDWLRQ�
)OHHW6PDUW
$ZDUHQ
HVV
:LOO�HQFRX
UDJH
�FRP
PHUFLDO�IOHH
W�RSH
UDWRUV�WR
7UDQVS�
/DXQ
FKHG
�LQ�ODWH
1$
3UHPDWXUH��VLQFH�SURJUDP
,QIRUP
DWLRQ
UHGX
FH�RSH
UDWLQJ�FRVWV�WKURXJ
K�HQ
HUJ\�HIILFLHQ
W��
���
TXLWH�QHZ
�
(GX
FDWLRQ
SUDFWLFHV�DQG
�WKH�XVH�RI�$7)V��:
LOO�SURYLGH
LQIRUP
DWLRQ��ZRUNVKR
SV��WHFKQ
LFDO�GHP
RQVWUDWLRQV�
DQG�WUDLQLQJ
�
921DP
H�RI
7\SH�RI
2EMHFWLYH�DQ
G�RU�PHWKRG�RI�DFKLHYLQJ�UHG
XFWLRQ
6HFWRU
6WDWXV�RI
(VWLP
DWH�RI�PLWLJDWLRQ
0RQLWRULQJ��LQWHUP
HGLDWH
SROLF\�P
HDVX
UHLQVWUXPHQW
�LQFOXGLQJ�GHVFULSWLRQ�RI�KRZ�HIIHFWV�WDNH�SODFH�
LPSOHPHQ
WDWLRQ��
LPSDFW
LQGLFDWRU�RI�SURJUHVV
����
����
*29(510(17�2)
&$1$'$��FR
QW��
%X\�P
DUW
$ZDUHQ
HVV
:LOO�SURYLGH
�FRQ
VXPHUV�ZLWK�IX
HO�HIILFLHQ
F\7UDQVS�
8QG
HU1$
3UHPDWXUH��VLQFH�SURJUDP
�QRW�
,QIRUP
DWLRQ
LQIRUP
DWLRQ�RQ
�LQGLYLGX
DO�YHK
LFOH�P
RGHOV�WKURXJ
K�D
GHYHORSP
HQW�
IXOO\�GHVLJQH
G�
(GX
FDWLRQ
YHKLFOH�ODEH
O��9HK
LFOH�P
DQXIDFWXUHUV�ZLOO�SURPRWH
YHKLFOH�HIILFLHQF\�DQ
G�SURYLGH�LQIRUP
DWLRQ�DQ
G
WUDLQLQJ
�WR�WK
HLU�GH
DOHUV�
(QH
UJ\�(IILFLHQ
F\6WDQG
DUGV�DQG
5HJ
XODWLRQV�XQG
HU�WK
H�(QH
UJ\�(IILFLHQ
F\�$
FW5HVLG�
)XOO�VFDOH�VWDWXV�
1$
5HJ
XODWLRQV�DSS
O\�WR
�SURGX
FWV
5HJ
XODWLRQV
5HJ
XODWLRQV
HVWDEOLVK�PLQLPXP
�HQH
UJ\�SH
UIRUPDQ
FH�OHYHOV�IR
U&RP
P�
)LUVW�UHJ
XODWLRQV
WKDW�DFFRX
QW�IR
U���
��RI
SUHVFULEHG
�SURGX
FWV��7R�GD
WH��UHJ
XODWLRQV�KDYH
,QGX
VW�
FDPH�LQWR�HIIH
FW�LQ
UHVLGH
QWLDO�HQH
UJ\�GH
PDQ
G�
EHHQ
�HVWDE
OLVKH
G�IRU���
�UHVLGHQ
WLDO�HQH
UJ\�XVLQJ
,QVWLWXW��
����
�7KH
�OLJK
WLQJ�UHJX
ODWLRQV�DUH
SURG
XFWV��H
OHFWULF�P
RWRUV��DQG
�OLJK
WLQJ�SURG
XFWV�
HVWLP
DWHG
�WR�UHG
XFH�&2
7KH
VH�ZLOO�EH�H[SD
QGHG
�LQ�WK
H�QH
DU�IX
WXUH�WR
HPLVVLRQ
V�LQ�WK
H�\HDU����
��E\
LQFOXG
H�ILYH�DG
GLWLRQD
O�UHVLGHQ
WLDO�SURGX
FWV�DQ
G�VL[
DQ�DPRX
QW�HTX
LYDOHQ
W�WR�WKH
DGGLWLRQD
O�SURGX
FWV�LQ�WK
H�FRPPHUFLDO�VHFWRU�
DQQX
DO�&2
�HPLVVLRQ
V�RI�
�
PRUH�WKDQ
���P
LOOLRQ�FDUV���
��
0W�D
QQXD
OO\�E\���
���
&DQ
DGLDQ�-RLQW
$ZDUHQ
HVV
7KH
�SURJUDP
�ZLOO�HQFRX
UDJH
�DQG
�VXS
SRUW�&DQ
DGLDQ
&RP
P�
6WDUW������
����
1$�
7KH
�&-,,�R
IILFH�LV�DQWLFLSDWLQJ
,PSOHP
HQWDWLRQ
,QIRUP
DWLRQ
SDUWLHV�WR�LP
SOHP
HQW�S
URMHFWV�LQWHUQDWLRQD
OO\�WR
,QGX
VW�
���IX
OO\�GHYHORS
HG�-,
,QLWLDWLYH��&-,,�
(GX
FDWLRQ
UHGX
FH�*+*�HPLVVLRQ
V�SURS
RVDOV�IRU���
���
(QH
U*XLGH
$ZDUHQ
HVV
5HJ
XODWLRQV�XQG
HU�WK
H�(QH
UJ\�(IILFLHQ
F\�$
FW�UHT
XLUH
5HVLG�
)XOO�VFDOH�VWDWXV�
1$
,Q����
���15&DQ
�LQWURG
XFHG
�D
,QIRUP
DWLRQ
PDQ
XIDFWXUHUV�WR
�DIIL[�(QH
U*XLGH
�ODEH
OV�WR
QHZ�ODEH
O�IRU�VL[�UHVLGHQ
WLDO
(GX
FDWLRQ
HTXLSP
HQW�WR�LQIRUP
�FRQ
VXPHUV�RI�WK
H�SURG
XFW·V
DSSOLDQFHV�WK
DW�ZDV�HDVLHU�WR
6WDQG
DUGV�DQG
UHODWLYH�HQ
HUJ\�FRQ
VXPSWLRQ��7KLV�LV�VXS
SRUWHG
XQGH
UVWDQG
�DQG
�SURYLGH
G
5HJ
XODWLRQV
WKURXJ
K�GLUHFWRULHV�IRU�FRQVXP
HUV��LQIRUP
DWLRQ�DQ
GFRPSD
UDWLYH�HQ
HUJ\
HGXFDWLRQ�FDPSD
LJQV��D
QG�WUDLQLQJ
�IRU�UHWDLO�VDOHV
FRQVXP
SWLRQ�LQIRUP
DWLRQ��,Q
VWDII�
����
��WKH
�SURJUDP
�ZDV
H[SD
QGHG
�WR�LQFOXG
H�URRP
�DLU
FRQG
LWLRQ
HUV�
+\GURJH
Q�)XH
O�&HOO
5'
*RYHUQP
HQW�K
HOSH
G�%DOODUG�3RZ
HU�6\VWHPV�LQ
7UDQVS�
3LORW�WHVWLQJ�RI�EXV
1$
1HZ
�SURWRW\SH
�EHLQJ
�WHVWHG
�
%XV
EXLOGLQJ�ZRUOG·V�ILUVW�K
\GURJH
Q�IXHO�FHOO�EXV��7
KHEH
JDQ���
���
EXV�GR
HV�QRW�HPLW�DQ
\�*+*V�

931DP
H�RI
7\SH�RI
2EMHFWLYH�DQ
G�RU�PHWKRG�RI�DFKLHYLQJ�UHG
XFWLRQ
6HFWRU
6WDWXV�RI
(VWLP
DWH�RI�PLWLJDWLRQ
0RQLWRULQJ��LQWHUP
HGLDWH
SROLF\�P
HDVX
UHLQVWUXPHQW
�LQFOXGLQJ�GHVFULSWLRQ�RI�KRZ�HIIHFWV�WDNH�SODFH�
LPSOHPHQ
WDWLRQ��
LPSDFW
LQGLFDWRU�RI�SURJUHVV
����
����
*29(510(17�2)
&$1$'$��FR
QW��
%XLOGLQJ�(QH
UJ\
$ZDUHQ
HVV
7KH
�SURJUDP
�HPSK
DVL]HV�ZD\V�WR�SURGX
FH�KHD
W&RP
P�
1$
1$
%HQ
HILWV�RQJ
RLQJ
�
7HFKQ
RORJ
\,QIRUP
DWLRQ
HIILFLHQWO\��P
LQLPL]H�WKHUPDO�ORVV��D
QG�GLVWULEXWH
,QVWLW�
$GYDQ
FHPHQ
W(GX
FDWLRQ
HQHUJ\��3
URMHFWV�LQFOXG
H�5'�DQG
�ILHOG�WULDOV�RI�Q
HZ5HVLG�
3URJUDP
WHFKQR
ORJLHV�
1DWLRQD
O$ZDUHQ
HVV
$Q�DFWLRQ�RULHQWHG
�SXE
OLF�HGX
FDWLRQ�FDPSD
LJQ�RQ
1$
3ODQQ
HG�IR
U���
���
1$
&RP
PXQ
LFDWLRQ
,QIRUP
DWLRQ
FOLPDWH�FKDQ
JH�DQG
�RWKHU�DLU�LVVXHV�FRR
UGLQDWHG
3URJUDP
�RQ�&OLP
DWH
(GX
FDWLRQ
DPRQ
J�JR
YHUQPHQ
WV�DQG
�RWKHU�RUJDQ
L]DWLRQV�
&KD
QJH
5HQ
HZDE
OH�(QH
UJ\
$ZDUHQ
HVV
*RYHUQP
HQW�Z
LOO�LQFUHD
VH�LWV�LQLWLDWLYHV�UH�
$OO
RXQFHG
�2FW�
1$
,Q����
����
��15&DQ
�VSH
QW���
6WUDWHJ
\,QIRUP
DWLRQ
LQIRUP
DWLRQ��WUDLQLQJ
�DQG
�HGX
FDWLRQ��DQG
�VXS
SRUWLQJ
����
�PLOOLRQ�RQ
�UHQ
HZDE
OH
(GX
FDWLRQ
UHQH
ZDE
OH�HQH
UJ\�WHFKQR
ORJ\�UHVHD
UFK�
DFWLYLWLHV��*
RYHUQP
HQW�D
OVR
5HVHD
UFK
FRQIHUHQ
FHV��ZRUNVKR
SV��S
XEOLFDWLRQV��D
QG�P
DUNHW
FKDQ
JHG�LQYHVWPHQ
W�WD[�UXOHV
UHVHDUFK�DQG
�DFFHVV�
LQ����
��WR�SURPRWH
LQYHVWPHQ
WV�LQ�UHQ
HZDE
OH
HQHUJ\�
$3(&
6WDQG
DUGV
:LOO�VHH
N�WR�KDUPRQ
L]H�WHVW�P
HWKR
GV�DQG
5HVLG�
$3(&�&RP
PLWWHH
1$
3UHPDWXUH��VLQFH�LQLWLDWLYH�MXVW
+DUPRQ
L]DWLRQ�RI
DVVHVVPHQ
W�V\VWHPV�IRU�HT
XLSP
HQW�VWDQG
DUGV
&RP
P�
ZLOO�EHJ
LQEH
JLQQ
LQJ�
(TX
LSPHQ
WDP
RQJ�PHP
EHU�FRXQ
WULHV�RI�WK
H�$VLD�3DFLILF
GHOLEHUDWLRQV�LQ
6WDQG
DUGV
(FRQR
PLF�&RR
SHUDWLRQ��$3(&��RUJD
QL]DWLRQ�
����
�
1DWLRQD
O�%LRPDVV
)LQDQ
FLDO
7KH
�SURJUDP
��DGP
LQLVWHUHG�E\�WK
H�)DUP�&UHGLW
,QGX
VW�
RXQFHG
�'HF�
1$
(WKDQ
RO�3URJUDP
,QFHQWLYH
&RUS���R
IIHUV�D�JXD
UDQWHH
G�UHSD
\DEOH�OLQH�RI�FUHGLW
����
�����
�PLOOLRQ
IRU�ILUPV�WR�EXLOG�RU�H[SD
QG�HWKDQ
RO�SODQWV�LQ
LQ�FUHGLW�FDQ
�EH
&DQ
DGD��7KH
�OLQH
�RI�FUHGLW�LV�DYDLODEOH�LI�WKH
DFFHVVHG
JRYHUQPHQ
W�UHG
XFHV�RU�HOLPLQDWHV�WK
H�H[FLVH�WD
[��
��²�
����
H[HP
SWLRQ�IRU�HWKD
QRO�LQ�WKH�IXWXUH�
&RP
PXQ
LW\�%DVHG
$ZDUHQ
HVV
)HG
HUDO�JRYHUQP
HQW�Z
RUNV�ZLWK�P
XQLFLSDOLWLHV�
0XQ
LF�
2QJ
RLQJ
�1$
1$
(QH
UJ\�3ODQQ
LQJ
,QIRUP
DWLRQ
XWLOLWLHV��DQG
�XUEDQ
�SODQQ
HUV�WR�H[SORUH�P
RUH
8WLOLWLHV
(GX
FDWLRQ
LQWHJUDWHG
�DSS
URDFK�WR�FRP
PXQ
LW\�EDVHG
�HQH
UJ\
SODQ
QLQJ
��([SDQ
GLQJ
�WKH�XVH�RI�GLVWULFW�K
HDWLQJ�DQ
G
FRROLQJ�V\VWHP
V�ED
VHG�RQ
�ZDVWH�KHD
W�
FRJH
QHUDWLRQ��RU�UHQH
ZDE
OH�IX
HOV�

941DP
H�RI
7\SH�RI
2EMHFWLYH�DQ
G�RU�PHWKRG�RI�DFKLHYLQJ�UHG
XFWLRQ
6HFWRU
6WDWXV�RI
(VWLP
DWH�RI�PLWLJDWLRQ
0RQLWRULQJ��LQWHUP
HGLDWH
SROLF\�P
HDVX
UHLQVWUXPHQW
�LQFOXGLQJ�GHVFULSWLRQ�RI�KRZ�HIIHFWV�WDNH�SODFH�
LPSOHPHQ
WDWLRQ��
LPSDFW
LQGLFDWRU�RI�SURJUHVV
����
����
*29(510(17�2)
&$1$'$��F
RQW��
$OWHUQDWLYH
$ZDUHQ
HVV
3URPRWH�5'�IR
U�WKH�FRPPHUFLDOL]DWLRQ�RI�$7)V
7UDQVS�
)XOO�VFDOH�VWDWXV�
1$
1$
7UDQVSR
UWDWLRQ
,QIRUP
DWLRQ
VXFK�DV�QD
WXUDO�JDV��S
URSD
QH��D
OFRK
RO�IX
HOV��DQG
����
�([SHQ
G������
)XH
OV�5HVHD
UFK�
(GX
FDWLRQ
HOHFWULF�YHK
LFOHV�
PLOOLRQ�
'HYHORS
PHQ
W5'
7UDQVSR
UWDWLRQ
$ZDUHQ
HVV
2EMHFWLYH�LV�WR
�UHG
XFH�YHKLFOH�IXHO�FRQ
VXPSWLRQ�DQ
G7UDQVS�
)XOO�VFDOH�VWDWXV�
1$
1$
(IILFLHQ
F\�³
,QIRUP
DWLRQ
HPLVVLRQ
V�WKURXJ
K�WKH�GH
YHORSP
HQW�R
I�HQH
UJ\�
6WDUW������
����
5HVHD
UFK�DQ
G(GX
FDWLRQ
HIILFLHQW�WH
FKQR
ORJLHV�
����
�([SHQ
G�
'HYHORS
PHQ
W5'
����
����
�
3URJUDP
$GYDQ
FHG�+RX
VH$ZDUHQ
HVV
3URYLGH
V�FRVW�VKD
UHG�VXSS
RUW�WR�LQGX
VWU\�IR
U�WKH
5HVLG�
3LORW
1$
7HFKQ
RORJ
LHV�SURYHQ
�WKURXJ
K
3URJUDP
,QIRUP
DWLRQ
FRQVWUXFWLRQ�RI�WH
FKQR
ORJLFDOO\�DGYDQ
FHG�KR
PHV
'HP
RQVWUDWLRQ
WKLV�SURJUDP
�ZLOO�EH
(GX
FDWLRQ
WKDW�FRQ
VXPH���
��RI�WKH
�HQH
UJ\�RI�FRQ
YHQWLRQD
OFRQVLGHUHG
�IRU�LQFRUSRUDWLRQ
5'
KRXVLQJ�
LQWR�WK
H�5����
��3URJUDP
�
0HP
RUDQ
GD�RI
$ZDUHQ
HVV
(QH
UJ\�DVVRFLDWLRQV�DJUHH
�WR�HQFRX
UDJH
�VWURQ
J,QGX
VW�
)XOO�VFDOH�VWDWXV
1$
1$
8QG
HUVWDQ
GLQJ
�ZLWK
,QIRUP
DWLRQ
YROXQWDU\�DFWLRQV�E\�PHP
EHU�FRPSD
QLHV�WR
�DGG
UHVV
DV�RI��
���
(QH
UJ\
(GX
FDWLRQ
FOLPDWH�FKDQ
JH�LVVXHV�
$VVRFLDWLRQV
5'
&����
��3URJUDP
$ZDUHQ
HVV
3URPRWHV�WK
H�DG
RSWLRQ�RI�HQH
UJ\�HIILFLHQW
&RP
P�
3LORW
1$
1$
,QIRUP
DWLRQ
DGYDQFHG
�WHFKQR
ORJLHV�DQG
�LQQR
YDWLYH
,QVWLW�
'HP
RQVWUDWLRQ
(GX
FDWLRQ
PDQ
DJHP
HQW�LQ�FRPPHUFLDO�EXLOGLQJV�WK
URXJ
K
5'
VXSS
RUW�IRU�WK
H�FRQVWUXFWLRQ�RI�D�VPDOO�QXP
EHU�RI
SLORW�S
URMHFWV��P
RQLWRULQ
J��DQG
�WHFKQR
ORJ\�WUDQ
VIHU�
�5����
��3URJUDP
$ZDUHQ
HVV
,PSURYHV�WK
H�OHYHO�RI�H
QHUJ\�HIILFLHQF\�LQ�KRX
VLQJ
5HVLG�
)XOO�VFDOH�VWDWXV�
1$
0RUH�WKDQ
������
�KRX
VH
,QIRUP
DWLRQ
E\�GHYHORS
LQJ�DQ
G�PDUNHWLQJ�WKH�HQ
HUJ\�HIILFLHQ
W��1HZ
�6WDUWHG
�LQ����
��EX
LOGHUV�WUDLQH
G�WR�WK
H�5����
�
(GX
FDWLRQ
5����
��YROXQWDU\�VWDQ
GDUG��7
HDFKHV�KRX
VHRQ
JRLQJ�DQ
GVWDQ
GDUG��D
QG�P
RUH�WKDQ
6WDQG
DUGV
EXLOGHUV�WKH�VWDQ
GDUG��D
QG�WH
VWV�DQ
G�FHUWLILHV
FXPXODWLYH�
����
��FHUWLILHG
�5����
��KR
PHV
�YROXQ
WDU\�
KRXVHV��(
QFRX
UDJH
V�EX
\HUV�WR
�SXUFKDVH�KR
XVHV
KDYH�EHH
Q�EX
LOW�
WKDW�P
HHW�WKH
�VWDQG
DUG�

951DP
H�RI
7\SH�RI
2EMHFWLYH�DQ
G�RU�PHWKRG�RI�DFKLHYLQJ�UHG
XFWLRQ
6HFWRU
6WDWXV�RI
(VWLP
DWH�RI�PLWLJDWLRQ
0RQLWRULQJ��LQWHUP
HGLDWH
SROLF\�P
HDVX
UHLQVWUXPHQW
�LQFOXGLQJ�GHVFULSWLRQ�RI�KRZ�HIIHFWV�WDNH�SODFH�
LPSOHPHQ
WDWLRQ��
LPSDFW
LQGLFDWRU�RI�SURJUHVV
����
����
*29(510(17�2)
&$1$'$��FR
QW��
+RP
H�(QH
UJ\
$ZDUHQ
HVV
(QFRX
UDJH
V�KR
PHR
ZQH
UV�WR
�LPSURYH�WKH�HQ
HUJ\
5HVLG�
)XOO�VFDOH�VWDWXV�
1$
15&DQ
�LV�GHYHORS
LQJ�WKH
5HWURILW�,Q
LWLDWLYH
,QIRUP
DWLRQ
HIILFLHQF\�RI�WK
HLU�KR
XVHV�ZKH
Q�WKH\�UHQ
RYDWH�DQ
G6WDUW����
��&DQ
DGLDQ�9ROXQ
WDU\�+RP
H
(GX
FDWLRQ
PDLQWDLQ�WKHP
��$FKLHYHG�WKURXJ
K�LQIRUP
DWLRQ
(QH
UJ\�5DWLQJ�6\VWHP
'HP
RQVWUDWLRQ
PHG
LD��WKH
�GHYHORS
PHQ
W�RI�D
�+RP
H�(QH
UJ\�5DWLQJ
*XLGH
OLQHV��X
QGHUWDNLQJ
6\VWHP��+(56���DQG
�GHP
RQVWUDWLRQ�SURMHFWV�
PDUNHWLQJ�DQ
G�SURP
RWLRQ��DQG
KHOSLQJ�GH
VLJQ
�WKH
5HQ
RYDWLRQ�'HP
RQVWUDWLRQ
DQG�7UDLQLQJ�DQ
G�&HUWLILFDWLRQ
LQLWLDWLYHV�
3URJUDP
�RI�(
QHUJ\
$ZDUHQ
HVV
6WXG\�WK
H�OLQNDJH
�EHWZHH
Q�HQ
HUJ\�DQG
�FOLP
DWH�DQ
G(QH
UJ\
)XOO�VFDOH�VWDWXV�
1$
1$
5HVHD
UFK�DQ
G,QIRUP
DWLRQ
WKH�LPSOLFDWLRQV�IR
U�&DQ
DGD·V�HQ
HUJ\�VHFWRU��7KH
6WDUW������
�
'HYHORS
PHQ
W(GX
FDWLRQ
VHFRQG
�SDUW�R
I�WKH
�3(5'�7DVN�ZLOO�GHYHORS
XDO�EXG
JHW�R
I
�3(5'�
5'
WHFKQLTX
HV�WR
�FDS
WXUH�DQG
�GLVSR
VH�RI�*
+*V�DIWHU
����PLOOLRQ�
WKH\�KDYH�EH
HQ�IR
UPHG
�GXULQJ�HQ
HUJ\�UHODWHG
DFWLYLWLHV�
9ROXQ
WDU\
$ZDUHQ
HVV
7KH
�9&5�LQYLWHV�&DQ
DGLDQ�EX
VLQH
VVHV�DQG
$OO
)XOO�VFDOH�VWDWXV�
1$
%HQ
HILWV�RQJ
RLQJ
��2YHU���
�
&KD
OOHQJ
H�DQ
G,QIRUP
DWLRQ
RUJD
QL]DWLRQV�WR
�H[SUHVV�WK
HLU�LQWHQWLRQ�WR
VHFWRUV
6WDUW������
����
SDUWLFLSDQ
WV�DV�RI�1RY���
����
5HJ
LVWU\��9&5�
(GX
FDWLRQ
SDUWLFLSDWH��RQ�D�YROXQWDU\�ED
VLV��DQG
�GHYHORS
5HJ
LVWUDQ
WV�UHS
UHVHQW�VRX
UFHV
3URJUDP
DFWLRQ�SODQ
V�WR�OLPLW�RU�UHG
XFH�WKHLU�QH
W�*+*
RI�RYHU���
��RI�&
DQDG
D·V
HPLVVLRQ
V��9&5�RIILFH�VXS
SRUWHG
�E\�IHGH
UDO�DQG
*+*�HPLVVLRQ
V�
SURYLQFLDO�JRYHUQP
HQWV�DQG
�WKH�SULYDWH�VHFWRU�

�SODQQ
HG��LPSOHP
HQWHG��OH
JLVODWLRQ�SD
VVHG
�RU�QR
W��VWDWXV
�RI�IXQ
GLQJ
�*
�1RWH��LQ
�RUGHU�WR
�DYR
LG�GRX
EOH�FR
XQWLQ
J��LQ
�PRV
W�FDV
HV�WK
H�HIIHFWV�RI�LQ
GLYLGX
DO�P
HDVX
UHV�DUH�QR
W�TXD
QWLILHG
�GXH
�WR�WK
HLU�LQWHU�UHODWLR
QVKLS�DQ
G�FR
PELQH
G�LP
SDFW�ZLWK
�VLP
LODU�RU
**
RWKH
U�FR
PSOHP
HQWDU\�P
HDVX
UHV��7KH
�FRP
ELQH
G�HIIHFWV�RI�P
RVW�R
I�WKH
�PHD
VXUHV�DUH�DF
FRXQ
WHG�IRU�LQ�WK
H�HP
LVVLRQ
V�RX
WORRN
�WR����
��DQ
G�EH
\RQG
���VHH
�$SS
HQGL[����7DE
OHV
��D����E����F���
961DP
H�RI
7\SH�RI
2EMHFWLYH�DQ
G�RU�PHWKRG�RI�DFKLHYLQJ�UHG
XFWLRQ
6HFWRU
6WDWXV�RI
(VWLP
DWH�RI�PLWLJDWLRQ
0RQLWRULQJ��LQWHUP
HGLDWH
SROLF\�P
HDVX
UHLQVWUXPHQW
�LQFOXGLQJ�GHVFULSWLRQ�RI�KRZ�HIIHFWV�WDNH�SODFH�
LPSOHPHQ
WDWLRQ��
LP
SDFW
LQGLFDWRU�RI�SURJUHVV
����
����
%5,7,6+
&2/80%,$
%&��
�3RZ
HU�6PDUW
5'�
$Q�HQ
HUJ\
�HIILFLHQ
F\�DQG
�ZDWHU�FRQ
VHUYDWLRQ
5HV
LG��
6WDUW������
��(QG
1$
3URJUDP
�KDV
�EHH
Q�SK
DVHG
SURJ
UDP�IR
U�H[
LVWLQ
J�KR
PHV
���
�����([S
HQG��IR
URX
W��0HD
VXUHV�LQFOXG
H�WKH
PRV
W�UHF
HQW�\
HDU�
GLUHFW�LQ
VWDOODWLR
Q�RI�ZDWHU�
������PLOOLRQ�
VDYLQJ
�SURGX
FWV�LQ������
�
KRPHV
��UHWURILW�DGY
LFH�
SUHIHUUHG�ILQ
DQFLQJ
�DQG
�D�����
PLOOLRQ�IXQG
�IRU�VS
HFLDO
LQQR
YDWLYH�SURMHF
WV��6
DYLQJV
RQJR
LQJ�
%&·V�(TX
LSPHQ
W6WDQG
DUGV
�DQG
5HJ
XODWLRQV
�XQG
HU�WK
H�DF
W�UHT
XLUH�D�ZLGH�UDQJ
H�RI
&RP
P�
)XOO�V
FDOH�VWDWXV�
����NW
5HJ
XODWLRQV
�SHULRGLFD
OO\
(QH
UJ\�(IILFLHQ
F\5HJ
XODWLRQV
�DS
SOLDQF
HV�DQG
�HTX
LSPHQ
W�WR�PHH
W�PLQLP
XP,QVWLW�
,PSOHP
HQWHG
*+*V�SH
UXS
GDWHG�
6WDQG
DUGV
HQHUJ\
�SHUIRUP
DQFH
�VWDQG
DUGV
�5HV
LG�
��������
�\H
DU�
,QGX
VW�
&OHDQ
�9HK
LFOHV�DQ
G9HK
LFOH
7KH
�SURJUDP
�SURYLGH
V�VX
SSRUW�IRU�DOO�NLQG
V�RI�FOHDQ
7UDQV
S��
)XOO�V
FDOH�VWDWXV�
5HG
XFWLR
QV%HQ
HILWV�RQJ
RLQJ
�
)XH
OV�3URJUDP
(PLVVLRQ
VWUDQ
VSRUWDWLR
Q�IXHOV��5HG
XFHV
�DLU�HP
LVVLRQ
V�IURP
RI����
�&2�
7HV
WLQJ�
YHKLFOHV
�WKURXJ
K�DF
WLRQV
�VXF
K�DV
�HPLVVLRQ
V�WHVWLQJ
���
0DLQWHQ
DQFH
DQG�PDLQWHQ
DQFH
��5HG
XFWLR
QV�RI�D
SSUR[�����
�LQK\
GUR�
)LQDQ
FLDO
IOHHW�HPLVVLRQ
V�ED
VHG�RQ
�$LU&
DUH�
FDUERQ
V����
,QFH
QWLYH
12[������
3URJUDP
&2
�LQ�IOHH
W�
HPLVVLRQ
V�
971DP
H�RI
7\SH�RI
2EMHFWLYH�DQ
G�RU�PHWKRG�RI�DFKLHYLQJ�UHG
XFWLRQ
6HFWRU
6WDWXV�RI
(VWLP
DWH�RI�PLWLJDWLRQ
0RQLWRULQJ��LQWHUP
HGLDWH
SROLF\�P
HDVX
UHLQVWUXPHQW
�LQFOXGLQJ�GHVFULSWLRQ�RI�KRZ�HIIHFWV�WDNH�SODFH�
LPSOHPHQ
WDWLRQ��
LPSDFW
LQGLFDWRU�RI�SURJUHVV
����
����
%5,7,6+
&2/80%,$��FR
QW��
)RUHVW
9ROXQ
WDU\�RU
3KD
VLQJ
�RXW�RI�´%HH
KLYH�%XUQH
UVµ�DQ
G�HQ
FRXUDJ
LQJ
)RUHVW�
)XOO�VFDOH�VWDWXV�
1$
1$
6XVWDLQDE
LOLW\
5HJ
XODWHG
RWKH
U�YDOXH�DG
GHG�XVH�IRU�ZRR
G�UHVLGX
H����0
W�QR
,QLWLDWLYHV
6WDQG
DUGV
ORQJ
HU�LQFLQH
UDWHG��
/DQG
ILOO�&
ULWHULD
9ROXQ
WDU\�RU
$WWH
PSWLQJ�WR�UHG
XFH�DP
RXQW�RI�Z
DVWH�JRLQJ
�WR0XQ
LF�
)XOO�VFDOH�VWDWXV�
1$
1$
5HJ
XODWHG
ODQG
ILOOV�RU�LQFLQH
UDWRUV�E\���
��SHU�FDS
LWD�E\�WKH
6WDQG
DUGV
\HDU����
���$OVR�UHJX
ODWLQJ�PHWKD
QH�DQG
�RWKHU
*+*V�WKDW�DUH�HVFDS
LQJ�IURP
�ODQG
ILOOV�
7UDQVSR
UWDWLRQ
$ZDUHQ
HVV
'HYHORS
�7'0�VWUDWHJ
LHV�IRU�WKH�SURYLQFH·V�P
DMRU
7UDQVS�
)XOO�VFDOH�VWDWXV�
1$
7'0�IR
U�JR
YHUQPHQ
W�DQG
'HP
DQG
,QIRUP
DWLRQ
XUED
Q�DUHD
V��3URYLGH
G�IXQG
LQJ�IRU�D�QH
Z�F\FOLQJ
&URZQ�HP
SOR\HH
V�LV�XQG
HU
0DQ
DJHP
HQW��7'0�
(GX
FDWLRQ
LQIUDVWUXFWXUH�
H[SD
QVLRQ�
$LU&
DUH
9ROXQ
WDU\�RU
7HVW�WKH
�H[KDX
VW�V\VWHPV�RI���P
LOOLRQ�OLJKW�GXW\
7UDQVS�
)XOO�VFDOH�VWDWXV�
5HG
XFHG
$�YROXQ
WDU\�YHK
LFOH�VFUDS
SLQJ
5HJ
XODWHG
YHKLFOHV�SHU�\HD
U�6WDUW����
��*+*�E\���
�SURJ
UDP�LV�WR
�EH�SLORW�WHVWHG
6WDQG
DUGV
NW�DQQ
XDOO\
LQ�WK
H�/R
ZHU�)UDVHU�9DOOH\�
VLQFH���
���
%�&��(
QHUJ\�&RG
H9ROXQ
WDU\�RU
3URJUDP
�VXS
SRUWV�WKH�LQWURG
XFWLRQ�RI�QHZ
�HQH
UJ\
&RP
P�
6WDUW����
��1$
1$
IRU�%XLOGLQJV�DQG
5HJ
XODWHG
HIILFLHQF\�UHTX
LUHPHQ
WV�IR
U�EX
LOGLQJV�DQG
�KRP
HV5HVLG�
+RX
VHV
6WDQG
DUGV
LQWR�WK
H�%�&��%
XLOGLQJ�&RG
H�
(QH
UJ\�(IILFLHQ
W9ROXQ
WDU\�RU
(QFRX
UDJH
V�HQ
HUJ\�UHWURILWV�LQ�H[LVWLQJ�SX
EOLF
&RP
P�
1$
1$
7KH
���\HD
U�SURJ
UDP�VKR
XOG
3XE
OLF�%XLOGLQJV
5HJ
XODWHG
IDFLOLWLHV�
,QVWLW��
SURG
XFH�HQ
HUJ\�VDYLQJV�RI
3URJUDP
6WDQG
DUGV
���²
���P
LOOLRQ�SH
U�\HDU�
(QYLUR
QPHQ
WDO
$ZDUHQ
HVV
,QIRUP
DWLRQ�SD
FNDJ
HV�IR
U�JR
YHUQPHQ
W�HPSOR\HH
V�*RYW�
1$
1$
1$
$ZDUHQ
HVV
,QIRUP
DWLRQ
3URJUDP
(GX
FDWLRQ
*RLQJ
�3ODFHV
5HJ
XODWHG
�DQG
7KH
�FRQ
VWUXFWLRQ�RI�DQ�+29�QHWZRUN�LQ�/RZ
HU7UDQVS�
1$
1$
1$
9ROXQ
WDU\
0DLQODQ
G��%�&��
6WDQG
DUGV
'HVWLQDWLRQ
$ZDUHQ
HVV
-RLQWO\�IX
QGHG
�SURJUDP
�IRU�HG
XFDWLRQ�DQ
G�HQ
HUJ\
,QVWLW�
)XOO�VFDOH�VWDWXV�
1$
2QJ
RLQJ
�EHQ
HILWV�
&RQ
VHUYDWLRQ
,QIRUP
DWLRQ
UHWURILW�IRU�%�&��VFKRR
OV�
(GX
FDWLRQ

�SODQQ
HG��LPSOHP
HQWHG��OHJLVODWLRQ�SD
VVHG
�RU�QR
W��VWDWXV�RI�IXQ
GLQJ
�*
�1RWH��LQ�RUGHU�WR
�DYRLG�GRX
EOH�FRXQ
WLQJ��LQ�P
RVW�FDVHV�WK
H�HIIHFWV�RI�LQGLYLGX
DO�P
HDVXUHV�DUH�QR
W�TXD
QWLILHG
�GXH
�WR�WK
HLU�LQWHU�UHODWLRQVKLS�DQ
G�FRPELQH
G�LPSD
FW�ZLWK�VLPLODU�RU
**
RWKH
U�FRPSOHP
HQWDU\�P
HDVXUHV��7KH
�FRP
ELQH
G�HIIHFWV�RI�P
RVW�R
I�WKH
�PHD
VXUHV�DUH�DFFRXQ
WHG�IRU�LQ�WK
H�HP
LVVLRQ
V�RX
WORRN�WR
����
��DQ
G�EH
\RQG
���VHH
�$SS
HQGL[����7DE
OHV
��D����E����F���
981DP
H�RI
7\SH�RI
2EMHFWLYH�DQ
G�RU�PHWKRG�RI�DFKLHYLQJ�UHG
XFWLRQ
6HF
WRU
6WDWXV�RI
(VWLP
DWH�RI�PLWLJDWLRQ
0RQLWRULQJ��LQWHUP
HGLDWH
SROLF\
�PHD
VXUH
LQVWUXPHQW
�LQFOXGLQJ�GHVFULSWLRQ�RI�KRZ�HIIHFWV�WDNH�SODFH�
LPSOHPHQ
WDWLRQ��
LP
SDF
W LQGLFDWRU�RI�SURJUHVV
����
����
$/%(57$
&OHDQ
�$LU�6WUDWHJ
LF$ZDUHQ
HVV
'HYHORS
�FRQ
VHQVXV�RQ�UHFRPPHQ
GDWLRQV�RI�S
ULYDWH
$OO
1$
1$
$OOLDQ
FH�UHFRP
PHQ
GV
$OOLDQ
FH�
,QIRUP
DWLRQ
DQG�SX
EOLF�VHFWRUV�IR
U�UHGX
FWLRQ�RI�*+*�HPLVVLRQ
V�VHFWRUV
LQLWLDWLYHV�WK
DW�KDYH�WKH
(GX
FDWLRQ
SRWHQWLDO�WR�UHGX
FH�*+*
6WDQG
DUGV�DQG
HPLVVLRQ
V�³�H�J���IRU
5HJ
XODWLRQV
YHKLFOHV��H
QHUJ\�HIILFLHQF\�LQ
PDQ
XIDFWXULQ
J�VWDQ
GDUGV��DQG
HQHUJ\�FRG
HV�
(QH
UJ\�(IILFLHQ
F\(QH
UJ\
*RYHUQP
HQW�R
I�$OEHUWD�LV�DVVHVVLQJ
�HQH
UJ\
*RYW�
%HLQJ
1$
*RYHUQP
HQW�E
XLOGLQJV�XVH�D
$XG
LWV3HUIRUP
DQFH
HIILFLHQF\�RI�LWV�RZ
Q�EX
LOGLQJV��$
XGLWV�DUH�UHYLHZHG
LPSOHP
HQWHG�
FRPSX
WHUL]HG
�GDWDE
DVH�WKDW
&RQ
WUDFWV
WR�LGHQ
WLI\�FDQG
LGDWHV�IR
U�FRVW�HIIH
FWLYH�HQ
HUJ\
NHHS
V�WUDFN�RI�HQH
UJ\
UHWURILWV�
FRQVXP
SWLRQ�WR�P
DNH�HQ
HUJ\
FRQVHUYDWLRQ�GH
FLVLRQ
V�
6PDOO�3
RZHU
5'
,QGH
SHQG
HQW�G
HYHORS
HUV�RI�DSS
URYHG�VP
DOO�K\GUR�
$OO
)XOO�VFDOH�VWDWXV�
7RWDO�RIIVHWV
7KH
�WRWDO�SURGX
FWLRQ�RI
5HVHD
UFK�DQ
GZLQG��DQG
�ELRPDVV�SURMHFWV�FDQ
�VHOO�SRZ
HU�WR
6WDUW������
����
RI�����0
W�RI
HOHFWULFLW\�IURP
�635'
'HYHORS
PHQ
WHOHFWULFDO�XWLOLWLHV�DW�D
�OHYHOOHG�SULFH�RU�HVFDODWHG
&2
SURMHFWV�ZLOO�EH���
��*:K�SH
U
�635'��3URJUDP
SULFH�LQGH
[HG�WR�LQIODWLRQ��7KLV�SURJ
UDP�LV�DOVR
SRVVLEOH
\HDU�ZKH
Q�DOO�SURMHFWV�DUH
DLPHG
�DW�WHFKQ
RORJ
\�WUDQ
VIHU�
RYHU�QH[W��
�FRPPLVVLRQ
HG��,Q���
�����
��
�
\HDUV�
*:K�RI�HOHFWULFLW\�ZHUH
JHQH
UDWHG�XQ
GHU�WKH�SURJ
UDP�
$OEHUWD�)RUHVW
6WDQG
DUGV�DQG
)RUHVWV�DUH�P
DQDJ
HG�IR
U�VXVWDLQH
G�\LHOGV��7
KLV�LV
)RUHVW�
1$
1$
1$
&RQ
VHUYDWLRQ
5HJ
XODWLRQV
WR�HQVXUH�WKDW�WK
H�YROXPH�RI�WLPEH
U�KD
UYHVWHG�GR
HV
6WUDWHJ
\QR
W�H[FHH
G�WKH�YROXPH�JURZ
Q�
991DP
H�RI
7\SH�RI
2EMHFWLYH�DQ
G�RU�PHWKRG�RI�DFKLHYLQJ�UHG
XFWLRQ
6HF
WRU
6WDWXV�RI
(VWLP
DWH�RI�PLWLJDWLRQ
0RQLWRULQJ��LQWHUP
HGLDWH
SROLF\
�PHD
VXUH
LQVWUXPHQW
�LQFOXGLQJ�GHVFULSWLRQ�RI�KRZ�HIIHFWV�WDNH�SODFH�
LPSOHPHQ
WDWLRQ��
LPSDF
WLQGLFDWRU�RI�SURJUHVV
����
����
$/%(57$��FR
QW��
&DQ
DGD²
$OEHUWD
$ZDUHQ
HVV
3URJUDP
�HQFRX
UDJH
V�WLOODJH
�SUDFWLFHV�WK
DW�UHG
XFH
$JULF�
��\HDU�FRVW�
1$
3URJUDP
�H[HFXWHG�LQ
(QYLUR
QPHQ
WDOO\
,QIRUP
DWLRQ
*+*�HPLVVLRQ
V��
VKDUHG
�DJUHH
PHQ
W�FRQMXQ
FWLRQ�ZLWK�WK
H�$OEHUWD
6XVWDLQDE
OH(GX
FDWLRQ
5HG
XFHG
�7LOODJ
H�,QLWLDWLYH�
$JULFXOWXUH
5'
(VWDE
OLVKH
V�D�IUDP
HZRUN�IRU
$JUHH
PHQ
WDG
GUHVVLQJ
�HQYLUR
QPHQ
WDO
FRQFHUQV�ZLWKLQ�WK
H
DJULFXOWXUDO�VHFWRU�
)RUHVWU\�(GX
FDWLRQ
$ZDUHQ
HVV
)RUHYHU�$�7UHH�LV�D�IR
UHVW�FRQ
VHUYDWLRQD
O�SURJUDP
(GX
F�1$
1$
1$
3URJUDP
V�,QIRUP
DWLRQ
IRU�FKLOGUHQ�LQ�*UDGH
V���DQ
G����$UERX
U�'D\�SURJUDP
(GX
FDWLRQ
JLYHV�VHHG
OLQJV�WR
�VFKRR
OV�IR
U�SODQ
WLQJ��7UHHV�DUH
DOVR�SURYLGH
G�WR�RWKHU�LQWHUHVW�JURXS
V�IRU
GHPRQ
VWUDWLRQ�SX
USRVHV�
/DQG
�3XUFKDVH
6WDQG
DUGV�DQG
7KH
�SURYLQFH�EX
\V�ODQG
�WR�UHWDLQ�ZHWODQG
V�DQ
G�WUHH
1$
1$
1$
%HQ
HILWV�ZLOO�EH�RQ
JRLQJ�
3URJUDP
5HJ
XODWLRQV
FRYHU��WK
HUHE
\�UHGX
FLQJ
�*+*�HPLVVLRQ
V�
$FWLRQ�RQ
�:DVWH
6WDQG
DUGV�
$�FRP
SUHK
HQVLYH�ZDVWH�P
DQDJ
HPHQ
W�VWUDWHJ
\�WR
0XQ
LF�
1$
1$
0HD
VXUHV�LQFOXG
H�UHF\FOLQJ�
3URJUDP
UHGX
FH�WK
H�OHYHOV�RI�P
XQLFLSDO�VROLG�ZDVWH��
����UHG
XFWLRQ�RI����
��ZDVWH
OHYHOV�E\���
���
&RVW�(IIH
FWLYH�8VH
5'
7KH
�$OEHUWD�&KD
PEH
U�RI�5HVRX
UFHV�LV�OHDG
LQJ�DQ
&RP
P�
1$
1$
1$
RI�&2�(PLVVLRQ
VLQLWLDWLYH�WR�ILQG
�D�FRVW�HIIHFWLYH�XVH�IRU�$OEHUWD·V
�
&2�HPLVVLRQ
V��
(QH
UJ\�(IILFLHQ
F\$ZDUHQ
HVV
7KH
�JRYHUQP
HQW�R
I�$OEHUWD�KDV�EHH
Q�HQ
FRXUDJ
LQJ
,QGX
VW�
1$
1$
1$
6WDQG
DUGV
,QIRUP
DWLRQ
WKH�&DQ
DGLDQ�*DV�$VVRFLDWLRQ�DQ
G�WKH�&DQ
DGLDQ
(GX
FDWLRQ
6WDQG
DUGV�$VVRFLDWLRQ�WR�LQFOXG
H�HQ
HUJ\�HIILFLHQ
F\
UHTX
LUHPHQ
WV�ZLWK�P
DQXIDFWXULQ
J�VWDQ
GDUGV�
-DVSHU�(QH
UJ\
$ZDUHQ
HVV
$�FRP
PXQ
LW\�ZLGH�HIIRUW�WR
�UHG
XFH�HOHFWULFLW\
5HVLG�
&RP
SOHWH�
5HG
XFWLRQ�LQ
7RWDO�DQQ
XDO�HQH
UJ\�VDYLQJ
V
(IILFLHQ
F\�3URMHFW
,QIRUP
DWLRQ
GHPDQ
G�DQ
G�GH
IHU�FRQVWUXFWLRQ�RI�D�WUDQ
VPLVVLRQ
&RP
P�
HPLVVLRQ
V�RI
RI
(GX
FDWLRQ
OLQH�RU�H[SDQ
VLRQ
�RI�WKH
�HOHFWULFLW\�JHQ
HUDWLQJ�SODQ
W�����W�1
2[
����
����
��N:
K�
)LQDQ
FLDO
DQG�����
��W
,QFHQWLYH
&2�
�

100
1DP
H�RI
7\SH�RI
2EMHFWLYH�DQ
G�RU�PHWKRG�RI�DFKLHYLQJ�UHG
XFWLRQ
6HF
WRU
6WDWXV�RI
(VWLP
DWH�RI�PLWLJDWLRQ
0RQLWRULQJ��LQWHUP
HGLDWH
SROLF\
�PHD
VXUH
LQVWUXPHQW
�LQFOXGLQJ�GHVFULSWLRQ�RI�KRZ�HIIHFWV�WDNH�SODFH�
LPSOHPHQ
WDWLRQ��
LPSDF
WLQGLFDWRU�RI�SURJUHVV
����
����
$/%(57$��FR
QW��
'UXPKH
OOHU�3RZ
HU$ZDUHQ
HVV
3URJUDP
�DLPV�WR�UHG
XFH�ZDWHU��J
DV��D
QG�HOHFWULFLW\
5HVLG�
1$
1$
XDO�VDYLQJV�RI��
������
�LQ
6PDUW�3
DUWQHUVKLS
,QIRUP
DWLRQ
XVH�LQ�FLW\�ID
FLOLWLHV�DQ
G�FXVWRP
HUV�LQ�WK
H�FLW\�
ILYH�PXQ
LFLSDO�ID
FLOLWLHV�
3URJUDP
�(GX
FDWLRQ
'HVWLQDWLRQ
$ZDUHQ
HVV
$�VWXGH
QW�GULYHQ
�SURJUDP
�WKDW�LQFUHD
VHV�SH
UVRQ
DO,QVWLW�
1$
1$
$FFUXHG
�VDYLQJV�RI��
���
&RQ
VHUYDWLRQ
,QIRUP
DWLRQ
DZDUHQ
HVV�DQ
G�HQ
FRXUDJ
HV�SDUWLFLSDWLRQ�E\�DOO
PLOOLRQ�RYHU�WK
H�ODVW���\HD
UV�
(GX
FDWLRQ
PHP
EHUV�RI�VFKRR
O�FRP
PXQ
LWLHV�WR
�FRQ
VHUYH
2YHU���
��VFKR
ROV
HQHUJ\�
SDUWLFLSDWLQJ�
3RZ
HU�6PDUW
$ZDUHQ
HVV
(QH
UJ\�XWLOLWLHV�GH
OLYHU�VXFK�SURJ
UDPV�DV
1$
1$
1$
3RZ
HU�6PDUW�LV�D�QD
WLRQD
O�DQG
,QIRUP
DWLRQ
LQIRUP
DWLRQ�DQ
G�HG
XFDWLRQ��WUDLQLQJ
��DQG
LQWHUQDWLRQD
O�EUDQG
�WR�IR
VWHU
(GX
FDWLRQ
HQGR
UVHP
HQW�D
QG�ODEH
OOLQJ
�RI�H
QHUJ\�HIILFLHQW
HQHUJ\�HIILFLHQ
F\�DFWLRQV�E\
5'
SURG
XFWV�DQG
�WHFKQR
ORJLHV�
FRQVXP
HUV�
6XVWDLQDE
OH$ZDUHQ
HVV
$WWH
PSWV�WR�LQIOXHQ
FH�$OEHUWDQ�FRPPXQ
LWLHV�WR
0XQ
LF�
1$
1$
1$
&RP
PXQ
LWLHV
,QIRUP
DWLRQ
UHGX
FH�WK
HLU�ZDVWH�VWUHD
P�E\�DS
SUR[LPDWHO\���
�DV
,QLWLDWLYH
(GX
FDWLRQ
D�UHVXOW�RI�FRP
SRVWLQJ��,Q
YROYHV�FRP
PXQ
LWLHV�LQ
DFWLYLWLHV�WK
DW�GHP
RQVWUDWH�DQ�DG
RSWLRQ�RI��D
QG
FRPPLWP
HQW�WR�ZRUNLQJ
�WRZDUGV��D
�VKD
UHG�YLVLRQ
�RI
VXVWDLQD
EOH�GH
YHORSP
HQW�
6PRJ
�)UHH
$ZDUHQ
HVV
$Q�HG
XFDWLRQD
O�SURJUDP
�WKDW�P
DNHV�LW�HDV\�DQ
G7UDQVS�
��\HDUV�LQ�&DOJD
U\�
1$
1$
,QIRUP
DWLRQ
FRQYHQ
LHQW�IR
U�PRWRULVWV�WR
�UHG
XFH�WKHLU�YHKLFOH
�VW�\HD
U�LQ
(GX
FDWLRQ
HPLVVLRQ
V��7KH
UH�DUH�ILQD
QFLDO�GLVFRXQ
WV�IR
U�ZRUN
(GP
RQWRQ�
)LQDQ
FLDO
WKDW�UHG
XFHV�HPLVVLRQ
V��,Q
FUHD
VLQJ
�SXE
OLF
,QFHQWLYH
DZDUHQ
HVV�E\�SXE
OLFL]LQJ�SURJ
UDP�WK
URXJ
K�PDVV
PHG
LD�DQG
�WKH�SD
UWLFLSDWLQJ�VHUYLFH�FHQWUHV�
*UHHQ
KRXVH�*DV
$ZDUHQ
HVV
7RS
LFV�RI�*+*V�DQ
G�JORE
DO�ZDUPLQJ�DUH�DG
GUHVVHG
1$
1$
1$
1$
&XUULFXOXP
,QIRUP
DWLRQ
LQ�WK
H�FXUULFXOXP
�IRU�WKH�FRPSX
OVRU\�FRXUVHV�RI
(GX
FDWLRQ
VRFLDO�VFLHQ
FHV��QDWXUDO�VFLHQ
FHV��DQG
�QDWXUDO
UHVRXUFHV�IRU�MXQLRU�DQG
�KLJK�VFKR
RO�VWXGH
QWV��7KH
SURJ
UDP�LV�FUHDWLQJ�JUHD
WHU�DZ
DUHQ
HVV�WRGD
\�IRU
VROXWLRQV�LQ�WK
H�IXWXUH�
101
1DP
H�RI
7\SH�RI
2EMHFWLYH�DQ
G�RU�PHWKRG�RI�DFKLHYLQJ�UHG
XFWLRQ
6HF
WRU
6WDWXV�RI
(VWLP
DWH�RI�PLWLJDWLRQ
0RQLWRULQJ��LQWHUP
HGLDWH
SROLF\
�PHD
VXUH
LQVWUXPHQW
�LQFOXGLQJ�GHVFULSWLRQ�RI�KRZ�HIIHFWV�WDNH�SODFH�
LPSOHPHQ
WDWLRQ��
LPSDF
WLQGLFDWRU�RI�SURJUHVV
����
����
$/%(57$��FR
QW��
'ULOOLQJ�:DVWH
6WDQG
DUGV�DQG
,PSOHP
HQW�S
URFHGX
UHV�IRU�SH
WUROHX
P�GULOOLQJ�ZDVWH
2LO�DQ
G)XOO�VFDOH�VWDWXV�
1$
1$
0DQ
DJHP
HQW
5HJ
XODWLRQV
PDQ
DJHP
HQW�D
QG�GLVSR
VDO�UHT
XLUHPHQ
WV��LQ�DQ
*DV
6WDUW����
��
DWWHPSW�WR
�UHG
XFH�ZDVWH�JHQ
HUDWHG
�IURP
�GULOOLQJ
DFWLYLWLHV��(
QFRX
UDJH
V�WKH�UHXVH�RI�GULOOLQJ�PDWHULDOV
DQG�WKH�XVH�RI�P
RUH�HQ
YLURQP
HQWDOO\�EHQ
LJQ�GULOOLQJ
V\VWHP
V��P
XGV��DQG
�DGG
LWLYHV�
7LPEH
U�+DUYHVW
6WDQG
DUGV�DQG
2SH
UDWLQJ�JURX
QG�UXOHV��Z
KLFK�RXWOLQH�WKH�SUDFWLFHV
)RUHVW�
1$
1$
1$
3ODQQ
LQJ
5HJ
XODWLRQV
WKDW�P
XVW�E
H�IROORZHG
�ZKH
Q�KD
UYHVWLQJ�WLP
EHU�
/HDVHK
ROG
0DLQWHQ
DQFH
2ZQH
UV�RI�J
RYHUQP
HQW�OHDVHG
�EXLOGLQJV�DUH
&RP
P�
1$
1$
%HQ
HILWV�RQJ
RLQJ
�
$JUHH
PHQ
WVHQ
FRXUDJ
HG�WR
�LPSOHP
HQW�FRVW�HIIHFWLYH�HQ
HUJ\
HIILFLHQF\�PHD
VXUHV�
%HYHUDJ
H�&RQ
WDLQHU
$ZDUHQ
HVV�
2EMHFWLYH�LV�WR
�HGX
FDWH�FRQ
VXPHUV�DQ
G�SURP
RWH�D
5HVLG�
1$
1$
:LOO�UHG
XFH�ZDVWH�DQG
�HQH
UJ\
5HF\FOLQJ
,QIRUP
DWLRQ
KLJK
HU�UDWH�RI�UHWXUQ�RI�FRQ
WDLQHUV��(IIR
UW�LV�XQG
HU&RP
P�
XVH�
(GX
FDWLRQ
ZD\�WR
�GHYHORS
�DQ�LQGX
VWU\�UXQ
�UHFRYHU\�SURJ
UDP�
(FR�HIILFLHQ
W$ZDUHQ
HVV
3URYLGH
V�PXQ
LFLSDOLWLHV�ZLWK�VXFFHVV�VWRULH
V��D
0XQ
LF�
,QIRUP
DWLRQ
1$
1$
&RP
PXQ
LWLHV
,QIRUP
DWLRQ
´+RZ
�WR�*XLGH
�µ�DQG
�ZRUNVKR
SV�RQ�SR
WHQWLDO
GHYHORSH
G��6RP
H
(GX
FDWLRQ
DFWLRQV�
PXQ
LFLSDOLWLHV
DSSURD
FKHG
�
)DUP�(QH
UJ\
$ZDUHQ
HVV
$VVLVWV�SULP
DU\�SURG
XFHUV�LQ�WK
H�DUHD
V�RI�HQH
UJ\
$JULF�
)XOO�VFDOH�VWDWXV�
1$
1$
0DQ
DJHP
HQW
,QIRUP
DWLRQ
XVH��HQH
UJ\�HIILFLHQF\��DQG
�DOWHUQDWLYH�DQ
G
(GX
FDWLRQ
UHQH
ZDE
OH�HQH
UJ\�
:DVWH�0
DQDJ
HPHQ
W$ZDUHQ
HVV�
$�XVHU�IULHQG
O\�LQIRUP
DWLRQ�DQ
G�UHVRXUFH�NLW�ZLOO�EH
*RYW�
1$
1$
$GYLVRU\�VXSS
RUW�IRU�VWDUWLQJ
$FWLRQV
,QIRUP
DWLRQ
DVVHPEOHG
�DQG
�VKD
UHG�ZLWK�DOO�JR
YHUQPHQ
WWKH�SURJ
UDP�ZLOO�EH�SURYLGHG
�
(GX
FDWLRQ
GHSD
UWPHQ
WV�WR
�HQFRX
UDJH
�WKHP
�WR�XQG
HUWDNH
YROXQWDU\�ZDVWH�P
DQDJ
HPHQ
W�PHD
VXUHV�
�SODQQ
HG��LPSOHP
HQWHG��OH
JLVODWLRQ�SD
VVHG
�RU�QR
W��VWDWXV
�RI�IXQ
GLQJ
�*
�1RWH��LQ
�RUGHU�WR
�DYR
LG�GRX
EOH�FR
XQWLQ
J��LQ
�PRV
W�FDV
HV�WK
H�HIIHFWV�RI�LQ
GLYLGX
DO�P
HDVX
UHV�DUH�QR
W�TXD
QWLILHG
�GXH
�WR�WK
HLU�LQWHU�UHODWLR
QVKLS�DQ
G�FR
PELQH
G�LP
SDFW�ZLWK
�VLP
LODU�RU
**
RWKH
U�FR
PSOHP
HQWDU\�P
HDVX
UHV��7KH
�FRP
ELQH
G�HIIHFWV�RI�P
RVW�R
I�WKH
�PHD
VXUHV�DUH�DF
FRXQ
WHG�IRU�LQ�WK
H�HP
LVVLRQ
V�RX
WORRN
�WR����
��DQ
G�EH
\RQG
���VHH
�$SS
HQGL[����7DE
OHV
��D����E����F���
102
1DP
H�RI
7\SH�RI
2EMHFWLYH�DQ
G�RU�PHWKRG�RI�DFKLHYLQJ�UHG
XFWLRQ
6HFWRU
6WDWXV�RI
(VWLP
DWH�RI�PLWLJDWLRQ
0RQLWRULQJ��LQWHUP
HGLDWH
SROLF\�P
HDVX
UHLQVWUXPHQW
�LQFOXGLQJ�GHVFULSWLRQ�RI�KRZ�HIIHFWV�WDNH�SODFH�
LPSOHPHQ
WDWLRQ��
LP
SDFW
LQGLFDWRU�RI�SURJUHVV
����
����
6$6.$7&+(:$1
5����
��,QLWLDWLYH
$ZDUHQ
HVV
$�OH
DGLQJ�HG
JH�VWDQG
DUG�IRU�HQ
HUJ\
�HIILFLHQ
F\�
5HV
LG�
1$
1$
%HQ
HILWV�ZLOO�EH�RQ
JRLQJ�
,QIRUP
DWLRQ
KLJK
�TXD
OLW\�QH
Z�UHV
LGHQ
WLDO�K
RXVLQJ
�LV�EHLQJ
(GX
FDWLR
QDF
WLYHO\�SURP
RWHG
�WKURXJ
K�D�MRLQW�Y
HQWXUH�
����
��(QH
UJ\
$ZDUHQ
HVV
3KR
QH�OLQH
�SURYLGH
V�HQ
HUJ\
�FRQ
VHUYDWLRQ�HIILFLHQF
\5HV
LG�
)XOO�V
FDOH�VWDWXV�
1$
1$
&RQ
VHUYDWLRQ�/LQH
,QIRUP
DWLRQ
LQIRUP
DWLRQ�WR�UHV
LGHQ
WV�RI�WKH
�SURYLQF
H��7KH
7UDQV
S�6WDUW������
����
(GX
FDWLR
QRE
MHFWLYH�RI�WK
H�SK
RQH�OLQH�LV�WR
�SURYLGH
�UHV
LGHQ
WV
ZLWK
�RQH
�VWRS�VK
RSSLQJ
�IRU�LQIRUP
DWLRQ�DQ
G�WR
SURP
RWH�WKH�ZLVH�XV
H�RI�HQH
UJ\��7KH
�OLQH
�SURYLGH
V
LQIRUP
DWLRQ�DQ
G�EURF
KXUHV�IURP
�15&DQ
�DQG
�RWKHU
VRXUFH
V�
(QH
UJ\�(IILFLHQ
F\6WDQG
DUGV
�DQG
3ODQ�FD
OOV�IR
U�LP
SURY
HG�HQH
UJ\�HIILFLHQF
\�LQ
*RY
W�1$
1$
1$
3ODQ
5HJ
XODWLRQV
JRYH
UQPHQ
W�EXLOGLQJV
�DQG
�DOVR�H[
DPLQHV
RSSR
UWXQ
LWLHV
�IRU�DOWHUQDWLYH�IXHOV�LQ�LWV�YH
KLFOH�IOH
HW�
(QH
UJ\�(IILFLHQ
F\$ZDUHQ
HVV
*RY
HUQP
HQW�V
XSSR
UWV�WKH�YLJR
URXV
�DQD
O\VLV�RI
*RY
W�1$
(VWLP
DWHG
3URJUDP
�H[S
DQGLQJ
�
&RP
PLWP
HQW
,QIRUP
DWLRQ
PHWKR
GV�WR
�UHG
XFH�*+*�HPLVVLRQ
V��LQ
FOXG
LQJ�WKH
��NW�\HD
U
(GX
FDWLR
QDQ
DO\VLV�RI�Y
ROXQ
WDU\�P
HDVX
UHV�DQ
G�PHD
VXUHV
VDYH
G�WR
5'
SUHY
LRXV
O\�HYD
OXDWHG
�DW�WKH
�QDWLRQD
O�OHY
HO��(
QHUJ\
GDWH�
XVH�DX
GLWV�DUH�RIIH
UHG�WR�D�EURDG
�UDQ
JH�RI
JRYH
UQPHQ
W��LQVWLWX
WLRQD
O��DQ
G�FR
PPHUFLDO�HQH
UJ\
XVHUV�LQ�WK
H�SURY
LQFH
�
103
1DP
H�RI
7\SH�RI
2EMHFWLYH�DQ
G�RU�PHWKRG�RI�DFKLHYLQJ�UHG
XFWLRQ
6HFWRU
6WDWXV�RI
(VWLP
DWH�RI�PLWLJDWLRQ
0RQLWRULQJ��LQWHUP
HGLDWH
SROLF\�P
HDVX
UHLQVWUXPHQW
�LQFOXGLQJ�GHVFULSWLRQ�RI�KRZ�HIIHFWV�WDNH�SODFH�
LPSOHPHQ
WDWLRQ��
LPSDFW
LQGLFDWRU�RI�SURJUHVV
����
����
6$6.$7&+(:$1
�FRQ
W��
$JULFXOWXUDO�(
QHUJ\
$ZDUHQ
HVV
$Q�$JULFXOWXUDO�(
QHUJ\�8VH�'DWDE
DVH�KD
V�EH
HQ$JULF�
)XOO�VFDOH�VWDWXV�
���0
W�RI
$OVR�SURP
RWLQJ�VXVWDLQD
EOH
8VH�'DWDE
DVH
,QIRUP
DWLRQ
HVWDEOLVKH
G�DW�WK
H�8QLYHUVLW\�RI�6
DVNDWFKH
ZDQ
�LQ&2
IRUHVW�P
DQDJ
HPHQ
W�
(GX
FDWLRQ
FRRS
HUDWLRQ�ZLWK�WK
H�IHGH
UDO�JRYHUQP
HQW�WR�DVVHVV
VHTX
HVWHUHG
HQHUJ\�XVH�LQ�WK
H�DJ
ULFXOWXUDO�VHFWRU��3URYLQFLDO
RYHU�ODVW
IDUP
V�KD
YH�H[SHULHQFHG
�UDS
LG�H[SDQ
VLRQ
�RI
GHFDGH
�
FRQVHUYDWLRQ�IDUP
LQJ�WHFKQLTX
HV��H
QFRX
UDJH
G�E\
WKH�SURYLQFH�
�
*DV�5HD
G\(FRQR
PLF
6DVN(
QHUJ\�LV�SURPRWLQJ�WKH�´*
DV�5HD
G\µ�KR
PH
5HVLG�
)XOO�VFDOH�VWDWXV�
1$
%HQ
HILWV�DUH�RQJ
RLQJ
�
0HD
VXUHV
FRQFHS
W��ZKLFK�ZLOO�HQD
EOH�FRQVXP
HUV�WR�WD
NH
DGYDQWDJ
H�RI�HIILFLHQ
W�QDWXUDO�JDV�WH
FKQR
ORJ\�LQ
QHZ�KRP
HV�
6XS
SRUWLQJ
9ROXQ
WDU\
7KH
�SURYLQFH�LV�HQFRX
UDJLQJ
�LQGX
VWU\�WR
�UHJ
LVWHU
$OO
)XOO�VFDOH�VWDWXV�
1$
7KH
�9&5�RIILFH�KDV�UHFHLYHG
9ROXQ
WDU\
0HD
VXUHV
DFWLRQV�XQG
HU�WK
H�QD
WLRQ·V�9ROXQ
WDU\�&KD
OOHQJ
H�DQ
GVHFWRUV
RYHU����VXEP
LVVLRQ
V�IURP
&KD
OOHQJ
H�DQ
G5HJ
LVWU\�3URJUDP
�6DVNDWFKH
ZDQ
�FRP
SDQLHV��
5HJ
LVWU\��9&5�
3URJUDP
$LU�4XD
OLW\�7DVN
5'
7DVN�IRUFH�XQ
GHUWRR
N�D�FRPSUHK
HQVLYH�UHYLHZ�RI
$OO
)XOO�VFDOH�VWDWXV�
1$
1$
)RUFH
DLU�LVVXHV��*
RYHUQP
HQW�Z
LOO�GHYHORS
�D�&OHDQ
�$LU
VHFWRUV
6WUDWHJ
\�WR�LQWHJUDWH�DFWLRQV�RQ�YDULR
XV�DLU
HPLVVLRQ
V�
5HJ
LQD�$LUS
RUW
5'
6DVN3
RZHU�DQG
�WKH�IHGH
UDO�JRYHUQP
HQW�D
UH*RYW�
5HVHD
UFK�VWDWXV�
1$
%HQ
HILWV�WR
�EH�GH
WHUP
LQHG
�
(QH
UJ\�5HWURILW
H[SORULQJ�WKH�SR
WHQWLDO�IRU�DQ�HQ
HUJ\�UHWURILW�RI�WKH
5HJ
LQD�$LUS
RUW�

�SODQQ
HG��LPSOHP
HQWHG��OH
JLVODWLRQ�SD
VVHG
�RU�QR
W��VWDWXV
�RI�IXQ
GLQJ
�*
�1RWH��LQ
�RUGHU�WR
�DYR
LG�GRX
EOH�FR
XQWLQ
J��LQ
�PRV
W�FDV
HV�WK
H�HIIHFWV�RI�LQ
GLYLGX
DO�P
HDVX
UHV�DUH�QR
W�TXD
QWLILHG
�GXH
�WR�WK
HLU�LQWHU�UHODWLR
QVKLS�DQ
G�FR
PELQH
G�LP
SDFW�ZLWK
�VLP
LODU�RU
**
RWKH
U�FR
PSOHP
HQWDU\�P
HDVX
UHV��7KH
�FRP
ELQH
G�HIIHFWV�RI�P
RVW�R
I�WKH
�PHD
VXUHV�DUH�DF
FRXQ
WHG�IRU�LQ�WK
H�HP
LVVLRQ
V�RX
WORRN
�WR����
��DQ
G�EH
\RQG
���VHH
�$SS
HQGL[����7DE
OHV
��D����E����F���
104
1DP
H�RI
7\SH�RI
2EMHFWLYH�DQ
G�RU�PHWKRG�RI�DF
KLHYLQJ�UHG
XFWLRQ
6HF
WRU
6WDWXV�RI
(VWLP
DWH�RI�PLWLJDWLRQ
0RQLWRULQJ��LQWHUP
HGLDWH
SROLF\
�PHD
VXUH
LQVWUXPHQW
�LQFOXGLQJ�GHV
FULSWLRQ�RI�KRZ�HIIHF
WV�WDN
H�SODFH
�LP
SOHPHQ
WDWLRQ��
LP
SDF
W LQGLFDWRU�RI�SURJUHVV
����
����
0$1,72%$
(QH
UJ\�$GY
LVRU\
$ZDUHQ
HVV
3URYLGH
V�LQIRUP
DWLRQ�WR�WK
H�SX
EOLF��K
RXVLQJ
&RP
P�
)XOO�V
FDOH�VWDWXV�
1$
2QJ
RLQJ
�EHQ
HILWV�LQ
�UHG
XFLQJ
6HUYLFH
,QIRUP
DWLRQ
LQGX
VWU\��D
QG�RWKHU�DJH
QFLHV�WKURXJ
K�D�WROO�IUHH
,QVWLW�
6WDUW������
�HQ
HUJ\
�FRQ
VXPSWLRQ�
(GX
FDWLR
QWHOHSK
RQH�OLQH�VH
UYLFH�DQ
G�SX
EOLFDWLRQV
��3URYLGH
V5HV
LG�
LQIRUP
DWLRQ�RQ
�KRP
H�LP
SURY
HPHQ
WV��H
QHUJ\�
$JULF�
HIILFLHQW�DSS
OLDQF
HV�DQG
�SURGX
FWV��DQG
�VHUYLFH
V�7UDQV
S�
0LQLP
XP�7LOODJ
H$ZDUHQ
HVV
3URJUDP
�DLP
V�WR�HQF
RXUDJH
�IDUP
HUV�WR�XVH
$JULF�
)XOO�V
FDOH�VWDWXV�
1$
3UDFWLFHV
,QIRUP
DWLRQ
PLQLP
XP�WLOODJH
�SUDFWLFHV
�WR�VDY
H�HQ
HUJ\
�
(GX
FDWLR
Q
$JULFXOWXUDO�:
DVWH
6WDQG
DUGV
�DQG
'HY
HORS
PHQ
W�DQG
�RSH
UDWLR
Q�RI�SDUWLFOHER
DUG
0DQ
XI�
1$
1$
1$
5HJ
XODWLRQV
PDQ
XIDF
WXULQ
J�SODQ
WV�WK
DW�XWLOL]H�H[
FHVV�DJULFXOWXUDO
FHUHDO�VWUDZ
��ZKLFK
�LV�RWKHUZLVH�EX
UQHG
��LQWR�ED
VH
FRQV
XPHU�SURGX
FWV��5HG
XFWLR
Q�LQ�WK
H�EX
UQLQJ�RI�WK
H
VWUDZ�DOVR�UHGX
FHV�WKH�HP
LVVLRQ
V�RI�&2
�DQG
�RWKHU
�
DLU�SR
OOXWDQWV�LQWR�WK
H�DWPRV
SKHUH�
+RP
H�(QH
UJ\
$ZDUHQ
HVV�
:RUNVKR
SV�FRQ
GXFWHG
�WKURXJ
KRXW�WK
H�SURY
LQFH
�WR5HV
LG�
)XOO�V
FDOH�VWDWXV�
1$
$V�RI�-XQ
H���
�����
��
6DY
HUV�:RUNVKR
SV,QIRUP
DWLRQ
LQIRUP
�KRP
HRZQH
UV�RQ�KR
Z�WR
�SODQ�DQ
G�LP
SOHP
HQW
6WDUW������
�ZRUNVKR
SV�KDY
H�EH
HQ
(GX
FDWLR
QHQ
HUJ\
�VDY
LQJ�PHD
VXUHV�DQ
G�SX
UFKD
VH�HQH
UJ\�
GHOLYHUHG
�WR�RYH
U�����
�
HIILFLHQW�DSS
OLDQF
HV�DQG
�SURGX
FWV�
KRPHR
ZQH
UV�
0DQ
LWRED
�3UR�
$ZDUHQ
HVV
3UR�7UXFNHU�LV�D�SURJUDP
�WR�UHG
XFH�WKH�IXHO
7UDQV
S�)XOO�V
FDOH�VWDWXV�
1$
$Q�DQ
QXDO�IX
HO�HFR
QRP\
7UXFNHU�3URJUDP
,QIRUP
DWLRQ
XWLOL]D
WLRQ�RI�OD
UJH�WUXF
NV�WK
URXJ
K�GULYHU�HGX
FDWLR
Q6WDUW������
�FK
DOOHQJ
H�LV�D�FRP
SRQH
QW�RI
(GX
FDWLR
QDQ
G�WUDLQLQJ
�WKH�SURJ
UDP�
�&RP
P��

105
1DP
H�RI
7\SH�RI
2EMHFWLYH�DQ
G�RU�PHWKRG�RI�DF
KLHYLQJ�UHG
XFWLRQ
6HF
WRU
6WDWXV�RI
(VWLP
DWH�RI�PLWLJDWLRQ
0RQLWRULQJ��LQWHUP
HGLDWH
SROLF\
�PHD
VXUH
LQVWUXPHQW
�LQFOXGLQJ�GHV
FULSWLRQ�RI�KRZ�HIIHF
WV�WDN
H�SODFH
�LP
SOHPHQ
WDWLRQ��
LPSDF
WLQGLFDWRU�RI�SURJUHVV
����
����
0$1,72%$��FR
QW��
(QH
UJ\�(IILFLHQ
F\5'
*RY
HUQP
HQW�Z
LOO�FRQ
WLQXH
�WR�VXS
SRUW�SURJUDP
PLQJ
$OO
1$
1$
%HQ
HILWV�ZLOO�EH�RQ
JRLQJ�
DQG�5HQ
HZDE
OHWKDW�FRQ
WULEXWHV
�WRZDUGV
�WKH�DG
RSWLR
Q�RI�HQH
UJ\
VHFWRUV
&RQ
WLQXH
V�WR�SURPRWH
(QH
UJ\�3URMHFWV
HIILFLHQF
\�LQ�LQ
GXVWU\�DQG
�FRP
PHUFH
��JRY
HUQP
HQW�
GHYH
ORSP
HQW�LQ�WKH
DQG�WKH�KR
PH�
SURG
XFWLR
Q��XVH
��DQG
�H[S
RUW�R
I
UHQH
ZDE
OH�HQH
UJLHV�
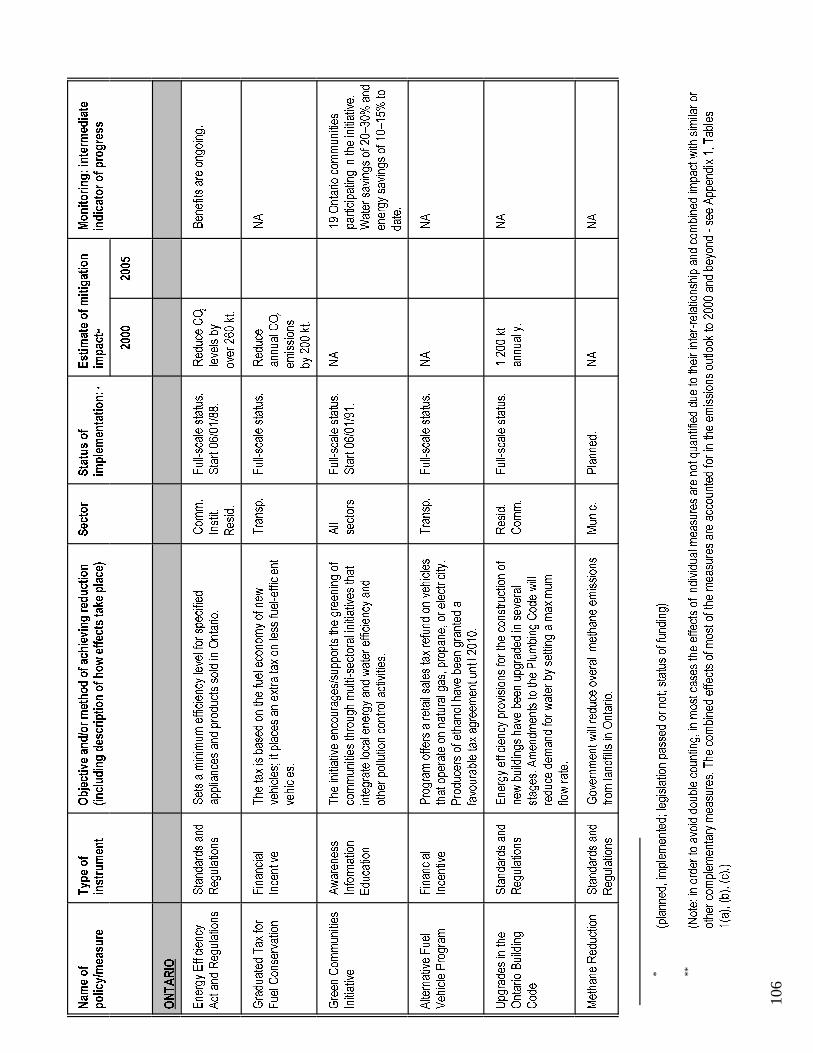
�SODQQ
HG��LPSOHP
HQWHG��OHJLVODWLRQ�SD
VVHG
�RU�QR
W��VWDWXV�RI�IXQ
GLQJ
�*
�1RWH��LQ�RUGHU�WR
�DYRLG�GRX
EOH�FRXQ
WLQJ��LQ�P
RVW�FDVHV�WK
H�HIIHFWV�RI�LQGLYLGX
DO�P
HDVXUHV�DUH�QR
W�TXD
QWLILHG
�GXH
�WR�WK
HLU�LQWHU�UHODWLRQVKLS�DQ
G�FRPELQH
G�LPSD
FW�ZLWK�VLPLODU�RU
**
RWKH
U�FRPSOHP
HQWDU\�P
HDVXUHV��7KH
�FRP
ELQH
G�HIIHFWV�RI�P
RVW�R
I�WKH
�PHD
VXUHV�DUH�DFFRXQ
WHG�IRU�LQ�WK
H�HP
LVVLRQ
V�RX
WORRN�WR
����
��DQ
G�EH
\RQG
���VHH
�$SS
HQGL[����7DE
OHV
��D����E����F���
106
1DP
H�RI
7\SH�RI
2EMHFWLYH�DQ
G�RU�PHWKRG�RI�DF
KLHYLQJ�UHG
XFWLRQ
6HF
WRU
6WDWXV�RI
(VWLP
DWH�RI�PLWLJDWLRQ
0RQLWRULQJ��LQWHUP
HGLDWH
SROLF\
�PHD
VXUH
LQVWUXPHQW
�LQFOXGLQJ�GHV
FULSWLRQ�RI�KRZ�HIIHF
WV�WDN
H�SODFH
�LP
SOHPHQ
WDWLRQ��
LP
SDF
W LQGLFDWRU�RI�SURJUHVV
����
����
217$5,2
(QH
UJ\�(IILFLHQ
F\6WDQG
DUGV�DQG
6HWV�D�PLQLPXP
�HIILFLHQ
F\�OHYHO�IRU�VSH
FLILHG
&RP
P�
)XOO�VFDOH�VWDWXV�
5HG
XFH�&2
%HQ
HILWV�DUH�RQJ
RLQJ
�
$FW�DQG
�5HJ
XODWLRQV
5HJ
XODWLRQV
DSSOLDQFHV�DQG
�SURGX
FWV�VROG�LQ�2QWDULR�
,QVWLW�
6WDUW������
����
OHYHOV�E\
5HVLG�
RYHU����
�NW��
*UDGX
DWHG
�7D[�IR
U)LQDQ
FLDO
7KH
�WD[�LV�EDVHG
�RQ�WKH�IXHO�HFRQR
P\�RI�QHZ
7UDQVS�
)XOO�VFDOH�VWDWXV�
5HG
XFH
1$
)XH
O�&RQ
VHUYDWLRQ
,QFHQWLYH
YHKLFOHV��LW�S
ODFHV�DQ
�H[WUD�WD
[�RQ
�OHVV�IX
HO�HIILFLHQ
WDQ
QXDO�&2
YHKLFOHV�
HPLVVLRQ
V�
E\����
�NW�
*UHHQ
�&RP
PXQ
LWLHV
$ZDUHQ
HVV
7KH
�LQLWLDWLYH�HQ
FRXUDJ
HV�VXS
SRUWV�WKH�JUHH
QLQJ
�RI
$OO
)XOO�VFDOH�VWDWXV�
1$
���2QWDULR�FRP
PXQ
LWLHV
,QLWLDWLYH
,QIRUP
DWLRQ
FRPPXQ
LWLHV�WK
URXJ
K�PXOWL�VHFWRUDO�LQLWLDWLYHV�WK
DWVHFWRUV
6WDUW������
����
SDUWLFLSDWLQJ�LQ�WK
H�LQLWLDWLYH�
(GX
FDWLRQ
LQWHJUDWH�ORFDO�HQH
UJ\�DQ
G�ZDWHU�HIILFLHQ
F\�DQG
:DWHU�VDYLQJV�RI��
�²��
��DQG
RWKH
U�SR
OOXWLRQ�FRQWURO�DFWLYLWLHV�
HQHUJ\�VDYLQJV�RI��
�²��
��WR
GDWH�
$OWHUQDWLYH�)XH
O)LQDQ
FLDO
3URJUDP
�RIIH
UV�D�UHWDLO�VDOHV�WD
[�UHIXQG
�RQ�YHKLFOHV
7UDQVS�
)XOO�VFDOH�VWDWXV�
1$
1$
9HK
LFOH�3URJUDP
,QFHQWLYH�
WKDW�RSH
UDWH�RQ�QD
WXUDO�JDV��S
URSD
QH��R
U�HOHFWULFLW\�
3URGX
FHUV�RI�H
WKDQ
RO�KDYH�EH
HQ�JUDQWHG
�D
IDYRXUDE
OH�WD
[�DJ
UHHP
HQW�X
QWLO���
���
8SJ
UDGH
V�LQ�WK
H6WDQG
DUGV�DQG
(QH
UJ\�HIILFLHQF\�SURYLVLRQV�IR
U�WKH�FRQVWUXFWLRQ�RI
5HVLG�
)XOO�VFDOH�VWDWXV�
����
��NW
1$
2QWDULR�%XLOGLQJ
5HJ
XODWLRQV
QHZ�EXLOGLQJV�KDYH�EH
HQ�XSJ
UDGH
G�LQ�VHYHUDO
&RP
P�
DQQX
DOO\�
&RG
HVWDJ
HV��$
PHQ
GPHQ
WV�WR
�WKH�3OXPELQJ
�&RG
H�ZLOO
UHGX
FH�GHP
DQG�IRU�ZDWHU�E\�VHWWLQJ
�D�P
D[LPXP
IORZ�UDWH�
0HWKD
QH�5HG
XFWLRQ
6WDQG
DUGV�DQG
*RYHUQP
HQW�Z
LOO�UHG
XFH�RYHUDOO�P
HWKD
QH�HPLVVLRQ
V0XQ
LF�
3ODQQ
HG�
1$
1$
5HJ
XODWLRQV
IURP
�ODQG
ILOOV�LQ�2QWDULR�

107
1DP
H�RI
7\SH�RI
2EMHFWLYH�DQ
G�RU�PHWKRG�RI�DF
KLHYLQJ�UHG
XFWLRQ
6HF
WRU
6WDWXV�RI
(VWLP
DWH�RI�PLWLJDWLRQ
0RQLWRULQJ��LQWHUP
HGLDWH
SROLF\
�PHD
VXUH
LQVWUXPHQW
�LQFOXGLQJ�GHV
FULSWLRQ�RI�KRZ�HIIHF
WV�WDN
H�SODFH
��LP
SOHPHQ
WDWLRQ�
LPSDF
WLQGLFDWRU�RI�SURJUHVV
����
����
217$5,2��FR
QW��
&XVWRP�0
DQXUH
$ZDUHQ
HVV
3URJUDP
�IRFXVHV�RQ
�HQYLUR
QPHQ
WDO�VDIHW\�DQ
G$JULF�
1$
1$
0DQ
XUH�DS
SOLFDWLRQV�DUH
$SS
OLFDWLRQV
,QIRUP
DWLRQ
QXWULHQW�HIILFLHQ
F\�LQ�WK
H�FRQWH[W�R
I�PDQ
XUH
EHLQJ�HYDOXD
WHG�WR�GHWHUPLQH�
(GX
FDWLRQ
DSSOLFDWLRQ�
DPRQ
J�RWKH
U�WKLQJV��K
RZ�WR
UHGX
FH�P
HWKD
QH�IR
UPDWLRQ�
6RODU�3KR
WRYROWDLF
'HP
RQVWUDWLRQ
,QVWDOODWLRQ�RI�FRP
ELQH
G�VRODU�SK
RWRYROWDLF�DQG
1$
1$
1$
5HS
ODFHG�DQ
�H[LVWLQJ�GLHVHO
DQG�7KH
UPRH
OHFWULF
WKHUPRH
OHFWULF�JHQ
HUDWLRQ�WR�SURYLGH
�WKH�HOHFWULFLW\
JHQH
UDWLRQ�V\VWHP
�
*HQ
HUDWLRQ
IRU�D�UHPRWH�UDGLR�UHSH
DWHU�VWDWLRQ�
7KH
�*UHHQ
6WDQG
DUGV�
+HOSV�2QWDULR�JRYHUQP
HQW�LPSOHP
HQW�Z
DVWH
&RP
P�
1$
5HG
XFWLRQ�RI
%\���
����Z
DVWH�UHG
XFWLRQ
:RUNSODFH
UHGX
FWLRQ�DQ
G�ZDWHU�DQG
�HQH
UJ\�FRQVHUYDWLRQ�
,QVWLW�
���NW�R
I�&2
HIIRUWV�KD
G�UHGX
FHG�ZDVWH
�
DQQX
DOO\
JRLQJ�WR�ODQG
ILOOV�E\�DS
SUR[�
VLQFH���
���
���NW�D
QQXD
OO\�
*RYHUQP
HQW�(
QHUJ\
6WDQG
DUGV�DQG
,PSOHP
HQW�D
FWLRQ�SODQ
V�WR�LP
SURYH�HQ
HUJ\
*RYW�
���P
LOOLRQ�LQYHVWHG
1$
1$
0DQ
DJHP
HQW
5HJ
XODWLRQV
HIILFLHQF\�LQ�JRYHUQP
HQW�RZ
QHG�DQ
G��RSH
UDWHG
LQ�UHWURILWV�ZLWK
�*(0��3URJUDP
EXLOGLQJV��*
(0�LV�DOVR�RIIHULQ
J�DVVLVWDQ
FH�LQ
DQRWKH
U���
�PLOOLRQ
DXGLWLQJ�DQ
G�PRQ
LWRULQ
J�WKH�LPSOLFDWLRQV�RI�H
QHUJ\
WR�EH�LQYHVWHG
��IRU
XVH�SD
WWHUQV��LGHQ
WLI\LQJ
�FRVW�VDYLQJV�DQG
D�WRWDO�DQQ
XDO
UHWURILWWLQJ�H[LVWLQJ�EX
LOGLQJV��D
QG�SURYLGLQJ
�HQH
UJ\
VDYLQJ
V�RI�����
PDQ
DJHP
HQW�WUDLQLQJ�
PLOOLRQ�
%XLOG�*UHHQ
�,QF�
$ZDUHQ
HVV
$�SURJUDP
�WKDW�ID
FLOLWDWHV�WK
H�UHF\FOLQJ�RI�EXLOGLQJ
5HVLG�
1$
1$
1$
,QIRUP
DWLRQ
PDWHULDOV�
(GX
FDWLRQ
%XLOGLQJ
9ROXQ
WDU\
$�SURJUDP
�WKDW�HYDOXDWHV�WK
H�HQ
YLURQP
HQWDO�P
HULWV
&RP
P�
1$
1$
3URJUDP
�LV�EHJ
LQQLQJ
�ZLWK
(QYLUR
QPHQ
WDO
0HD
VXUHV
RI�RIILFH�EXLOGLQJV�
SLORW�S
URMHFWV�LQ�SURYLQFLDO
3HUIRUP
DQFH
EXLOGLQJV�
$VVHVVP
HQW�&
ULWHULD
(QYLUR
QPHQ
WDOO\
1$
*RYHUQP
HQW�K
DV�GHYHORS
HG�JXLGH
OLQHV�IR
U�XVH�LQ
*RYW�
)XOO�VFDOH�VWDWXV�
1$
%HQ
HILWV�ZLOO�EH�RQ
JRLQJ�
&RQ
VFLRXV�'HVLJQ
WKH�FRQVWUXFWLRQ�RI�QHZ
�JRYHUQP
HQW�E
XLOGLQJV�
*XLGH
OLQHV

108
1DP
H�RI
7\SH�RI
2EMHFWLYH�DQ
G�RU�PHWKRG�RI�DF
KLHYLQJ�UHG
XFWLRQ
6HF
WRU
6WDWXV�RI
(VWLP
DWH�RI�PLWLJDWLRQ
0RQLWRULQJ��LQWHUP
HGLDWH
SROLF\
�PHD
VXUH
LQVWUXPHQW
�LQFOXGLQJ�GHV
FULSWLRQ�RI�KRZ�HIIHF
WV�WDN
H�SODFH
�LP
SOHPHQ
WDWLRQ��
LPSDF
WLQGLFDWRU�RI�SURJUHVV
����
����
217$5,2��FR
QW��
,QGX
VWULD
O�DQG
1$
*RYHUQP
HQW�LV�ZRUNLQJ
�WR�JHQ
HUDWH�SULYDWH�IXQG
V�WR
5HVLG�
1$
1$
1$
&RP
PHUFLDO
FRQYHUW�LQG
XVWULDO�RU�FRPPHUFLDO�EXLOGLQJV�WR
%XLOGLQJ�&RQ
YHUVLRQ
UHVLGH
QWLDO�XVH�WR
�LQFUHD
VH�XUEDQ
�GHQ
VLWLHV�DQ
G
UHGX
FH�YHK
LFOH�XVH�IR
U�FRPPXWLQJ��*RYHUQP
HQW�LV
DOVR�ZRUNLQJ
�WR�HOLP
LQDWH�DQ
\�LPSH
GLPHQ
WV�LQ�WK
H
XVH�RI�UHF\FOHG�FRQWHQ
W�PDWHULDOV�IURP
�WKH�2QWDULR
%XLOGLQJ�&RG
H�
)OHHW:LVH
6WDQG
DUGV�DQG
2EMHFWLYH�RI�SURJUDP
�LV�WR
�PLQLPL]H�IXHO�XVH�DQG
7UDQVS�
1$
1$
1$
5HJ
XODWLRQV
H[SH
QVH�RI�YHK
LFOH�IOHH
WV�WK
URXJ
K�VXFK�P
HDVXUHV
DV�UHJ
XODU�P
DLQWHQ
DQFH��G
ULYHU�HGX
FDWLRQ��DQG
�WKH
SXUFKD
VH�RI�VPDOOHU�FDUV�
&DU�3RR
O�3URJUDP
$ZDUHQ
HVV
7KH
�DFWLYH�SURP
RWLRQ�RI�FDU�DQG
�YDQ
�SRR
OV�WK
URXJ
K7UDQVS�
)XOO�VFDOH�VWDWXV�
1$
1$
,QIRUP
DWLRQ
VXFK�SURJUDP
V�DV�9RLFH�5HVSR
QVH�6\VWHP��D
(GX
FDWLRQ
UHJLVWUDWLRQ�V\VWHP
�IRU�PDWFKLQJ�GULYHUV�DQ
G
SDVVHQ
JHUV��D
QG�6KD
UH�$�5LGH��D�FRP
SXWHU�V\VWHP
WKDW�P
DWFKHV�SHR
SOH�LQWHUHVWHG
�LQ�FDUSR
ROLQJ�
6KD
UH�$�5LGH�LV�DYDLODEOH�RQ
�D�SURYLQFH�ZLGH�ED
VLV
WKURXJ
K�D�WROO�IUHH
�QXP
EHU�
9HK
LFOH�,Q
VSHFWLRQ
$ZDUHQ
HVV
7KLV�SURJ
UDP�LV�DLPHG
�DW�LGH
QWLI\LQJ�DQ
G�UHGX
FLQJ
7UDQVS�
3LORW�VWDWXV�
1$
,QFOXG
HG�LQ�WK
LV�SURJUDP
�LV
DQG�0DLQWHQ
DQFH
,QIRUP
DWLRQ
WKH�HP
LVVLRQ
V�IURP
�YHK
LFOHV�LQ�QHH
G�RI�UHS
DLU��
0HWUR�7RURQ
WR·V�KLJK�WHFK
3URJUDP
(GX
FDWLRQ
YHKLFOH�LQVSHFWLRQ�FHQWUH�
ZKLFK�LV�EHLQJ
�UXQ
�DV�D���\HDU
SLORW�S
URMHFW�
7UDQVLW
$ZDUHQ
HVV
7KH
�SURYLQFH�LV�FRP
PLWWHG
�WR�ZRUNLQJ
�ZLWK
7UDQVS�
)XOO�VFDOH�VWDWXV�
1$
1$
2SS
RUWXQLWLHV
,QIRUP
DWLRQ
PXQ
LFLSDOLWLHV�DQG
�UHJ
LRQV�WR
�LGHQ
WLI\�RS
SRUWXQ
LWLHV
(GX
FDWLRQ
IRU�+29�ODQH
V��$7)��D
QG�RWKHU�WUDQ
VLW�S
URMHFWV�
5'
$OWHUQDWLYH�)XH
O)LQDQ
FLDO
3URJUDP
�RIIH
UV�D�UHWDLO�VDOHV�WD
[�UHIXQG
�RQ�YHKLFOHV
7UDQVS�
)XOO�VFDOH�VWDWXV�
1$
3URGX
FHUV�RI�H
WKDQ
RO�KDYH
9HK
LFOH�3URJUDP
,QFHQWLYH�
WKDW�RSH
UDWH�RQ�QD
WXUDO�JDV��S
URSD
QH��R
U�HOHFWULFLW\�
EHHQ
�JUDQWHG
�D�ID
YRXUDE
OH�WD
[
([HPSWV�$7)V��H[FHS
W�SURSD
QH��IURP
�IXHO�WD
[�DJ
UHHP
HQW�X
QWLO���
���

109
1DP
H�RI
7\SH�RI
2EMHFWLYH�DQ
G�RU�PHWKRG�RI�DF
KLHYLQJ�UHG
XFWLRQ
6HF
WRU
6WDWXV�RI
(VWLP
DWH�RI�PLWLJDWLRQ
0RQLWRULQJ��LQWHUP
HGLDWH
SROLF\
�PHD
VXUH
LQVWUXPHQW
�LQFOXGLQJ�GHV
FULSWLRQ�RI�KRZ�HIIHF
WV�WDN
H�SODFH
�LP
SOHPHQ
WDWLRQ��
LPSDF
WLQGLFDWRU�RI�SURJUHVV
����
����
217$5,2��FR
QW��
1DWXUDO�*DV
5'
&1*�SRZ
HUHG
�WUDQ
VLW�E
XVHV�DUH�EHLQJ
�XVHG�LQ
7UDQVS�
3LORW�
1$
3LORW�S
URMHFW�WR
�GHYHORS
��WHVW�
3RZ
HUHG
�7UDQVLW
VRPH�2QWDULR�FLWLHV�DQG
�RQ�D�SLORW�E
DVLV��WKH
DQG�HYDOXD
WH�WK
H�XVH�RI
%XVHV
PRQ
LWRULQ
J�RI�WK
H�IOHHW�FRQ
WLQXH
V��DQG
�QHZ
OLTXH
ILHG�QD
WXUDO�JDV�SRZ
HUHG
GHYHORSP
HQWV�DUH�EHLQJ
�HYDOXDWHG
�EX
VHV�
%LF\FOH
$ZDUHQ
HVV
0XQ
LFLSDOLWLHV�UHFHLYH�SURYLQFLDO�IXQ
GLQJ
�IRU�ELF\FOH
7UDQVS�
)XOO�VFDOH�VWDWXV�
1$
1$
,QIUDVWUXFWXUH
,QIRUP
DWLRQ
LQIUDVWUXFWXUH�RQ�D�VLPLODU�ED
VLV�DV�IX
QGLQJ�IRU
(GX
FDWLRQ
URDG
V�DQ
G�WUDQ
VLW�
(QH
UJ\�(IILFLHQ
F\(FRQR
PLF
5HG
XFH�HQ
HUJ\�XVH�LQ�JRYHUQP
HQW�RZ
QHG�DQ
G*RYW�
)XOO�VFDOH�VWDWXV�
����3-
%HQ
HILWV�RQJ
RLQJ
�
0HD
VXUHV
�RSH
UDWHG�EX
LOGLQJV�
UHGX
FWLRQ
EHWZHH
Q
����
�DQG
����
�
:DWHU�(IILFLHQ
F\(FRQR
PLF
:DWHU�HIILFLHQ
W�VKR
ZHUV��VHOI�FORVLQJ�ZDWHU�ID
XFHWV�
,QVWLW�
)XOO�VFDOH�VWDWXV�
1$
1$
0HD
VXUHV
0HD
VXUHV
DQG�ZDWHU�HIILFLHQ
W�ODX
QGU\�HTX
LSPHQ
W�LQVWDOOHG�LQ
FRUUHFWLRQD
O�IDFLOLWLHV�
5HVRX
UFH
$ZDUHQ
HVV
*RYHUQP
HQW�S
XEOLVKH
G�D�JX
LGH�WR�UHVRX
UFH
$JULF�
)XOO�VFDOH�VWDWXV�
1$
%HQ
HILWV�WR
�EH�RQ
JRLQJ�
&RQ
VHUYDWLRQ�*XLGH
,QIRUP
DWLRQ
FRQVHUYDWLRQ�DQ
G�FRVW�VDYLQJ�RS
SRUWXQ
LWLHV�LQ�WK
H
IRU�WKH�'DLU\
(GX
FDWLRQ
GDLU\�SURFHVVLQJ�VHFWRU�
3URFHVVLQJ�6HFWRU
&URZQ�)RUHVW
$ZDUHQ
HVV
3XUSR
VH�RI�D
FW�LV�WR
�SURYLGH
�IRU�ORQJ
�WHUP�KHD
OWK)RUHVW�
)XOO�VFDOH�VWDWXV�
1$
1$
6XVWDLQDE
LOLW\�$FW
,QIRUP
DWLRQ
DQG�VXVWDLQD
ELOLW\�RI�&URZQ�IRUHVWV��)RUHVW�5
HQHZ
DO
(GX
FDWLRQ
7UXVW�)XQ
G�ZDV�SXW�LQ�SODFH�WR
�SURYLGH
�DGH
TXDWH
IXQG
V�IRU�IRUHVW�UHQ
HZDO�
&RP
PXQ
LW\$ZDUHQ
HVV
:RUNV�WR
�DGG
UHVV�SRWHQ
WLDO�SROLF\�ED
UULHUV�WR
�ORFDO
7UDQVS�
)XOO�VFDOH�VWDWXV�
1$
1$
7UDQVSR
UWDWLRQ
,QIRUP
DWLRQ
FRRUGLQD
WLRQ�RI�FRP
PXQ
LW\�WUDQ
VSRUWDWLRQ�
2IILFH
(GX
FDWLRQ
&RR
UGLQDWLRQ�VKRX
OG�UHG
XFH�HP
LVVLRQ
V�E\
GHFUHD
VLQJ
�WKH�QX
PEH
U�RI�YHK
LFOHV�XVHG
�LQ�D
FRPPXQ
LW\�
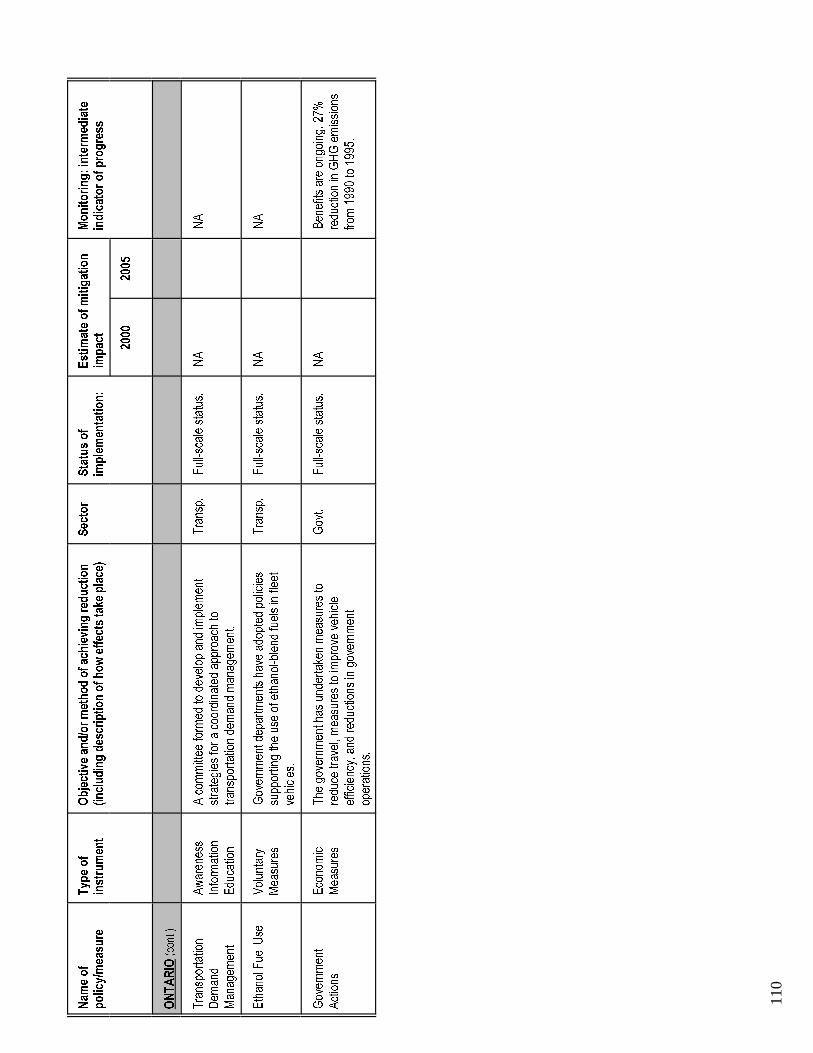
110
1DP
H�RI
7\SH�RI
2EMHFWLYH�DQ
G�RU�PHWKRG�RI�DF
KLHYLQJ�UHG
XFWLRQ
6HF
WRU
6WDWXV�RI
(VWLP
DWH�RI�PLWLJDWLRQ
0RQLWRULQJ��LQWHUP
HGLDWH
SROLF\
�PHD
VXUH
LQVWUXPHQW
�LQFOXGLQJ�GHV
FULSWLRQ�RI�KRZ�HIIHF
WV�WDN
H�SODFH
�LP
SOHPHQ
WDWLRQ��
LPSDF
WLQGLFDWRU�RI�SURJUHVV
����
����
217$5,2��FR
QW��
7UDQVSR
UWDWLRQ
$ZDUHQ
HVV
$�FRP
PLWWHH
�IRUP
HG�WR
�GHYHORS
�DQG
�LPSOHP
HQW
7UDQVS�
)XOO�VFDOH�VWDWXV�
1$
1$
'HP
DQG
,QIRUP
DWLRQ
VWUDWHJLHV�IR
U�D�FRRUGLQD
WHG�DS
SURD
FK�WR
0DQ
DJHP
HQW
(GX
FDWLRQ
WUDQ
VSRUWDWLRQ�GH
PDQ
G�PDQ
DJHP
HQW��
(WKDQ
RO�)XH
O�8VH
9ROXQ
WDU\
*RYHUQP
HQW�G
HSDUWP
HQWV�KDYH�DG
RSWHG�SR
OLFLHV
7UDQVS�
)XOO�VFDOH�VWDWXV�
1$
1$
0HD
VXUHV
VXSS
RUWLQJ�WKH�XVH�RI�HWKDQ
RO�EOHQG
�IXHOV�LQ�IOHH
W
YHKLFOHV�
*RYHUQP
HQW
(FRQR
PLF
7KH
�JRYHUQP
HQW�K
DV�XQG
HUWDNHQ�PHD
VXUHV�WR
*RYW�
)XOO�VFDOH�VWDWXV�
1$
%HQ
HILWV�DUH�RQJ
RLQJ
�����
$FWLRQV
0HD
VXUHV
UHGX
FH�WUDYHO��P
HDVXUHV�WR�LP
SURYH�YHKLFOH
UHGX
FWLRQ�LQ�*+*�HPLVVLRQ
V
HIILFLHQF\��DQG
�UHG
XFWLRQV�LQ�JRYHUQP
HQW
IURP
����
��WR����
��
RSHUDWLRQV�

�SODQQ
HG��LPSOHP
HQWHG��OH
JLVODWLRQ�SD
VVHG
�RU�QR
W��VWDWXV
�RI�IXQ
GLQJ
�*
�1RWH��LQ
�RUGHU�WR
�DYR
LG�GRX
EOH�FR
XQWLQ
J��LQ
�PRV
W�FDV
HV�WK
H�HIIHFWV�RI�LQ
GLYLGX
DO�P
HDVX
UHV�DUH�QR
W�TXD
QWLILHG
�GXH
�WR�WK
HLU�LQWHU�UHODWLR
QVKLS�DQ
G�FR
PELQH
G�LP
SDFW�ZLWK
�VLP
LODU�RU
**
RWKH
U�FR
PSOHP
HQWDU\�P
HDVX
UHV��7KH
�FRP
ELQH
G�HIIHFWV�RI�P
RVW�R
I�WKH
�PHD
VXUHV�DUH�DF
FRXQ
WHG�IRU�LQ�WK
H�HP
LVVLRQ
V�RX
WORRN
�WR����
��DQ
G�EH
\RQG
���VHH
�$SS
HQGL[����7DE
OHV
��D����E����F���
111
1DP
H�RI
7\SH�RI
2EMHFWLYH�DQ
G�RU�PHWKRG�RI�DFKLHYLQJ�UHG
XFWLRQ
6HF
WRU
6WDWXV�RI
(VWLP
DWH�RI�PLWLJDWLRQ
0RQLWRULQJ��LQWHUP
HGLDWH
SROLF\
�PHD
VXUH
LQVWUXPHQW
�LQFOXGLQJ�GHVFULSWLRQ�RI�KRZ�HIIHFWV�WDNH�SODFH�
LPSOHPHQ
WDWLRQ��
LP
SDF
W LQGLFDWRU�RI�SURJUHVV
����
����
48(%(&
4XH
EHF·V�(QH
UJ\
)LQDQ
FLDO
)LQDQ
FLDO�VXS
SRUW�IR
U�IHDV
LELOLW\�VWXGLHV
�DQG
$JULF�
)XOO�V
FDOH�VWDWXV�
1$
6LQFH
����
���0
LQLVWqUH�GHV
3URGX
FWLYLW\
,QFH
QWLYH
GHPRQ
VWUDWLR
Q�SURMHF
WV��D
QG�LV�JHD
UHG�WRZDUGV
,QGX
VW�
6WDUW������
����
5HV
VRXUFH
V�1DWXUHOOHV�KD
V
3URJUDP
3URJUDP
VXV
HUV�RI�HQH
UJ\�VR
XUFH
V�RWKH
U�WKDQ
�HOHFWULF
LW\�
FRQG
XFWHG�PRUH�WKDQ
����
IHDV
LELOLW\�VWXGLHV
�IRU�D�WRWDO�LQ
VXEV
LGLHV�RI�DSS
UR[����
PLOOLRQ�DQ
G�DQ
�HQH
UJ\�VD
YLQJ
V
SRWHQWLDO�R
I����
��PLOOLRQ�
)RUHV
W�$FW
6WDQG
DUGV
�DQG
6HWV�JX
LGHOLQHV
�IRU�PDLQWDLQLQJ
�ORQJ
�WHUP
)RUHV
W�)XOO�V
FDOH�VWDWXV�
1$
%HQ
HILWV�WR
�EH�RQ
JRLQJ�IRU
5HJ
XODWLRQV
SURG
XFWLYLW\�RI�IRUHV
WV�
&2
�VHT
XHVWUDWLR
Q��
,QVWLWX
WLRQD
O�(QH
UJ\
6WDQG
DUGV
�DQG
$LP
�RI�WKH
�SURJUDP
�LV�WR
�LQWHJUDWH�HIILFLHQW
*RY
W�)XOO�V
FDOH�VWDWXV�
1$
6RP
H�DUHD
V�FR
YHUHG�DUH�FD
U
3URJUDP
5HJ
XODWLRQV
PDQ
DJHP
HQW�P
HFKD
QLVP
V�LQWR�JRY
HUQP
HQW
,QVWLW�
SDUNLQJ��GD\
�WR�GD
\
V\VWHP
V�PDQ
DJHP
HQW��DQ
G�ILQ
DQFLQJ
PHF
KDQLVP
V�IRU�HQ
HUJ\
HIILFLHQF
\�
7UDIILF�0DQ
DJHP
HQW
5'
,Q�WK
H�0RQ
WUHD
O�DUHD��WK
H�JR
YHUQPHQ
W�KDV
7UDQV
S�3LORW
1$
%HQ
HILWV�EHLQJ
�VWXGLHG
��7KH
6\VWHPV
H[SH
ULPHQ
WHG�ZLWK
�WUDIILF�P
DQDJ
HPHQ
W�V\VWHPV�WKDW
JRYH
UQPHQ
W�ZLOO�FRQ
WLQXH
�WR
LQFOXG
H�HQ
HUJ\
�HIILFLHQ
F\�DV�DQ
�REMHF
WLYH�
LQLWLDWH�PHD
VXUHV�HQ
FRXUDJ
LQJ
HQHUJ\
�HIILFLHQ
F\�
)DUP�0
DQXUH
9ROXQ
WDU\�RU
$�P
RGLILFD
WLRQ�LQ�SROLFLHV�E\
�WKH�JR
YHUQPHQ
W$JULF�
)XOO�V
FDOH�VWDWXV�
1$
1$
6WRFNLQJ�DQ
G5HJ
XODWHG
UHVX
OWLQJ
�LQ�WK
H�DG
MXVWPHQ
W�RI�IDUP�P
DQXUH�VWRF
NLQJ
6SUHD
GLQJ
�3UDFWLFHV
0HD
VXUHV
DQG�VS
UHDG
LQJ�PHWKR
GV�RI�S
URGX
FHUV��7
KH
JRYH
UQPHQ
W�KDV
�DOVR�GH
YHORSH
G�DQ
G�LP
SOHP
HQWHG
D�SURJ
UDP�IR
U�WKH�UHKD
ELOLWDWLRQ�RI�DFWLYH�RU�FORVH
G
ODQG
ILOOV�
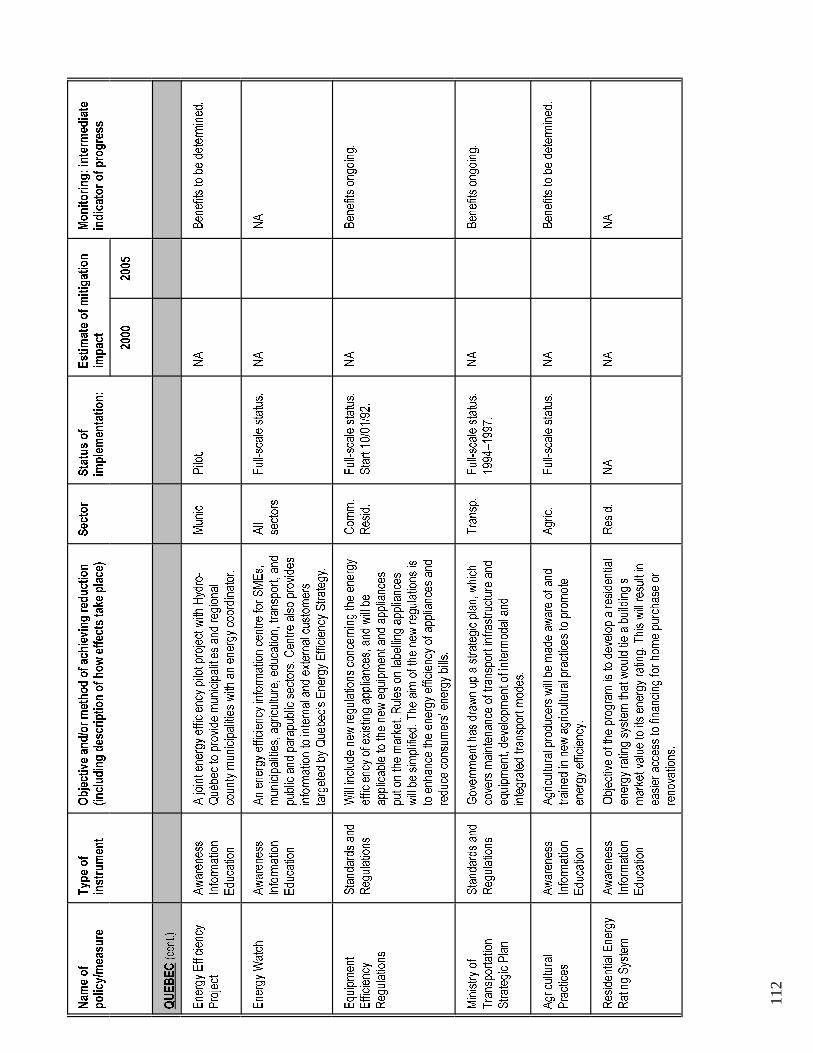
112
1DP
H�RI
7\SH�RI
2EMHFWLYH�DQ
G�RU�PHWKRG�RI�DFKLHYLQJ�UHG
XFWLRQ
6HF
WRU
6WDWXV�RI
(VWLP
DWH�RI�PLWLJDWLRQ
0RQLWRULQJ��LQWHUP
HGLDWH
SROLF\
�PHD
VXUH
LQVWUXPHQW
�LQFOXGLQJ�GHVFULSWLRQ�RI�KRZ�HIIHFWV�WDNH�SODFH�
LPSOHPHQ
WDWLRQ��
LPSDF
WLQGLFDWRU�RI�SURJUHVV
����
����
48(%(&��FR
QW��
(QH
UJ\�(IILFLHQ
F\$ZDUHQ
HVV
$�MRLQW�H
QHUJ\�HIILFLHQF\�SLORW�S
URMHFW�ZLWK�+\GUR�
0XQ
LF�
3LORW�
1$
%HQ
HILWV�WR
�EH�GH
WHUP
LQHG
�
3URMHFW
,QIRUP
DWLRQ
4Xp
EHF�WR�SURYLGH
�PXQ
LFLSDOLWLHV�DQG
�UHJ
LRQD
O
(GX
FDWLRQ
FRXQ
W\�P
XQLFLSDOLWLHV�ZLWK�DQ�HQ
HUJ\�FRR
UGLQDWRU�
(QH
UJ\�:DWFK
$ZDUHQ
HVV
$Q�HQ
HUJ\�HIILFLHQ
F\�LQIRUP
DWLRQ�FHQWUH�IR
U�60(V�
$OO
)XOO�VFDOH�VWDWXV�
1$
1$
,QIRUP
DWLRQ
PXQ
LFLSDOLWLHV��D
JULFXOWXUH��H
GXFDWLRQ��WUDQ
VSRUW��DQ
GVHFWRUV
(GX
FDWLRQ
SXEOLF�DQG
�SDUDS
XEOLF�VHFWRUV��&
HQWUH�DOVR�SURYLGH
V
LQIRUP
DWLRQ�WR�LQWHUQDO�DQG
�H[WHUQD
O�FXVWRPHUV
WDUJHWHG
�E\�4XH
EHF·V�(QH
UJ\�(IILFLHQ
F\�6WUDWHJ
\�
(TX
LSPHQ
W6WDQG
DUGV�DQG
:LOO�LQFOXG
H�QH
Z�UHJ
XODWLRQV�FRQ
FHUQLQJ�WKH�HQ
HUJ\
&RP
P�
)XOO�VFDOH�VWDWXV�
1$
%HQ
HILWV�RQJ
RLQJ
�
(IILFLHQ
F\5HJ
XODWLRQV
HIILFLHQF\�RI�H[LVWLQJ�DS
SOLDQFHV��D
QG�ZLOO�EH
5HVLG�
6WDUW������
����
5HJ
XODWLRQV
DSSOLFDE
OH�WR
�WKH�QH
Z�HTX
LSPHQ
W�DQG
�DSS
OLDQFHV
SXW�R
Q�WKH�PDUNHW��5XOHV�RQ�ODEH
OOLQJ
�DSS
OLDQFHV
ZLOO�EH�VLPSOLILHG
��7KH
�DLP�RI�WKH
�QHZ
�UHJ
XODWLRQV�LV
WR�HQK
DQFH�WK
H�HQ
HUJ\�HIILFLHQ
F\�RI�D
SSOLDQFHV�DQG
UHGX
FH�FRQ
VXPHUV·�HQH
UJ\�ELOOV�
0LQLVWU\�RI
6WDQG
DUGV�DQG
*RYHUQP
HQW�K
DV�GUDZQ�XS
�D�VWUDWHJ
LF�SODQ��ZKLFK
7UDQVS�
)XOO�VFDOH�VWDWXV�
1$
%HQ
HILWV�RQJ
RLQJ
�
7UDQVSR
UWDWLRQ
5HJ
XODWLRQV
FRYHUV�P
DLQWHQ
DQFH�RI�WUDQVSR
UW�LQIUDVWUXFWXUH�DQG
����
²���
��
6WUDWHJ
LF�3ODQ
HTXLSP
HQW��GH
YHORSP
HQW�R
I�LQWHUPRG
DO�DQG
LQWHJUDWHG
�WUDQ
VSRUW�P
RGHV�
$JULFXOWXUDO
$ZDUHQ
HVV
$JULFXOWXUDO�SURGX
FHUV�ZLOO�EH�PDG
H�DZ
DUH�RI�DQG
$JULF�
)XOO�VFDOH�VWDWXV�
1$
%HQ
HILWV�WR
�EH�GH
WHUP
LQHG
�
3UDFWLFHV
,QIRUP
DWLRQ
WUDLQH
G�LQ�QHZ
�DJULFXOWXUDO�SUDFWLFHV�WR
�SURPRWH
(GX
FDWLRQ
HQHUJ\�HIILFLHQ
F\�
5HVLGHQ
WLDO�(
QHUJ\
$ZDUHQ
HVV
2EMHFWLYH�RI�WK
H�SURJ
UDP�LV�WR
�GHYHORS
�D�UHVLGHQ
WLDO
5HVLG�
1$
1$
1$
5DWLQJ�6\VWHP
,QIRUP
DWLRQ
HQHUJ\�UDWLQJ�V\VWHP
�WKDW�ZRX
OG�WLH�D�EX
LOGLQJ·V
(GX
FDWLRQ
PDUNHW�YDOXH
�WR�LWV�HQ
HUJ\�UDWLQJ��7KLV�ZLOO�UHVXOW�LQ
HDVLHU�DFFHVV�WR�ILQD
QFLQJ�IRU�KR
PH�SX
UFKD
VH�RU
UHQR
YDWLRQV�

113
1DP
H�RI
7\SH�RI
2EMHFWLYH�DQ
G�RU�PHWKRG�RI�DFKLHYLQJ�UHG
XFWLRQ
6HF
WRU
6WDWXV�RI
(VWLP
DWH�RI�PLWLJDWLRQ
0RQLWRULQJ��LQWHUP
HGLDWH
SROLF\
�PHD
VXUH
LQVWUXPHQW
�LQFOXGLQJ�GHVFULSWLRQ�RI�KRZ�HIIHFWV�WDNH�SODFH�
LPSOHPHQ
WDWLRQ��
LPSDF
WLQGLFDWRU�RI�SURJUHVV
����
����
48(%(&��FR
QW��
%XLOGLQJ
6WDQG
DUGV�DQG
$Q�HQ
HUJ\�HIILFLHQ
F\�JXLGH
�WKDW�LQFRUSRUDWHV
&RP
P�
)XOO�VFDOH�VWDWXV�
1$
4XH
EHF�ZLOO�DOVR�EH
�DGR
SWLQJ
5HJ
XODWLRQV
5HJ
XODWLRQV
FKDQ
JHV�LQ�HQH
UJ\�HIILFLHQF\�VWDQ
GDUGV�IRU�QH
Z,QVWLW�
WKH�1DWLRQD
O�(QH
UJ\�&RG
H�
EXLOGHUV�DQ
G�ZLOO�EH�D�UHIHUHQFH�IRU�KR
XVLQJ
5HVLG�
*RYHUQP
HQW�LV�DOVR�RIIH
ULQJ
SODQ
QHUV�DQG
�EXLOGHUV�
�QHZ
�DQ
�H[SHULPHQ
WDO�HQH
UJ\
PDQ
DJHP
HQW�S
URJUDP
�IRU
VFKR
ROV�
0HWKD
QH�&DS
WXUH
5HJ
XODWLRQ
&KD
QJHV�WR
�UHJ
XODWLRQV�SHUPLW�WKH�FDSWXUH�DQ
G0XQ
LF�
2SH
UDWLRQD
O1$
,W�LV�H[SHFWHG�WKDW�WK
LV
EXUQLQJ�RI�P
HWKD
QH�IURP
�ZDVWH�GLVSR
VDO�VLWHV�
PHD
VXUH�ZLOO�FRYHU���²
����RI
WKH�WRWDO�YROXP
H�RI�P
XQLFLSDO
ZDVWH�
(FR*HVWH
9ROXQ
WDU\
7KLV�YROXQWDU\�FOLPDWH�FKDQ
JH�SURJUDP
�LV�VLPLODU�WR
,QGX
VW�
)XOO�VFDOH�VLQFH
1$
WKH�9ROXQ
WDU\�&KD
OOHQJ
H�DQ
G�5HJ
LVWU\�SURJ
UDP�LQ
&RP
P�
6HS
W����
���
HIIHFW�HOVHZ
KHUH�LQ�WK
H�FRXQ
WU\��,W�LV�GHVLJQH
G�WR
,QVWLW�
VWLPXODWH�YROXQWDU\�PLWLJD
WLYH�*+*�LQLWLDWLYHV
DPRQ
J�ODUJH��P
HGLXP�VL]HG
���DQ
G�VP
DOO
HQWHUSULVHV��LQVWLWXWLRQV��D
QG�RWKHU�EXVLQHVVHV�
,QFUHD
VH�6SH
QGLQJ
(FRQR
PLF
*RYHUQP
HQW�Z
LOO�LQFUHD
VH�VSH
QGLQJ�RQ
�SXE
OLF7UDQVS�
)XOO�VFDOH�VWDWXV�
1$
1$
RQ�3XE
OLF�7UDQVLW
0HD
VXUHV
WUDQ
VSRUW�LQIUDVWUXFWXUH�DQ
G�ZLOO�DVVLVW�LQ�RWKH
U
WUDQ
VSRUWDWLRQ�SURMHFWV�

�SODQQ
HG��LPSOHP
HQWHG��OH
JLVODWLRQ�SD
VVHG
�RU�QR
W��VWDWXV
�RI�IXQ
GLQJ
�*
�1RWH��LQ
�RUGHU�WR
�DYR
LG�GRX
EOH�FR
XQWLQ
J��LQ
�PRV
W�FDV
HV�WK
H�HIIHFWV�RI�LQ
GLYLGX
DO�P
HDVX
UHV�DUH�QR
W�TXD
QWLILHG
�GXH
�WR�WK
HLU�LQWHU�UHODWLR
QVKLS�DQ
G�FR
PELQH
G�LP
SDFW�ZLWK
�VLP
LODU�RU
**
RWKH
U�FR
PSOHP
HQWDU\�P
HDVX
UHV��7KH
�FRP
ELQH
G�HIIHFWV�RI�P
RVW�R
I�WKH
�PHD
VXUHV�DUH�DF
FRXQ
WHG�IRU�LQ�WK
H�HP
LVVLRQ
V�RX
WORRN
�WR����
��DQ
G�EH
\RQG
���VHH
�$SS
HQGL[����7DE
OHV
��D����E����F���
114
1DP
H�RI
7\SH�RI
2EMHFWLYH�DQ
G�RU�PHWKRG�RI�DFKLHYLQJ�UHG
XFWLRQ
6HFWRU
6WDWXV�RI
(VWLP
DWH�RI�PLWLJDWLRQ
0RQLWRULQJ��LQWHUP
HGLDWH
SROLF\�P
HDVX
UHLQVWUXPHQW
�LQFOXGLQJ�GHVFULSWLRQ�RI�KRZ�HIIHFWV�WDNH�SODFH�
LPSOHPHQ
WDWLRQ��
LP
SDFW
LQGLFDWRU�RI�SURJUHVV
����
����
1(:
%5816:,&.
3URYLQF
LDO�%
XLOGLQJ
$ZDUHQ
HVV
+HOSV
�GHS
DUWP
HQWV�DQG
�KRV
SLWDO�FRUSR
UDWLR
QV�WR
�XVH
&RP
P�
)XOO�V
FDOH�VWDWXV�
1$
7KH
�REMHF
WLYH�LV�WR
�UHWURILW�DOO
,QLWLDWLYH
,QIRUP
DWLRQ
WKLUG
�SDUW\�ILQD
QFLQJ�WR�LP
SOHP
HQW�H
QHUJ\
,QVWLW�
6WDUW������
����
IDFLOLWLHV�WR�LP
SURY
H�HQ
HUJ\
(GX
FDWLR
QLP
SURY
HPHQ
WV�LQ
�SURYLQF
LDOO\�RZQH
G�EX
LOGLQJV
�HIILFLHQF
\�ZLWK
LQ�D���\HD
U
SHULR
G�
:DWHU�(IILFLHQ
F\(FR
QRPLF
(QF
RXUDJH
V�PXQ
LFLSDOLWLHV
�WR�WD
NH�DFWLRQV
�WR�UHG
XFH
0XQ
LF�
)XOO�V
FDOH�VWDWXV�
1$
1$
3URJUDP
0HD
VXUHV
ZDWHU�FRQ
VXPSWLRQ�WKURXJ
K�SURP
RWLRQ�DQ
G�UDWH
UHGX
FWLRQV
�IRU�WKHLU�FX
VWRP
HUV��0
HDVX
UHV
XQGH
UWDN
HQ�LQ
FOXG
H�XS
JUDG
LQJ�RI�ID
FLOLWLHV�WR�SUHYH
QW
OHDN
DJH�DQ
G�LQILOWUDWLRQ�
3ROOXWLR
Q�3UHYH
QWLRQ
6WDQG
DUGV
�DQG
3ROOXWLR
Q�SUHY
HQWLR
Q�WHFK
QLTX
HV�XVH
G�LQ�WK
H,QGX
VW�
)XOO�V
FDOH�VWDWXV�
1$
1$
5HJ
XODWLRQV
DVVH
VVPHQ
W�RI�IDF
LOLWLH
V�UHTX
LUHG�WR�UHF
HLYH
DSSURY
DOV�WR�RSH
UDWH�XQG
HU�HQY
LURQP
HQWDO
OHJLVODWLRQ��3ROOXWLR
Q�SUHY
HQWLR
Q�UHGX
FHV�WKH
FRQV
XPSWLRQ�RI�UDZ
�PDWHULDOV�DQG
�HQH
UJ\�DQ
G�WKH
SURG
XFWLR
Q�RI�ZDV
WHV�UHTX
LULQJ
�WUHD
WPHQ
W�
3URYLQF
LDO�(
QHUJ\
5HJ
XODWHG
5HJ
XODWH�WKH�PLQLP
XP�HIILFLHQ
F\�OH
YHOV��E
DVHG
�RQ
&RP
P�
)XOO�V
FDOH�VWDWXV�
1$
1$
(IILFLHQ
F\6WDQG
DUGV
QDWLR
QDO�VWDQG
DUGV
��LQ�HQ
HUJ\
�XVLQJ
�HTX
LSPHQ
W�5HV
LG�
6WDUW������
����
5HJ
XODWLRQV
5HJ
XODWLRQ�RE
MHFWLYHV
�DUH�WR
�HOLP
LQDWH�WKH�OHDV
W
HIILFLHQW�HTX
LSPHQ
W�
$LU�5HV
RXUFH
$ZDUHQ
HVV
/RFD
O�FRP
PLWWHH
V�H[
DPLQH�ZKD
W�FRQ
WULEXWHV
�WR0XQ
LF�
)XOO�V
FDOH�VWDWXV�
1$
1$
0DQ
DJHP
HQW�$
UHD
,QIRUP
DWLRQ
UHGX
FHG�DLU�TX
DOLW\�LQ
�WKHLU�FR
PPXQ
LWLHV
�DQG
&RP
PLWWHH
V(GX
FDWLR
QGH
YHORS�DF
WLRQ�SODQ
V�WR�UHG
XFH�WKDW�LP
SDFW�

115
1DP
H�RI
7\SH�RI
2EMHFWLYH�DQ
G�RU�PHWKRG�RI�DFKLHYLQJ�UHG
XFWLRQ
6HFWRU
6WDWXV�RI
(VWLP
DWH�RI�PLWLJDWLRQ
0RQLWRULQJ��LQWHUP
HGLDWH
SROLF\�P
HDVX
UHLQVWUXPHQW
�LQFOXGLQJ�GHVFULSWLRQ�RI�KRZ�HIIHFWV�WDNH�SODFH�
LPSOHPHQ
WDWLRQ��
LPSDFW
LQGLFDWRU�RI�SURJUHVV
����
����
1(:
%5816:,&.
�FRQ
W��
3UR�7UXFNHU
$ZDUHQ
HVV
(QH
UJ\�HIILFLHQW�WUXFN�GULYHU�WUDLQLQJ
�WKURXJ
K7UDQVS�
)XOO�VFDOH�VWDWXV�
1$
1$
,QIRUP
DWLRQ
VHPLQDUV�DQ
G�RQ
H�RQ
�RQH
�FRQ
VXOWDWLRQV��0
DNHV
�&RP
P��
(GX
FDWLRQ
UHFRPPHQ
GDWLRQV�RQ�HT
XLSP
HQW�VSH
FLILFDWLRQV�IR
U
GULYHUV�DQ
G�IOHHW�P
DQDJ
HUV�
%HVW�$
YDLODEOH
9ROXQ
WDU\�RU
3URJUDP
�ORRNV�DW�SROOXWLRQ�SUHYHQ
WLRQ�RS
SRUWXQ
LWLHV�
&RP
P�
)XOO�VFDOH�VWDWXV��
1$
1$
&RQ
WURO�7HFKQ
RORJ
\5HJ
XODWHG
IROORZHG
�E\�D�WRS�GR
ZQ�DVVHVVPHQ
W�RI�D
SSOLFDE
OH,QVWLW�
$VVHVVP
HQW
6WDQG
DUGV
FRQWURO�WHFKQ
RORJ
LHV��3URFHVV�DOVR�ORRNV�DW�WK
H
3URFHVV
LPSD
FW�RI�S
ROOXWLRQ�FRQWUROV�RQ�RWKH
U�HOHP
HQWV�RI
WKH�HQ
YLURQP
HQW�D
QG�RQ�HQ
HUJ\�FRQ
VXPSWLRQ�
$XWR�3URSD
QH$ZDUHQ
HVV
7KUHH
�SURJUDP
V�WR�HQJ
DJH�LQ�P
DUNHWLQJ�DFWLYLWLHV
7UDQVS�
)XOO�VFDOH�VWDWXV�
1$
9HK
LFOH�FRQ
YHUVLRQV��S
ULPDULO\
0DUNHWLQJ�3URJUDP
,QIRUP
DWLRQ
DQG�WR�HVWDE
OLVK�DQ
�LPSURYHG
�IXHO�VXS
SO\�DQ
G$PRX
QW�LQYHVWHG
RI�SULYDWH�IOHHWV��DUH
(GX
FDWLRQ
PDLQWHQ
DQFH�VWUXFWXUH�WK
URXJ
KRXW�1HZ
�%UXQVZLFN�
����
����
�SURJ
UHVVLQJ�DW�D�UDWH�RI�RQH
SHU�ZHH
N�ZLWK�D�WD
UJHW�RI��
��
FRQYHUVLRQ
V�E\����
��
([SDQ
GHG
$ZDUHQ
HVV
3ODQ�FDOOV�IR
U�DQ
�LQFUHD
VH�LQ�SURGX
FWLYLW\�RI
)RUHVW�
)XOO�VFDOH�VWDWXV�
1$
)DVWHU�JURZ
LQJ�WUHH
V�WKDW
6LOYLFXOWXUH�3URJUDP
,QIRUP
DWLRQ
PDQ
DJHG
�WLPEH
U�KD
YH�WK
H�DE
LOLW\�WR
�DEVRUE
(GX
FDWLRQ
PRUH�&2
�DUH�FXUUHQWO\�XQG
HU�
SURG
XFWLRQ�LQ�1HZ
�%UXQVZLFN�
%LRPDVV�(QH
UJ\
$ZDUHQ
HVV
3URJUDP
�LPSURYHV�WK
H�SR
WHQWLDO�IRU�H[SDQ
GHG
$JULF�
)XOO�VFDOH�VWDWXV�
1$
%HQ
HILWV�WR
�EH�GH
WHUP
LQHG
�
3URJUDP
,QIRUP
DWLRQ
ELRP
DVV�XVH��3URJUDP
�HOHPHQ
WV�LQFOXG
H�UHVRXUFH
(GX
FDWLRQ
LQYHQWRULHV��HFRQR
PLF�HYDOXDWLRQV��D
QG�WH
FKQR
ORJ\
WUDQ
VIHU�

�SODQQ
HG��LPSOHP
HQWHG��OHJLVODWLRQ�SD
VVHG
�RU�QR
W��VWDWXV�RI�IXQ
GLQJ
�*
�1RWH��LQ�RUGHU�WR
�DYRLG�GRX
EOH�FRXQ
WLQJ��LQ�P
RVW�FDVHV�WK
H�HIIHFWV�RI�LQGLYLGX
DO�P
HDVXUHV�DUH�QR
W�TXD
QWLILHG
�GXH
�WR�WK
HLU�LQWHU�UHODWLRQVKLS�DQ
G�FRPELQH
G�LPSD
FW�ZLWK�VLPLODU�RU
**
RWKH
U�FRPSOHP
HQWDU\�P
HDVXUHV��7KH
�FRP
ELQH
G�HIIHFWV�RI�P
RVW�R
I�WKH
�PHD
VXUHV�DUH�DFFRXQ
WHG�IRU�LQ�WK
H�HP
LVVLRQ
V�RX
WORRN�WR
����
��DQ
G�EH
\RQG
���VHH
�$SS
HQGL[����7DE
OHV
��D����E����F���
116
1DP
H�RI
7\SH�RI
2EMHFWLYH�DQ
G�RU�PHWKRG�RI�DFKLHYLQJ�UHG
XFWLRQ
6HF
WRU
6WDWXV�RI
(VWLP
DWH�RI�PLWLJDWLRQ
0RQLWRULQJ��LQWHUP
HGLDWH
SROLF\
�PHD
VXUH
LQVWUXPHQW
�LQFOXGLQJ�GHVFULSWLRQ�RI�KRZ�HIIHFWV�WDNH�SODFH�
LPSOHPHQ
WDWLRQ��
LP
SDF
W LQGLFDWRU�RI�SURJUHVV
����
����
129$�6&27,$
(1(5$&&2817
$ZDUHQ
HVV
$�GDWDE
DVH�HVWDEOLVKH
G�WR�UHFRUG�DQ
G�IDFLOLWDWH
&RP
P�
)XOO�VFDOH�VWDWXV�
1$
)XWXUH�HIIRUWV�ZLOO�IR
FXV�RQ
,QIRUP
DWLRQ
DQDO\VLV�RI�H
QHUJ\�SH
UIRUPDQ
FH�LQGLFDWRUV�IR
U�DOO
,QVWLW�
6WDUW����
��LPSURYLQJ�(1(5$&&2817�
(GX
FDWLRQ
SXEOLFO\�IX
QGHG
�IDFLOLWLHV�
(QH
UJ\
(FRQR
PLF
7KH
�XQG
HUWDNLQJ
�RI�H
QHUJ\�HIILFLHQF\�UHODWHG�FDSLWDO
&RP
P�
)XOO�VFDOH�VWDWXV�
1$
7KH
�SURYLQFH�ZLOO�HQFRX
UDJH
3HUIRUP
DQFH
0HD
VXUHV
LPSURYHP
HQWV�WR
�SXE
OLF�EXLOGLQJV�
,QVWLW�
DOO�JRYHUQP
HQW�IXQG
HG
&RQ
WUDFWLQJ
IDFLOLWLHV�WR�H[DPLQH�WKH
IHDVLELOLW\�RI�H
QHUJ\
SHUIRUPDQ
FH�FRQ
WUDFWLQJ�E\
����
�
1RYD�6FRWLD�&RD
O5'�DQG
7KH
�SURJUDP
�LV�ZRUNLQJ
�WR�LP
SURYH�WKH�HQ
HUJ\
)XOO�VFDOH�VWDWXV�
1$
3URJUDP
V�IRFXV�RQ
�DGYDQ
FHG
5HVHD
UFK
'HP
RQVWUDWLRQ
HIILFLHQF\�DQ
G�UHGX
FH�WK
H�HQ
YLURQP
HQWDO�LPSD
FWXWLOL]DWLRQ�WHFKQR
ORJLHV�IR
U
$JUHH
PHQ
WDVVRFLDWHG
�ZLWK�FRD
O�SURGX
FWLRQ�DQ
G�XVH�LQ�1RYD
QHZ�WK
HUPRH
OHFWULF�ID
FLOLWLHV�
6FRWLD�
(OHFWULFDO
8WLOLWLHV
1RQ
�8WLOLW\
$ZDUHQ
HVV
18*�LV�HQFRX
UDJH
G�WKURXJ
K�WKH�VXSS
O\LQJ�RI
0DQ
XI�
)XOO�VFDOH�VWDWXV�
1$
%HQ
HILWV�RQJ
RLQJ
�
*HQ
HUDWLRQ��18*�
,QIRUP
DWLRQ
LQIRUP
DWLRQ�UHJD
UGLQJ�FRJH
QHUDWLRQ�DQ
G�WHFKQLFDO
,QGX
VW�
(GX
FDWLRQ
DVVLVWDQ
FH�WR
�SRWHQ
WLDO�SULYDWH�SR
ZHU�VXS
SOLHUV�
&RP
P�
5HVLG�
/DQG
ILOO�*
DV5'
*RYHUQP
HQW�LV�GH
YHORSLQJ
�RSWLRQV�IR
U�PDQ
DJLQJ
0XQ
LF�
3LORW
1$
+DYH�ODXQ
FKHG
�D�SURYLQFH�
0DQ
DJHP
HQW�3
ODQV
ODQG
ILOO�JDVHV�LQ�RUGHU�WR
�UHG
XFH�*+*�HPLVVLRQ
VZLGH�SODQ
�WR�KDOYH�JDUED
JH
IURP
�VROLG�ZDVWH�
JRLQJ�WR�ODQG
ILOOV�E\�WKH�\HDU
����
�

117
1DP
H�RI
7\SH�RI
2EMHFWLYH�DQ
G�RU�PHWKRG�RI�DFKLHYLQJ�UHG
XFWLRQ
6HF
WRU
6WDWXV�RI
(VWLP
DWH�RI�PLWLJDWLRQ
0RQLWRULQJ��LQWHUP
HGLDWH
SROLF\
�PHD
VXUH
LQVWUXPHQW
�LQFOXGLQJ�GHVFULSWLRQ�RI�KRZ�HIIHFWV�WDNH�SODFH�
LPSOHPHQ
WDWLRQ��
LPSDF
WLQGLFDWRU�RI�SURJUHVV
����
����
129$�6&27,$
�FRQ
W��
5HVLGHQ
WLDO�(
QHUJ\
$ZDUHQ
HVV
3URJUDP
�GHVLJQH
G�WR�LQFUHD
VH�UHVLGHQ
WLDO�HQH
UJ\
5HVLG�
)XOO�VFDOH�VWDWXV�
1$
1$
3URJUDP
V,QIRUP
DWLRQ
HIILFLHQF\�WKURXJ
K�LQIRUP
DWLRQ��WUDLQLQJ
��DQG
�DGYLFH
(GX
FDWLRQ
WR�KRP
HRZQH
UV��3
URJUDP
�LQFOXG
HV�D�WR
OO�IUHH
LQIRUP
DWLRQ�QX
PEH
U�DQ
G�VHPLQDUV�LQ�KRX
VLQJ
�DQG
KHDWLQJ�LVVXHV�
5����
��1DWLRQD
O$ZDUHQ
HVV
&RQ
IHUHQFHV�RQ�HQ
HUJ\�HIILFLHQ
W�KHD
OWK\�KR
XVLQJ
5HVLG�
)XOO�VFDOH�VWDWXV�
1$
%HQ
HILWV�RQJ
RLQJ
�
%XLOGHUV�3URJUDP
,QIRUP
DWLRQ
DQG�IXQG
LQJ�IRU�WHFKQR
ORJ\�WUDQ
VIHUV�
(GX
FDWLRQ
(QH
UJ\�(IILFLHQ
W5HJ
XODWHG
6HWV�PLQLPXP
�HIILFLHQ
F\�OHYHOV�IR
U�HQ
HUJ\�XVLQJ
&RP
P�
)XOO�VFDOH�VWDWXV�
1$
1$
$SS
OLDQFH�$FW�DQG
6WDQG
DUGV
DSSOLDQFHV�DQG
�HTX
LSPHQ
W�VROG�RU�OHDVHG
��/DE
HOOLQJ
,QVWLW�
6WDUW������
����
5HJ
XODWLRQV
IRU�DS
SOLDQFHV�DQG
�HTX
LSPHQ
W�DOVR�LQFOXG
HG��
5HVLG�
0RWRU�9HK
LFOH
6WDQG
DUGV�DQG
*RYHUQP
HQW�R
SHUDWHV�DQ
�DQQ
XDO�P
RWRU�YHK
LFOH
7UDQVS�
)XOO�VFDOH�VWDWXV�
1$
1$
1$
,QVSHFWLRQ�3URJUDP
5HJ
XODWLRQV
LQVSHFWLRQ�SURJ
UDP��Z
KLFK�LQFOXG
HV�DQ�LQVSHFWLRQ�RI
D�YHKLFOH·V�SR
OOXWLRQ�FRQWURO�V\VWHP�
6XS
SRUWLQJ
(FRQR
PLF
7KH
�SURYLQFH�KD
V�SURYLGHG
�ILQD
QFLDO�DVVLVWDQFH�WR
7UDQVS�
)XOO�VFDOH�VWDWXV�
1$
7UDQVSR
UWDWLRQ�E\
0HD
VXUHV
&1�5DLOZD\�IR
U�WKH�HVWDEOLVKP
HQW�R
I�DQ�LQODQG
5DLO
)LQDQ
FLDO
GRXE
OH�VWDFNHG
�FRQ
WDLQHU�VHUYLFH��1
6�5DLOZD\�$FW
$VVLVWDQFH
DOVR�SHUPLWV�WK
H�RS
HUDWLRQ�RI�VKR
UW�OLQH
�UDLOZD\
RSHUDWLRQV��5
DLOZD\�WUDQ
VSRUWDWLRQ�LV�P
RUH�HQ
HUJ\
HIILFLHQW�WK
DQ�ORQJ
�KDX
O�WUXFNLQJ�
5HQ
HZDE
OH�DQG
5'
,QIRUP
DWLRQ�LV�SURYLGH
G�RQ
�WKH�FRVW�HIIH
FWLYH�XVH�RI
,QGX
VW�
)XOO�VFDOH�VWDWXV�
1$
1$
$OWHUQDWLYH�(QH
UJ\
UHQH
ZDE
OH�DQG
�DOWHUQDWLYH�HQ
HUJ\��7
HFKQ
LFDO
&RP
P�
,QIRUP
DWLRQ
DVVLVWDQ
FH�LV�SURYLGH
G�IRU�D�SUHOLPLQDU\�DQ
DO\VLV�RI
,QVWLW�
7UDQVIHU
VSHFLILF�RS
SRUWXQ
LWLHV�
5HVLG�
$JULF�

�SODQQ
HG��LPSOHP
HQWHG��OHJLVODWLRQ�SD
VVHG
�RU�QR
W��VWDWXV�RI�IXQ
GLQJ
�*
�1RWH��LQ�RUGHU�WR
�DYRLG�GRX
EOH�FRXQ
WLQJ��LQ�P
RVW�FDVHV�WK
H�HIIHFWV�RI�LQGLYLGX
DO�P
HDVXUHV�DUH�QR
W�TXD
QWLILHG
�GXH
�WR�WK
HLU�LQWHU�UHODWLRQVKLS�DQ
G�FRPELQH
G�LPSD
FW�ZLWK�VLPLODU�RU
**
RWKH
U�FRPSOHP
HQWDU\�P
HDVXUHV��7KH
�FRP
ELQH
G�HIIHFWV�RI�P
RVW�R
I�WKH
�PHD
VXUHV�DUH�DFFRXQ
WHG�IRU�LQ�WK
H�HP
LVVLRQ
V�RX
WORRN�WR
����
��DQ
G�EH
\RQG
���VHH
�$SS
HQGL[����7DE
OHV
��D����E����F���
118
1DP
H�RI
7\SH�RI
2EMHFWLYH�DQ
G�RU�PHWKRG�RI�DFKLHYLQJ�UHG
XFWLRQ
6HFWRU
6WDWXV�RI
(VWLP
DWH�RI�PLWLJDWLRQ
0RQLWRULQJ��LQWHUP
HGLDWH
SROLF\�P
HDVX
UHLQVWUXPHQW
�LQFOXGLQJ�GHVFULSWLRQ�RI�KRZ�HIIHFWV�WDNH�SODFH�
LPSOHPHQ
WDWLRQ��
LP
SDFW
LQGLFDWRU�RI�SURJUHVV
����
����
35,1&(�(':$5'
,6/$1'
(QH
UJ\�(IILFLHQ
F\)LQDQ
FLDO
3URYLGH
V�ILQDQ
FLDO�DVVLVWDQFH�WR�FRP
SDQLHV�IR
U,QGX
VW�
)XOO�VFDOH�VWDWXV�
1$
%HQ
HILWV�RQJ
RLQJ
�
,QLWLDWLYH
$VVLVWDQFH
LPSOHP
HQWLQJ�HQ
HUJ\�FRQ
VHUYDWLRQ�PHD
VXUHV�
&RP
P�
'LVWULFW�+
HDWLQJ
(FRQR
PLF
7ULJ
HQ�(QH
UJ\�&DQ
DGD�,QF��LV�H[SDQ
GLQJ
�WKH�GLVWULFW
,QGX
VW�
)XOO�VFDOH�VWDWXV�
:LOO
7KH
�H[SDQ
VLRQ
�ZLOO�GLVSODFH
6\VWHP�([SDQ
VLRQ
0HD
VXUHV
KHDWLQJ�V\VWHP
V�LQ�&KD
UORWWH
WRZQ�
&RP
P�
HOLPLQDWH���
����PLOOLRQ�OLWUHV�RI�IX
HO�RLO
5HVLG�
NW�RI�&
2DQ
QXDOO\�
�
DQQX
DOO\�
0HWKD
QH�5HFRYHU\
6WDQG
DUGV�DQG
0HWKD
QH�LV�UHFRYHUHG
�IURP
�WKH�SURYLQFH·V�WZ
R0DQ
XI�
)XOO�VFDOH�VWDWXV�
0HWKD
QH%HQ
HILWV�RQJ
RLQJ
�
6\VWHPV
5HJ
XODWLRQV
ODUJHVW�IRR
G�SURFHVVLQJ
�SODQWV�DQ
G�IURP
0XQ
LF�
UHFRYHUHG�LV
&KD
UORWWH
WRZQ·V�PXQ
LFLSDO�ZDVWHZDWHU�WUHD
WPHQ
W����PLOOLRQ
SODQ
W�FXELF�PHWUHV
DQQX
DOO\�
3RZ
HUZLVH
$ZDUHQ
HVV
:RUNVKR
SV�DVVLVW�WKH
�SURYLQFH·V�PDQ
XIDFWXUHUV
0DQ
XI�
)XOO�VFDOH�VWDWXV�
1$
%HQ
HILWV�RQJ
RLQJ
�
2SS
RUWXQLWLHV�
,QIRUP
DWLRQ
DQG�SURFHVVRUV�LQ�LGHQ
WLI\LQJ
�FRQ
VHUYDWLRQ
7KH
UPDO�(QH
UJ\
(GX
FDWLRQ
PHD
VXUHV�WKDW�ZLOO�UHG
XFH�HQ
HUJ\�FRQ
VXPSWLRQ�DQ
G
(IILFLHQ
F\*+*�HPLVVLRQ
V�
:RUNVKR
SV
$LU�4XD
OLW\�DQ
G6WDQG
DUGV�DQG
7KH
�SURYLQFH�KD
V�LPSOHP
HQWHG�PHD
VXUHV�WR�FXUE
$OO
)XOO�VFDOH�VWDWXV�
1$
%HQ
HILWV�RQJ
RLQJ
�
2]RQH
�'HS
OHWLQJ
5HJ
XODWLRQV
WKH�XVH�RI�R]RQH
�GHS
OHWLQJ�VXEVWDQFHV��Z
KLFK
6XE
VWDQ
FHLQFOXG
H�PHD
VXUHV�WR�UHG
XFH�*+*�HPLVVLRQ
V�
5HJ
XODWLRQV

�SODQQ
HG��LPSOHP
HQWHG��OH
JLVODWLRQ�SD
VVHG
�RU�QR
W��VWDWXV
�RI�IXQ
GLQJ
�*
�1RWH��LQ
�RUGHU�WR
�DYR
LG�GRX
EOH�FR
XQWLQ
J��LQ
�PRV
W�FDV
HV�WK
H�HIIHFWV�RI�LQ
GLYLGX
DO�P
HDVX
UHV�DUH�QR
W�TXD
QWLILHG
�GXH
�WR�WK
HLU�LQWHU�UHODWLR
QVKLS�DQ
G�FR
PELQH
G�LP
SDFW�ZLWK
�VLP
LODU�RU
**
RWKH
U�FR
PSOHP
HQWDU\�P
HDVX
UHV��7KH
�FRP
ELQH
G�HIIHFWV�RI�P
RVW�R
I�WKH
�PHD
VXUHV�DUH�DF
FRXQ
WHG�IRU�LQ�WK
H�HP
LVVLRQ
V�RX
WORRN
�WR����
��DQ
G�EH
\RQG
���VHH
�$SS
HQGL[����7DE
OHV
��D����E����F���
119
1DP
H�RI
7\SH�RI
2EMHFWLYH�DQ
G�RU�PHWKRG�RI�DFKLHYLQJ�UHG
XFWLRQ
6HFWRU
6WDWXV�RI
(VWLP
DWH�RI�PLWLJDWLRQ
0RQLWRULQJ��LQWHUP
HGLDWH
SROLF\�P
HDVX
UHLQVWUXPHQW
�LQFOXGLQJ�GHVFULSWLRQ�RI�KRZ�HIIHFWV�WDNH�SODFH�
LPSOHPHQ
WDWLRQ��
LP
SDFW
LQGLFDWRU�RI�SURJUHVV
����
����
1(:)281'/$1'
(QH
UJ\�(IILFLHQ
F\9ROXQ
WDU\�RU
7KH
�1HZ
IRXQ
GODQ
G�DQ
G�/D
EUDG
RU�+RX
VLQJ
5HV
LG�
)XOO�V
FDOH�VWDWXV�
1$
%HQ
HILWV�RQJ
RLQJ
�
0HD
VXUHV
5HJ
XODWHG
&RUSR
UDWLR
Q�KD
V�EH
HQ�ZRUNLQJ
�WR�LP
SURY
H�WKH
6WDQG
DUGV
HQHUJ\
�HIILFLHQ
F\�RI�LWV�VWRFN�
3UR�7UXFNHU
$ZDUHQ
HVV
(QH
UJ\�HIILFLHQW�WUXF
N�GULYHU�WUDLQLQJ
�WKURXJ
K7UDQV
S�)XOO�V
FDOH�VWDWXV�
1$
$FWLYLW\�LQ
�SURJUDP
�LV�FXUUHQWO\
3URJUDP
,QIRUP
DWLRQ
VHPLQDUV�DQ
G�RQ
H�RQ
�RQH
�FRQ
VXOWD
WLRQV
�KLJK
HU�WK
DQ�DW�WKH
�EHJ
LQQLQJ
�
(GX
FDWLR
Q
,QVWLWX
WLRQD
O�(QH
UJ\
(FR
QRPLF
,QLWLDWLYH�LV�WR
�XVH
�(3&�WR
�LPSURY
H�HQ
HUJ\
�HIILFLHQ
F\,QVWLW�
)XOO�V
FDOH�VWDWXV�
1$
$SS
UR[LPDWHO\�RQ
H�KD
OI�RI
3HUIRUP
DQFH
0HD
VXUHV
LQ�LQ
VWLWX
WLRQV
��SDUWLFXODUO\�KHD
OWK�DQG
�HGX
FDWLR
Q�KH
DOWK�DQG
�RQH
�TXD
UWHU�RI
&RQ
WUDF
WLQJ��(3&�
HGXF
DWLRQD
O�LQV
WLWXWLRQV
�DUH�DW
VRPH�VWDJ
H�RI
LPSOHP
HQWDWLR
Q�
1RQ
�8WLOLW\
(FR
QRPLF
7R�XWLOL]H
�QRQ
�XWLOLW\�JHQ
HUDWLRQ�WR�P
HHW�Q
HZ�SRZ
HU8WLOLW\
)XOO�V
FDOH�VWDWXV�
1$
)RX
U�VP
DOO�K
\GUR�SURMHFWV
*HQ
HUDWLRQ
0HD
VXUHV
UHTX
LUHPHQ
WV��0
RVW�S
URMHFWV�DUH�UHQH
ZDE
OH�HQH
UJ\
FRQWUDFWHG
�WR�GHOLYHU�SRZ
HU�LQ
RU�KLJK�HIILFLHQF
\��H�J���FR
JHQH
UDWLR
Q��
����
��1HZ
�UHT
XHVW�IR
U
SURS
RVDOV�LVVX
HG�LQ
�-DQ
XDU\
����
�IRU�XS
�WR����
�0:�
$XWR�3URSD
QH$ZDUHQ
HVV
5HG
XFWLR
Q�LQ�SURYLQF
LDO�J
DVROLQH�WD[D
WLRQ�IURP
�WKH
7UDQV
S�)XOO�V
FDOH�VWDWXV�
1$
,Q����
���D�SURJUDP
�IRU�OLJKW�
0DUNH
W,QIRUP
DWLRQ
FXUUHQ
W�OHY
HO�RI��
����
�/�WR
������
�/�IR
U�SURS
DQH�
GXW\�YHK
LFOHV�DOVR
(GX
FDWLR
Q,P
SOHP
HQWHG�WR�HQF
RXUDJH
�SURSD
QH�FRQ
YHUVLRQ
LPSOHP
HQWHG�WR�VWLP
XODWH�DX
WR
)LQDQ
FLDO
DQG�UHGX
FH�HPLVVLRQ
V��,Q
����
���D�SURJUDP
�IRU�OLJKW�
SURS
DQH�PDUNH
W�
,QFH
QWLYH
GXW\�YHK
LFOHV�DOVR
�LPSOHP
HQWHG�WR�VWLP
XODWH�DX
WR
SURS
DQH�PDUNH
W�
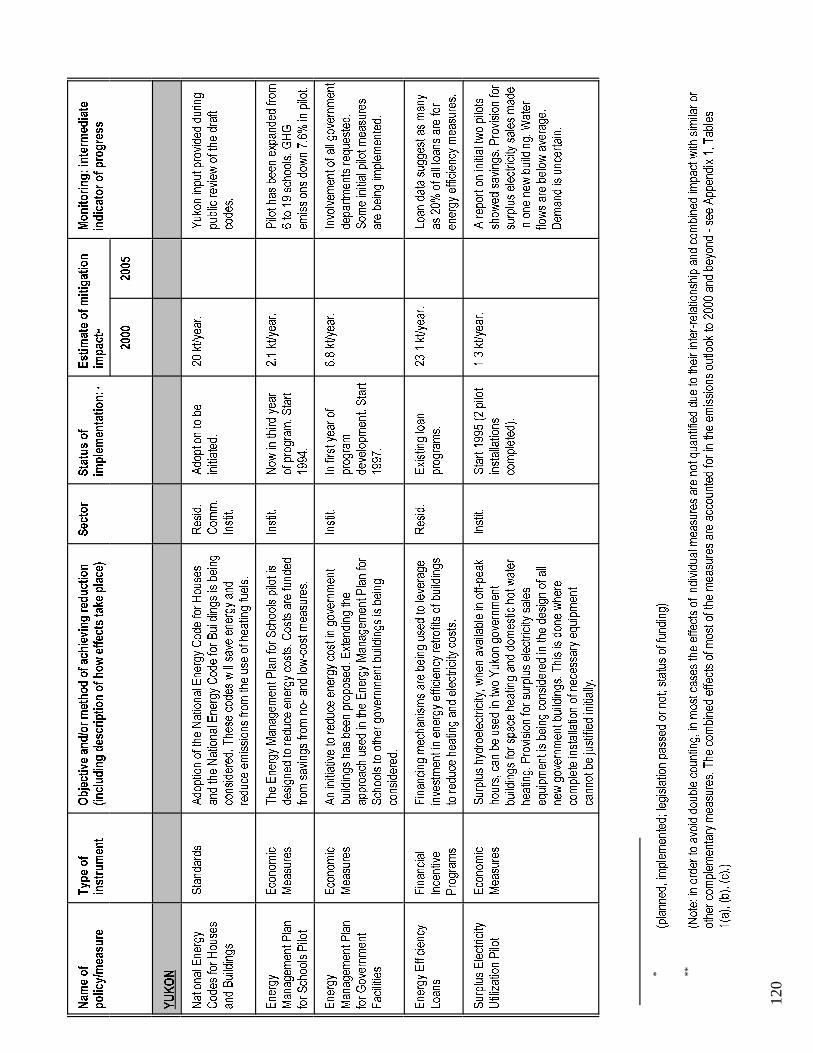
�SODQQ
HG��LPSOHP
HQWHG��OHJLVODWLRQ�SD
VVHG
�RU�QR
W��VWDWXV�RI�IXQ
GLQJ
�*
�1RWH��LQ�RUGHU�WR
�DYRLG�GRX
EOH�FRXQ
WLQJ��LQ�P
RVW�FDVHV�WK
H�HIIHFWV�RI�LQGLYLGX
DO�P
HDVXUHV�DUH�QR
W�TXD
QWLILHG
�GXH
�WR�WK
HLU�LQWHU�UHODWLRQVKLS�DQ
G�FRPELQH
G�LPSD
FW�ZLWK�VLPLODU�RU
**
RWKH
U�FRPSOHP
HQWDU\�P
HDVXUHV��7KH
�FRP
ELQH
G�HIIHFWV�RI�P
RVW�R
I�WKH
�PHD
VXUHV�DUH�DFFRXQ
WHG�IRU�LQ�WK
H�HP
LVVLRQ
V�RX
WORRN�WR
����
��DQ
G�EH
\RQG
���VHH
�$SS
HQGL[����7DE
OHV
��D����E����F���
120
1DP
H�RI
7\SH�RI
2EMHFWLYH�DQ
G�RU�PHWKRG�RI�DFKLHYLQJ�UHG
XFWLRQ
6HF
WRU
6WDWXV�RI
(VWLP
DWH�RI�PLWLJDWLRQ
0RQLWRULQJ��LQWHUP
HGLDWH
SROLF\
�PHD
VXUH
LQVWUXPHQW
�LQFOXGLQJ�GHVFULSWLRQ�RI�KRZ�HIIHFWV�WDNH�SODFH�
LPSOHPHQ
WDWLRQ��
LP
SDF
W LQGLFDWRU�RI�SURJUHVV
����
����
<8.21
1DWLRQD
O�(QH
UJ\
6WDQG
DUGV
$GR
SWLRQ�RI�WK
H�1DWLRQD
O�(QH
UJ\�&RG
H�IRU�+RX
VHV
5HVLG�
$GR
SWLRQ�WR�EH
���NW�\HD
U�<XNRQ
�LQSX
W�SURYLGH
G�GX
ULQJ
&RG
HV�IR
U�+RX
VHV
DQG�WKH�1DWLRQD
O�(QH
UJ\�&RG
H�IRU�%XLOGLQJV�LV�EHLQJ
&RP
P�
LQLWLDWHG
�SX
EOLF�UHYLHZ�RI�WKH
�GUDIW
DQG�%XLOGLQJV
FRQVLGHUHG
��7KH
VH�FRG
HV�ZLOO�VDYH�HQ
HUJ\�DQG
,QVWLW�
FRGH
V��
UHGX
FH�HPLVVLRQ
V�IURP
�WKH�XVH�RI�KHD
WLQJ�IXHOV�
(QH
UJ\
(FRQR
PLF
7KH
�(QH
UJ\�0DQ
DJHP
HQW�3
ODQ�IRU�6FKRR
OV�SLORW�LV
,QVWLW�
1RZ
�LQ�WK
LUG�\HD
U����NW�\HD
U�3LORW�K
DV�EHH
Q�H[SD
QGHG
�IURP
0DQ
DJHP
HQW�3
ODQ
0HD
VXUHV
GHVLJQ
HG�WR
�UHG
XFH�HQ
HUJ\�FRVWV��&
RVWV�DUH�IX
QGHG
RI�SURJUDP
��6WDUW
��WR����VFKR
ROV��*+*
IRU�6FKRR
OV�3LORW
IURP
�VDYLQJV�IURP
�QR��DQG
�ORZ�FRVW�P
HDVXUHV�
����
�HP
LVVLRQ
V�GR
ZQ�����
�LQ�SLORW�
(QH
UJ\
(FRQR
PLF
$Q�LQLWLDWLYH�WR�UHG
XFH�HQ
HUJ\�FRVW�LQ�JR
YHUQPHQ
W,QVWLW�
,Q�ILUVW�\HD
U�RI
����NW�\HD
U�,QYROYHP
HQW�R
I�DOO�JR
YHUQPHQ
W
0DQ
DJHP
HQW�3
ODQ
0HD
VXUHV
EXLOGLQJV�KDV�EHH
Q�SURS
RVHG
��([WHQ
GLQJ
�WKH
SURJ
UDP
GHSD
UWPHQ
WV�UHT
XHVWHG
�
IRU�*RYHUQP
HQW
DSSURD
FK�XVHG�LQ�WK
H�(QH
UJ\�0DQ
DJHP
HQW�3
ODQ�IRU
GHYHORSP
HQW��6WDUW
6RP
H�LQLWLDO�SLORW�P
HDVXUHV
)DFLOLWLHV
6FKRR
OV�WR
�RWKHU�JRYHUQP
HQW�E
XLOGLQJV�LV�EHLQJ
����
�DUH�EH
LQJ�LPSOHP
HQWHG�
FRQVLGHUHG
�
(QH
UJ\�(IILFLHQ
F\)LQDQ
FLDO
)LQDQ
FLQJ
�PHFKD
QLVP
V�DUH�EH
LQJ�XVHG
�WR�OHYHUDJH
5HVLG�
([LVWLQJ�ORDQ
�����NW�\HD
U�/R
DQ�GDWD�VXJJ
HVW�D
V�PDQ
\
/RDQ
V,QFHQWLYH
LQYHVWPHQ
W�LQ�HQ
HUJ\�HIILFLHQ
F\�UHWURILWV�RI�EXLOGLQJV
SURJ
UDPV�
DV����
�RI�D
OO�ORDQ
V�DUH�IRU
3URJUDP
VWR�UHG
XFH�KH
DWLQJ�DQ
G�HOHFWULFLW\�FRVWV�
HQHUJ\�HIILFLHQ
F\�P
HDVXUHV�
6XUSOXV�(OHFWULFLW\
(FRQR
PLF
6XUSOXV�K\GURHOHFWULFLW\��Z
KHQ�DYDLODEOH�LQ�RII�SH
DN,QVWLW�
6WDUW����
�����SLORW
����NW�\HD
U�$�UHS
RUW�R
Q�LQLWLDO�WZ
R�SLORWV
8WLOL]DWLRQ�3LORW
0HD
VXUHV
KRXUV��FDQ
�EH�XVHG
�LQ�WZ
R�<XNRQ
�JRYHUQP
HQW
LQVWDOODWLRQV
VKRZ
HG�VDYLQJV��3
URYLVLRQ
�IRU
EXLOGLQJV�IR
U�VSDFH�KH
DWLQJ�DQ
G�GR
PHVWLF�KRW�ZDWHU
FRPSOHWHG
��VXUSOXV�HOHFWULFLW\�VDOHV�P
DGH
KHDWLQJ��3URYLVLRQ
�IRU�VXUSOXV�HOHFWULFLW\�VDOHV
LQ�RQH
�QHZ
�EXLOGLQJ��:
DWHU
HTXLSP
HQW�LV�EH
LQJ�FRQVLGHUHG
�LQ�WK
H�GH
VLJQ
�RI�D
OOIORZV�DUH�EH
ORZ�DYHUDJH
�
QHZ�JRYHUQP
HQW�E
XLOGLQJV��7
KLV�LV�GRQ
H�ZKH
UH'HP
DQG�LV�XQFHUWDLQ�
FRPSOHWH�LQVWDOODWLRQ�RI�QHFHVVDU\�HTX
LSPHQ
W
FDQQ
RW�EH�MXVWLILHG
�LQLWLDOO\�
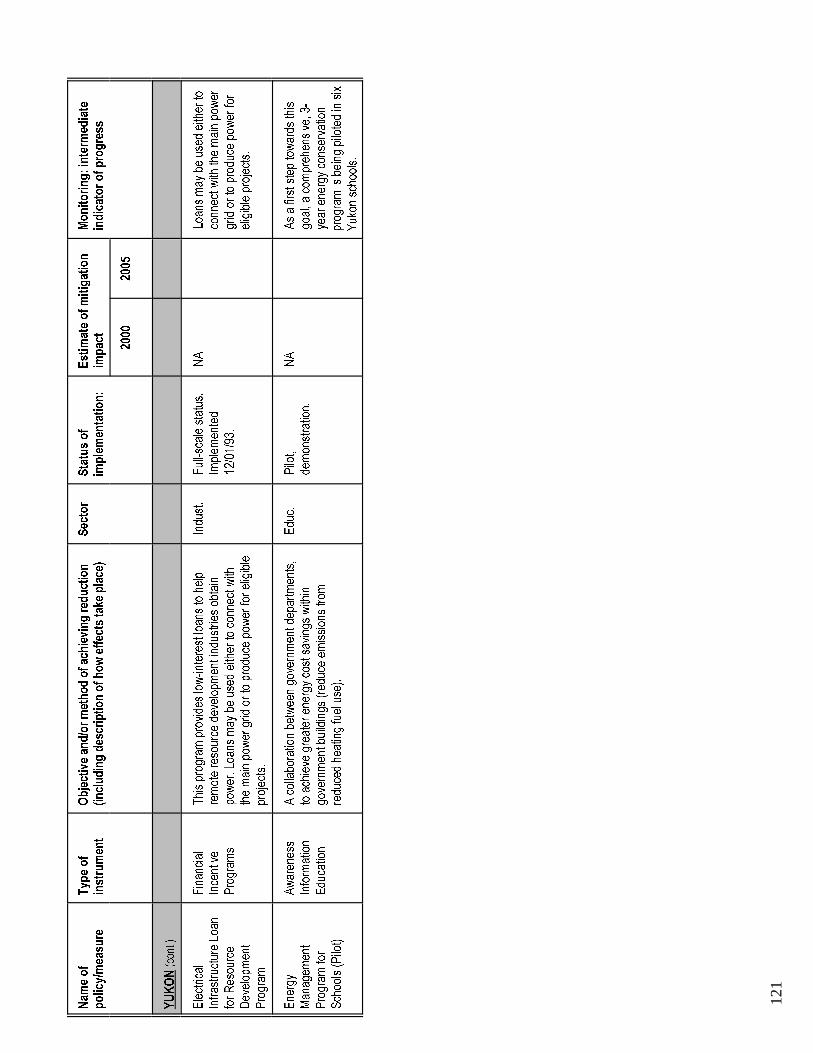
121
1DP
H�RI
7\SH�RI
2EMHFWLYH�DQ
G�RU�PHWKRG�RI�DFKLHYLQJ�UHG
XFWLRQ
6HF
WRU
6WDWXV�RI
(VWLP
DWH�RI�PLWLJDWLRQ
0RQLWRULQJ��LQWHUP
HGLDWH
SROLF\
�PHD
VXUH
LQVWUXPHQW
�LQFOXGLQJ�GHVFULSWLRQ�RI�KRZ�HIIHFWV�WDNH�SODFH�
LPSOHPHQ
WDWLRQ��
LPSDF
WLQGLFDWRU�RI�SURJUHVV
����
����
<8.21��FR
QW��
(OHFWULF
DO)LQDQ
FLDO
7KLV�SURJ
UDP�SURYLGH
V�ORZ�LQ
WHUHVW�OR
DQV�WR�KHOS
,QGX
VW�
)XOO�V
FDOH�VWDWXV�
1$
/RDQ
V�PD\
�EH�XV
HG�HLWK
HU�WR
,QIUDV
WUXF
WXUH�/RD
Q,QFH
QWLYH
UHPRWH�UHVR
XUFH
�GHY
HORS
PHQ
W�LQG
XVWULHV�RE
WDLQ
,PSOHP
HQWHG
FRQQ
HFW�Z
LWK�WK
H�PDLQ�SR
ZHU
IRU�5HV
RXUFH
3URJUDP
VSR
ZHU��/
RDQV
�PD\
�EH�XV
HG�HLWK
HU�WR
�FRQ
QHFW�ZLWK
��������
�JULG�RU�WR�SURGX
FH�SRZ
HU�IR
U
'HY
HORS
PHQ
WWKH�PDLQ�SR
ZHU�JULG
�RU�WR�SURGX
FH�SRZ
HU�IR
U�HOLJLEOH
HOLJLEOH�SURMHFWV�
3URJUDP
SURMHF
WV�
(QH
UJ\
$ZDUHQ
HVV
$�FROODER
UDWLR
Q�EH
WZHH
Q�JR
YHUQPHQ
W�GHS
DUWP
HQWV�
(GX
F�3LORW�
1$
$V�D�ILUVW�VWHS�WRZDUGV
�WKLV
0DQ
DJHP
HQW
,QIRUP
DWLRQ
WR�DFK
LHYH
�JUHDWHU�HQH
UJ\�FR
VW�VDY
LQJV
�ZLWK
LQGH
PRQ
VWUDWLR
Q�JR
DO��D
�FRP
SUHK
HQVLYH
����
3URJUDP
�IRU
(GX
FDWLR
QJR
YHUQPHQ
W�EXLOGLQJV
��UHGX
FH�HPLVVLRQ
V�IURP
\HDU�HQH
UJ\�FR
QVHUYD
WLRQ
6FK
RROV��3LORW�
UHGX
FHG�KH
DWLQJ�IXHO�XVH
��SURJ
UDP�LV�EHLQJ
�SLORWHG�LQ�VL[
<XN
RQ�VFK
RROV�
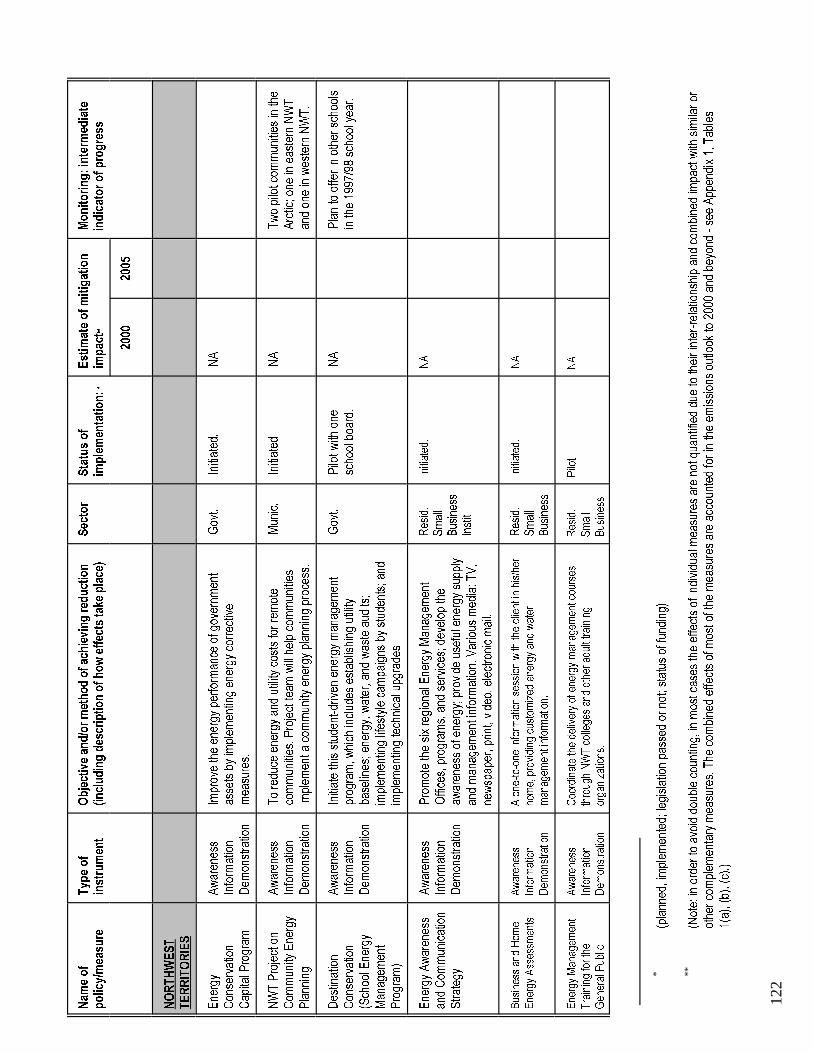
�SODQQ
HG��LPSOHP
HQWHG��OH
JLVODWLRQ�SD
VVHG
�RU�QR
W��VWDWXV
�RI�IXQ
GLQJ
�*
�1RWH��LQ
�RUGHU�WR
�DYR
LG�GRX
EOH�FR
XQWLQ
J��LQ
�PRV
W�FDV
HV�WK
H�HIIHFWV�RI�LQ
GLYLGX
DO�P
HDVX
UHV�DUH�QR
W�TXD
QWLILHG
�GXH
�WR�WK
HLU�LQWHU�UHODWLR
QVKLS�DQ
G�FR
PELQH
G�LP
SDFW�ZLWK
�VLP
LODU�RU
**
RWKH
U�FR
PSOHP
HQWDU\�P
HDVX
UHV��7KH
�FRP
ELQH
G�HIIHFWV�RI�P
RVW�R
I�WKH
�PHD
VXUHV�DUH�DF
FRXQ
WHG�IRU�LQ�WK
H�HP
LVVLRQ
V�RX
WORRN
�WR����
��DQ
G�EH
\RQG
���VHH
�$SS
HQGL[����7DE
OHV
��D����E����F���
122
1DP
H�RI
7\SH�RI
2EMHFWLYH�DQ
G�RU�PHWKRG�RI�DFKLHYLQJ�UHG
XFWLRQ
6HF
WRU
6WDWXV�RI
(VWLP
DWH�RI�PLWLJDWLRQ
0RQLWRULQJ��LQWHUP
HGLDWH
SROLF\
�PHD
VXUH
LQVWUXPHQW
�LQFOXGLQJ�GHVFULSWLRQ�RI�KRZ�HIIHFWV�WDNH�SODFH�
LPSOHPHQ
WDWLRQ��
LP
SDF
W LQGLFDWRU�RI�SURJUHVV
����
����
1257+:(67
7(55,725,(6
(QH
UJ\
$ZDUHQ
HVV
,PSURY
H�WKH�HQ
HUJ\
�SHUIRUP
DQFH
�RI�J
RYHUQP
HQW
*RY
W�,QLWLDWHG
�1$
&RQ
VHUYDWLRQ
,QIRUP
DWLRQ
DVVH
WV�E\�LP
SOHP
HQWLQ
J�HQ
HUJ\
�FRUUHFWLYH
&DS
LWDO�3
URJUDP
'HP
RQVWUDWLR
QPHD
VXUHV�
1:7�3URMHFW�RQ
$ZDUHQ
HVV
7R�UHGX
FH�HQH
UJ\�DQ
G�XWLOLW\�FRV
WV�IR
U�UHPRWH
0XQ
LF�
,QLWLDWHG
�1$
7ZR�SLORW�F
RPPXQ
LWLHV
�LQ�WK
H
&RP
PXQ
LW\�(QH
UJ\
,QIRUP
DWLRQ
FRPPXQ
LWLHV
��3URMHFW�WH
DP�ZLOO�KHOS�FR
PPXQ
LWLHV
$UFWLF��R
QH�LQ
�HDV
WHUQ�1:7
3ODQQ
LQJ
'HP
RQVWUDWLR
QLP
SOHP
HQW�D
�FRP
PXQ
LW\�HQH
UJ\�SODQ
QLQJ
�SURFH
VV�
DQG�RQ
H�LQ�ZHV
WHUQ�1:7�
'HV
WLQDWLRQ
$ZDUHQ
HVV
,QLWLDWH�WKLV�VWXGH
QW�GULY
HQ�HQH
UJ\�PDQ
DJHP
HQW
*RY
W�3LORW�Z
LWK�RQH
1$
3ODQ�WR�RIIH
U�LQ�RWKHU�VFK
RROV
&RQ
VHUYDWLRQ
,QIRUP
DWLRQ
SURJ
UDP��Z
KLFK
�LQFOXG
HV�HVWDE
OLVKLQJ
�XWLOLW\
VFKR
RO�ERD
UG�
LQ�WK
H���
������VFKR
RO�\HD
U�
�6FK
RRO�(
QHUJ\
'HP
RQVWUDWLR
QED
VHOLQHV
��HQH
UJ\��ZDWHU��D
QG�ZDV
WH�DXG
LWV�
0DQ
DJHP
HQW
LPSOHP
HQWLQ
J�OLIHV
W\OH�FDP
SDLJQV
�E\�VWXG
HQWV��D
QG
3URJUDP
�LP
SOHP
HQWLQ
J�WHFK
QLFD
O�XSJ
UDGH
V�
(QH
UJ\�$ZDUHQ
HVV
$ZDUHQ
HVV
3URPRWH�WKH�VL[�UHJLRQ
DO�(QH
UJ\�0DQ
DJHP
HQW
DQG�&RP
PXQ
LFDWLRQ
,QIRUP
DWLRQ
2IILFH
V��SURJUDP
V��DQG
�VHUYLFH
V��GHY
HORS
�WKH
6WUDWHJ
\'HP
RQVWUDWLR
QDZ
DUHQ
HVV�RI�HQH
UJ\��SURYLGH
�XVH
IXO�H
QHUJ\�VX
SSO\
DQG�PDQ
DJHP
HQW�LQIRUPDWLRQ��9DULRXV
�PHG
LD��7
9�
QHZVS
DSHU��S
ULQW��YLGH
R��HOHFWURQLF�PDLO�
5HVLG�
,QLWLDWHG
�1$
6PDOO
%XVLQHVV
,QVWLW�
%XVLQHVV�DQ
G�+RP
H$ZDUHQ
HVV
$�RQH
�WR�RQ
H�LQIRUP
DWLRQ�VHVVLRQ�ZLWK�WK
H�FOLHQW�LQ�KLV�KHU
5HVLG�
,QLWLDWHG
�1$
(QH
UJ\�$VVHVVP
HQWV
,QIRUP
DWLRQ
KRPH��SURYLGLQJ
�FXVWRPL]HG
�HQH
UJ\�DQ
G�ZDWHU
'HP
RQVWUDWLRQ
PDQ
DJHP
HQW�LQIRUPDWLRQ�
6PDOO
%XVLQHVV
(QH
UJ\�0DQ
DJHP
HQW
$ZDUHQ
HVV
&RR
UGLQDWH�WKH�GH
OLYHU\�RI�HQH
UJ\�PDQ
DJHP
HQW�FRX
UVHV
5HVLG�
3LORW�
1$
7UDLQLQJ�IRU�WKH
,QIRUP
DWLRQ
WKURXJ
K�1:7�FROOHJH
V�DQ
G�RWKH
U�DG
XOW�WUDLQLQJ
6PDOO
*HQ
HUDO�3XE
OLF'HP
RQVWUDWLRQ
RUJD
QL]DWLRQV�
%XVLQHVV

123
1DP
H�RI
7\SH�RI
2EMHFWLYH�DQ
G�RU�PHWKRG�RI�DFKLHYLQJ�UHG
XFWLRQ
6HF
WRU
6WDWXV�RI
(VWLP
DWH�RI�PLWLJDWLRQ
0RQLWRULQJ��LQWHUP
HGLDWH
SROLF\
�PHD
VXUH
LQVWUXPHQW
�LQFOXGLQJ�GHVFULSWLRQ�RI�KRZ�HIIHFWV�WDNH�SODFH�
LPSOHPHQ
WDWLRQ��
LPSDF
WLQGLFDWRU�RI�SURJUHVV
����
����
1257+:(67
7(55,725,(6
�FRQ
W��
+\G
URJH
Q�6WXG\
5'
6WXG\
�ZLOO�GHWHUPLQH�WKH�IHDV
LELOLW\�RI�X
WLOL]LQJ
1$
)HD
VLELOLW\�VWDJ
H�1$
H[FH
VV�K\G
URHOHF
WULF�FDS
DFLW\�DW�WKH
�7DOWVRQ
�VLWH
�WR
SURG
XFH�K\
GURJ
HQ�IR
U�LQGX
VWULD
O�DSS
OLFDWLRQV
�
,JORROLN�:
LQG
5'
7ZR���
�N:�ZLQG�PDF
KLQH
V�ZHUH�LQVWDOOHG�LQ�,J
ORROLN
1$
3LORW�
1$
2SH
UDWLR
QV�ZLOO�EH�PRQ
LWRUHG�
'HP
RQVWUDWLR
QLQ�WK
H�VX
PPHU�RI��
����WR�VXS
SO\�HOHF
WULFLW\�WR
�WKH
GHPRQ
VWUDWLR
Q�LQ
DQG��LI�VXF
FHVVIXO�
3URMHFW
FRPPXQ
LW\�JULG
�RS
HUDWLRQ�
FRQV
LGHUDWLRQ�ZLOO�EH�JLYH
Q�WR
HVWDEOLVKLQJ
�D�OD
UJHU�´ZLQG
IDUP
�µ
39�'HP
RQVWUDWLR
Q5'�DQG
$���N:�SKR
WRYR
OWDLF��39��V\VWHP
�ZDV
�LQVWDOOHG�LQ
1$
3LORW�LQ�RS
HUDWLRQ�
1$
,I�WKH�LQLWLDO�WH
VW�LV�VXF
FHVVIXO�
3URMHFW
'HP
RQVWUDWLR
QDQ
�LQVWLWX
WLRQD
O�EXLOGLQJ�LQ�,T
DOXLW�LQ�WKH�VX
PPHU�RI
D�ODUJHU�K\E
ULG�GLHVH
O�39
����
�V\VWHP
�ZLOO�EH�LQVWDOOHG�LQ
VXEV
HTXH
QW�\HD
UV�
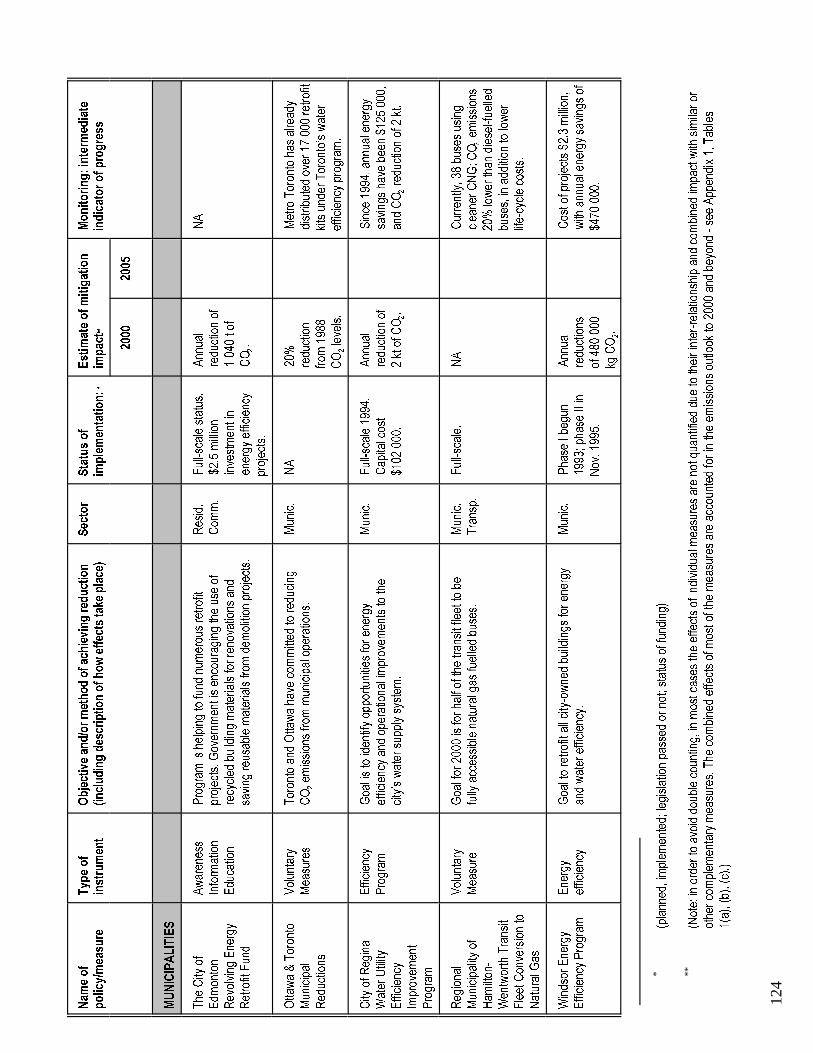
�SODQQ
HG��LPSOHP
HQWHG��OHJLVODWLRQ�SD
VVHG
�RU�QR
W��VWDWXV�RI�IXQ
GLQJ
�*
�1RWH��LQ�RUGHU�WR
�DYRLG�GRX
EOH�FRXQ
WLQJ��LQ�P
RVW�FDVHV�WK
H�HIIHFWV�RI�LQGLYLGX
DO�P
HDVXUHV�DUH�QR
W�TXD
QWLILHG
�GXH
�WR�WK
HLU�LQWHU�UHODWLRQVKLS�DQ
G�FRPELQH
G�LPSD
FW�ZLWK�VLPLODU�RU
**
RWKH
U�FRPSOHP
HQWDU\�P
HDVXUHV��7KH
�FRP
ELQH
G�HIIHFWV�RI�P
RVW�R
I�WKH
�PHD
VXUHV�DUH�DFFRXQ
WHG�IRU�LQ�WK
H�HP
LVVLRQ
V�RX
WORRN�WR
����
��DQ
G�EH
\RQG
���VHH
�$SS
HQGL[����7DE
OHV
��D����E����F���
124
1DP
H�RI
7\SH�RI
2EMHFWLYH�DQ
G�RU�PHWKRG�RI�DFKLHYLQJ�UHG
XFWLRQ
6HF
WRU
6WDWXV�RI
(VWLP
DWH�RI�PLWLJDWLRQ
0RQLWRULQJ��LQWHUP
HGLDWH
SROLF\
�PHD
VXUH
LQVWUXPHQW
�LQFOXGLQJ�GHVFULSWLRQ�RI�KRZ�HIIHFWV�WDNH�SODFH�
LPSOHPHQ
WDWLRQ��
LP
SDF
W LQGLFDWRU�RI�SURJUHVV
����
����
081,&,3$/,7,(6�
7KH
�&LW\�RI
$ZDUHQ
HVV
3URJUDP
�LV�KHOSLQJ
�WR�IX
QG�QXP
HURX
V�UHWURILW
5HVLG�
)XOO�VFDOH�VWDWXV�
XDO
1$
(GP
RQWRQ
,QIRUP
DWLRQ
SURMHFWV��*
RYHUQP
HQW�LV�HQ
FRXUDJ
LQJ�WKH�XVH�RI
&RP
P�
�����P
LOOLRQ
UHGX
FWLRQ�RI
5HYROYLQJ
�(QH
UJ\
(GX
FDWLRQ
UHF\FOHG
�EXLOGLQJ�PDWHULDOV�IR
U�UHQR
YDWLRQV�DQG
LQYHVWPHQ
W�LQ
����
��W�R
I
5HWURILW�)XQ
GVDYLQJ
�UHX
VDEOH�PDWHULDOV�IURP
�GHP
ROLWLRQ
�SURMHFWV�
HQHUJ\�HIILFLHQ
F\&2
�
SURMHFWV�
�
2WWD
ZD��7RURQ
WR9ROXQ
WDU\
7RURQ
WR�DQG
�2WWD
ZD�KD
YH�FRP
PLWWHG
�WR�UHG
XFLQJ
0XQ
LF�
1$
���
0HWUR�7RURQ
WR�KDV�DOUH
DG\
0XQ
LFLSDO
0HD
VXUHV
&2
�HPLVVLRQ
V�IURP
�PXQ
LFLSDO�RSH
UDWLRQV�
UHGX
FWLRQ
GLVWULE
XWHG
�RYHU���
����
�UHWURILW
5HG
XFWLRQV
IURP
����
�NLWV�XQG
HU�7RURQ
WR·V�ZDWHU
�
&2
�OHYHOV�
HIILFLHQF\�SURJ
UDP�
�
&LW\�RI�5
HJLQD
(IILFLHQ
F\*RD
O�LV�WR�LGHQ
WLI\�RS
SRUWXQ
LWLHV�IR
U�HQ
HUJ\
0XQ
LF�
)XOO�VFDOH����
XDO
6LQFH����
���DQQ
XDO�HQH
UJ\
:DWHU�8WLOLW\
3URJUDP
HIILFLHQF\�DQ
G�RS
HUDWLRQD
O�LPSURYHP
HQWV�WR
�WKH
&DS
LWDO�FRVW
UHGX
FWLRQ�RI
VDYLQJ
V�KD
YH�EHH
Q���
������
�
(IILFLHQ
F\FLW\·V�ZDWHU�VXS
SO\�V\VWHP
���
������
���NW�RI�&
2�
DQG�&2
�UHG
XFWLRQ�RI���NW�
,PSURYHP
HQW
3URJUDP
��
5HJ
LRQD
O9ROXQ
WDU\
*RD
O�IRU����
��LV�IR
U�KD
OI�RI�WK
H�WUDQ
VLW�IOHHW�WR
�EH
0XQ
LF�
)XOO�VFDOH�
1$
&XUUHQWO\���
��EX
VHV�XVLQJ
0XQ
LFLSDOLW\�RI
0HD
VXUH
IXOO\�DFFHVVLEOH�QD
WXUDO�JDV�IX
HOOHG�EX
VHV�
7UDQVS�
FOHD
QHU�&1*��&
2�HPLVVLRQ
V
+DP
LOWRQ
���
��ORZHU�WK
DQ�GLHVHO�IXH
OOHG
:HQ
WZRUWK�7UDQVLW
EXVHV��LQ�DGG
LWLRQ
�WR�ORZHU
)OHHW�&RQ
YHUVLRQ�WR
OLIH�F\FOH�FRVWV�
1DWXUDO�*DV
�
:LQGVRU�(QH
UJ\
(QH
UJ\
*RD
O�WR�UHWURILW�DOO�FLW\�RZQH
G�EX
LOGLQJV�IR
U�HQ
HUJ\
0XQ
LF�
3KD
VH�,�EH
JXQ
XDO
&RVW�R
I�SURMHFWV���
���P
LOOLRQ�
(IILFLHQ
F\�3URJUDP
HIILFLHQF\
DQG�ZDWHU�HIILFLHQ
F\�
����
��SKD
VH�,,�LQ
UHGX
FWLRQV
ZLWK�DQQ
XDO�HQH
UJ\�VDYLQJ
V�RI
1RY���
����
RI����
����
����
����
�
NJ�&2
��

125
1DP
H�RI
7\SH�RI
2EMHFWLYH�DQ
G�RU�PHWKRG�RI�DFKLHYLQJ�UHG
XFWLRQ
6HF
WRU
6WDWXV�RI
(VWLP
DWH�RI�PLWLJDWLRQ
0RQLWRULQJ��LQWHUP
HGLDWH
SROLF\
�PHD
VXUH
LQVWUXPHQW
�LQFOXGLQJ�GHVFULSWLRQ�RI�KRZ�HIIHFWV�WDNH�SODFH�
LPSOHPHQ
WDWLRQ�
LPSDF
WLQGLFDWRU�RI�SURJUHVV
����
����
081,&,3$/,7,(6
�FRQ
W��
9DQ
FRXYHU�%LF\FOH
9ROXQ
WDU\
2EMHFWLYH�LV�IR
U�D�FLW\�ZLGH�ELNHZD\�QHWZRUN�WR
0XQ
LF�
8QG
HU1$
7KUHH
�RI�IRX
U�ELNHZD\V�LQ
1HWZRUN
0HD
VXUH
HQFRXUDJ
H�F\FOLQJ��)RX
U�SULRULW\�FRUULGRUV�FKRVHQ
�7UDQVS�
GHYHORSP
HQW�����
�SODFH��%HWZHH
Q���
���DQG
PLOOLRQ�VSHQ
W�LQ
����
��SHUFHQWDJ
H�RI�F\FOLVWV
SDVW���\HD
UV���
�RQ
�URX
WHV�LQWR�GRZ
QWRZ
Q�URVH
PLOOLRQ
IURP
�����WR
������
H[SH
QGLWXUHV�RYHU
QH[W���\HD
UV�
,QWHUQDWLRQD
O6WDQG
DUGV�DQG
$�FRR
SHUDWLYH�PXQ
LFLSDO�HQH
UJ\�LPSURYHP
HQW
0XQ
LF�
3LORW�S
URMHFW��
1$
%HQ
HILWV�RQJ
RLQJ
�
&RX
QFLO�IRU�/R
FDO
5HJ
XODWLRQV
SURJ
UDP��,&/(
,�LV�VHWWLQJ
�XS�D�SLORW�IDFLOLW\�DQG
�ZLOO
����
�PLOOLRQ
(QYLUR
QPHQ
WDO
SURYLGH�EURNHULQJ�DQ
G�FRQVXOWLQJ�VHUYLFHV�WR
LQYHVWHG
�LQ
,QLWLDWLYHV��,&/(
,�PXQ
LFLSDOLWLHV�RQ�HQ
HUJ\�UHWURILWV�
PXQ
LFLSDO�UHWURILWV�

126
/(*(1'�)25�7$%/(��
$7)� �$OWHUQDWLYH�7UDQVSRUWDWLRQ�)XHO
&1*� �&RP
SUHVVHG�1DWXUDO�*DV
*+*� �*UHHQKRXVH�*DV
+29� �+LJK�2FFXSDQF\�9HKLFOH
-,� �-RLQW�,P
SOHP
HQWDWLRQ
1$� �QRW�DYDLODEOH�RU�QRW�DSSOLFDEOH
15&DQ� �1DWXUDO�5HVRXUFHV�&DQDGD
5'� �5HVHDUFK�DQG�'HYHORSPHQW
60(V� �6PDOO�DQG�0HGLXP�6L]HG�(QWHUSULVHV
Agr
ic.
= A
gric
ultu
reC
om
m.
= C
om
mer
cial
Ed
uc.
= E
du
catio
nal
Exp
end
. =
Exp
end
iture
sF
ore
st.
= F
ore
stry
Go
vt.
= G
ove
rnm
ent
Ind
ust
. =
In
du
stri
alM
anu
f. =
Man
ufa
ctu
rin
gM
un
ic.
= M
un
icip
alR
esid
. =
Res
iden
tial
Tra
nsp
. =
Tra
nsp
ort
atio
n
GW
h =
gig
awat
t-h
ou
rkg
= k
ilogr
amkt
= k
iloto
nn
ekW
= k
ilow
att
kWh
= k
ilow
att-
ho
ur
L =
litr
em
= s
qu
are
met
re2
Mt
= m
egat
on
ne
MW
= m
egaw
att
PJ
= p
etaj
ou
let
= t
on
ne
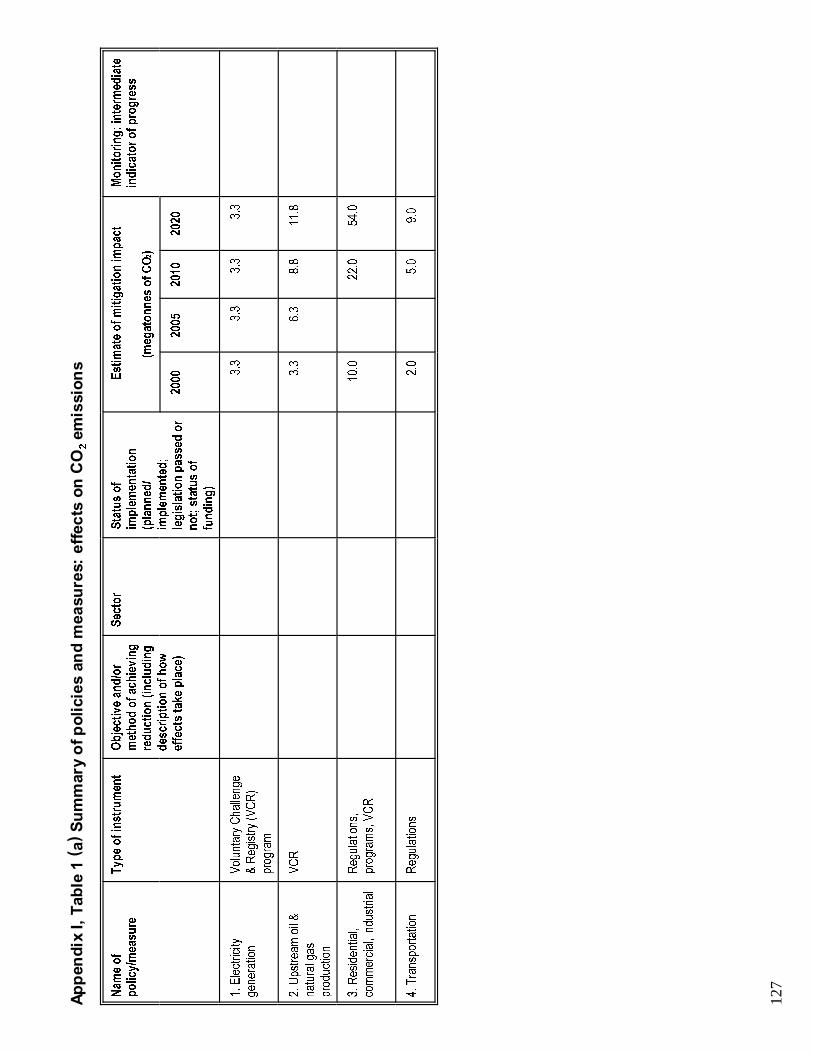
127
$SSHQGL[�,��7DEOH����D��6XPPDU\�RI�SROLFLHV�DQG�P
HDVXUHV��HIIHFWV�RQ�&2
�HPLVVLRQV
�
1DP
H�RI
7\S
H�RI�LQVWUXPHQ
W2EMHFWLYH
�DQG�RU
6HF
WRU
6WDWXV�RI
(VWLP
DWH�RI�PLWLJDWLRQ�LP
SDF
W0RQLWRULQJ��LQWHUP
HGLDWH
SROLF
\�P
HDV
XUH
PHWKRG�RI�DF
KLHYLQJ
LPSOHPHQ
WDWLRQ
LQGLFDWRU�RI�SURJUHVV
UHGXFWLRQ��LQFOXGLQJ
�SODQQHG
��P
HJDWRQQHV
�RI�&2
��
GHV
FULSWLRQ�RI�KRZ
LPSOHPHQ
WHG�
HIIHFWV�WDN
H�SODFH
�OHJLVODWLRQ�SDV
VHG�RU
QRW��VWDWXV�RI
IXQGLQJ�
����
����
����
����
���(OHFWULF
LW\9ROXQ
WDU\�&KD
OOHQJ
H���
���
���
���
JHQH
UDWLR
Q�5HJ
LVWU\��9&5�
SURJ
UDP
���8SV
WUHD
P�RLO��
9&5
���
���
���
����
QDWXUDO�J
DV
SURG
XFWLR
Q
���5HV
LGHQ
WLDO�
5HJ
XODWLRQV
���
����
����
��
FRPPHUFLDO��LQG
XVWULDO
SURJ
UDPV��9&5
���7UDQV
SRUWDWLRQ
5HJ
XODWLRQV
����
���
����

128
$SSHQGL[�,��7DEOH����E��6XPPDU\�RI�SROLFLHV�DQG�P
HDVXUHV��HIIHFWV�RQ�&+�HPLVVLRQV
�
1DP
H�RI
7\S
H�RI�LQVWUXPHQ
W2EMHFWLYH
�DQG�RU
6HF
WRU
6WDWXV�RI
(VWLP
DWH�RI�PLWLJDWLRQ�LP
SDF
W0RQLWRULQJ��LQWHUP
HGLDWH
SROLF
\�P
HDV
XUH
PHWKRG�RI�DF
KLHYLQJ
LPSOHPHQ
WDWLRQ
LQGLFDWRU�RI�SURJUHVV
UHGXFWLRQ��LQFOXGLQJ
�SODQQHG
��NLOR
WRQQHV
�&+��
GHVF
ULSWLRQ�RI�KRZ
LPSOHPHQ
WHG�
HIIHFWV�WDNH�SODFH
�OHJLVODWLRQ�SDV
VHG�RU
QRW��VWDWXV�RI
IXQGLQJ�
����
����
����
����
���2LO�SURG
XFWLRQ
9ROXQ
WDU\�&KD
OOHQJ
H���
����
���
���
��
�5HJ
LVWU\��9&5�
SURJ
UDP
���1DWXUDO�JDV
9&5�
�����
���
���
����
SURG
XFWLRQ�
���3LSHOLQHV
9&5�
�����
���
���
����
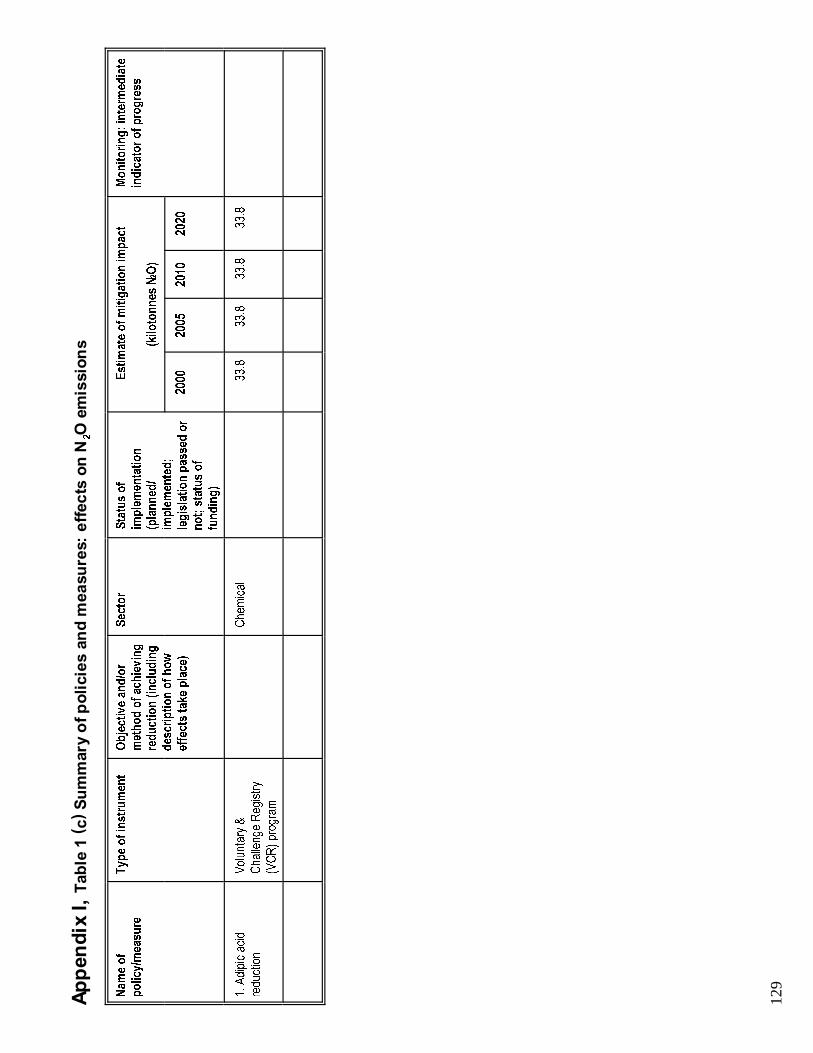
129
$SSHQGL[�,��7DEOH����F��6XPPDU\�RI�SROLFLHV�DQG�P
HDVXUHV��HIIHFWV�RQ�1
2�HPLVVLRQV
�
1DP
H�RI
7\S
H�RI�LQVWUXPHQ
W2EMHFWLYH
�DQG�RU
6HF
WRU
6WDWXV�RI
(VWLP
DWH�RI�PLWLJDWLRQ�LP
SDF
W0RQLWRULQJ��LQWHUP
HGLDWH
SROLF
\�P
HDV
XUH
PHWKRG�RI�DF
KLHYLQJ
LPSOHPHQ
WDWLRQ
LQGLFDWRU�RI�SURJUHVV
UHGXFWLRQ��LQFOXGLQJ
�SODQQHG
��NLOR
WRQQHV
�1�2�
GHV
FULSWLRQ�RI�KRZ
LPSOHPHQ
WHG�
HIIHFWV�WDN
H�SODFH
�OHJLVODWLRQ�SDV
VHG�RU
QRW��VWDWXV�RI
IXQGLQJ�
����
����
����
����
���$GLSLF�DF
LG9ROXQ
WDU\�
&KH
PLFDO�
������
����
����
�����
UHGX
FWLRQ
&KD
OOHQJ
H�5HJ
LVWU\
�9&5��SURJ
UDP

$SSHQGL[�,�7DEOH����D���6XPPDU\�RI�SURMHFWLRQV�RI�DQWKURSRJHQLF�JUHHQKRXVH�JDV�HPLVVLRQV
(PLVVLRQV�RI�*+*V�LQ�&2
��(TXLYDOHQW��WHUDJUDPV�
����
����
����
����
����
����
)XH
O�FRP
EXVWLRQ��HQH
UJ\�DQ
G�WUDQ
VIRUPDWLRQ�LQGX
VWULH
V���
���
���
���
���
���
)XH
O�FRP
EXVWLRQ��LQ
GXVWU\
��
��
��
��
��
���
)XH
O�FRP
EXVWLRQ��WUDQV
SRUW
���
���
���
���
���
���
)XH
O�FRP
EXVWLRQ��RWKHU
��
��
��
��
��
��
2WKHU
���
���
���
���
���
���
7RWDO
���
���
���
���
���
���
13
0
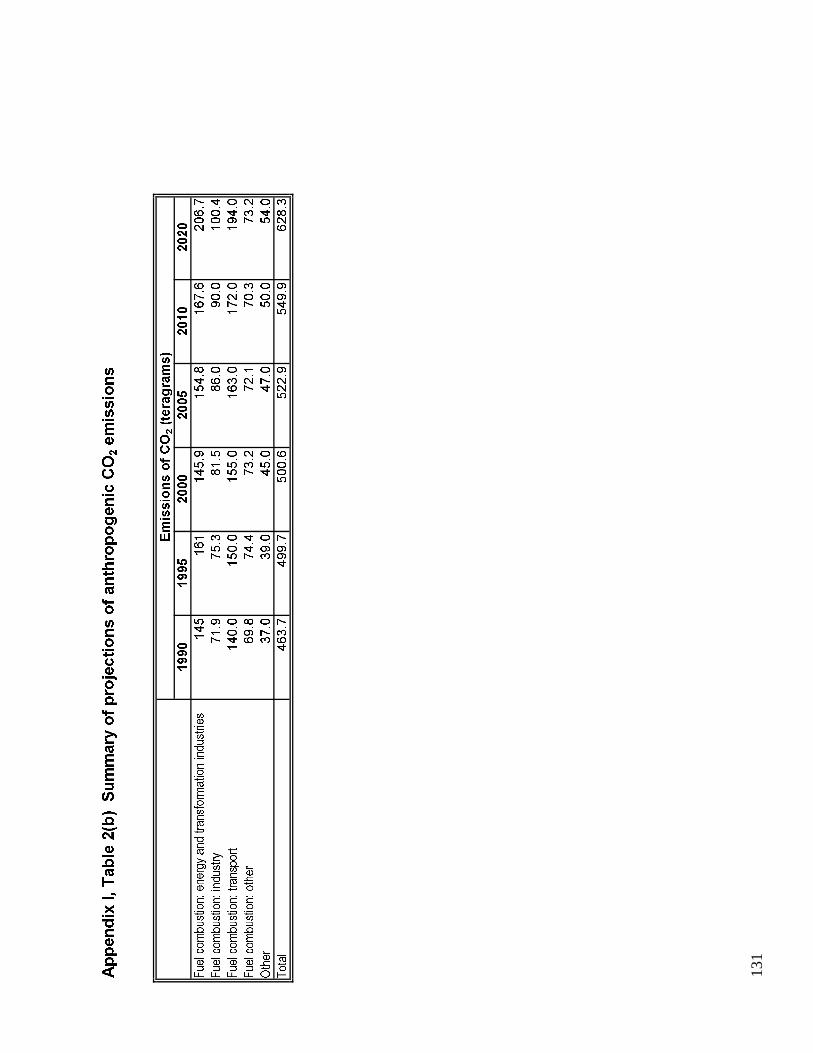
$SSHQGL[�,��7DEOH���E���6XPPDU\�RI�SURMHFWLRQV�RI�DQWKURSRJHQLF�&2
��HPLVVLRQV�
(PLVVLRQV�RI�&2
���WHUDJUDPV�
����
����
����
����
����
����
)XH
O�FRPEX
VWLRQ��HQH
UJ\�DQG
�WUDQV
IRUP
DWLRQ�LQ
GXVWULH
V���
���
�����
�����
�����
�����
)XH
O�FRP
EXV
WLRQ��LQGX
VWU\
����
����
����
����
����
�����
)XH
O�FRPEX
VWLRQ��WUDQV
SRUW
�����
�����
�����
�����
�����
�����
)XH
O�FRP
EXVWLRQ��RWKHU
����
����
����
����
����
����
2WKHU
����
����
����
����
����
����
7RWDO
�����
�����
�����
�����
�����
�����
13
1

$SSHQGL[�,��7DEOH����6XPPDU\�RI�SURMHFWLRQV�RI�UHPRYDOV�RI�&2
��E\�VLQNV
&2
��UHPRYDO�E\�VLQNV��PHJDWRQQHV�
����
����
����
����
����
����
$JULFXOWXUDO�VRLOV
������
������
�����
�����
�����
1$
/DQG�XVH�FKDQJH�DQG�IRUHVWU\
1$
1$
1$
1$
1$
1$
2WKHU
1$
1$
1$
1$
1$
1$
7RWDO�UHPRYDOV
1$
1$
1$
1$
1$
1$
1$� �QRW�DYDLODEOH
13
2

$SSHQGL[�,��7DEOH����6XPPDU\�RI�SURMHFWLRQV�RI�DQWKURSRJHQLF�&+
��HPLVVLRQV�
(PLVVLRQV�RI�&+���JLJDJUDPV�
����
����
����
����
����
����
)XH
O�FRP
EXVWLRQ
��
��
��
��
��
��
)XJ
LWLYH�HPLVVLRQV�IURP�IXHO�SURGXFWLR
Q�����
�����
�����
�����
�����
�����
,QGXVWULDO�S
URFHVVHV
��
��
��
(QWHULF�IHUP
HQWDWLR
Q���
���
���
���
�����
�����
$QLPDO�Z
DVWHV
���
���
���
���
���
���
5LFH�FXOWLYDWLR
Q�
��
��
�
:DVWH��ODQG
ILOOV�DQG
�ZDVWHZDWHU
���
���
���
���
���
�����
2WKHU��FRPSRVWLQ
J�DQG�PXQ
LFLSDO�VROLG�ZDVWH
��
��
��
7RWDO
�����
�����
�����
�����
�����
�����
13
3
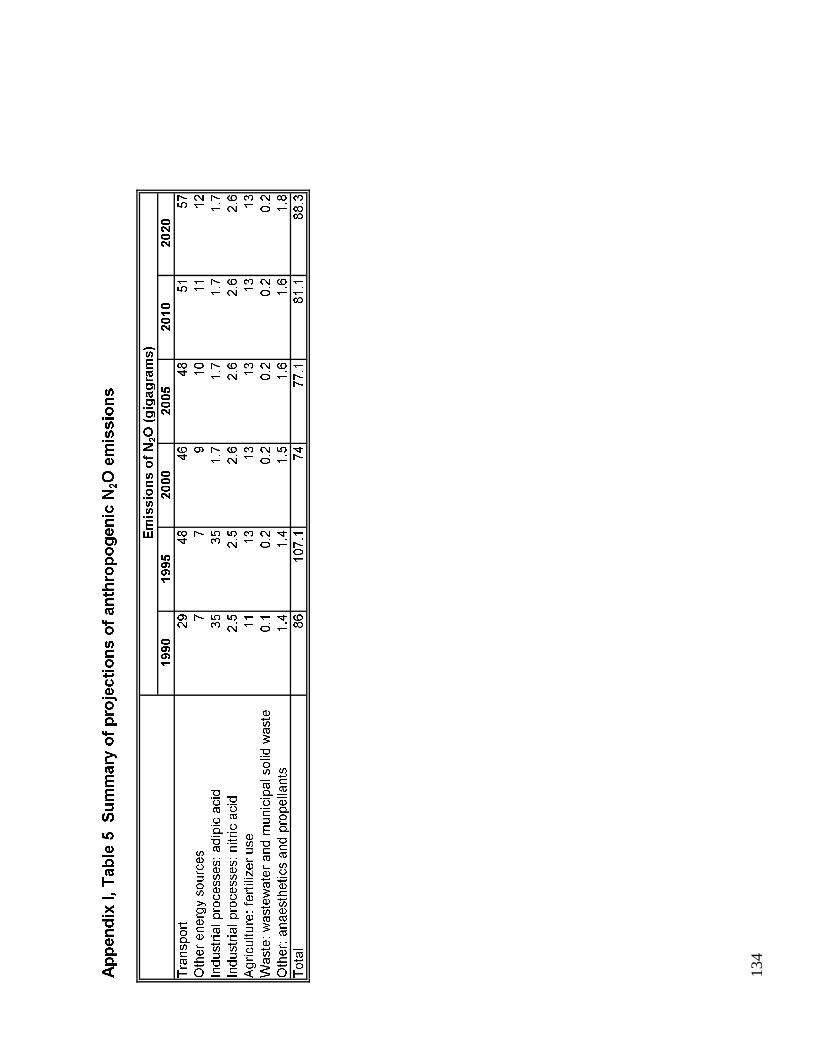
$SSHQGL[�,��7DEOH����6XPPDU\�RI�SURMHFWLRQV�RI�DQWKURSRJHQLF�1
�2�HPLVVLRQV�
(PLVVLRQV�RI�1�2��JLJDJUDPV�
����
����
����
����
����
����
7UDQVSRUW
��
��
��
��
��
��
2WKHU�HQHUJ\�VRXUFHV
��
���
��
��
,QGXVWULDO�SURFHVVHV��DGLSLF�DFLG
��
��
���
���
���
���
,QGXVWULDO�SURFHVVHV��QLWULF�DFLG
���
���
���
���
���
���
$JULFXOWXUH��IHUWLOL]HU�XVH
��
��
��
��
��
��
:DVWH��ZDVWHZDWHU�DQG�P
XQLFLSDO�VROLG�ZDVWH
���
���
���
���
���
���
2WKHU��DQDHVWKHWLFV�DQG�SURSHOODQWV
���
���
���
���
���
���
7RWDO
��
�����
��
����
����
����
13
4

$SSHQGL[�,��7DEOH����6XPPDU\�RI�SURMHFWLRQV�RI�DQWKURSRJHQLF�
HPLVVLRQV�RI�RWKHU�JUHHQKRXVH�JDVHV
(PLVVLRQV�RI�RWKHU�JUHHQKRXVH�JDVHV��JLJDJUDPV�
���� ���� ���� ���� ���� ����
6)� ��� ���� ���� ���� ���� ����
+)&V��&2��(TXLYDOHQW� 1$ ��� ����� ����� ����� ������
3)&V��
�����&)� � � � � � �
�����&�)� ���� ���� ��� ��� ��� ���
2WKHU 1$ 1$ 1$ 1$ 1$ 1$
1$� �QRW�DYDLODEOH�RU�QRW�DSSOLFDEOH�
135

$SSHQGL[�,��7DEOH����6XPPDU\�RI�SURMHFWLRQV�RI�DQWKURSRJHQLF�
HPLVVLRQV�RI�SUHFXUVRUV�DQG�62[
(PLVVLRQV�RI�SUHFXUVRUV�DQG�62[���JLJDJUDPV�
���� ���� ���� ���� ���� ����
&2 ������ ����� ������ ������ ������ ������
12[ ����� ����� ����� ����� ����� 1$
1092&V ����� ����� ����� ����� ����� 1$
62[ ����� ����� ����� ����� ����� 1$
1$� �QRW�DYDLODEOH�RU�QRW�DSSOLFDEOH
6RXUFH��3ROOXWLRQ�'DWD�%UDQFK��(QYLURQPHQW�&DQDGD�
���

$SSHQGL[�,��7DEOH����6XPPDU\�RI�NH\�YDULDEOHV�DQG�DVVXPSWLRQV
LQ�WKH�SURMHFWLRQV�DQDO\VLV
����
����
����
����
����
����
:RUOG�FRDO�SULFHV��86��WRQ�
��������$OEHUWD
���
���
���
���
���
���
��������2QWDULR
��
��
��
��
��
��
:RUOG�RLO�SULFHV��86��WRQ�����:7,�DW�&XVKLQJ
���
���
���
���
���
���
'RP
HVWLF�HQHUJ\�SULFHV��E\�IXHO�W\SH�DQG�IRU�HOHFWULFLW\�
(OHFWULFLW\���N:K
��������5HVLGHQWLDO
���
���
���
���
����
��
��������&RP
PHUFLDO
���
���
���
���
���
���
��������,QGXVWULDO
���
���
���
���
���
���
1DWXUDO�JDV���*-
��������5HVLGHQWLDO
���
���
����
���
���
��������&RP
PHUFLDO
����
���
���
���
���
��������,QGXVWULDO
���
���
���
���
���
���
/)2���/
��������5HVLGHQWLDO
����
����
����
����
����
����
��������&RP
PHUFLDO
����
����
����
����
��
��
+)2���/���,QGXVWULDO
����
����
����
����
��
����
*DVROLQH���/���7UDQVSRUWDWLRQ
����
����
����
����
��
����
'LHVHO�IXHO���/���7UDQVSRUWDWLRQ
����
��
����
��
����
����
*'3��GRPHVWLF�FXUUHQF\���ELOOLRQV�������
�����
�����
�����
�����
�����
�����
3RSXODWLRQ��PLOOLRQV�
����
����
��
����
����
����
1HZ�YHKLFOH�HIILFLHQF\��E\�YHKLFOH�W\SH���/�����NP�
���
���
���
���
����
$YHUDJH�YHKLFOH�NP
�WUDYHOOHG
������
������
������
������
������
������
3ULP
DU\�HQHUJ\�GHP
DQG��3-�
�����
������
������
������
������
������
,QGH[�RI�PDQXIDFWXULQJ�SURGXFWLRQ�����������
1$
1$
1$
1$
1$
1$
,QGXVWULDO�SURGXFWLRQ��ELOOLRQV�������
���
���
���
���
���
���
2WKHU
1$
1$
1$
1$
1$
1$
1$� �QRW�DYDLODEOH�RU�QRW�DSSOLFDEOH
:7,� �:
HVW�7H[DV�,QWHUPHGLDWH
/)2� �/LJKW�IXHO�RLO
+)2� �+HDY\�IXHO�RLO
13
7

���
$SSHQGL[�,� 7DEOH����)LQDQFLDO�FRQWULEXWLRQV�WR�WKH�RSHUDWLQJ�HQWLW\�RU�HQWLWLHV�RI�WKH�ILQDQFLDO
PHFKDQLVP��UHJLRQDO�DQG�RWKHU�PXOWLODWHUDO�LQVWLWXWLRQV�DQG�SURJUDPV
&RQWULEXWLRQV
�PLOOLRQV�RI�&GQ�GROODUV�D
������� ������� ������� �������
*OREDO�(QYLURQPHQW�)DFLOLW\ 1$ �������RYHU���\HDUV�
0XOWLODWHUDO�LQVWLWXWLRQV
:RUOG�%DQN��,'$�,%5'����,0) ������ ������ ������ 1$
,QWHUQDWLRQDO�)LQDQFH�&RUSRUDWLRQ ���� ����� ���� 1$
$IULFDQ�'HYHORSPHQW�%DQN ������ 1$ 1$ 1$
$VLDQ�'HYHORSPHQW�%DQN ����� ����� ���� 1$
&DULEEHDQ�'HYHORSPHQW�%DQN ���� ���� ���� 1$
,QWHU�$PHULFDQ�'HYHORSPHQW�%DQN ����� ����� ����� 1$
8QLWHG�1DWLRQV�'HYHORSPHQW3URJUDP ���� 1$ 1$ 1$
8QLWHG�1DWLRQV�(QYLURQPHQW3URJUDP ��� ��� ��� ���
8QLWHG�1DWLRQV�)&&&���&RUH%XGJHW 1$ 1$ ������ �����
8QLWHG�1DWLRQV�)&&&���7UXVW�)XQGIRU�WKH�1HJRWLDWLQJ�3URFHVV 1$ ����� ������� 1$
8QLWHG�1DWLRQV�)&&&���6SHFLDO9ROXQWDU\�)XQG�IRU�3DUWLFLSDWLRQ 1$ ����� ����� 1$
0XOWLODWHUDO�6FLHQWLILF�3URJUDPV
,3&& ����� ����� ����� �����
:02 ����� ����� ����� �����
,$, ����� ����� ����� ����
67$57 1$ 1$ ����� 1$
D
� $PRXQWV�LQ�WKLV�WDEOH�UHSUHVHQW�WKH�RYHUDOO�&DQDGLDQ�FRQWULEXWLRQV�WR�WKHVH�LQVWLWXWLRQV�'LVEXUVHPHQW�FRUUHVSRQG�WR�ILQDQFLDO�\HDU���$SULO��
VW
�¤�0DUFK���VW
�1$� �QRQ�DYDLODEOH�RU�QRQ�DSSOLFDEOH,0)���,QWHUQDWLRQDO�0RQHWDU\�)XQG,'$���,QWHUQDWLRQDO�'HYHORSPHQW�$VVRFLDWLRQ,%5'���,QWHUQDWLRQDO�%DQN�IRU�5HFRQVWUXFWLRQ�DQG�'HYHORSPHQW,3&&���,QWHUJRYHUQPHQWDO�3DQHO�RQ�&OLPDWH�&KDQJH:02���:RUOG�0HWHRURORJLFDO�2UJDQL]DWLRQ,$,���,QWHU�$PHULFDQ�,QVWLWXWH�IRU�*OREDO�&KDQJH�5HVHDUFK67$57���*OREDO�&KDQJH�6\VWHP�IRU�$QDO\VLV��5HVHDUFK�DQG�7UDLQLQJ
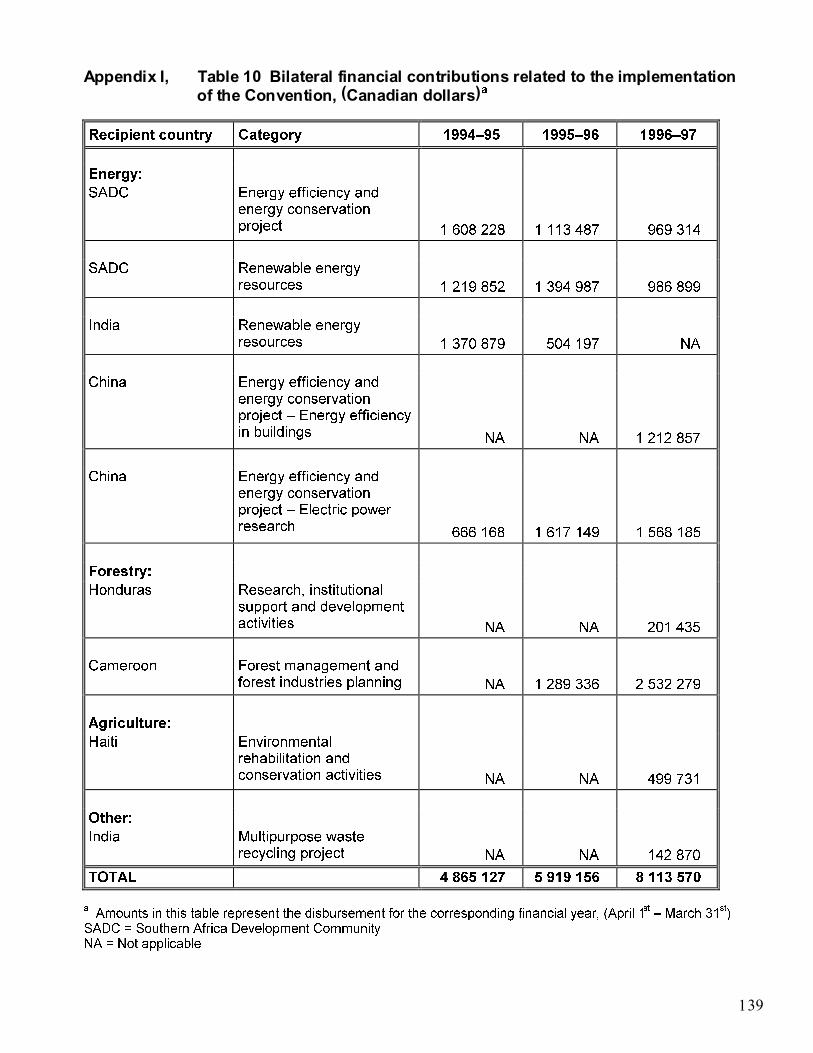
���
$SSHQGL[�,��� 7DEOH�����%LODWHUDO�ILQDQFLDO�FRQWULEXWLRQV�UHODWHG�WR�WKH�LPSOHPHQWDWLRQ�
RI�WKH�&RQYHQWLRQ���&DQDGLDQ�GROODUV�D
5HFLSLHQW�FRXQWU\ &DWHJRU\ ����¤�� ����¤�� ����¤��
(QHUJ\�
6$'& (QHUJ\�HIILFLHQF\�DQGHQHUJ\�FRQVHUYDWLRQSURMHFW ��������� ��������� �������
6$'& 5HQHZDEOH�HQHUJ\UHVRXUFHV ��������� ��������� �������
,QGLD 5HQHZDEOH�HQHUJ\UHVRXUFHV ��������� ������� 1$
&KLQD (QHUJ\�HIILFLHQF\�DQGHQHUJ\�FRQVHUYDWLRQSURMHFW�¤�(QHUJ\�HIILFLHQF\LQ�EXLOGLQJV 1$ 1$ ���������
&KLQD (QHUJ\�HIILFLHQF\�DQGHQHUJ\�FRQVHUYDWLRQSURMHFW�¤�(OHFWULF�SRZHUUHVHDUFK ������� ��������� ���������
)RUHVWU\�
+RQGXUDV 5HVHDUFK��LQVWLWXWLRQDOVXSSRUW�DQG�GHYHORSPHQWDFWLYLWLHV 1$ 1$ �������
&DPHURRQ )RUHVW�PDQDJHPHQW�DQGIRUHVW�LQGXVWULHV�SODQQLQJ 1$ ��������� ���������
$JULFXOWXUH�
+DLWL (QYLURQPHQWDOUHKDELOLWDWLRQ�DQGFRQVHUYDWLRQ�DFWLYLWLHV 1$ 1$ �������
2WKHU�
,QGLD 0XOWLSXUSRVH�ZDVWHUHF\FOLQJ�SURMHFW 1$ 1$ �������
727$/ ��������� ��������� ���������
D
$PRXQWV�LQ�WKLV�WDEOH�UHSUHVHQW�WKH�GLVEXUVHPHQW�IRU�WKH�FRUUHVSRQGLQJ�ILQDQFLDO�\HDU���$SULO��VW
�¤�0DUFK���VW
�6$'&� �6RXWKHUQ�$IULFD�'HYHORSPHQW�&RPPXQLW\1$� �1RW�DSSOLFDEOH

���
$SSHQGL[�,����7DEOH�����D���3URMHFWV�RU�SURJUDPV�WKDW�SURPRWH��IDFLOLWDWH�DQG�RU�ILQDQFH�WUDQVIHU
RI�RU�DFFHVV�WR��KDUG��DQG��VRIW��WHFKQRORJLHV
3URMHFW���SURJUDP�WLWOH��(QHUJ\�(IILFLHQF\�LQ�%XLOGLQJV
3XUSRVH��7R�DVVLVW�WKH�&KLQHVH�0LQLVWU\�RI�&RQVWUXFWLRQ�WR��D��3UHSDUH�UHOHYDQW�SROLFLHV�UHJXODWLRQV��VWDQGDUGV�DQG�GHVLJQ�FULWHULD�IRU�HQHUJ\�HIILFLHQF\�LQ�EXLOGLQJV��E��6WUHQJWKHQ�LWVRUJDQLVDWLRQDO�FDSDFLW\�E\�SHUIHFWLQJ�D�&HQWUH�IRU�(QHUJ\�(IILFLHQF\�LQ�%XLOGLQJV��F��(VWDEOLVK�DFRPSUHKHQVLYH�PDQDJHPHQW�V\VWHP�DQG�LQFHQWLYH�SURJUDP�WR�HQFRXUDJH�HQHUJ\�FRQVHUYDWLRQ�DQG�G��$GDSW�DQG�GHPRQVWUDWH�DSSURSULDWH�HQHUJ\�HIILFLHQW�WHFKQRORJLHV�DQG�SURGXFWV�LQUHVLGHQWLDO�DQG�FRPPHUFLDO�EXLOGLQJV�LQ�PDMRU�FOLPDWLF�]RQHV�
5HFLSLHQW
FRXQWU\
6HFWRU 7RWDO�IXQGLQJ <HDUV�LQ
RSHUDWLRQ
'XUDWLRQ�RI�SURMHFW
&KLQD (QHUJ\ �������������&GQ�� � ����¤����
'HVFULSWLRQ��6LQFH�������&KLQD�KDV�HQWHUHG�D�SHULRG�RI�UDSLG�HFRQRPLF�JURZWK�DQG�ULVLQJLQFRPHV��'RPHVWLF�HQHUJ\�UHTXLUHG�IRU�KHDWLQJ��FRROLQJ�DQG�KRW�ZDWHU�LV�H[SHFWHG�WR�LQFUHDVHUDSLGO\�DV�WKH�GHPDQG�IRU�D�PRUH�FRPIRUWDEOH�HQYLURQPHQW�JURZV�ZLWK�WKH�HFRQRP\�DQG�WKHULVLQJ�VWDQGDUG�RI�OLYLQJ���7RWDO�HQHUJ\�FRQVXPSWLRQ�IRU�EXLOGLQJV�LV�H[SHFWHG�WR�JURZ�DW��SHUFHQW�SHU�\HDU��IDU�RXWVWULSSLQJ�HQHUJ\�SURGXFWLRQ��SODQQHG�DW�����SHUFHQW�SHU�\HDU���,Q�RUGHUWR�PHHW�LWV�JURZLQJ�HQHUJ\�GHPDQG�IRU�GRPHVWLF�HQHUJ\��&KLQD�ZDQWV�WR�LPSURYH�HQHUJ\HIILFLHQF\�LQ�EXLOGLQJV�ZLWKRXW�FRPSURPLVLQJ�WKH�HQHUJ\�QHHGV�RI�RWKHU�VHFWRUV���7KH�(QHUJ\(IILFLHQF\�LQ�%XLOGLQJV�SURMHFW�LV�IXOO\�FRQVLVWHQW�ZLWK�&,'$V�2'$�SULRULWLHV�RQ�HQYLURQPHQW�DQGLQIUDVWUXFWXUH�VHUYLFHV���,W�FOHDUO\�DOLJQV�ZLWK�WKH�HQYLURQPHQWDOO\�VXVWDLQDEOH�GHYHORSPHQWSDUDPHWHUV�RI�WKH�&KLQD�&RXQWU\�'HYHORSPHQW�3ROLF\�)UDPHZRUN���7KH�SURMHFW�ZLOO�SURPRWHHQYLURQPHQWDO�VXVWDLQDELOLW\�E\�HQKDQFLQJ�WKH�&KLQHVH�FDSDFLW\�WR�PDQDJH�HQHUJ\�UHTXLUHPHQWWKURXJK�WKH�XVH�RI�HQHUJ\�FRQVHUYDWLRQ�DQG�HIILFLHQW�WHFKQRORJLHV�DQG�SURGXFWV��ZKLFK�ZRXOGUHVXOW�LQ�D�UHGXFWLRQ�RI�JDV�HPLVVLRQ�IURP�FRDO�EXUQLQJ���7KH�SURMHFW�ZLOO�SURPRWH�FDSDFLW\EXLOGLQJ�DQG�HFRQRPLF�OLQNDJHV�DQG�SDUWQHUVKLS�EHWZHHQ�&DQDGLDQ�SULYDWH�VHFWRU�DQG�&KLQHVHSXEOLF�DQG�SULYDWH�VHFWRU�DV�ZHOO�DV�SURPRWLQJ�VRFLDO�ZHOIDUH�E\�SURYLGLQJ�EHWWHU�OLYLQJ�DQGZRUNLQJ�FRQGLWLRQV�
7KH�JRDO�LV�WR�HQKDQFH�WKH�*RYHUQPHQW�RI�&KLQDV�FDSDFLW\�WR�PDQDJH�LWV�HQYLURQPHQW�DQGLPSURYH�DWPRVSKHULF�TXDOLW\�E\�UHGXFLQJ�DLU�SROOXWLRQ�DQG�HQHUJ\�FRQVXPSWLRQ�LQ�UHVLGHQWLDO�DQGFRPPHUFLDO�EXLOGLQJV�WKURXJK�HQHUJ\�HIILFLHQW�WHFKQRORJLHV�
0LQLVWU\�RU�FRPSDQ\��FRQWDFW�SHUVRQ��DGGUHVV�DQG�SKRQH�QXPEHU���*RYHUQPHQW�RI&DQDGD�WKURXJK�WKH�&DQDGLDQ�,QWHUQDWLRQDO�'HYHORSPHQW�$JHQF\��&,'$������3URPHQDGH������GX�3RUWDJH��+XOO��4XpEHF��&DQDGD��.�$��*���&RQWDFW��-HDQ�6DERXULQ��&,'$��7HOHSKRQH�����������������
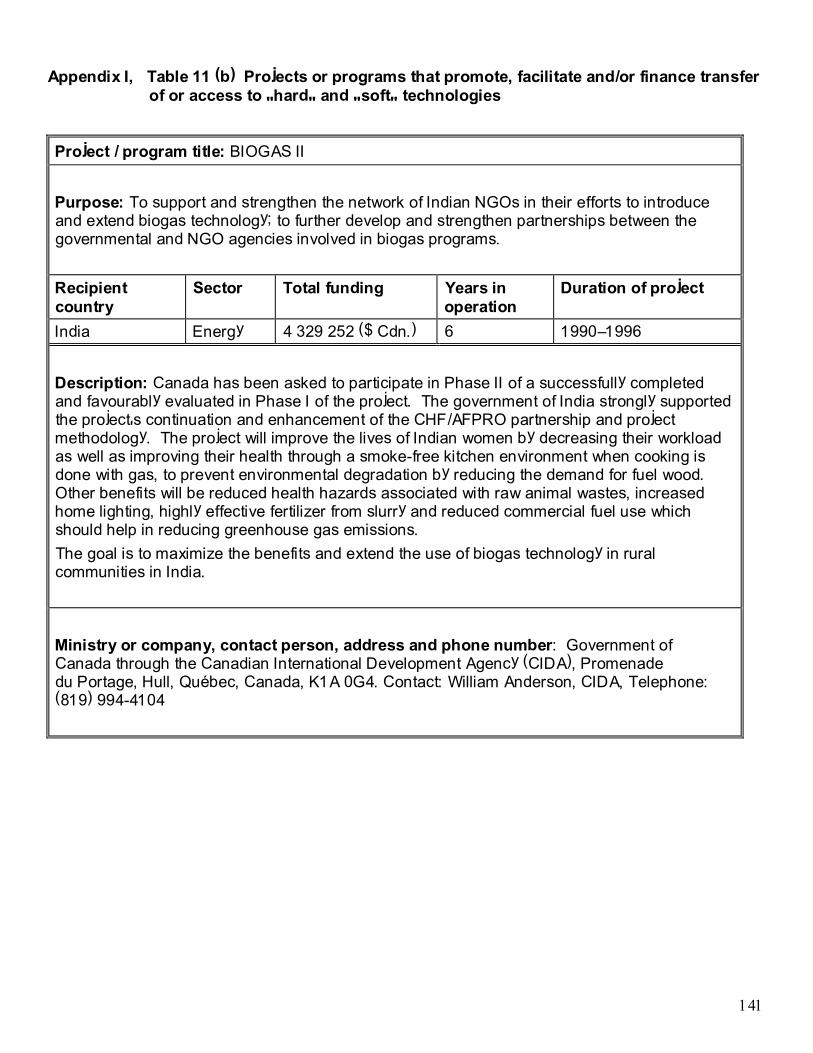
���
$SSHQGL[�,����7DEOH�����E���3URMHFWV�RU�SURJUDPV�WKDW�SURPRWH��IDFLOLWDWH�DQG�RU�ILQDQFH�WUDQVIHU
RI�RU�DFFHVV�WR��KDUG��DQG��VRIW��WHFKQRORJLHV
3URMHFW���SURJUDP�WLWOH��%,2*$6�,,
3XUSRVH��7R�VXSSRUW�DQG�VWUHQJWKHQ�WKH�QHWZRUN�RI�,QGLDQ�1*2V�LQ�WKHLU�HIIRUWV�WR�LQWURGXFHDQG�H[WHQG�ELRJDV�WHFKQRORJ\��WR�IXUWKHU�GHYHORS�DQG�VWUHQJWKHQ�SDUWQHUVKLSV�EHWZHHQ�WKHJRYHUQPHQWDO�DQG�1*2�DJHQFLHV�LQYROYHG�LQ�ELRJDV�SURJUDPV�
5HFLSLHQW
FRXQWU\
6HFWRU 7RWDO�IXQGLQJ <HDUV�LQ
RSHUDWLRQ
'XUDWLRQ�RI�SURMHFW
,QGLD (QHUJ\ �������������&GQ�� � ����¤����
'HVFULSWLRQ��&DQDGD�KDV�EHHQ�DVNHG�WR�SDUWLFLSDWH�LQ�3KDVH�,,�RI�D�VXFFHVVIXOO\�FRPSOHWHGDQG�IDYRXUDEO\�HYDOXDWHG�LQ�3KDVH�,�RI�WKH�SURMHFW���7KH�JRYHUQPHQW�RI�,QGLD�VWURQJO\�VXSSRUWHGWKH�SURMHFWV�FRQWLQXDWLRQ�DQG�HQKDQFHPHQW�RI�WKH�&+)�$)352�SDUWQHUVKLS�DQG�SURMHFWPHWKRGRORJ\���7KH�SURMHFW�ZLOO�LPSURYH�WKH�OLYHV�RI�,QGLDQ�ZRPHQ�E\�GHFUHDVLQJ�WKHLU�ZRUNORDGDV�ZHOO�DV�LPSURYLQJ�WKHLU�KHDOWK�WKURXJK�D�VPRNH�IUHH�NLWFKHQ�HQYLURQPHQW�ZKHQ�FRRNLQJ�LVGRQH�ZLWK�JDV��WR�SUHYHQW�HQYLURQPHQWDO�GHJUDGDWLRQ�E\�UHGXFLQJ�WKH�GHPDQG�IRU�IXHO�ZRRG��2WKHU�EHQHILWV�ZLOO�EH�UHGXFHG�KHDOWK�KD]DUGV�DVVRFLDWHG�ZLWK�UDZ�DQLPDO�ZDVWHV��LQFUHDVHGKRPH�OLJKWLQJ��KLJKO\�HIIHFWLYH�IHUWLOL]HU�IURP�VOXUU\�DQG�UHGXFHG�FRPPHUFLDO�IXHO�XVH�ZKLFKVKRXOG�KHOS�LQ�UHGXFLQJ�JUHHQKRXVH�JDV�HPLVVLRQV�
7KH�JRDO�LV�WR�PD[LPL]H�WKH�EHQHILWV�DQG�H[WHQG�WKH�XVH�RI�ELRJDV�WHFKQRORJ\�LQ�UXUDOFRPPXQLWLHV�LQ�,QGLD�
0LQLVWU\�RU�FRPSDQ\��FRQWDFW�SHUVRQ��DGGUHVV�DQG�SKRQH�QXPEHU���*RYHUQPHQW�RI&DQDGD�WKURXJK�WKH�&DQDGLDQ�,QWHUQDWLRQDO�'HYHORSPHQW�$JHQF\��&,'$���3URPHQDGH�����������GX�3RUWDJH��+XOO��4XpEHF��&DQDGD��.�$��*���&RQWDFW��:LOOLDP�$QGHUVRQ��&,'$��7HOHSKRQH���������������