canada’s bridge to global trade and...
TRANSCRIPT
A N N U A L R E P O R T 2 0 0 2
Canada’s Bridge to Global Trade and Investment
EDC_AR_text_E 4/3/03 11:43 AM Page 1

During 2002, revelations of corporatemalfeasance, just on the heels ofSeptember 11 (2001), heightened uncertainty associated with internationaltrade. EDC fulfilled a critical role, helping customers expand their financialcapacity, access relevant knowledge,identify opportunities and ventureinto global markets with confidence.
The following statistics represent a few highlights of EDC’s performance in 2002:
�$51.2 billion in exports and international investments using EDC solutions
�7,223 customers served
�648 large customers
�6,575 small and medium-sized customers
�$122 million net income
�$24.6 billion total assets
�$0 Parliamentary appropriation
�$95 million dividend to shareholder
�992 average employee strength
i C A N A D A ’ S B R I D G E T O G L O B A L T R A D E A N D I N V E S T M E N T
For almost six decades, EDC has served Canadian exporters and investors of allsizes, from all sectors of the economy, doing business in up to 200 marketsaround the world. We offer a full range of financial products and services,tailored to meet customers’ needs.
Canada’s Bridge to Global Trade and Investment
Overview
EDC_AR_text_E 4/3/03 11:43 AM Page 2

Medium- and Long-term Financial ServicesShort-term Financial Services
Agri-
Food
Auto
mot
ive
Aero
spac
e
Adva
nced
Tech
nolo
gies
Base
and
Sem
i-M
anuf
actu
red
Goo
dsCi
vil W
orks
and
Prof
essi
onal
Ser
vice
s
Fina
ncia
l Ins
titut
ions
Cons
umer
Goo
ds
Emer
ging
Exp
orte
rs
Fore
stry
Gro
und
Tran
spor
tatio
nan
d Sh
ipbu
ildin
g
Oil
and
Gas
Mac
hine
ry a
nd E
quip
men
t
Min
ing
and
Pow
er
Tele
com
mun
icat
ions
10,000
8,000
6,000
2,000
4,000
0
3,23
2 | 3
91
2,58
3 | 797
3 | 2
,813
698
| 738 150
| 2,6
32
592
| 0
55 |
2,00
1
925
| 380 24
9 | 2
,364
327
| 3,8
65
380
| 1,3
66
626
| 26
6,49
2 6
5
7,53
2 5
1 9,71
8
9
553
| 627
5,11
3 | 5
30
4,73
2 | 2
,010
1,02
2 | 2
,46123
,112
1
1,08
0
Afric
a/M
iddl
e Ea
st
Asia
/Pac
ific
Euro
pe
Nor
th A
mer
ica/
Carib
bean
*
Sout
h Am
eric
a/Ce
ntra
l Am
eric
a
40,000
30,000
20,000
10,000
0
* Includes Mexico
31,4
21
518
40,8
69
262
51,2
40
533
44,3
47
151
Canada AccountCorporate Account
36,2
22
314
60,000
50,000
40,000
30,000
20,000
10,000
0 1998 1999 2000 2001 2002
983
1,
009
983
81
5
983
1,
067
983
1,
094
983
69
7
Retained EarningsShare Capital
2,500
2,000
1,500
1,000
500
0 1998 1999 2000 2001 2002
5,08
1
59
8
4,55
0
6
32
5,72
0
6
35
6,57
5
64
8
3,66
4
51
9
LargeSmall/Medium
8,000
6,000
4,000
2,000
0 1998 1999 2000 2001 2002
1,21
9 | 5
3 5,49
8 | 1
98
4,56
4 | 2
,547
Atla
ntic
B.C.
/Yuk
on
Ont
ario
Prai
ries
Que
bec
12,4
54
8,91
4
10,7
97
4,9
96
25,000
20,000
15,000
5,000
10,000
0
2002 Corporate Account Highlights
Five-Year Review
ii C A N A D A ’ S B R I D G E T O G L O B A L T R A D E A N D I N V E S T M E N T
Business Volume by Industry Sector
($ in millions)
Business Volume by Geographic Market
($ in millions)
Business Volume
($ in millions)
Shareholder’s Equity
($ in millions)
Customers Served
Business Volume by Canadian Region
($ in millions)
EDC_AR_text_E 4/3/03 11:43 AM Page 3

iii C A N A D A ’ S B R I D G E T O G L O B A L T R A D E A N D I N V E S T M E N T
Helping small and medium-sized enterprises (SMEs) expand and grow their business in
international markets is a top priority for EDC. No company is too small to export, and no
exporter is too small for EDC. The Emerging Exporters (EE) Team, which signed 818 new
accounts receivable insurance customers in 2002, specializes in serving businesses with up
to $1 million in annual export sales. In total, the EE Team now accounts for more than 50
per cent of EDC’s direct customer base.
SMEs - 91%Large Exporters - 9%
4,55
0
3,66
4
5,08
1 5,72
0 6,57
5
7,000
6,000
5,000
3,000
4,000
1,000
2,000
0 19991998 2000 2001 2002
5.1 5.3
6.3
7.7
9.7
10
8
4
6
2
0 19991998 2000 2001 2002
89 91 90 89
84
66
Resp
onse
toCu
stom
er In
quiri
es
Prod
uct M
eets
Nee
ds
Reso
urce
fuln
ess
Tim
ely
Cred
it De
cisi
ons
Risk
App
etite
Pric
e
100
80
40
60
20
0
North America/Caribbean* - 78%Europe - 9%Asia/Pacific- 8%Middle East/Africa - 3%South America/Central America - 2%
* Includes Mexico
Short-term Insurance - 87%Contract Insurance and Bonding - 10%Financing - 2%Political Risk Insurance - 1%
Number of SMECustomers
Volume Support for SMEs
($ in billions)
SME Service Attribute Ratings
(%)
SME Volume byGeographic Market
SME Product UsageSMEs as a Percentage of EDC’s Customer Base
2002 Target % Achieved 2001
SME – Customers served count (direct and indirect) 6,575 6,050 109% 5,720
SME – Business volume ($ millions) 9,698 7,800 124% 7,670
Emerging Exporters (EE) – number of new customers 818 800 102% 743
EE – average credit approval turnaround time 2 days – – 2 days
SME Scorecard
EDC_AR_text_E 4/3/03 11:43 AM Page 4

i Canada’s Bridge to Global Trade and Investment
ii 2002 Corporate Account Highlights and Five-Year Review
iii SME Scorecard
2002 Corporate Review2 Message to the Shareholder9 Message from the Chairperson
10 Performance Against Objectives14 Capacity16 Knowledge18 Opportunity20 Confidence22 Milestones 2002
23 Message to Investors 24 Investor Relations25 Secure25 Experienced26 Debt Products26 Performance27 Liquidity27 Funding Program
28 Executive Management Team/Management Representatives
29 2002 Financial Review30 Management’s Discussion and Analysis54 Financial Reporting Responsibility55 Auditor’s Report56 Consolidated Financial Statements78 Five-Year Review
81 Board of Directors82 Corporate Governance Practices85 Committees of the Board of Directors
88 Code of Business Ethics
90 Glossary of Financial Terms
91 Corporate Offices
92 Vision and Values
Investor Relations
Contents
EDC_AR_text_E 4/3/03 11:43 AM Page 5
2 C A N A D A ’ S B R I D G E T O G L O B A L T R A D E A N D I N V E S T M E N T
Against a backdrop of continued
economic and financial marketuncertainty and geo-politicaltensions, EDC’s role as a steadfast
bridge to international successand competitiveness proved to be
more important than ever in 2002.
A. Ian GillespiePresident and Chief Executive Officer
Message to the Shareholder
EDC_AR_text_E 4/3/03 11:43 AM Page 6

E D C A N N U A L R E P O R T 2 0 0 2 3
The risks associated with international trade increased significantly post-September 11,2001. In 2002, a series of new concerns – particularly revelations of corporate malfea-sance – pushed uncertainty to a whole new level. For Canadian exporters, the falloutincluded border delays, higher insurance rates and renewed signs of trade protectionism,all of which translated into higher risks and costs.
Overall, Canadian companies experienced lower export sales in 2002. Despitethis decline, EDC carried out $51.2 billion in business volumes on behalf of Canadiancompanies during 2002, an increase of 16 per cent over the 2001 level of $44.3 billion.This is not entirely surprising, since Canadian companies engaged in internationaltrade had an increased stake in managing their trade risk in 2002, and they faced agreater need for financial intermediation.
EDC business volumes in 2002 were equivalent to 11 per cent of total Canadianexports of goods and services -- up from 9.4 per cent in 2001. The increase comesfrom the fact that while overall Canadian exports were down in 2002, EDC volumescontinued to grow.
In keeping with our mandate to facilitate Canada’s trade and investment agenda,EDC continued to serve Canadian exporters and investors of all sizes and from all sectorsof the economy by helping to expand financial capacity, access relevant knowledge,identify opportunities and venture into global markets with confidence.
We served 7,223 customers in 2002, doing business in 182 countries and territories.A majority of the Canadian companies using our services were small and medium-sizedcompanies (SMEs). We worked with 6,575 SMEs, an increase of 855 new SME customersover the previous year. The total volume of SME transactions amounted to $9.7 billion,an increase of $2 billion over SME business volumes in 2001.
Canada’s Bridge to Global Trade and Investment
EDC_AR_text_E 4/3/03 11:43 AM Page 7
4 C A N A D A ’ S B R I D G E T O G L O B A L T R A D E A N D I N V E S T M E N T
Building CapacityWhile exporter needs vary depending on their size and industry sector, EDC remainsfocused on finding ways to build capacity for Canadian companies across the board.
Today, global competitiveness increasingly hinges on being able to participate in global supply chains. For larger customers, this often means having the capacity to establish manufacturing facilities abroad, and to merge, create alliances, enterpartnerships or participate in joint ventures. In some cases, the majority of contentof a particular export may be produced outside of Canada, but we will facilitate atransaction as long as there are sufficient Canadian benefits associated with it.
Over the years, EDC’s Canadian benefits policy has evolved to keep pace with theway international trade is conducted in an increasingly globalized environment.Canadian benefits are not defined exclusively in terms of Canadian content. Today,other benefits such as future trade creation, R&D investment, higher-quality jobs inCanada, sub-supply for smaller Canadian firms and the maintenance of internationalmarket share are more important than ever.
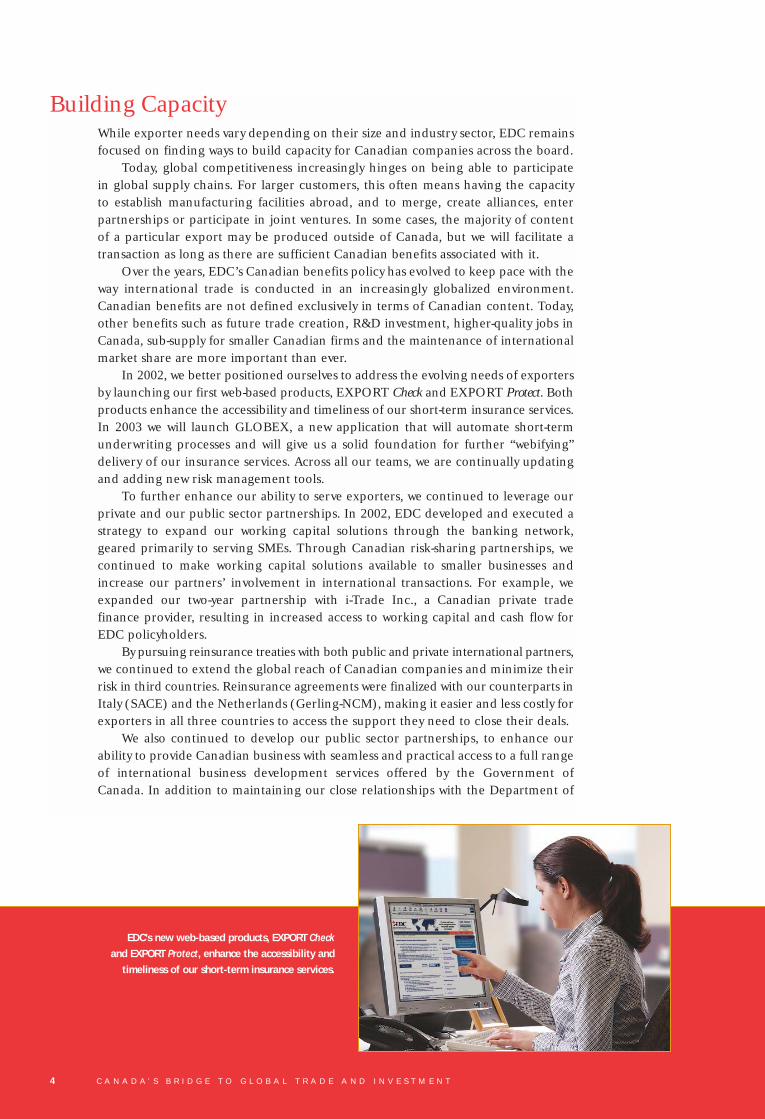
In 2002, we better positioned ourselves to address the evolving needs of exportersby launching our first web-based products, EXPORT Check and EXPORT Protect. Bothproducts enhance the accessibility and timeliness of our short-term insurance services.In 2003 we will launch GLOBEX, a new application that will automate short-termunderwriting processes and will give us a solid foundation for further “webifying”delivery of our insurance services. Across all our teams, we are continually updatingand adding new risk management tools.
To further enhance our ability to serve exporters, we continued to leverage ourprivate and our public sector partnerships. In 2002, EDC developed and executed astrategy to expand our working capital solutions through the banking network,geared primarily to serving SMEs. Through Canadian risk-sharing partnerships, wecontinued to make working capital solutions available to smaller businesses andincrease our partners’ involvement in international transactions. For example, weexpanded our two-year partnership with i-Trade Inc., a Canadian private tradefinance provider, resulting in increased access to working capital and cash flow forEDC policyholders.
By pursuing reinsurance treaties with both public and private international partners,we continued to extend the global reach of Canadian companies and minimize theirrisk in third countries. Reinsurance agreements were finalized with our counterparts inItaly (SACE) and the Netherlands (Gerling-NCM), making it easier and less costly forexporters in all three countries to access the support they need to close their deals.
We also continued to develop our public sector partnerships, to enhance ourability to provide Canadian business with seamless and practical access to a full rangeof international business development services offered by the Government ofCanada. In addition to maintaining our close relationships with the Department of
EDC’s new web-based products, EXPORT Check
and EXPORT Protect, enhance the accessibility and
timeliness of our short-term insurance services.
EDC_AR_text_E 4/3/03 11:43 AM Page 8

E D C A N N U A L R E P O R T 2 0 0 2 5
Foreign Affairs and International Trade, Department of Finance, Industry Canada,other financial Crown corporations and provincial and municipal governmentsengaged in trade advisory or business development activities, we became an ExecutiveMember of Team Canada Inc.
Knowledge sharingIn today’s increasingly integrated global economy, rapidly changing economic, marketand political conditions generate an endless stream of data and opinion that can challengethe knowledge resources of even the largest of corporations. EDC is a recognized centreof international trade finance expertise, offering the knowledge capacity that ourcustomers need to manage uncertainty and risk in global markets.
From a geographic standpoint, our economists continued to offer customizedpolitical risk and investment assessment services that gave our customers real andmeaningful insight on specific countries and sectors. Our semi-annual Let’s Talk RiskWorkshops and Executive Roundtables were delivered in 16 major cities across Canada,complemented by national distribution of our Global Export Forecast and Trade ConfidenceIndex. These, plus our new EXPORT Market Insight service, were central to our efforts topackage our information in formats that are relevant, useful and timely for our customers.
In addition, EDC’s sector-based approach to serving customers helps us continueto build in-depth knowledge. This enables us to anticipate emerging customer needs,so that we are better able to provide customized solutions and facilitate their efforts todo more business in more markets. Furthermore, it provides us with the insight we needto identify potential opportunities and bridge gaps in the current export landscape.
For example, EDC identified the environmental sector as having growth potential,and responded by launching its EnviroExport Initiative about four years ago. Today, weplay a key role in expanding exports of Canadian environmental goods, technologiesand services for some 200 customers. Last year alone, EDC’s trade finance and riskmanagement services facilitated about $500 million in environmental industryexports and investments.
In other non-traditional export sectors, such as culture, we also expanded oursupport. The added dimension to EDC’s promotion of culture is the opportunity toshowcase a key national strength. Canada’s culture helps define us as a nation and,in the face of today’s often homogenizing forces of globalization, we must use everyopportunity to demonstrate our nation’s unique attributes. In fact, EDC took ahands-on approach to promoting Canadian culture in 2002, becoming the presentingsponsor of the Tom Thomson Exhibition at the National Gallery of Canada. In 2003,we will further enhance our support for Canadian culture by becoming the presentingsponsor for the National Arts Centre Orchestra’s fall tour of 10 cities in the UnitedStates and Mexico, which coincides with the tenth anniversary of the North AmericanFree Trade Agreement (NAFTA).
Ian Gillespie in conversation with
Alexandre Dubé, one of EDC’s 21
Education and Youth Employment
(EYE) scholarship winners.
EDC_AR_text_E 4/3/03 11:43 AM Page 9

6 C A N A D A ’ S B R I D G E T O G L O B A L T R A D E A N D I N V E S T M E N T
In addition to seeking new ways to serve current exporters in 2002, EDC continuedto foster the development of an export culture in Canada through education. Thisentailed a wide range of sponsorship and outreach activities, with special emphasison providing learning and employment opportunities for youth. Last year, weexpanded our university partnership program, increasing the number of partners to25 (up from 18) and offering 21 international studies scholarships.
Seeking OpportunitiesA central component of EDC’s public policy mandate is our commitment to better assistCanadian companies doing business in higher risk developing markets, where financialintermediation is less prevalent but where significant export growth potential exists.
In 2002, we strengthened EDC’s foreign market expertise by establishing permanentrepresentation in Warsaw (Poland), and placing a second representative in Mexico –this time in Monterrey. EDC’s business volumes for Canadian firms selling to orinvesting in the Mexican market have almost doubled (from $1.2 billion in 1999 to$2.3 billion in 2002) since we established our first representation in Mexico City in1999 to build on opportunities created by NAFTA.
These two new additions enhance our existing complement of representatives inBeijing (China), Sâo Paulo (Brazil) and Mexico City (Mexico). All are strategically placedto access several economies rich in opportunities for Canadians. In-market presence helpsus develop firsthand, competitive intelligence, and identify opportunities for Canadianbusiness. Plans are underway to place representatives in additional markets in 2003.
An important aspect of our developing market strategy lies in working directlywith Canadian companies to back their international marketing activities. In 2002, wetook part in five federal trade missions including two Team Canada excursions toGermany and Russia, and missions with the Minister for International Trade to Africa,India and Mexico. EDC also sponsored and participated in many market developmentactivities that included additional trade missions and exporter outreach roundtables.
In 2002, EDC facilitated more than $9.9 billion of business in 152 developingmarkets. This represents a downward turn in EDC business volumes in higher riskmarkets compared to 2001 figures, which was consistent with the downturn in globaldemand. However, the number of customers using EDC services to expand their businessin developing markets has risen steadily, reaching 1,370 last year (up from 1,278 in 2001).In 2003, we will continue our efforts to find new opportunities and partnerships inthese markets.
All of these activities rely on the strength of our balance sheet, which in turn requiresthat we manage portfolio risk. We must diversify our exposures geographically and acrossindustry sectors, while at the same time responding to specific needs within theCanadian economy. In 2002, two key sectors faced highly unusual economic conditions:aerospace and telecommunications. EDChas an established record of providingservices to Canadian exporters in boththe aerospace and telecommunicationssectors, and last year we continued to
In 2002, EDC established permanent
representation in Warsaw (Poland) and placed
a second representative in Mexico, for a
total of five international representatives.
EDC_AR_text_E 4/3/03 11:43 AM Page 10

E D C A N N U A L R E P O R T 2 0 0 2 7
deliver the trade finance services exporters needed, while managing the associatedrisks. Consistent with other financial institutions, EDC provisions against possiblefuture loan losses and insurance claims by setting aside both specific and generalallowances from its net income.
EDC’s net income in 2002 was $122 million, an increase from $58 million theprevious year. The increase reflected income of $96 million as a result of the federalgovernment reimbursing EDC for an amount equal to debt relief granted by theGovernment of Canada to poor countries for debts incurred with EDC in prior years.Lower cost of funds also contributed to the increase in net income. The impact ofthese factors was partially offset by increased provisions for credit losses required dueto credit deterioration. Also during 2002, at the request of the federal government,EDC paid a dividend of $95 million.
Maintaining a healthy balance sheet in 2002 has positioned us to live up to ourcommitment of ensuring there is substantial and growing capacity in Canada’s financialsystem to meet the trade and investment finance needs of Canadian businesses.
ConfidenceEDC takes great pride in our reputation for sustainability and integrity, particularlyin today’s increasingly challenging global trade environment. An area that has alwaysbeen an important priority, and is increasingly brought under scrutiny in this post-Enronenvironment, is business ethics. EDC has implemented a series of fundamental practicesdesigned to ensure that we conduct our business based on a high standard of businessethics. Anti-corruption declarations, and the review of environmental and social impacts,have become integral to our processes when analyzing finance and insurance transactions.
Since its establishment in the fall of 2001, EDC’s Advisory Council on CorporateSocial Responsibility has provided a regular forum for the review of emerging nationaland international standards for both the public and private sector and our own businesspractices. The Advisory Council meets semi-annually and is an important pillar ofEDC’s overall stakeholder engagement strategy. EDC has taken significant steps to ensurethat it obtains views from other stakeholders, including non-government organizations.
In 2002, EDC appointed its first Compliance Officer, to provide additional publicaccountability. The Compliance Officer’s role included establishing a complianceprogram for matters related to EDC’s disclosure policy, environmental review directive,and anti-corruption practices.
From a policy perspective, in 2002 we updated EDC’s environmental review pro-cedures to ensure that the transactions we facilitate will comply with the requirementsof the Environmental Review Directive, which was made part of the Export DevelopmentAct when it was amended in 2001. As part of this initiative, we strengthened our team ofenvironmental specialists who review transactions being considered for EDC supportand work with international organizations to advance the environmental and socialrequirements of projects in which Canadian suppliers may have an interest.
The review of environmental and
social impacts has become integral
to EDC processes when analyzing
finance and insurance transactions.
EDC_AR_text_E 4/3/03 11:43 AM Page 11

8 C A N A D A ’ S B R I D G E T O G L O B A L T R A D E A N D I N V E S T M E N T
Since our introduction of a new disclosure policy in October 2001, as a means ofproviding greater public transparency on our operations, our web site has become arich source of information about our aggregate business as well as about specifictransactions. I am pleased that our customers have fully endorsed this approach,enabling us to achieve 100 per cent compliance from customers asked to consent tothe public release of this information.
In addition to continuing to evolve and strengthen our own environmentalreview and disclosure procedures, we actively engage in discussions with export credit agencies in other countries. We seek to encourage greater transparency onproject-related environmental information around the globe, and to ensure Canadianexporters, as leaders in these areas, are not put at a competitive disadvantage by Canada’sheightened requirements.
We provide clear direction with regard to the ethical standards applied to EDCbusiness activities – to employees, customers and stakeholders – via our own Code of Conduct and Code of Business Ethics. EDC has also adhered to international anti-corruption initiatives such as the 1997 Action Statement by OECD export creditagencies, and to Canada’s anti-corruption legislation, The Corruption of Foreign PublicOfficials Act. To ensure effective implementation of these new obligations, we havetrained staff, updated documentation and enhanced monitoring systems. We haveinformed our customers of requirements related to anti-corruption and have heldworkshops across Canada to encourage our customers to develop best practices in thisarea. In 2002, we also took steps to ensure our business practices conform with Canada’sobligations under the United Nations Security Council Resolution against terrorism.
Bridge to Global MarketsThe people of EDC are dedicated to helping Canadian companies build bridges toglobal markets – working with them to find financial solutions, access relevant knowledgeand access global opportunities. The demands we have placed on our employeeshave never been greater, the circumstances never more challenging, yet our employeeshave passed the test with flying colours once again. One measure of this is that theyachieved a customer satisfaction survey score of 81.8 in 2002, up from 81.5 in 2001.My sincere thanks to each of you for your accomplishments last year, and for theenthusiasm you have shown in taking on even larger performance goals for 2003. I would also like to thank the Advisory Council on Corporate Social Responsibility forbeing an indispensable sounding board, and the Board of Directors for its unfailingand ongoing support.
A. Ian GillespiePresident and Chief Executive Officer
EDC is dedicated to helping Canadian
companies build bridges to global markets.
EDC_AR_text_E 4/3/03 11:43 AM Page 12

W
E D C A N N U A L R E P O R T 2 0 0 2 9
hen I joined the EDC Board of Directors onJanuary 1, 2002, the corporation was headinginto a challenging year. The Export DevelopmentAct, by which EDC is governed, had beenrecently amended in December 2001, followingan extensive legislative review process. The resulting message was essentially: we likewhat you are doing EDC – do more of it. In 2002, during a slow and uncertain economic recovery, EDC continued to expand its ability to serve Canadian businessesof all sizes and across all sectors of the Canadian economy.
In talking with Canadian business people – and specifically EDC customers – it isevident that EDC has a unique and critical role to play within Canada’s export creditsystem. As Chairperson of EDC’s Board of Directors, I have a personal interest in helpingEDC optimize this role. The Board has always helped to shape EDC’s strategic direction,and played an integral role during the legislative review process concluded in 2001.
In October 2002, the Board created a committee to conduct a strategic review. Whilethe legislative review process studied EDC and its evolving role, the current strategicreview will examine Canada’s export credit system and EDC’s place and functionwithin that system. It will help determine how EDC can partner with others withinCanada’s export credit system to ensure that optimal support from both the publicand the private sectors is available to Canadian companies pursuing internationalbusiness, for years to come.
In 2002, the corporation proved yet again that it is a dedicated and reliable partnerfor Canadian exporters and investors, as evidenced by the results in this report.Furthermore, EDC effectively managed its own portfolios and finances to maintain asolid financial base, enabling it to meet the current and future needs of its customers,and to fulfill the expectations of the shareholder and other stakeholders.
In closing, on behalf of the Board, I would like to congratulate the management teamon EDC’s impressive ranking among the top 100 employers in Canada for the secondyear running. I would also like to thank the employees of EDC for their ongoing effortsto help Canadian businesses succeed in the increasingly competitive global marketplace.EDC has our commitment and support, as together we strive to enhance the availabilityand competitiveness of financial services for Canadian exporters and investors.
Paul Gobeil, FCA
Chairperson of the Board of Directors
Message from the Chairperson
Paul GobeilChairperson of the Board of Directors
EDC_AR_text_E 4/3/03 11:43 AM Page 13
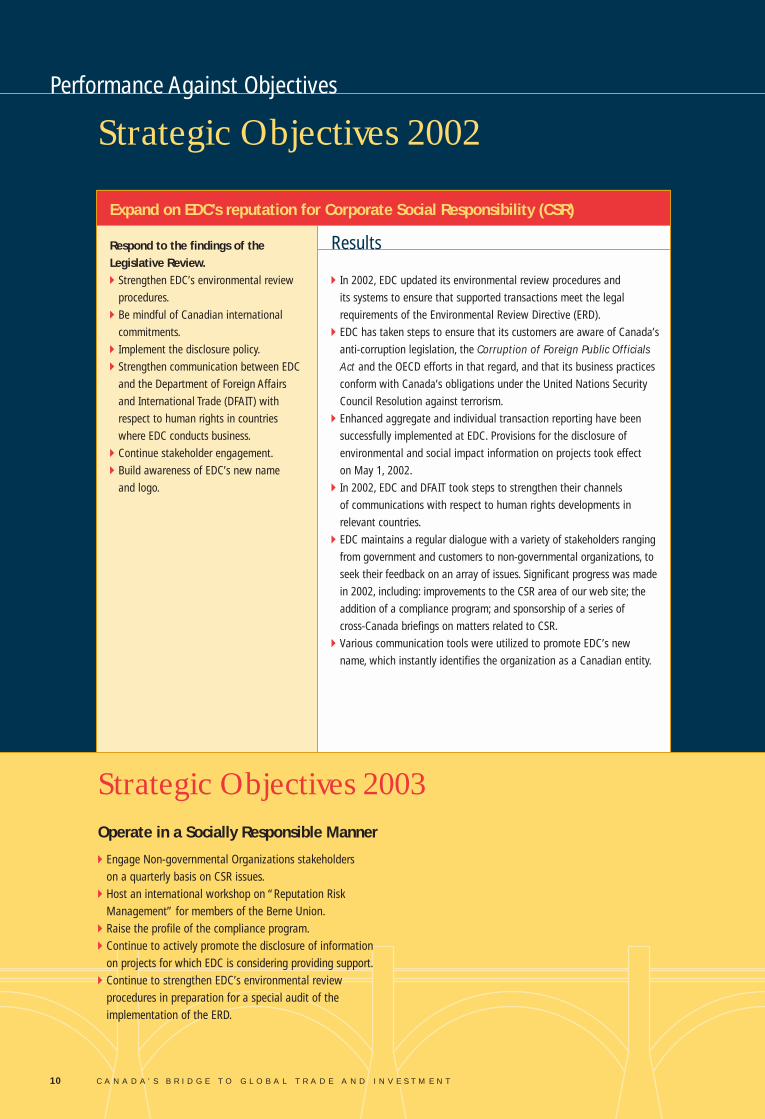
Expand on EDC’s reputation for Corporate Social Responsibility (CSR)
Results
10 C A N A D A ’ S B R I D G E T O G L O B A L T R A D E A N D I N V E S T M E N T
Strategic Objectives 2002
Strategic Objectives 2003
�Engage Non-governmental Organizations stakeholders on a quarterly basis on CSR issues.
�Host an international workshop on “Reputation RiskManagement” for members of the Berne Union.
�Raise the profile of the compliance program.�Continue to actively promote the disclosure of information
on projects for which EDC is considering providing support.�Continue to strengthen EDC’s environmental review
procedures in preparation for a special audit of the implementation of the ERD.
Operate in a Socially Responsible Manner
Performance Against Objectives
�In 2002, EDC updated its environmental review procedures and
its systems to ensure that supported transactions meet the legal
requirements of the Environmental Review Directive (ERD).
�EDC has taken steps to ensure that its customers are aware of Canada’s
anti-corruption legislation, the Corruption of Foreign Public Officials
Act and the OECD efforts in that regard, and that its business practices
conform with Canada’s obligations under the United Nations Security
Council Resolution against terrorism.
�Enhanced aggregate and individual transaction reporting have been
successfully implemented at EDC. Provisions for the disclosure of
environmental and social impact information on projects took effect
on May 1, 2002.
�In 2002, EDC and DFAIT took steps to strengthen their channels
of communications with respect to human rights developments in
relevant countries.
�EDC maintains a regular dialogue with a variety of stakeholders ranging
from government and customers to non-governmental organizations, to
seek their feedback on an array of issues. Significant progress was made
in 2002, including: improvements to the CSR area of our web site; the
addition of a compliance program; and sponsorship of a series of
cross-Canada briefings on matters related to CSR.
�Various communication tools were utilized to promote EDC’s new
name, which instantly identifies the organization as a Canadian entity.
Respond to the findings of theLegislative Review.�Strengthen EDC’s environmental review
procedures.
�Be mindful of Canadian international
commitments.
�Implement the disclosure policy.
�Strengthen communication between EDC
and the Department of Foreign Affairs
and International Trade (DFAIT) with
respect to human rights in countries
where EDC conducts business.
�Continue stakeholder engagement.
�Build awareness of EDC’s new name
and logo.
EDC_AR_text_E 4/3/03 11:43 AM Page 14

Enhance EDC’s products and servicedelivery to serve more Canadian companies operating internationally.�Increase the number of customers
served to 6,800. Increase the number of SMEs served to 6,050.
�Introduce expanded e-services, in particular for SMEs.
�Enhance EDC’s distribution channelstrategy to reach more companies andoptimize service to customers (EDC salesforce; its brokers and bank partners;e-business channels).
�Achieve a Customer Satisfaction Index(CSI) rating of 80.0.
Leverage EDC’s reputation for leader-ship and excellence and providevalue-added support to Canadiancompanies selling or investing abroad.�Support $40 billion or more in volume of
exports and investments.�Develop and implement an integrated
country sectors strategy to build a plat-form for increased support to developingmarkets. In 2002, support $9.5 billion ormore business in developing markets.
�Expand presence abroad.
Add financial and/or service capacityby expanding the network of partners.�Implement the broker and banker
strategies.
Capture Opportunities for Canadian Companies
�A total of 7,223 customers were served, an increase of 14 per cent
over 2001. Of these customers, 6,575 were SMEs, a 15 per cent growth
over 2001.
�EDC introduced two new on-line products in 2002, EXPORT Check
and EXPORT Protect, our first fully automated trade finance products.
�Several financial institutions signed master facility agreements relating
to EDC’s pre-shipment financing program for small business. As for
e-business channels, seven new portals to EDC were built from associa-
tion web sites to provide easy links to EDC for association members.
�EDC’s customers once again expressed high levels of satisfaction
with EDC. The 2002 CSI came in at a record 81.8, up from
81.5 last year.
�EDC continued its partnerships with Canadian companies by facilitating
$51.2 billion of their export and investment business, representing a
16 per cent increase over 2001 volume.
�EDC expanded its developing markets tool kit and initiated new
partnership approaches with exporters in support of its integrated
country sectors strategy. Business concluded in 2002 exceeded the
target, $9.9 billion versus $9.5 billion, but represents a decrease of
10 per cent compared to 2001 results. The decrease was primarily
due to financial crises in key markets which saw a reduced level of
export activity in 2002.
�EDC increased its foreign representation from three to five in 2002,
adding permanent resources in both Warsaw, Poland and Monterrey,
Mexico.
�In 2002, a strategy was developed and executed to expand EDC’s
working capital support through the banking network.
Results
E D C A N N U A L R E P O R T 2 0 0 2 11
Strategic Objectives 2003
�Implement a brand positioning campaign with our new
advertising agency.
�Create a proactive Small Business brand image and improve
prospecting and service process efficiencies.
�Develop a proactive relationship management strategy
for key customers.
�Expand geographic representation in both domestic
and international markets.
�Enhance EDC’s tool kit.
�Increase the number of customers served to 8,000.
�Increase the number of SMEs served to 7,200.
�Achieve a Customer Satisfaction Index (CSI) rating of 80.0.
Expand our support of Canada’s trade and investments abroad.�Raise awareness of EDC’s activities and promote EDC’s
interest and capabilities in developing markets in order
to proactively pursue more business in these markets.
�Expand the use of partnerships with both the private and
public sector in order to create capacity to support more
business.
�Enhance risk-sharing products with financial institutions.
�Support $54.5 billion or more in volume of exports
and investments.
�Support $11.75 billion or more business in developing markets.
Grow EDC’s Customer Base and Enhance our Customer Service Proposition
EDC_AR_text_E 4/3/03 11:43 AM Page 15

Financial Health
Results
Strategic Objectives 2002
Strategic Objectives 2003
�Net income of $190 million.�FSR of 13.0 per cent.�Internal Efficiency Ratio of 19.8 per cent. The IERs reported
in EDC’s 2002 and 2003 Corporate Plans were 20.0% for 2002
and 17.0% for 2003. Subsequent to the publication of the
2003 Corporate Plan, the calculation basis for the IER was
modified as explained on page 35 of this Annual Report.
The strategic objectives have been revised to reflect the
change in calculation basis.
�ROE of 8.4 per cent.
Manage in a Financially Prudent Manner
12 C A N A D A ’ S B R I D G E T O G L O B A L T R A D E A N D I N V E S T M E N T
Carefully manage financial risks toensure that EDC remains financiallysound, to support future business.�Net loss of $159 million.
�Financial Sustainability Ratio (FSR)
of 12.3 per cent.
�Internal Efficiency Ratio (IER) of
20.7 per cent. The IERs reported in EDC’s
2002 and 2003 Corporate Plans were
20.0% for 2002 and 17.0% for 2003.
Subsequent to the publication of the
2003 Corporate Plan, the calculation
basis for the IER was modified as explained
on page 35 of this Annual Report. The
strategic objectives have been revised
to reflect the change in calculation basis.
�Return On Equity (ROE) of -9.2 per cent.
�EDC achieved a net income of $122 million. All our financial results in
2002 were better than forecast under the Corporate Plan. The Plan was
developed soon after the events of September 11 when it was nearly
impossible to predict how 2002 would unfold.
�An FSR of 13.9 per cent was achieved.
�The IER came in at 17.4 per cent.
�An ROE of 5.9 per cent was attained.
EDC_AR_text_E 4/3/03 11:43 AM Page 16
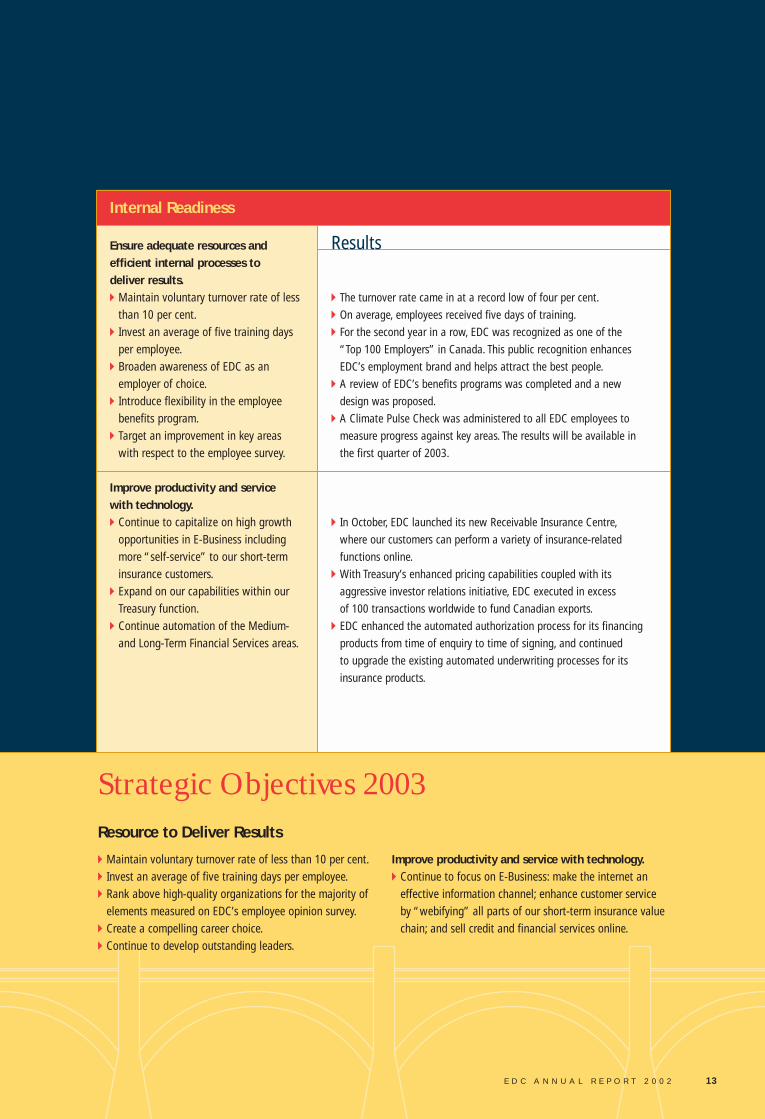
Ensure adequate resources and efficient internal processes to deliver results.�Maintain voluntary turnover rate of less
than 10 per cent.�Invest an average of five training days
per employee.�Broaden awareness of EDC as an
employer of choice.�Introduce flexibility in the employee
benefits program.�Target an improvement in key areas
with respect to the employee survey.
Improve productivity and service with technology.�Continue to capitalize on high growth
opportunities in E-Business includingmore “self-service” to our short-terminsurance customers.
�Expand on our capabilities within ourTreasury function.
�Continue automation of the Medium-and Long-Term Financial Services areas.
Internal Readiness
�The turnover rate came in at a record low of four per cent.
�On average, employees received five days of training.
�For the second year in a row, EDC was recognized as one of the
“Top 100 Employers” in Canada. This public recognition enhances
EDC’s employment brand and helps attract the best people.
�A review of EDC’s benefits programs was completed and a new
design was proposed.
�A Climate Pulse Check was administered to all EDC employees to
measure progress against key areas. The results will be available in
the first quarter of 2003.
�In October, EDC launched its new Receivable Insurance Centre,
where our customers can perform a variety of insurance-related
functions online.
�With Treasury’s enhanced pricing capabilities coupled with its
aggressive investor relations initiative, EDC executed in excess
of 100 transactions worldwide to fund Canadian exports.
�EDC enhanced the automated authorization process for its financing
products from time of enquiry to time of signing, and continued
to upgrade the existing automated underwriting processes for its
insurance products.
Results
Strategic Objectives 2003
�Maintain voluntary turnover rate of less than 10 per cent.�Invest an average of five training days per employee.�Rank above high-quality organizations for the majority of
elements measured on EDC’s employee opinion survey.�Create a compelling career choice.�Continue to develop outstanding leaders.
Improve productivity and service with technology.�Continue to focus on E-Business: make the internet an
effective information channel; enhance customer serviceby “webifying” all parts of our short-term insurance valuechain; and sell credit and financial services online.
Resource to Deliver Results
E D C A N N U A L R E P O R T 2 0 0 2 13
EDC_AR_text_E 4/3/03 11:43 AM Page 17

14 C A N A D A ’ S B R I D G E T O G L O B A L T R A D E A N D I N V E S T M E N T
EDC frees up cash and working capital for Niko by providing performance guarantees
to our banks. This in turn gives us the capacity to undertake more contracts, and expand
our use of Canadian supplies and services.
Robert Ohlson, President, Niko Resources Ltd.Calgary, Alberta
“”
EDC’s Regional Vice-President for westernCanada, Lewis Megaw (left), with Robert Ohlson,President, Niko Resources Ltd.
EDC_AR_text_E 4/3/03 11:43 AM Page 18

MFor many Canadian businesses, international trade offers far greater potential
to expand and succeed than focusing on the more limited domestic market.
To compete in global markets, these businesses need the capacity to establish
operations abroad and to enter into partnerships.
ore than almost any other industrialized country in the world, Canada’s economicprosperity depends on its ability to maintain and expand its trade capacity. Canada’seconomy relies heavily on international trade, with exports representing 43 per centof Canadian GDP. About 30 cents of every dollar earned by Canadians, and one outof every five jobs, is associated with the export of goods and services.
EDC remains committed to its vision: to be the recognized leader in providingground-breaking commercial financial solutions to companies of all sizes, helpingthem succeed in the global marketplace and create enduring prosperity for Canada.
To encourage more companies to compete in global markets, EDC offers a rangeof products and services, including trade finance and risk management solutions. Itsexport insurance provides protection against non-payment, and is used extensively by thesmall and medium-sized companies that make up 91 per cent of EDC’s customer base.
For larger, more long-term projects, foreign buyers are increasingly looking to theirsuppliers for alternative sources of financing. EDC’s financing solutions can give Canadianexporters a competitive edge in these situations. To provide Canadian exporters withthe broadest possible access to capital, EDC works together with Canadian banks tohelp finance opportunities for Canadian companies in global markets.
EDC was able to provide this type of financing advantage to Niko Resources Ltd.,a Calgary-based oil and gas company. Niko operates oil and gas fields located in India,and its Indian operations account for 99 per cent of the company’s total revenue.The company typically begins by drilling low-risk development wells and reworkingexisting wells, then expands into exploration and development operations – and allof these stages employ Canadians.
During the exploration phase, Niko requires a financial guarantee to meet itscontractual obligations with the government of India. EDC provides Niko’s bank withan annual Performance Security Guarantee, rather than the bank putting a lien on thecompany’s own funds for security. This frees more of Niko’s cash and working capitalto enable it to pursue other opportunities – a very real advantage, given its footholdin India, the world’s sixth largest energy consumer.
E D C A N N U A L R E P O R T 2 0 0 2 15
Bridge to China“While a revival in world markets for agriculture, telecom andtransportation should help restore Canadian exports to Chinaback to their previous levels, it will take a stronger commitmentof Canadian capital and technology to enhance capacity andensure we enjoy a sustained and expanding share of China’simport market.”
Alison Nankivell,EDC’s Regional Director for China (Beijing, China)
Capacity
EDC_AR_text_E 4/3/03 11:43 AM Page 19

EDC has proven to us that they are not just ‘money’ people – they are creative and they are
able to provide creative solutions. This opened up new opportunities to partner with us.
Jean-Pierre Dion, Financial and Corporate Events Manager, Cirque ÉloizeMontreal, Quebec
“ ”16 C A N A D A ’ S B R I D G E T O G L O B A L T R A D E A N D I N V E S T M E N T
EDC’s Regional Vice-President for Quebec,Françoise Faverjon-Fortin, with Jean-Pierre Dion,Financial and Corporate Events Manager, Cirque Éloize
Phot
o:Co
urte
sy o
f Cirq
ue É
loiz
e
Phot
o:In
col
labo
ratio
n w
ith M
artin
Ber
nier
and
Chris
tian
Bugd
en o
f Éco
le d
e Ci
rque
de
Verd
un
EDC_AR_text_E 4/3/03 11:44 AM Page 20

IEDC’s sector-based approach to serving customers enables it to build in-depth
knowledge of individual sectors and enhances the corporation’s ability to provide
customized solutions. In some cases, sector knowledge helps EDC to identify other
potential growth sectors, and to bridge gaps in the current export landscape.
n recent years, EDC has expanded its customer base and facilitated a range of non-traditional exports, such as film and television, multimedia and the performingarts. Typically, these companies come to EDC for insurance to protect them againstnon-payment or contract frustration, on a specific contract or transaction. EDC canalso provide bonding, which protects the customer’s bank.
Initially, insurance and bonding were the types of services that EDC offered toCirque Éloize. This circus company approached EDC to insure Excentricus, a showencompassing circus arts, theatre and music. However, working closely with CirqueÉloize gave EDC further insight into how it could customize more of its services tomeet additional needs.
While it was producing its latest creation, Nomade, Cirque Éloize became thefirst company in the entertainment industry to take advantage of EDC’s pre-shipmentfinancing, an EDC product designed to finance work in progress. Financing isrequired during the development stage of each new production to cover costs suchas salaries, props, lighting, special effects, costumes, choreography, music and travel.
Through pre-shipment financing, EDC can guarantee up to 75 per cent of a loanneeded to finance a product – whether its something that comes in a box or somethingless tangible like the productions of Cirque Éloize. EDC can also partner with otherfinancial institutions to enhance support for an exporter. In the case of Cirque Éloize,a partnership between La Caisse d’économie Desjardins de la culture and EDC’sSmall Business Financial Solutions Team, helped guarantee part of Cirque Éloize’sline of credit, so they could obtain needed working capital.
Other non-traditional export sectors offer significant growth opportunities aswell. In 2002, EDC identified tourism as one such sector. In-bound tourism is valuedat more than $16 billion annually, and accounts for almost 30 per cent of Canada’stotal services exports. EDC is promoting its insurance services to tourism operators,as a means of facilitating in-bound tourism business to Canada. Tourism is a departurefrom the traditional definition of exporting, expanding it to encompass Canadianservices purchased by foreign buyers – in transactions that take place on Canadian soil.
Knowledge
E D C A N N U A L R E P O R T 2 0 0 2 17
Bridge to Mexico“To develop an effective market expansion strategy, you need three key types of intelligence: market intelligence, customer intelligenceand competitor intelligence. The constant turmoil of today’s marketsmakes accurately gathering this kind of knowledge challenging, buteven more essential to understanding the forces at play.”
Marvin Hough (left), EDC’s Regional Director for Mexico and Central America (Mexico City, Mexico) Noé Elizondo, EDC’s Regional Manager for Monterrey (Monterrey, Mexico)
EDC_AR_text_E 4/3/03 11:44 AM Page 21
18 C A N A D A ’ S B R I D G E T O G L O B A L T R A D E A N D I N V E S T M E N T
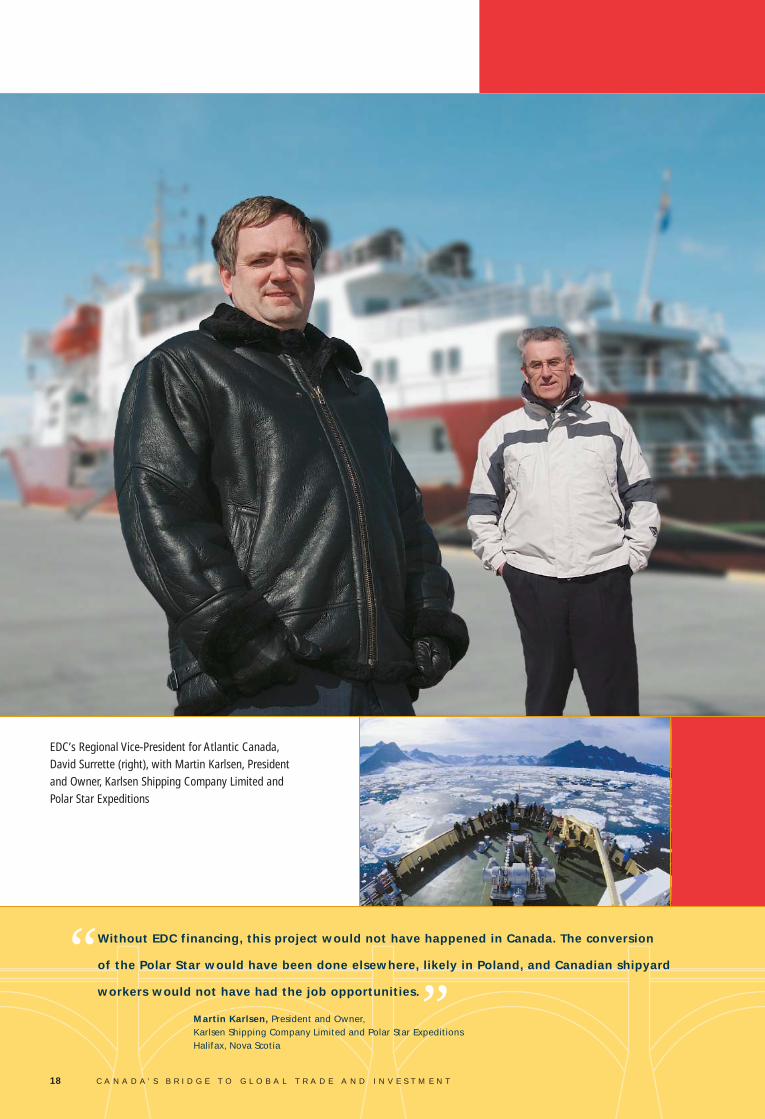
Without EDC financing, this project would not have happened in Canada. The conversion
of the Polar Star would have been done elsewhere, likely in Poland, and Canadian shipyard
workers would not have had the job opportunities.
Martin Karlsen, President and Owner, Karlsen Shipping Company Limited and Polar Star ExpeditionsHalifax, Nova Scotia
“”
EDC’s Regional Vice-President for Atlantic Canada,David Surrette (right), with Martin Karlsen, President and Owner, Karlsen Shipping Company Limited and Polar Star Expeditions
EDC_AR_text_E 4/3/03 11:44 AM Page 22

E D C A N N U A L R E P O R T 2 0 0 2 19
HIn today’s global marketplace, export and investment opportunities are as
diverse as the companies pursuing them. Increasingly, EDC has found ways to
facilitate transactions that help create new and innovative possibilities for
Canadian companies.
elping Canadian companies engage in international trade extends well beyond facilitating the export of goods or services to other countries. While that is the traditionalconcept of trade, it represents a gradually shrinking proportion of it.
Among the many Canadian companies which have adapted and evolved accordinglyare Halifax-based Karlsen Shipping Company and its spin-off, Polar Star Expeditions.Founded more than 100 years ago, Karlsen Shipping traditionally operated fishing,offshore support and other vessels. In 2001, it expanded operations to include theadventure travel industry, with the launch of Polar Star Expeditions.
Karlsen Shipping had previous experience in Arctic tour operations, havingchartered a vessel to a tour operator in Spitzbergen, north of Norway. It took about fiveyears of searching before the company found the ‘Njord’ (now called the ‘Polar Star’)to purchase and convert into a tour boat. Since its commissioning in 1969, the shiphad served as an icebreaker and training ship with the Swedish Navy and Coast Guard.
In addition to shopping around for a vessel to purchase, Karlsen Shippingresearched financing options and came across EDC. The corporation financed thetransaction through Karlsen’s foreign affiliate, and the ship conversion was done at theVerreault Navigation shipyard of Les Mechins, Quebec. Benefits to Canada includedthe labour and a portion of the supplies required to modify the former icebreaker,converting it into a passenger ship with a capacity of 100. Today, the Polar Star providesexpedition cruises to the Arctic, Antarctic and other destinations.
The Canadian benefits associated with the financing for conversion of the PolarStar are among the types of less traditional Canadian benefits now being taken intoconsideration in the evaluation of transactions. Recognizing that Canadian benefitscan no longer be defined exclusively in terms of Canadian content, the economic impactof other benefits such as future trade creation, R&D investment, higher-quality jobs inCanada, sub-supply from smaller Canadian firms and the maintenance of internationalmarket share are increasingly being taken into account in EDC's decisions.
Opportunity
Bridge to Central and Eastern Europe“In general, prospects for economies throughout Central andEastern Europe have brightened considerably during the past two years. With a combined population of more than 300 million,comprised of people well aware that goods and services can makelife more enjoyable, these countries are ripe with opportunity.”
Dennis Goresky,EDC’s Regional Director for Central and Eastern Europe (Warsaw, Poland)
EDC_AR_text_E 4/3/03 11:44 AM Page 23

20 C A N A D A ’ S B R I D G E T O G L O B A L T R A D E A N D I N V E S T M E N T
For financing, we depend on EDC to supplement our private sources of capital.
In Venezuela alone, EDC has already financed a half a dozen of our projects in the
environmental sector, including design/build, equipment procurement and management
of municipal wastewater treatment plants.
Douglas Langley, Vice-President, Delcan Corporation’s Environmental DivisionToronto, Ontario
“”
EDC’s Regional Vice-President for Ontario, Ruth Fothergill,with Douglas Langley, Vice-President, Delcan Corporation’sEnvironmental Division
EDC_AR_text_E 4/3/03 11:44 AM Page 24

SBusiness ethics have always been an important priority for EDC. The corporation
has implemented a series of fundamental business practices designed to ensure that
it maintains its high ethical standards. This in turn helps build confidence among
Canadian exporters and investors, as well as their foreign buyers and partners.
Confidence
E D C A N N U A L R E P O R T 2 0 0 2 21
ustainable trade is top-of-mind in today’s global arena, brought to the forefront by theUnited Nations’ Kyoto Protocol and events such as the World Summit on SustainableDevelopment held in 2002. At EDC, the review of environmental and social impacts,and anti-corruption declarations, have become integral to its analysis of finance andinsurance transactions. Last year, EDC appointed a Compliance Officer to addressthese issues, provide advice to EDC, and to oversee compliance audits.
EDC's compliance program serves as a bridge between all stakeholders and certainpublic policy initiatives of EDC. All stakeholders, including customers, may avail them-selves of EDC's compliance program to satisfy themselves as to the integrity of EDC'sinitiatives. During 2002, the inaugural year of the program, two complaints were received.
The environmental industry presents a wealth of opportunities to Canadianfirms that supply innovative environmental products or services. In recognition ofthe growth potential within this sector, EDC launched its EnviroExport Initiativeabout four years ago. Today, EDC plays a key role in expanding exports of Canadianenvironmental goods, technologies and services for some 200 customers. Last yearalone, EDC’s trade finance and risk management services facilitated about $500 millionin environmental industry exports and investments.
Canadian firms are achieving recognition for their expertise in developing water andwastewater treatment technologies, handling liquid and solid wastes, and manufac-turing environmental equipment. For example, Delcan Corporation – a key player inrehabilitating lakes and giving people access to potable water in many parts of LatinAmerica – was named winner of the Industry Award for Export Performance atGLOBE 2002. Canadian expertise in environmental engineering and environmentalconsulting is also in high demand.
Many environmental exporters use EDC’s short-term credit insurance, whichprotects them against non-payment by foreign buyers, covering up to 90 per cent ofthe loss. However, EDC can also provide insurance of service contracts and coverageof bid and performance bonds, political risk insurance, and some types of financing.
Bridge to Brazil and Southern Cone“Shortly after Brazil’s new government assumed power last year, the country’s currency improved, as did investor confidence. With the renewed focus on fostering change in the macroeconomic condition of Brazil, a Canadian proposal that complements goods andservices with partnerships, transfer of technology and investment is clearly a winning combination.”
J. Claudio Escobar,EDC’s Regional Director for Brazil and Southern Cone Countries (Sâo Paulo, Brazil)
EDC_AR_text_E 4/3/03 11:44 AM Page 25

22 C A N A D A ’ S B R I D G E T O G L O B A L T R A D E A N D I N V E S T M E N T
EDC was the presenting sponsor of an exhibit of Canadian artist Tom Thomson’s work, at the National Gallery of Canada in Ottawa. We believe that support of ourCanadian identity, including our cultural identity, contributes significantly to thesuccess of Canadian exporters and investors. The exhibit drew more than 105,000visitors, a quarter of whom were from outside of Canada.
Corporate Milestones
Community Milestones�EDC’s annual United Way/Healthpartners Campaign raised over $135,000. In addition, this year more than 60 EDC employees
donated their time, participating in the Day of Caring hosted by the United Way and Volunteer Ottawa in October.
�85 per cent of EDC employees participated in the 2002 Commuter Challenge, using environmentally friendly alternativesto get to work, and earning EDC first place in our category (government company with 100-1,000 employees). This resultedin the selection of EDC’s Fitness Centre as the launch site for the City of Ottawa’s second annual Gottawalk campaign.
�As part of its Education and Youth Employment strategy, EDC:
�sponsored the Junior Team Canada program, which enabled 1,600 students to attend training centres acrossCanada; sent 60 delegates on Economic Missions to Mexico, China and the Philippines; and sent three delegates on the Prime Minister’s Trade Mission to Russia.
�expanded its University Partnership program from 18 to 25 partners across Canada, and offered 21 International Studies Scholarships.
�launched its Go Global: Youth Trade Challenge, an essay contest enabling Canadian youth 18-25 to share theirideas on international trade, offering a total of $11,000 in prizes. Some 350 youth took part in the discussions and essay contest and more than 6,000 visitors logged onto the web site.
�EDC established permanent representatives in Warsaw, Poland and Monterrey, Mexico, to better serve Canadian companies and their buyers in those markets. These two new additions enhance our existing complement of representatives in Beijing (China), Sao Paulo (Brazil) and Mexico City (Mexico).
�EDC appointed a fourth Regional Vice-President in Canada, this one to serve the Atlantic region.
�EDC’s Compliance Officer established a compliance program for matters related to EDC’s disclosure policy, environmentalreview directive, and business ethics program.
�EDC was ranked by Macleans’ magazine among the top 100 employers in Canada for the second year in a row,with it’s employee newsletter making the top 10 for a second time.
�EDC implemented its revised Environmental Review Directive (ERD), establishing objective and systematic practices for conducting environmental reviews of projects being considered for financing or political risk insurance services.
�EDC launched its first web-based products, EXPORT Check and EXPORT Protect.
�EDC became an Executive Member of Team Canada Inc.
�EDC’s 2001 Annual Report received the Auditor General of Canada’s Award for Excellence in Annual Reporting – this is the fifth time in nine years that EDC has received the award.
Milestones 2002
Aut
umn
Folia
ge,T
om T
hom
son,
Nat
iona
l Gal
lery
of C
anad
a,O
ttaw
a
EDC_AR_text_E 4/3/03 11:44 AM Page 26

F
E D C A N N U A L R E P O R T 2 0 0 2 23
or more than 50 years, Export Development Canada (EDC) has facilitated steadygrowth in Canadian exports. Such strong performance is the result of a business strategythat seeks to balance growth in three areas – customers, capacity and people.
We continue to look for opportunities to develop new products and services tomeet customer needs. Recently, EDC added internet-based services, delivery partnersand knowledge products, responding to customer needs in competitive marketsaround the world. As a result, our customer base continues to expand.
Our financial capacity is a critical element of our growth strategy. As Canada’s exportvolumes continue to expand, EDC must ensure that the strength of its balance sheetkeeps up with the increasing demand for its services. Shareholder’s equity has grownsteadily and in 2002 reached CAD 2.1 billion. Our total assets were CAD 24.6 billion in2002, and we continue to prudently manage portfolio risk by diversifying our exposuresboth geographically and across industry sectors.
The third element of our strategy is our people. We have the largest pool of tradefinance talent in Canada. The bottom line is that EDC is a well established financialinstitution, with more than five decades of solid growth and strong financial performance.
Two years ago, EDC launched a global investor relations initiative and since thattime EDC executives have met with 200 investors in Asia, Europe and Canada. Ourweb site contains information of interest to current and prospective investors. In 2002,EDC conducted a direct mail campaign to more than 1,000 professional bond managersto inform them of EDC’s funding activities in the domestic market. Our aim is to betterunderstand their requirements and structure our funding program to incorporatetheir feedback.
EDC’s credit rating was upgraded to Aaa/AAA, contributing to increaseddemand for our debt securities. Our total funding programs were targeted to reachUSD 8 billion in 2002. We focused our efforts on selected markets, including Canada,Asia, Europe and the United States and raised USD 7 billion. Given internationaldemand we launched USD 1 billion of long-term debt into the global capital market.
In 2003, EDC will raise USD 5.5 billion in long-term debt and will operate a USD2.5 billion commercial paper program, targeting Canada, the United States, Asia andEurope. We will continue with our enhanced global investor relations program in2003, ensuring investors have access to the information they need to make informedinvestment decisions.
As you weigh the various investment choices for your portfolio, please considerthe comparative advantages of EDC bonds. EDC is a leading provider of risk-free debtsecurities and provides a broad range of products through financial institutions orprivate placements directly with investors. EDC not only provides vital services toCanadian exporters – it makes an excellent choice for your portfolio.
Marie MacDougallVice-President and Treasurer
Message to Investors
Marie MacDougallVice-President and Treasurer
EDC_AR_text_E 4/3/03 11:44 AM Page 27

24 C A N A D A ’ S B R I D G E T O G L O B A L T R A D E A N D I N V E S T M E N T
EDC debt securities offer many comparativeadvantages for investors
InnovativeEDC continues to strengthen its relationships with investors around the world throughdirect contact and dialogue.
Relationships with the investment community are essential to EDC. Ensuring investorsare well-informed of EDC’s investment products and services further strengthensthose relationships. To that end, EDC executives met with over 100 investment dealersand bankers in London last year, enhancing EDC’s name recognition in a key market.Relationship building efforts continued in Toronto where EDC met with partnersfrom financial institutions and the investment community to acknowledge their keyrole in the success of EDC’s borrowing program.
In September, EDC executives held inaugural meetings with institutional investorsin Beijing presenting EDC’s borrowing program. In Tokyo, EDC conducted a road showwith more than 50 investors and 30 representatives from Japanese security houses. Tofurther enhance its investor relations efforts, meetings took place with regional financialinstitutions in the Nagoya region.
Executives also met with banks, insurance companies and fund managers fromacross Canada to better understand their investment needs. Feedback from these investorshas been invaluable in guiding the development of a responsive borrowing strategy.
Keeping our investors informed of EDC’s role in supporting Canadian exportersand the benefits of EDC debt securities remains a key priority. Our web site providesinformation for current and prospective investors in multiple languages, and is locatedat www.edc.ca/invest. Our longstanding commitment to transparency and reportingexcellence guides the development of our web site content. In 2002, EDC introducedenhanced functionality to our web site such as:
www.edc.ca/invest
Investor Relations
� Capital Markets Activity Report – an updated list of recent trades
� Credit Spread History – to demonstratespread performance of selected issues
� Bond Report – indicative rates for structured products
In 2003, EDC will expand the web site contentto include:
� Call monitor – an updated list of bonds to be called
� Order book distribution on recent issues� Complete list of EDC’s Treasury team
members with contact information
EDC_AR_text_E 4/3/03 11:44 AM Page 28

SecureAaa/AAA Rating The ratings for the debt of EDC reflect its status as an agent of Her Majesty in rightof Canada; as such, EDC’s debt is an irrevocable full faith and credit obligation of theCanadian government.
In 2002, Moody’s Investor Service and Standard & Poor’s upgraded Canada’s ratings to Aaa/AAA. The ratings upgrades were based on:
� Canada’s track record of improving public-sector finance levels;� the shift of Canada’s current account balance into a surplus allowing its net
liability position to improve; and� diminishment of contentious constitutional issues.
In conjunction with the Government of Canada upgrade, the ratings of ExportDevelopment Canada debt securities were also upgraded to Aaa/AAA.
In 2002, the Japan Credit Rating Agency conducted an assessment and re-confirmed its AAA rating of EDC’s debt securities.
0% BIS Risk Weighted EDC debt obligations incur favourable capital treatment as they constitute a directclaim on a central government within the OECD. This is in accordance with theInternational Convergence of Capital Measurement and Capital Standards set forthby the Basel Committee on Banking Regulations and Supervisory practices. As such,EDC carries a zero risk weighting for regulatory capital applications.
ExperiencedEDC has been a recognized leader in the capital markets for more than three decades.In a world where the pace of change continues to accelerate, this kind of knowledgeis a valuable commodity. For our investors, it is experience they value and trust.
EDC partners with financial institutions who continuously demonstrate theircommitment to market making. EDC’s knowledge and experience ensures high execution standards and allows us to reach a broad range of investors. Our expectationis to receive solid primary placement with institutional and retail investors aroundthe world.
In 2002, we developed new structures and extended terms on our debt securitiesto enhance our ability to do more business with investors.
Partnering with underwriters enables EDC to achieve key objectives, a broaderinvestor base and spread performance in the secondary market.
E D C A N N U A L R E P O R T 2 0 0 2 25
Domestic Foreign CurrencyLong-term Short-term Long-term Short-term
Moody’s Aaa P1 Aaa P1
Standard & Poor’s AAA A-1+ AAA A-1+
DBRS AAA R-1 (high) AA (high) R-1 (high)
JCR AAA – AAA –
EDC_AR_text_E 4/3/03 11:44 AM Page 29

Debt ProductsAs a frequent international issuer, EDC customizes debt offerings to respond toinvestors’ portfolio requirements by providing a spectrum of products in a wide varietyof structures and currencies. Timing of issuance and structuring of debt products canbe executed quickly to allow investors to respond to opportunities.
Debt products issued by EDC:� Eurobonds, Global Bonds � Callable Structured Notes
and Domestic Issues � Dual Currency Issues� Zero Coupon � Private Placements� Floating Rate Notes � Commercial Paper� Step Up
In 2002, EDC executed more than 100 transactions through a combination ofstrategic and opportunistic issues complemented by structured products.
Performance In 2002, EDC re-entered the global bond market, executing two successful transactions inthe three and five-year maturities. Investor participation and geographical distributionmet our expectations.
26 C A N A D A ’ S B R I D G E T O G L O B A L T R A D E A N D I N V E S T M E N T
Issue Details
Launch Date: December 9, 2002
Issue Price: 99.829
Co-Lead Managers: RBC Capital Markets/Salomon Smith Barney
Syndicate Group: DB/CIBC/BMO/Scotia/BNP Paribas/Mizuho/NBF/TD
USD 500 million 2.750% Global Bond due December 12, 2005Export Development Canada (Aaa/AAA)
Investor Participation Geographical Distribution
Asset Management - 43%Government Entity - 30%Banks - 12%Retail - 6%Central Banks - 5%Corporate - 4%
U.S. - 41%Asia/Pacific - 31%Europe - 27%Japan - 1%
USD 500 million 4.00% Global Bond due August 1, 2007Export Development Canada (Aaa/AAA)
Investor Participation Geographical Distribution
Banks - 24%Asset Management - 23%Central Banks - 20%Insurance - 17%State Funds - 13%Agencies - 3%
U.S. - 45%Asia - 45%Europe - 10%
Issue Details
Launch Date: July 24, 2002
Issue Price: 99.874
Co-Lead Managers: BNP Paribas/Salomon Smith Barney
Syndicate Group: CSFB/Deutsche/Dresdner/Mizuho/RBC/TD
EDC_AR_text_E 4/3/03 11:44 AM Page 30

LiquidityEDC debt securities are a component of major bond indices.
� Scotia Capital Universe Index � Lehman Global Aggregate Index
Investors who are benchmarked against these indices understand the importanceof including EDC debt in their portfolios in order to match or exceed their return targets.
EDC bonds are a component of the Scotia Capital Universe Index. Major fixed-income indices are used by investors to determine asset allocation and for performancemeasurement. Entry into the Scotia Capital Universe Index is determined by minimumissue size of CAD 100 million, liquidity and pricing.
EDC debt obligations are also included in the Lehman Global Aggregate Index.The weight of EDC bonds is expected to increase in 2003 due to the addition ofCanadian provincial, agency and investment grade corporate bonds. For inclusion inthe Lehman Global Aggregate Index, Canadian bonds must have the equivalent ofUSD 300 million par amount outstanding and a BBB rating or higher by Moody’sInvestor Service.
EDC will continue to monitor the indices which are most relevant to ourinvestors, in order to demonstrate liquidity in capital markets.
Funding ProgramThe funding program supports EDC’s lending activities in order to support Canadianexporters. As EDC’s business continues to grow its funding program must keep pace.
2002 HighlightsDue to continued volatility in the capital markets, securities of high-quality borrowerswere in demand in 2002. EDC creates value for global investors by managing its fundingprogram to meet their requirements within approved asset-liability policies.
Long-term Funding Program� Aggregate volume of USD 4 billion � In excess of 100 transactions� Core markets: Asia, Canada, Europe and the United States � Maturities of one year and longer
Short-term Funding Program� Aggregate volume of USD 3 billion � Core markets: Asia, Canada, Europe and the United States � Maturities up to 365 days
2003 Borrowing StrategyEDC expects to issue USD 8 billion in debt securities.� Short-term funding target of USD 2.5 billion � Long-term funding target of USD 5.5 billion
Core markets will be targeted� Canada� United States� Europe� Asia
E D C A N N U A L R E P O R T 2 0 0 2 27
USD billions
Canada - 2.0Europe - 1.5US - 2.5Asia - 2.0
EDC_AR_text_E 4/3/03 11:44 AM Page 31

28 C A N A D A ’ S B R I D G E T O G L O B A L T R A D E A N D I N V E S T M E N T
A. Ian GillespiePresident and Chief Executive Officer
Peter AllenSenior Vice-President and
Chief Financial Officer
Rolfe CookeSenior Vice-President, Short-term
Financial Services
Ron DahmsSenior Vice-President,
Business Development
Susanne LaperleSenior Vice-President,
Human Resources
Gilles RossSenior Vice-President,
Legal Services and Secretary
Eric SiegelExecutive Vice-President, Medium- and
Long-term Financial Services
Rosemarie BoyleCorporate Communications and External Relations
Jim BrockbankRisk Management Office
Jim ChristieNational Sales
Don CurtisIndustrial Equipment
June DomokosInternational Markets – Asia
Françoise Faverjon-FortinQuebec Region
Robert ForbesEnergy, Infrastructure and Services
Ruth Fothergill Ontario Region
John GaganCorporate Finance and Control
Pierre GignacInsurance and Loan Services
Glen HodgsonEconomics
Harry KaunisviitaCorporate Business Systems
Louise LandryStrategic Planning andCorporate Performance
Derek LayneProject Finance
Norman LowInformation Technologies
Marie MacDougallTreasury
Jim McArdleLegal Services
Mike McLean International Markets –Americas
Lewis MegawWestern Region
Keith MilloyShort-term Insurance
Gilles MorinE-Business
Suzanne MorrisSME Services
Mike NealsMarketing
Sherry NobleStructured Finance
Kevin O’BrienTransportation, Equity and CIB
Brian PearceInternal Audit and Evalutaion
Stephen PolozEconomics
Sandy ReidAsset Management
Ed SimacInformation Systems
Henri SouquièresInternational Markets
David Surrette Atlantic Region
Executive Management Team
As at December 31, 2002
Management RepresentativesAs at December 31, 2002
Management Representatives
� Left to right: Rolfe Cooke, Eric Siegel and Ron Dahms.
� Left to right: Susanne Laperle, Peter Allen and Gilles Ross.
EDC_AR_text_E 4/3/03 11:44 AM Page 32

Management’s Discussion and Analysis30 Operating Highlights37 Risk Management
54 Financial Reporting Responsibility
55 Auditor’s Report
Consolidated Financial Statements56 Consolidated Balance Sheet57 Consolidated Statement of Income and Retained Earnings58 Consolidated Statement of Cash Flows59 Notes to the Consolidated Financial Statements
78 Five-Year Review
2002 Financial Review
E D C A N N U A L R E P O R T 2 0 0 2 29
EDC_AR_fin_E 4/3/03 11:30 AM Page 1

Income Statement DiscussionNet IncomeNet income reported for 2002 was $122 million, up $64 million from the 2001 level of $58 million primarily due to increasednet interest income. Net interest income increased by $175 million, or 21% from the 2001 level of $814 million principally as aresult of two factors. Firstly, receipt of debt relief resulted in the recognition of income associated with non-accrued capitalizedinterest (debt relief income) and secondly, lower funding costs were achieved in a low interest rate environment. This increasedincome was partially offset by increased provisions and administrative expenses. EDC’s provision for credit losses increased bya net amount of $99 million from the level of $741 million in 2001. Additional provisions required due to credit deteriorationand impairment were partially offset by provisions released as a result of prepayments and debt relief. Administrative expenseswere 17% higher than 2001 mainly as a result of the increased human resources, occupancy and technology costs required tomanage higher business volumes.
The following table outlines net income and return on shareholder’s equity over the last five years:
($ in millions) 2002 2001 2000 1999 1998
Net income 122 58 194 118 135Shareholder’s equity 2,077 2,050 1,992 1,798 1,680
Return (%) on shareholder’s equity 5.9% 2.8% 9.7% 6.6% 8.0%
Net Interest IncomeThe net margin of 3.86%, which represents net interest income expressed as a percentageof average performing assets employed, increased by 50 basis points from the 2001 levelof 3.36%.
The following items contributed to this increase:
bp
Increase in debt relief income 37Increased spread due to lower debt funding costs 13Decreased interest reversals on impaired loans 4Decreased amortization of non-accrued capitalized interest (3)Impact of decreased prepayment fees (2)Increased gains on sale of shares/loan assets 1
Net increase in net interest margin 50 bp
The net interest margin increased in 2002 primarily due to increased debt relief income and reduced funding costs. Debt relief incomewas $96 million in 2002 compared to $1 million in 2001 and pertained to amounts received for Yugoslavia ($61 million) andIvory Coast ($35 million). The interest rate environment in 2002 was such that it was beneficial to increase short-term fundingto take advantage of the low interest rates in the short-term. This funding strategy reduced interest expense and therebyincreased the spread between the yield on assets and the cost to borrow.
Decreased amortization of non-accrued capitalized interest and decreased prepayment fees reduced the margin by 5 basispoints, but this was offset by the positive effect of reduced interest reversals on impaired loans and increased gains on sale ofloan assets.
30 C A N A D A ’ S B R I D G E T O G L O B A L T R A D E A N D I N V E S T M E N T
Operating Highlights
3.76
3.27
3.31
3.86
3.36
5.0
4.0
3.0
2.0
1.0
0.0 1998 1999 2000 2001 2002
Net Margin(%)
Management’s Discussion and Analysis
EDC_AR_fin_E 4/3/03 11:30 AM Page 2

($ in millions) 2002 2001 2000 1999 1998
Average gross loans receivable 24,790 22,982 19,744 17,331 14,286Average investment portfolio balance 2,759 2,840 3,215 2,758 1,908
Less: average impaired loans 1,914 1,596 1,311 1,468 1,861
Total average assets employed 25,635 24,226 21,648 18,621 14,333
Interest income:Loans 1,404 1,620 1,585 1,256 1,055Debt relief 96 1 – 2 –Investment portfolio 69 127 197 146 126
Total interest income 1,569 1,748 1,782 1,404 1,181Interest expense 580 934 1,066 796 642
Net interest income $989 $814 $716 $608 $539
Net margin 3.86% 3.36% 3.31% 3.27% 3.76%
Interest Income – Loans
For 2002, loan interest income was $1,404 million, a decrease of $216 million, or 13%,from the level of $1,620 million in 2001. The performing gross loans receivable averaged$22,876 million in 2002 (2001 – $21,386 million) with an average yield of 6.56% (2001 – 7.58%). In 2002, disbursements exceeded repayments by $871 million, which,when combined with increased average foreign exchange rates, had the impact of increasingthe average performing loans by $1,490 million, or 7%, over 2001.
Components of change in interest income – loans from prior year($ in millions)
Volume increases 88Yield decreases (290)Foreign exchange impact 17Decrease in other loan interest (31)
Net change in interest income – loans $(216)
Performing fixed rate loans receivable averaged $11,969 million in 2002 (2001 – $10,235 million) with an average coupon yield of 6.99% (2001 – 7.19%), earning interestof $837 million (2001 – $736 million). The increase in average fixed rate loans receivablewas principally the result of increases in the aerospace and mining and power industrysectors. The coupon on performing fixed rate loans receivable decreased over last year. Thiswas due to the changes in the portfolio as older loans earning higher interest rates wererepaid. Meanwhile, current loan disbursements carry lower interest rates. Disbursementsduring the year yielded 6.38% while existing loans repaid carried a yield of 7.37%. Newfixed rate loans signed in 2002 yielded 5.96% compared with 6.68% in 2001.
The performing floating rate loans receivable averaged $10,907 million in 2002 (2001 –$11,151 million) with an average coupon rate of 3.68% (2001 – 6.13%) earning interestof $401 million (2001 – $684 million). The six month moving average U.S. dollar LIBORwas 2.04% in 2002, a decrease of 261 basis points from the 2001 average. The reductionin U.S. dollar LIBOR resulted in decreased floating rate interest income which led to loweryields on the floating rate loans portfolio. New floating rate loans signed in 2002 yielded1.61% over LIBOR compared with 1.75% in 2001.
E D C A N N U A L R E P O R T 2 0 0 2 31
2,000
1,600
1,200
800
400
0
10.0
8.0
6.0
4.0
2.0
01998
* Includes impact of debt relief income
1999 2000 2001 2002
IncomeYield
9.0
7.0
6.0
8.0
5.0
4.0
3.0 1998 1999 2000 2001 2002
Performing fixed couponPerforming floating couponTotal average yield (including other loan interest and debt relief income)
Interest Income – Loans*
($ in millions) Yield (%)
Loan Interest YieldYield (%)
EDC_AR_fin_E 4/3/03 11:30 AM Page 3
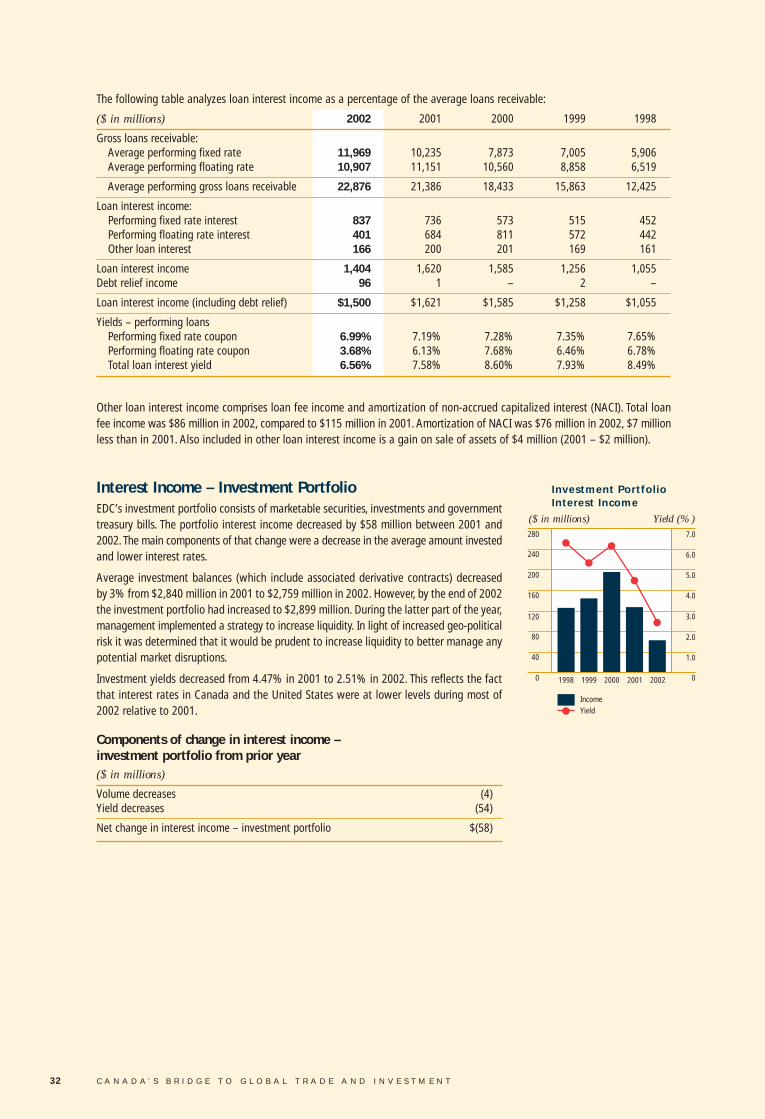
The following table analyzes loan interest income as a percentage of the average loans receivable:
($ in millions) 2002 2001 2000 1999 1998
Gross loans receivable:Average performing fixed rate 11,969 10,235 7,873 7,005 5,906Average performing floating rate 10,907 11,151 10,560 8,858 6,519
Average performing gross loans receivable 22,876 21,386 18,433 15,863 12,425
Loan interest income:Performing fixed rate interest 837 736 573 515 452Performing floating rate interest 401 684 811 572 442Other loan interest 166 200 201 169 161
Loan interest income 1,404 1,620 1,585 1,256 1,055Debt relief income 96 1 – 2 –
Loan interest income (including debt relief) $1,500 $1,621 $1,585 $1,258 $1,055
Yields – performing loansPerforming fixed rate coupon 6.99% 7.19% 7.28% 7.35% 7.65%Performing floating rate coupon 3.68% 6.13% 7.68% 6.46% 6.78%Total loan interest yield 6.56% 7.58% 8.60% 7.93% 8.49%
Other loan interest income comprises loan fee income and amortization of non-accrued capitalized interest (NACI). Total loanfee income was $86 million in 2002, compared to $115 million in 2001. Amortization of NACI was $76 million in 2002, $7 millionless than in 2001. Also included in other loan interest income is a gain on sale of assets of $4 million (2001 – $2 million).
Interest Income – Investment PortfolioEDC’s investment portfolio consists of marketable securities, investments and governmenttreasury bills. The portfolio interest income decreased by $58 million between 2001 and2002. The main components of that change were a decrease in the average amount investedand lower interest rates.
Average investment balances (which include associated derivative contracts) decreased by 3% from $2,840 million in 2001 to $2,759 million in 2002. However, by the end of 2002the investment portfolio had increased to $2,899 million. During the latter part of the year,management implemented a strategy to increase liquidity. In light of increased geo-politicalrisk it was determined that it would be prudent to increase liquidity to better manage anypotential market disruptions.
Investment yields decreased from 4.47% in 2001 to 2.51% in 2002. This reflects the factthat interest rates in Canada and the United States were at lower levels during most of2002 relative to 2001.
Components of change in interest income – investment portfolio from prior year($ in millions)
Volume decreases (4)Yield decreases (54)
Net change in interest income – investment portfolio $(58)
32 C A N A D A ’ S B R I D G E T O G L O B A L T R A D E A N D I N V E S T M E N T
200
240
280
160
120
80
40
0
7.0
6.0
5.0
4.0
3.0
2.0
1.0
01998 1999 2000 2001 2002
IncomeYield
Investment PortfolioInterest Income
($ in millions) Yield (%)
EDC_AR_fin_E 4/3/03 11:30 AM Page 4

Interest ExpenseInterest expense decreased by $354 million between 2001 and 2002. The main factor thataccounted for this change was a decrease in the general level of interest rates. However,the decrease was partially offset by an increase in overall debt volume as well as the continued strength of the U.S. dollar relative to the Canadian dollar.
EDC carried an average floating rate debt balance of $15,278 million in 2002 (2001 –$14,409 million) at an average cost of 1.98% (2001 – 4.51%), resulting in interestexpense of $302 million (2001 – $650 million). Long-term debt instruments comprise 77%of the floating rate debt portfolio while short-term debt (i.e., commercial paper) makes upthe balance.
EDC carried an average fixed rate debt balance of $4,745 million in 2002 (2001 – $4,438 million) at an average cost of 5.86% (2001 – 6.34%), resulting in interest expenseof $278 million (2001 – $281 million).
Components of change in interest expense from prior year($ in millions)
Volume increases 49Cost of funds decreases (409)Foreign exchange impact on interest expense 9
Net change prior to foreign currency translation gain/loss (351)
Change in the Corporation’s foreign currency translation gain/loss (3)
Net change in interest expense $(354)
Levels of interest rates both in Canada and the United States were lower in 2002, relative to 2001. This was reflected in theaverage cost of funds, which decreased from 4.95% in 2001, to 2.90% in 2002. The decrease in the general level of interestrates had the most significant impact on the floating rate debt portfolio with the average yield falling by 253 basis points.
The overall increase in debt volume is the result of borrowing requirements necessary to support the continued growth in theloans receivable portfolio. The average balance of long-term debt increased from $15,535 million in 2001 to $16,580 million in2002 while the average balance of short-term debt increased from $3,313 million in 2001 to $3,443 million in 2002. The averagebalances for both short-term and long-term debt include associated derivative contracts.
Continued strength of the U.S. dollar relative to the Canadian dollar during 2002 increased interest expense on foreign currencydenominated debt by $9 million.
Interest expense, as reported on the income statement, includes the Corporation’s foreign exchange translation gain/loss for theyear. Included in interest expense for 2002 is a translation gain of $2.6 million (2001 – $75 thousand gain).
E D C A N N U A L R E P O R T 2 0 0 2 33
1,200
1,000
800
600
400
200
0
7
6
5
4
3
2
11998 1999 2000 2001 2002
ExpenseCost of funds
Interest Expense(Excluding Foreign ExchangeTranslation Gain/Loss)
($ in millions) Cost of Funds (%)
EDC_AR_fin_E 4/3/03 11:30 AM Page 5

Insurance Premiums and Guarantee FeesThe following table analyzes the average premium rate for insurance premiums and guarantee fees:
($ in millions) 2002 2001
$ % $ %
Short-term program:Short-term insurance average exposure 28,897 23,487Premiums and fees earned 101 91
Average short-term premium rate 0.35 0.39
Medium-term program:Medium-term insurance average exposure 5,253 5,162Premiums and fees earned 37 35
Average medium-term premium rate 0.70 0.68
Loan guarantees:Loan guarantees average exposure 2,628 2,145Loan guarantee fees earned 9 8
Average loan guarantee fee rate 0.34 0.37
Short-term insurance premium revenue totaled $101 million, or 69% of 2002 insurance premiums earned. Short-term premium revenue increased by $10 million or 11% from the 2001 level of $91 million. This was the result of an increase in short-term insurance exposure, which increased by $5,410 million, or 23% over 2001 mainly due to an overall increase in short-term insurance volumes. The decrease in the average premium rate is mainly due to the issuance of a few large policieswhich carry a lower premium rate.
Medium-term insurance premium revenue for the year totaled $37 million, an increase of 6% over 2001. The average exposurein the medium-term insurance programs increased by $91 million, or 2% over 2001. This increase was primarily due to thegrowth in the surety bond program. The decrease in the average loan guarantee fee rate was driven primarily by the signing ofloan guarantees with higher credit ratings, which carry lower guarantee fees.
Provision for Credit LossesThe following table analyzes the expense for the provision for credit losses over the last five years:
($ in millions) 2002 2001 2000 1999 1998
Provision for credit losses pertaining to:Loans 930 208 381 397 313Loan commitments (231) 521 – – –Loan guarantees 26 (71) 10 (7) 32Insurance 115 83 158 133 88
Total provision for credit losses $840 $741 $549 $523 $433
A provision charge of $930 million (2001 – $208 million) was made to the income statement for losses on loans. This was primarily the result of credit downgrades which occurred throughout 2002.
A provision credit of $231 million (2001 – $521 million charge) was made to the income statement for losses on loan commitments.This credit was made in accordance with the general provisioning methodology. Under this methodology, a provision is chargedfor those loans that are committed or signed, but not yet disbursed. This reduction was due to fewer loan commitments beingoutstanding at the end of 2002.
A provision charge was made to the income statement for credit losses on loan guarantees in the amount of $26 million (2001 – $71 million credit).
During the year, there was a $115 million charge (2001 – $83 million) to the income statement for the provision for insurance claims.Of the total provision for insurance claims, $111 million was due to the write-off of recoverable claims in 2002 (2001 – $74 million).
34 C A N A D A ’ S B R I D G E T O G L O B A L T R A D E A N D I N V E S T M E N T
EDC_AR_fin_E 4/3/03 11:30 AM Page 6

Administrative ExpensesNet administrative expenses for 2002 totaled $174 million, an increase of 17% from theprior year. Expenditures related to human resources, occupancy and technology were higheras a result of strategic investments in technology and people in order to continue to serviceand grow the business.
Expressed as a percentage of net revenue (internal efficiency ratio), administrative expensesincreased to 17.4% in 2002, from 17.0% in 2001. The calculation of the internal efficiencyratio was revised in 2002 to exclude the impact of debt relief income from net revenueand also to exclude from administrative expenses the impact of amounts retained fromCanada Account receipts and recoveries to meet overhead and expenses related toCanada Account transactions. The ratio has been revised to exclude these amountsbecause it is management’s view that the ratio should be calculated on amounts overwhich it exercises control. Debt relief is determined by the shareholder and is not withinmanagement’s control so it is excluded from the calculation. Despite the fact that EDCreceives compensation for expenses and overhead related to Canada Account activities,management is nevertheless responsible for control of the gross administrative expensesand therefore the internal efficiency ratio is based on the gross administrative expenses.Prior years’ results have been restated.
Corporate Plan DiscussionComparison with 2002 PlanBusiness volume for 2002 reached a record $51.2 billion, a 16% increase over the 2001 level of $44.3 billion, and exceeded the2002 planned volume of $40.0 billion. Planned 2002 volume was projected shortly after the September 11th attacks and reflectedthe economic uncertainty that existed at that time. The increase over plan can be attributed to financing surpassing the plan by$2.2 billion, contract insurance and bonding by $2.5 billion and short-term insurance by $6.5 billion.
Loans receivable and loans payable increased over the plan mainly due to the higher financing volumes and a stronger US dollar than planned.
The 2002 net income of $122 million was higher than the 2002 Corporate Plan projection of a $159 million loss primarily due tohigher net interest income and lower provisions than planned. EDC achieved its level of profitability in 2002 primarily as a resultof debt relief and lower funding costs. Net interest income exceeded plan by $199 million primarily as a result of two factors:firstly due to the recognition as income of the non-accrued capitalized interest associated with debt relief (debt relief income)and secondly because of the lower funding costs which resulted from management’s strategy of increasing the proportion ofshort-term borrowings to take advantage of the steep yield curve that existed in 2002. Provisions for credit losses were $57 millionlower than the plan in 2002 due primarily to the release of provisions which occurred as a result of the unplanned debt relief.
Administrative expenses were below plan by $10 million, due to efforts to contain costs in the current economic environment.The internal efficiency ratio was 17.4%, better than the revised plan of 20.7% as a result of higher than planned net revenue andlower administrative expenses. The Corporate Plan projected the internal efficiency ratio to be 20.0% for 2002. This was subsequentlyrevised to 20.7% to reflect the new calculation of the ratio as explained above under the administrative expenses section.
2003 Corporate PlanThe Corporate Plan projects the year 2003 business volume to increase to $54.5 billion from $51.2 billion in 2002 primarily dueto an increase in short-term insurance volume.
The loans receivable and loans payable balances are expected to increase from 2002 actuals since disbursements in 2003 areexpected to exceed repayments.
Net income is planned at $190 million, which is higher than 2002 by $68 million.The major projected net income variances from the2002 actual results are due to a projected increase in net interest income and a projected decrease in the provision for credit losses.This is partially offset by a projected increase in administrative expenses due primarily to the continuing investment in technology.
E D C A N N U A L R E P O R T 2 0 0 2 35
200
160
120
80
40
0
18.0
17.5
17.0
16.5
16.0
15.51998 1999 2000 2001 2002
Administrative expensesInternal efficiency ratio
Administrative Expenses($ in millions) (%)
EDC_AR_fin_E 4/3/03 11:30 AM Page 7

2003 2002 2002 Corporate Actual Corporate
Plan Results Plan
Volume
($ in billions)Financing 7.5 7.4 5.2Contract insurance and bonding 5.0 5.8 3.3Political risk insurance 4.0 3.5 3.5Short-term insurance 38.0 34.5 28.0
Total $54.5 $51.2 $40.0
Balance Sheet
($ in millions)AssetsLoans receivable 25,845 24,623 23,376Allowance for losses on loans 3,500 3,613 3,142
Net loans receivable 22,345 21,010 20,234Cash and marketable securities 2,584 2,824 2,422Investments 76 75 342Accrued interest and other assets 540 474 470Derivative related amounts 181 171 287
Total Assets $25,726 $24,554 $23,755
Liabilities and Shareholder’s EquityLoans payable 21,716 20,828 20,010Accrued interest and other liabilities 516 428 529Allowance for loan commitments and guarantees 555 377 664Allowance for claims on insurance 470 460 498Derivative related amounts 205 384 324
Total Liabilities 23,462 22,477 22,025
Share capital 983 983 983Retained earnings 1,281 1,094 747
Shareholder’s Equity 2,264 2,077 1,730
Total Liabilities and Shareholder’s Equity $25,726 $24,554 $23,755
Income Statement
($ in millions)Interest incomeLoans 1,482 1,404 1,501Debt relief 113 96 –Investment portfolio 81 69 93
1,676 1,569 1,594Interest expense 665 580 804
Net interest income 1,011 989 790Insurance premiums and guarantee fees 158 147 132Provision for credit losses 780 840 897
Income after provision for credit losses 389 296 25Administrative expenses 199 174 184
Net Income/(Loss) $190 $122 $(159)
Dividend $– $95 $50
36 C A N A D A ’ S B R I D G E T O G L O B A L T R A D E A N D I N V E S T M E N T
EDC_AR_fin_E 4/3/03 11:30 AM Page 8

Risk Management
EDC strives to balance the risk it takes with the financial and mandate returns it generates for that risk to ensure continuedcapacity for Canadian exporters. Risk management is central to EDC’s business. Not only must the Corporation manage the risks itfaces in its operations, it is in the business of providing exporters and investors with the tools they need to manage their own risks.
To enhance its risk management capabilities, EDC takes guidance from an Enterprise Risk Management framework that providesa comprehensive view of the key risks it faces and tools to measure, monitor and manage them. This framework comprises guidingprinciples, policies and analytical and reporting tools that support EDC in carrying out effective risk management practices.
The ongoing responsibilities for risk management are shared throughout the Corporation. The Board of Directors maintains overall responsibility for approval of risk management policies within the Corporation and provides additional governancethrough its Risk Management Committee. A management Risk Management Committee oversees compliance with risk management policies and processes and is accountable to the Board Risk Management Committee in this endeavour. A centralRisk Management Office, led by EDC’s Chief Risk Officer, coordinates and develops risk management standards and methodologiesand manages operational asset exposures while working closely with the business units who originate these exposures.
EDC monitors key risks within five risk categories: credit, market, operational, organizational and business. To date, EDC’s focus as a financial institution has been on the management and ongoing development of the credit and market risk components. Attention is also focused on the integration of the remaining elements of its framework centered on operational,organizational and business risks.
E D C A N N U A L R E P O R T 2 0 0 2 37
Identification
Communication MeasurementMonitoring
Management
Enterprise Risk Management Process
EDC_AR_fin_E 4/3/03 11:30 AM Page 9

38 C A N A D A ’ S B R I D G E T O G L O B A L T R A D E A N D I N V E S T M E N T
EDC Risk Management Organization
Responsible for ensuring adequate policies, processesand systems are in place tomanage risk, for approvingpolicies, and for approvingexceptions to policy.
Board of Directors
Responsible for ensuring thatpolicies are in place to manageEDC’s risk, monitor manage-ment compliance, and to reviewrisk management standards,processes and methodologies.
Board Risk Management Committee
Responsible for reviewing andupdating policies, compliancewith policies, and approvingand ensuring compliance withrisk management standards,processes and methodologies.
Management RiskManagement Committee
Responsible for formulatingpolicies, for monitoring com-pliance with and endorsingrisk management standards,processes and methodologies.
Risk Management Office
Each of the above risks is discussed in greater detail on the following pages.
Credit Riskis the risk of loss incurred if a counterparty fails to meet its financial commitments. EDC is exposed to credit risk underits loans and insurance programs and treasury activities. The Corporation has credit risk management policies in placeto manage and continuously monitor these credit exposures.
Operational Riskis the potential risk of loss from human error, internal control weaknesses and systems deficiencies. EDC has policies, pro-cedures, and an Internal Audit department in place to mitigate the possibility of material losses as a result of operational risk.
Organizational Riskis the risk of loss or cost to the company due to the organizational environment (people and skills, incentives, culture andvalues). EDC has policies and procedures in place to manage and monitor its organizational environment.
Business Riskis the potential for loss relating to EDC’s external environment or to its relations with stakeholders. EDC has policies andpractices in place to manage and monitor the possibility of adverse effects as a result of business risk.
Market Riskis the likelihood of loss to EDC as a result of movements in interest and foreign exchange rates and the risk that fundswill not be available to meet corporate obligations. EDC manages the market risk of its assets and liabilities on a port-folio basis and has policies in place to limit its exposure to interest rate and foreign exchange movements and to ensuresufficient liquidity is retained to meet requirements and maintain stability in short-term borrowing programs.
EDC_AR_fin_E 4/3/03 11:30 AM Page 10

Credit Risk Credit risk represents the most substantial risk to EDC. As at December 31, 2002, EDC had $52.4 billion of exposure to creditrisk, as detailed on the next page. The Corporation regularly reviews its processes and systems in order to improve the administrationand assessment of credit risk associated with financing, insurance and treasury transactions. The Corporation is committed toensuring that its origination and portfolio management policies and methodologies embody relevant best-in-class practiceswithin the private sector and the public sector.
As organizations develop risk management capabilities, there is an increasing recognition of the central importance of the abilityto transfer or otherwise mitigate credit risk to manage credit exposure and portfolio concentrations. As risk transfer and mitigationtools continue to develop in international capital and trade finance markets, greater opportunities for this kind of active portfolio management may emerge, providing EDC with enhanced flexibility in maintaining its capacity for taking risk.
EDC manages the credit risk associated with its exposures at the portfolio level and the transaction level, as follows:
Portfolio Credit Risk ManagementEDC has in place a Credit Risk Management Framework. The policy framework establishes the approval responsibilities of theBoard of Directors, the oversight responsibilities of the Risk Management Committee of the Board of Directors, and the operational, approval and reporting responsibilities of Management. Among other things, the framework includes methodologiesto determine country risk limits, industry risk limits and commercial obligor risk limits. All limits are determined based on theCorporation’s capital base and risk factors associated with the exposure. The framework also provides for reporting of managementtransaction approvals, risk aggregations and compliance with the policies to the Board of Directors on a regular basis.
Country risk is continually reviewed by the Corporation’s Economics Department to take into consideration any changes in theworld environment or a specific country. The Economics Department risk rates all countries, and all other things being equal,the higher the country risk, the lower the country risk limit.
Commercial obligor risk is regularly reviewed by the Corporation to take into consideration any changes that may affect thecredit risk of the commercial obligor. The Corporation risk rates all commercial obligors, and all other things being equal, thehigher the risk, the lower the commercial obligor risk limit.
It is Management’s responsibility to operate the Corporation’s credit risk exposures within the limits established by the Board.Any exceptions to limits require specific Board approval.
Specific Transaction Risk ManagementIn order to better understand the credit risk associated with EDC’s individual credit commitments, the Corporation is organizedinto business teams along industry sectors. The business teams are responsible for the proper due diligence associated with eachcredit commitment. Within the business team structure, each individual has a delegation of approval authority based on relevantexpertise and experience. Every credit commitment (except for very small amounts) requires the approval of at least two individuals with delegated approval authority.
Significant potential transactions with respect to credit risk and structure are reviewed for endorsement by the RiskManagement Office prior to authorization. The Risk Management Office reports to the Chief Risk Officer who in turn reports tothe Senior Vice-President and Chief Financial Officer. Very significant transactions with respect to credit risk and structure arealso reviewed for endorsement by the management Risk Management Committee. The management Risk ManagementCommittee comprises the following seven corporate officers: the President; the Executive Vice-President of Medium- and Long-term Financial Services; the Senior Vice-President and Chief Financial Officer; the Senior Vice-President, Legal Services, andSecretary; the Senior Vice-President of Short-term Financial Services; the Senior Vice-President of Business Development; and theChief Risk Officer. In addition, certain very significant transactions with respect to credit risk and structure require the approvalof the Board of Directors.
The Corporation actively monitors and manages the credit risks associated with transactions post-commitment to ensure thatwhere there is a change in the risk, the implications are assessed and managed. Where negative changes in risk have occurred,the transactions are downgraded, allowances adjusted and plans to mitigate potential losses put into place.
E D C A N N U A L R E P O R T 2 0 0 2 39
EDC_AR_fin_E 4/3/03 11:30 AM Page 11

Concentration of ExposureThe following reflects the major concentrations of total commercial and sovereign exposure in the geographic market and countrywhere the risk resided for all operations at the end of 2002.
Investmentsand Derivative
Gross Loans Short- Medium- Medium-term Financial 2002 Country Receivable Commitments term term Guarantees (1) Instruments (2) Exposure
($ in millions) $ %
United States 11,568 2,447 4,226 115 3,082 1,510 22,948 44Canada 2,523 (3) 1,262 (3) 93 2,410 (4) 156 1,579 8,023 15Mexico 1,440 1,256 147 219 35 – 3,097 6China 973 259 182 149 23 – 1,586 3Brazil 930 235 188 181 1 – 1,535 3United Kingdom 987 47 248 7 63 74 1,426 3Peru 828 20 7 110 2 – 967 2Indonesia 885 – 27 16 2 – 930 2Venezuela 649 228 35 9 9 – 930 2Germany 129 160 130 3 5 174 601 1Other (5) 5,429 1,413 1,814 751 818 114 10,339 19
Total $26,341 $7,327 $7,097 $3,970 $4,196 $3,451 $52,382 100
(1) Includes $2,998 million of loan guarantees.
(2) Investments include amounts represented by cash, marketable securities and investments. Exposure does not take into consideration anycollateral or the effect of any master netting agreements with derivative counterparties.
(3) Includes the impact of one transaction signed in 1997 for $1,389 million with recourse to the Consolidated Revenue Fund of Canadain the event of a loan default.
(4) Includes $2,393 million of surety bond insurance where risk rests with the exporter. A total of 79% of the exports insured in the suretybond program are to the United States. The balance represents exports to other countries.
(5) Includes 164 countries with total exposure ranging from $0.001 million to $576 million
40 C A N A D A ’ S B R I D G E T O G L O B A L T R A D E A N D I N V E S T M E N T
North America/Caribbean* - 67%Europe - 10%South America/Central America - 9%Asia/Pacific- 9%Middle East/Africa - 5%
* Includes Mexico
Exposure by Geographic Market
Loans PortfolioInsurance Policies and
Guarantees Outstanding
EDC_AR_fin_E 4/3/03 11:30 AM Page 12

Concentration of Exposure – Loans Portfolio Over the last four years, gross loans receivable have increased at an average yearly rateof 12%, moving from $16,524 million in 1998 to $26,341 million in 2002. This increase isdue to the continued growth in commercial financing outstanding, ranging from $8,974million in 1998 to $19,401 million in 2002. Over the last four years, commercial loans haveincreased by an average yearly rate of 21%, while sovereign loans outstanding havedeclined over the same period.
Accordingly, the mix between commercial and sovereign loans has continued to shift infavour of commercial loans. In 1998, the ratio of commercial to sovereign was 54:46, whileby 2002 it had shifted to 70:30. In 2002, new signing volume to commercial borrowersaccounted for 97% of total signing volume. During 2002, 332 customers were supportedthrough loans financing (2001 – 252 customers).
Commercial LoansAs depicted, the commercial exposure has increased for the aerospaceand resource industries sectors, while exposure in the informationtechnologies and surface transportation sectors has declined fromlast year. Aerospace exposure has increased by $1 billion in 2002,reflecting EDC’s continued support to customers of 27 Canadianexporters in the aerospace sector. Exposure in the informationtechnology sector declined by more than $900 million from 2001.Reductions in the level of commitments outstanding at the end of theyear account for $520 million of the decrease, while the remainderis due to a reduction in the gross loans receivable balance.
Five counterparties comprising the Corporation’s largest commercialexposure balances collectively represent $7,861 million, or 28%, ofthe total commercial exposure. Of these five, two are foreign transitauthorities within the surface transportation sector, comprising$3,377 million, or 12%.Two are foreign airlines within the aerospacesector, comprising $2,705 million, or 10% and the fifth is a foreignautomotive company within the resource industries sector, com-prising $1,779 million, or 6%.
The ratio of below investment grade loans to total commercialexposure has remained relatively stable from 2001 to 2002 for allsectors except for information technologies. The percentage ofbelow investment grade exposure in this sector represented 8% oftotal commercial exposure in 2002, down from the level of 13%reported in 2001.This can be largely attributed to a 19% decrease inbelow investment grade gross loans receivable in the informationtechnologies sector. Write-offs of $162 million during 2002 in thissector was a contributing factor for the decline.
Gross Loans Loan Total Total($ in millions) Receivable Commitments Guarantees Exposure 2002 Exposure 2001
Commercial Exposure $ % $ %
Aerospace 6,901 2,308 52 9,261 33 8,219 30Resource Industries 6,344 1,952 222 8,518 31 8,175 30Surface Transportation 3,065 268 2,541 5,874 21 5,935 22Information Technologies 2,929 680 73 3,682 13 4,504 16Financial Institutions 162 448 – 610 2 538 2
Total $19,401 $5,656 $2,888 $27,945 100 $27,371 100
E D C A N N U A L R E P O R T 2 0 0 2 41
CommercialSovereign
30,000
25,000
20,000
15,000
5,000
10,000
0 1998 1999 2000 2001 2002
7,55
0 8
,974
7,34
3 1
1,25
5
7,48
0 1
4,54
3
7,54
7 1
7,67
9
6,94
0 1
9,40
1
Gross Loans Receivable
($ in millions)
Below Investment GradeInvestment Grade
10
20
12
21 17
13
19
12
5 | 8
20 |
1
20 |
1
0 | 2
1 | 1
4 | 1
3
35
30
25
20
15
5
10
0
Aero
spac
e 20
01
Reso
urce
Indu
strie
s 20
01
Info
rmat
ion
Tech
nolo
gies
200
1
Surfa
ce Tr
ansp
orta
tion
2001
Fina
ncia
l Ins
titut
ions
200
1
Aero
spac
e 20
02
Reso
urce
Indu
strie
s 20
02
Info
rmat
ion
Tech
nolo
gies
200
2
Surfa
ce Tr
ansp
orta
tion
2002
Fina
ncia
l Ins
titut
ions
200
2
Commercial Loans Exposure(% of Exposure)
EDC_AR_fin_E 4/3/03 11:30 AM Page 13

Sovereign LoansThe Corporation has the following sovereign risk concentrations for its sovereign portfolio:
Gross Loans Loan Total Total($ in millions) Receivable Commitments Guarantees Exposure 2002 Exposure 2001
Sovereign Exposure $ % $ %
Canada 1,259 130 – 1,389 16 1,475 15China 933 254 1 1,188 14 1,613 17Peru 581 – – 581 7 616 6Indonesia 513 – – 513 6 527 5Venezuela 292 205 9 506 6 533 6Algeria 440 53 – 493 6 539 6Cameroon 374 – – 374 4 405 4Other 2,548 1,029 100 3,677 41 4,011 41
Total $6,940 $1,671 $110 $8,721 100 $9,719 100
The sovereign portfolio as a whole has decreased from 2001 by $998 million, or 10%. This, mainly can be attributed to thedecline in the value of sovereign gross loans receivables, which decreased by $565 million, or 8.1%. Repayments exceeded dis-bursements in 2002 in the sovereign loan portfolio.
Concentration of Exposure – Insurance Portfolio
Insurance Policies Outstanding($ in millions) 2002 2001
Short-term 7,097 6,255Medium-term 5,168 5,689
Total $12,265 $11,944
At December 31, 2002, policies with terms of less than one year comprised 68% ofthe total exposure compared to 59% in 2001.
Short-term Program
Size Concentration
During 2002, the short-term program supported 5,435 customers. In terms of total insured volume, the top five customers represented 27% of the total 2002 insured volume (2001 – 16%). The largest number of buyers in terms of aggregate creditauthorizations is within the $1,000 to $500,000 range and has remained relatively unchanged from 2001 levels in terms of overall concentration.
The following table shows the number of foreign buyers and the respective exposure for the year classified by exposure sizewithin the short-term portfolio:
2002 2001
$ Value of Foreign Exposure* Total TotalNumber of Exposure Number of Exposure
($ in thousands) Foreign Buyers ($ in millions) Foreign Buyers ($ in millions)
1 – 500 47,110 5,828 43,227 5,337501 – 2,000 3,758 3,596 3,890 3,7142,001 – 5,000 855 2,717 987 3,1285,001 – 10,000 327 2,272 343 2,39410,001 and over 258 7,089 297 7,848
Total 52,308 $21,502 48,744 $22,421
* Excludes buyers located in Canada as most of the Corporation’s domestic business is now being underwritten by St. Paul GuaranteeInsurance Company.
42 C A N A D A ’ S B R I D G E T O G L O B A L T R A D E A N D I N V E S T M E N T
Less than 1 year - 68%1 - 5 years - 24%More than 5 years- 8%
Insurance Policies Outstanding by Policy Term
EDC_AR_fin_E 4/3/03 11:30 AM Page 14

Country Concentration
The largest concentrations within the short-term program are in the following countries:
($ in millions) 2002 2001
$ % $ %
U.S. 4,226 60 U.S. 3,450 55United Kingdom 248 3 Brazil 237 4South Korea 225 3 Japan 228 4Brazil 188 3 Canada 194 3Japan 187 3 United Kingdom 188 3Other* 2,023 28 Other* 1,958 31
Total $7,097 100 Total $6,255 100
* Includes 135 countries with concentrations ranging from $0.001 million to $182 million (2001 – 138 countries ranging from $0.001 million to $163 million).
Industry Concentration
The insurance policies’ liability in terms of industry concentration are as follows:
Medium-term Insurance Program
Size Concentration
During 2002, 540 customers were supported in the medium-term program (2001 – 432). The top five customers represented42% of the 2002 medium-term insurance policies outstanding (2001 – 58%). The largest exposure within the top five customers is $893 million. The five largest policies as at December 31, 2002, represent 13% (2001 – 16%) of the total medium-term policies outstanding.
E D C A N N U A L R E P O R T 2 0 0 2 43
20012002
9 8
2728
2122
16
12
15
19
10
13
30
25
20
15
5
10
0
Agri-
Food
Fore
stry
Base
& S
emi
Man
ufac
turin
g
Info
rmat
ion
Tech
nolo
gies
Cons
umer
Goo
ds
Oth
er
Insurance Policies’ Liability – by Industry SectorShort-term Programs
(%)
EDC_AR_fin_E 4/3/03 11:30 AM Page 15

Country Concentration
As at December 31, 2002, the medium-term insurance policies and guarantees outstanding portfolio comprised 2,113 transactionsin 134 countries (2001 – 1,838 transactions in 129 countries) with an average exposure of $2.4 million (2001 – $3.1 million).
The largest insurance policies and guarantees outstanding in terms of where the risk resides within the medium-term portfolio are in the following countries:
($ in millions) 2002 2001
Insurance Insurance Insurance Guarantees $ % Insurance Guarantees $ %
Canada 2,409 40 2,449 47 Canada 2,387 41 2,428 43U.S. 115 474 589 11 U.S. 68 327 395 7Mexico 218 6 224 4 Brazil 323 1 324 6Israel 4 211 215 4 Mexico 273 7 280 5Colombia 204 – 204 4 China 209 27 236 4Other* 1,020 467 1,487 30 Other* 1,283 743 2,026 35
Total $3,970 $1,198 $5,168 100 Total $4,543 $1,146 $5,689 100
* Includes 129 countries with concentrations ranging from $0.009 million to $183 million (2001 – 122 countries ranging from $0.012 million to $222 million).
Exposure in Canada is made up largely ($2,393 million) of surety bond insurance (2001 – $2,364 million), 79% of which is to support exports to theUnited States (2001 – 54%).
Program Concentration
Total medium-term exposure has decreased by $521 million or 9% over 2001results. Surety bond exposure increased by $30 million and performancesecurity program exposure decreased by $319 million over 2001 results.
Credit Quality – LoansRisk concentration remains comparable to 2001, with the largest increaseattributable to impaired loans. The performing gross loans receivable grew by2% in 2002 to $24,082 million from the 2001 level of $23,576 million. The levelof growth in the performing portfolio is below that experienced in prior yearsdue primarily to reduced net disbursements and increased impairments in2002.
Impaired LoansImpaired loans represent loans for which the Corporation no longer has reasonable assurance that the full amount of principal and interest will becollected on a timely basis in accordance with the terms of the loan agreement.Impaired loans as a percentage of total gross loans receivable increased from6.5% in 2001 to 8.6% in 2002.This is higher than the average impaired loans of8.0% over the last five years, a reflection of the current economic environment.
In 2002, loans totaling $840 million became impaired. These were composed of17 commercial loans in the following countries: United States ($291 million),Argentina ($114 million), Brazil ($185 million), Mexico ($60 million),Germany ($63 million), Sweden ($18 million), others ($1 million) and sovereignloans to counterparties in Argentina ($66 million) and Kenya ($42 million).During the year, no loans were reclassified from impaired to performing.
Impaired loans to seven commercial borrowers ($162 million) and one sovereignborrower ($32 million) totaling $194 million were written off against theallowance for loan losses. These loans were fully provided for by the allowancefor loan losses and $128 million of these loans had been made impaired in 2002.
44 C A N A D A ’ S B R I D G E T O G L O B A L T R A D E A N D I N V E S T M E N T
20012002
50
40
30
10
20
0
Polit
ical
Risk
Spec
ific
Tran
sact
ion
Sure
tyBo
nd
Perfo
rman
ceSe
curit
y
20 19
9
26
4642
9
29
ImpairedBelow Investment GradeInvestment Grade
30
25
20
15
5
10
0 1998 1999 2000 2001 2002
ImpairedBelow Investment GradeInvestment Grade
100
80
60
20
40
0 1998 1999 2000 2001 2002
Concentration by Program(%)
Gross Loans Receivables($ in billions)
Gross Loans Receivables(%)
EDC_AR_fin_E 4/3/03 11:30 AM Page 16

The largest concentrations of gross loans receivable for impaired loans are listed in the following table:
($ in millions) 2002 2001Gross Non-accrued Gross Non-accruedLoans Capitalized Loans Loans Capitalized Loans
Receivable Interest Receivable Receivable Interest Receivable
SovereignCameroon 374 322 52 405 323 82Ivory Coast 208 208 – 264 183 81Russia 135 60 75 138 60 78Yugoslavia 192 192 – 122 – 122Pakistan 112 34 78 95 16 79Other 400 173 227 296 160 136
Subtotal 1,421 989 432 1,320 742 578
CommercialInformation Technologies 376 11 365 166 – 166Resource Industries 320 1 319 107 – 107Aerospace 141 – 141 54 – 54Financial Institutions 1 – 1 1 – 1Surface Transportation – – – 2 – 2
Subtotal 838 12 826 330 – 330
Total Impaired 2,259 1,001 1,258 1,650 742 908Less: Specific Allowance 582 370
Net Impaired Loans Receivable $676 $538
When sovereign borrowers experience financial difficulties and are unable to meet their debt obligations, sovereign creditors,including the Government of Canada, agree at an international forum, the Paris Club, to formally reschedule the borrower’s debtobligations. From time to time and on a case-by-case basis, the most heavily indebted sovereign borrowers are granted debtreduction or debt service relief by the Government of Canada. The granting of debt reduction or relief by the Paris Club is contingent upon the sovereign borrower’s ability to implement and maintain economic programs outlined by the InternationalMonetary Fund.
In the past, the Government of Canada has reimbursed the Corporation an amount equal to the debt relief granted by theGovernment of Canada to the Corporation’s sovereign borrowers. The formula for calculating the amount to be paid to theCorporation was amended effective April 1, 2001 in two ways. Firstly, for new loans issued by the Corporation to sovereign borrowers which were on the Paris Club debt relief list as at April 1, 2001, the Government of Canada has no obligation to compensate the Corporation for further debt relief granted to such borrowers. Secondly, for any debt reduction for new loansresulting from unilateral debt relief measures or new debt reduction for obligations contracted prior to April 1, 2001, EDC willshare in the costs of debt forgiveness to the amount of its appropriate specific allowances.
Amounts received for debt relief arrangements on sovereign impaired loans are credited to the book value of the loans similarto the treatment accorded to other receipts on impaired loans. To the extent that amounts received exceed the book value of theloans as a result of non-accrued capitalized interest, debt relief income is recorded, and any provisions are returned to income.
Payments received from the Government of Canada for debt relief for sovereign loans totaled $402 million in 2002 (2001 – $13 million)and related to Yugoslavia ($155 million), Cameroon ($119 million), Ivory Coast ($115 million), Bolivia ($10 million) and othercountries ($3 million). These amounts are not included as receipts from borrower countries in the table below.
The following cash flows pertain to impaired loan debtors and represent, in the case of sovereign receipts, the long-term effortsof multilateral rescheduling arrangements through the Paris Club. The largest receipts for impaired loans including contractualprincipal and interest from borrowers were as noted:
($ in millions) 2002 2001
Sovereign SovereignRussia 8 Russia 11Pakistan 2 Gabon 10Other 7 Other 8
Subtotal 17 Subtotal 29Commercial 92 Commercial 5
Total $109 Total $34
E D C A N N U A L R E P O R T 2 0 0 2 45
EDC_AR_fin_E 4/3/03 11:30 AM Page 17

Loan CommitmentsLoan commitments include undisbursed amounts on signed loans, letters ofoffer outstanding and unallocated confirmed lines of credit.
In 2002, loan commitments on investment grade financing accounted for 62%of the total commitments compared to 46% in 2001. This result is reflectiveof a higher concentration of loan signings for investment grade loans.
Credit Quality – Insurance
Short-termWithin the short-term programs, the comparative spread in terms of countryrisk classification has remained relatively unchanged in 2002 compared withthe 2001 levels.
Medium-termWithin the medium-term programs, there was a 5% increase in high investmentgrade concentration in 2002 compared with 2001 levels.
The increase in high investment grade in 2002 was mainly the result of anoverall increase of 49% in exposure in the United States, due to the issuance ofseveral performance guarantee policies. This increase was partially offset by theexpiration of performance world wide policies within the high investmentgrade category.
Claims Experience($ in millions) 2002 2001
Claims paid 144 144Claims recovered 39 51
Net claims $105 $93
In 2002, the Corporation paid 1,857 claims in 78 countries. During the sameperiod in 2001, the Corporation paid 1,712 claims in 66 countries.
In 2002, claim payments were particularly impacted by the financial problemsencountered in the industrial equipment sector. The 138 claim payments for$45 million represented 7% of the total number of claim payments and 31%of the total amount paid. Commercial defaults by buyers in Argentina andMexico represented the majority of payments.
The value of claim payments remained the same as 2001 at $144 million.Meanwhile, the number of claims paid increased 8% from 2001.
The claims paid as a percentage of insurance policies outstanding over thepast five years has averaged 1.00%.
46 C A N A D A ’ S B R I D G E T O G L O B A L T R A D E A N D I N V E S T M E N T
SpeculativeBelow Investment GradeMedium Investment GradeHigh Investment Grade
100
80
60
20
40
0 2001 2002
SpeculativeBelow Investment GradeMedium Investment GradeHigh Investment Grade
100
80
60
20
40
0 2001 2002
Insurance PoliciesOutstanding – Short-Term
(%)
Insurance Policies Outstanding – Medium-Term
(%)
2,000
1,500
1,000
500
0
160
120
80
40
01998 1999 2000 2001 2002
Number of ClaimsClaims Paid
Claims PaidNumber of Claims ($ in millions)
Below Investment GradeInvestment Grade
10,000
8,000
6,000
2,000
4,000
0 2001 2002
Loan Commitments($ in millions)
EDC_AR_fin_E 4/3/03 11:30 AM Page 18
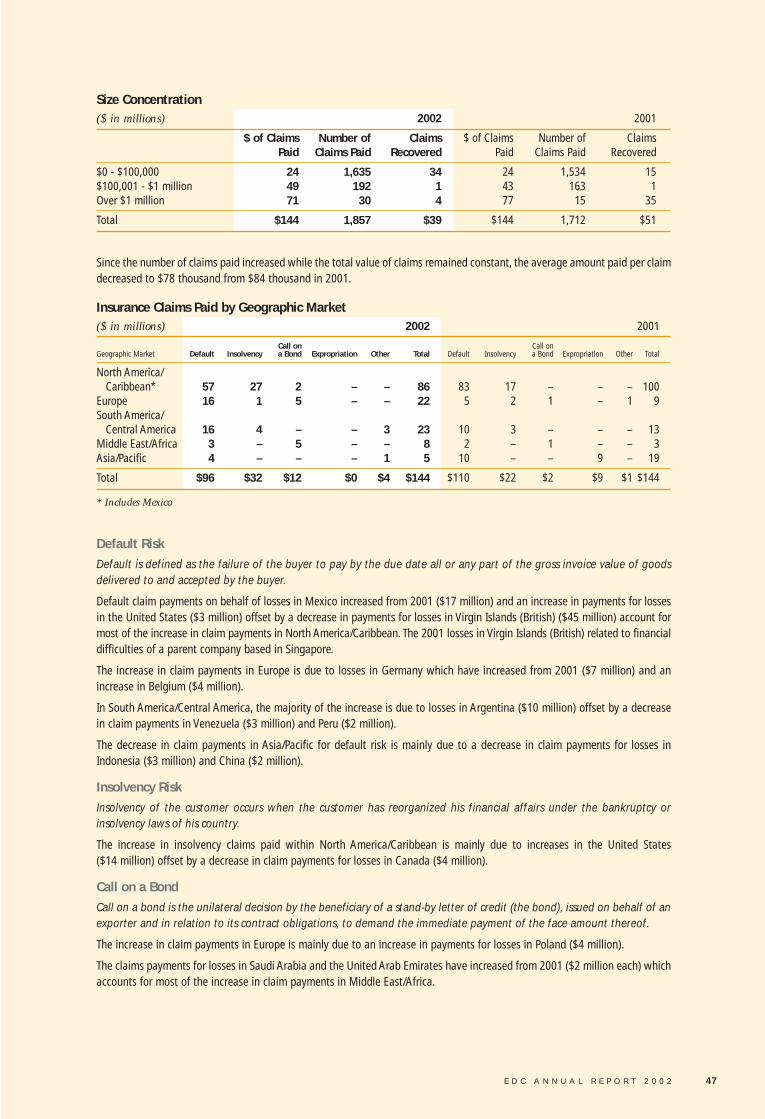
Size Concentration($ in millions) 2002 2001
$ of Claims Number of Claims $ of Claims Number of ClaimsPaid Claims Paid Recovered Paid Claims Paid Recovered
$0 - $100,000 24 1,635 34 24 1,534 15$100,001 - $1 million 49 192 1 43 163 1Over $1 million 71 30 4 77 15 35
Total $144 1,857 $39 $144 1,712 $51
Since the number of claims paid increased while the total value of claims remained constant, the average amount paid per claimdecreased to $78 thousand from $84 thousand in 2001.
Insurance Claims Paid by Geographic Market($ in millions) 2002 2001
Call on Call onGeographic Market Default Insolvency a Bond Expropriation Other Total Default Insolvency a Bond Expropriation Other Total
North America/Caribbean* 57 27 2 – – 86 83 17 – – – 100
Europe 16 1 5 – – 22 5 2 1 – 1 9South America/
Central America 16 4 – – 3 23 10 3 – – – 13Middle East/Africa 3 – 5 – – 8 2 – 1 – – 3Asia/Pacific 4 – – – 1 5 10 – – 9 – 19
Total $96 $32 $12 $0 $4 $144 $110 $22 $2 $9 $1 $144
* Includes Mexico
Default Risk
Default is defined as the failure of the buyer to pay by the due date all or any part of the gross invoice value of goodsdelivered to and accepted by the buyer.
Default claim payments on behalf of losses in Mexico increased from 2001 ($17 million) and an increase in payments for lossesin the United States ($3 million) offset by a decrease in payments for losses in Virgin Islands (British) ($45 million) account formost of the increase in claim payments in North America/Caribbean. The 2001 losses in Virgin Islands (British) related to financialdifficulties of a parent company based in Singapore.
The increase in claim payments in Europe is due to losses in Germany which have increased from 2001 ($7 million) and anincrease in Belgium ($4 million).
In South America/Central America, the majority of the increase is due to losses in Argentina ($10 million) offset by a decreasein claim payments in Venezuela ($3 million) and Peru ($2 million).
The decrease in claim payments in Asia/Pacific for default risk is mainly due to a decrease in claim payments for losses inIndonesia ($3 million) and China ($2 million).
Insolvency Risk
Insolvency of the customer occurs when the customer has reorganized his financial affairs under the bankruptcy or insolvency laws of his country.
The increase in insolvency claims paid within North America/Caribbean is mainly due to increases in the United States ($14 million) offset by a decrease in claim payments for losses in Canada ($4 million).
Call on a Bond
Call on a bond is the unilateral decision by the beneficiary of a stand-by letter of credit (the bond), issued on behalf of anexporter and in relation to its contract obligations, to demand the immediate payment of the face amount thereof.
The increase in claim payments in Europe is mainly due to an increase in payments for losses in Poland ($4 million).
The claims payments for losses in Saudi Arabia and the United Arab Emirates have increased from 2001 ($2 million each) whichaccounts for most of the increase in claim payments in Middle East/Africa.
E D C A N N U A L R E P O R T 2 0 0 2 47
EDC_AR_fin_E 4/3/03 11:30 AM Page 19

Expropriation Risk
Expropriation is described as direct or indirect action(s) or omission(s), taken, authorized or condoned by a foreign government which have the result of depriving an insured of the benefits, use or control of its asset or investment.
The $9 million in claim payments made in Asia/Pacific for expropriation risk in 2001 is due to losses in Pakistan. No similar claimpayments occurred in 2002.
Industry Concentration
The majority of the claims paid in 2002were in the industrial equipment sector,mainly in Mexico ($15 million) andArgentina ($14 million). In 2001, themajority of the payments in the forestrysector were due to losses resulting fromfinancial difficulties of a Singapore basedforestry conglomerate ($45 million) andlosses in China ($2 million). Within thefinancial institutions industry sector,the claims paid in 2002 were mainlydue to losses in the United States ($6 million) and Poland ($4 million).
Claims Submitted
At the end of 2002, the value of the claims requests thatwere still under consideration was $35 million (2001 – $48million). The largest concentrations are related to claimspending for losses in the United States ($24 million) andJordan ($5 million).
The value of claims submitted has decreased from $232 mil-lion in 2001 to $213 million in 2002 while the number ofclaims submitted increased from 2,571 in 2001 to 2,829 in2002. The decrease in value from 2001 is mainly due to largeclaims in the Virgin Islands (British) in 2001. The five coun-tries with the largest claims submitted in 2002 were theUnited States ($118 million), Argentina ($25 million), Mexico($22 million), Jordan ($6 million) and Poland ($4 million).
Credit Quality – Investments and Derivative Financial InstrumentsEDC’s interest-bearing deposits and investment portfolio expose EDC to the risk that the deposit-taking institutions or theinvestment issuer will not repay EDC in accordance with contractual terms. EDC’s potential deposit and investment credit exposure is represented by the carrying value of the financial instruments.
The following table provides a breakdown, by credit rating and term to maturity, of EDC’s deposit and investment credit exposure.
($ in millions)
Remaining Term to Maturity
Credit Under 1 1 to 3 Over 3 2002 2001Rating* Year Years Years Net Exposure Net Exposure
Aaa 1,122 123 352 1,597 974Aa1 223 15 10 248 471Aa2 331 17 27 375 115Aa3 406 91 43 540 577A1 60 10 – 70 161A2 46 – – 46 57A3 32 – – 32 –
Total $2,220 $256 $432 $2,908 $2,355
* Moody’s long-term rating
48 C A N A D A ’ S B R I D G E T O G L O B A L T R A D E A N D I N V E S T M E N T
20012002
19
45
4
18
10
18
13 12
54
7
18
713 13
11 11 96
60
50
40
30
10
20
0
Indu
stria
lEq
uipm
ent
Fina
ncia
lIn
stitu
tions
Info
rmat
ion
Tech
nolo
gies
Cons
umer
Goo
ds
Emer
ging
Expo
rter
s
Base
and
Sem
i-Man
ufac
ture
dG
oods
Engi
neer
ing
and
Prof
essi
onal
Ser
vice
s
Oth
er
Fore
stry
Claims SubmittedClaims PaidClaims UnderConsideration
1998 1999 2000 2001 2002
250
200
150
50
100
0
Claims Paid by Industry Sector($ in millions)
Claims Submitted, Paid and Under Consideration
($ in millions)
EDC_AR_fin_E 4/3/03 11:30 AM Page 20

Derivatives expose EDC to the risk that the counterparty will not repay EDC in accordance with contractual terms. EDC’s potentialderivative credit exposure is represented by the replacement cost of contracts that have positive fair value.
The following table provides a breakdown, by credit rating and term to maturity, of EDC’s derivative credit exposure.
($ in millions)
Remaining Term to Maturity
Credit Under 1 1 to 3 Over 3 Exposure Collateral 2002 Net 2001 NetRating* Year Years Years Total Netting ** Held Exposure Exposure
Aaa 3 13 22 38 (14) – 24 7Aa1 15 38 30 83 (62) – 21 5Aa2 5 1 42 48 (42) – 6 24Aa3 41 89 244 374 (58) (68) 248 125A1 – – – – – – – 42
Total $64 $141 $338 $543 $(176) $(68) $299 $203
* Moody’s long-term rating
** As a result of master netting agreements
The Department of Finance sets out guidelines that limit the counterparty credit quality of EDC’s investments and derivativefinancial instruments. In addition, EDC has policies and procedures in place to limit and to manage the credit risk associatedwith these financial instruments.
Credit risk for investments and derivative financial instruments is reported on a monthly basis to the Asset/Liability ManagementCommittee and quarterly to the Risk Management Committee of the Board.
Allowance for Losses on Loans,Loan Commitments andGuaranteesEDC’s allowance for losses on loans, loan commitmentsand guarantees was $3,990 million at December 31,2002, an increase of $510 million from 2001.
The allowance as a percentage of total exposure has increased to 10.9% in 2002. The increase from2001 was primarily caused by the economic down-turn experienced in global markets. Numerous airlinedowngrades and financial uncertainty in the aerospacesector were primarily responsible for the increase inprovisioning. As well, new impaired loans of $840 millioncaused an increase in provisioning, with telecomfinancing representing 51% of the total impairment.
The current provisioning methodology is comprisedof various components of the total allowance whichallows EDC to adequately provide for increased risks tospecific counterparties, industries, and countries.Theseare represented by the counterparty concentration,country overlay, and industry overlay components,respectively, and are explained in more detail in thefollowing sections.
E D C A N N U A L R E P O R T 2 0 0 2 49
9.4
10.9
15
12
9
3
6
0 2001 2002
Allowance as aPercentage of TotalExposure
(%)
20012002
60
50
40
10
20
30
0
Base
Gen
eral
Spec
ific
Coun
try
Ove
rlay
Indu
stry
Ove
rlay
Coun
terp
arty
Conc
entr
atio
n
Allowance Components
(%)
EDC_AR_fin_E 4/3/03 11:30 AM Page 21

Counterparty Concentration A concentration component is added to adequately provision for sovereign and commercialcounterparties whose level of exposure is deemed by management to represent anincreased amount of risk. At December 31, a counterparty whose exposure exceeds 10%of shareholder’s equity will attract a concentration component calculated on the portionof exposure over that threshold. The allowance on this portion of exposure is calculatedat the base allowance rate for that counterparty. The threshold is set based on externalbenchmarks for commercial chartered banks.
Indonesia and Venezuela represent 79% of the sovereign concentration allowance, whilecounterparties in the aerospace industry comprise 83% of the commercial concentrationallowance.
Country OverlayA country overlay component is added for exposure to countries with negative outlooksthat are experiencing economic downturns or recession. For countries with negative outlooks, the full impact of downturns or economic uncertainty are often not reflected incurrent credit ratings. This is due to timing issues for financial uncertainties that are oftennot reflected in credit ratings for up to two years after a downturn begins. The amount ofoverlay added is directly related to the amount of exposure, both sovereign and commercial,in every country with a negative outlook.An incremental allowance is added based on thecurrent allowance and probability of a downgrade. When a country’s outlook changes tostable, a reversal of the overlay is amortized over the subsequent two years.The United States,Venezuela and Brazil collectively represent 80% of the total country overlay allowance.
The overlay for Venezuela was increased in 2002 to reflect the heightened economicuncertainty brought about by the volatile political situation and general strike thatVenezuela was experiencing at the end of 2002.
Industry OverlayAn industry overlay component is added to reflect the risk of economic downturns beingexperienced by companies in certain industries that are on credit watch or have negativeoutlooks. It is believed that companies in these industries have a greater risk than isreflected in current credit ratings. This is due to timing issues for financial difficulties thatmay not be reflected in current financial results, or for companies that are expected to bedowngraded in the near future. The amount of overlay added is directly related to theamount of exposure to each company and the probability of a subsequent downgrade.Based on the probability of the downgrade and the likely credit rating, an appropriateamount of incremental allowance is added.
The aerospace industry comprises 71% of the total industry overlay and reflects the current financial uncertainty that many aerospace concerns are experiencing, which mayresult in further credit rating downgrades.
50 C A N A D A ’ S B R I D G E T O G L O B A L T R A D E A N D I N V E S T M E N T
20012002
60
50
40
30
10
20
0
Aero
spac
e
Indo
nesi
a
Vene
zuel
a
Oth
er
CounterpartyConcentration
(%)
20012002
50
40
10
20
30
0
Uni
ted
Stat
es
Vene
zuel
a
Braz
il
Indo
nesi
a
Oth
er
20012002
80
60
40
20
0
Aero
spac
e
Tele
com
Oth
er
Country Overlay(%)
Industry Overlay(%)
EDC_AR_fin_E 4/3/03 11:30 AM Page 22

Allowance for Claims on Insurance As at December 31, 2002, the allowance for claims oninsurance is $460 million, a decrease of $4 million or1% over the 2001 allowance of $464 million. During 2002,$115 million was charged to the income statement forthe provision for credit losses relating to claims oninsurance. This was offset by charges to the allowanceof $111 million, due to write-offs of recoverable claimspaid and claims expenses of $8 million. Despite thegrowth experienced in most insurance programs aswell as a corresponding growth in the claims incurredbut not reported, the impact of a refinement in theactuarial valuation methodology resulted in a netdecrease in the allowance.
Seventy-eight per cent of the total unrecoverable portionof claims paid amount was attributable to short-terminsurance claims.
The allowance as a percentage of insurance policiesoutstanding has remained within a range of 3.1% to3.9% averaging 3.5% over the last five years. Theallowance is based on an actuarial valuation of theinsurance policy and claim liabilities. The actuarial valu-ation uses simulation techniques and is based onassumptions (frequency of claim and severity of loss)relevant for each insurance program separately and isderived from the Corporation’s own experience.Moreover, the allowance includes a provision foradverse deviation such that it will be sufficient to coverall expected losses 19 times out of 20.
CapitalizationThe gross assets of the Corporation are $29.9 billion (2001 – $28.2 billion), which are supported by shareholder’s equity and allowances of $6.5 billion (2001 – $6.0 billion). At this level of capitalization, 22% of assets do not require external debtfinancing (2001 – 21%).
The following table shows the capitalization of EDC over the last five years:
($ in millions) 2002 2001 2000 1999 1998
Shareholder’s equity:Capital 983 983 983 983 983Retained earnings 1,094 1,067 1,009 815 697
Subtotal 2,077 2,050 1,992 1,798 1,680Allowances 4,470 3,964 3,289 2,798 2,516
Total capitalization $6,547 $6,014 $5,281 $4,596 $4,196
Operational, Organizational and Business RisksOperational risk is the potential risk of loss from human error, internal control weaknesses and systems deficiencies. Organizationalrisk is the risk of loss or cost to the company due to the organizational environment (people and skills, incentives, culture andvalues). Business risk is the potential for loss relating to EDC’s external environment or to its relations with stakeholders.
EDC manages and monitors these three types of risk and strives to develop tools and techniques based on best-in-class practice.To manage its operational risks, EDC has policies and procedures in place that establish clear segregation of responsibilities andtimely internal reporting to management. To mitigate risks associated with its organizational and business environment, EDCmakes use of a broad array of policies, practices, statements of corporate vision and values and business strategies and plans.
E D C A N N U A L R E P O R T 2 0 0 2 51
North America/Caribbean - 60%*South America/Central America - 17%Europe - 13%Middle East/Africa - 5%Asia/Pacific - 5%
* Includes Mexico
4.0
3.0
3.5
2.0
2.5
1.0
1.5
0.0
0.5
1998 1999 2000 2001 2002
Unrecoverable Portionof Claims Paid byGeographic Market
Allowance as a % ofInsurance PoliciesOutstanding
(%)
EDC_AR_fin_E 4/3/03 11:30 AM Page 23

Market RiskMarket risk is the likelihood of loss to EDC as a result of movements in interest and foreign exchange rates and the risk thatfunds will not be available to meet corporate obligations. This risk is mitigated through the management of EDC’s asset/liabilitypositions, through the use of derivatives, and through the maintenance of sufficient liquidity.
The Corporation manages its exposure to market risk using policy limits developed in consultation with the Department ofFinance, overseen by the Risk Management Committee of the Board of Directors and approved by the Board of Directors. TheCorporation’s Capital Markets group meets weekly to discuss market and credit risks and to analyze borrowing requirements.These activities and the asset/liability positions are reported monthly (or more frequently as required) to EDC’s Asset/LiabilityManagement Committee, and quarterly to its Risk Management Committee of the Board, and to the Board of Directors.
The likelihood of loss to EDC as a result of possible movements in interest and foreign exchange rates is monitored andmanaged within operational guidelines and Board-approved policies. Market risk is aggregated and managed on an integratedbasis. Limits exist for interest rate and foreign exchange rate shock effects in relation to projected net interest income and economic value. Exposures are classified, calculated and limited on a consolidated Canadian dollar equivalent basis, coveringEDC’s lending, investing, funding and derivative transactions.
EDC continues to improve analytical techniques, information systems and reporting to enhance the evaluation and control ofrisk. The Market Risk Management Policies are reviewed annually with the Corporation’s Board of Directors, and compliance isreviewed quarterly with the Risk Management Committee of the Board of Directors.
Asset/Liability Management Asset terms are set to meet the needs of external parties. EDC arranges its liabilities accordingly but must balance the need tomatch its assets and liabilities with opportunities to obtain optimal funding levels. In doing so, EDC may expose itself to interestrate and foreign exchange risk. Asset/liability gaps are measured against policy limits and reported to senior management ona monthly basis.
Interest Rate RiskInterest rate risk is the exposure of the Corporation’s market value and net interest income to adverse movements in interestrates. Interest rate risk exists where there is a mismatch between maturities or interest rate resets between assets and liabilities.
EDC manages its interest rate risk in accordance with guidelines established by the Department of Finance, as well as policiesset by the Board of Directors. EDC reports on its interest rate risk on a monthly basis to the Asset/Liability ManagementCommittee, and on a quarterly basis to the Risk Management Committee of the Board.
The table below is an aging distribution of EDC’s fixed and floating rate financial instruments as at December 31, 2002. All figures are present values translated into Canadian dollars. Since capital, which bears no interest, is used to fund a portion ofthe interest-earning assets of the Corporation, there will always be a sensitivity to interest rates. EDC has chosen, strategically,to use its capital to fund the longest-term fixed rate assets, therefore its interest rate sensitivity is in the longer-dated fixed ratematurities.
Interest Rate Sensitivity(Present Value $ in millions)
1d-6m 6m-12m 12m-5y 5y-10y 10y-15y 15y+ Total
AssetsFixed rate 679 362 4,420 5,095 4,022 963 15,541Floating rate 14,939 – – – – – 14,939Investments 3,107 – – – – – 3,107
Total $18,725 $362 $4,420 $5,095 $4,022 $963 $33,587
LiabilitiesFixed rate 1,063 173 3,601 327 660 42 5,866Floating rate 12,042 – – – – – 12,042Commercial paper 5,251 – – – – – 5,251
Total $18,356 $173 $3,601 $327 $660 $42 $23,159
Interest rate sensitivity position 369 189 819 4,768 3,362 921 10,428
Cumulative position $369 $558 $1,377 $6,145 $9,507 $10,428
52 C A N A D A ’ S B R I D G E T O G L O B A L T R A D E A N D I N V E S T M E N T
EDC_AR_fin_E 4/3/03 11:30 AM Page 24

Foreign Exchange Risk Foreign exchange risk is the exposure of the Corporation’s net interest income and market value to adverse movements in foreign exchange rates. Foreign exchange risk exists where there is a mismatch between assets and liabilities in any currency.EDC manages foreign exchange risk within Board approved policies with the objective of minimizing foreign exchange losses.
EDC’s foreign exchange risk is managed in accordance with guidelines established by the Department of Finance, as well aspolicies set by the Board of Directors. EDC reports on its foreign exchange risk on a monthly basis to the Asset/LiabilityManagement Committee, and on a quarterly basis to the Risk Management Committee of the Board.
DerivativesEDC uses a variety of derivatives to manage costs, returns and levels of financial risk associated with its funding, investmentand risk management activities. EDC’s use of derivatives may include, but is not restricted to, currency and interest rate swaps,foreign exchange contracts and equity index swaps. EDC does not use derivatives for speculative purposes.
EDC does not engage in the use of derivatives whose value and financial risks cannot be measured, monitored and managedon a timely basis. The Market Risk Management department formally reviews EDC derivative financial instrument transactionsat time of inception, and on an ongoing basis, to provide an independent verification on the valuation of transaction structures,and of associated financial risks.
The use of any new derivative products is reviewed and reported separately by the Market Risk Management department to theTreasurer and the Senior Vice-President and Chief Financial Officer. Financial risks associated with derivatives are controlled andreported as specified in Market Risk Management Policies approved by the Board of Directors. EDC’s use of derivatives is typicallylinked to the following activities:
FundingDerivatives are used to achieve reduced fixed rate or sub-LIBOR floating rate funding costs. An example would be issuing anEDC bond in a foreign currency, on a fixed interest rate basis, and entering into a currency and interest rate swap with a creditworthy counterparty to achieve low-cost floating rate U.S. dollar denominated debt, thereby replacing the foreign currencydenominated payment obligations with U.S. dollar denominated obligations. The combination of the bond issue and swap woulddeliver a more favourable cost of funding than could be achieved using a straight U.S. dollar floating rate bond issue.
InvestingDerivatives are used to maximize yields on investments. For example, rather than invest directly in a three month U.S. dollartreasury bill, EDC may obtain a higher yield by investing in a Japanese yen swapped deposit, where U.S. dollars are convertedto yen and invested in a three-month yen deposit. At maturity, the maturing term deposit plus interest is swapped back into U.S.dollars. This structure uses a forward foreign exchange contract to enhance the investment yield.
Risk ManagementDerivatives are used to hedge risks by diversifying concentrated exposures. For example, EDC might balance the proportion offixed to floating rate assets in its investment book, using interest rate swaps, in order to diversify interest rate risk.
Liquidity RiskLiquidity risk is the risk that funds will not be available to meet current and future cash outflow requirements. Pursuant to itsrisk management policies, EDC must maintain enough liquidity to meet the following six months’ net cash outflow requirementswithout accessing the capital markets (i.e., bond issuance). This is ensured by measuring and reporting to senior managementEDC’s actual liquidity position against this minimum limit on a monthly basis.
EDC maintains liquidity through a variety of methods:
� Access to Commercial Paper Markets: In the course of EDC’s normal activities, the Corporation’s commercial paper programsprovide it with the necessary liquidity to meet its cash requirements on a daily basis. During 2002, the average balance ofshort-term debt was $3,443 million (2001 – $3,313 million) with a turnover of 16 times (2001 – 17 times).
� Cash and Marketable Securities: EDC holds cash and marketable securities to ensure that sufficient liquidity is available,if required, to meet forecasted cash requirements. During 2002, the average balance of cash and marketable securities was$2,759 million (2001 – $2,840 million)
� Standby Credit Facility: As a contingency, EDC also maintains a U.S. $2 billion standby revolving credit facility to furtherensure its liquidity. To date, it has not been necessary to use this facility.
E D C A N N U A L R E P O R T 2 0 0 2 53
EDC_AR_fin_E 4/3/03 11:30 AM Page 25

T
54 C A N A D A ’ S B R I D G E T O G L O B A L T R A D E A N D I N V E S T M E N T
Financial Reporting Responsibility
he consolidated financial statements containedin this Annual Report have been prepared bymanagement in accordance with generallyaccepted accounting principles appropriate inthe circumstances and consistently applied.The integrity and objectivity of the data inthese consolidated financial statements aremanagement’s responsibility. The consolidatedfinancial statements include some amounts,such as the allowances for losses on loans, theallowance for loan commitments and guaranteesand the allowance for claims on insurance, thatare necessarily based on management’s bestestimates and judgment. Management is alsoresponsible for all other information in the
Annual Report and for ensuring that this information is consistent, where appropriate,with the information and data contained in the consolidated financial statements.
In support of its responsibility, management maintains financial, managementcontrol and information systems and management practices to provide reasonableassurance that the financial information is reliable, that the assets are safeguardedand that the operations are carried out effectively. The Corporation has an internalaudit department whose functions include reviewing internal controls and theirapplication, on an ongoing basis.
The Board of Directors of EDC is responsible for the management of the businessand activities of the Corporation. In particular, it is responsible for ensuring thatmanagement fulfills its responsibilities for financial reporting and internal controland exercises this responsibility through the Audit Committee of the Board, which iscomposed of Directors who are not employees of the Corporation. The AuditCommittee meets with management, the internal auditors and the Auditor Generalof Canada on a regular basis.
Contracts which, in the opinion of EDC, involve risks in excess of that which theCorporation would normally undertake, may be entered into under the authority ofthe Minister for International Trade and the Minister of Finance where the Ministerfor International Trade considers them to be in the national interest. Funds requiredfor such contracts are paid to the Corporation by the Minister of Finance out of theConsolidated Revenue Fund, and funds recovered are remitted to the ConsolidatedRevenue Fund, net of amounts withheld to cover related administrative expenses.These transactions, which are known as Canada Account transactions, are shown innote 21 to the Corporation’s consolidated financial statements, and the responsibilityof the Board of Directors for these transactions is limited to the management of theadministration thereof by EDC.
The Auditor General of Canada conducts an independent audit, in accordance withgenerally accepted auditing standards, and expresses her opinion on the consolidatedfinancial statements. Her report is presented on the following page.
A. Ian Gillespie Peter AllenPresident and Senior Vice-President andChief Executive Officer Chief Financial Officer
Peter AllenSenior Vice-President and Chief Financial Officer
EDC_AR_fin_E 4/3/03 11:30 AM Page 26

E D C A N N U A L R E P O R T 2 0 0 2 55
I have audited the consolidated balance sheet of Export Development Canada as atDecember 31, 2002 and the consolidated statements of income and retained earningsand cash flows for the year then ended. These financial statements are the responsibilityof the Corporation’s management. My responsibility is to express an opinion on thesefinancial statements based on my audit.
I conducted my audit in accordance with Canadian generally accepted auditingstandards. Those standards require that I plan and perform an audit to obtain reasonableassurance whether the financial statements are free of material misstatement. An auditincludes examining, on a test basis, evidence supporting the amounts and disclosuresin the financial statements. An audit also includes assessing the accounting principlesused and significant estimates made by management, as well as evaluating the overallfinancial statement presentation.
In my opinion, these consolidated financial statements present fairly, in all materialrespects, the financial position of the Corporation as at December 31, 2002 and theresults of its operations and its cash flows for the year then ended in accordance withCanadian generally accepted accounting principles. As required by the FinancialAdministration Act, I report that, in my opinion, these principles have been applied ona basis consistent with that of the preceding year.
Further, in my opinion, the transactions of the Corporation and of its wholly-ownedsubsidiary that have come to my notice during my audit of the consolidated financialstatements have, in all significant respects, been in accordance with Part X of the FinancialAdministration Act and regulations, the Export Development Act and regulations and theby-laws of the Corporation and its wholly-owned subsidiary.
Sheila Fraser, FCAAuditor General of Canada
Ottawa, CanadaFebruary 12, 2003
AUDITOR GENERAL OF CANADA VÉRIFICATEUR GÉNÉRAL DU CANADA
Auditor’s Report
To the Minister for International Trade
EDC_AR_fin_E 4/3/03 11:30 AM Page 27

56 C A N A D A ’ S B R I D G E T O G L O B A L T R A D E A N D I N V E S T M E N T
Consolidated Balance Sheet
as at December 31
($ in millions) 2002 2001
AssetsCash and InvestmentsCash and cash equivalents 271 612Marketable securities (note 3) 2,553 1,562Investments (note 4) 75 172Accrued interest 9 9
2,908 2,355
Loans ReceivableNet loans receivable (notes 5, 6 and 7) 21,010 20,826Accrued interest and fees 295 269
21,305 21,095
OtherRecoverable insurance claims (note 10) 90 96Derivative related amounts (note 17) 171 167Other assets 80 80
341 343
Total Assets $24,554 $23,793
Liabilities and Shareholder’s EquityLoans Payable (notes 13 and 14)Loans payable 20,828 19,609Accrued interest 254 415
21,082 20,024
Other Liabilities and Deferred RevenueAccounts payable and other credits 155 131Deferred insurance premiums 19 20Derivative related amounts (note 17) 384 516Allowance for loan commitments and guarantees (note 7) 377 588Allowance for claims on insurance (note 11) 460 464
1,395 1,719
Loan Commitments and Contingent Liabilities (notes 8 and 9)
Shareholder’s Equity (note 15)Share capital 983 983Retained earnings 1,094 1,067
2,077 2,050
Total Liabilities and Shareholder’s Equity $24,554 $23,793
See accompanying notes.
Approved by the Board of Directors
R. Fung A. Ian GillespieDirector Director
Consolidated Financial Statements
EDC_AR_fin_E 4/3/03 11:30 AM Page 28

E D C A N N U A L R E P O R T 2 0 0 2 57
Consolidated Statement of Income and Retained Earningsfor the year ended December 31
($ in millions) 2002 2001
Interest income:Loans 1,404 1,620Debt relief (note 19) 96 1Investment portfolio 69 127
1,569 1,748Interest expense 580 934
Net Interest Income 989 814
Insurance Premiums and Guarantee Fees 147 134
Provision for Credit Losses (note 12) 840 741
Income after provision for credit losses 296 207
Administrative Expenses 174 149
Net Income 122 58
Retained EarningsBeginning of year 1,067 1,009Dividend paid (note 19) 95 –
End of year $1,094 $1,067
See accompanying notes.
EDC_AR_fin_E 4/3/03 11:30 AM Page 29
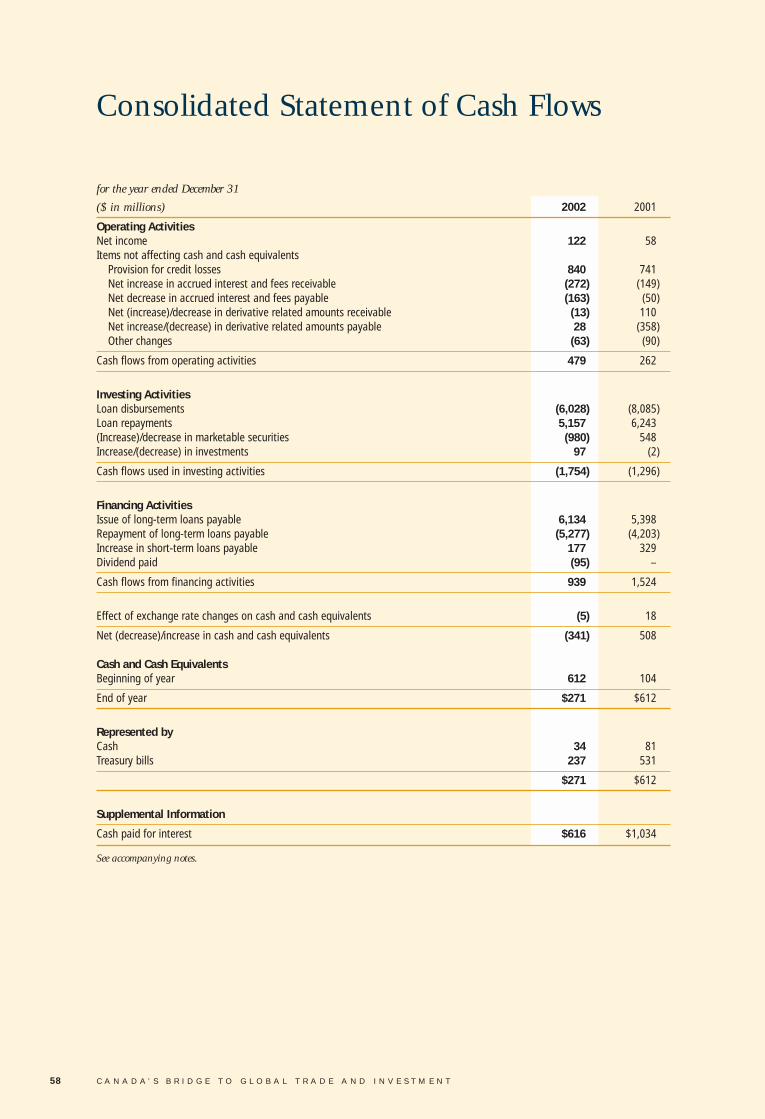
58 C A N A D A ’ S B R I D G E T O G L O B A L T R A D E A N D I N V E S T M E N T
Consolidated Statement of Cash Flows
for the year ended December 31
($ in millions) 2002 2001
Operating ActivitiesNet income 122 58Items not affecting cash and cash equivalents
Provision for credit losses 840 741Net increase in accrued interest and fees receivable (272) (149)Net decrease in accrued interest and fees payable (163) (50)Net (increase)/decrease in derivative related amounts receivable (13) 110Net increase/(decrease) in derivative related amounts payable 28 (358)Other changes (63) (90)
Cash flows from operating activities 479 262
Investing ActivitiesLoan disbursements (6,028) (8,085)Loan repayments 5,157 6,243(Increase)/decrease in marketable securities (980) 548Increase/(decrease) in investments 97 (2)
Cash flows used in investing activities (1,754) (1,296)
Financing ActivitiesIssue of long-term loans payable 6,134 5,398Repayment of long-term loans payable (5,277) (4,203)Increase in short-term loans payable 177 329Dividend paid (95) –
Cash flows from financing activities 939 1,524
Effect of exchange rate changes on cash and cash equivalents (5) 18
Net (decrease)/increase in cash and cash equivalents (341) 508
Cash and Cash EquivalentsBeginning of year 612 104
End of year $271 $612
Represented byCash 34 81Treasury bills 237 531
$271 $612
Supplemental Information
Cash paid for interest $616 $1,034
See accompanying notes.
EDC_AR_fin_E 4/3/03 11:30 AM Page 30

E D C A N N U A L R E P O R T 2 0 0 2 59
Notes to the Consolidated Financial Statements
1. Corporate Mandate and Activities
Export Development Canada (the “Corporation” or “EDC”), which prior to December 21, 2001 was named Export DevelopmentCorporation, was established on October 1, 1969 by the Export Development Act (the “Act”), a statute of the Parliament of Canada that was last amended effective December 21, 2001. The Act provides that the Corporation was established for thepurposes of supporting and developing, directly or indirectly, Canada’s export trade and Canadian capacity to engage in thattrade and to respond to international business opportunities. The Corporation is accountable for its affairs to Parliament throughthe Minister for International Trade.
EDC incorporated Exinvest Inc. as a wholly-owned subsidiary (the “Subsidiary”) under the Canada Business Corporations Actin 1995. The activities of the Subsidiary have been consolidated with those of the Corporation.
The earnings of the Corporation and its Subsidiary are not subject to the requirements of the Income Tax Act.
The Corporation is subject to a limit imposed by the Act on its contingent liability programs. The Act specifies that the limitapplies to the principal amount owing under all outstanding arrangements which have the effect of providing, to any person,any insurance, reinsurance, indemnity or guarantee. This limit shall at no time exceed the greater of an amount equal to 10 timesthe authorized capital of the Corporation and $17.5 billion, which amount may be varied in an appropriation Act. During 2002,the amount of $17.5 billion was increased to $20.0 billion by an appropriation Act (Bill C-21). As at December 31, 2002, theamount of these contingent liabilities is $15.3 billion (2001 – $14.5 billion restated – see note 9).
EDC is for all purposes an agent of Her Majesty in right of Canada. As a result, all obligations under debt instruments issued bythe Corporation are obligations of Canada. The Act allows the Corporation to borrow and have outstanding borrowings up toa maximum of 15 times the aggregate of its (a) current paid-in capital and (b) the retained earnings of the Corporation determined in accordance with the previous year’s audited financial statements. The maximum applicable to December 31, 2002is $30.8 billion (2001 – $29.9 billion), against which borrowings amounted to $20.8 billion (2001 – $19.6 billion).
2. Summary of Significant Accounting Policies
Cash and Cash EquivalentsCash equivalents represent short-term highly liquid investments that are readily convertible into known amounts of cash andthat are subject to an insignificant risk of changes in value. Cash and cash equivalents on EDC’s balance sheet comprise cashand treasury bills. Cash flows arising from transactions in a foreign currency are translated at the yearly average exchange rate.As well, investing or financing transactions that do not require the use of cash or cash equivalents are excluded from the statementof cash flows and disclosed elsewhere in the financial statements.
Marketable Securities and InvestmentsSecurities and investments that are being held to maturity are carried at cost. Gains and losses on these securities and investments are recognized in income only when they are realized and the asset is removed from the balance sheet. In the caseof a significant and other than temporary loss in the value of a security or investment carried at cost, the security or investment would be written down in value at the time of impairment. Temporary investments are carried at market value. Thegains and losses arising from securities carried at market value are included in investment portfolio income.
Net Loans ReceivableNet loans receivable are stated net of non-accrued capitalized interest, deferred loan revenue, and the allowance for losses onloans. Non-accrued capitalized interest represents contractual interest capitalized according to rescheduling agreements withsovereign borrowers during which time the loans are classified as impaired, but not recognized for financial statement purposes.Rescheduled loans are considered performing unless they meet the criteria of impaired loans.
EDC_AR_fin_E 4/3/03 11:30 AM Page 31

Loan interest is recorded on an accrual basis until such time as management determines that a loan should be classified asimpaired. Loans are classified as impaired when circumstances indicate that the Corporation no longer has reasonable assurancethat the full amount of principal and interest will be collected on a timely basis in accordance with the terms of the loan agreement.Commercial loans are made impaired when there are payment overdues of 90 days or more, or if the counterparty is in bank-ruptcy protection. Amounts received for impaired loans are credited to the book value of the loans. No portion of cash receivedon a loan subsequent to its classification as impaired is recorded as interest income until such time as any specific allowancehas been reversed, and it is determined that the loan principal is fully collectible in accordance with the contractual terms ofthe loan. An impaired loan is restored to a performing basis after a pattern of regular payments has been established, normallythree years. When the Corporation restores the impaired loan to an accrual basis, previously non-accrued capitalized interest isrecognized over the remaining term of the loan.
Deferred RevenueDeferred loan revenue, comprised of exposure fees and administration fees, is recognized as interest income and amortized asa yield increment over the term of the related loan. Guarantee fee revenue is recognized as income together with insurance premium revenue and is amortized over the term of the related guarantee.
Measurement UncertaintyTo prepare the Corporation’s financial statements in accordance with Canadian generally accepted accounting principles, it isnecessary for management to make assumptions and estimates based on information available as at the date of the financialstatements. The most material of these estimates are the allowance for losses on loans, loan commitments and guarantees (note 7)and the allowance for claims on insurance (note 11). Management determines the allowances using various assumptions, basedon its assessment of the impact of recent events and changes in economic conditions and trends. These estimates are reviewedperiodically during the course of the year as required and in detail as at the date of the financial statements. Actual losses onloans and liabilities for contingencies incurred may vary significantly from management’s estimates. The uncertainty in the estimation process arises, in part, from the use of historical data to identify and quantify credit deterioration. While historicaldata may be the most reliable basis available to calculate these amounts, economic events may occur in the near term that renderprevious assumptions invalid and cause a material change to management’s estimates.
The general allowance for losses on loans, loan commitments and guarantees is estimated using historical loan default andrecovery rates. For specifically identified impaired loans, recoverable amounts are calculated using the best estimates of the timing and amount of future cash flows for each borrower.
The allowance for claims on insurance is calculated by discounting estimated future net claims less future net premiums, basedon assumptions consistent with the Corporation’s past experience. Additional amounts are provided for possible adverse deviation from best estimate assumptions. While these amounts vary with the degree of uncertainty inherent in each programand with the homogeneity of policies (size and term) within each portfolio, the valuation process conforms to the recommendations of the Canadian Institute of Actuaries.
Allowance for Losses on Loans, Loan Commitments and GuaranteesThe allowance for losses on loans, loan commitments and guarantees is based on a review of all loans, loan guarantees andcommitments to commercial and sovereign borrowers and represents management’s best estimate of probable credit losses.The allowance includes both general and specific allowances.
General allowances are comprised of the base allowance calculated based on counterparty credit ratings, market overlays,and a counterparty concentration allowance. General allowances are calculated based on probable credit losses for performingloans, loan guarantees, and loan commitments (including letters of offer). Amounts for loan commitments are factored to providefor the estimated usage rate of the commitment.
For the base allowance, EDC classifies its performing loans, loan guarantees and commitments into seven categories. The firstsix categories represent groups of performing loans that share the same credit rating. The Corporation categorizes its performingcommercial and sovereign loans using a rating system of 6 credit grades (AA grade to C grade), then establishes an appropriategeneral allowance based on expected credit losses for each performing risk category. The seventh category represents loan assetsthat have been designated as watchlist items, which require a higher degree of monitoring and loan allowance. These sevencategories, as well as the counterparty ratings, are consistent with the categorization and ratings used by EDC’s credit risk management policies. These categories are further segregated between commercial and sovereign exposures, OECD and emergingmarket countries, and secured and unsecured exposures. Loss rates are determined for each category based on estimates ofdefault rates and loss severity. Default rates are based on the average of Moody’s and Standard and Poor’s default tables. Lossseverity is determined based on EDC’s historical loan loss rates. These rates are then applied to the segregated categories toform the general allowance.
In addition, market overlays are provided for those countries and industries which are currently experiencing downward trends.These overlays are needed because of the time delay that exists between market events and announcement of credit rating changes.
60 C A N A D A ’ S B R I D G E T O G L O B A L T R A D E A N D I N V E S T M E N T
EDC_AR_fin_E 4/3/03 11:30 AM Page 32

EDC has significant single name counterparty concentrations. A counterparty concentration allowance is established for counterparties whose exposure is deemed by management to represent an increased amount of risk. At December 31, 2002,this level was assessed at 10% of shareholder’s equity.
Specific allowances are established on an individual loan basis to recognize credit losses. When a loan is considered impaired,the carrying value of the loan is reduced to its estimated realizable value using appropriate market values. When market valuesare not available, the estimated realizable value is determined by discounting expected cash flows at rates inherent in the loan.The amount of initial impairment and any subsequent changes due to the re-evaluation of estimated future cash flows arerecorded through the provision for credit losses as an adjustment to the specific allowance for impaired loans.
The general allowances for performing loans and specific allowances for impaired loans are shown as a reduction in gross loans receivable in note 5 to arrive at net loans receivable which is an asset on the balance sheet. General allowances for loanguarantees and loan commitments are shown as a liability on the balance sheet.
Recoverable Insurance ClaimsRecoverable insurance claim payments are recorded at estimated recoverable values. Subsequent net gains or losses on recoveryare credited or charged to the allowance for claims on insurance when recoverable values are re-estimated.
Allowance for Claims on InsuranceThe allowance for claims on insurance is based on an actuarial review of net loss experience and potential net losses and represents management’s best estimate of the net present value of the liability under existing policies. The related provision isrecorded through the provision for credit losses.
Insurance PremiumsFor short-term insurance policies, premiums are taken into income at the commencement of coverage. Premiums on other exportinsurance policies are taken into income using methods that generally reflect the exposures over the terms of the policies andare amortized over the life of the policies on a straight line basis. Reinsurance premiums and recoveries on losses incurred arerecorded as reductions of the respective income and balance sheet accounts. Unearned premiums on insurance transferred toreinsurers and estimates of amounts recoverable from reinsurers on unpaid claims are deducted from deferred premiums andrecoverable claims respectively.
Derivative Financial InstrumentsThe Corporation uses a variety of derivative financial instruments (“derivatives”) to manage market risk, which includes foreignexchange fluctuations and changes in interest rates. These derivatives are only contracted with creditworthy counterparties. Thecounterparty must have a minimum credit rating of A3 where EDC has a collateral agreement with the counterparty. In transactionswhere EDC does not have a collateral agreement with the counterparty, the counterparty must have a minimum credit ratingof A2 for transactions of less than three years, and a minimum credit rating of Aa3 for transactions greater than three years.
Derivatives are recognized on the balance sheet upon issuance, and removed from the balance sheet when they expire or areterminated. Both on initial recognition and subsequently, each derivative is recognized as either an asset or a liability on thebalance sheet at its accrual basis value. The derivative is an asset when the accrual basis value indicates that the counterpartyowes EDC. The derivative is a liability when the accrual basis value indicates that EDC owes the counterparty. Assets are disclosedon the balance sheet as a separate component of other assets, while liabilities are disclosed on the balance sheet as a separatecomponent of other liabilities and deferred revenue. Premiums paid or discounts received on these instruments are deferred andamortized over the life of the contract. Net receipts or payments are recognized in income on an accrual basis in the same periodand the same financial statement category to which the contract is related. Where the interest payment amount is known inadvance, as is the case with fixed and floating rate payments, the accrual allocates the income (or expense) over the period to payment. Where the interest payment amount is not known in advance, an appropriate interest accrual is determined by reference to market prices. Changes in the accrual basis values of derivatives are reported in the statement of cash flows asoperating activities.
Translation of Foreign CurrencyAll monetary assets and liabilities denominated in foreign currencies are translated into Canadian dollars at exchange rates prevailing at the end of the year. Income and expenses are translated at monthly average exchange rates in effect during theyear. Exchange gains and losses resulting from the translation of foreign currency balances and transactions are included withinterest expense.
Interest ExpenseInterest expense includes expenses of commercial paper, bonds, derivative financial instruments, the amortization of debt discount and issue expenses, and foreign exchange gains and losses. Gains or losses incurred when the Corporation repurchasesits bonds, and unwinds any swaps related to those bonds, are either taken into income at the time of the transaction, or deferredand amortized over the life of a replacement debt issue, should one be issued.
E D C A N N U A L R E P O R T 2 0 0 2 61
EDC_AR_fin_E 4/3/03 11:30 AM Page 33

62 C A N A D A ’ S B R I D G E T O G L O B A L T R A D E A N D I N V E S T M E N T
Employee BenefitsThe Corporation maintains a defined benefit pension plan to provide retirement benefits to its employees. Pension costs areactuarially determined using the projected benefit method pro rated on service and management’s best estimate assumptions.The latest valuation was completed by an independent actuary as at December 31, 2002. The discount rate used to determinethe accrued benefit obligation was based on market rates for long-term high-quality bonds. Pension fund assets are valued atfair value for the purpose of calculating the expected return on plan assets.
The net pension plan expense consists of the actuarially determined pension benefits for the current year’s service, imputedinterest on projected pension obligations net of interest earned on plan assets and the amortization of actuarial gains or lossesand other items over the average remaining service period of active employees expected to receive benefits under the plan.Actuarial gains or losses are amortized only if the net actuarial gain or loss at the beginning of the year is in excess of 10% ofthe greater of the accrued benefit obligation and the fair value of plan assets.
The cumulative difference between the pension expense and funding contributions is included in accounts payable and other credits.
The Corporation also provides other non-pension post-retirement benefits for employees including a retiring allowance plan andlife insurance and health and dental care benefits. The cost of these benefits is accrued for as earned by the employees and isactuarially determined in a manner consistent with the method used for the pension benefits.
Adoption in fiscal 2000 of the CICA’s new standard for recording employee future benefits resulted in a transitional obligationwith respect to the non-pension post-retirement benefit plans. The transitional obligations with respect to the retiring allowanceplan and the other post-retirement benefit plans are being amortized into income over 14 and 20 years respectively.
3. Marketable Securities
The Corporation maintains liquidity sufficient to meet general operating requirements, to maintain stability in the short-termborrowing program and to provide flexibility in achieving corporate objectives. In order to meet these varied needs, marketablesecurities are held in either the investment portfolio or the temporary investment portfolio. Investment portfolio securities areheld for liquidity as well as for the longer term. Temporary investments will either mature or be sold within a year. Credit exposurerelated to securities held in the investment portfolio and the temporary investment portfolio is represented by their carrying value.
($ in millions) 2002 2001
Portfolio
TemporaryIssued or guaranteed by: Investments Investments Total Total
Canadian government* 397 – 397 284Corporate 407 72 479 501Financial institutions 1,196 314 1,510 767Other sovereign 167 – 167 10
Total Marketable Securities $2,167 $386 $2,553 $1,562
* Canadian government includes federal, provincial, and municipal governments and Crown corporations.
EDC_AR_fin_E 4/3/03 11:30 AM Page 34

The table below shows yields on EDC’s marketable securities and how derivative financial instruments have been used to manageinterest rate and foreign currency exposures of the Corporation’s investment portfolio.
($ in millions) 2002 2001
Remaining Term to Maturity
Under 1 to 3 Over 3 1 Year Years Years Total Total
Investment portfolioFixed rate securities 135 62 353 550 423Swap contracts (95) (26) (33) (154) (193)
Subtotal 40 36 320 396 230
Yield to maturity % 5.24 5.03 5.00 5.00 4.82Floating rate securities 1,417 184 16 1,617 618Swap contracts 100 25 30 155 199
Subtotal 1,517 209 46 1,772 817
Yield to reset % 1.72 2.10 1.77 1.81 2.24Total investment portfolio 1,557 245 366 2,168 1,047
Temporary investmentsFloating rate securities 386 – – 386 521
Spot yield % 2.86 2.13Value at purchase 384 519
Total portfolio 1,943 245 366 2,554 1,568Derivative related amounts (5) 1 3 (1) (6)
Total Marketable Securities $1,938 $246 $369 $2,553 $1,562
Credit exposure for swap contracts is a fraction of the notional amount of the instruments shown above, and is represented bythe replacement cost of those contracts. Credit exposure for swap contracts held in the investment portfolio is included as partof note 17.
4. Investments
Investments comprise $33 million (2001 – $127 million) of restricted cash and securities held by EDC’s subsidiary Exinvest Inc.and notes issued by Vancouver Port Authority (formerly Vancouver Port Corporation) and the Royal Canadian Mint, totaling $42 million (2001 – $45 million). EDC intends to hold these notes to maturity. The Royal Canadian Mint is a Crown corporationand is related to EDC as a result of common ownership. The investment with the Royal Canadian Mint was transacted at fairvalue, made on the same terms as those with third parties with similar credit risk, and is recorded at cost.
($ in millions) 2002 2001
Remaining Term to Maturity
Under 1 to 3 Over 31 Year Years Years Total Total
Fixed rate investments 4 9 42 55 45Floating rate investments 3 – 17 20 127
Total Investments $7 $9 $59 $75 $172
Yield % * 6.26 6.36 4.86 4.97 6.32
* Refers to yield to maturity for fixed rate investments, and yield to reset for floating rate investments.
E D C A N N U A L R E P O R T 2 0 0 2 63
EDC_AR_fin_E 4/3/03 11:30 AM Page 35

5. Net Loans Receivable
The following table shows the contractual maturity and related contractual effective yields for gross loans receivable. The yieldsare computed on a weighted average basis by amount and term. Floating rate yields are expressed as spreads over base rateswhich consist mainly of LIBOR for U.S. dollars and Prime for Canadian dollars.
($ in millions) 2002 2001
Yield to Yield toFixed Maturity Floating Spread Total Fixed Maturity Floating Spread Total
$ % $ % $ $ % $ % $
Performing:Overdue 93 7.67 8 2.64 101 39 9.44 126 .43 165
2002 – – – – – 1,092 7.80 2,801 1.46 3,8932003 947 7.55 2,716 2.05 3,663 946 7.44 1,624 1.95 2,5702004 917 7.65 1,994 2.00 2,911 864 7.66 1,547 2.09 2,4112005 866 7.53 1,417 2.14 2,283 803 7.55 1,374 1.95 2,1772006 807 7.43 1,154 1.64 1,961 725 7.47 1,090 1.54 1,8152007 882 7.52 836 1.49 1,718 774 7.62 687 1.52 1,461
2008-2012 4,220 7.20 2,414 1.38 6,634 3,559 7.30 1,941 1.54 5,5002013 and beyond 3,850 7.11 961 1.42 4,811 3,193 7.38 391 1.37 3,584
Performing grossloans receivable 12,582 7.18 11,500 1.74 24,082 11,995 7.42 11,581 1.69 23,576
Impaired (note 6) 201 5.34 2,058 1.71 2,259 234 1,416 1,650
Gross loans receivable $12,783 $13,558 $26,341 $12,229 $12,997 $25,226
Less: Non-accrued capitalized interest onImpaired loans (note 6) 1,001 742Performing loans* 425 499
Loans receivable 24,915 23,985Less: Allowance for losses on loans (note 7) 3,613 2,892
Deferred loan revenue 292 267
Net Loans Receivable $21,010 $20,826
* Represents the unamortized balance that accrued while the loan was impaired.
At December 31, 2002, the floating rate performing gross loans receivable are yielding 3.76% (2001 – 4.63%) with an averageterm to reset of 103 days (2001 – 107 days).
The breakdown of the Corporation’s performing gross loans receivable between sovereign and commercial is as follows:
($ in millions) 2002 2001
Yield to Yield toFixed Maturity Floating Spread Total Fixed Maturity Floating Spread Total
$ % $ % $ $ % $ % $
Sovereign 3,046 8.37 2,473 1.11 5,519 3,241 8.31 2,989 1.23 6,230Commercial 9,536 6.89 9,027 1.93 18,563 8,754 7.09 8,592 1.85 17,346
Total PerformingGross LoansReceivable $12,582 7.18 $11,500 1.74 $24,082 $11,995 7.42 $11,581 1.69 $23,576
The Corporation has significant geographic concentrations in certain countries as outlined below.
($ in millions) 2002 2001
Performing Performing Gross Loans Gross Loans
Country Receivable % Country Receivable %
United States 11,689 49 United States 10,169 43Canada 2,088 9 Canada 2,201 9Mexico 1,426 6 Mexico 1,322 6United Kingdom 987 4 China 1,090 5China 973 4 Peru 932 4Other 6,919 28 Other 7,862 33
Total $24,082 100 Total $23,576 100
64 C A N A D A ’ S B R I D G E T O G L O B A L T R A D E A N D I N V E S T M E N T
EDC_AR_fin_E 4/3/03 11:30 AM Page 36

In addition, the Corporation has single counterparty gross loans receivables totaling $4,610 million (2001 – $3,386 million) withfive airlines, $1,258 million (2001 – $1,293 million) with a ground transportation entity and $1,779 million (2001 – $1,206 million)with an automotive entity. All of these counterparties are located in the United States.
Non-accrued capitalized interest represents contractual interest capitalized according to rescheduling agreements with sovereignborrowers during which time the loans are classified as impaired.
The following reflects the movement of non-accrued capitalized interest during the year:
($ in millions) 2002 2001
Balance at beginning of year 1,241 1,165Capitalized interest 343 92Amortization (76) (83)Debt relief (81) (1)Foreign exchange translation (1) 68
Balance at end of year $1,426 $1,241
6. Impaired Loans Receivable
The Corporation has $2,259 million (2001 – $1,650 million) of impaired gross loans receivable, of which $1,421 million (2001 – $1,320 million) is sovereign and $838 million (2001 – $330 million) is commercial. The following table shows theamount of gross loans receivable, net of non-accrued capitalized interest and the specific allowance, which represents netimpaired loans receivable.
($ in millions) 2002 2001
Gross impaired loans receivableSovereign 1,421 1,320Commercial 838 330
2,259 1,650Less: Non-accrued capitalized interest 1,001 742
Specific allowance (note 7) 582 370
Net Impaired Loans Receivable $676 $538
The following reflects the movement in impaired gross loans receivable during the year:
($ in millions) 2002 2001
Balance at beginning of year 1,650 1,323Loans classified as impaired 840 482Loans reinstated to performing – (44)Loans written off (194) (191)Capitalized interest 343 94Principal repayments (109) (15)Receipts from the Government of Canada for sovereign debt relief (311) (13)Receivable from the Government of Canada for sovereign debt relief – (81)Foreign exchange translation 40 95
Balance at end of year $2,259 $1,650
Impaired loans to five commercial borrowers in the United States totaling $82 million, one commercial loan in Germany for $41 million, one commercial loan in Brazil for $39 million and sovereign loans in Yugoslavia totaling $32 million were writtenoff against the allowance for loan losses. These loans were written off after all collection methods had been exhausted and nofurther prospect of recovery was likely. Included in the write-offs of $194 million are loans totaling $128 million which weremade impaired in 2002. For the five years ending December 31, 2002, cumulative loan write-offs totaled $490 million, of which79% occurred in the past two years.
During 2002, payments of principal and interest from borrowers for impaired loans were $109 million (2001 – $34 million).These amounts were applied to the book value of the impaired loans and did not affect interest income.
E D C A N N U A L R E P O R T 2 0 0 2 65
EDC_AR_fin_E 4/3/03 11:30 AM Page 37

7. Allowance for Losses on Loans, Loan Commitments and Guarantees
The composition of the allowance for losses on loans, loan commitments and guarantees is as follows:
($ in millions) 2002 2001
General allowanceBase Allowance
Investment grade exposure 125 104Non-investment grade exposure 1,895 1,819
Total base allowance 2,020 1,923
Counterparty ConcentrationInvestment grade exposure 64 60Non-investment grade exposure 497 466
Total counterparty concentration 561 526
Allowance OverlaysCountry
United States 138 130Venezuela 57 12Brazil 37 41Indonesia 20 28Turkey 10 19Argentina 7 19Other 21 44
Total country overlay 290 293
IndustryAerospace 382 267Telecom 110 87Power 45 –Other – 14
Total industry overlay 537 368
Total general allowance 3,408 3,110
Specific allowance for impaired loans 582 370
Allowance for Losses on Loans, Loan Commitments and Guarantees $3,990 $3,480
The classification of the allowance for losses on loans, loan commitments and guarantees is as follows:
($ in millions) 2002 2001
Allowance for losses on loans 3,613 2,892Allowance for loan commitments 284 521Allowance for loan guarantees 93 67
Total $3,990 $3,480
The allowance for losses on loans is shown as a reduction of gross loans receivable in note 5 to arrive at net loans receivablewhich is an asset on the balance sheet. The allowance for loan commitments and guarantees is reported as a liability in thefinancial statements.
During the year, changes to the allowance for losses on loans, loan commitments and guarantees were as follows:
($ in millions) 2002 2001
Specific General Total Specific General Total
Balance at beginning of year 370 3,110 3,480 431 2,399 2,830Provision for loan losses 409 316 725 106 552 658Write-offs* (194) – (194) (191) – (191)Foreign exchange translation (3) (18) (21) 24 159 183
Balance at end of year $582 $3,408 $3,990 $370 $3,110 $3,480
*See note 6 for more information on loan write-offs.
66 C A N A D A ’ S B R I D G E T O G L O B A L T R A D E A N D I N V E S T M E N T
EDC_AR_fin_E 4/3/03 11:30 AM Page 38

8. Loan Commitments
The Corporation has two types of loan commitments. The first type are undisbursed amounts on signed loan agreements. Thesecond type of commitment represents commitments made by EDC, for which terms related to the transaction such as interest ratetype and disbursement schedule have not yet been determined. This category includes letters of offer accepted and outstandingof $3,225 million as well as unallocated, confirmed lines of credit of $590 million.
The Corporation has undisbursed signed loan commitments of $3,512 million (2001 – $4,938 million). Over the next two years,management estimates that the Corporation will disburse 65% of the remaining undisbursed commitments.
The projected disbursement of the signed loan commitments is as follows:
($ in millions) 2002 2001
Projected ProjectedYear Disbursements % Disbursements %
2002 – – 2,207 452003 1,962 56 487 102004 319 9 93 22005 and beyond 1,231 35 2,151 43
Total $3,512 100 $4,938 100
Undisbursed commitments with their committed fixed rates or committed floating rate spreads are outlined in the followingtable. All yields are computed on a weighted average basis and the spreads over floating interest rates are represented mainlyby LIBOR for U.S. dollars.
($ in millions) 2002 2001
Estimated EstimatedSpot Spot
Fixed Yield Floating Spread Fixed Yield Floating Spread$ % $ % $ % $ %
Sovereign 466 8.12 249 2.69 988 8.31 237 2.10Commercial 105 3.68 2,692 1.28 930 6.13 2,783 1.99
Total $571 7.31 $2,941 1.40 $1,918 7.26 $3,020 2.00
9. Contingent Liabilities
Note 1 states that the Corporation is subject to a limit imposed by the Act on its contingent liability programs. The contingentliability as reported in prior years did not adjust the liability to reflect policy maximums. In 2002, the Corporation refined its estimatesof the contingent liabilities to reflect policy maximums and 2001 has been restated accordingly.
The Corporation’s contingent liabilities include both short-term and medium-term insurance policies and guarantees. The short-term program protects exporters of goods and services trading on credit terms of up to a year against non-payment dueto commercial and political risks. Commercial risks covered include buyer insolvency, default, repudiation of goods by buyer andcontract cancellation. Political risks covered by EDC are conversion and risk transfer, cancellation of export or import permits, orwar-related risks. The medium-term program provides cover for sales on credit terms greater than one year and includes exportcredits insurance and guarantees, loan guarantees, performance insurance extending cover for risks inherent in performance and bidguarantees, and political risk insurance, which provides political risk protection for equity and other investments abroad.
E D C A N N U A L R E P O R T 2 0 0 2 67
EDC_AR_fin_E 4/3/03 11:30 AM Page 39

Insurance Policies and Guarantees
As at December 31, 2002, the Corporation has insurance policies and guarantees outstanding of $15,263 million (2001 – $14,511 million) which mature as follows:
($ in millions) 2002 2001Short-term Medium-term Short-term Medium-term
Insurance Insurance Guarantees Total Insurance Insurance Guarantees Total
2002 – – – – 6,255 1,079 759 8,0932003 7,097 1,568 2,116 10,781 – 1,582 1,419 3,0012004 – 804 356 1,160 – 599 269 8682005 – 484 186 670 – 682 214 8962006 – 264 115 379 – 194 110 3042007 – 214 441 655 – 46 25 712008 – 2012 – 525 328 853 – 348 103 4512013 and beyond – 111 654 765 – 13 814 827
Total $7,097 $3,970 $4,196 $15,263 $6,255 $4,543 $3,713 $14,511
The major concentrations by location of risk are as follows:
($ in millions) 2002 2001Short-term Medium-term Short-term Medium-term
Insurance Insurance Guarantees Total Insurance Insurance Guarantees Total
U.S. 4,226 115 3,082 7,423 U.S. 3,450 68 2,474 5,992Canada 93 2,410 156 2,659 Canada 194 2,387 131 2,712Mexico 147 219 35 401 Brazil 237 323 1 561Brazil 188 181 1 370 Mexico 152 273 55 480China 182 149 23 354 China 163 209 29 401Other 2,261 896 899 4,056 Other 2,059 1,283 1,023 4,365
Total $7,097 $3,970 $4,196 $15,263 Total $6,255 $4,543 $3,713 $14,511
Reinsurance of $2,026 million (2001 – $1,618 million) has been deducted from the insurance policies outstanding.
Reinsurance premiums of $24 million were deducted from total premiums earned for the year ended December 31, 2002 (2001 – $21 million).
Guarantees
The Corporation issues bid security guarantees and performance security guarantees which provide insurance coverage to theexporter’s bank for 100% of the bid or performance letter of guarantee value in the event of any call by the buyer. Each insuranceguarantee issued stipulates a recovery provision whereby the third party, the exporter, agrees to indemnify the Corporationshould a payment be made under the guarantee. Loan guarantees are issued by the Corporation and cover non-payment of principal,interest and fees due to banks and financial institutions providing loans to buyers of Canadian goods and services. Calls onguarantees result in the recognition by EDC of a loan asset on the balance sheet and become a direct obligation of the buyer.
As at December 31, 2002, the Corporation has insurance and loan guarantees outstanding of $4,196 million (2001 – $3,713 million).
($ in millions) 2002 2001
Loan Guarantees 2,998 2,567Performance Security Guarantees 1,182 1,134Bid Security Guarantees 11 7Specific Transaction Guarantees 5 5
Total $4,196 $3,713
68 C A N A D A ’ S B R I D G E T O G L O B A L T R A D E A N D I N V E S T M E N T
EDC_AR_fin_E 4/3/03 11:30 AM Page 40

10. Recoverable Insurance Claims
During the year, changes to the recoverable insurance claims were as follows:
($ in millions) 2002 2001
Balance at beginning of year 96 74Claims paid 144 144Claims recovered (39) (51)Write-off of recoverable claims (111) (74)Foreign exchange translation – 3
Balance at end of year $90 $96
Of the $144 million in claim payments made during 2002, 78% were related to the short-term program. The largest concentrationsof claim payments and recoveries were in the following countries:
($ in millions) 2002 2001
Claims Claims Claims ClaimsPaid Recovered Paid Recovered
U.S. 63 8 U.S. 46 6Mexico 19 1 Virgin Islands (British)* 45 34Argentina 18 1 Pakistan 9 –Germany 8 4 Canada 7 –Belgium 5 – Argentina 6 –Other 31 25 Other 31 11
Total $144 $39 Total $144 $51
* Loss relates to financial difficulties of a parent company based in Singapore.
11. Allowance for Claims on Insurance
During the year, changes to the allowance for claims on insurance were as follows:
($ in millions) 2002 2001
Balance at beginning of year 464 439Provision for claims on insurance 115 83Write-off of recoverable claims (111) (74)Claims expense (8) (7)Foreign exchange translation – 23
Balance at end of year $460 $464
12. Provision for Credit Losses
The composition of the provision for credit losses, expressed in the income statement, is comprised as follows:
($ in millions) 2002 2001
Provision for losses on loans 930 208Provision for claims on insurance 115 83Provision for loan commitments (231) 521Provision for loan guarantees 26 (71)
Provision for Credit Losses $840 $741
E D C A N N U A L R E P O R T 2 0 0 2 69
EDC_AR_fin_E 4/3/03 11:30 AM Page 41

13. Debt Instruments
The Corporation issues debt instruments in world capital markets. Short-term payables consist of commercial paper and othershort-term debt related instruments that are issued by EDC with maturities under one year. Long-term payables represent bondsand other long-term instruments issued by the Corporation in Canadian dollars, U.S. dollars and other currencies. EDC uses currency swaps to convert foreign denominated fixed rate notes primarily to U.S. dollars. Interest rate swaps are principally usedto convert fixed rate instruments to floating rates primarily related to LIBOR. EDC uses derivative contracts and structured notesto minimize market risk and also for asset/liability management purposes.
Loans Payable
Loans payable (excluding derivatives) are comprised as follows:
($ in millions) 2002 2001
Short-term payables 3,909 3,723
Long-term payables- due within current year 3,671 2,926- over one year 13,254 12,965
Total long-term payables 16,925 15,891
Subtotal 20,834 19,614
Plus: unamortized discounts and premiums 1 4deferrals (7) (9)
Total Loans Payable $20,828 $19,609
Unamortized discounts and premiums are associated with the issue of long-term debt and swaps. The amount of a discount orpremium recorded represents the difference between the face value of an instrument and the actual cash flow at the time ofsettlement. Deferrals include gains incurred upon debt repurchases and swap unwinds. Such amounts are recorded as an assetor liability at the settlement date and amortized over the life of the instrument (in the case of discounts and premiums) or overthe life of the replacement instrument (in the case of deferrals).
Accrued Interest
Accrued interest reflects corporate cash flow obligations and rights. Accrued interest is comprised as follows:
($ in millions) 2002 2001
Short-term 6 12Long-term 248 403
Total Accrued Interest Payable $254 $415
Where the interest payment amount is known in advance, as is the case with fixed and floating rate payments, the interestaccrual allocates the cost over the period to payment. Where the interest payment amount is not known in advance an appropriateinterest accrual is determined by reference to market prices.
70 C A N A D A ’ S B R I D G E T O G L O B A L T R A D E A N D I N V E S T M E N T
EDC_AR_fin_E 4/3/03 11:30 AM Page 42

Structured Notes
EDC has entered into a number of structured notes as part of its funding program. Structured notes are hybrid securities thatcombine fixed income products with derivative components.
Structured notes outstanding, included in loans payable, are as follows:
($ in millions) 2002 2001
Callable/extendible 2,251 1,850Inverse floating rate note 564 567Equity index 441 541Dual currency 140 244Other 209 178
Total $3,605 $3,380
The Corporation has executed swap contracts to mitigate market risk on these structured borrowings. These contracts ensurethat EDC will receive proceeds from the swap to meet the requirements of settling and servicing the debt obligation. TheCorporation has in substance created floating rate debt by issuing bonds at fixed rates and entering into swap contracts wherebyEDC receives fixed rate interest and pays interest at a floating rate. In swapping out of the underlying bond issue, the potential market risk has been converted to credit risk. Credit risk is managed by contracting with counterparties evaluated ascreditworthy, based on treasury limits and policy guidelines as approved by the Board of Directors. Credit exposure on derivative financial instruments is further discussed in note 17.
14. Debt Instrument Maturities
EDC often combines debt instruments with derivative financial instruments to generate lower-cost funding. For example, a fixedrate debt issue can be combined with an interest rate swap to generate floating rate funding at a lower cost than issuing a floating rate note. The following table shows EDC’s resulting net fixed and floating rate debt positions, as well as yieldson those net positions.
($ in millions) 2002 2001
Debt Swap Yield* Yield*Year of Maturity Issues Contracts Net (%) Net (%)
Fixed Rate Issues2002 – – – – 956 7.042003 2,415 (1,210) 1,205 6.46 1,215 6.092004 2,816 (1,971) 845 5.91 852 6.132005 1,470 (1,470) – – – –2006 1,518 (1,518) – – – –2007 1,170 (380) 790 4.05 – –2008 to 2012 5,101 (4,852) 249 8.47 251 8.142013 and beyond 115 (83) 32 8.16 32 8.16
Subtotal 14,605 (11,484) 3,121 5.73 3,306 6.92
Floating Rate Issues2002 – – – 5,7952003 5,165 1,261 6,426 2,1982004 214 2,019 2,233 1,7732005 49 1,479 1,528 2582006 97 1,553 1,650 1,7452007 75 388 463 1812008 to 2012 223 4,957 5,180 4,5502013 and beyond 406 67 473 380
Subtotal 6,229 11,724 17,953 1.27 16,880 2.21
Total $20,834 $240 $21,074 $20,186
* Refers to yield to maturity for fixed rate issues, and yield to reset for floating rate issues.
Credit exposure and other details on swap contracts are included as part of note 17.
E D C A N N U A L R E P O R T 2 0 0 2 71
EDC_AR_fin_E 4/3/03 11:30 AM Page 43

15. Shareholder’s Equity
The authorized share capital is $1.5 billion consisting of 15 million shares with a par value of $100 each. The number of sharesissued and fully paid is 9.8 million (2001 – 9.8 million). No shares were issued in 2002 (2001 – nil). At the request of the shareholder, EDC paid a dividend of $95 million during the year (2001 – nil).
16. Foreign Currency Balances
The Corporation has substantial assets and liabilities in U.S. dollars and in other currencies. In addition, EDC has derivative financial instruments denominated in various currencies. The purpose of these derivative financial instruments is to minimize thecost of capital and optimize yields for the Corporation, while remaining within treasury guidelines and limits approved by theBoard of Directors.
The table below shows where EDC has used derivative financial instruments to manage the foreign currency exposures of itsasset and liability positions. The resulting net foreign currency exposure as at December 31 (expressed in Canadian equivalentdollars) is as follows:
($ in millions) 2002 2001Net Foreign Net ForeignAssets Liabilities
Currency CurrencyGross DFI* Net Gross DFI* Net Exposure Rate Exposure Rate
U.S. Dollars 19,981 714 20,695 (12,183) (8,503) (20,686) 9 1.5796 (58) 1.5926Euro 461 – 461 (234) (223) (457) 4 1.6564 2 1.4185British Pounds 984 – 984 (4) (976) (980) 4 2.5428 3 2.3160Japanese Yen 108 (55) 53 (663) 610 (53) – 0.0133 – 0.0122New Zealand Dollars – – – (207) 207 – – 0.8276 – 0.6636Norwegian Krone – – – (803) 803 – – 0.2278 – 0.1779Australian Dollars – – – (124) 124 – – 0.8890 – 0.8156Swedish Krona 52 – 52 – (52) (52) – 0.1818 – 0.1525Danish Krone 28 (28) – – – – – 0.2230 – 0.1908
* DFI (Derivative Financial Instruments) includes swaps and foreign exchange contracts. See note 17.
The Corporation experienced a foreign exchange gain of $2.6 million in 2002 (2001 – gain of $75 thousand). This amount isincluded in interest expense. Throughout the year, EDC’s assets and liabilities were denominated mainly in U.S. dollars, euro andBritish pounds.
17. Derivative Financial Instruments
The Corporation actively manages its exposure to market risk through the use of derivative financial instruments. Treasury policy and guidelines limit the use of derivatives. EDC does not use derivatives for speculative purposes. It uses a variety of theseinstruments to manage funding costs and investment returns, and to implement asset/liability management strategies in order tominimize market risks in EDC’s portfolios. The credit risk in these instruments is managed in accordance with policies establishedin EDC’s Market Risk Management Department and approved by the Board of Directors.
EDC currently uses, but is not limited to, the following types of instruments:
Interest rate swaps – transactions in which two parties exchange interest flows on a specified notional amount on predetermineddates for a specified period of time using agreed-upon fixed or floating rates of interest. Notional amounts upon whichinterest payments/receipts are based are not exchanged.
Currency swaps – transactions in which two parties exchange currencies at inception and at maturity, as well as interest flows onthe exchanged amounts on predetermined dates for a specified period of time using agreed-upon fixed or floating rates of interest.
72 C A N A D A ’ S B R I D G E T O G L O B A L T R A D E A N D I N V E S T M E N T
EDC_AR_fin_E 4/3/03 11:30 AM Page 44

Equity index swaps – transactions used to eliminate exposure to movements in an equity index on a debt issue undertaken by theCorporation. Two counterparties agree to exchange payments, one of which represents the percentage change in an agreed-uponequity index and the other a short-term interest rate index. The principal may either resemble an interest rate swap, in that noexchange of notional amounts occurs, or a currency swap, in which currencies will be exchanged at both inception and maturity.
Foreign exchange contracts – commitments to purchase or sell foreign currencies for delivery at a specified date in the futureat a fixed rate.
In any transaction there is a potential for loss. This loss potential is represented by (1) credit risk, wherein the counterparty failsto perform an obligation as agreed upon, causing the other party to incur a financial loss, and (2) market risk, where an exposureexists as a result of changes in foreign exchange rates or interest rates.
The Corporation manages its exposure to credit risk by contracting only with creditworthy counterparties, and in certain casesentering into collateral agreements with those counterparties. Collateral agreements provide for the posting of collateral by thecounterparty when EDC’s exposure to that entity exceeds a certain threshold. Where EDC has a collateral agreement with acounterparty, the counterparty must have a minimum credit rating of A3. Where EDC does not have a collateral agreement with acounterparty, the counterparty must have a minimum credit rating of A2 for transactions of less than three years, and a minimumcredit rating of Aa3 for transactions of greater than three years. Internal policies and procedures establish credit approvals,controls and monitoring. The Corporation does not anticipate any significant non-performance by the counterparties.
The Corporation manages its exposure to market risk (interest rate and foreign exchange) using limits developed in consultationwith the Department of Finance and approved by the Board of Directors.
Credit impairment in the derivative financial instruments, marketable securities and investments has been estimated not toexceed $20 million. Accordingly, an allowance for credit risk of $20 million (2001 – $20 million) has been established. Thisamount is included in accounts payable.
Notional principal amounts outstanding as at December 31 are listed below for interest rate, currency swap and foreignexchange contracts entered into by the Corporation.
($ in millions) 2002 2001
Remaining Term to Maturity
Under 1 Year 1 to 3 Years Over 3 Years Total Total
Currency swaps 620 1,644 6,472 8,736 8,811Interest rate swaps 2,063 3,864 1,729 7,656 5,416Foreign exchange contracts 3,248 – – 3,248 3,149
Total Derivative Financial Instruments $5,931 $5,508 $8,201 $19,640 $17,376
These same derivatives can be measured by book value and fair value.
2002 2001
Book value:Asset 171 167Liability (384) (516)
Fair value:Positive 543 293Negative (424) (532)
Swaps that have a positive fair value are those contracts that, if settled immediately, would result in a gain. Conversely, immediatesettlement of a swap with a negative fair value would result in a loss.
E D C A N N U A L R E P O R T 2 0 0 2 73
EDC_AR_fin_E 4/3/03 11:30 AM Page 45

18. Fair Value of Financial Instruments
The following chart outlines the book values and the fair values of the Corporation’s financial instruments. As with any estimate, uncertainty is inherent due to the unpredictability of future events. In the case of estimating the fair value of theCorporation’s financial instruments, this uncertainty is magnified due to the large number of assumptions used and the widerange of acceptable valuation techniques. Estimates of fair values are based on market conditions at a certain point in time, andmay not be reflective of future market conditions. Thus, the estimates of the value of financial instruments outlined as follows do not necessarily reflect the actual values that may occur should the instruments be exchanged in the market. It is notthe Corporation’s intent to settle these items in the market before they mature.
The aggregate of the estimates of the fair value of financial instruments presented as follows does not reflect an estimate ofthe underlying value of the Corporation.
($ in millions) 2002 2001
Balance Sheet Financial Instruments Book Value Fair Value Book Value Fair Value
Cash and marketable securities:Fixed rate securities 557 575 430 438Floating rate securities 2,276 2,276 1,752 1,753
Investments 75 75 173 173Performing fixed rate loans 12,703 12,261 12,132 11,160Performing floating rate loans 11,674 9,123 11,713 10,252Impaired loans (net of specific allowance
and non-accrued capitalized interest) 676 676 538 538
Subtotal 27,961 24,986 26,738 24,314
Less: Non-accrued capitalized interest onPerforming Loans* 425 – 499 –General allowance for loan losses (note 7) 3,031 – 2,522 –
Total $24,505 $24,986 $23,717 $24,314
Accounts payable 155 155 131 131Loans payable:
Fixed rate 14,855 15,518 12,992 13,276Floating rate 6,233 6,496 7,037 7,042
Total $21,243 $22,169 $20,160 $20,449
* Represents the unamortized balance that accrued while the loan was impaired.
Note: The book value of assets and liabilities shown above differs slightly from the balances on the financial statements due to the exclusionof deferrals that do not have a fair value.
($ in millions) 2002 2001
Off-Balance Sheet Financial Instruments Fair Value Fair Value
Currency swap contracts 102 (319)Interest rate swap contracts 57 107Foreign exchange contracts (40) (27)Undisbursed loan commitments:
Fixed rate 180 251Floating rate 368 221
The fair values of marketable securities and investments are estimated using observable market prices. If such prices are notavailable, a valuation technique is used that is consistent with accepted economic pricing methodologies.
In order to estimate the fair value of its performing loans receivable, the Corporation separates its loans into risk pools and calculates the net present value of cash flows of principal and interest. The discount rate for the fixed rate portfolio is derivedby taking the base rate, U.S. Treasury for U.S. dollar fixed rate cash flows, for example, to which a spread for credit risk is addedto each credit pool. The discount rate for the floating rate portfolio is derived similarly by adding to the base rate a spread forcredit risk depending on the grade of credit. The fair value of undisbursed loan commitments is estimated using the samemethodology used in the performing loans receivable estimate.
74 C A N A D A ’ S B R I D G E T O G L O B A L T R A D E A N D I N V E S T M E N T
EDC_AR_fin_E 4/3/03 11:30 AM Page 46

Accounts payable are outstanding for only a short period of time. Thus, the fair value of accounts payable is estimated to beequal to their book value.
The estimate of the fair value of loans payable is based on a discounted cash flow approach using current market rates.
The estimate of the fair value of the foreign exchange contracts is calculated using the current market spot and forwardexchange rates at the end of the year. Currency swap contracts and interest rate swap contracts are valued using a discountedcash flow approach. The discount rate used to estimate the fair value of the swap contracts is based on the current market swaprates at the end of the year as issued by Reuters and Telerate. These rates are used to calculate the present value of future interest payments and principal cash flows related to the swap contracts.
19. Related Party Transactions
The Corporation enters into transactions with other government departments, agencies and Crown corporations in the normalcourse of business.
Canada Account Administrative Expense Recovery
As described in note 21, EDC administers certain financial and contingent liability transactions on behalf of the Government ofCanada, known as the “Canada Account”. EDC receives compensation for expenses and overhead relating to Canada Accountactivities. In 2002, EDC retained $7 million (2001 – $12 million) from Canada Account receipts and recoveries for these expensesand overhead.
Loan with Recourse to the Consolidated Revenue Fund
The Corporation has loans receivable of $1,368 million (2001 – $1,222 million) and undisbursed commitments of $130 million(2001 – $275 million), for which it has recourse to the Consolidated Revenue Fund of Canada in the event of a loan default.
Debt Relief
When sovereign borrowers experience financial difficulties and are unable to meet their debt obligations, sovereign creditors,including the Government of Canada, agree at an international forum, the Paris Club, to formally reschedule the borrower’s debtobligations. From time to time and on a case-by-case basis, the most heavily indebted sovereign borrowers are granted debtreduction or debt service relief by the Government of Canada. The granting of debt reduction or relief by the Paris Club is contingent upon the sovereign borrower’s ability to implement and maintain economic programs outlined by the InternationalMonetary Fund.
In the past, the Government of Canada has reimbursed the Corporation an amount equal to the debt relief granted by theGovernment of Canada to the Corporation’s sovereign borrowers. The formula for calculating the amount to be paid to theCorporation was amended effective April 1, 2001 in two ways. Firstly, for new loans issued by the Corporation to sovereign borrowers which were on the Paris Club debt relief list as at April 1, 2001, the Government of Canada has no obligation to compensate the Corporation for further debt relief granted to such borrowers. Secondly, for any debt reduction for new loansresulting from unilateral debt relief measures or new debt reduction for obligations contracted prior to April 1, 2001, EDC willshare in the costs of debt forgiveness to the amount of its appropriate specific allowances.
Amounts received for debt relief arrangements on sovereign impaired loans are credited to the book value of the loans similarto the treatment accorded to other receipts on impaired loans. To the extent that amounts received exceed the book value of theloans as a result of non-accrued capitalized interest, debt relief income is recorded, and any provisions are returned to income.
Debt relief in the amount of $96 million (2001 – $1 million) was recognized as income. During the year, the Corporation receivedin total $402 million (2001 – $13 million) pursuant to debt relief arrangements, and of this amount, $96 million represented thenon-accrued capitalized interest associated with these loans and was recognized as debt relief income in the income statement.
Dividend
EDC paid a dividend to the Government of Canada in the amount of $95 million during the year (2001 – nil) at the request ofthe shareholder.
E D C A N N U A L R E P O R T 2 0 0 2 75
EDC_AR_fin_E 4/3/03 11:30 AM Page 47

20. Employee Benefits
Pension Plan
Effective April 24, 2000, the Corporation established a pension plan for its employees. The plan is a defined benefit plan,providing benefits to retirees based on years of service and the best five consecutive years’ average salary of the employees. Allpermanent employees of EDC are members of the pension plan, however, employee contributions to the plan are optional.
The benefits that were transferred from the Public Service Superannuation Fund with respect to both the Registered Plan and the Supplementary Plan are included in the projected obligation as at December 2002. As of December 31, 2002, theGovernment of Canada had transferred a total of $110 million to the Corporation’s registered pension plan to fund the pensionobligation that was transferred. Included in pension assets is $14 million owing from the Government of Canada to fund thebalance of this obligation. Also included in pension assets is $33 million owing from the Government of Canada to fund the liabilities transferred to the Supplementary Plan. The PSSA is in the process of establishing the Regulation required to enable it to transfer the obligation and the corresponding assets with respect to the Supplementary Plan. It is anticipated that the regulation will be in place and the transfer will occur in 2003.
Other Benefits Plan
The Corporation maintains a retiring allowance program and provides certain life insurance, health and dental care benefits toretired employees. This plan is unfunded.
The following presents the financial position of EDC’s Employee Benefit Plans at December 31, 2002.
($ in thousands) 2002 2001
Pension Other Pension OtherBenefits Benefits Benefits Benefits
Plan Plan Plan Plan
Accrued Benefit Obligation:Obligation beginning of year 126,604 28,604 6,689 22,474Current service costs 12,733 2,881 11,087 1,879Interest cost on benefit obligation 10,114 2,256 1,214 1,743Buyback contributions 722 – – –Obligation transferred from PSSA 4,982 – 123,227 –Actuarial (gain)/loss including change in basis 3,665 1,215 (13,941) 2,687Benefits paid (1,100) (659) (1,672) (179)
Accrued benefit obligation at end of year 157,720 34,297 126,604 28,604
Fair Value of Plan Assets:Fair value at beginning of year 137,786 – 6,070 –Actual return on plan assets (4,764) – (556) –Transfer from PSSA – – 80,000 –Receivable from PSSA 30,749 – 43,227 –Employer contributions 7,618 659 7,641 179Employee contributions 3,771 – 3,076 –Benefits paid (1,100) (659) (1,672) (179)
Fair value at end of year 174,060 – 137,786 –
Funded Status – plan surplus/(deficit) 16,340 (34,297) 11,182 (28,604)Unamortized net actuarial (gain)/loss (15,466) 3,756 (12,541) 2,576Unamortized transitional obligation – 9,004 – 9,608
Accrued benefit asset/(liability) $874 $(21,537) $(1,359) $(16,420)
Included in the accrued benefit obligation is an amount of $8,023 thousand (2001 – $1,905 thousand) and included in the fairvalue of plan assets is $34,221 thousand (2001 – $1,372 thousand), both in respect to the Supplementary plan.
76 C A N A D A ’ S B R I D G E T O G L O B A L T R A D E A N D I N V E S T M E N T
EDC_AR_fin_E 4/3/03 11:30 AM Page 48

Net Employee Benefits Expense($ in thousands) 2002 2001
Pension Other Pension OtherBenefits Benefits Benefits Benefits
Plan Plan Plan Plan
Current service costs (net of employee contributions) 9,684 2,881 8,011 1,879Interest cost on benefit obligation 10,114 2,256 1,214 1,743Expected return on plan assets (12,608) – (800) –Amortization of transitional obligation – 604 – 604Amortization of net actuarial (gain)/loss (1,806) 30 – –
Total $5,384 $5,771 $8,425 $4,226
Assumptions2002 2001
Pension Other Pension OtherBenefits Benefits Benefits Benefits
Plan Plan Plan Plan
Expected long-term rate of return on assets 7.5% n/a 8.0% n/aDiscount rate on projected benefit obligation 6.75% 6.75% 7.0% 7.0%Inflation 3.0% 3.0% 3.0% 3.0%Rate of compensation increase Inflation + 1% Inflation + 1% Inflation + 1% Inflation + 1%
productivity + productivity + productivity + productivity + merit merit merit merit
The initial annual rate of increase for covered medical care benefits is assumed to be 8%. This rate is projected to trend downover 7 years to an ultimate rate of 4%. For dental care, the trend rate used was 4%.
21. Canada Account Transactions
Pursuant to the Act, the Minister for International Trade, with the concurrence of the Minister of Finance, may authorize theCorporation to undertake certain financial and contingent liability transactions on behalf of the Government of Canada. Thesetransactions and the legislative authorities that underlie them have come to be known collectively as the “Canada Account”.The Board of Directors is responsible only for ensuring that the transactions made by the Corporation under the Canada Accountare administered appropriately. Accounts for these transactions are maintained separately from the Corporation’s accounts andare consolidated annually as at March 31 with the financial statements of the Government of Canada, which are reported uponseparately by the Government and audited by the Auditor General of Canada. The assets under the Canada Account, mainlyloans receivable and accrued interest and fees recorded in accordance with the accounting policies and practices of theGovernment of Canada, amounted to $3,069 million at December 31, 2002 (2001 – $2,774 million).
The Act allows the Canada Account to have outstanding loans and commitments to foreign borrowers, and liabilities under contracts of insurance and other agreements up to a maximum of $13 billion. The position against this limit, determined inaccordance with the requirements of the Act, is $10,305 million (2001 – $5,030 million).
As at the end of December 2002, total Ministerial Authorizations (M.A.’s) issued and approved totaled $490 million and unallocated amounts under Lines of Credit totaled $187 million for Canada Account. These amounts have been approved by theMinister of International Trade and the Minister of Finance in support of potential new transactions to be signed. The positionagainst the statutory limit will increase accordingly as each new obligation is signed by the Corporation that has the effect ofextending credit.
During 2001, a new methodology to compensate EDC for expenses and overhead related to Canada Account activities was instituted. This resulted in the Corporation retaining $7 million (2001 – $12 million) from Canada Account receipts and recoveriesfor these expenses and overhead.
22. Reclassification of Comparative Figures
Certain 2001 comparative figures have been reclassified to conform to the presentation adopted in 2002.
E D C A N N U A L R E P O R T 2 0 0 2 77
EDC_AR_fin_E 4/3/03 11:30 AM Page 49

78 C A N A D A ’ S B R I D G E T O G L O B A L T R A D E A N D I N V E S T M E N T
Balance Sheetsas at December 31
($ in millions) 2002 2001 2000 1999 1998
Gross loans receivable 26,341 25,226 22,023 18,598 16,524Less: non-accrued capitalized interest 1,426 1,241 1,165 1,182 1,255Less: allowance for losses on loans 3,613 2,892 2,700 2,324 2,060Less: deferred loan revenue 292 267 272 248 220
Net loans receivable 21,010 20,826 17,886 14,844 12,989Cash and investments 2,899 2,346 2,357 3,417 1,730Accrued interest and other assets 645 621 747 1,253 761
Total assets $24,554 $23,793 $20,990 $19,514 $15,480
Loans payable 20,828 19,609 17,583 16,325 12,636Accrued interest and other liabilities 812 1,082 846 937 728Allowance for loan commitments and guarantees 377 588 130 115 129Allowance for claims on insurance 460 464 439 339 307
Total liabilities 22,477 21,743 18,998 17,716 13,800
Share capital 983 983 983 983 983Retained earnings 1,094 1,067 1,009 815 697
Shareholder’s equity 2,077 2,050 1,992 1,798 1,680
Total liabilities and shareholder’s equity $24,554 $23,793 $20,990 $19,514 $15,480
Income Statementsfor the year ended December 31
($ in millions) 2002 2001 2000 1999 1998
Interest income – loans 1,404 1,620 1,585 1,256 1,055Interest income – debt relief 96 1 – 2 –Interest income – investment portfolio 69 127 197 146 126
Less: interest expense 580 934 1,066 796 642
Net interest income 989 814 716 608 539
Insurance premiums and guarantee fees 147 134 144 133 110Provision for credit losses 840 741 549 523 433
Income after provision for credit losses 296 207 311 218 216Administrative expenses 174 149 117 100 81
Net income $122 $58 $194 $118 $135
Five-Year Review
EDC_AR_fin_E 4/3/03 11:30 AM Page 50

E D C A N N U A L R E P O R T 2 0 0 2 79
Corporate Account
Financial Arrangements Facilitated($ in millions) 2002 2001 2000 1999 1998
Export FinancingDirect financing 7,381 8,419 7,657 6,060 6,639
Export InsuranceShort-term insurance* 34,532 26,776 25,807 23,792 20,660Medium-term insurance 8,638 8,555 7,080 5,914 3,933Guarantees 689 597 325 456 189
Subtotal 43,859 35,928 33,212 30,162 24,782
Total $51,240 $44,347 $40,869 $36,222 $31,421
Short-term domestic insurance not included above $298 $1,157 $3,996 $3,833 $3,330
Financial and Other DataExport FinancingNumber of transactions financed 397 556 458 372 351Value of total obligations on loans receivable 26,341 25,226 22,023 18,598 16,524Value of undisbursed loans 3,512 4,938 4,825 5,345 5,813Value of disbursements 6,028 8,085 7,210 6,374 5,822Value of liability on loan guarantees 2,699 2,212 1,795 1,643 1,723Undisbursed amounts on loan guarantees 299 355 112 123 150Number of current lines of credit and protocols 47 40 44 55 52Amounts available for allocation 1,655 1,476 1,176 1,659 1,320Loan amounts rescheduled 775 290 264 720 237Loan amounts written off 194 191 105 – –
Export InsuranceNumber of policies issued 6,351 5,090 3,951 3,879 3,345Number of insurance policies
and guarantees in force 11,686 9,982 8,264 7,190 6,272Value of liability on insurance and guarantees** 12,265 11,944 12,495 10,955 9,921Value of claims paid 144 144 84 134 72Value of claims recovered/rescheduled 39 51 30 17 19Value of claims outstanding at end of year 344 298 246 234 164Value of claims under consideration at end of year 35 48 36 38 62
Average employee strength during year 992 939 838 778 698
* Excludes domestic insurance.
** Figures prior to 2000 were not restated to reflect current presentation as the information was not reasonably determinable.
EDC_AR_fin_E 4/3/03 11:30 AM Page 51

80 C A N A D A ’ S B R I D G E T O G L O B A L T R A D E A N D I N V E S T M E N T
Canada Account
Financial Arrangements Facilitated($ in millions) 2002 2001 2000 1999 1998
Export FinancingDirect financing 527 135 38 67 9
Export InsuranceShort-term insurance 1 – – – –Medium-term insurance 5 16 224 247 497Guarantees – – – – 12
Subtotal 6 16 224 247 509
Total $533 $151 $262 $314 $518
Financial and Other DataExport FinancingNumber of transactions financed 28 8 11 12 5Value of total obligations on loans receivable 2,968 2,682 2,490 2,599 2,904Value of undisbursed loans 5,123 101 192 183 194Value of disbursements 534 203 76 66 100Number of current lines of credit and protocols 2 2 3 2 2Amounts available for allocation 109 88 73 73 87Loan amounts rescheduled 25 43 3 45 45
Export InsuranceNumber of policies issued 1 1 1 4 12Number of insurance policies
and guarantees in force 1 4 5 20 25Value of liability on insurance and guarantees 4 56 170 199 299Value of claims paid – – – 8 4Value of claims recovered – – – – 7Value of claims outstanding at end of year 47 47 46 46 38
EDC_AR_fin_E 4/3/03 11:30 AM Page 52

E D C A N N U A L R E P O R T 2 0 0 2 81
Mr. J. Bernard Boudreau PresidentRadcliffe Consulting and Investment Ltd.Halifax, Nova Scotia
Ms Dorothy E. Byrne, Q.C.PresidentEagle Island Consulting Corp.Corporate SecretaryVancouver/Whistler 2010 Bid CorporationVancouver, British Columbia
Mr. Rayburn D. DoucettPresidentCrosswaters Trade Brokers LimitedBelledune, New Brunswick
Mr. Leonard J. EdwardsDeputy Minister for International TradeOttawa, Ontario
Mr. Rowland W. FlemingPresidentVergemount Inc.Creemore, Ontario
Mr. Jonathan T. FriedSr. Assistant Deputy Minister of Finance and G-7 Deputy for CanadaDepartment of FinanceOttawa, Ontario
Mr. Robert A. FungDeputy ChairmanYorkton Financial Inc.Toronto, Ontario
Mr. A. Ian GillespiePresident and Chief Executive OfficerExport Development CanadaOttawa, Ontario
Mr. Paul GobeilChairman of the BoardExport Development CanadaMontreal, Quebec
Mr. Robert J. HoltPresidentApplied Common Sense Solutions Inc.Saltspring Island, British Columbia
Mr. Pierre MacDonald President and Chief Executive OfficerMacD Consult Inc.Verdun, Quebec
Mr. James A. PattilloPresidentAdvance Film GroupCalgary, Alberta
Mr. Ajay K. VirmaniPresidentCargo Jet Canada Ltd.Mississauga, Ontario
Ms. Margriet ZwartsGeneral Counsel and SecretaryTelesystem International Wireless Inc.Montreal, Quebec
(1 Vacancy)
Board of Directors
During 2002, the following changes occurred on the Board of Directors:
� Pierre MacDonald reappointed April 30, 2002
� A. Ian Gillespie reappointed August 27, 2002
� Rayburn D. Doucett reappointed on November 5, 2002
� Dominique Vachon resigned on December 4, 2002
Members of the Board of Directors As at December 31, 2002
EDC_AR_text_E 4/3/03 11:44 AM Page 33
82 C A N A D A ’ S B R I D G E T O G L O B A L T R A D E A N D I N V E S T M E N T
Over the year 2002, the leadership and stewardship shown by EDC’s Board ofDirectors (the “Board”) and its various committees largely focused on consolidationand renewal, bridging past initiatives and future direction.
Consolidation took the form of putting into full operation policy decisions,including those arising from legislative changes, which the Board had overseen inprevious years, such as EDC’s new corporate identity and Corporate SocialResponsibility (CSR) initiatives. Renewal related to the efforts of the Board, underthe direction of a new Chairperson, to ensure that the focus on the future did notstop with the legislative review that concluded in 2001, and that the corporation’sactivities remained effective in providing the best possible service to Canada’sexporters. It also involved steps by the Board and its Human Resources Committeeto ensure appropriate succession planning, both with respect to the President, whowas re-appointed during the year, and senior management. Informed by this dualfocus, the Board and its committees, in the 42 meetings held during the year, gavedirection and guidance to EDC’s management on key features of EDC’s operations.
This ongoing work by the Board in demonstrating leadership of the corporationrelated to and helped ensure compliance with the guidelines set out by TreasuryBoard in its publication entitled Corporate Governance in Crown Corporations and OtherPublic Enterprises (the “Guidelines”).
The Guidelines related to the Board’s activities in 2002 as indicated below:
Board StewardshipAs a key responsibility of the Board, the stewardship of the corporation remained amajor focus of Board activities, with the following initiatives undertaken in 2002:
Strategic Direction: The legislative review process, which had been the focus of theBoard’s strategic activities over several years, ended in December 2001 with theamendment of the Export Development Act, but this by no means marked the end ofthe Board’s involvement in strategic issues. Rather, the Board took active steps in2002 to continue the consideration and discussion of the strategic direction of thecorporation, and in furtherance of this discussion held special sessions at its regularmeetings, convened a meeting devoted to strategic review, and constituted an ad hoccommittee of the Board dedicated to that purpose. The original themes identifiedwere: application of EDC’s mandate to meet customer needs, customer service andbusiness development, the risk element, including risk management, risk appetiteand the profitability of the corporation, and people in senior management positions.However, the scope of the study has evolved to include a much broader examinationof Canada’s export credit system and the corporation’s place and function within thatsystem. The Board approved the 2003-2007 Corporate Plan of the corporation, whichrecognized that the development of a longer-term strategy remained ongoing.
Identifying and Managing Risks: 2002 proved to be a year of continuing financialand economic turmoil in countries in which the corporation has exposure, especiallyin sectors such as the telecommunications, airline and United States power industries.In light of this ongoing uncertainty, the Risk Management Committee of the Board(RMC) continued to play an active role in ensuring that the Board remained awareof the status of the corporation’s portfolio, including those assets consideredimpaired or at risk, and in refining the examination and monitoring of risk and thereporting of results. The Board also reviewed the corporation’s capabilities and thesystems in place to ensure that the operations of the corporation could continue in theevent of disaster, and toured the special facilities established to aid in this purpose.
Corporate Governance Practices
EDC_AR_text_E 4/3/03 11:44 AM Page 34

E D C A N N U A L R E P O R T 2 0 0 2 83
Succession Planning: Both the Board and the Human Resources Committee (HRC)of the Board had roles to play in connection with the position of President of the corporation and the renewal of the incumbent for a further two-year term. In addition,the HRC took on the responsibility of satisfying itself that a proper system existedwithin the corporation to ensure appropriate succession planning as well as a sharingand distribution of responsibilities in this regard. The year concluded with an approvalby the HRC of the framework outlining where the responsibility for various appointmentswill lie, and the manner in which the succession plan will be approved and monitored.
Importance of Information Flow: Efforts continued in 2002 to ensure that EDC’sinformation systems and management practices met the Board’s needs, with continuedimprovement in the usability of the reporting provided to the Board and its committees.During the year, the Board requested and received a number of enhancements to theinformation flow, including systems to avoid duplication in reports and presentationmaterial received by the Board. Monthly reporting to all directors regarding credit riskexposures, including policy compliance and changes to country and obligor ratings,which had been initiated following the events of September 11, 2001, continued tobe provided, and this reporting enhanced the currency of the information Boardmembers have at hand.
Public Policy Objectives: As noted, the corporation’s mandate will be examined aspart of the strategic review. The other significant public policy matters monitored by theBoard together constituted initiatives to implement the corporation’s CSR program.Specific activities in this regard included: public consultations and resulting amendmentsboth to the Disclosure Policy and the Environment Review Directive (ERD), both of whichhad been approved in 2001; implementation and communication of the role of theCompliance Officer which had been established in 2001 to ensure accountability andcompliance in specific CSR matters and to assist EDC in responding to the concernsof stakeholders in these matters; the formation of a CSR Advisory Council which mettwice in 2002; workshops held across the country with respect to new anti-corruptionlegislation; staff training on the ERD and on anti-corruption legislation; and, finally,strengthened channels of communications between EDC and the Department ofForeign Affairs and International Trade (DFAIT) so as to provide EDC with informationand guidance from DFAIT with respect to human rights developments in relevantcountries, and ways in which such information may be integrated into EDC's politicalrisk assessment.
Communications and Stakeholder Relations: In 2002, all areas of communicationand engagement with the main stakeholders of the corporation, the Crown and par-liamentarians, public interest groups, the media, key business associations, and thepublic at large, were centralized within one area of the corporation under theresponsibility of the Vice-President for Corporate Communications and ExternalRelations. The resulting regrouping helped to ensure consistency and a better levelof communication, including a proactive role in engaging public interest groups bymeans ranging from the formal public consultation process used in connection withthe ERD and the Disclosure Policy, and public interest group membership on theCSR Advisory Council to less formal dialogue.
EDC_AR_text_E 4/3/03 11:44 AM Page 35

84 C A N A D A ’ S B R I D G E T O G L O B A L T R A D E A N D I N V E S T M E N T
Working with ManagementActivities in 2002 involving the relationship between EDC’s Board and its management,and the ability of the Board to function independently included the following:
Working Relationships: The Board continued in 2002, through management systemsincluding its Delegation of Authority and policy frameworks, to enhance its ability tofocus on the corporation’s directions and objectives and to monitor the management ofthe business activities and other affairs of the corporation. The Board placed significantimportance on maintaining an effective working relationship and accountabilitystructure between the Board and management, as evidenced by the involvement ofboth the HRC and the Board itself in establishing and approving, in agreement withthe President, his objectives for the year and in measuring his performance againstthese objectives.
Board Independence: The Board continued to meet in-camera for a portion of eachmeeting of the Board, as it has done for several years, and some meetings of committeescontinued to include sessions without management presence. In 2002, the AuditCommittee established regular in camera discussions with the corporation’s internalCorporate Auditor, and with representatives of the corporation’s external auditor, theAuditor General of Canada. With respect to other issues related to its independentfunctioning, the Board was briefed on conflict of interest concerns and, in addition,the directors received an annual refresher with respect to the applicability of theCorporation’s Code of Conduct and relevant provisions of the Financial AdministrationAct, and filed declarations with respect thereto. The corporation’s committee structureremains robust and continues to evolve, with Terms of Reference for the committeesreviewed periodically and revised when appropriate, as was the case with several committees in 2002. The Board and committees received external independentadvice where such advice was necessary or desirable in connection with issues undertheir consideration.
Functioning of the BoardMatters related to Board functioning were primarily concerned with education, andconsideration of ways in which the Board could appropriately assess its own effectiveness.The newly appointed Chairperson of the Board received an orientation on the corporation, its business and practices, and the operations of the Board at the time ofhis appointment, and the Board continues to ensure that, as vacancies are filled, newdirectors will receive similar orientation. In addition, a focus in 2002 was the provision ofongoing education to all directors by means of background presentations on specificEDC policies and practices, and the history of their development.
Finally, in 2002 the Board made a commitment to continue the process of renewaland evaluation of Board effectiveness by undertaking every two years a formal surveyto assess the Board’s capacity and evaluate its performance, as well as that of its committees. The next such survey will take place in the first half of 2003. During thecourse of 2002, however, Board members did have a vehicle by which they couldexpress their views as to what they need to receive in order to enhance the functioningof the Board and its committees.
EDC_AR_text_E 4/3/03 11:44 AM Page 36

E D C A N N U A L R E P O R T 2 0 0 2 85
The Audit Committee assists the Board in fulfilling its responsibilities in relation to:financial reporting and performance measurement; financial and management controlsystems and practices; the safeguarding of assets of the corporation and the managementof its resources; corporate financing; internal and external audits; EDC’s Code ofBusiness Ethics and Code of Conduct; its Environmental Review Directive (ERD);and overseeing the activities of the Compliance Officer. Areas of particular focus in2002 included the implementation of ERD reporting and operational guidelines forthe compliance program; emerging accounting principles regarding accounting for derivatives; EDC’s information technology infrastructure and systems and relatedcosts; and a review and recommendations for revision of the Committee’s Terms ofReference. In 2002, the Committee held five meetings.
Members: R.A. Fung (Chair), R.J. Holt, P. MacDonald, J.A. Pattillo, and A.K. Virmani.
The Business Development Committee assists the Board by providing policydirection to enhance EDC’s ability to meet the evolving needs of the market, takinginto account factors related to industrial sector and/or regional economy. Areas ofparticular focus in 2002 included: eBusiness strategies and achievements; support foremerging exporters; EDC market size and the goal of 10,000 customers by 2004; newEDC representation for Central and Eastern Europe; and a program, in partnershipwith Canadian banks, focusing on working capital requirements of small- and medium-sized enterprises. In 2002, the Committee held five meetings.
Members: R.D. Doucett (Chair), J.B. Boudreau, D.E. Byrne, R.A. Fung, and A.K. Virmani.
The Corporate Governance Committee is responsible for, and makes recom-mendations to the Board on, matters relating to EDC’s corporate governance regime,including the development and implementation of methods to ensure good Boardperformance; and the determination of the structure, responsibility and compositionof the various committees of the Board. The Committee’s activities in 2002 consisted ofreviewing and recommending updates to the Terms of Reference of several committeesof the Board, and reviewing the corporate governance sections of the corporation’sannual report. In 2002, the Committee held one meeting.
Members: The Chairperson of the Board, D.E. Byrne, R.D. Doucett, R.W. Fleming and J.A. Pattillo.
The Executive Committee has the authority to exercise all the powers of the Boardwith the exception of: declaring dividends; approving any corporate plan, budget,financial statement or report required by any statute or under EDC’s By-Laws; andmaking, amending or repealing EDC’s By-Laws. This Committee is intended to meetto handle only those urgent matters that may arise between meetings of the Board.In 2002, the Committee held four meetings and one joint meeting with the RiskManagement Committee.
Members: The Chairperson of the Board, L.J. Edwards, A.I. Gillespie, P. MacDonald and J.A. Pattillo.
Committees of the Board of Directors
EDC_AR_text_E 4/3/03 11:44 AM Page 37

86 C A N A D A ’ S B R I D G E T O G L O B A L T R A D E A N D I N V E S T M E N T
The Human Resources Committee assists the Board by reviewing and makingrecommendations to the Board on EDC’s Human Resources strategic plan, successionplanning for the Corporation’s senior management, and EDC’s compensation policy;approving, on the recommendation of the President, the annual budget for both basepay and variable pay, and the annual cash compensation paid to senior executives; andworking with the Pension Committee in making recommendations to the Board onany changes to the design of the pension plan for EDC employees. Areas of particularfocus in 2002 included: a review of the President’s performance against objectives;the reappointment of the President and consideration of succession issues withrespect to that office; succession planning for senior management positions; officiallanguages and the development of a new policy in this regard; and approval of EDC’scompensation plan for 2002. In 2002, the Committee held five meetings and onejoint meeting with the Pension Committee.
Members: R.J. Holt (Chair), R.D. Doucett, L.J. Edwards, A.I. Gillespie, P. MacDonald and the Chairperson of the Board.
The Pension Committee assists the Board in overseeing the administration of thepension plan for EDC employees including ensuring the component plans are properlyadministered and funded in accordance with applicable legislation, required documentsare filed with appropriate authorities and all activities of the plan are monitored on anongoing basis, as well as working with the Human Resources Committee in makingrecommendations to the Board on any changes to the design of the plan. In 2002,the Committee having completed the implementation phase, focused much of itsactivities on ensuring that adequate management systems were in place for it to assistthe Board in fulfilling its oversight role, and in this regard approved changes to theinvestment policies for the plan, recommended changes to its own Terms of Reference,and periodically met and reviewed the performance of the plan’s investment managers,as well as approving plan text amendments of an administrative nature reflecting twofull years of experience with the plan. In 2002, the Committee held five meetings andone joint meeting with the Human Resources Committee.
Members: R.W. Fleming (Chair), D.E. Byrne, A.I. Gillespie, R.J. Holt and the Chairperson of the Board.
The Risk Management Committee assists the Board in fulfilling its oversightresponsibilities with respect to the management of the financial and other enterpriserisks, including direct and contingent credit exposures undertaken by the Corporationin the conduct of its business activities, including establishing and updating, asrequired, an effective and flexible regime governing the authorizations required bythe Corporation to undertake such activities; the risks to the Corporation’s financialresources and value from exposure to changes in market risk factors such as interestrates, foreign exchange rates and equity indices; and availability of liquid diversifiedfinancial resources to call upon in the event that market conditions do not permitaccess to funding. Areas of particular focus in 2002 included: implementation of economic capital measurement within the credit risk framework; continued refinementof the risk frameworks, including consideration of additional elements such as operational risk; establishment of an enterprise risk management timetable andwork-plan spanning several years; and reviewing and satisfying itself that theCommittee’s Terms of Reference were appropriate and that no amendments werenecessary, with a recommendation to the Board to that effect. In 2002, theCommittee held four meetings and one joint meeting with the Executive Committee.
Members: P. MacDonald (Chair), J.B. Boudreau, R.W. Fleming, A.I. Gillespie, R.J. Holt and the Chairperson of the Board.
EDC_AR_text_E 4/3/03 11:44 AM Page 38

E D C A N N U A L R E P O R T 2 0 0 2 87
The Ad Hoc Strategic Review Committee was formally constituted as an adhoc committee of the Board in order to determine a work plan for, and oversee thecarrying out of, a strategic review, the objective of which is to see if Canadian exportersand foreign investors have the required trade finance related products, services andcapacity available to them in order to realize their full potential in an increasinglycompetitive global marketplace thereby ensuring long term prosperity for Canada. A significant focus of this review will be the extent to which EDC, as the principalinstrument of public policy to achieve this end, can further enhance its overall effectiveness for Canadian exporters and investors taking into account their viewsand those of other stakeholders. In 2002, the Committee held two meetings.
Members: R.W. Fleming (Chair), J.B. Boudreau, P. MacDonald and J. Pattillo.
All committees are required to report to the Board of Directors on their activitieson a regular and timely basis.
The remuneration of directors falls under the authority of the Governor Generalin Council, which has also set guidelines governing the payment of fees to theChairperson of the Board and to the other private sector directors. The Chairpersonof the Board is paid an annual fee of $12,400 and a per diem of $485, and the otherprivate sector directors are paid an annual fee of $6,200 and a per diem of $485. Inaddition, private sector directors, other than the Chairperson of the Board, receiveannual fees of $2,000 when they hold office as Vice Chairperson of the Board orChairperson of a committee of the Board. Public service directors are not paid fortheir services as directors.
The total aggregate remuneration paid to EDC’s private sector directors for theirservice in 2002 was approximately $247,500 compared to $279,000 in 2001. Thedirectors served, on average, on three committees of the Board, and attended a totalof 42 Board and committee meetings in 2002. The total costs incurred by the Board,including business travel and promotion as well as meeting expenses, were $ 235,124for 2002 compared to $262,774 for 2001.
Finally, attendance at meetings of the Board and its Committees during the yearwas as indicated in the following table.
Table of Directors’ attendance at meetings of the Board, and of Board Committees in 2002
Corp. Strategic Audit-5 BDC-5 Gov.-1 Exec.-5 HR-6 Pension-6 Risk-5 Review-2 Board-7
Boudreau n/a 5/5 n/a n/a n/a n/a 4/5 2/2 7/7
Byrne n/a 4/5 1/1 n/a n/a 4/6 n/a n/a 3/7
Doucett n/a 5/5 1/1 n/a 6/6 n/a n/a n/a 7/7
Edwards n/a n/a n/a 4/5 5/6 n/a n/a n/a 6/7
Fleming n/a n/a n/a n/a n/a 6/6 4/5 2/2 6/7
Fried n/a n/a n/a n/a n/a n/a n/a n/a 7/7
Fung 5/5 4/5 n/a n/a n/a n/a n/a n/a 7/7
Gillespie n/a n/a n/a 5/5 5/6 3/6 5/5 n/a 7/7
Gobeil n/a n/a 1/1 5/5 6/6 5/6 5/5 n/a 7/7
Holt 5/5 n/a n/a n/a 6/6 6/6 5/5 n/a 7/7
MacDonald 5/5 n/a n/a 5/5 5/6 n/a 4/5 2/2 7/7
Pattillo 5/5 n/a 1/1 5/5 n/a n/a n/a 2/2 7/7
Vachon n/a 1/5 0/1 n/a n/a n/a n/a n/a 0/7
Virmani 0/5 0/5 n/a n/a n/a n/a n/a n/a 4/7
Zwarts n/a n/a n/a n/a n/a n/a n/a n/a 7/7
EDC_AR_text_E 4/3/03 11:44 AM Page 39

88 C A N A D A ’ S B R I D G E T O G L O B A L T R A D E A N D I N V E S T M E N T
Commitment to legal and ethical conductEDC will conduct its business and affairs in accordance with the letter and spirit of allapplicable laws in the countries in which it does business. If any EDC employee orrepresentative is ever uncertain as to the interpretation or application of a particularlaw, he or she must seek advice from Legal Services before taking action. Compliancewith the law may, however, fall short of the standard of ethical conduct expected by EDC.
Accordingly, it is EDC’s policy that each of its directors, employees and represen-tatives conduct EDC’s business with honesty, integrity and fairness. It is also corporatepolicy that communication and relationships with stakeholders be truthful and transparent in a way that will withstand the highest degree of public scrutiny. Workingrelationships will be based on candor and openness, treating each other fairly and withrespect, while acting with integrity, and weighing responsibilities to all stakeholders.
The environmentIn considering transactions, EDC examines environmental risk along with any otherrisk. EDC has developed its own environmental assessment procedure in consultationwith Canadian exporters, environmental organizations and other stakeholders. Thisprocedure will support EDC’s desire to conserve and enhance environmental qualityand to advocate concern for the environmental impact of projects it supports in for-eign jurisdictions. EDC will encourage best practices among those with whom it doesbusiness, with the aim of raising international environmental standards. EDC will strivefor high standards of environmental conservation while ensuring that this does notunduly hinder EDC’s ability to support Canadian exporters to compete on a global scale.
Prohibitions against bribery and corruptionBasic criminal statutes of virtually all countries prohibit extortion and bribery. Under nocircumstances will EDC, directly or indirectly, knowingly offer or give a bribe. Further,EDC will not support a transaction that involves the offer or giving of a bribe, and willexercise reasonable diligence and care not to support unknowingly such a transaction.
Code of Business Ethics
EDC_AR_text_E 4/3/03 11:44 AM Page 40

E D C A N N U A L R E P O R T 2 0 0 2 89
Human rightsEDC values human rights and promotes the protection of internationally recognizedhuman rights, consistent with the policies of the Government of Canada. EDC recognizes the sovereignty of other national governments with respect to humanrights and conducts business with them where doing so is consistent with the policiesof the Government of Canada.
EDC employees, representatives and other stakeholders are entitled to have theirdignity as human beings respected and to work in an environment free from intimidation,hostility or offensiveness. EDC is therefore committed to creating and maintaining awork and business environment that is free from harassment and discrimination onprohibited grounds. These prohibited grounds include age, race, colour, religion,creed, sex, nationality, ethnic or place of origin, citizenship, language, political belief,marital or family status, pregnancy, sexual orientation and disability.
Avoiding conflicts of interestEmployees and representatives of EDC have a duty to act in the best interests of EDCat all times. A conflict of interest arises when an employee must choose between EDC’sbest interests and his/her own. The judgment of EDC employees and representativesmust be, and must be seen to be, independent of any personal or financial intereststhat arise from business dealings, social ties, or other personal considerations.
EDC has adopted a Code of Conduct that requires employees and representativesof EDC to adhere to the highest standards of conduct with respect to conflicts ofinterest. Compliance with these standards is achieved through avoidance, disclosure,discontinuance or divestment.
Maintaining confidentiality of information EDC will respect the privacy rights of its stakeholders, including their right to securityof information. EDC will preserve confidential information in its possession, and usesuch information only for corporate purposes.
Some employees have access to sensitive or confidential information that, if released,could significantly harm EDC, its employees or other stakeholders. Therefore, employeesand other representatives of EDC must use extreme care when handling such information.As a general rule, such information shall not be provided to EDC employees or rep-resentatives other than on a need-to-know basis or to anyone outside EDC who is notauthorized or legally entitled to receive it.
EDC_AR_text_E 4/3/03 11:44 AM Page 41

90 C A N A D A ’ S B R I D G E T O G L O B A L T R A D E A N D I N V E S T M E N T
Actuarial Gains and Losses – Changes in the value of the accrued benefit obligation and the plan assets resulting from actual results differing from those assumed or changes in an actuarial assumption.
Actuarial Valuation (re: Employee Benefits Plan) – An assessment of the financial status of a benefit planperformed by an independent actuary. It includes the valuation of any plan assets and the accrued benefitobligation using estimates of future events that will affect the costs and obligation for employee future benefits.
Basis Point – One one-hundredth of a percentage point.
Contingent Liability – Potential debt which may become an actual financial obligation if certain eventsoccur or fail to occur. Contingent liability is also referred to as insurance policies and guarantees outstanding.
Credit Risk – Credit risk is the possibility that a loss may be incurred if a counterparty fails to meet its financialcommitments.
Internal Efficiency Ratio – Gross administrative expenses expressed as a percentage of net revenue excludingdebt relief.
Financial Sustainability Ratio – Adjusted operating income (operating income net of debt relief) as a percentageof the year’s average capital and allowances.
Foreign Exchange Risk – Foreign exchange risk is the possibility that a loss may result from exchange ratemovements.
Gross Loans Receivable – Principal amounts outstanding, including any non-accrued capitalized interest,under existing loan agreements.
Hedge – A risk management practice used to manage interest rate or foreign exchange exposures arising fromthe normal course of business operations.
Impaired Loans – Loans that no longer have reasonable assurance of collection of interest and principal.
Interest Rate Risk – Interest rate risk is the potential impact on the Corporation due to changes in interest rates.
LIBOR – London Inter-Bank Offered Rate – The interest rate at which banks in London are prepared tolend funds to first-class banks.
Liquidity Risk – Liquidity risk is the chance that funds will not be available to meet the Corporation’s obligations.
Market Risk – Market risk is the likelihood of a loss to the Corporation as a result of possible movements ininterest and foreign exchange rates.
Net Interest Income – The difference between the interest earned on assets and interest expense on borrowings.
Net Margin – Net interest income expressed as a percentage of average assets employed.
Net Revenue – Net income excluding the provision for credit losses and administrative expenses.
Off-Balance Sheet Financial Instrument – An asset or liability that is not recorded on the balance sheet,but has the potential to impact cash flows in the future if a contingent event occurs.
Operating Income – Net income excluding the provision for credit losses.
Operational Risk – Operational risk is the potential loss that may result from human error, internal controlweaknesses and system deficiencies.
Projected Benefit Method Pro Rated on Services – An actuarial valuation method in which an equal portionof the total estimated future benefit is attributed to each year of service.
Projected Benefit Obligation – The actuarial present value of benefits attributed to employee services rendered to a particular date.
Return on Equity – Net income expressed as a percentage of shareholder’s equity.
Undisbursed Loan Commitments – A contractual amount under an existing loan agreement that has yetto be advanced to the borrower.
Glossary of Financial Terms
EDC_AR_text_E 4/3/03 11:44 AM Page 42

Head OfficeExport Development Canada151 O’Connor StreetOttawa, Canada K1A 1K3
Tel.: (613) 598-2500Fax: (613) 237-2690
Web site: www.edc.ca
Vancouver OfficeSuite 1030, One Bentall Centre505 Burrard Street, Box 58Vancouver, British ColumbiaV7X 1M5
Tel.: (604) 638-6950Fax: (604) 638-6955
Edmonton OfficeSuite 90510010 – 106th StreetEdmonton, AlbertaT5J 3L8
Tel.: (780) 702-5233Fax: (780) 702-5235
Calgary OfficeHome Oil TowerSuite 606324 – 8th Avenue S.W.Calgary, AlbertaT2P 2Z2
Tel.: (403) 537-9800Fax: (403) 537-9811
Winnipeg OfficeCommodity Exchange TowerSuite 2075360 Main StreetWinnipeg, ManitobaR3C 3Z3
Tel.: (204) 975-5090Fax: (204) 975-5094
London OfficeSuite 1512148 Fullarton StreetLondon, OntarioN6A 5P3
Tel.: (519) 963-5400Fax: (519) 963-5407
Toronto OfficeSuite 810150 York StreetP. O. Box 810Toronto, OntarioM5H 3S5
Tel.: (416) 640-7600Fax: (416) 862-1267
Montreal OfficeTour de la BourseSuite 4520800 Victoria SquareP. O. Box 124Montreal, QuebecH4Z 1C3
Tel.: (514) 908-9200Fax: (514) 878-9891
Quebec City OfficeSuite 13002875 Laurier BoulevardSte-Foy, QuebecG1V 2M2
Tel.: (418) 266-6130Fax: (418) 266-6131
Moncton OfficeSuite 400735 Main StreetMoncton, New BrunswickE1C 1E5
Tel.: (506) 851-6066Fax: (506) 851-6406
Halifax OfficePurdy’s Wharf Tower IISuite 14101969 Upper Water StreetHalifax, Nova ScotiaB3J 3R7
Tel.: (902) 442-5205Fax: (902) 442-5204
St. John’s Office90 O’Leary AvenueSt. John’s, NewfoundlandA1B 2C7
Tel.: (709) 772-8808Fax: (709) 772-8693
Brazil and Southern ConeAv. das Nações Unidas 12901Cenu Torre Norte, Andar 16CEP 04578-000, São Paulo – SPBrazil
Tel.: 011-5511-5509-4320, ext. 3320Fax: 011-5511-5509-4275
Chinac/o Canadian Embassy19 Dongzhimenwai StreetChaoyang DistrictBeijing, 100600China
Tel.: 86-10-6532-3536, ext. 3357Fax: 86-10-6532-4072
MexicoCalle Schiller 529Rincón del BosqueColonia PolancoMéxico, D.F. 11560Mexico
Tel.: 011-5255-5387-9316Fax: 011-5255-5387-9317
Edificio KalosPiso c-1, Local 108-AZaragoza 1300 Sur y Constitucion64000 Monterrey, N.L. México
Tel.: 011-52-81-8344-3200, ext. 3360Fax: 011-52-81-8340-7703
Polandc/o Canadian Embassy ul. Jana Matejki 1/500-481 WarsawPolandTel.: 011-48-22-584-3240Fax: 011-48-22-584-3277
Ce document existe également en version française.
Printed in Canada on Canadian recycled and recyclable paper.
Corporate Offices
International Representation
EDC_AR_text_E 4/3/03 11:44 AM Page 43

www.edc.ca
Vision
EDC will be the recognized leader in providingground-breaking commercial financial solutions to companies of all sizes, helping them succeed in the global marketplace and create enduringprosperity for Canada.
Values
PeopleWe are the heart and soul of EDC. Our diversityenriches us all. Each one of us deserves respectand makes a difference. Working together is fundamental to our success.
ExcellenceWe are responsible for excellence in everythingwe do. We believe in personal accountability and the power of challenging the status quo.
PassionInitiative and enthusiasm characterize the way wework. We take satisfaction in the quality of whatwe do. We are here because we want to be here.
LearningWe believe that learning is an invigorating andcontinuous process. We seek out and embracepersonal and professional development, and theinvaluable lessons that come from experience.
EDC_AR_text_E 4/3/03 11:44 AM Page 44