canadian banks abroad. expansion and exposure to …€¦ · 1 for a full list of countries of...
TRANSCRIPT

1
Canadian Banks Abroad. Expansion and Exposure to the 2008-2009 Financial Crisis Hugues Létourneau and Pablo Heidrich The North-South Institute May 2010 Banking is one of the most internationalised sectors of the Canadian economy, whereby the five largest institutions have important assets abroad, and operate extensive retail banking networks in the US, Latin America, the Caribbean and East Asia. Using a literature review, this paper assesses first the factors that have driven this foreign expansion of Canada’s main financial institutions for the 1980-2010 period. The resulting patterns are used later to infer why this expansion abroad has not resulted in a high degree of negative exposure in this recent global crisis. This paper is part of a North-South Institute project on global financial markets and regulations, funded by the Ford Foundation and the Commonwealth Secretariat. The views presented here are not necessarily those of these funders or the Institute, but solely those of the authors. Any mistakes or errors are also their sole responsibility. Please, send your comments or suggestions to [email protected] or [email protected] .
2
Introduction The five largest Canadian banks - Royal Bank of Canada, Bank of Nova Scotia, Bank of Montreal, Toronto Dominion, and Canadian Imperial Bank of Commerce – have a dominating position in their home market and, just as their peers from other countries, have expanded their operations abroad. That internationalization has happened in several waves, with the latest starting in the late 1990s. They operate today in most major economies around the world via representative offices, and in the United States, the Caribbean, Latin America, and parts of East Asia, through branch network for personal and commercial banking services. The current financial crisis has hit these banks to different extents, mostly due to their exposure at home, as the Canadian economy has suffered from the contagion of the US downturn. However, some of the international operations of these banks have also been a source of crisis impact, given their large exposure to the US market. As the crisis plays itself out, and the US as well as other countries engineer economic recovery plans as well as new banking or financial regulatory policies, the foreign expansion of Canadian banks might change. That could constitute a new instance of exposure via international expansion. This paper seeks to answer two questions: what has the expansion of Canadian banks abroad been, and how has that translated (or not) into damaging exposure to the financial crisis in the 2008-2009 period? Those questions structure the paper into two parts. The first looks at the actual paths of expansion by these banks abroad, drawing on anecdotal evidence from media reports, framed by a brief summary of the literature on financial foreign direct investment. The findings roughly portray these large Canadian banks as institutions that seek profit opportunities abroad in a saturated Canadian banking market. They have also followed the path of Canadian businesses’ internationalization via the North American Free Trade Agreement with the United States and Mexico, as well as other roads for foreign expansion by Canadian non-bank firms anchored on past common colonial ties with the Caribbean, and on comparative advantages in natural resources extraction and processing in Latin America1. The second half of the paper looks at how that external expansion has translated or not into damaging exposure during this time of crisis. Informed by a brief review of the literature on exposure, the expansion presented before is analyzed again but observing the results obtained by these Canadian banks in those markets where they chose to invest principally through data from the Bank of International Settlement Consolidated Banking Statistics, Bank of Canada data on claims and liabilities booked abroad and bank annual reports. The findings point to two stylized facts. Canadian banks, relative to other Western countries, were, both in absolute and relative terms, less exposed to the crisis as a result of their low foreign claims positions around the world. Another finding is that the type of incursion made into the foreign market matters in terms of exposure both when looking at Canadian banks individually and aggregated country-level data. Those Canadian banks that focused most on retail banking and least on investment or wholesale operations abroad suffered comparatively less than those who did the reverse. Foreign direct investment in the banking sector. Main insights from the literature. The decision of banks to internationalise their operations is rooted in a number of factors. These can be grouped by level of analysis into firm and macroeconomic. The latter are, in turn, divided into push and pull factors, referring to those that can propel a bank to conduct direct investments abroad, and the ones that bring that investment into a given country, respectively. In any given decision for a bank to invest directly abroad, all elements play at once in an often interconnected manner, with some being more
1 For a full list of countries of operation and international expansion since 1980, see annex.

3
relevant than others according to the bank, timing of the decision, home country and host economy of the investment. These multiple relations are initially presented here in a short review of the literature, done in order to draw on an analytical framework that looks at the key drivers behind the foreign operations of Canadian banks, observing where they coincide with – differ from – the international experiences of multinational banking in general. There are essentially three ways in which banks can operate abroad. Firstly, they can open a foreign branch which will be controlled by the parent bank and suited to serve personal and commercial banking. Also referred to as greenfield investment, this type of expansion has been limited to the Caribbean for Canadian banks. Secondly, banks can acquire shareholdings in a foreign bank which may stem from a merger and result in a foreign subsidiary. Subsidiaries have identical banking powers as domestic banks and usually operate in the personal and commercial banking sector. This form of expansion has generally prevailed for Canadian banks operating abroad, notably in the retail and commercial sectors in the United States and in Latin America. Thirdly, direct cross border lending is typically offered to large-scale borrowers such as multinational companies and foreign banks and is often operated out of a representative office which has a foothold in a given country to offer services (ex: facilitate trade finance) to home country clients. The present section on the international expansion of Canadian bank activities will focus on the first two forms of foreign expansion, namely, subsidiaries and greenfield investments (branches). Firm level factors The vast majority of literature on bank behaviour points to the costs and benefits of their international expansion. Hymer (1969) pioneered the notion that foreign banks face significant cost disadvantages when compared to local competitors. Such costs may stem from lack of information on the host country’s market, culture and language, and also a lack of soft information on borrowers due to a lack of prior borrowing relationships, such as the ones that a domestic bank would have. Relationships with customers and regulators are key factors in information gathering for banking, the reason why local banks are seen as having an advantage over foreign banks. Foreign banks seeking to penetrate markets are thus uninformed lenders depending on their mode of entry. In order to overcome these disadvantages, the prior efficiency of the bank that is seeking to penetrate a new market is a key counterweighting factor in its expansion. Lehner (2009) develops a framework that ties the multinational operations of banks abroad to their efficiency in screening potential borrowers at home, ie, soft information on borrowers. He argues that a bank that is inefficient in that task is unlikely to expand abroad. As banks gain efficiency in screening, they are likely to opt for cross border lending. Once sufficient market knowledge makes up for the fixed entry costs, greenfield investments (starting up a new bank from scratch) are preferred because they can compensate for the larger fixed entry costs. However, they hold no soft information on clients. When a bank has access to highly reliable screening techniques, acquisition will be favoured because its profit will rise more quickly as a result of the soft information it will hold from its acquisition. Thus, Lehner argues that a bank needs powerful enough screening technology so that greenfield entry would lower the profits of a host country bank and drive down the price of acquisition. Empirical evidence for this new theoretical paper is however still scarce. A natural advantage that can help a home country bank expand abroad is through its relationship with corporate clients who want to establish operations abroad, principle known as “follow the client”. The home country bank, already in possession of soft information on this client may be ideally positioned to offer adequate services and build knowledge on the local market for subsequent expansion. Size is a firm specific attribute that has been assessed as a potential factor to understand foreign expansion of banks. A large bank could take advantage of its economies of scale to establish non cost-duplicating operations in a foreign market. According to Casson (1990), retail operations through foreign

4
subsidiaries are unlikely to lead to large gains in a banks’ efficiency while a branch model directed to wholesale or investment banking might do so. Adrian E. Tschoegl (2003) finds that foreign banks that penetrate the US market through subsidiaries tend to be the largest in their home country, which raises the observation that domestic limits to growth may interest banks in setting up shop in the US. Using data on cross border merger and shareholdings from OECD countries, Focarelli & Conzzolo (2001) also find that the most important factor behind the internationalization of banks is their size in their home market. Focarelli and Pozzollo (2005) establish that banks in countries where the banking sector is more profitable are more likely to expand abroad. The degree of internationalisation (DOI) can lead to better overall performance because internationalized firms can spread fixed costs, allowing learning about domestic markets from international market experience and accessing factors of production at lower cost in addition to cross-subsidizing. Other authors have argued that the reverse is true, meaning that firms which choose to internationalize are those that have already become high performers. In an analysis of Canadian banks’ international operations, Santor and Hejazi (2005) find a weak but positive relationship between degree of internationalization and bank performance, defined as return on equity, return on asset and profitability. They find that in this case, the causality would run from bank performance as a determinant of degree of internationalization, in other words, better banks tend to be more international. Risk is also a factor in the international expansion of banking operations. It can be dispersed through operations across regions with different economic climates, thus diversifying a bank’s portfolio and pushing the risk-expected return frontier (Berger & de Young (2001). Santor and Hejazi (2005) also look at the risk dimension in their analysis of Canadian bank’s degree of internationalisation and their performance. They measure riskiness within the DOI index by country into the least risky government bonds such as US Treasury Bills and more risky private loans. They also assess whether countries are developed or less developed. Their empirical findings show that greater holdings of securities are negatively correlated with performance and deposits are correlated with better performance. Private claims are positively correlated to performance while public claims such as Treasury Bills are negatively correlated.. Nevertheless, these relationships are described as insignificant. Disaggregation into developed and less-developed countries does not show a significant empirical relationship in terms of risk profile and bank performance. Macro factors The decisions of banks are undoubtedly affected by the macroeconomic, institutional and cultural environments of the host countries where they choose to invest. These factors need to be considered in both, the home country of the bank, and in the host country. While in the first, these are called push factors, in the second, they are referred to as pull factors (see chart 1). Regulatory and institutional environments are consistently portrayed as one of the most important determinants for banks to expand abroad. The general finding is that deregulation has a substantial impact on merger decisions. For example, Guillen and Tschoegl (2000) show that the Latin American privatisation wave was conducive to the entry of a large number of Spanish banks. Galindo (2003) find that differences in legal origin, banking regulations and institutional variables such as differences in corruption, the rule of law and the efficiency of the judiciary all add learning costs which deter entry into foreign countries. Focarelli and Pozzolo add that a stronger rule of law increases the probability of hosting foreign subsidiaries because they usually have larger involvement with activities regulated by local laws. Regulation will also affect the organisational form of a bank’s foreign operations. Restrictions on banking activities reduces the likelihood of a foreign bank operating subsidiaries according to Focarelli and Pozzolo (2005) who say that branches, for who regulations are less binding are more likely. Buch and DeLong (2004) find that as countries increase transparency and enhance supervision, their banks become

5
more attractive targets. Furthermore, they find that banks from more developed countries tend to take over banks in less developed countries. Cultural integration, through culture and language spoken in the home country’s bank is found to be a significant factor in a bank’s decision to invest abroad notably because it decreases information costs. The evidence of Galindo (2003) is consistent with this view and Tschoegl (2003) reinforces this idea by showing that this is the case for foreign banks operating through subsidiaries in the US. Buch and Delong (2004) and also corroborate the idea that the protagonists in bank mergers tend to speak the same language. Furthermore, common legal systems and political systems, as identified with Canadian banks operating in the Caribbean, is a factor to weigh. The economic integration of the home country and the host country are also identified as a relevant factor in understanding the international operations of banks. Indeed, banks seem to be pulled by the trade partners of their clients as there is a relation between bilateral trade and financial FDI. Following the clients is important but not as much as size in banks’ choices and the search for opportunities abroad according to Focarelli & Conzzolo (2001). Geographical proximity is also found to be an important factor in cross border bank mergers (Buch & deLong 2004). Nevertheless, Herrero & Simon (2006) argue that empirical evidence regarding the causality of financial FDI and bilateral trade is not conclusive; do banks enter markets following non-financial FDI or vice-versa? This factor is connected with the firm specific advantage of having a commercial relationship and therefore possessing soft information on the client. Profit opportunities are also a basic determinant in the decision of banks to expand abroad. Among the macro factors which are used to signal profit opportunities, we find economic growth, the size of the baning sector, income per capita, level of schooling, average age and the size of the banking sector. Focarelli and Pozzolo (2005) demonstrate that the expected growth of the destination country is a key factor in expansion. They find a correlation between the presence of foreign banks and high costs and less efficient use of equity capital. Macroeconomic variables such as the effects of taxes, exchange rates, interest rates and growth are seen to have an impact on international banking expansion and are important to analyse in the home and host country perspective. Although the effect of taxes on the location choices of banks is not fully established, financial institutions may engage in profit shifting whereby profits are shifted out of a foreign jurisdiction either to the home country or in a tax haven in order to reduce the taxes paid relative to the scale of operations. Demirgu-Kunt & Huizinga (2001) find evidence that taxes paid by foreign banks actually fall with the statutory tax, which they tie to profit shifting by banks. Cerutti et al (2005) show that taxation impact organisational in that branches are more likely in host countries with high corporate taxes because of greater ease to shift profits across borders. Interest rates are also important in both the home and host country. Higher real interest rates in the home country reduce incentives for corporations to pursue foreign investments. Herrero & Simon (2006) stipulate this should be the case for the banking sector as well because low interest rates at home mean lower costs of capital which stimulates foreign investments, claim which is corroborated by Tschoegl’s case study of Spanish banks. On the host country side, a pull factor might be high real interest rates, often used to do inflation targeting in monetary policy. Such practice is widespread in emerging markets in Latin America, with some examples in East Asia, too. High real interest rates in the host country, when coupled with low real interest rates in the home country of the investing bank, make a very profitable environment. Funds can be raised in the home country, transferred intra-firm to the host country, and lent there. The returns on that lending are then used to pay back depositors in the foreign subsidiary and the rest, transferred back to the headquarters in the home country. Martinez Meria and Mody (2004) found evidence that spreads from foreign banks in Latin America are lower than for domestic institutions although Brock & Suarez (2000) also shown that on average, during the 1990’s spreads in Latin America
6
were much higher than in industrial countries. This can thus imply that foreign banks obtain a significant profit margin. Comparing expansion patterns among Canadian banks The Canadian banking landscape is characterised by the dominance of a relatively small number of banks, which dominate and have wide-ranging operations across the whole country. At the end of October 2008, the six largest banks in terms of assets, namely, RBC, TD, CIBC, BMO and the National Bank of Canada held over 90% of all bank assets in the country. The financial center of the country is the city of Toronto where the Big Five (Big Six minus National Bank of Canada) are headquartered and it is home to the country’s largest stock exchange, the Toronto Stock Exchange. Over the past 25 years, legislative changes have eliminated the four pillars that used to separate the basic functions in the financial sector: banking, insurance, trust services and brokerage and investment, and today, these large banks operate in all of these four areas with just a few restrictions. The Canadian financial sector, acclaimed as one of soundest in the world in the last years, is however tightly regulated. These dominant institutions, known as chartered banks, are federally regulated by the Office of the Superintendent of Financial Institutions (OSFI), the Department of Finance, and the Bank of Canada2. The Competition Bureau determines whether mergers among institutions can proceed. In 2010, there are 78 banks under the supervision of OSFI. The foreign ownership limit has recently been raised to 20% from 10%, still preventing foreign acquisition or control. Regulatory capital ratios, set by OSFI, generally exceed the risk based capital guidelines issued by the Bank for International Settlements. The presence of Canadian banks abroad dates back to the latter half of the nineteenth century when RBC (1882) and Scotiabank (1889) started operations in the Caribbean to cater to maritime commerce. Caribbean expansion was pursued until the Great Depression. A second wave of expansion started in the 1960’s and peaked during the time of the Latin American debt crisis of the early 1980’s. Canadian banks, such as RBC, were important creditors to Latin American countries, especially to Brazil and Mexico. After BMO’s acquisition of Chicago based Harris bank in 1984, the latter part of the 1980’s were a period of retrenchment and sovereign debt rescheduling. RBC notably sold an important part of its Caribbean operations in 1988, the Royal Bank of Trinidad and Tobago to local interests. It was not before the second half of the 1990’s that Canadian banks started venturing abroad again, generally in the form of personal and commercial banking but also in investment banking acquisitions in major centres such as the US. This third wave of foreign expansion was led by privatizations of state banks and sales of domestic private ones in Latin American countries. Scotiabank has been the Canadian leader in this movement into that region, while RBC and TD have made important retail and commercial banking acquisitions in the United States after their failed merger of 1997. The Caribbean has brought renewed interest from CIBC and RBC, which have made important acquisitions to compete against Scotiabank. Finally, there is an increasing interest in the Asian emerging markets, which is still relatively more regulated than Latin America’s but have an important growth potential. By 2010, Canada’s Big Five banks have a varying degree of international operations. The most internationalised bank in terms of countries of operation is Scotiabank, which has positioned itself as a strong player in Mexican, Caribbean and Latin American markets. The Bank of Montreal, Toronto-Dominion and RBC have important operations in the US market, with Toronto-Dominion being the most North American focused bank. Currently, Scotia, RBC and BMO are attempting to gain a foothold in
2 Another important institution in the financial sector is the Desjardins Group, the largest association of credit unions in North America, and sixth largest financial institution in Canada,. It is provincially regulated by Quebec.
7
China. Furthermore, Scotiabank has looked beyond China to Malaysia, Thailand and India although foreign control regulations in these markets have limited the scope of acquisitions and operations. The following section will analyse the international expansion patterns of these “Big Five” Canadian banks with a focus on the personal and commercial banking activities in light of the frameworks that have been outlined above3. This is done by drawing observations from evidence that has been gathered on the banks’ operations going back to 1980, using archived newspaper articles, annual reports, magazine articles and bank websites. United States Among the international operations of Canadian banks, the United States needs to be isolated from other countries given that it is Canada’s only geographical neighbour and that the vast majority of Canada’s trade is conducted with the United States. The United States, as the world’s financial centre, has a well developed financial regime where institutions are protected by legislation, an incentive for FDI to occur. Thus the institutional factors characterising the US market make it favourable to foreign banking investments. The US market can be fundamentally differentiated from the Canadian in the following manner; the former has a large number of smaller banks notably because of the history of fragmented state regulations that complicated the formation of interstate bank networks. For example, the number of insured banks in the US peaked in 1984 at 14,496, to decrease progressively to 8,080 in 2001 after a wave of consolidations. The three Canadian players with significant personal and commercial banking operations in the American market are BMO, RBC and TD. For much of the 1980’s and 1990’s, Canadian banking operations in the United States consisted of wholesale banking operations with large multinational clients, corporations with links to Canada and respective niche lending markets. RBC, TD and CIBC mostly built on their existing U.S. assets during this period without large networks of branches or subsidiaries. The Bank of Montreal was the exception to this pattern as it penetrated the U.S. retail banking market in 1983 when it acquired Chicago-based Harris Bank, the region’s third largest bank. The transaction costed US $546M (1983$) and it positioned the BMO as the most important Canadian player in the US market with assets totalling more than US $15b. During these years, all players except BMO seemed to be partly driven by the economic integration between both countries. On the side of RBC and TD, the “follow the client” principle seems to have played a strong part in their U.S. operations in the 1980’s and 1990’s. Indeed, at RBC, loans to U.S. clients only represented 8% of its $9-billion (CAN) in US assets in 1994 thus reflecting the focus on corporate clients with ties to Canada. On the side of TD, at least half of their 500 most important relationships in the US, principally with Fortune 1000 companies, involved companies with a strong presence in Canada. CIBC focused on increasing its presence in the large corporate sector with industry teams focusing on industries with a North American presence. An important part of their operations came from the brokerage arm, Wood Gundy. Scotia, with the third largest US assets in 1996 after CIBC, catered to certain sectors in specific locations such as health care in Atlanta4. Table1:
3 Wholesale, brokerage and investment banking activities such as those occurring in international financial centers (ex: Hong Kong or Singapore) or in countries where banks only hold a representative office are not the main subject of this study. 4 Gordon, Sheldon (1994). “Banking on U.S. customers.” Canadian Banker, 101 (1), p.24
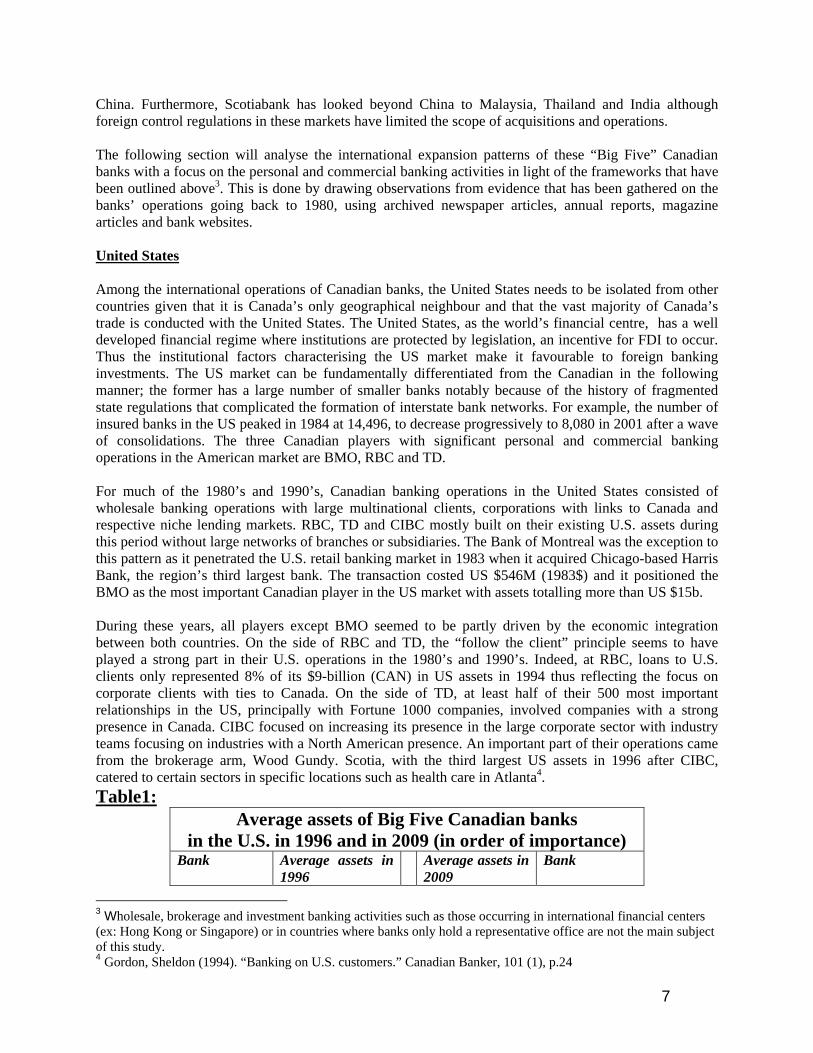
Average assets of Big Five Canadian banks in the U.S. in 1996 and in 2009 (in order of importance)
Bank Average assets in 1996
Average assets in 2009
Bank

8
Source: 1996: BMO (p.38 & p.30-to 1996) , CIBC, Scotia, RBC (p.61-to 1993) , TD: Annual reports 1997 2009: RBC (p.127), TD (p.143), BMO (p.46, p.155), CIBC (p.157), Scotia: 2009 Annual Reports The failed mergers of CIBC with TD and RBC with BMO in 1998 marked a turning point in terms of these banks’ US strategies. TD and RBC would both make incursions in the US market through small and mid-sized acquisitions in distinct regional markets. RBC acquired Centura Banks in 2001, a mid-sized bank with operations in the Southeastern US for $2.3-billion (US)5. Furthermore, in 2000 and 2001, notwithstanding the Centura transaction, RBC spent about $4.5-billion (CAN) on a wave of US acquisitions6. Nevertheless, Centura was the first acquisition of retail operations and this was pursued in 2007 when RBC acquired Alabama National Bancorp for $1.6-billion (US) thus doubling RBC’s locations in Alabama, tripling them in Florida and adding to its presence in Georgia for a total of approximately 400 branches7. In a similar fashion, TD ventured into the American market more aggressively in the 2000’s with two large acquisitions in the US Northeast. It acquired Banknorth Group in two operations. In 2004, it disbursed $5-billion (US) for Banknorth Group and in 2006, it acquired the 43% of shares they did not own for a sum of $3.2-billion (US)8. The second large acquisition of TD was that of Commerce Bancorp for the sum of $8.5-billion (US) in October 20079. It now operates as many branches in the US as it does in Canada. Thus, since the failed mergers of 1998, the number of Canadian banks with significant retail operations in the US has increased from one to three, while the size of their total investments has more than tripled. The consequential incursion into the US market can partially be attributed to saturated growth in the Canadian market according to public statements made by bank CEO’s. The acquisition wave began following the failed mergers of 1998 mergers which would have resulted in growth for the banks and a better chance to compete in categories where size matters, for example, capital markets on Wall Street10. The reorientation to the US market offered the chance for the large Canadian players to acquire regionally focused banks in a fragmented US market and then enlarge their operations out of those bases, namely, New England for TD, the Midwest for BMO and the Southeast for RBC. The evidence would seem to be in line with Tschoegl’s (2003) finding that foreign banks that penetrate the US market through subsidiaries tend to be the largest in their home country (RBC), and that they tend to be large, as are TD and BMO. Language which he found to be an important factor for foreign banks penetrating the US through subsidiaries also fits with the Canadian evidence. The retail and commercial operations are all on the U.S. East coast which demonstrates relative geographic and cultural proximity to the global headquarters of these three banks, in Toronto. High per capita income, perceived to be a pull factor for foreign banks, is true at the macro-US level, large country with the highest per capita income in the world. Nevertheless, the US is a large fragmented market and the three banks have established in regions which do not overlap; Southeast for RBC, the 5 Howlett, Karen (2001). “Royal buys U.S. bank Centura”. The Globe and Mail, Toronto, Jan 27, 2001, p.B.1 6 Reguly, Eric (2001). “Message to Bay Street: Go international or go home”. Globe and Mail, Toronto, April 19 2001, p.B12. 7 Grant, Tavia (2007). “RBC makes $1.6-billion push into U.S. Southeast.” Globe and Mail, Toronto, Sep 7, 2007. p. B1 8 Perkins, Tara (2007). “TD pares in U.S., still aims for growth.” Globe and Mail, Toronto, Mar 24, 2007, p.B6 9 Perkins, Tara (2009). “RBC, rivals find mixed success in U.S. expansion.” Globe and Mail, Toronto, Aug 15, 2009, p.B4. 10 Craig, Susanne (1998). “Bank mergers fire up debate some analysts see better, cheaper services others wary sector becoming a closed hub.” Globe and Mail, Toronto, Apr 20, 1998.p. B1.
BMO C$ 53.2 billion C$ 177.6 billion TD CIBC C$ 43.9 billion C$ 144.5 billion RBC Scotia Bank C$ 22.5 billion C$ 142.5 billion BMO RBC C$ 22 billion C$ 44 billion Scotia Bank TD C$ 18.1 billion C$ 19.8 billion CIBC
9
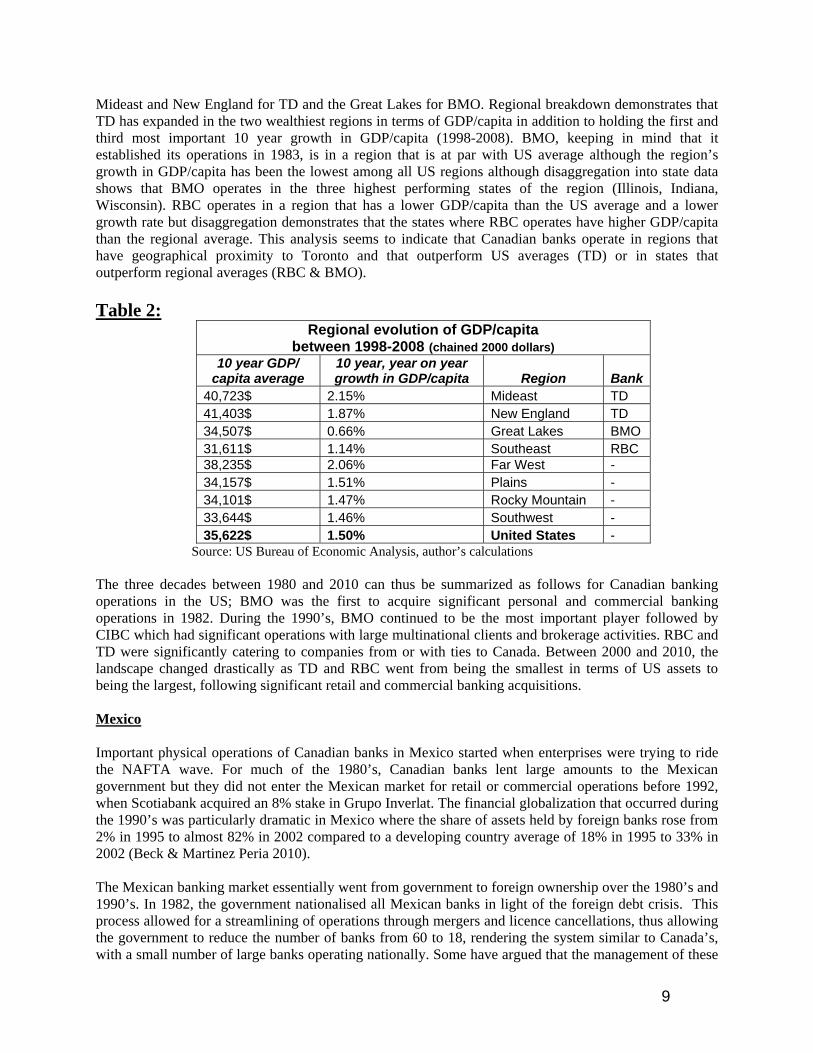
Mideast and New England for TD and the Great Lakes for BMO. Regional breakdown demonstrates that TD has expanded in the two wealthiest regions in terms of GDP/capita in addition to holding the first and third most important 10 year growth in GDP/capita (1998-2008). BMO, keeping in mind that it established its operations in 1983, is in a region that is at par with US average although the region’s growth in GDP/capita has been the lowest among all US regions although disaggregation into state data shows that BMO operates in the three highest performing states of the region (Illinois, Indiana, Wisconsin). RBC operates in a region that has a lower GDP/capita than the US average and a lower growth rate but disaggregation demonstrates that the states where RBC operates have higher GDP/capita than the regional average. This analysis seems to indicate that Canadian banks operate in regions that have geographical proximity to Toronto and that outperform US averages (TD) or in states that outperform regional averages (RBC & BMO). Table 2:
Regional evolution of GDP/capita between 1998-2008 (chained 2000 dollars)
10 year GDP/ capita average
10 year, year on year growth in GDP/capita Region Bank
40,723$ 2.15% Mideast TD 41,403$ 1.87% New England TD 34,507$ 0.66% Great Lakes BMO 31,611$ 1.14% Southeast RBC 38,235$ 2.06% Far West - 34,157$ 1.51% Plains - 34,101$ 1.47% Rocky Mountain - 33,644$ 1.46% Southwest - 35,622$ 1.50% United States -
Source: US Bureau of Economic Analysis, author’s calculations The three decades between 1980 and 2010 can thus be summarized as follows for Canadian banking operations in the US; BMO was the first to acquire significant personal and commercial banking operations in 1982. During the 1990’s, BMO continued to be the most important player followed by CIBC which had significant operations with large multinational clients and brokerage activities. RBC and TD were significantly catering to companies from or with ties to Canada. Between 2000 and 2010, the landscape changed drastically as TD and RBC went from being the smallest in terms of US assets to being the largest, following significant retail and commercial banking acquisitions. Mexico Important physical operations of Canadian banks in Mexico started when enterprises were trying to ride the NAFTA wave. For much of the 1980’s, Canadian banks lent large amounts to the Mexican government but they did not enter the Mexican market for retail or commercial operations before 1992, when Scotiabank acquired an 8% stake in Grupo Inverlat. The financial globalization that occurred during the 1990’s was particularly dramatic in Mexico where the share of assets held by foreign banks rose from 2% in 1995 to almost 82% in 2002 compared to a developing country average of 18% in 1995 to 33% in 2002 (Beck & Martinez Peria 2010). The Mexican banking market essentially went from government to foreign ownership over the 1980’s and 1990’s. In 1982, the government nationalised all Mexican banks in light of the foreign debt crisis. This process allowed for a streamlining of operations through mergers and licence cancellations, thus allowing the government to reduce the number of banks from 60 to 18, rendering the system similar to Canada’s, with a small number of large banks operating nationally. Some have argued that the management of these
10
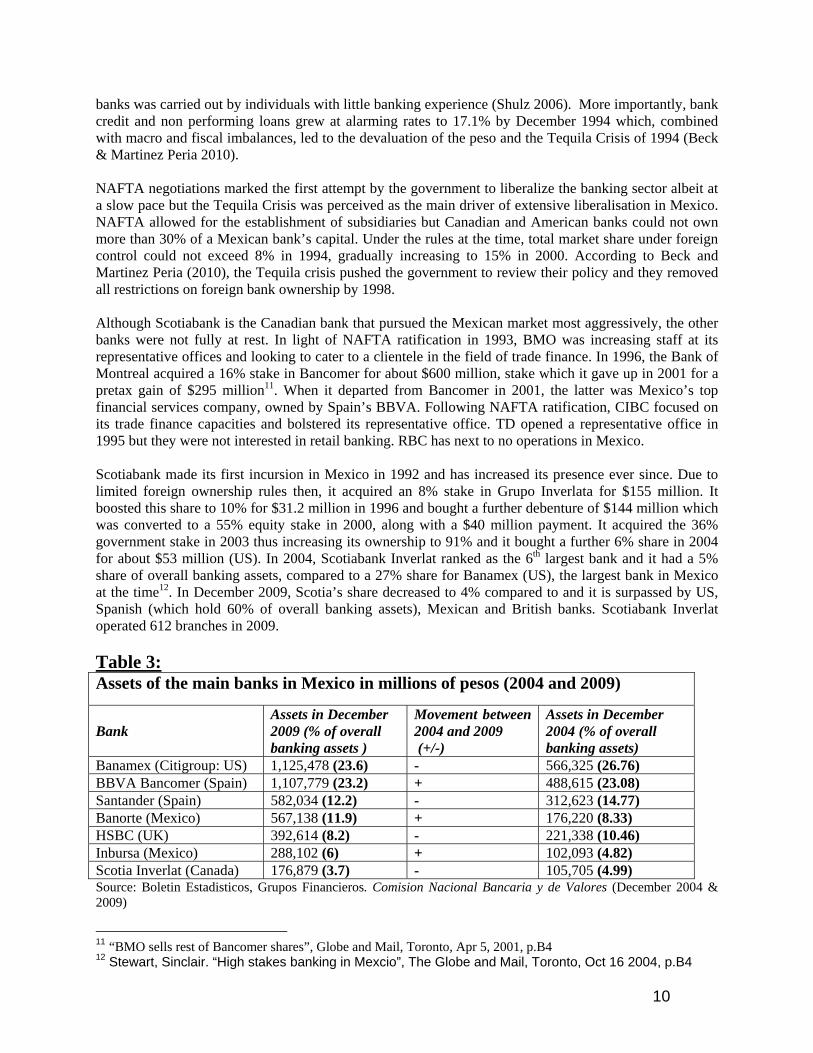
banks was carried out by individuals with little banking experience (Shulz 2006). More importantly, bank credit and non performing loans grew at alarming rates to 17.1% by December 1994 which, combined with macro and fiscal imbalances, led to the devaluation of the peso and the Tequila Crisis of 1994 (Beck & Martinez Peria 2010). NAFTA negotiations marked the first attempt by the government to liberalize the banking sector albeit at a slow pace but the Tequila Crisis was perceived as the main driver of extensive liberalisation in Mexico. NAFTA allowed for the establishment of subsidiaries but Canadian and American banks could not own more than 30% of a Mexican bank’s capital. Under the rules at the time, total market share under foreign control could not exceed 8% in 1994, gradually increasing to 15% in 2000. According to Beck and Martinez Peria (2010), the Tequila crisis pushed the government to review their policy and they removed all restrictions on foreign bank ownership by 1998. Although Scotiabank is the Canadian bank that pursued the Mexican market most aggressively, the other banks were not fully at rest. In light of NAFTA ratification in 1993, BMO was increasing staff at its representative offices and looking to cater to a clientele in the field of trade finance. In 1996, the Bank of Montreal acquired a 16% stake in Bancomer for about $600 million, stake which it gave up in 2001 for a pretax gain of $295 million11. When it departed from Bancomer in 2001, the latter was Mexico’s top financial services company, owned by Spain’s BBVA. Following NAFTA ratification, CIBC focused on its trade finance capacities and bolstered its representative office. TD opened a representative office in 1995 but they were not interested in retail banking. RBC has next to no operations in Mexico. Scotiabank made its first incursion in Mexico in 1992 and has increased its presence ever since. Due to limited foreign ownership rules then, it acquired an 8% stake in Grupo Inverlata for $155 million. It boosted this share to 10% for $31.2 million in 1996 and bought a further debenture of $144 million which was converted to a 55% equity stake in 2000, along with a $40 million payment. It acquired the 36% government stake in 2003 thus increasing its ownership to 91% and it bought a further 6% share in 2004 for about $53 million (US). In 2004, Scotiabank Inverlat ranked as the 6th largest bank and it had a 5% share of overall banking assets, compared to a 27% share for Banamex (US), the largest bank in Mexico at the time12. In December 2009, Scotia’s share decreased to 4% compared to and it is surpassed by US, Spanish (which hold 60% of overall banking assets), Mexican and British banks. Scotiabank Inverlat operated 612 branches in 2009. Table 3: Assets of the main banks in Mexico in millions of pesos (2004 and 2009)
Bank Assets in December 2009 (% of overall banking assets )
Movement between 2004 and 2009 (+/-)
Assets in December 2004 (% of overall banking assets)
Banamex (Citigroup: US) 1,125,478 (23.6) - 566,325 (26.76) BBVA Bancomer (Spain) 1,107,779 (23.2) + 488,615 (23.08) Santander (Spain) 582,034 (12.2) - 312,623 (14.77) Banorte (Mexico) 567,138 (11.9) + 176,220 (8.33) HSBC (UK) 392,614 (8.2) - 221,338 (10.46) Inbursa (Mexico) 288,102 (6) + 102,093 (4.82) Scotia Inverlat (Canada) 176,879 (3.7) - 105,705 (4.99) Source: Boletin Estadisticos, Grupos Financieros. Comision Nacional Bancaria y de Valores (December 2004 & 2009)
11 “BMO sells rest of Bancomer shares”, Globe and Mail, Toronto, Apr 5, 2001, p.B4 12 Stewart, Sinclair. “High stakes banking in Mexcio”, The Globe and Mail, Toronto, Oct 16 2004, p.B4
11
Regulatory factors and trade integration can be seen as having had a role in Canadian bank’s penetration in Mexico albeit at a different level. Trade integration, following NAFTA’s entry into force in 1994 may have been the main factor prompting BMO, CIBC and TD to bolster or open representative offices which usually offer limited services such as trade finance. On the other hand, the domestic bank stakes acquired by BMO and Scotia in 1996 is in line with the banking sector liberalisation that ensued the Tequila crisis of 1994. Looking at the macroeconomic factors that may have drawn Canadian banks into Mexico, profit opportunity indicators seem to concord with the theory. Scotia and BMO are likely to have been drawn by the profit opportunities offered by Mexico as GDP per capita was the lowest among NAFTA countries. However, GDP and GDP/capita growth between 1994 and 2008 has by no means been exceptional with the former averaging 3% and the latter 1.68%. Banks saw growth potential in a market that was underserved as there was only one branch per 19,000 people in 1994 (compared to one for every 3,000 Canadian). The country’s demographics has been an important factor in Scotia’s choice to consolidate its investment in Inverlat according to Rick Waugh, the CEO (in 2004)13. Indeed, average age in Mexico among Mexcio’s 108.6 million people is 26.3 versus 40 in Canada and 37 in the US. Cultural and linguistic similarities cannot be seen as being an advantage for Canadian banks operating in Mexico, unlike Spanish banks, BBVA SA and Santander Central Hispano which own the second and third largest Mexican banks respectively. The largest bank is owned by Citigroup, the American giant which has closer geographical proximity, thus decreasing information costs and it also has larger trade integration with Mexico than Canada. Ultimately, Canadian banking presence has not grown that strongly in Mexico since 1994. Aside from Scotia’s operations, the presence of the Big Five has actually diminished with BMO’s exit. Central and South America Over the last 30 years, South America has been a volatile economic region, between the debt crisis of the early 1980’s and Argentina’s debt default episode in 2002, including years of slow economic growth in the region during the 1980s and 1990s. Canadian banks present or seeking presence in the South American market have thus had to deal with this volatility which has resulted in alternate episodes of increased and diminished presence. By 2010, Scotiabank has firmly established itself as the leading Canadian bank in South America with a significant presence in Chile, Costa Rica, El Salvador, Panama, Peru and Belize. The foreign debt crisis that struck Latin America in the 1980’s prevented many governments from repaying their creditors among which were Canadian banks. Brazil, the world’s third largest debtor and largest in the developing world in 1993 owed a total of $120-billion of which $3-billion was owed to Canadian banks. Royal Bank was Brazil’s largest creditor and was owed about $1.2-billion (Cdn), Scotia: $976-million, BMO: $550-million and CIBC: $186-million14. For a good part of the 1990’s, Canadian banks, with the exception of Scotia, used trade finance as a platform to increase their activities with a cautious attitude following the debt crisis in the 1980’s. RBC sold its Brazilian subsidiary in 1993, leaving Canadian banks without a partner in Brazil which was and is Canada’s largest export market in South America. Rather, RBC opted for a network of representative
13 Stewart, Sinclair. “High stakes banking in Mexcio”, The Globe and Mail, Toronto, Oct 16 2004, p.B4 14 Partridge, John. “Brazil signs plan for $52-billion debt Canadian banks stand to gain”. The Globe and Mail, Toronto, Nov 30 1993, p.B1.
12
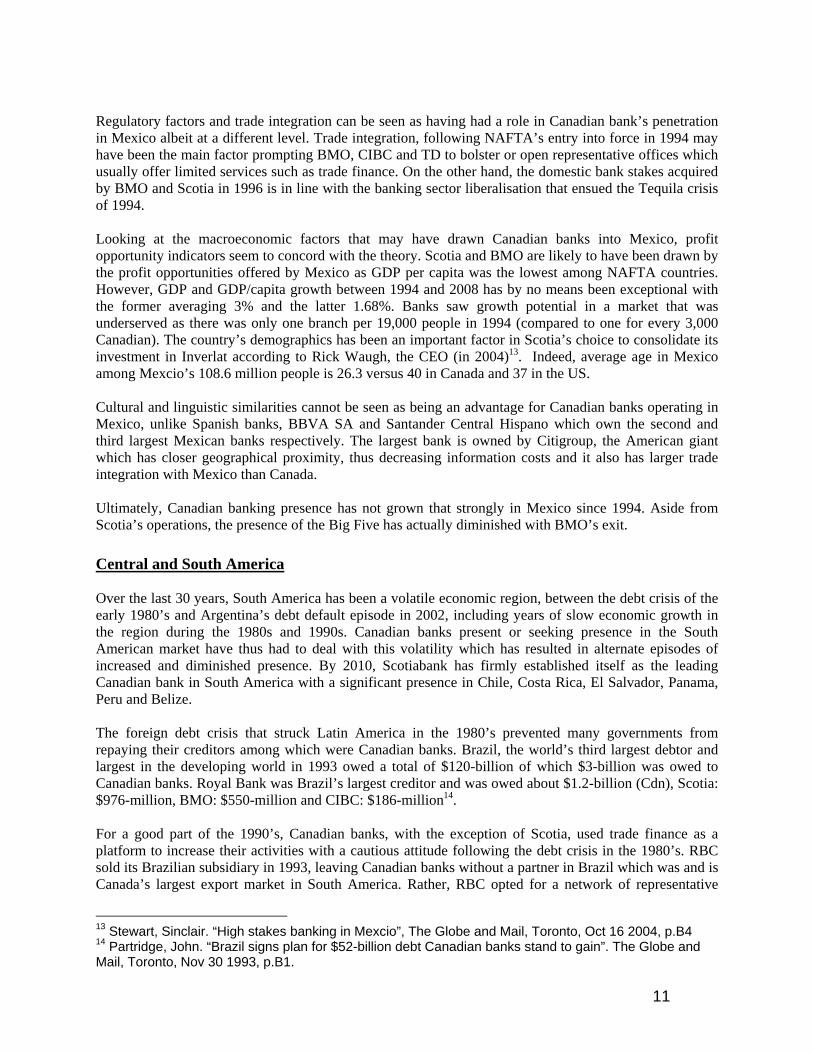
offices in Argentina, Brazil, Venezuela and Chile. In 1995, BMO had a representative office in Brazil and CIBC was looking at establishing at representative office in Chile in line with its tradition to being a banker for the Canadian mining industry. TD focused on trade finance in South America through its Mexican representative office. RBC and BMO were respective leaders in trade finance, the former with $3 billion worth of business in Latin America (including Mexico) and the latter with $1 billion in transactions in Mexico and South America15. This operational pattern was very much aligned to cater to Canadian companies which were safe bets with minimal risk, thus fitting the pattern of the “follow the client” hypothesis. Scotiabank aside, the operational structure of these banks South American activities has not really been altered in the 2000’s. Scotiabank is the sole Canadian bank that has aggressively pursued the South American market through important acquisitions that have led to significant retail networks in this region. Scotia ventured into Chile in 1990 when it acquired a 24% stake in a local institution, Banco Sud Americano, stake it increased to 30% in 1993 for a total investment of $22 million (US) and finally consolidated to 100% in 2000 when it paid $116 million and $114.5 million in two separate transactions. Scotia actually made a further incursion in Chile in 2007 when it acquired Banco del Desarrollo for $1.03 billion (US) and in 2008, it ranked in 9th position in terms of assets behind Chilean and Spanish banks. The market is more domestically inclined than in Mexico. Integration between Canada and Chile can be seen as having had an impact on Scotia’s initial investment in the early 1990’s because trade increased from $50 million in 1986 to $1.7 billion in 1994. The free trade agreement that was signed in 1997 gave a further push to trade in goods between both countries which increased to $2.34 billion in 2006. Chile notably has a strong mining sector, particularly copper, which has long interested Canadian mining companies. The macroeconomic conditions of Chile have also been favourable to penetration by foreign banks as it has been the fastest growing economy since the early 1990’s with an average annual per capita growth of 4.1% between 1990 and 2005 and the second most important GNI/capita ($13,270) among South American countries in 2008 after Argentina16. Scotiabank’s decision to acquire stakes in Chile is in line with Buch and DeLong (2004) who claimed that foreign banks will tend to penetrate markets where the regulatory and supervisory system is strictly enforced which is the case for Chile according to the US State Department’s 2010 Investment Climate Statement for Chile. Table 4:
Largest banks in Chile
Ranking Bank (nationality) Total Assets, Dec 2008 in US$ millions)
1 Banco Santander Chile (Spain) 33,598 2 Banco Central de Chile (Chile) 29,037 3 Banco de Chile (Chile) 28,816 4 Banco del Estado de Chile (Chile) 24,454 5 Banco de Credito e Inversiones (Chile) 21,437 6 Ohiggins Central Hispanoamerican (Chile) 13,178 7 Banco Bilbao Vizcaya Argentaria (Spain) 12,322 8 CorpBanca (Chile) 9,842
15 Clarke, David (1995). “Magnetic South America. (Canadian banks’ foreign operations)”. Canadian Banker, 102 (3). 16 WDI Indicators

13
9 Scotiabank (Canada) 9,370 Source:Bankscope, http://seekingalpha.com/article/175216-the-top-10-chilean-banks-according-to-assets
Scotiabank has established an importance presence in Peru where it now forms the 3rd largest bank in the country. It started there in 1997, acquiring a 25% stake of Banco Sudamericano for $14.1 million (US) followed by a $390M contribution to acquire 80% of Banco Wiese Sudameris and the majority control of Banco Sudamericano thus allowing it to form the 3rd largest bank in Peru. Finally, it acquired Banco del Trabajo, Peru’s 9th largest bank in 2008 for an undisclosed sum. It has been incorporated within Scotiabank Peru, renamed Crediscotia and will remain focused on consumer and small business credit. In terms of regulation, the financial liberalization in the early 1990’s is partly responsible for the presence of multinational banks in Peru. Indeed, Peru has one of the most liberalized regimes for foreign capital in the world, there are no capital controls and banks are free to remit profits. The case of Scotia seems to be in line with Focarelli & Pozzolo’s (2005) claim that foreign banks tend to operate subsidiaries in less restricted environments. In addition, it seems to corroborate Buch and Delong’s (2004) finding that targets of acquisistions tend to be located in countries with strong supervisory systems, which is the case according to the US State which made mention of Peru’s “sound and able bank supervisions” in its 2010 Investment Climate Analysis17. As opposed to Chile, Peru was not a significant trade partner with Canada in 1997 but FDI numbers, jumped between 1996-1997 from $237 million to $1,338 million when Scotia initially penetrated the market. The $1 billion increase was likely not only attributable to Scotiabank’s acquisition but also to Canadian company investments. The mineral trade gained importance in 2003 when non ferrous metals and gold and silver imports to Canada skyrocketed and FDI has average $2,275 million between 2000-2009, placing it in third place behind Brazil and Chile. Furthermore, Canada signed a free trade agreement with Peru which entered into force in August 2009 and Canada’s imports from Peru were second in importance after Brazil in 2009 for a total of $2.5 billion. Thus Scotia’s penetration in Peru seems to have preceded the important increase in trade that occurred in the mid 2000’s, although this very wave may have convinced Scotia to consolidate its presence in Peru (table 5). Table 5:
Trade and investment relations with Canada
Country Free trade agreement
Investment agreement (FIPA)
Year- year increase in imports (2000-2009)
Year- year increase in investments (2000-2009)
Chile yes-1997 No 13.46% 5.15% Peru yes-2009 No 35.35% 3.41%
El Salvador (being negociated)
(signed 1999-never entered into force) -9.02% (not disclosed)
Costa Rica yes-2002 yes-1998 7.76% (not disclosed) Panama No yes-1998 12.67% (not disclosed) South and Central America - - - 5.19% Latin America (excl. Mexico) - - 8.23% -
Source: Foreign Affairs and International Trade, author’s calculations
17 http://www.state.gov/e/eeb/rls/othr/ics/2010/138128.htm

14
Scotiabank is also the sole Canadian bank with an important presence in El Salvador. In 2005, it built on its alliance with Metropolitan Savings SA dating from 1997, by acquiring 97% of the shares of Banco de Comercio, El Savlador’s fourth largest bank with assets of $1.6 billion and a 17% market share, for $178 million. It now has 53 branches in the country. The Salvadorian financial system is among the largest in Central America and is mostly owned by foreign financial institutions. The case of Scotia seems to be in line with Focarelli & Pozzolo’s (2005) claim that foreign banks tend to operate subsidiaries in less restricted environments because in El Salvador, foreign banks are afforded national treatment and they can buy or invest in Salvadorian financial institutions without restrictions according to the State Department’s Investment Climate Analysis. Economic integration does not seem to be a driving factor for Scotia’s investment in the country and the principal trading sector are not high net worth sectors like mining. Indeed, exports totaled $61 million in 2008, lower than in 2000 while imports were worth $69 million and the principal imports, textiles and food production and has been relatively stable since 1997 when Scotia penetrated. FDI figures are however kept confidential. Costa Rica is host to important Scotiabank operations, too. After an initial incursion in the Costa Rican market in 1995 when it bought an 80% stake in Banco Mercantil group, a small bank with assets of $60 million, Scotia consolidated its presence in 2006 when it bought Corporacion Interfin for $330 million. This placed Scotiabank at the top of the Costa Rican market with $1.8 billion in assets. There is a correlation between economic integration and Scotiabank’s increased presence in 2006 because a free trade agreement entered into force in 2002. Since then, imports into Canada have increased from $200 million in 1998 to levels nearing $400 million between 2006 and 2009. Although Scotiabank has generally grown out of acquisitions in Central and South America, it has also expanded a retail network out of organic growth in Belize and Panama. In Belize, Scotia opened its first branch in 1968, it added 3 branches in the 1970’s and 1980’s. Scotia’s growth was heavily centered on the agricultural industry and in 2010, it has 11 branches. In Panama, operations started in 1974 and were geared at an international commercial clientele. The bank has grown to 10 branches and it has reoriented toward the personal and commercial banking sectors. Finally, Scotia’s Guyanese operations began in 1968 and it has grown to operate 5 branches throughout the country, initially reflecting growth in agriculture and increasingly towards the tourist industry. Thus the three countries where Scotia operates greenfield operations are all characterised by a relatively modest presence. Table 6:
Assets of Scotia Bank in selected South American countries Country Assets in CAD in 2008 Belize $316,679,000 Chile $11,000,000,000 Costa Rica $2,042,769,280 El Salvador $2,105,953,700 Panama $1,077,778,837 Peru $7,400,000,000
Source: Scotiabank country annual reports (2009 & 2008) except for Chile and Peru where data comes from the Canadian Scotiabank annual report. Key macroeconomic and demographic indicators demonstrate an association with profit opportunity and growth indicators and South American countries. In countries where Scotiabank has made acquisitions in

15
the 2000’s, GDP growth averaged 4.3% between 2000-2008 versus 3.9% in countries where Scotia is not present. GNI/capita also indicates that Scotia has been present in countries where income per capita is relatively higher. Among countries of recent acquisitions, GNI/capita averaged $9,476 in 2008 whereas it was $6,843 in countries where Scotia is not present. Similarly, literacy rates which may be conducive to higher education and better paying jobs has averaged 91% in countries of recent acquisition vs. 86% in the other countries. Average age is also very low in South American countries, averaging 26 years in the entire region and thus allowing for banks to establish client relationships with young people whom they can serve over their lifetime and to whom they can provide credit and loans. Thus, the characteristics of the South American market indicate that Canadian banks, particularly Scotia, may have been interested in acquisitions for a number of reasons. Most countries favour foreign investments and have relatively able supervisory bodies. Growth opportunities driven by strong economic growth and young populations has also been a factor of attraction. Furthermore, integration in the form of increasing trade, investments and agreements that promote these seem to investment agreements and free trade agreements seems to be associated with increased presence from Canadian banks although the causality is not established. Caribbean The Caribbean is a network of small islands which is very important to look at in order to understand the international operations of Canadian banks because outside the US, it is the region where Canadian banks have the highest concentration of foreign operations in the retail and commercial sectors. It is also unique because the operations of Canadian banks in the Caribbean date as far back as the nineteenth century when banks sought to take advantage of the flourishing trade between the Maritime provinces of Canada and the West Indies region. The region has been renowned for its offshore bank activities but this analysis will focus only on the retail and commercial banking services provided by Canadian banks. Canadian banks mainly from Maritime provinces started venturing in the West Indies as early as 1882. RBC (formerly Merchant's Bank) was the first to venture South closely followed by Scotiabank (Bank of Nova Scotia) in 1889 and both of these banks who operated out of Halifax, sought to engage in the thriving trade between Halifax and the West Indies when Canadian ships carried flour, codfish and timber, returning to Canada with supplies of sugar, rum, cotton and spices notably. Quigley (1989) argued that Canadian banks were also ideally placed to provide trade finance to American companies. Canadian banks have consistently been present since this period at a greater or lesser extent. There has been a renewed interest by Canadian banks since the 2000’s with RBC and CIBC enlarging their footprint by acquiring and consolidating assets respectively. In recent years, RBC’s expanded operations in the region can be perceived as a return to its roots. By 1920, it already had operations in 20 Caribbean jurisdictions. However, it shed some of its operations in the English speaking Caribbean in the 1980’s, notably in Jamaica and Trinidad and Tobago where it sold the Royal Bank of Trinidad and Tobago to local shareholders in 1987. In 1992, RBC’s operations were retail in nature although it also provided mortgage services and private banking services through offshore banks. It had 33 Caribbean branches and 17 more in Puerto Rico18. RBC made an important incursion into the Caribbean market by reacquiring the RBTT in 2008 for $2.2 billion (US). The new entity was to have 130 branches in 18 Caribbean markets with US$13.6 billion in assets19. When the acquisition was made, RBC moved into 2nd place in the English-speaking Caribbean region whereas Scotiabank, was in first.
18 Thompson, Evan (1992). “Sunshine Banking”. Canadian Banker, 99(2). 19 Gordon, Susan. “RBC/RBTT aims for top bank in Caribbean”. Jamaica Gleaner, July 18 2008. (http://www.jamaica-gleaner.com/gleaner/20080718/business/business5.html, accessed May 3rd 2010)

16
Scotiabank has an equally long standing history in the Caribbean region which has allowed it to be the leading Canadian bank in the region. Its first Caribbean branch was in Jamaica in 1889, it also began operating in Puerto Rico in 1910 and the Dominican Republic in 1920. Scotiabank established a significant banking presence gradually in the latter half of the 20th century, principally in the 1960’s when it began operations in 6 new Caribbean markets. In 1992, Scotiabank was the most prominent Canadian bank operating in 24 Caribbean markets for a total of 172 locations20. It has most often entered markets through greenfield investments, establishing initially a small number of branches and then growning up from this presence in the cases of the Bahamas, Jamaica, Puerto Rico, Trinidad & Tobago and the Dominican Republic. In thirteen other markets, they hold an average of 3.3 branches, thus a smaller presence. In 2008, it had assets of $19.9 billion (CAN) Caribbean wide. CIBC’s operations in the Caribbean also date from the early 20th century and although they renewed with expansion in 2002, RBC’s acquisition of RBTT took the wind out of CIBC’s other plans there. It opened branches in Barbados, Jamaica, Trinidad and Cuba in 1920 and the next wave of expansion occurred between 1955 and 1985, thus reflecting a similar though less ambitious expansion than Scotia. In 1992, it operated 27 branches, 12 branches of CIBC Jamaica of which it owned 55% and a range of trust companies21. CIBC preceded RBC with an important acquisition in the Caribbean’s in 2006 which temporarily put CIBC in the position of potential consolidator for that region. It bought an additional 43.7% stake in First Caribbean for $1.1 billion thus obtaining a 91.5% stake in the bank. First Caribbean was created when CIBC merged operations with Barclays Bank in 2001 each receiving 43.7% of shares22. It thus consolidated its position in a well known entity strengthening its position in the Caribbean with a network of 100 branches and $12 billion in assets. Table 7:
Assets of largest banks in the Caribbean in 2008 Bank Countries of operation Assets in CAN $ Scotiabank 21 19.9 billion RBC/RBTT 16 13.7 billion First Caribbean (CIBC) 18 (including Belize) 10.9 billion Republic Bank (Trinidad & Tobago owned) 5 (including Guyana) 6.69 billion
Source: Annual reports from Scotiabank, Republic Bank, First Caribbean and RBC factsheet The landscape of Canadian bank presence in the Caribbean has thus been significantly altered since 2000, moving from one dominant Canadian player, Scotiabank, to three important Canadian banks with the penetrations of CIBC and RBC through aquisitions. Scotiabank is the only Canadian player to have developed to this day through a branch system which it progressively incorporated locally in jurisdictions where it held important operations, for example, Trinidad and Tobago, the Bahamas or Jamaica. Scotiabank is the only Canadian bank not to have closed a branch in the Caribbean, with the exception of the sale in Cuba, thus reflecting a certain linearity in its Caribbean operations. CIBC had important branch operations prior to 2002 when it formed FirstCaribbean with Barclays. Their purchase of majority control in 2006 is thus not a foreign acquisition of a domestic bank per se because it already had significant information on the bank, its operating culture and its client dealings. RBC’s acquisition of RBTT in 2008 is the closest to a classic foreign acquisition for Canadian banks in the Caribbean since RBC sold the RBTT in the mid 1980’s when it was retrenching from foreign operations as a consequence of the foreign debt crisis. 20 Thompson, Evan (1992). “Sunshine Banking”. Canadian Banker, 99(2). 21 Thompson, Evan (1992). “Sunshine Banking”. Canadian Banker, 99(2). 22 Stewart, Sinclair. “CIBC spends $1.1-billion on Caribbean expansion”. The Globe and Mail, Mar 14 2006, p.B1
17
The increasing operations of recent years cannot be analysed as a bank penetrating a new market because of the longstanding history of Canadian banking presence in the region but certain factors have altered the market outlook and created profit opportunities for Canadian banks. Trinidad and Tobago has grown by an annual average of 6.6% over the last 15 years and 3.5% growth in 2008. This growth has been driven by the energy sector which accounts for 89% of exports and 40% of GDP. RBC’s acquisition of Trinidad & Tobaggo based RBTT has allowed it to gain a foothold in this growth market where, up to 2008, it had no presence. In recent years, there has been a strengthening in trade and other economic ties between Canada and the CARICOM region23, where the most important operations of Canadian banks are held. Canadian direct investment in the CARICOM market registered at $52.95 billion in 2006, an increase of 52% since 2001 with some investments in natural resource extractions. The government held inaugural talks to negotiate a trade agreement in October 2007. In 2008, merchandise trade amounted to $2.5 billion (15.8% increase from 2007) with the most important export markets being Trinidad and Tobago ($273.6 million), the Bahamas ($230.8 million) and Jamaica ($193.7 million). The major import partners of CARICOM were Suriname ($607.1 million), Trinidad and Tobago ($341.4 million), Jamaica ($327.6 million) and Guyana ($225.1 million)24. Trinidad and Tobago and Suriname registered the most important import growth over the period of 2000-2009, imports from the former increasing at an annualised rate of 18% and 28% for the latter. In all the above mentioned countries, at least one Canadian bank has operations in the country. This angle demonstrates that trade integration is in line with the renewed operations of CIBC and RBC. Although multiple languages are spoken in the Caribbean, Canadian banks have an overwhelming majority of their operations in English speaking regions which often are former British colonies. The colonial ties were a facilitating factor in the first wave of Caribbean operations in the late nineteenth and early 20th century when colonial trade was a driving expansion factor. The recent acquisitions by CIBC and RBC were also in the English speaking Caribbean and Scotiabank’s operations are all in English speaking countries except for its operations in Haiti (Creole and French), the Dominican Republic (Spanish), St. Marteen and the Netherlands Antilles and Aruba where it has an affiliation (Dutch). Beyond language, colonial ties and shared Commonwealth membership imply similar governmental and legal structures which make for a familiar environment for banks. Indeed, the most important operations of RBC, Scotia and CIBC are all located in countries where these ties are shared, namely, the Bahamas, Jamaica, Trinidad and Tobago and Barbados. South and East Asia In a global context, South and EastAsia represent a sort of Eldorado for Canadian banks, eagerly seeking to penetrate certain countries there. There are evidently the two economic giants there, China and India, with respective populations over a billion, rising middle classes, gradual liberalization and impressive economic growth rates. The four East Asian Tigers of Hong Kong, Singapore, South Korea and Taiwan have graduated to advanced economies with very high levels of consumer wealth today. Finally. there is also a group of newly industrializing countries with smaller populations than China and India in the region, Malaysia, Vietnam, Philippines and Thailand. In the late 1980’s and early 1990’s, Thailand, Malaysia, Indonesia, Singapore and South Korea experienced high growth rates between 8-12%, but in July 1997, a crisis that started in Thailand with the collapse of the Thai Baht rapidly propagated to other regions and became known as the Asian Financial Crisis. Most of Southeast Asia and Japan were
23 Full members: Antigua and Barbuda, Bahamas, Barbados, Belize, Dominica, Grenada, Guyana, Haiti, Jamaica, Montserrat, Saint Kitts and Nevis, Saint Lucia, St.Vincent & the Grenadines, Suriname, Trinidad & Tobago 24Department of Foreign Affairs and International Trade. “Commerce facts”, 2010 (http://www.international.gc.ca/commerce/facts-infos/caricom-2008.aspx?lang=eng, accessed on 22 May 2010)

18
affected, currencies slumped and stock markets were devalued. Nevertheless, the region was on a recovery path in the 2000’s and it has started drawing investments once again. Until recently, the presence of Canadian banks in the Asian market consisted mostly of representative offices dealing with trade finance and wealth management in major financial centres such as Singapore, Hong Kong, Tokyo, Seoul and Taipei. Scotiabank pursued expansions most strongly with single branch or representative offices in Vietnam, Australia and Taiwan and important activities in Malaysia and Thailand in addition to China and India. Table 8:
Assets of Scotiabank in Asia in 2009 Country Assets in billion CAN$ India 3.7 Malaysia 1.8 South Korea 2.6 Japan 1.2 Hong Kong 2.9 Other 6.2
Source: Scotiabank annual report 2009 After opening offices in the early 1980’s and building trade finance expertise, all Big Five banks except for TD had operations in China in 2006 and have sought growth in this market although they are confined to strict regulatory parameters, which has complicated network branching. In China. RBC has thus partnered locally in the fund management field. In 2006, Scotia opened a 6th branch in China and in 2009, it has boosted its interest to 20%, maximum allowed under China regulations, in western China’s Xi’an City Commercial Bank, an investment totalling $162 million hoping to target consumer lending25. BMO’s operations in China also saw significant developments in 2009 as Chinese regulators gave BMO the approval to incorporate in the country, thus allowing BMO to initiate retail and commercial branching operations. The first Canadian bank with this privilege, BMO had 3 branches in China in 2009. The other large market in the region is India, where Scotia established its first operations in the early 1980’s and where it now has 5 branches that developed out of a trade and corporate finance focus. Furthermore, Scotia acquired a 4.99% stake, maximum allowed by regulators, in the Bank of Punjab, a regional bank with 130 full service branches for a modest $7 million26. RBC followed Scotia into India in 2008 when it established its representative office in Mumbai. The attraction of Canadian banks to both of these markets reflects a trend in the US and Europe where large banks have started pursuing these markets more aggressively. The interest can certainly be partly explained by the growth opportunities in India and China, opportunities that could signal profit opportunities for Canadian banks. The rising middle class, concentrated mainly in urban areas which is bound to enlarge substantially in years to come is an important drawing factor for banks who see potential relationships with people who can look for mortgages and sophisticated services. In China, the middle-class has grown from 65.5 million to 80 million between January 2005 and January 2007 alone. It is projected to reach 700 million by 202027. In India, the middle class which numbered 50 million in 2007 is
25 Perkins, Tara. “Scotiabank raises stake in Chinese bank, eyes new Asian ventures”, The Globe and Mail, Dec 31 2009, p.B1. 26 Stewart, Sinclair. “Scotiabank buys in Bank of Punjab”, The Globe and Mail, Feb 24 2005, p.B13. 27 Hodgson, An (2007). “China’s middle class reaches 80 million”, Euromonitor International. (http://www.euromonitor.com/Chinas_middle_class_reaches_80_million, accessed 22 May 2010)

19
expected to grow to 583 million people by 202528. However, beyond per capita revenue, potential in these two markets is based on their volume potential. Regulatory restrictions is however one of the main reasons why this growth has not occurred more quickly. The bank’s organizational patterns are also in line with Focarelli and Pozzolo’s claim that restrictions on banking activities reduce the likelihood of operating subsidiaries because branches give more latitude to banks with regards to host country regulation. Indeed, up to the mid 2000’s, Canadian banks only ventured in India and China through branch activities. Beyond China and India, Scotia has also pursued expansion in the Thai market through the acquisition route. In 2009, Scotia acquired the maximum stake permitted under Thai law, 49%, in Thanachart Bank, the 8th largest bank in the country and leading auto lender. It had acquired a 25% stake in 2007 for $240 million and this additional 24% was acquired at the price of $270 million29. In response to the financial crisis that was triggered in Thailand, a National Corporate Governance Committee was created and began rating companies on their corporate governance practices30. Hence this form of supervision may have benefitted to Scotia’s screening of a potential acquisition, in line with Buch and DeLong’s (2004) claim that targets of acquisitions tend to be located in countries with strong supervisory systems as it tends to reassure the acquirer. In addition, Thailand has signed a Foreign Investment Promotion and Protection agreement (FIPA) with Canada, thus reinforcing legal protections for Canadian investors. Scotia has moved with the regulation which increased the share of foreign ownerships in the financial sector from 25% to 49 in August 2008. Furthermore, Scotia, through Thanachart has agreed to pay $1 billion US for a 47.6% stake in Siam City Bank in what will be Thailand’s biggest acquisition in 4 years. This will create the country’s fifth largest lender in terms of assets31. Profit opportunities in Thailand also seem to favour foreign bank investments. Between 2000 and 2008, GDP growth has averaged 4.78% and it has the second largest GNI/capita in the region ($5990) after Malaysia ($13,740). Moreover, poverty has steadily declined from 15.6% in 2002 to 9.8% in 2005, around 2 million people and it has a population with a median age of 33 years, versus 40 years in Canada. Scotiabank’s operations in Malaysia date from 1973 and the modest expansion that took place in this country was pursued through organic growth. Indeed, it operated on a branch basis until 1994 when it incorporated itself. Malaysia tried to imitate the Asian tigers to pursue growth in the 1970’s and it industrialised in a short time span, consistently achieving growth rates of more than 7% along with low inflation in the 1980’s and 1990’s. Scotia thus benefitted from this growth over the years but it has not pursued an aggressive expansion strategy in the Southeast Asian country with the highest GNI/capita ($13,740) in 2008. Among the factors that may have pushed Scotiabank in the Malaysian market as early as the 1970’s is the country’s status as a former British colony which left English as an important common language for the country’s multiple communities. Furthermore, legal code and government structures are based on the British system which is a facilitating factor for Canadian banks. The country has grown into an important financial centre ranking as the world’s largest Islamic financial centre and also housing an important number of offshore activities which Scotiabank has. Scotia is one of 7 fully qualified foreign banks operating in Malaysia the remaining being from the UK, the US and Singapore.
28 Farrell, Diana & Beinhocker, Eric (2007). “Next big spenders” India’s Middle Class”, Business Week, May 19 2007. (http://www.mckinsey.com/mgi/mginews/bigspenders.asp, accessed 22 May 2010) 29 Partridge, John. “Scotiabank expands its reach in Thailand”, The Globe and Mail, Feb 4 2009, p.B9. 30 “2009 Investment Climate Statement-Thailand”, US State Department, 2009, Washington. (http://www.state.gov/e/eeb/rls/othr/ics/2009/117189.htm, accessed 22 May 2010) 31 Manunphattr Dhanananphorn & Boontiwa Wichakul (2010). “Scotiabank's Thanachart buys $1 bln Siam City stake”, Reuters, Bangkok, March 11 2010. (http://www.reuters.com/article/idUSSGE62A08720100311, accessed 22 May 2010)
20
Foreign Banks and Crises: Overview of the Literature In order to better understand the behaviour of Canadian banks during the latest financial crisis, a review of literature on banks penetrating foreign markets and their operations during crisis periods over the last 30 years will help in making to possible inferences about Canadian banks’ behaviours. The literature that is relevant in this case addresses the following question: How do foreign banks react to financial crisis exposure in host countries crises but also in system-wide crises? In the case we are looking at, the Canadian economy (home) has been affected by an external financial crisis. Looking at Canadian bank operations in the US (host) imply only looking at the epicentre of the shock. On the other hand, other Canadian bank operations such as those in Latin America imply looking at a host country which was itself affected by an external shock that originated beyond its borders, too (in the US). The main caveat to hold while answering this question is that the amplitude and outcome of the current crisis has yet to be analysed in its entirety because it is too recent and, in fact, for some observers, it has yet to finish. Much of the literature on foreign banks and crises focuses on three specific regions, Latin America, Eastern Europe and Russia (and ex-CIS), the first being most relevant when looking at Canadian banks. These regions have been most analysed because they are where foreign bank penetration rates have been highest during the 1990’s and 2000’s. The reason for this is simply because liberalisation policies have been taken furthest in these regions thus allowing for higher rates of foreign banks penetration. In Eastern Europe and Russia, the share of assets held by foreign banks tripled from 13% in 1995 to 39% in 2002. In Latin America, foreign bank participation nearly doubled from 19 to 37% over the same period. East Asia is the region with lowest levels of foreign bank penetration from 1995 to 2002. The share of assets was steady at 7% between 1995 and 2002. Literature on financial integration has pointed to several reactions by foreign banks depending on the nature of a financial crisis shock. Regarding host country shocks, Goldberg (2002) shows that the international activities of US banks operating abroad is not influenced by the economic conditions of the latter, thus pointing to a credit stabilizing role for foreign banks who can rely on capital back up from the parent institution. Rather, it is home country conditions that drive changes in foreign bank lending. Martinez Peria et al. (2005) use a comprehensive dataset of foreign claims on Latin America from 1985-2000 and examine the sensitivity of foreign banks to external and host shocks. In addition, they evaluate how the level of a foreign banks’ exposure affects its responsiveness to host country shocks and whether aggregate movements in claims to other countries drive changes in foreign bank claims to individual hosts, in other words, how does a bank adjust in country x when there are changes in its operations in other countries. Their study corroborates Goldberg’s assertion that foreign bank claims do not retract significantly during crises in host countries (also found by Peek and Rosengreen 2000). Martinez Peria et al. (2005) finally show the higher the aggregate exposure of foreign banks to a host country, the lower the sensitivity of claims to host country shocks. Foreign banks also tend to react more to positive than negative shocks. The reaction to crisis events by globalised banks also varies according to the structure of their operations. McCauley, Macguire and Peter (2010) draw a line to differentiate between international and multinational banks. The former refers to banks that operate mostly out of a home country or a major financial centre and conducts mostly cross-border business whereas the latter operates significant foreign branches and subsidiaries in multiple jurisdictions. Their analysis of banks’ exposures demonstrates that local positions proved more stable during the crisis than cross-border lending. By extension, countries where banking systems hold a larger part of their foreign claims as local claims in local currency have been less vulnerable to global funding disruptions up to the end of 2009. Canadian Banks and Foreign Exposure During the Crisis

21
This section will attempt to demonstrate the factors that have allowed Canadian banks to be among the world’s most resilient during the economic crisis up to now. Firstly, we will look at the broad international picture in a comparative perspective followed by a regional performance analysis mainly using Bank of International Settlements Consolidated Banking Statistics32 and Bank of Canada data on claims and liabilities booked worldwide by Canadian banks. Canadian banks stand out among 11 major OECD countries (whose foreign claims make up for 70% of global foreign claims) in terms of their foreign claims through the relatively minor foreign exposure of national financial institutions33. In order to give an adequate picture of country exposures before foreign claims plummeted as a result of the crisis, data in the table below looks at the importance of foreign claims in individual countries relative to their economic weight during Q1-2008, just when foreign claims peaked. Indeed, Canadian bank foreign claims to GDP are at 52.5%, just ahead of Australia. The United States has the lowest share which is to be expected given its position as the world’s largest national economy which is also a dominant financial centre and can thus conduct a large amount of financial activities domestically. Omitting the risk profile and structure of Canadian bank operations abroad, this demonstrates that Canadian banks were, on the whole, less exposed and by extension, on the sole basis of foreign claims, less bound to be victims of contagion through their international activities. Smaller countries such as Belgium and Switzerland were larger players relative to their weight and their institutions sustained significantly more losses as these numbers demonstrate. Table 9:
Compared Country Risk Exposures Relative to their Economic Weight
Country Foreign claims Q1-2008 (USD millions)
GDP (USD millions) 2008
Foreign claims/GDP
United States 1,766,453 14,600,000 12.10%Australia 466,998 1,020,000 45.78%Japan 2,403,414 4,910,000 48.90%Canada 787,869 1,500,000 52.52%Italy 1,287,326 2,300,000 55.97%Spain 1,248,343 1,600,000 78.02%Germany 4,701,835 3,650,000 128.82%Austria 613,861 414,000 148.28%France 4,264,100 2,860,000 149.09%United Kingdom 4,198,779 2,670,000 157.26%Belgium 1,565,378 504,000 310.59%Switzerland 2,625,322 492,000 533.60%Selected country total 25,929,678 80,710,000 32.13%All reporting countries total 36,859,296 Selected country foreign claims as a percentage of total reporting country foreign claims 70.35%
Source: World Development Indicators, BIS Consolidated Claims of reporting banks December 2009
32 The stats provide details of credit risk exposures in the form of complete country coverage of banks’ on balance sheet exposures on an immediate risk basis and ultimate risk basis (residence of the party responsible for the repayment of an obligation). Data on immediate risk basis is used in what follows. 33 Foreign claims make up A) cross-border claims, B)local claims of foreign affilitates in foreign currency and c) local claims of foreign affilitates in local currency. International claims consist of B+C and are thus part of foreign claims.

22
Data (illustrated in chart 1&2) also shows that Canada’s foreign claims were above average in their recovery between the Q1-2008 peak and Q4-2009.Consolidated foreign claims from all BIS reporting countries topped in the first quarter of 2008 at 36,859,296 million US dollars and have since plummeted to stand at 30,469,196 million US dollars in the fourth quarter of 2009, a 17 percent decrease. The country whose claims decreased most was Belgium (72%), followed by Switzerland (38%), also those with the largets share of foreign assets to GDP. Canada sustained a 4% decrease whereas Australia and Spain, among mid-level economies recorded positive change. Canadian along with the Japanese, Spanish and Australian banks thus withdrew less and recovered more quickly in terms of the credit they had extended abroad for retail and wholesale operations. Chart 1:
Evolution of consolidated foreign claims for selected countries between Q3-2007 and Q4-2009
0
500,000
1,000,000
1,500,000
2,000,000
2,500,000
3,000,000
3,500,000
4,000,000
4,500,000
5,000,000
Q3-07Q4-07
Q1-08
Q2-08Q3-08
Q4-08
Q1-09
Q2-09Q3-0
9Q4-0
9
Mill
ions
of U
S d
olla
rs
AustraliaAustriaBelgiumCanadaFranceGermanyItalyJapanSpainSwitzerland
Source: BIS Consolidated Banking Statistics Chart 2:

23
Percent change in foreign claims between Q1-2008 and Q4-2009
-17.34%
7.32%
-12.73%
-72.31%
-3.76%-11.52%
-29.77%-25.33%
1.04%
10.42%
-37.77%
-13.22%
41.10%
-80.00%
-60.00%
-40.00%
-20.00%
0.00%
20.00%
40.00%
60.00%
1
Countries
All countriesAustraliaAustriaBelgiumCanadaFranceGermanyItalyJapanSpainSwitzerlandUnited KingdomUnited States
Source: BIS Consolidated Banking Statistics, author’s calculations Note: The US data does not reflect the change in reporting by US banks which saw securities firms becoming reporting banks in Q1 2009. Characteristics of the Canadian banking system Countries which performed better than average in terms of foreign claims resiliency during the crisis, had except for Japan, a common feature in their international banking operations; a large share of their foreign operations were conducted through foreign affiliates in local currency (Local claims in local currency or LCLC). This refers to the retail and corporate operations of foreign branches or subsidiaries conducted in the currency of the host country. McCauley, McGuire & von Peter (2010) distinguish between multinational and international banking models. The former refers to countries where banks operate significant foreign branches and subsidiaries in multiple jurisdictions (Jones 1992) whereas the latter operate out of the home country and conducts most of its operations through cross-border flows which do not necessitate a significant physical presence in terms of branches. It can be handled through simple representative offices. According to these definitions, Canadian banks rank second in the 12 country set, just after Australia in terms of the percentage of local claims in local currency as a percent of foreign claims. Spanish banks34 were also shown to be among the most multinational in their operational mode, reflecting their retail presence in Latin America notably.
34 Data not disaggregated in BIS consolidated stats. Information obtained from McCauley, McGuire & von Peter (2010)

24
Table 10 Importance of local currency claims of national banks’ foreign
affiliates (branches or subsidiaries)
Country Local currency claims as a percent of total foreign claims in Q4-2009
Japan 15.82% Germany 17.34% Belgium 30.52% United States 32.66% Switzerland 42.88% France 48.37% Italy 49.71% United Kingdom 53.19% Canada 59.90% Australia 71.83% All countries 34.57%
Source: BIS Consolidated statistics Division of Canadian bank foreign claims gives a portrait of the importance of Canadian bank exposure to different countries. As would be expected given the magnitude of Canadian bank operations in the US both in cross border and local activity, 56% of Canadian bank foreign claims are in the United States. The second largest exposure of Canadian banks is in the UK (14%) followed by the rest of Western Europe (11%) and Latin America and Caribbean countries (7.5%)35. When we take the local claims in local currency operations as a percent of total foreign claims, we see that the most important local currency claims are in the US and Latin America and the Caribbean. On the other hand, only 21.5% of foreign claims are made locally in local currency in the UK. This is consistent with the geographical distribution of Canadian bank’s most important retail operations which are in the United States and in Latin America and the Caribbean. There is no significant branch presence in the UK where most of the activity is presumably concentrated in securities and investment activity transiting through London. Chart 3:
Geographical division of Canadian bank foreign claims in Q1-2008
Other, 6.31%Offshore
banking centre, 5.51%
Rest of Western Europe, 10.79%
UK, 14.01%US , 55.86%
Latin America and Caribbean,
7.52%
Source: BIS Consolidated Statistics
35 In BIS and Bank of Canada data, Latin America and Caribbean is unified. Offshore centre such as the Bahamas, Barbados, Bermuda, Panama and the Cayman Islands are however part of a separate category.

25
Table 11: Breakdown of Canadian bank claims in selected countries
Country
Local claims in local currency as a percent of foreign claims between
2008-Q1 and 2009-Q2 Percent of overall foreign claims
in 2009-Q2 United States 78.20% 58.75% United Kingdom 21.47% 24.16% Latin America and Caribbean 62.04% 8.59% Chile 75.41% 1.61% Mexico 81.60% 2.58% Peru 39.55% 1.07% Brazil 0.01% 0.31% Trinidad & Tobago 75.91% 0.91% Bahamas 42.44% 1.26% Total 57.02% 100.00%
Source: Bank of Canada Banking and Financial Statistics, author’s calculations Noting that Canadian banks’ share of foreign activities is largely made up of local currency claims which is associated with retail and commercial banking is consistent with Canadian bank’s historical and persistent dominance in the Canadian retail and commercial banking markets. Their expansion patterns which has focused on retail and commercial banking since the 2000’s has thus been different than many European banks which built up positions in US asset-backed securities funded or held outside the US36. The difference in risk profile between expanding foreign claims through securities (more risk, higher expected returns) and retail activities (less risk and more stability through deposits, lower expected returns) may have been a factor that played in favour of Canadian banks relative other country’s banks. It is also noteworthy that Canadian banks, in absolute terms, are small players among major Western countries in terms of foreign claims as chart 1 demonstrates. United States Looking at the US operations of Canadian banks, which accounted for 59% of total Canadian bank foreign claims in 2009-Q2 shows a various degree of exposure to troubled sectors of the economy of the financial crisis’ epicentre. Exposure to the subprime market is captured through loans but most importantly, in the securities books in the form of the asset backed commercial papers (ABCP)37. Interestingly enough, CIBC, the Canadian bank which has had the highest write downs and losses, by far, does not have significant retail presence in the US meaning that it was exposed through securitised products. Since CIBC operates under a relatively centralised structure, it can be assumed that CIBC’s investment and securities trade was conducted through cross-border claims, those (Canada toward US) which retrenched the most during the crisis (vs. local claims in local currency). Among Canadian banks, RBC sustained the second most important write downs and losses (US $3.6 billion) whereas TD and BMO underwent were least affected at US $600M and US $1.1b. Data on writedowns and credit losses shows that Canadian banks clearly stood out, among other global banks through their relatively low exposure (except for CIBC) (see table below). The top 30 financial institutions that were most affected clearly reflect the central role of US institutions, followed by EU countries.
36 P.36, Mccauely, McGuire, Von Peter. 37 DBRS, “Big Five Canadian Banks have Limited Subprime Exposure”, DBRS North American FI Weekly, 2 (26), Aug 1, 2007.

26
Table 12: Geographic Profile of 30 Most Affected Institutions
Country Number of institutions Percentage US 11 36.67% UK 5 10.00% DE 3 6.00% FR 4 8.00% CAN 1 2.00%
Source: Bloomberg, Scotia Capital, see annex for individual bank writedowns and credit losses In terms of foreign claims from Canada to the US between 2006-Q1 and 2009-Q2, figures are consistent with the global peak in foreign claims in Q1-2008. After a period of important increases between 2005 and Q1-2008, partly driven by the acquisitions of US banks, claims start to stagnate moderately before recovering beyond the Q1-2008 point at the end of 2009. An association with US GDP quarterly growth seems to be possible when add a lag effect of 1 or 2 periods for the US GDP quarterly growth. Chart 4:
Canadian foreign claims on the United States (2004-2009) and GDP quarterly growth
0
50,000
100,000
150,000
200,000
250,000
300,000
350,000
400,000
450,000
500,000
Mar.20
04
Sep.20
04
Mar.20
05
Sep.20
05
Mar.20
06
Sep.20
06
Mar.20
07
Sep.20
07
Mar.20
08
Sep.20
08
Mar.20
09
Sep.20
09
Mill
ions
of U
S $
-2.00%
-1.50%
-1.00%
-0.50%
0.00%
0.50%
1.00%
1.50%
2.00%
US Quarterly GDP growth
(compared to previous quarter)
Foreign claims
US GDP quarterlygrowth
Source: BIS consolidated statistics, stats.OECD.org Individual bank data demonstrates that there was a sharper retraction of credit in the US than in Canada in the form of loans. Credit kept growing during year 2008, consistent with GDP annual growth numbers which were still positive for the US (0.41%) and Canada (0.44) in 2008. The contraction in loans by banks is most observed during year 2009, consistent with the transmission of the crisis to the real sector of the economy. BMO and RBC’s loan portfolio shrunk by 27% and 16% respectively in 2009 compared to a year before whereas TD’s grew by 6% although TD was still integrating its US acquisitions during the period. As would be expected, gross impaired loans as a percent of total loans increased sharply for all three banks between 2007 and 2009, from 1.38% for RBC to reach 9.23%, from 0.58% for BMO to reach 4.89% and by 0.74% for TD to reach 3.43%38.
38 Author’s calculations from Bank Annual reports

27
Thus, Canadian banks did retrench credit from the US, country where they have the most exposure, but they sustained fewer losses through writedowns and credit losses than major Western European countries’ institutions there. This is consistent with McCauley, McGuire and von Peter (2010) assertion that European banks build up positions in US ABCP’s, conducted through cross border operations, those which were most affected during the crisis. As a result of strong positions in local claims in local currency in the US among other factors, Canadian banks seem to have weathered the storm more easily.
Latin America and Caribbean Latin America and the Caribbean region39 account for 9% of overall total Canadian foreign claims but outside the US, it is where Canadian retail and commercial banking operations are concentrated. The most important share of local claims in local currency is in Mexico (82%), Chile (75%) and Trinidad and Tobago (76%). On the other hand, only 40% of total foreign claims are locally conducted in local currency in Peru perhaps implying important cross border flows going to companies operating in the important mining sector there. Comparing total global foreign claims vs. Canadian foreign claims to the Latin American and Caribbean region demonstrates that Canadian bank claims have grown at a moderately higher rate than global claims between 2006 and the end of 2009. If global foreign claims went through three periods of negative year on year growth in 2008-2009, Canadian banks did not witness negative growth. If changes in Canadian foreign claims to Latin America are not on par with global foreign claims, it may be partially explained by the acquisitions that occurred in Chile and the Caribbean, acquisitions which complicates drawing a simple observation regarding the behaviour of Canadian banks in the wider region during the peak of the crisis. Chart 5:
Comparison between global and Canadian foreign claims growth to Latin America and the Caribbean (2006-2009)
-20%
-10%
0%
10%
20%
30%
40%
50%
2007
-Q1
2007
-Q2
2007
-Q3
2007
-Q4
2008
-Q1
2008
-Q2
2008
-Q3
2008
-Q4
2009
-Q1
2009
-Q2
2009
-Q3
2009
-Q4
Year
on
year
gro
wth
(com
pare
d to
sam
e qu
arte
r of p
revi
ous
year
)
Global foreignclaims
Canadianforeign claims
39 Regrouped in order to be consistent with BIS and Bank of Canada data which regroups Latin American and Caribbean countries. The data excludes Caribbean offshore banking centre such as the Bahamas, Barbados, the Cayman Islands and Panama.
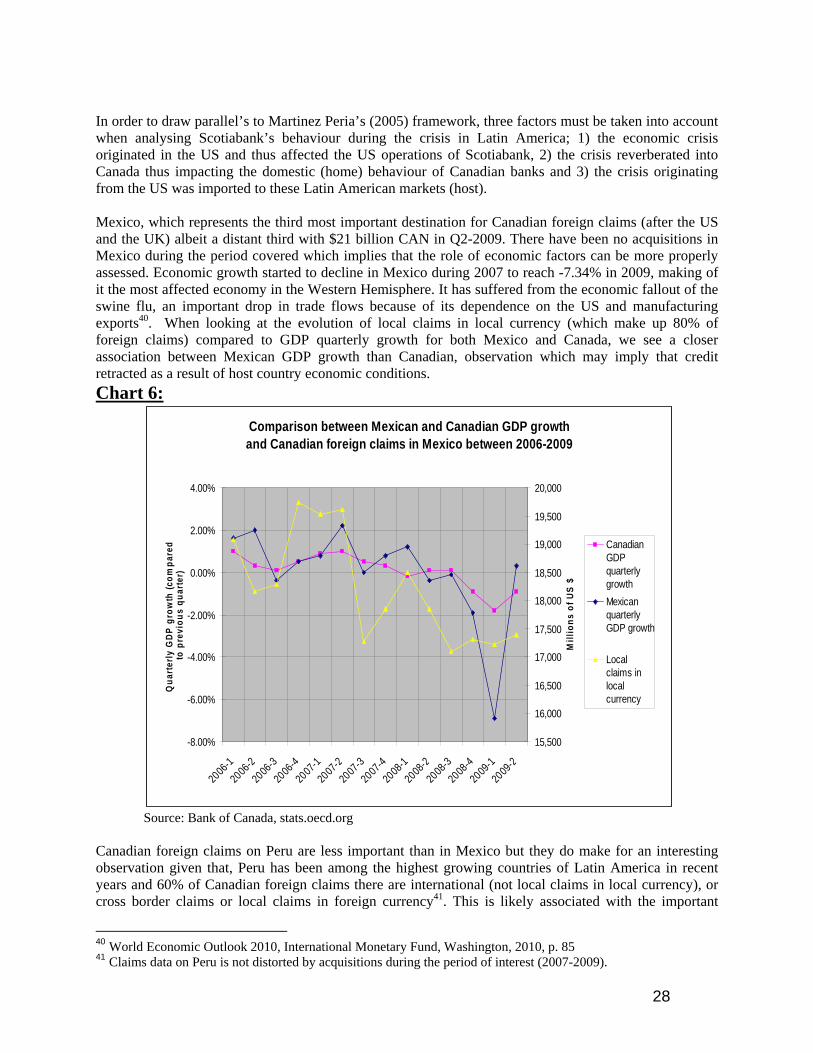
28
In order to draw parallel’s to Martinez Peria’s (2005) framework, three factors must be taken into account when analysing Scotiabank’s behaviour during the crisis in Latin America; 1) the economic crisis originated in the US and thus affected the US operations of Scotiabank, 2) the crisis reverberated into Canada thus impacting the domestic (home) behaviour of Canadian banks and 3) the crisis originating from the US was imported to these Latin American markets (host).
Mexico, which represents the third most important destination for Canadian foreign claims (after the US and the UK) albeit a distant third with $21 billion CAN in Q2-2009. There have been no acquisitions in Mexico during the period covered which implies that the role of economic factors can be more properly assessed. Economic growth started to decline in Mexico during 2007 to reach -7.34% in 2009, making of it the most affected economy in the Western Hemisphere. It has suffered from the economic fallout of the swine flu, an important drop in trade flows because of its dependence on the US and manufacturing exports40. When looking at the evolution of local claims in local currency (which make up 80% of foreign claims) compared to GDP quarterly growth for both Mexico and Canada, we see a closer association between Mexican GDP growth than Canadian, observation which may imply that credit retracted as a result of host country economic conditions. Chart 6:
Comparison between Mexican and Canadian GDP growth and Canadian foreign claims in Mexico between 2006-2009
-8.00%
-6.00%
-4.00%
-2.00%
0.00%
2.00%
4.00%
2006
-120
06-2
2006
-320
06-4
2007
-120
07-2
2007
-320
07-4
2008
-120
08-2
2008
-320
08-4
2009
-120
09-2
Qua
rter
ly G
DP
gro
wth
(com
pare
d to
pre
viou
s qu
arte
r)
15,500
16,000
16,500
17,000
17,500
18,000
18,500
19,000
19,500
20,000
Mill
ions
of U
S $
CanadianGDPquarterlygrowthMexicanquarterlyGDP growth
Localclaims inlocalcurrency
Source: Bank of Canada, stats.oecd.org
Canadian foreign claims on Peru are less important than in Mexico but they do make for an interesting observation given that, Peru has been among the highest growing countries of Latin America in recent years and 60% of Canadian foreign claims there are international (not local claims in local currency), or cross border claims or local claims in foreign currency41. This is likely associated with the important
40 World Economic Outlook 2010, International Monetary Fund, Washington, 2010, p. 85 41 Claims data on Peru is not distorted by acquisitions during the period of interest (2007-2009).
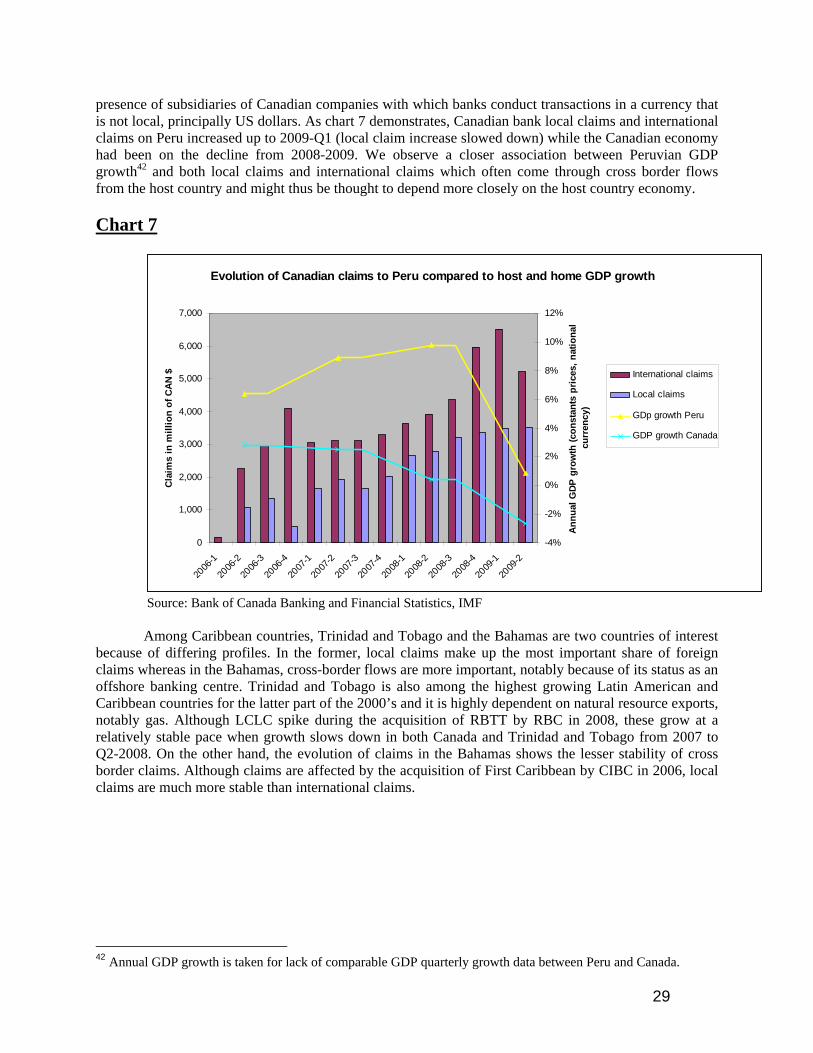
29
presence of subsidiaries of Canadian companies with which banks conduct transactions in a currency that is not local, principally US dollars. As chart 7 demonstrates, Canadian bank local claims and international claims on Peru increased up to 2009-Q1 (local claim increase slowed down) while the Canadian economy had been on the decline from 2008-2009. We observe a closer association between Peruvian GDP growth42 and both local claims and international claims which often come through cross border flows from the host country and might thus be thought to depend more closely on the host country economy.
Chart 7
Evolution of Canadian claims to Peru compared to host and home GDP growth
0
1,000
2,000
3,000
4,000
5,000
6,000
7,000
2006
-1
2006
-2
2006
-3
2006
-4
2007
-1
2007
-2
2007
-3
2007
-4
2008
-1
2008
-2
2008
-3
2008
-4
2009
-1
2009
-2
Cla
ims
in m
illio
n of
CAN
$
-4%
-2%
0%
2%
4%
6%
8%
10%
12%
Annu
al G
DP g
row
th (c
onst
ants
pric
es, n
atio
nal
curr
ency
)
International claims
Local claims
GDp growth Peru
GDP growth Canada
Source: Bank of Canada Banking and Financial Statistics, IMF Among Caribbean countries, Trinidad and Tobago and the Bahamas are two countries of interest because of differing profiles. In the former, local claims make up the most important share of foreign claims whereas in the Bahamas, cross-border flows are more important, notably because of its status as an offshore banking centre. Trinidad and Tobago is also among the highest growing Latin American and Caribbean countries for the latter part of the 2000’s and it is highly dependent on natural resource exports, notably gas. Although LCLC spike during the acquisition of RBTT by RBC in 2008, these grow at a relatively stable pace when growth slows down in both Canada and Trinidad and Tobago from 2007 to Q2-2008. On the other hand, the evolution of claims in the Bahamas shows the lesser stability of cross border claims. Although claims are affected by the acquisition of First Caribbean by CIBC in 2006, local claims are much more stable than international claims. 42 Annual GDP growth is taken for lack of comparable GDP quarterly growth data between Peru and Canada.

30
Chart 8: Evolution of Canadian foreign claims in Trinidad and Tobago compared with GDP
growth
0
1,000
2,000
3,000
4,000
5,000
6,000
7,000
8,000
2006
-1
2006
-2
2006
-3
2006
-4
2007
-1
2007
-2
2007
-3
2007
-4
2008
-1
2008
-2
2008
-3
2008
-4
2009
-1
2009
-2
Mill
ions
of C
anad
ian
$
-6.00%
-4.00%
-2.00%
0.00%
2.00%
4.00%
6.00%
8.00%
10.00%
12.00%
14.00%
16.00%
Annu
al G
DP g
row
th (n
atio
nal c
urre
ncy,
co
nsta
nt p
rice
s)
Internationalclaims
LCLC
Annual GDPgrowth-Canada
Annual GDPgrowth-T&T
Source: Bank of Canada Banking and Financial Statistics, IMF Chart 9:
Evolution of Canadian foreign claims in the Bahamas
0
2,000
4,000
6,000
8,000
10,000
12,000
2006-1
2006
-22006
-320
06-420
07-1
2007-2
2007-32007-4
2008-1
2008
-22008
-320
08-420
09-1
2009-2
Mill
ions
of C
anad
ian
$
-6.00%
-4.00%
-2.00%
0.00%
2.00%
4.00%
6.00%
Annu
al G
DP g
row
th (n
atio
nal c
urre
ncy,
con
stan
ts
pric
es)
Internationalclaims
Local claims inLC
Canadian annualGDP growth
Bahamas-annualGDP growth
Source: Bank of Canada Banking and Financial Statistics, IMF

31
During the crisis43, Canadian banks have thus shown greater resilience than the average of major OECD countries’ banks in terms of their positions abroad. They are also among the least exposed abroad both absolutely and relative to their economic weight. McCauley, McGuire and Von Peter (2010) argue that local assets were more stable during the crisis, and by extension, that banks which had more local claims in local currency (particularly in emerging markets) were more stable during the crisis. Indeed, strictly looking at the change in foreign claims by Canadian banks during the crisis demonstrates that the largest credit contraction was in the UK where 79% of claims are either cross border or local in foreign currency. Between the time when global claims were at their highest and Q2-2009, Canadian bank foreign claims still recorded positive growth in the US and Latin America where the majority of their activities are conducted in locally in local currency (through branches or subsidiaries). This analysis is not as comprehensive as Martinez Peria (2005) who looks at data between 1985-2000 and multiple country data set. However, it looks at both local claims in local currency and international claims albeit at a limited number of countries and in countries where data is not distorted as a result of acquisitions, association between host country GDP growth with foreign claims is more observable than between home country GDP growth and foreign claims. Table 13:
Change in Canadian foreign claims to selected areas during the crisis
Country or region Change in claims between Q1-2008 and Q2-2009 UK -29.61% US 4.68% Latin America and Caribbean 13.66% Total -0.47%
Source: Bank of Canada Banking and Financial Statistics Conclusion This paper has thus demonstrated that Canadian bank expansion abroad has largely focused on retail and commercial activities in recent years and the expansion has focused on the Western Hemisphere; the United States, Mexico, Central and South America in addition to the Caribbean. A main push factor that has driven the Big 5 banks to expand abroad has been profit opportunities which were limited because of a saturated Canadian market where further expansion on a large scale, in the form of the 1998 mergers, failed. Looking at the markets where banks have expanded since the 1980’s points to the importance of catering to the needs of home country clients (Canadian banks in the US in the early 1990’s) and in the latter half of the 1990’s and during the 2000’s points to the importance of trade and investment associated with bilateral agreements, which has also entailed catering to the needs of home country companies (Scotiabank in South America). Furthermore, relatively strong financial regulatory bodies seem to be prevalent in countries of recent expansion. Finally, profit opportunities driven by home country demographic and economic conditions is also associated with bank’s expansion patterns. Canadian banks have been among the most resilient during the crisis and their international operations have been among those that suffered the least. On one hand, Canadian banks, CIBC aside, were among the least affected in terms of writedowns and credit losses. On the other hand, among Western countries which are both larger and smaller than Canada, their foreign claims are very low and have been among the fastest to recover since Q1-2008. A particularity of Canadian banks abroad has been their important share of foreign claims as local operations in local currency which has been associated to better stability during the financial crisis. Indeed, where foreign claims were predominantly made up
43 BIS data was available up to Q4-2009 and BoC data was available up to Q2-2009. When more detailed Canadian data is used, it is taken from the BoC sheets and figures are thus only available up to Q2-2009.
32
cross border flows such as in the UK, the credit retrenchment was significant whereas this is less visible in the Latin American region as a whole where claims in local currency are predominant.
This paper aimed at giving an overview of Canadian bank international expansion and the reasons for this expansion along with their exposure during the crisis using a variety of publicly available sources. A more systematic analysis of push and pull factors may allow to identify the relative importance of each factor in Canadian bank international expansion. Furthermore, the use of data that will cover the crisis from end to end will allow to draw more accurate conclusions regarding Canadian and other major country’s bank performance during the crisis. Bibliography: -Beck T. & Martinez Peria M. (2010) “Foreign bank participation and outreach: evidence from Mexico.” Journal of Financial Intermediation, 19, p. 52-73. -Berger and de Young (2001) “The effects of geographic expansion on bank efficiency”. Journal of Financial Services Research, 19 (2-3), p.163-184. -Buch, C & DeLong (2004) “Cross border bank mergers: What lures the rare animal?”, Journal of Banking and Finance (28), p.2077-2702 -Brock, P & Suarez, L (2000) “Understanding the Behaviour of Bank Spreads in Latin America”. Journal of Development Economics, 63, p. 113-134. -Casson, M. (1990) Evolution of multinational banks: a theoretical perspective. In G. Jones (ed.) Banks as Multinationals (pp.14-29). London: Routledge. -Cerutti, Dell Ariccia & Martinez Peria (2005) “How banks go abroad, branched or subsidiaries?”, World Bank Policy Research Working Paper No. 3753. -Demirguc-Kunt, A & Huizinga, H (2001) “The taxation of domestic and foreign banking”. Journal of Public Economics (79), p.429-453. -Focarelli, D & Pozzolo, A (2005) “Where do banks expand abroad? An empirical analysis.” Journal of Business, 78 (6), p.2435-2463. -Focarelli, D., and A. F. Pozzolo, (2001). “The Patterns of Cross-Border Bank Mergers and Shareholdings in OECD Countries”. Journal of Banking and Finance 25, 2305-2337. -Focarelli, D., Pozzolo, A.F., (2001b). “Where do banks expand abroad?” Working Paper, Banca d’Italia, Rome. -Galindo,, A., Micco, A. and Serra, C., (2003). “Better the Devil that You Know: Evidence on Entry Costs Faced by Foreign Banks”. IADB Working Paper #477. -Galindo, A et al. (2003) “Better the devil that you know: evidence on entry costs faced by foreign banks”, Inter-American Development Bank, Working Paper 477. -Guillen, M., Tschoegl, A.E., (2000). “The internationalization of retail banking: The case of the Spanish banks in Latin America”. Transnational Corporations 9, 63–97.
33
-Hejazi, W & Santor, E (2005) “Degree of internationalization and performance: An Analysis of Canadian Banks”, Bank of Canada Working Paper Series, 2005-32. -Herrero, A & Simon, D (2006) “DO WE KNOW WHY BANKS GO TO EMERGING COUNTRIES AND WHAT IS THE IMPACT FOR THE HOME COUNTRY?: A SURVEY”. Background paper for the Working Group on Financial FDI of the BIS Committee of the Global Financial System. -Hymer, S.H. (1969), The International Operations of National Firms: A Study of Direct Foreign Investment, Ph.D. Dissertation, MIT. -Martinez Perez, M & Mody, A (2004) “How Foreign Participation and market concentration impact bank spreads: evidence from Latin America”. Journal of Money, Credit and Banking, 36 (3). -Papaioannou, Elias (2009) “What Drives International Financial Flows? Politics, Institutions and Other Determinants”. Journal of Development Economics (88), p.269-281. -Quigley, Neil (1989). “The Bank of Nova Scotia in the Caribbean, 1889-1940” The Business History Review, Vol. 63, No. 4 (Winter, 1989), pp. 797-838 -Tschoegl A. (2003). “Who Owns the Major US Subsidiaries of Foreign Banks? A note”. Wharton Working Paper Series Foreign banks and crises literature -Galindo, A, Micco A, & Powell A (2004) “Loyal Lenders or Fickle Financiers: Foreign Banks in Latin America”. Inter-American Development Bank Research Department, Working Paper 529. -Goldberg, L.S. 2002. "When Is U.S. Bank Lending to Emerging Markets Volatile?" NBER Working Paper 8209. -Martinez Peria, Maria Soledad, Powell, Andrew, and Ivanna Vladkova-Hollar (2005) “Banking on Foreigners: The Behavior of International Bank Claims on Latin America, 1985–2000,” IMF Staff Papers. 01/02/2005; 52. -McCauley, McGuire & Von Peter (2010). “The architecture of global banking: from international to multinational?”. BIS Quarterly Review, March 2010, p.25-37 -Jones, G (ed) (1992): Multinational and international banking, Edward Elgar Publishing Ltd. -Peek, Joe, and Eric Rosengren (2000), “Collateral Damage: Effects of the Japanese Bank Crisis on Real Activity in the United States”. American Economic Review 90, no. 1 (March): 30-45.

34

35
Annex:
Countries of Operations of Canadian Banks
Bank Region Significant retail and commercial activities
through subsidiaries or branches
Limited retail and commercial
activities (2-5 branches)
Minority ownership in local retail and commercial bank
or association
Representative office, single branch or investment
banking?
North America
Canada Mexico Guyana Venezuela Brazil Belize Venezuela Colombia Chile Costa Rica El Salvador Panama
Latin America
Peru
Bahamas Antigua and Barbuda Netherlands Antilles St. Vincent and the Grenadines
Barbados Cayman Islands Aruba Dominica Dominican Republic Grenada British Virgin Islands Jamaica Haiti Anguilla Trinidad and Tobago St Kitts and Nevis US Virgin Islands St. Lucia Puerto Rico St. Maarten
Caribbean
Turks and Caicos Ireland Egypt United Kingdom Turkey Russia
Europe and Middle East
UAE
Scotiabank
Asia China China Hong Kong

36
India India Japan Thailand Thailand South Korea Malaysia Vietnam Australia Taiwan Singapore
Canada North
America United States Argentina Brazil Panama
Latin America
Uruguay Bahamas Aruba Antigua and Barbuda Netherlands Antilles Barbados Dominica Trinidad and Tobago Cayman Islands Grenada Jamaica St. Kitts and Nevis Montserrat
St. Lucia St. Vincent and the Grenadines
Caribbean
Suriname Turks and Caicos Spain Jersey Switzerland Turkey UK
Europe and MidEast
Guernsey China India Japan Singapore
RBC
Asia
Brunei Darussalam
North America Canada CIBC Europe UK

37
China Hong Kong Tokyo Asia Australia Bahamas Antigua Anguilla Barbados Belize Dominica Jamaica British Virgin Islands Curacao Cayman Islands St. Eustatius
Grenada St. Vincent and the Grenadines
St. Maarten St. Kitts and Nevis St. Lucia Trinidad and Tobago
Caribbean
Turks and Caicos
Canada
North America
United States: Connecticut, Delaware, the District of Columbia, Florida, Maine, Maryland, Massachusetts, New Hampshire, New Jersey, New York, Pennsylvania, Vermont and Virginia.
Latin America Mexico Mexico
Hong Kong Singapore South Korea
Asia
China UK
TD
Europe Ireland
Canada North
America US BMO
Latin Mexico
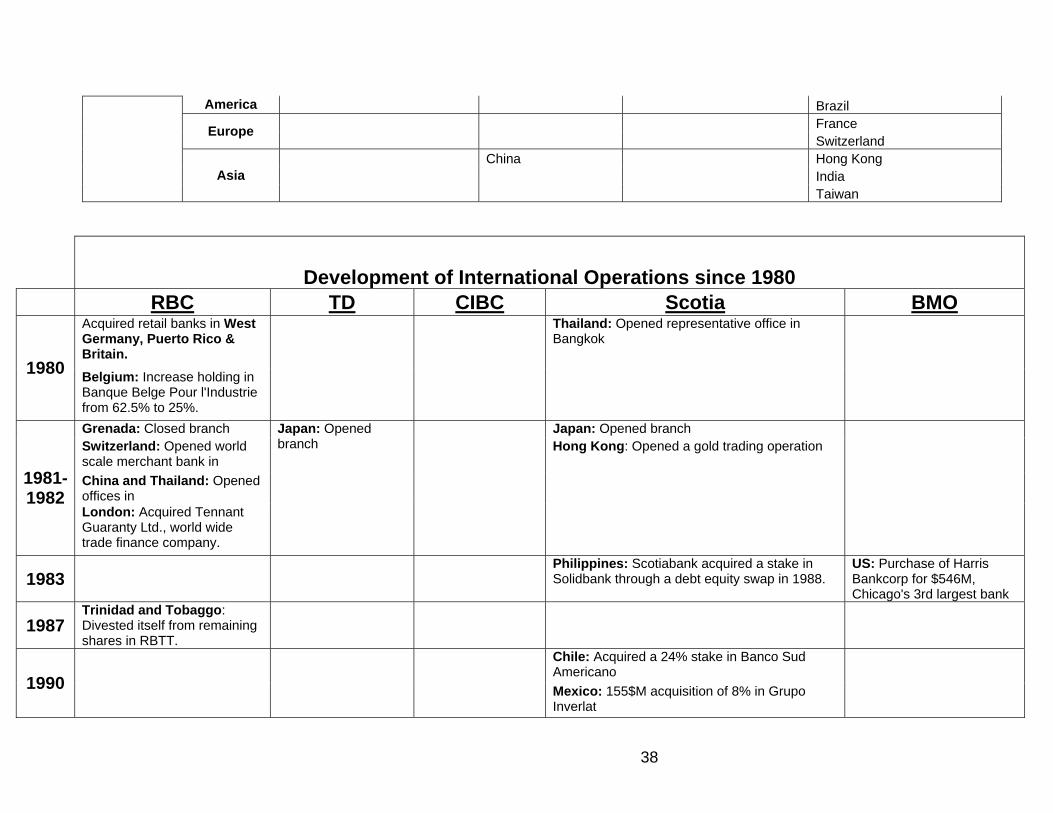
38
America Brazil France Europe Switzerland China Hong Kong India Asia Taiwan
Development of International Operations since 1980 RBC TD CIBC Scotia BMO
Acquired retail banks in West Germany, Puerto Rico & Britain.
Thailand: Opened representative office in Bangkok
1980 Belgium: Increase holding in Banque Belge Pour l'Industrie from 62.5% to 25%.
Grenada: Closed branch Japan: Opened branch Switzerland: Opened world scale merchant bank in
Hong Kong: Opened a gold trading operation
China and Thailand: Opened offices in
1981-1982
London: Acquired Tennant Guaranty Ltd., world wide trade finance company.
Japan: Opened branch
1983 Philippines: Scotiabank acquired a stake in
Solidbank through a debt equity swap in 1988. US: Purchase of Harris Bankcorp for $546M, Chicago's 3rd largest bank
1987 Trinidad and Tobaggo: Divested itself from remaining shares in RBTT.
Chile: Acquired a 24% stake in Banco Sud Americano
1990
Mexico: 155$M acquisition of 8% in Grupo Inverlat

39
China: Opened branch for trade finance and lending for companies 1993 Brazil: Sold subsidiary to Banco Portugues
US: For past 20 years, focus on establishing relationships with Fortune companies. 7 offices across the US (healthcare in Atlanta, oil and gas in Houston, communications and project finance in NYC).
1994
US: focuses relationship with top tier MNC's and corporations with links to Canada and niche areas such as media, communications, high tech and insurance. In past 6 years, closed offices in six cities and consolidated in 3 regional areas- LA, Chicago and NYC.
US: Concentrating on Fortune 1000 companies as well as in media comm, utiliities, forest products and health care.
US: Over 10 years, CIBC has boosted corporate client base to 1200 firms and asset portfolio of $13 billion (US). Headquarter in NYC, offices in Atlanta, Chicago, Houston, LA, San Francisco. Seeks to increase presence in large corporate sector.
Thailand: Upgraded Bangkok representative office to international banking centre
US: Largest presence in terms of assets- $18 billion (US). Spending $ 700 million to open new branches and acquire smaller regional banks. Purchased 13 small community banks in Chicago area in deal worth $246-million (U.S.).
Argentina: Purchased $57 million (US) for 25% of Banco Quilmes, gets assets of USD 1.4B and seats on board. Chile: Increased share in Banco Sud Americano to 30% for $22 million (US) Lebanon: Reopened branch in Beirut 1995
Latin America: structure consists of a network of representative offices in
Agentina, Brazil, Venezuela and Chile
Mexico: Opened representative office in
Costa Rica: Began operations through purchase of 80% stake in Corporacion Mercaban, holding company of Banco Mercantil group with assets of more than $60 million
Representative offices in Mexico and Brazil
1996
US: Purchased Waterhouse Securities in the US for $525 million (US) and became wholly owned subsidiary of TD.
Mexico: agreed to acquire 10% of Grupo Financiero Inverlat's shares for the sum of $31.2 million (US) . Bought a further $143.75 million that could be converted into 45% equity stake in 2000
Mexico: Acquired 20% interest in Bancomer for about $600-million (US) as part of a plan to operate in three countries under the North American Free Trade Agreement.

40
Argentina: Paying an additional $260 millions (US) for 70% of Banco Quilmes, Argentina's 7th largest bank. Total investment at $360m (US). Quilmes has 86 branches and assets of $1.8 b US.
El Salvador: Formalised the strategic alliance with El Salvador's Metropolitan Savings SA (Ahorromet) Peru: Purchased a 25% stake for $14.1 million (US) in Banco Sudamericano, Peru's 12th largest bank.
1997
US: Bought Oppenheimer, US brokerage house and carved investment banking niche for the sum of $525 million (US) over 3 years.
India: Opened 4th branch with focus on corporate and trade finance
1998 Venzuela: Signed agreement to acquire 25%
stake in Banco del Caribe for $88-million (US), Venezuela's 8th argest bank with assets of $793.6 million
1999 Chile: Paid $116 million US in 2000 to boost
stake to 60.6% from 28% in Banco Sud Americano
Mexico: Converted its subordinated bonds to GFI shares, thereby increasing its stake to 55%. Philippines: Sold its 40-per-cent stake in Solidbank Corp. for about $141-million. 2000
Chile: Consolidated share in Banco Sud Americano with a new transaction valued at $114.5 million (US) to own 100%.

41
2001
US: Acquired Centura Banks, 14th largest bank in Southeastern US for $2.3 billion (US) - 241 branches. Acquired Prism Financial Corp, Chicago mortgage broker for 115$M, acquired insurance subsidiaries of Liberty Corp for 580$M and Dain Rauscher Corp, Minneapolis based brokerage firm for 1.5B$ in September.
US: CIBC world markets in NYC. Trying to gain retail banking presence in US providing store label banking called Amicus for Safeway and Winn Dixie Stores-145 kiosks.
Mexico: BMO sells Bancomer shares to BBVA of Spain for pre tax gain of $295 million
2002
Argentina: Scotiabank Quilmes suspended by Central Bank. Scotiabank had a $540-million writedown after walking away from its investment in a bank in Argentina when that country's economy last melted down.
2003
US: Paying $75-million (U.S.) in cash for a Florida 13 branch network operated by Provident Financial Group Inc. Assets under administration of $500-million. RBC already has 11 branches in Florida from the purchase of Admiralty Bancorp. Inc. in 2003.
2004 US: Acquired
Banknorth Group $5 billion (US)
Mexico: Scotiabank boosts stake in Inverlat to 97%.
Peru: Acquiring 80% of Banco Wiese Sudameris and majority control of Banco Sudamericano who will be combined to form Peru's 3rd largest bank.
2005 US: Sold TD
waterhouse to Ameritrade for $2.9 billion (US)
El Salvador: Paid $178-million to acquire El Salvador's fourth largest bank, Banco de Comercia. Now has more than 97% of shares in BanCo which has nearly $1.6 billion in assets and 17% market share
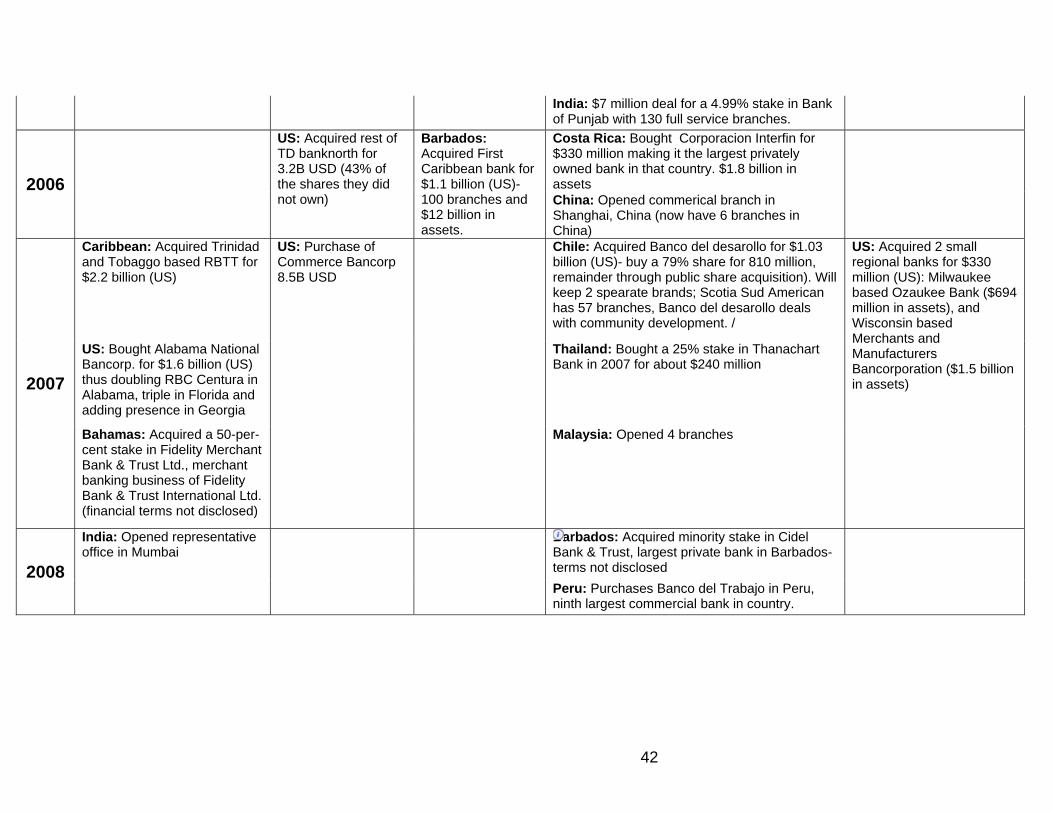
42
India: $7 million deal for a 4.99% stake in Bank of Punjab with 130 full service branches. Costa Rica: Bought Corporacion Interfin for $330 million making it the largest privately owned bank in that country. $1.8 billion in assets 2006
US: Acquired rest of TD banknorth for 3.2B USD (43% of the shares they did not own)
Barbados: Acquired First Caribbean bank for $1.1 billion (US)- 100 branches and $12 billion in assets.
China: Opened commerical branch in Shanghai, China (now have 6 branches in China)
Caribbean: Acquired Trinidad and Tobaggo based RBTT for $2.2 billion (US)
Chile: Acquired Banco del desarollo for $1.03 billion (US)- buy a 79% share for 810 million, remainder through public share acquisition). Will keep 2 spearate brands; Scotia Sud American has 57 branches, Banco del desarollo deals with community development. /
US: Bought Alabama National Bancorp. for $1.6 billion (US) thus doubling RBC Centura in Alabama, triple in Florida and adding presence in Georgia
Thailand: Bought a 25% stake in Thanachart Bank in 2007 for about $240 million
2007
Bahamas: Acquired a 50-per-cent stake in Fidelity Merchant Bank & Trust Ltd., merchant banking business of Fidelity Bank & Trust International Ltd. (financial terms not disclosed)
US: Purchase of Commerce Bancorp 8.5B USD
Malaysia: Opened 4 branches
US: Acquired 2 small regional banks for $330 million (US): Milwaukee based Ozaukee Bank ($694 million in assets), and Wisconsin based Merchants and Manufacturers Bancorporation ($1.5 billion in assets)
Barbados: Acquired minority stake in Cidel Bank & Trust, largest private bank in Barbados-terms not disclosed 2008
India: Opened representative office in Mumbai
Peru: Purchases Banco del Trabajo in Peru, ninth largest commercial bank in country.

43
China: Boost its interest in western Xi'an City Commercial Bank to 20 per cent - the maximum allowed under China regulations - from less than 2.5 per cent. Will bring its stake in the Chinese bank up to 18.1 per cent, at which point it will have invested $162-million into its interest. It then intends to buy additional shares in the bank from private sources to get up to the 20-per-cent ceiling. Also finalized terms to acquire a 33-per-cent stake for $15-million (U.S.) in a Chinese fund management company to be established with the Bank of Beijing (should get off the ground in 2010)
2009
Thailand: Paid $270 million to own 49% of Thanachart Bank- the maximum allowed for foreigners- 8th largest bank and leading auto lender
China banking regulator gave BMO approval to incorporate in country, thus allowing bank to do everything. 1st Canadian banks with privilege. Currently has 3 branches in mainland China and one in Hong Kong
US: Bought 3 troubled Florida banks with assets of $4.7 billion and 69 branches. TD now has 100 branches in Florida.
Thailand: Thanachart Bank (49% owned by Scotia) will pay $1 billion for a 47.6% stake in Siam City Bank. Scotia will merge both bankscreating fifth largeset lender in terms of assets. Scotia would still own 49% of the new bank. Biggest acquisition in 4 years in Thailand. 2010
Colombia: Acquired wholesale banking operations of RBS. Terms were not disclosed but they are not financially material to Scotia
US: Took over Amcore Bank (52 branches) in Illinois and Wisconsin.
Amcore was closed by the FDIC following a failure.
Terms were not disclosed.

44
Writedowns and Credit losses between Q3-2007 and April 2009 in USD billions
0.60.81.11.12.12.12.32.32.32.42.42.52.6333.23.23.23.23.63.63.83.83.94.34.54.84.855.2
5.96.16.16.16.16.87.17.27.37.47.47.57.58.78.7
13.613.814.515.615.81616.2
2121.523.425.226.1
33.342.442.7
45.350.6
55.988.3
101.9
5.9
0 20 40 60 80 100 120
T-D BankNational Bank
ScotiabankBMO
ABN AmroKeyCorp
Industrial and Commercial bank of ChinaLandesbank Sachsen
Alliance & Leicester PLCNorthern Rock PLC
Marshall & Ilsley CorpSovereign Bancorp
Allied Irish BanksMitsubishi
HuntingtonRabobank
Lloyds TSBWest LB
Bear StearnsRBC
US BancorpCommerzbankHSH Nordbank
Nomura HoldingsLB Baden-Wuerettenberg
E*TradeDresdner Bank
SantanderFifth Third Bancorp
Indymac BancorpBank of China
UnicreditKBC Groep
DexiaHypo Real Estate Holding AG
Sun TrustDZ Bank
Goldman SachsPNC Financial
CIBCBNP Paribas
Mizuho Financial GroupCredit Agricole
NatixisFortis
Societe GeneraleIKB Deutsche
ING GroepBarclays
Credit SuisseBayerische Landesbank
Deutsche BankLehman Borthers
RBSMorgan Stanley
Wells FargoNational City
HBOSJP Morgan Chase
HSBCBank of America
Washington MutualUBS
Merrill LynchCitigroup
Wachovia