canadian biotechnology industrial activities: features
TRANSCRIPT

Cat. No. 88F0006XIE01012
Canadian Biotechnology IndustrialActivities: Features from the 1997Biotechnology Survey

CANADIAN BIOTECHNOLOGYINDUSTRIAL ACTIVITIES: FEATURES
FROM THE 1997 BIOTECHNOLOGY SURVEY
Namatié Traoré, Ph. D.
Science, Innovation and Electronic Information Division
August 2001
88F0006XIE No. 12
ST-01-12

2
CONTACTS FOR MORE INFORMATION
Science, Innovation and Electronic Information Division
Director Dr. F.D. Gault (613-951-2198)
Assistant Director Brian Nemes (613-951-2530)
Assistant Director Paul McPhie (613-951-9038)
The Science and Innovation Information Program
Chief, Indicators Development
Dr. Frances Anderson (613-951-6307)
Chief, Knowledge Indicators
Michael Bordt (613-951-8585)
Chief, Innovation
Daood Hamdani (613-951-3490)
Chief, Life Science Unit
Antoine Rose (613-951-9919)
Science and Innovation Surveys Section
Chief
Bert Plaus (613-951-6347)
FAX:(613-951-9920)

3
The Science and Innovation Information Program
The purpose of this Program is to develop useful indicators of science andtechnology activity in Canada based on a framework that ties them together into acoherent picture. To achieve the purpose, statistical indicators are being developed in fivekey entities:
� Actors: are persons and institutions engaged in S&T activities. Measuresinclude distinguishing R&D performers, identifying universities thatlicense their technologies, and determining the field of study of graduates.
� Activities: include the creation, transmission or use of S&T knowledgeincluding research and development, innovation, and use of technologies.
� Linkages: are the means by which S&T knowledge is transferred amongactors. Measures include the flow of graduates to industries, the licensingof a university’s technology to a company, co-authorship of scientificpapers, the source of ideas for innovation in industry.
� Outcomes: are the medium-term consequences of activities. An outcomeof an innovation in a firm may be more highly skilled jobs. An outcome ofa firm adopting a new technology may be a greater market share for thatfirm.
� Impacts: are the longer-term consequences of activities, linkages andoutcomes. Wireless telephony is the result of many activities, linkages andoutcomes. It has wide-ranging economic and social impacts such asincreased connectedness.
The development of these indicators and their further elaboration is being done atStatistics Canada, in collaboration with other government departments and agencies, anda network of contractors.
Prior to the start of this work, the ongoing measurements of S&T activities werelimited to the investment of money and human resources in research and development(R&D). For governments, there were also measures of related scientific activity (RSA)such as surveys and routine testing. These measures presented a limited picture ofscience and technology in Canada. More measures were needed to improve the picture.
Innovation makes firms competitive and we are continuing with our efforts tounderstand the characteristics of innovative and non-innovative firms, especially in theservice sector that dominates the Canadian Economy. The capacity to innovate resides inpeople and measures are being developed of the characteristics of people in thoseindustries that lead science and technology activity. In these same industries, measuresare being made of the creation and the loss of jobs as part of understanding the impact oftechnological change.

4
The federal government is a principal player in science and technology in which itinvests over $5 billion each year. In the past, it has been possible to say only how muchthe federal government spends and where it spends it. Our report Federal ScientificActivities, 1998 (Cat. No. 88-204) first published socio-economic objectives indicatorsto show what the S&T money is spent on. As well as offering a basis for a public debateon the priorities of government spending, all of this information has been used to providea context for performance reports of individual departments and agencies.
As of April 1999, the Program has been established as a part of Statistics Canada’sScience, Innovation and Electronic Information Division.
The final version of the framework that guides the future elaboration of indicatorswas published in December, 1998 (Science and Technology Activities and Impacts: AFramework for a Statistical Information System, Cat. No. 88-522). The frameworkhas given rise to A Five-Year Strategic Plan for the Development of an InformationSystem for Science and Technology (Cat. No. 88-523).
It is now possible to report on the Canadian system on science and technology andshow the role of the federal government in that system.
Our working papers and research papers are available at no cost on the StatisticsCanada Internet site at http://www.statcan.ca/cgi-bin/downpub/research.cgi?subject=193.
Working Papers
The Working Papers publish research related to science and technology issues. Allpapers are subject to internal review. The views expressed in the articles are those of theauthors and do not necessarily reflect the views of Statistics Canada nor, in this case, theviews of Industry Canada, Natural Resources Canada or the National Research Councilof Canada.

5
TABLE OF CONTENTS
TABLE OF CONTENTS................................................................................................................................ 5ACKNOWLEDGEMENTS............................................................................................................................ 6EXECUTIVE SUMMARY ............................................................................................................................ 7INTRODUCTION .......................................................................................................................................... 9II SURVEY METHODOLOGY AND DATA ............................................................................................... 9
2.1 Questionnaire Description.................................................................................................................... 92.2 Questionnaire Administration ............................................................................................................ 102.3 Data and Data Quality........................................................................................................................ 10
III BIOTECHNOLOGY FIRMS DISTRIBUTION...................................................................................... 113.1 Distribution by Firm Size................................................................................................................... 113.2 Distribution by Sector ........................................................................................................................ 113.3 Distribution by Province .................................................................................................................... 11
IV REVENUES AND R&D EXPENDITURES......................................................................................... 144.1 Number of Biotechnology Firms Reporting Biotechnology Revenues.............................................. 144.2 Total Revenues and Biotechnology Revenues ................................................................................... 154.3 Total R&D Expenditures and Biotechnology Expenditures .............................................................. 16
V EXPORTS ACTIVITIES......................................................................................................................... 185.1 Number of Biotechnology Firms Declaring Exports and Biotechnology Exports ............................. 185.2 Total Export Revenues and Biotechnology Export Revenues ........................................................... 19
VI PRODUCTS PIPELINE ......................................................................................................................... 216.1 Number of Biotechnology Products by Sector, by Firm Size, by Province and by ........................... 21Stage of Development............................................................................................................................... 216.2 Number of Products by Sector, Firm Size and Province and by Sector and Firm ............................. 24Size ........................................................................................................................................................... 24
VII HUMAN RESOURCES........................................................................................................................ 267.1 Total Employment by the Biotechnology Firms ................................................................................ 267.2 Biotechnology Employment .............................................................................................................. 26
VIII OBSTACLES TO BIOTECHNOLOGY COMMERCIALIZATION .................................................. 288.1 Main Biotechnology Commercialization Obstacles........................................................................... 288.2 Obstacles to Biotechnology Commercialization by Sector, Firm Size and Province........................ 28
IX PURPOSES OF RAISING FINANCING CAPITAL AND ITS SOURCES .......................................... 309.1 Purposes of Raising Financing Capital .............................................................................................. 309.2 Sources of Financing Capital ............................................................................................................. 31
X SOCIAL CAPITAL: NETWORKING ACTIVITIES ............................................................................. 3210.1 Strategic Alliances and Origin of Partners....................................................................................... 3210.2 R&D Partnerships and Origin of Partners........................................................................................ 32
References..................................................................................................................................................... 34Annex 1 – Questionnaire .............................................................................................................................. 35How to Order Catalogued Publications......................................................................................................... 36

6
ACKNOWLEDGEMENTS
This report provides new Statistics Canada estimations based on theBiotechnology Firm Survey - 1997. This survey was funded jointly by Industry Canadaand Statistics Canada. The survey was conducted by Statistics Canada. Industry Canadaand BioteCanada provided help for the design of the questionnaire, the listing ofbiotechnology companies and the analysis of the survey results.
The survey also owes a debt of gratitude to the firms, that must remainanonymous, for the time given to respond to the survey.
At Statistics Canada, the publication of this report was made possible by thecontribution of various people including Antoine Rose, Special Advisor onBiotechnology, Lloyd Lizotte, Claire Racine-Lebel and the methodology team composedof Richard Laroche and Yves Morin.

7
EXECUTIVE SUMMARY
As of 1997, the core of Canadian biotechnology consisted of 282 biotechnologyfirms. Of these, 76% were small firms. The majority, 48%, were in the health sector.Quebec and Ontario together were home to 59% of them. They brought in $14 billion intotal revenues. Of these, $813 million came from biotech sales. In total, they exported forover $3 billion in products. Nine percent of that amount, i.e. $311 million are frombiotech products exports. The total number of products at all stages of development was8,924. Twenty percent of that number represented products approved or on the markets,41% were products in the clinical/field trial and, 39% were under development. Totalemployment by firms was estimated at about 32,000 people with over 9,000 peopleworking in biotechnology. The main hurdle to biotech commercialization was access tocapital. Thirty nine percent (39%) of the biotech firms raised financing capital in the1997 year. For that, they heavily relied on private placements and venture capital andlabor sponsored funds. Networking was an important activity, with marketing anddistribution being the major reason for which strategic alliances were established. Overhalf of the biotech firms had R&D partnerships with universities.
Comparisons by firm size show that 49% of biotech sales are made by large firms ascompared to 26% for small firms and 25% for medium-sized. Small firms outspent otherfirm categories in R&D: $193 million versus $177 million for large firms and $124million for medium sized firms. Large firms account for 54% of biotech export revenueswhile medium firms have the largest number of products, 70%, at all development stages.Large firms account for 42% of biotech employment.
Sectoral comparisons show that the health sector is dominant in many respects. Itaccounts for 48% of all the firms, over half of the biotech sales, 79% of total R&Dexpenditures, 83% of biotech R&D expenses and 57% of the biotech sales. Theagriculture and the food processing sector accounts for 62% of total revenues but only32% of biotech revenues. This sector accounts for 41% of all the products and over 86%of all the products at the clinical/field trial stage.
Regional comparisons show that Ontario is home to 31% of the Canadian corebiotech firms followed by Quebec at 28% and British Columbia at 18%. Firms in Ontarioaccount for 45% of biotech revenues as compared to 28% for those in Quebec. Firms inQuebec outspent those in Ontario in overall R&D: $383 million versus $363 million.However, firms in Ontario spent the most in total R&D: $220 million as compared to$132 million in Quebec and $77 million in British Columbia. The province of Ontario isresponsible for 49% of biotech revenues. Quebec has over 65% of all the products and84% of the products in the clinical/field trial stage. Ontario, on the other hand, accountsfor over a third of biotech employment, followed by Quebec at 30%.


9
INTRODUCTION
Biotechnology activities in recent years have not only attracted attention in themedia, but have also become a larger part of the Canadian economy in terms of thenumber of firms, the amount of revenues generated and, the amount of R&D expenses(Rose 1998, Arundel 1999, Arundel and Rose 1999, McNiven 2001 a, b, Niosi 2000). Forexample, McNiven (2001 a) found that the number of biotechnology firms was 358, anincrease of 21% over 1997. Biotech revenues were estimated at $1.5 billion in 1998 andat $1.9 billion in 1999. Biotechnology R&D expenditures amounted to $695 million and$827 million in 1998 and 1999, respectively (McNiven 2001a). Hence, The Life Sciencesection of the Science, Innovation and Electronic Information Division (SIEID) ofStatistics Canada works on the developments of new improved indicators, the gatheringof reliable data on biotechnology, the publishing of research and working papers on thetopics as well participating in different committees at the national and internationallevels.
This working paper presents new estimates for the Biotechnology Firm Survey of1997. The new estimates are meant to harmonize data from the 1997 and 1999biotechnology firm survey. The data are based on a questionnaire (described below) sentout to 475 firms believed to be involved in biotechnology. In 1997, it is estimated that thecore activities of biotechnology was composed of 282 biotechnology firms.
This paper is organized as follows: This introduction is followed by a second sectiondescribing the questionnaire, its administration, the data and their quality. The thirdsection looks into the distribution of the biotech firms by province, sector and firm size.The fourth section is concerned with revenues and R&D expenses. The export activitiesare the focus of the fifth section, and the sixth deals with the products pipeline. Humanresources are the topic of the seventh section. Section 8 looks into the hurdles faced bybiotech firms in selling their products. Section 9 deals with financing capital: thepurposes for raising it and its origins. The last section looks into the networking activitiesof the surveyed firms.
II SURVEY METHODOLOGY AND DATA
2.1 Questionnaire Description
In the 1997 Biotechnology Firm Survey, biotechnology is defined “as theapplication of science and engineering in the direct or indirect use of living organisms orparts of organisms in their natural or modified forms in an innovative manner in theproduction of goods and services or to improve existing processes”. To definebiotechnology in a more precised manner, the questionnaire used a list based on three

10
categories of biotechnologies: DNA based, Biochemistry/immunochemistry based andbioprocessing based1.
The questionnaire was designed in 10 main sections by Statistics Canada inpartnership with Industry Canada and BioteCanada. It aimed to collect data on anddocument i) the use of biotechnology by the Canadian industry sector, ii) the scope ofbiotechnology activities in terms of the number of products at different developmentstages, iii) financial assets of the biotech firms, iv) R&D activities, v) strategicpartnerships, vi) employment in the sector, vii) intellectual property (IP) instruments, viii)biotech commercialization problems in Canada, ix) access to financing capital, and x)strategic decisions biotech firms’ CEOs made in the 1997 year or planned to make in1998.
2.2 Questionnaire Administration
The questionnaire was administered by Statistics Canada in the summer of 1998. Itwas mailed to 475 firms whose names and addresses were obtained from IndustryCanada, the 1998 Canadian Biotechnology Directory maintained by Contact Canada, andthe Statistics Canada Industrial R&D survey.
Of the 475 firms that were sent the questionnaire, 150 were out of scope, 44 were outof business, 72 couldn't be reached or refused to answer the questionnaire and 210provided the requested data.
The size of the Canadian Biotech sector was estimated to be 282 firms. This figure isobtained by way of weighing and imputation, taking into account the weight of the sectorand province and each firm size category in the sample at hand.
2.3 Data and Data Quality
The data used in the current report are based on the 282 firms that constituted theCanadian Biotech sector in 1997.
Excluded from the survey were not-for-profit organizations, universities,government laboratories, hospitals, newly established firms and companies that use onlytraditional biotechnological techniques, dairy culture or fermentation. The current reportdoes not cover any consolidations or bankruptcies or new entrants into the sector thatoccurred after June 1998. These exclusions are not expected to create any major bias inthe results. Indeed, companies that use traditional biotech techniques and newly createdcompanies constitute a small percentage of the biotech universe. In addition, universities,government laboratories and hospitals even though very active in R&D and may havegiven rise to new spin-off biotech companies, are not considered as belonging to thebiotech industrial activities.
1 Details of the elements that make each of these categories are found in the second question of thequestionnaire annexed to the current report.

11
Comparison with data from other sources, for example Ernest and Young andContact Canada, from the same period show similar trends in the major indicators: R&Dactivities, level of employment, firm size, and revenue levels2.
III BIOTECHNOLOGY FIRMS DISTRIBUTION
3.1 Distribution by Firm Size
From the 1997 biotech survey, it is estimated that 282 biotechnology firms3
constituted the core of the Canadian biotechnology activities. Of these, about 76% aresmall firms, i.e. firms with 50 employees or less, 13% are medium-sized, 51 to 150employees and 11% are large with more than 150 employees (Table 1).
3.2 Distribution by Sector
The definitions of the three sectors and the Other sector used in this study are foundin Table 2. The distribution by sector shows that the health sector far outweights the othersectors. In fact a little over 48% of the core biotechnology firms belong to that sector. Itis followed in decreasing order by the agricultural and food processing sector at 26%, theOther sector at about 15%, and the environment at 11% (Table 1).
3.3 Distribution by Province
The distribution of Canadian biotechnology firms shows that Ontario and Quebec arethe prime locations, with 31% and 28% of the firms, respectively. Eighteen percent arelocated in British Columbia. Alberta and Saskatchewan are each home to about 7% ofbiotechnology firms (Table 1). The Maritimes provinces, P.E.I., Nova Scotia, NewBrunswick, and Newfoundland account for a little over 7% of the firms.
2 Canadian Biotech 1997: Coming of Age, Ernest & Young, John Goudey and Deepika Nath, 1997 andCanadian Biotechnology 1998, Contact Canada, Fred Haynes, 1998.3 In the 1997 biotechnology firm survey, a biotechnology firm is a firm that uses biotechnology andundertakes R&D in biotechnology. In the 1999 survey, a biotech firm is also one that develops productsand processes that use biotechnology.

12
Table 1: Biotechnology Firms Distribution According to the Firm
Number of Biotechnology Firms According to the Firm SizeNumber of Firms
Small Firms (50 or less employees) 214Medium Firms(51-150 employees) 37Large Firms (over 150 employees) 31Total 282
Number of Biotechnology Firms According to the SectorNumber of Firms
Health 136Agriculture and Food Processing 74Environment 31Other 41Total 282
Number of Biotechnology Firms According to the ProvinceNumber of Firms
British Columbia 52Alberta 19Saskatchewan 19Manitoba 6Ontario 87Quebec 79Maritimes 20Canada 282Source: Statistics Canada
Size, the Sector and the Province, 1997

13
Table 2: Definition of the sectors
SECTORS COMPONENTS
HEALTH (HUMAN)
♦ Diagnostics
♦ Therapeutics
♦ Gene therapy
AGRICULTURE AND FOOD
PROCESSING
♦ Plant Biotechnology
♦ Animal Biotechnology
♦ Biofertilizers/Biopesticides/Bioherbicides/
Biological Feed Additives/Microbial Pest
Control
♦ Non-Food Applications of Agricultural
Products
♦ Bioprocessing
♦ Functional Foods/Nutriceuticals
ENVIRONMENT
♦ Biofiltration
♦ Bioremediation and
Phyto/Plant/remediation
♦ Diagnostics
OTHER
♦ Genomics and Molecular Modeling
♦ Fish Health
♦ Broodstock Genetics
♦ Bioextraction
♦ Microbiologically Enhanced Petroleum/
Mineral Recovery
♦ Industrial Bioprocessing
♦ Custom Synthesis-Chemical or Biological
Source: The 1997 biotechnology survey questionnaire

14
IV REVENUES AND R&D EXPENDITURES
4.1 Number of Biotechnology Firms Reporting Biotechnology Revenues
As Table 3 shows, 237 out of 282 or 84% of core biotechnology firms declared somerevenues in 1997. Of these, 178 are small firms, 29 are medium sized and 30 are largefirms. In other words, 83% of small firms earned some revenues in 1997 as compared to78% of medium-sized and 97% of large firms.
One hundred and fifteen (115) of the firms that declared some revenues in 1997 arein the health sector, 64 in agriculture and food processing, 26 in environment and 32 inthe Other sector. Thus, roughly 85% of all the firms in the health sector earned somerevenues. That percentage was 86% for the agriculture and food processing sector, 84%for the environment sector and 78% for the Other sector.
Most of the firms that declared revenues were in Ontario and Quebec, 69 and 65firms respectively. British Columbia was home to 43 of them, with 41 located in theprairies and 19 in the Maritimes (Table 3).
A combination of factors may explain why some 45 firms did not report anyrevenues. First of all, it takes a long time for R&D results to materialize into actualproducts and processes. Second, there is often a long testing process beforebiotechnology products may be allowed on the market. Several small firms have not yetreached the market, therefore not reporting any revenues.

15
4.2 Total Revenues and Biotechnology Revenues
The 282 biotechnology firms brought in over $14 billion in total revenues in 1997.Of these, $12 billion, i.e. 83% of total revenues, were made by large firms, $685 millionby medium firms and, $1.7 billion by small ones (Table 4).
The sectoral distribution of the revenues show that the agriculture and foodprocessing sector earned almost $10 billion in 1997, i.e. 68% of total revenues. It isfollowed in decreasing order by the health sector at $3.4 billion and the environmentsector at $1 billion (Table 4).
Firms in Saskatchewan were the largest revenue earners with $5.6 billion. The otherimportant provinces are Quebec with 3.8 billion, Ontario, with $2.7 billion and Manitoba,with almost $2 billion. Firms in the four Maritime provinces brought in $61 million in
Table 3: Number of Biotechnology Firms Declaring Revenues and Biotechnology
Number of Firms Number of Firms DeclaringDeclaring Revenues Biotechnology Revenues
Small Firms (50 employees or less) 178 134Medium Firms (51-150 employees) 29 24Large Firms (over 150 employees) 30 18Total 237 176
Number of Firms Number of Firms DeclaringDeclaring Revenues Biotechnology Revenues
Health 115 78Agriculture and Food Processing 64 41Environment 26 25Other 32 32Total 237 176
Number of Firms Number of Firms DeclaringDeclaring Revenues Biotechnology Revenues
British Columbia 43 32Alberta 19 14Saskatchewan 17 12Manitoba 5 4Ontario 69 49Quebec 65 48Maritimes 19 17Canada 237 176Source: Statistics Canada
Revenues by Firm Size, by Sector and by Province, 1997
Size, 1997
Sector, 1997
Province, 1997

16
revenues, placing them behind British Columbia ($118 million) and Alberta ($248million) (Table 4).
Of the $14 billion earned in 1997, $813 million came from biotechnology productssales. Forty nine percent (49%) or $398 million were made by large firms, as comparedto 26% ($214 million) by small firms and 25% ($201 million) by medium firms. A littleover half of the biotechnology revenues, $417 million, came from the health sector.About 40% or $322 million were made by firms in the agriculture and food processingsector. Environment and the Other sectors were the least revenue earners with $49million and $25 million, respectively (Table 4).
Ontario accounted for about 45% of the 1997 biotechnology revenues as comparedto about 28% for Quebec. Together, firms in these two provinces accounted for over 72%of biotechnology revenues. Firms in the prairies earned in total, $145 million. Thisrepresented about 18% of the 1997 biotechnology revenues. The Maritimes provincesaccounted for only 4% of total biotechnology revenues (Table 4).
4.3 Total R&D Expenditures and Biotechnology Expenditures
In 1997, total R&D expenditures by the 282 biotechnology firms amounted to $926million, which represents a significant percentage of the BERD (Service bulletin, vol. 25,# 4). Fifty three percent of these came from large biotechnology firms, as compared to33% for small firms and about 18.5% for medium ones. In sum, large firms spent almostas twice as much as medium firms. Small firms outspent the latter by more than 1.5times.
More than 79% of these expenditures in R&D were incurred by the health sector.That amounted to $733 million in R&D spending and represented about 8 times morethan the R&D expenses by the agriculture and food processing sector and 17.5 timesmore than those by the environment sector. The total amount spent in R&D by the Othersector, i.e. firms in bio-informatics, aquaculture, mining, energy, petroleum, chemicalsand forest products was $57 million, which represented roughly 6% of total R&Dexpenditures by the core biotechnology firms in 1997 (Table 4).
Firms in Quebec and Ontario spent almost the same amount on R&D in 1997: $363million for firms in Ontario and $383 million for those in Quebec. Together, these twoprovinces accounted for about 81% of total R&D expenses by the core biotechnologyfirms. They are followed by British Columbia which spent $88 million on R&D.Altogether, firms in the prairies spent 77 million on R&D as compared to $14 million forthe Maritimes (Table 4).
In 1997, the total amount of biotechnology R&D expenses was $494 million, or 53%of total R&D expenses incurred by the biotechnology firms. Small firms outspent otherfirms. They spent $193 million as compared to $177 million and $124 million for largeand medium firms, respectively.
The health sector is the most engaged in biotechnology R&D with $409 million inspending, or roughly 83% of the total biotechnology expenses. It outspent the agriculture

17
and food processing sector by more than 7.5 times, the environment sector by more than40 times, and the Other sector by roughly 19 times (Table 4).
As in the case for total R&D expenses, firms in Quebec and Ontario spent the moston biotechnology R&D, with Ontario leading the way with $220 million and Quebec with$132 million. British Columbia followed with $77 million. The Prairies accounted for$51 million, and the Maritimes for $14 million (Table 4).
Table 4:Total Revenues, Biotechnology Revenues, Total R&D and Total Biotechnology R&D for the Biotechnology Firms According to the Firm Size, the Sector and the Province, 1997
Total Revenues Biotechnology Total R&D R&D Biotechnology Revenues Expenses Expenses
(000,000) (000,000) (000,000) (000,000)Small Firms (50 or less employees) 1,756 214 307 193Medium Firms (51-150 employees) 685 201 171 124Large Firms (over 150 employees) 12,011 398 448 177Total 14,452 813 926 494
Total Revenues Biotechnology Total R&D R&D Biotechnology Revenues Expenses Expenses
(000,000) (000,000) (000,000) (000,000)Health 3,397 417 733 409Agriculture and Food Processing 9,792 322 93 53Environment 1,090 49 42 10Other 173 25 57 22Total 14,452 813 926 494
Total Revenues Biotechnology Total R&D R&D Biotechnology Revenues Expenses Expenses
(000,000) (000,000) (000,000) (000,000)British Columbia 118 47 88 77Alberta 248 56 28 20Saskatchewan 5,644 56 35 19Manitoba 1,908 33 14 12Ontario 2,665 363 364 220Quebec 3,805 224 383 132Maritimes 61 34 14 14Canada 14,452 813 926 494Source: Statistics Canada
Firm Size, 1997
Sector, 1997
Province, 1997

18
V EXPORTS ACTIVITIES
5.1 Number of Biotechnology Firms Declaring Exports and Biotechnology Exports
As may be seen in Table 5, 97 firms or 71% of the 136 exporting firms declaredexporting biotechnology products. Seventy four of these were small firms, 15 weremedium firms and 8 were large firms. In other words, 77% of the small exporting firmswere exporting biotechnology products as compared to 68% of medium exporting firmsand 44% of large exporting firms.
The bulk of the biotechnology products and exporting firms, i.e. 40 firms, were inthe health sector, 19 were in agriculture and food processing, 14 were in environment and24 were in the Other sector. Put differently, 42% of all biotechnology exporting firmswere in the health sector as compared to 20% for agriculture and food processing, 14%for the environment and 25% for the Other sector.
Twenty nine (29) of the 43 Ontario exporting firms were involved in biotechnologyproducts exports. This number was 25 for Quebec, 11 for the Maritimes and 17 forBritish Columbia (Table 5).
As also shown by figures in Table 5, 136 of the 282 biotechnology firms undertooksome export activities in 1997. Ninety six (96) small firms declared exporting products ascompared to 22 medium firms and 18 large firms. This translates into 45% of small firms,59% of medium firms and 58% of large firms who were involved in exporting activities.
The health sector led the way with 55 firms. It was followed in decreasing order byAgriculture and food processing with 32 firms, the Other sector with 30 firms, and theenvironment sector with 19 firms.
Ontario and Quebec are home to the largest number of firms declaring exports, 43and 39 firms, respectively. British Columbia had 20 firms that exported. The Maritimeshad 12 exporting firms as compared to 22 for the Prairies.

19
5.2 Total Export Revenues and Biotechnology Export Revenues
The total export revenues amounted to over $3.3 billion in 1997. Large firmsaccounted for over $2.3 billion, small firms for $810 million, and medium firms for $183million.
The agriculture and food processing sector earned $2 billion in export revenues, theenvironment sector, $750 million, the health sector, $484 million and the Other sector,$24 million.
Firms in Quebec and Manitoba led the way with a little over $1 billion in exportrevenues for each province. Ontario and Saskatchewan followed with $540 million and$441 million, respectively. Firms in Alberta recorded $52 million in export revenues,those in British Columbia, $26 million, and those in the Maritimes, $26 million (Table 6).
Table 5: Number of Biotechnogy Firms Reporting Exports, Biotechnology ExportsAccording to the Firm Size, the Sector and the Province, 1997
Total Exporting Biotechnology Exporting Firms Firms
Small Firms (50 or less employees) 96 74Medium Firms (51-150 employees) 22 15Large Firms (over 150 employees) 18 8Total 136 97
Total Exporting Biotechnology Exporting Firms Firms
Health 55 40Agriculture and Food Processing 32 19Environment 19 14Other 30 24Total 136 97
Total Exporting Biotechnology Exporting Firms Firms
British Columbia 20 17Alberta 11 10Saskatchewan 7 …Manitoba 4 …Ontario 43 29Quebec 39 25Maritimes 12 11Canada 136 97Source: Statistics Canada
…: Figures not available
Firm Size, 1997
Sector, 1997
Province, 1997

20
Of the $3.3 billion of export revenues, $311 million or 9% came from the sales ofbiotechnology products and processes sales. The bulk came from large firms, $167million or 54% of total biotechnology export revenues. Small and medium firmsaccounted for $67 million and $77 million, respectively.
The health sector was the largest biotechnology export revenues earner with $177million, followed by the agriculture and food processing sector, $101 million.Environment and the Other sector contributed $24 and $9 million, respectively.
The province of Ontario accounted for $153 million or 49% of total biotechnologyproducts and processes export revenues. That was more that 2.5 times the contribution offirms in Quebec, $59 million. Twenty four million dollars of the export revenues inBritish Columbia were biotechnology related, as compared to $53 million for the Prairiesand $22 million for the Maritimes (Table 6).

21
VI PRODUCTS PIPELINE
6.1 Number of Biotechnology Products by Sector, by Firm Size, by Province and by Stage of Development
Overall, the 282 core biotechnology firms developped a total of 8,924 biotechnologyrelated product, most of them (80%) still at development stage and not yet to the market.The agriculture and food processing sector was dominant with 6,268 products, followedby the health sector, 1,710 products, the Other sector with 546, and the environment with400 products (Table 7).
Table 6: Total Export Revenues, Biotechnology Export Revenues, for the BiotechnologyFirms According to the Firm Size, the Sector and the Province, 1997
Total Export Revenues
Biotechnology Export Revenues
(000,000) (000,000)Small Firms (50 or less employees) 810 67Medium Firms (51-150 employees) 183 77Large Firms (over 150 employees) 2,338 167Total 3,331 311
Total Export Revenues
Biotechnology Export Revenues
(000,000) (000,000)Health 484 177Agriculture and Food Processing 2,073 101Environment 750 24Other 24 9Total 3,331 311
Total Export Revenues
Biotechnology Export Revenues
(000,000) (000,000)British Columbia 26 24Alberta 52 49Saskatchewan 441 2Manitoba 1,130 2Ontario 540 153Quebec 1,116 59Maritimes 26 22Canada 3,331 311Source: Statistics Canada
Firm Size, 1997
Sector, 1997
Province, 1997

22
Medium firms accounted for 6,268 or 70% of all the total number of products. Thiswas more than double that for small firms which accounted for 2,520 products and morethan 13 times that for large firms which had 452 products at all stages of development(Table 8).
The province of Quebec accounted for 5,834 products or over 65% of all theproducts. Ontario had 1,475 products, about 4 times less than Quebec. British Columbiahad 800 products, Saskatchewan, 324, the Maritimes, 342, Alberta 108 and Manitoba, 41products (Table 9).
Forty one percent of the 8,924 products were in the clinical/field trail stage ascompared to 39% that were under development and 20% approved or on the market(Table 7).
The health sector accounted for 943 of the products approved or on the market, theagriculture and food processing sector, 454, the Other sector, 279 and the environment,82 (Table 7). Small firms possessed 1,040 or 59% of these products as compared to 470for medium firms and 248 for large firms (Table 8). Ontario and Quebec were the twoprovinces with the largest number of products approved or on the market, 540 and 443,respectively. They were followed in decreasing order by British Columbia, 326, theMaritimes, 223, Saskatchewan, 204, Alberta, 18 and Manitoba, 4 (Table 9).
Agriculture and food processing had 3,177 products in the clinical/field trial stage.That amounted to 86% of all the products in that development stage. Two hundred andthirty four (234) of these products belonged to firms in the environment sector and 161 tothe health sector (Table 7). Medium firms were the most active firm category at that stagewith 3,076 products or 83% of the total. Small firms followed with 540 and large firmswith only 70 products (Table 8).
Firms in Quebec accounted for 3,090 or 84% of the products in the clinical/field trialstage. British Columbia and Ontario followed with 256 and 247 products, respectively.Sixty seven (67) of these products came from firms in the Prairies and 26 were fromfirms in the Maritimes (Table 9).
The largest number of the products under development were found in the agricultureand food processing sector. This sector accounted for 2,636 or 76% of all the products inthat stage. The health sector followed with 607 products, the Other sector with 153, andthe environment sector with 84 products (Table 7). Medium firms were the most active atthat stage with 2,406 products or 69% of the total. Small firms had 940 products underdevelopment whereas large firms had 134 (Table 8). The province of Quebec accountedfor 66% of all the products in that stage. That represented 2,300 products. BritishColumbia had 218 products under development as compared to 157 for the Prairies and93 for the Maritimes (Table 9).

23
Approved/ Clinical/Field Under Totalon Market Trial Stage Development
Health 943 161 607 1,710Agriculture and Food Processing 454 3,177 2,636 6,268Environment 82 234 84 400Other 279 114 153 546Total 1,758 3,686 3,480 8,924Source: Statistics Canada
Table 7: Number of Biotechnology Products by Sector and Stage of Development, 1997
Approved/ Clinical/Field Under Totalon Market Trial Stage Development
Small Firms (50 employees and less) 1,040 540 940 2,520Medium Firms (51-150 employees) 470 3,076 2,406 5,952Large Firms (Over 150 employees) 248 70 134 452Total 1,758 3,686 3,480 8,924Source: Statistics Canada
Table 8: Number of Biotechnology Products by Firm Size and Stage of Development, 1997
Table 9: Number of Biotechnology Products by Province and Stage of Development, 1997Approved/ Clinical/Field Under Totalon Market Trial Stage Development
British Columbia 326 256 218 800Alberta 18 27 63 108Saskatchewan 204 33 87 324Manitoba 4 7 30 41Ontario 540 247 689 1,475Quebec 443 3,090 2,300 5,834Maritimes 223 26 93 342Canada 1,758 3,686 3,480 8,924Source: Statistics Canada

24
6.2 Number of Products by Sector, Firm Size and Province and by Sector and Firm Size
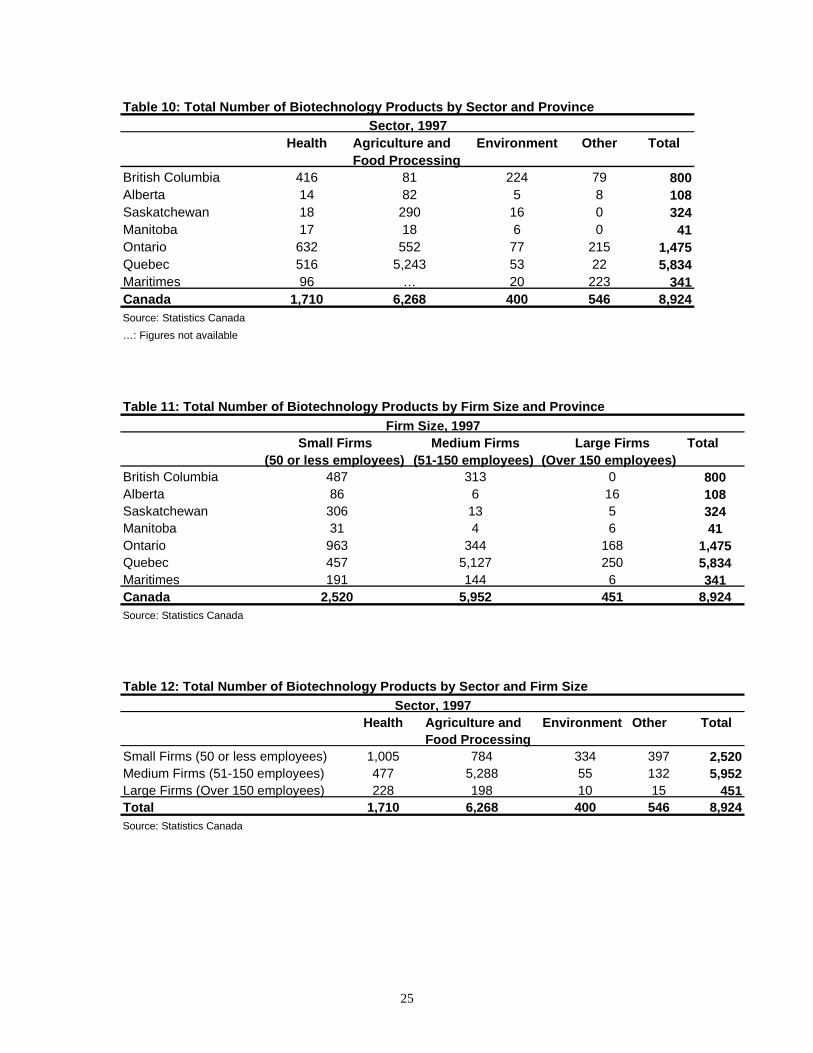
The health sector firms from Ontario, Quebec and British Columbia accounted forthe largest number of products. In fact, these three provinces accounted together for 91%of total biotechnology products: Ontario accounted for 632 products, Quebec 516 andBritish Columbia, 416. The prairies had 49 health products as compared to 96 for theMaritimes. The agriculture and food sector was dominated by Quebec firms with 5,243products or 84% of total. Ontario followed with 552 products and Saskatchewan with290. The environment sector was dominated by firms in British Columbia with 224products. Ontario and Quebec followed as distant second and third with 77 and 53products, respectively. The Prairies had 27 products only in that sector and the Maritimes20. The Other sector is mostly dominated by Ontario with 215 products (Table 10).
Small firms were very active in about all the provinces: they accounted for 963products in Ontario, 457 in Quebec, 487 in British Columbia, and 306 in Saskatchewan.Medium firms in Quebec were the most active with 5,127 products. Those in Ontario andBritish Columbia come as distant second and third with 344 and 313 products,respectively. Large firms had the largest number of products in Quebec and Ontario: 250and 168 products, respectively (Table 11).
Small firms are the dominant force in the health sector, the environment and theOther sector. They accounted for respectively 1,005, 334 and 397 products in thesesectors. The medium firms were the largest player in agriculture and food processing with5,288 products as compared to 784 for small firms and 198 for large firms. Large firmshad fewer products than any other firm category. This holds true across sectors (Table12).
25
Table 11: Total Number of Biotechnology Products by Firm Size and Province
Small Firms Medium Firms Large Firms Total(50 or less employees) (51-150 employees) (Over 150 employees)
British Columbia 487 313 0 800Alberta 86 6 16 108Saskatchewan 306 13 5 324Manitoba 31 4 6 41Ontario 963 344 168 1,475Quebec 457 5,127 250 5,834Maritimes 191 144 6 341Canada 2,520 5,952 451 8,924Source: Statistics Canada
Firm Size, 1997
Table 12: Total Number of Biotechnology Products by Sector and Firm Size
Health Agriculture and Environment Other TotalFood Processing
Small Firms (50 or less employees) 1,005 784 334 397 2,520Medium Firms (51-150 employees) 477 5,288 55 132 5,952Large Firms (Over 150 employees) 228 198 10 15 451Total 1,710 6,268 400 546 8,924Source: Statistics Canada
Sector, 1997
Table 10: Total Number of Biotechnology Products by Sector and Province
Health Agriculture and Environment Other TotalFood Processing
British Columbia 416 81 224 79 800Alberta 14 82 5 8 108Saskatchewan 18 290 16 0 324Manitoba 17 18 6 0 41Ontario 632 552 77 215 1,475Quebec 516 5,243 53 22 5,834Maritimes 96 … 20 223 341Canada 1,710 6,268 400 546 8,924Source: Statistics Canada
…: Figures not available
Sector, 1997

26
VII HUMAN RESOURCES
7.1 Total Employment by the Biotechnology Firms
As may be seen in Table 13, biotechnology firms employed almost 32,000 people in1997. Quebec accounted for about 41% of that number or about 13,000 employees.Ontario had 9,272 employees and Saskatchewan came third with 4,980 employees.Manitoba and British Columbia followed with 1,763 and 1,220 employees, respectively.Alberta and the Maritimes had less than a thousand employees each.
The largest number of employees was in large firms. They employed 19,960 people,or about 63% of total employees. Small firms employed over 8,000 people whereasmedium firms had half as many (Table 14).
The health sector was the largest employer with over 13,000 people. The agricultureand food processing sector followed with 10,671 employees. The environment sectoraccounted for 4,388 employees (Table 15).
7.2 Biotechnology Employment
Of the 31,924 people employed by the biotechnology firms, 9,019 or 28% werebiotechnology employees. The largest number of these were employed by firms inOntario at 3,416 and Quebec at 2,722 employees. The other important biotechnologyemployers were British Columbia with a little over a thousand employees and, thePrairies with 1,349 employees. There were as 490 biotech employees in the Maritimes(Table 13).
Large firms accounted for 3,825 or 42% of biotech employees, medium firms for2,299 and small firms for 2,895 (Table 14). The health sector had 6,280 employees, orabout 70% of all biotechnology employees. The agriculture and food processing sectorwas a distant second with 1,542 employees. The environment sector followed with 291employees (Table 15).

27
Table 13: Total Number of Employees,Total Number of Biotechnology Employees by Province
Total Number of Employees
Total Number of Biotechnology Employees
British Columbia 1,220 1,042Alberta 955 789Saskatchewan 4,980 351Manitoba 1,763 209Ontario 9,272 3,416Quebec 12,983 2,722Maritimes 751 490Canada 31,924 9,019Source: Statistics Canada
Province, 1997
Table 14: Total Number of Employees,Total Number of Biotechnology Employees by Firm Size
Total Number of Employees
Total Number of Biotechnology Employees
Small Firms (50 and less employees) 8,314 2,895Medium Firms (51-150 employees) 3,650 2,299Large Firms (over 150 employees) 19,960 3,825Total 31,924 9,019Source: Statistics Canada
Firm Size, 1997
Table 15: Total Number of Employees,Total Number of Biotechnology Employees by Sector
Health 13,438 6,280Agriculture and Food Processing 10,671 1,542Environment 4,388 291Other 3,427 906Total 31,924 9,019Source: Statistics Canada
Sector, 1997Total Number of
EmployeesTotal Number of
Biotechnology Employees

28
VIII OBSTACLES TO BIOTECHNOLOGY COMMERCIALIZATION
8.1 Main Biotechnology Commercialization Obstacles
Access to capital is a major obstacle to commercializing biotechnology in Canada. Infact, 118 of the 282 biotechnology firms, i.e. 42% were faced with this problem in 1997.Access to skilled human resources and the time requirements for gaining regulatoryapproval are also important issues confronting Canadian biotech firms. These issuesaffected 32% of them. Consumer acceptance, higher cost for gaining regulatory approval,the access to technology and the lack of information about markets are other importantobstacles biotech firms face in selling their products. Intellectual property (IP) protection,limited international harmonization and labeling are a concern to very few of biotechfirms (Table 16).
8.2 Obstacles to Biotechnology Commercialization by Sector, Firm Size and Province
Access to capital remains the greatest concern among the firms across sectors: infact, 58 or 43% of the firms in the health sector found it to be a major obstacle tocommercializing their products in 1997. This figure is 39% for the agriculture and foodprocessing sector and 52% for the environment sector (Table 17). Access to skilledhuman resources and the time requirements for gaining regulatory approval are thesecond and third major obstacles to biotech sales in the health sector. High cost and thetime required for gaining regulatory approval were cited as serious obstacles by firms inthe agriculture and food processing sector, as compared to consumer acceptance, accessto smart capital and time required to gain regulatory approval by the environment sector(Table 17).
Access to capital hampers biotech products commercialization for 94 or 44% of thesmall firms. A little over a third of them find access to skilled human resources and thetime requirement for gaining regulatory approval to be major obstacles to selling theirproducts. Other major issues for small firms are access to smart capital and the high costof gaining regulatory approval. These problems affect over a quarter of them. The lack ofinformation about markets and consumer acceptance hinder biotech sales for over 1 inevery 5 biotech small firms (Table 18). Medium-sized firms, on the other hand, are facedprimarily with access to skilled human resources, consumer acceptance and access tocapital (Table 18). As for large firms, the main obstacles to biotech sales are access tocapital and the time required to gain regulatory approval (Table 18).
The major hurdle to biotech sales facing firms in Ontario and Quebec is access tocapital. Additional issues for firms in Quebec are access to skilled human resources andthe time required to gain regulatory approval. In Ontario, firms have to deal withproblems of access to smart capital and consumer acceptance. In British Columbia, themajor obstacles to biotech sales are access to skilled human resources, access to capital,and time required to gain regulatory approval. In the Maritimes, the cost of gainingregulatory approval is the main issue, while the lack of information about market andaccess to smart capital was cited in Alberta and in Saskatchewan, limited internationalharmonization time required to gain regulatory approval. (Table 19).

29
Table 16: Commercialisation Problems Facing Biotechnology Firms in CanadaTotal Number of Firms
Access to Capital 118Access to Smart Capital 67Access to Technology 51Skilled Human Resources 89Consumer Acceptance 69Lack of Information about Markets 59Labelling 12Limited International Harmonization 32IP Protection 29Cost for Gaining Regulatory Approval 66Time Required to Gain Regulatory Approval 90Other 23Source: Statistics Canada
Table 17: Commercialisation Problems Facing Biotechnology Firms in Canada, by SectorHealth Agriculture and Environment Other Total
Food ProcessingAccess to Capital 58 29 16 15 118Access to Smart Capital 31 13 9 14 67Access to Technology 24 17 5 5 51Skilled Human Resources 55 18 6 10 89Consumer Acceptance 26 19 12 12 69Lack of Information about Markets 29 16 6 8 59Labelling … 9 0 0 12Limited International Harmonization 12 20 0 0 32IP Protection 15 9 … … 29Cost for Gaining Regulatory Approval 28 27 6 5 66Time Required to Gain Regulatory Approval 41 27 9 13 90Other 9 6 … 5 23Source: Statistics Canada
…: Figures not available

30
IX PURPOSES OF RAISING FINANCING CAPITAL AND ITS SOURCES
9.1 Purposes of Raising Financing Capital
In 1997, a total of 109 firms or roughly 39% of the core biotech firms raisedfinancing capital. By far, the need for R&D funds was the main reason: 75 out of 109firms or 69% acknowledged raising capital for that purpose. Twelve percent (12%) raisedfunds for process scaleup. Raising capital for regulatory approval, was not reported by alarge number of firms (Table 20).
For the 1998 year, 158 or 56% of the biotech firms intended to raise some financingcapital, an increase of 31% over 1997. This trend is the same for R&D where 104 firms(as compared to 75 for 1997) intended to raise funds to conduct R&D. Fifteen firmsacknowledged the need to raise financing capital for regulatory approval in 1998 as
Table 18: Commercialisation Problems Facing Biotechnology Firms in Canada, by Firm SizeSmall Firms Medium Firms Large Firms Total
(50 and less employees) (51-150 employees) (over 150 employees)Access to Capital 94 13 11 118Access to Smart Capital 57 8 … 67Access to Technology 34 8 9 51Skilled Human Resources 71 14 4 89Consumer Acceptance 50 14 5 69Lack of Information about Markets 51 6 … 59Labelling 5 4 … 12Limited International Harmonization 22 5 5 32IP Protection 17 7 5 29Cost for Gaining Regulatory Approval 55 4 7 66Time Required to Gain Regulatory Approval 70 11 10 90Other 20 0 … 23Source: Statistics Canada
…: Figures not available
Table 19: Commercialisation Problems Facing Biotechnology Firms in Canada, by ProvinceBritish Alberta Saskatchewan Manitoba Ontario Quebec Maritimes Canada
ColumbiaAccess to Capital 22 7 8 … 32 40 6 118Access to Smart Capital 9 9 4 0 25 18 … 67Access to Technology 7 … … … 20 12 … 51Skilled Human Resources 24 5 5 4 21 28 … 89Consumer Acceptance 12 4 5 … 25 13 8 69Lack of Information about Markets 6 9 6 … 16 15 5 59Labelling … … 0 0 4 … … 12Limited International Harmonization … … 9 0 13 7 … 32IP Protection 5 … 0 … 9 10 … 29Cost for Gaining Regulatory Approval 15 4 6 0 21 11 10 66Time Required to Gain Regulatory Approval 21 … 9 … 22 28 8 90Other 4 … … … 6 7 … 23Source: Statistics Canada
…: Figures not available

31
compared to 5 in 1997. Thirty four firms want to do so for process scaleup, an increase of61% over 1997 (Table 20).
9.2 Sources of Financing Capital
The 109 firms that raised financing capital in 1997 relied heavily on privateplacement and venture capital and labor sponsored funds: over 1 in three of these firmsgot their funds from the first source; over 1 in every 5 got funds from the latter. Twelvefirms got some funds from friends/“angel investors” and eleven from strategic alliancepartners (Table 21). Initial public offering (IPO) were not among the most used sourcesof financing capital. Indeed, very few firms used that source to get capital funds (Table21).
The number of firms willing to get capital funds from venture capital/laborsponsored funds rose from 25 in 1997 to 40 in 1998. Capital from private placementswent from 43 to 50. Strategic partners accounted as sources for 41 firms in 1998 ascompared to 12 in 1997 (Table 21). Only 8 firms intended to raise funds by an IPO.
Table 20: Purposes for Raising Financing Capital by
1997 1998R&D 75 104Regulatory Approval 5 15Process Scaleup 13 34Other 16 5Total 109 158Source: Statistics Canada
Biotechnology Firms, 1997, 1998
Table 21: Sources of Financing Capital Raised by Biotechnology Firms, 1997, 1998 1997 1998
Friends/"Angel Investors" 11 12Ventured Capital/Labor Sponsored Funds 25 40Private Placement 43 50Initial Public Offering (IPO) … 8Secondary Public Offering 7 …Strategic Alliance Partner 12 41Other 9 5Total 109 158Source: Statistics Canada
…: Figures not available

32
X SOCIAL CAPITAL: NETWORKING ACTIVITIES
10.1 Strategic Alliances and Origin of Partners
In the survey questionnaire, an alliance is defined as “a formal agreement withanother firm to do business without merging”. As is apparent in Table 22, marketing anddistribution constitute the major reason for entering strategic alliances: half of thebiotechnology firms had such an agreement in 1997. Manufacturing was a reason to enteran alliance for 73 or over a quarter of the biotech firms, whereas financial reasons helpedcreate 41 alliances, and regulatory purposes, 26.
Canada and the USA are equally important to biotechnology firms in enteringstrategic alliances: 94 firms had Canadian partners and 92 had American partners. Sixtyfour had partners in the European Union, 40 had theirs in Asia. Sixteen firms entertainedSouth/Latin American partnerships (Table 22).
10.2 R&D Partnerships and Origin of Partners
R&D partnerships is an agreement with another organisation to undertakecollaborative R&D projects. R&D partners may include other biotech companies, othercompanies, universities, hospitals, research institute, Canadian federal and/or provinciallaboratories and, network of Canadian centres of excellence. Universities constitute verypopular R&D partners for Canadian biotech firms. In 1997, 149 or over half ofentertained R&D partnerships occured with these institutions. Research Institutes andother biotechnology companies were partners with 98 and 87 biotech firms, respectively.Other R&D partners include Canadian federal labs which had partnership relations with66 firms, other companies had 57 core biotech firms as partners, 51 were partners withhospitals and, 42 entertained partnerships with Canadian network of centers ofexcellence. Canadian provincial labs were partners with 22 biotech firms.
Canada is by far where most of the R&D partners of the biotech firms are found: 184or over 65% of them had R&D partners in Canada. The U.S.A. came second with 91firms having American partners against 57 who had partners in countries of the Europeancommunity. Asia and South/Latin America totaled 11 partnerships (Table 23).

33
Table 22: Purposes of Strategic Alliances and Origin of Biotechnology Firms’ Strategic Partners, 1997
Purposes of Alliance Number of Firms*Marketing/Distribution 142Manufacturing 73Regulatory Affairs 26Finance 41Other 11
Origin of Strategic Partners Number of Firms*Canada 94U.S.A. 92European Union 64Asia 40South/Latin America 16Other 17Source: Statistics Canada* The total number of firms is more than 282 because some firms have
multiple partners in multiple locations
Table 23: R&D Partnerships Entertained by Biotechnology
Type of Partners Number of Firms*Biotechnology Company 87Other Company 57University 149Hospital 51Research Institute 98Federal Lab (Canadian) 66Provincial Lab (Canadian) 22Network of Centers of Excellence (Canadian) 42
Origin of R&D Partners Number of Firms*Canada 184U.S.A. 91European Union 57Asia 5South/Latin America 6Other 10Source: Statistics Canada
* The total number of firms is more than 282 because some firms have multiple
partners in multiple locations

34
ReferencesArundel, A. and Rose A.. “ The diffusion of environmental biotechnology in Canada:adoption strategies and cost effects”. Technovation (19), 1999.
Arundel, Anthony. Diffusion of biotechnologies in Canada. Research paper #6, SIEID,Statistics Canada, 1999.
BIOTECANADA. Canadian Biotechnology '98: Success from Excellence, 1999
Gouley, John and Deepika Nath. Canadian Biotech '97: Coming of Age. Ernst & Young,1997
Haynes, Fred. Canadian Biotechnology 1998. Contact Canada. 1997.
McNiven, Chuck. Biotechnology Use and Development – 1999. Research paper, SIEID,Statistics Canada, 2001a.
McNiven, Chuck. Practices and Activities of Canadian Biotechnology Firms: Resultsfrom the Biotechnology Use and Development Survey - 1999.
Niosi, Jorge. Explaining Rapid Growth in Canadian Biotechnology Firms. Researchpaper, SIEID, Statistics Canada, 2000.
Rose, Antoine. Biotechnology use by Canadian Industry-1996. Research paper , SIEID,Statistics Canada, 1998.
Service Bulletin, Science Statistics, vol. 25 (4), 2001.

35
Annex 1 – Questionnaire

5-4900-40.1: 1998-03-05 STC/SAT-465-75092
Combined Report
1.
Biotechnologyactivities
YES or NO
Biotechnology FirmSurvey - 1997
Science and Technology Redesign Project Confidential when completed.
In all correspondence concerning this questionnaire,please quote this four-digit reference number
Collected under the authority of theStatistics Act, Revised Statutes ofCanada, 1985, Chapter S19.
Si vous préférez ce questionnaireen français, veuillez appeler à fraisvirés au (613) 951-9662.
Please correct name and address, if necessary
Purpose
Name Title
Telephone Number
– –
Fax Number
– –
Statistics Canada is undertaking this survey under the sponsorship of Industry Canada and BIOTECanada to produce informationof use to firms engaged in biotechnology activities by adressing the following question: What are the main characteristics of thefirms which choose to develop biotechnologies as an important component of their business? The information from the survey canbe used by businesses for market analysis, by trade associations to study performance and other characteristics of theirindustries, by government to develop national and regional economic policies, and by other users involved in research or policymaking. Statistics Canada will create a database combining survey responses with existing Revenue Canada and StatisticsCanada records.
Confidentiality While participation in this survey is voluntary, your cooperation is important to ensure that the information collected in this surveyis as accurate and as comprehensive as possible. Statistics Canada is prohibited by law from publishing or releasing, in anymanner, any statistics which would divulge information obtained from this survey that relates to any identifiable business withoutthe previous written consent of that business. The data reported on the survey questionnaire will be treated in strict confidence,used for statistical purposes and released in aggregated form only. The confidentiality provisions of the Statistics Act are notaffected by either the Access to Information Act or any other Legislation.
Biotechnolo gy Definition
If you require assistance in the completion of this questionnaire or have any questions regarding this survey please contact LloydLizotte (tel: 613-951-2188 (call collect), fax: 613-951-9920 or e-mail: [email protected])
Survey ContactPlease indicate the name of the person completing this form so we know who to contact should we have questions about thisreport.
Name of company Indicate type of affiliation with reporting company(i.e. parent, subsidiary or other)
If your records do not permit separate reporting, list the names of other companies included in this report andindicate whether they are engaged in biotechnology activities by writing YES or NO in the second column.
Yes1
No2
Yes1
No2
Yes1
No2
Yes1
No2
Yes1
No2
Biotechnology is defined as the application of science and engineering in the direct or indirect use of living organisms or parts oforganisms in their natural or modified forms in an innovative manner in the production of goods and services or to improveexisting processes.
Please report only on Canadian biotechnology activities of your company. Complete a separate questionnaire for each companyengaged in biotechnology activities in Canada.
Questions?

Genetic Engineering
2.
IF "YES" ä Principal Use (check one only)
5-4900-40.1Page 2
DNA Based
CurrentlyUsed in
Operations?Products/Processes
Development
Clinical/Field Trials
CurrentProduction
Biotechnologies
Biotechnologies used by your firm
If your company does not presently use or plan to use any of the biotechnolo gies listedabove, please stop here. Si gn and return questionnaire. Thank you for your cooperation.
Please review the following list of biotechnologies, and check the applicable circle for each technology.
Yes ä1
No2
1 2 3
IF "NO"
Do you PLAN TO USEwithin 3 years?
ä
ä Yes1 No2
Gene Therapy
Biochemistry / Immunochemistry Based
Microbiology / Virology / Microbial Ecology
Bioprocessin g Based
Natural Products Chemistry
Others (Please specify)
ä
Yes ä1
No2
1 2 3
ä Yes1 No2ä
Yes ä1
No2
1 2 3
ä Yes1 No2ä
Yes ä1
No2
1 2 3
ä Yes1 No2ä
Yes ä1
No2
1 2 3
ä Yes1 No2ä
Yes ä1
No2
1 2 3
ä Yes1 No2ä
Yes ä1
No2
1 2 3
ä Yes1 No2ä
Yes ä1
No2
1 2 3
ä Yes1 No2ä
Yes ä1
No2
1 2 3
ä Yes1 No2ä
Yes ä1
No2
1 2 3
ä Yes1 No2ä
Yes ä1
No2
1 2 3
ä Yes1 No2ä
Yes ä1
No2
1 2 3
ä Yes1 No2ä
Yes ä1
No2
1 2 3
ä Yes1 No2ä
Yes ä1
No2
1 2 3
ä Yes1 No2ä
Yes ä1
No2
1 2 3
ä Yes1 No2ä
Yes ä1
No2
1 2 3
ä Yes1 No2ä
Yes ä1
No2
1 2 3
ä Yes1 No2ä
Yes ä1
No2
1 2 3
ä Yes1 No2ä
Yes ä1
No2
1 2 3
ä Yes1 No2ä
Yes ä1
No2
1 2 3
ä Yes1 No2ä
Vaccines / Immune Stimulants / Drug Design & Delivery / Combinatorial Chemistry
Diagnostic Tests / Antibodies
Peptide / Protein Sequencing or Synthesis
Cell Receptors / Cell Signalling / Pheromones / Three Dimensional Molecular Modelling / Structural Biology
Biosensors
Biomaterials
Cell / Tissue / Embryo Culture & Manipulation
Fermentation / Bioprocessing / Biotransformation / Bioleaching / Biopulping /Biobleaching / Biodesulphurization
Extraction / Purification / Separation
Bioremediation / Phytoremediation / Biofiltration / Bioindicators
Gene Probes
Bio-informatics / Genomics /Pharmacogenetics
DNA Sequencing / Synthesis / Amplification

5-4900-40.1 Page 3
Please indicate the top 3 bio-industry sectors, where applicable, in numbered order, that best describe yourfirm's biotechnology activities, (use 1 for the Most important and 3 for the least important). Please also indicatethe number of products based on genetic engineering (rDNA) your company has in each of the relevantdevelopment stages:
Top Bio-sectors (1 to 3 by importance)Please write number and sub-headings from above list
Human Health - Bio
Approved/On Market
(number)
Clinical/FieldTrial stage
(number)
Underdevelopment
(number)
BIO-INDUSTRY SECTOR
1
Diagnostics (e.g. immunodiagnostics, gene probes,biosensors)
Therapeutics (e.g. vaccines, immune stimulants,biopharmaceuticals, rational drug design, drugdelivery, combinatorial chemistry)
Gene Therapy (e.g. gene identification, geneconstructs, gene delivery)
Bio-InformaticsGenomics and Molecular Modelling(e.g. DNA/RNA/protein sequencing & databasesfor humans,plants, animals and microorganisms)
Ag - BioPlant Biotechnology (e.g. tissue culture,embryogenesis, genetic markers, geneticengineering)
Animal Biotechnology (e.g. diagnostics,therapeutics, embryo transplantation, geneticmarkers, genetic engineering)
Biofertilizers/Biopesticides/Bioherbicides/Biological Feed Additives/Microbial pest control (e.g. bacteria, fungi, yeasts)
Non-Food Applications of Agricultural Products(e.g. fuels, lubricants,commodity and fine chemicalfeedstocks, cosmetics)
Food ProcessingBioprocessing (e.g. using enzymes and bacteria culture)
10) Functional Foods/Nutriceuticals (e.g. probiotics, unsaturated fatty acids)
Aquaculture
Mining/Energy/Petroleum/Chemicals
Forest Products
Environment
Fish health (e.g. diagnostics, therapeutics)
Broodstock genetics (e.g. tracking superior traits,genetic modification / engineering)
Bioextraction (e.g. karageenan from seaweed, antifreeze proteins from fish, flavours)
Microbiologically enhanced petroleum/mineralrecovery
(Cleaner) Industrial Bioprocessing (e.g. biodesulphurization, bio-cracking, bio-recovery)
Silviculture (e.g. ectomycorrhizae, tissue culture,somatic embryogenesis, genetic markers, geneticengineering)
(Cleaner) Industrial Bioprocessing (e.g. biopulping, biobleaching, biological prevention ofsapstain)
Biofiltration (e.g. treatment of organic emissions toair/water)Bioremediation and Phytoremediation (e.g. cleanup of toxic waste sites usingmicroorganisms)
Diagnostics (e.g. detection of toxic substances usingbioindicators, biosensors, immunodiagnostics)
OtherCustom synthesis- chemical or biological(e.g. peptides, proteins, nucleotides, hormones,growth factors, biochemicals
Other (please specify)
1)
2)
3)
4)
5)
6)
7)
8)
9)
11)
12)
13)
14)
15)
16)
17)
18)
19)
20)
21)
22)
Did you implement a new or significantly improved PROCESS in the last 3 years that required the developmentof biotechnologies?
ä How many?
Number
Do you PLAN to implement in the NEXT 3 years a new or significantly improved PROCESS that requires thedevelopment of biotechnologies?
3. a)
b)
Yes1
No2
ä How many?
Number
Yes1
No2
c)
Number of products by development stages
2
3

%TOTAL Exports (as % of product sales)
Total Business Activity (All activities including Biotech)
5-4900-40.1Page 4
Financial Information
Is your firm a public company?
Please report data for 1997 or the latest fiscal year available. Do not include sales and operations of your subsidiaries located outside Canada.
000$Cash & securities
Balance Sheet
Total Assets
Total liabilities
Shareholders Equity
1997
Product sales
Revenue
Contract Research
Other revenue
1997
R&D
Expenses
All other expenses
1997
Biotechnology Related Exports (as % of product sales)
Total number of employees (average for the year):
What percentage of your product salesare based on biotechnology? % OR bio product sales
%
What percentage of your R&D expensesare based on biotechnology? % OR bio R&D
Did your firm have biotech R&D expendituresin any of the years 1995-1997?
In the past 5 years, did your company applyfor the tax benefit under the R&D (SR&ED)tax programme? ä What was the most recent year?
ä Why did your company not apply?(check most important only)
complexity of the application process
uncertainty of eligibility
did not meet eligibility requirements
other (specify)
4.
a) Yes1
No2
b)
000$
000$
000$
000$ 000$
000$
000$
000$
%
Total exports to other countries (as % of product sales)
Total exports to the United States (as % of product sales)
Total exports to Europe (as % of product sales)
Total exports to Asia (as % of product sales)
Total exports to South/Latin America (as % of product sales)
%
%
%
%
000$
000$
R&D
5. a)Yes1
No2
Yes1
No2
b)
1
2
3
4
Fiscal year (if different from 1997)

Strategic Partnerships
Does your firm currently have any strategic alliances with other organizations {a strategic alliance is a formalagreement with another firm to do business activities without merging}
Marketing/Distribution
CanadianPartner
Foreign Partner, (Please identify country of partner)
Strategic Alliance for:USA Asia South/ Latin
America OtherE-U
Manufacturing
Regulatory Affairs
Finance
Other
R&D Partnership:
Human Resources engaged in Biotechnology Activities
In your current biotechnology activities, please give the number of employees on staff in the listed positions(include contract personnel and use fractions of a person-year if individuals are filling more than one role).
Position Number Now Employed Positions Unfilled Now Estimated NumberEmployed in year 2001
5-4900-40.1 Page 5
Yes ä1
No2
1 2 3 4 5 6
6.
Yes ä1
No2
1 2 3 4 5 6
Yes ä1
No2
1 2 3 4 5 6
Yes ä1
No2
1 2 3 4 5 6
Yes ä1
No2
1 2 3 4 5 6
Yes ä1
No2
1 2 3 4 5 6
Network of Centres of Excellence(Canadian)
Yes ä1
No2
1 2 3 4 5 6
Yes ä1
No2
1 2 3 4 5 6
Yes ä1
No2
1 2 3 4 5 6
Yes ä1
No2
1 2 3 4 5 6
Yes1
No2
Yes1
No2
Yes1
No2
7. a)
Clinical Affairs/Quality Assurance
Marketing & Sales
R&D
Regulatory/Legal/Government Affairs
Manufacturing
Business Development/Finance
Administration/Human Resources
Biotech Company
Other company
University
Hospital
Research Institute
Federal Lab (Canadian)
Provincial Lab (Canadian)

Does your firm have a formal employee development program (continuing education and training program)?
If yes, estimate your firm's total expenditures onformal education and training in 1997? ($000) or as a percentage of product sales %$ OR
$000
Does your firm employ co-op program students from universities?
Do you have a full time person solely responsible for Human Resources in your organization?
What is your approximate professional staff turnover rate (persons leaving as a % of total staff) for thebiotechnology activity in 1997?
%
Are you experiencing problems in recruiting Business Operations staff?
If YES. In which specialties? Finance
Marketing
Regulatory, Legal
Clinical Affairs
Are you experiencing problems in recruiting Technical / Production / Scientific / R&D staff?
Scientist
Engineering
Technicians
Have you tried to hire personnel from outside Canada in 1997?
Yes
If Yes, From which areas?
US
EU
Asia
South/Latin America
Other
ä
If Yes, were you successful?
ä
If No, Was the problem relatedto the following issues?
5-4900-40.1Page 6
b)
Yes ä1
No2
Human Resources engaged in Biotechnology Activities (continued)
7.
c)
Yes1
No2
d)
Yes1
No2
e)
f)
Yes ä1
No2
1
2
3
4
g)
If YES. In which specialties?Yes ä1
No2
1
2
3
h)
1
1
2
3
4
5
Yes
No
1
2
No2
Personal income taxes1
Immigration Rules2
Advancement opportunities3
Other4
ä

Intellectual property (IP) instruments
Have you ever had to abandon animportant biotech project becausefurther work was blocked by IP rightsheld by another organization? Was this an issue of scope
of patent in Canada ascompared to other countries?
Has your firm been involved inlitigation related to patent infringementin the past year? How many different cases?
During the last three years has yourfirm assigned the right to useintellectual property TO: (check where applicable)
In Canada Outside Canada
Government lab
University
Hospital
During the last three years has yourfirm acquired the right to useintellectual property FROM: (check where applicable)
Problems for Biotechnology Commercialization in Canada
Select the three issues that you consider are the most important problems to successfully commercialize yourbiotechnology products/processes:
Access to capital
5-4900-40.1 Page 7
a)
Yes ä1
No2
8.
Yes1
No2
b)
Yes ä1
No2
c)
Another firm
In Canada Outside Canada
Government lab
University
Hospital
d)
Another firm
1 2
3 4
5 6
7 8
1 2
3 4
5 6
7 8
9.
01
02
12Other (please specify)
Access to smart capital (money plus management expertise)
03Access to technology
04Skilled human resources
05Consumer acceptance
06Lack of information about markets
07Labeling
08Limited international harmonization
09IP protection
10Cost for gaining regulatory approval
11Time required to gain regulatory approval
Regulations:

Licenced out technology
Financing
For what purposes?(check most important)
Did you raise capital in 1997 for biotechnology?
Sources?(check most important)
Strategic Decisions
As the CEO, what were the most important decisions you made over last year (1997)? For this year (1998)? (check up to three for each year)
1997
5-4900-40.1Page 8
a)10.
Yes ä1
No2
How Much?
R&D1
Regulatory approvals2
Process Scaleup3
Other4
Friends / "Angel Investors"1
Venture Capital / Labour Sponsored Funds 2
Private Placement 3
IPO (Initial Public Offering)4
Secondary Public Offering 5
Strategic Alliance Partner 6
Other7
Are you planning to raise capital in 1998?b)
11.
1998
The followin g question should be answered by the CEO of your company.
Alliances with academia
Alliances with government
Alliances with companies
Raised private capital
Raised public capital
Raised $ from alliance
Raised $ from sales
Borrowed $
Comments
Thank you for your cooperation !
01 02
03 04
05 06
07 08
09 10
11 12
13 14
15 16
17 18
19 20
21 22
23 24
25 26
27 28
29 30
31 32
33 34
35 36
000$
1997 1998
Other (please specify)37 38
For what purposes?(check most important)
Sources?(check most important)
Yes ä1
No2
How Much?
R&D1
Regulatory approvals2
Process Scaleup3
Other4
Friends / "Angel Investors"1
Venture Capital / Labour Sponsored Funds 2
Private Placement 3
IPO (Initial Public Offering)4
Secondary Public Offering 5
Strategic Alliance Partner 6
Other7
000$
Refocused current product development
Downsized the organization
Increased the size of the organization
Entered product trials
Launched new product
Acquired a company
Outsourced to others
Licenced in technology
Acquired by a company

How to Order Catalogued Publications
These and other Statistics Canada publications may be purchased from local authorized agentsand other community bookstores, through the local Statistics Canada offices, or by mail order to:
Statistics CanadaDissemination DivisionCirculation Management120 Parkdale AvenueOttawa, OntarioK1A 0T6
Telephone: 1(613)951-7277National toll free order line: 1-800-700-1033Fax number: 1-(613)951-1584 or 1-800-889-9734Toronto Credit Card only (416)973-8018Internet: [email protected]
CATALOGUED PUBLICATIONS
Statistical Publication
88-202-XPB Industrial Research and Development, 2000 Intentions (with 1999 preliminary estimates and 1998 actual expenditures)
88-204-XIB Federal Scientific Activities, 2000-2001e (annual)
88-001-XIB Science Statistics (monthly)
Volume 24
No. 1 Federal Government Personnel Engaged in Scientific and Technological (S&T)Activities, 1990-1991 to 1999-2000e
No. 2 Biotechnology Research and Development (R&D) in Canadian Industry, 1997
No. 3 Industrial Research and Development, 1996 to 2000
No. 4 The Provincial Research Organizations, 1998
No. 5 Federal Government Expenditures on Scientific Activities, 2000-2001e
No. 6 Total Spending on Research and Development in Canada, 1989 to 2000e, and Provinces,1989 to 1998
No. 7 Estimation of Research and Development Expenditures in the Higher Education Sector,1998-99

No. 8 Research and Development (R&D) Expenditures of Private Non-Profit (PNP)Organizations, 1999
Volume 25
No. 1 Distribution of Federal Expenditures on Science and Technology, by Province andTerritories, 1998-99
No. 2 Estimates of Total Spending on Research and Development in the Health Field inCanada, 1988 to 2000e
No. 3 Biotechnology Scientific Activities in Selected Federal Government Departments andAgencies, 1999-2000
No. 4 Biotechnology Research and Development (R&D) in Canadian Industry, 1998
No. 5 Research and Development (R&D) Personnel in Canada, 1990 to 1999e
No. 6 Industrial Research and Development, 1997 to 2001
WORKING PAPERS - 1998
These working papers are available from the Science and Innovation Surveys Section of StatisticsCanada, please contact:
Science and Innovation Surveys SectionScience, Innovation and Electronic Information DivisionStatistics CanadaOttawa, OntarioK1A 0T6Internet: http://www.statcan.ca/english/research/scilist.htmTel: (613) 951-6309
ST-98-01 A Compendium of Science and Technology Statistics, February 1998
ST-98-02 Exports and Related Employment in Canadian Industries, February 1998
ST-98-03 Job Creation, Job Destruction and Job Reallocation in the Canadian Economy,February 1998
ST-98-04 A Dynamic Analysis of the Flows of Canadian Science and TechnologyGraduates into the Labour Market, February 1998
ST-98-05 Biotechnology Use by Canadian Industry – 1996, March 1998
ST-98-06 An Overview of Statistical Indicators of Regional Innovation in Canada:A Provincial Comparison, March 1998

ST-98-07 Federal Government Payments to Industry 1992-93, 1994-95 and 1995-96,September 1998
ST-98-08 Bibliometric Analysis of Scientific and Technological Research: A User’s Guideto the Methodology, September 1998
ST-98-09 Federal Government Expenditures and Personnel on Activities in the Natural andSocial Sciences, 1989-90 to 1998-99e, September 1998
ST-98-10 Knowledge Flows in Canada as Measured by Bibliometrics, October 1998
ST-98-11 Estimates of Canadian Research and Development Expenditures (GERD),Canada, 1987 to 1998e, and by Province 1987 to 1996, October 1998
ST-98-12 Estimation of Research and Development Expenditures in the Higher EducationSector, 1996-97, November 1998
WORKING PAPERS - 1999
ST-99-01 Survey of Intellectual Property Commercialization in the Higher EducationSector, 1998, February 1999
ST-99-02 Provincial Distribution of Federal Expenditures and Personnel on Science andTechnology, 1988-89 to 1996-97, June 1999
ST-99-03 An Analysis of Science and Technology Workers: Deployment in the CanadianEconomy, June 1999
ST-99-04 Estimates of Gross Expenditures on Research and Development in the HealthField in Canada, 1970 to 1998e , July 1999
ST-99-05 Technology Adoption in Canadian Manufacturing, 1998, August 1999
ST-99-06 A Reality Check to Defining E-Commerce, 1999, August 1999
ST-99-07 Scientific and Technological Activities of Provincial Governments, 1990-1991 to1998-1999e, August 1999
ST-99-08 Estimates of Canadian Research and Development Expenditures (GERD),Canada, 1988 to 1999e, and by Province, 1988 to 1997, November 1999
ST-99-09 Estimation of Research and Development Expenditures in the Higher EducationSector, 1997-98
ST-99-10 Measuring the Attractiveness of R&D Tax Incentives: Canada and MajorIndustrial Countries, December 1999

WORKING PAPERS - 2000
ST-00-01 Survey of Intellectual Property Commercialization in the Higher EducationSector, 1999, April 2000
ST-00-02 Federal Government Expenditures and Personnel in the Natural and SocialSciences, 1990-91 to 1999-2000e, July 2000
ST-00-03 A Framework for Enhanced Estimations of Higher Education and Health R&DExpenditures, by Mireille Brochu, July 2000
ST-00-04 Information and Communications Technologies and Electronic Commerce inCanadian Industry, 1999, November 2000
WORKING PAPERS - 2001
ST-01-01 Estimates of Canadian Research and Development Expenditures (GERD),Canada, 1989 to 2000e, and by Province 1989 to 1998, January 2001
ST-01-02 Estimation of Research and Development Expenditures in the Higher EducationSector, 1998-99, January 2001
ST-01-03 Innovation, Advanced Technologies and Practices in the Construction andRelated Industries: Provincial Estimates, 1999, January 2001
ST-01-04 Innovation, Advanced Technologies and Practices in the Construction andRelated Industries: National Estimates, 1999, February 2001
ST-01-05 Provincial Distribution of Federal Expenditures and Personnel on Science andTechnology 1990-91 to 1998-99, February 2001
ST-01-06 Estimates of Total Expenditures on Research and Development in the HealthField in Canada, 1988 to 2000e, March 2001
ST-01-07 Biotechnology Use and Development, 1999, March 2001
ST-01-08 Federal Government Expenditures and Personnel in the Natural and SocialSciences, 1991-92 to 2000-2001e, April 2001
ST-01-09 Estimates of Research and Development Personnel in Canada, 1979 to 1999e,June 2001
ST-01-10 Innovation in Canadian Manufacturing: National Estimates, 1999, June 2001
ST-01-11 Practices and Activities of Canadian Biotechnology Firms: Results from theBiotechnology Use & Development Survey -- 1999, August 2001
RESEARCH PAPERS – 1996-2001
No. 1 The State of Science and Technology Indicators in the OECD Countries, byBenoit Godin, August 1996
No. 2 Knowledge as a Capacity for Action, by Nico Stehr, June 1996
No. 3 Linking Outcomes for Workers to Changes in Workplace Practices: AnExperimental Canadian Workplace and Employee Survey, by Garnett Picot andTed Wannell, June 1996
No. 4 Are the Costs and Benefits of Health Research Measurable?, by M.B. Wilk,February 1997
No. 5 Technology and Economic Growth: A Survey, by Petr Hanel and Jorge Niosi,April 1998
No. 6 Diffusion of Biotechnologies in Canada, by Anthony Arundel, February 1999
No. 7 Barriers to Innovation in Services Industries in Canada, by Pierre Mohnen andJulio Rosa, November 1999
No. 8 Explaining Rapid Growth in Canadian Biotechnology Firms, by Jorge Niosi,August 2000
No. 9 Internationally Comparable Indicators on Biotechnology: A Stocktaking, aProposal for Work and Supporting Material, by W. Pattinson, B. Van Beuzekomand A. Wyckoff, January 2001
No. 10 Analysis of the Survey on Innovation, Advanced Technologies and Practices inthe Construction and Related Industries, 1999, by George Seaden, MichaelGuolla, Jérôme Doutriaux and John Nash, January 2001
No. 11 Capacity to Innovate, Innovation and Impact: The Canadian EngineeringServices Industry, by Daood Hamdani, March 2001