canadian community health survey (cchs) cycle 2.2 (2004 ... · supplements) & 24-hour dietary...
TRANSCRIPT

Canadian Community Health Survey (CCHS)
Cycle 2.2 (2004)
Nutrition – General Health (including Vitamin & Mineral Supplements) & 24-Hour Dietary Recall Components
User Guide
April 2008


What’s New 1. Vitamin and mineral supplement files This current release of CCHS 2.2 contains three new files pertaining to the vitamin and mineral supplement module of the general health component. The three files are the vitamin and mineral description (VDC) file, the vitamin and mineral supplement details (VMD) file and the vitamin and mineral summary (VSD) file. In addition, the HS and HS_SIDE files contain flags indicating whether a respondent consumed a particular nutrient in supplement form. 2. Updates to two previously released vitamin and mineral supplement variables Two vitamin and mineral supplement variables that had been previously released as part of Wave 2 have been corrected in the current release. They are VSDD_01 (In the past month, did you take any vitamins or minerals?) and VSDD_13 (In the past month, how many different vitamin and mineral products did you take?). 3. New income derived variables There are three new derived income variables included in this current release. They are INCDDADR (Adjusted household income ratio – national level), INCDDRCA (Distribution of household income – national level) and INCDDRPR (Distribution of household income – provincial level). Variable INCDDADR provides the adjusted ratio of household income to the low income cut-off. The variables INCDDRCA and INCDDRPR provide, for each respondent, a relative measure of their household income to the household incomes of all other respondents nationally and provincially. Also included is a geography population size variable, which is used in the calculations to create the new income derived variables. Further information on these new variables can be found in the derived variables documentation. 4. Revised values of vitamin D for some food codes The vitamin D values for food codes 3208 - Whitefish (raw), 3169 - Whitefish (baked), 3088 - Whitefish (smoked), and 10913 - gefilte fish have been revised since the previous release. This revision will affect the following variables: FDCD_DMG, FIDD_DMG and FSDDDDMG. 5. Revised values of linolenic acid for some food codes The linolenic fatty acid value for food code 554 - salad dressing, mayonnaise, commercial, reduced fat, has been revised since the previous release. This revision will affect the following variables: FDCD_FAN, FIDD_FAN, FSDDDFAN, and FSDDDENI. 6. Updated sugar values for some foods The values for FDCD_SUG, FIDD_SUG, and FSDDDSUG have been updated since the previous release. This update will reduce the under-coverage of sugar in the Wave 2 release. As such, there will be fewer missing sugar values than in the previous release.
7. Revisions to some respondents’ aspartame intake There were eight cases for which the aspartame values were miscoded in the Wave 2 files. The values have been revised for this release. These revisions will result in changed values for the nutritional profiles of these individuals. 8. Corrections to nutrient values for some infant formulas The nutrient values for some infant formulas have been corrected since the previous release. These corrections affect the following food codes: 501026, 501031, 501037, 501042, and 501049. 9. Bureau of Nutritional Sciences (BNS) codes Approximately 2% of food and recipe group codes have been corrected since the previous release. These changes will affect the following variables: FDCD_FGE, FDCD_FGF, FIDD_FGR, FIDD_GR1, FIDD_GR2, FIDD_GR3, and FIDD_GR4. 10. Updates to several variables on HS_SIDE In the Wave 2 release, approximately 350 records contained non-response codes (99999.999999) for the following variables: FSDDDEAL, FSDDDECA, FSDDDEEI, FSDDDELI, FSDDDEMO, FSDDDENI, FSDDDEPO, FSDDDEPR, and FSDDDESA. These values have now been set to missing (“.”) to be consistent with the other non-response values.

TABLE OF CONTENTS
1. INTRODUCTION ...................................................................................................................................1
2. CCHS BACKGROUND AND OBJECTIVES ........................................................................................2
3. NUTRITION SURVEY — BACKGROUND AND OBJECTIVES ..........................................................4
4. SURVEY CONTENT..............................................................................................................................5 4.1 “GENERAL HEALTH” COMPONENT....................................................................................................5 4.2 “24-HOUR DIETARY RECALL” COMPONENT ....................................................................................13
5. SAMPLE DESIGN ...............................................................................................................................14 5.1 TARGET POPULATION ...................................................................................................................14 5.2 SAMPLE SIZE AND ALLOCATION .....................................................................................................14 5.3 PROVINCIAL SAMPLE BUY-INS........................................................................................................15 5.4 SAMPLING OF HOUSEHOLDS FROM THE VARIOUS SAMPLE FRAMES ..................................................16 5.4.1 SAMPLING OF HOUSEHOLDS FROM THE AREA FRAME............................................................16 5.4.2 SAMPLING OF HOUSEHOLDS FROM THE LIST FRAME OF CCHS (CYCLE 2.1) DWELLINGS.........17 5.4.3 SAMPLING OF HOUSEHOLDS FROM THE PROVINCIAL HEALTHCARE REGISTRIES.......................18 5.5 SAMPLING OF RESPONDENTS........................................................................................................18 5.6 SAMPLE ALLOCATION OVER THE COLLECTION PERIOD.....................................................................19 5.7 SPECIAL BUY-IN SAMPLE BY HEALTH CANADA ................................................................................19 5.8 ASSESSING THE INTRA-INDIVIDUAL VARIABILITY..............................................................................19
6. DATA COLLECTION ..........................................................................................................................21 6.1 QUESTIONNAIRE DESIGN ..............................................................................................................21 6.2 FIELD TEST .........................................................................................................................21 6.3 COLLECTION PERSONNEL (TRAINING, SUPERVISION AND CONTROL).................................................21 6.4 DATA COLLECTION METHOD ..........................................................................................................22 6.5 PROXY INTERVIEWS .....................................................................................................................22 6.6 MINIMISING NON-RESPONSE .........................................................................................................23 6.7 SPECIAL CIRCUMSTANCES DURING DATA COLLECTION ....................................................................24 6.7.1 MEASURING HEIGHT AND WEIGHT .......................................................................................24 6.7.2 VITAMIN AND MINERAL SUPPLEMENT DATA COLLECTION .......................................................26 6.7.3 24-HOUR DIETARY RECALL INTERVIEW APPLICATION.............................................................26 6.7.3.1 AMPM FEATURES FOR RECORDING FOOD DETAILS AND AMOUNTS.........................27 6.7.4 INTERVIEWING CHILDREN AND YOUTH..................................................................................28 6.8 PRIVACY .........................................................................................................................28
7. DATA PROCESSING..........................................................................................................................29 7.1 EDITING .........................................................................................................................29 7.1.1 EDITING OF THE “GENERAL HEALTH” DATA ...........................................................................29 7.1.2 EDITING OF VITAMIN AND MINERAL SUPPLEMENT DATA .........................................................29 7.1.3 CALCULATION OF SUPPLEMENT STRENGTH..........................................................................30 7.1.4 EDITING OF THE “24-HOUR DIETARY RECALL” DATA ..............................................................30 7.2 MINIMUM COMPLETION REQUIREMENTS .........................................................................................31 7.3 CODING OF OPEN-ENDED QUESTIONS............................................................................................32 7.3.1 NON-FOOD RELATED CODING..............................................................................................32 7.3.2 VITAMIN AND MINERAL SUPPLEMENT CODING .......................................................................32 7.3.3 FOOD-RELATED .................................................................................................................32 7.4 NSS AND FOOD CODING ...............................................................................................................33
v

CCHS 2.2 - Nutrition: General Health & 24-Hour Dietary Recall Components – User Guide
7.4.1 AUTOMATED FOOD CODING ................................................................................................33 7.4.2 MANUAL FOOD CODING ......................................................................................................33 7.4.3 CALCULATION OF FOOD PORTION SIZES...............................................................................34 7.4.4 IMPORTING FOOD DATA INTO NSS ......................................................................................35 7.4.5 AN OVERVIEW: NUTRITION SURVEY SYSTEM (NSS).............................................................35 7.5 VERIFICATION/VALIDATION OF FOOD DATA......................................................................................36 7.6 VERIFICATION/VALIDATION OF VITAMIN AND MINERAL SUPPLEMENT DATA .........................................37 7.7 CREATION OF DERIVED AND GROUPED VARIABLES..........................................................................37 7.8 WEIGHTING .........................................................................................................................37 7.9 SUPPRESSION OF CONFIDENTIAL INFORMATION..............................................................................38
8. DATA FILE STRUCTURE...................................................................................................................39 8.1 DESCRIPTION OF DATA FILES ........................................................................................................39 8.2 IMPORTANT KEY VARIABLES AND DEFINITIONS ................................................................................44 8.3 KEY VARIABLES FOR LINKING DATA FILES .......................................................................................44 8.4 MAIN FOOD DATA FILES (FID & FRL) AND KEY VARIABLES ..............................................................45
9. WEIGHTING ........................................................................................................................................48 9.1 SAMPLE WEIGHTING .....................................................................................................................48 9.1.1 WEIGHTING OF THE AREA FRAME SAMPLE............................................................................50 9.1.2 WEIGHTING OF THE CCHS 2.1 LIST FRAME .........................................................................52 9.1.3 WEIGHTING OF THE PRINCE EDWARD ISLAND HEALTHCARE REGISTRY..................................54 9.1.4 WEIGHTING OF THE MANITOBA HEALTHCARE REGISTRY.......................................................56 9.1.5 WEIGHTING OF THE SUPPLEMENTARY ABORIGINAL FRAME ....................................................58 9.1.6 INTEGRATION OF THE AREA AND LIST FRAMES (I1)................................................................59 9.1.7 INTEGRATION OF THE ABORIGINAL FRAME WITH THE OTHER FRAMES (I2) ...............................62 9.1.8 SEASONAL AND DAY OF THE WEEK EFFECT (I3)....................................................................62 9.1.9 POST-STRATIFICATION (I4) .................................................................................................63 9.2 WEIGHTING OF THE SUB-SAMPLE WITH HEIGHT AND WEIGHT MEASURES ..........................................63
10. DATA QUALITY ..................................................................................................................................65 10.1 LIMITATIONS OF THE DATA ............................................................................................................65 10.1.1 LIMITATIONS OF THE 24-HOUR DIETARY RECALL DATA .........................................................65 10.1.2 LIMITATIONS OF THE VITAMIN AND MINERAL SUPPLEMENT DATA ...........................................66 10.2 RESPONSE RATES........................................................................................................................67 10.3 SURVEY ERRORS 69 10.3.1 NON-SAMPLING ERRORS....................................................................................................69 10.3.2 SAMPLING ERRORS...........................................................................................................69
11. GUIDELINES FOR TABULATION, ANALYSIS AND RELEASE ......................................................71 11.1 ROUNDING GUIDELINES ................................................................................................................71 11.2 SAMPLE WEIGHTING GUIDELINES FOR TABULATION .........................................................................71 11.2.1 DEFINITIONS: CATEGORICAL ESTIMATES, QUANTITATIVE ESTIMATES.....................................72 11.2.2 TABULATION OF CATEGORICAL ESTIMATES .........................................................................73 11.2.3 TABULATION OF QUANTITATIVE ESTIMATES .........................................................................73 11.3 GUIDELINES FOR STATISTICAL ANALYSIS........................................................................................74 11.4 SOFTWARE FOR INTAKE DISTRIBUTION (SIDE) ..............................................................................74 11.5 RELEASE GUIDELINES...................................................................................................................75
12. APPROXIMATE SAMPLING VARIABILITY TABLES .......................................................................76 12.1 HOW TO USE THE CV TABLES FOR CATEGORICAL ESTIMATES..........................................................76 12.2 EXAMPLES OF USING THE CV TABLES FOR CATEGORICAL ESTIMATES ..............................................78 12.3 HOW TO USE THE CV TABLES TO OBTAIN CONFIDENCE LIMITS .........................................................81 12.4 EXAMPLE OF USING THE CV TABLES TO OBTAIN CONFIDENCE LIMITS ...............................................82
vi

CCHS 2.2 - Nutrition: General Health & 24-Hour Dietary Recall Components – User Guide
12.5 HOW TO USE THE CV TABLES TO DO A Z-TEST ...............................................................................82 12.6 EXAMPLE OF USING THE CV TABLES TO DO A Z-TEST .....................................................................82 12.7 EXACT VARIANCES/COEFFICIENTS OF VARIATION............................................................................83 12.8 RELEASE CUT-OFFS FOR THE CCHS.............................................................................................84
13. FILE USAGE .......................................................................................................................................85 13.1 PRINCIPAL SAMPLING WEIGHT .......................................................................................................85 13.2 EXACT MEASURED BODY MASS INDEX WEIGHT................................................................................85 13.3 VARIABLE NAMING CONVENTION....................................................................................................86 13.3.1 VARIABLE NAME COMPONENT STRUCTURE IN CCHS ...........................................................87 13.3.2 POSITIONS 1-3: VARIABLE / QUESTIONNAIRE SECTION NAME ..............................................87 13.3.3 POSITION 4: CYCLE ..........................................................................................................87 13.3.4 POSITION 5: VARIABLE TYPE..............................................................................................88 13.3.5 POSITIONS 6-8: VARIABLE NAME........................................................................................88 13.4 ACCESS TO MASTER FILE DATA.....................................................................................................88
APPENDIX 1: ANALYTICAL ISSUES .........................................................................................................90 1. VITAMIN AND MINERAL SUPPLEMENT DATA............................................................................................90 2. HOUSEHOLD FOOD SECURITY STATUS.................................................................................................94
vii


CCHS 2.2 - Nutrition: General Health & 24-Hour Dietary Recall Components – User Guide
The information provided in this user guide covers the data from the Canadian Community Health Survey, Cycle 2.2 (2004) - Nutrition, including all data released in July 2005, July 2006, and April 2008. Due to their confidential nature, some of these data are only available on Statistics Canada's premises, including Research Data Centres. For additional information, please contact Data Access and Information Services, Health Statistics Division at [email protected].


CCHS 2.2 - Nutrition: General Health & 24-Hour Dietary Recall Components – User Guide
1. Introduction The Canadian Community Health Survey (CCHS) is a cross-sectional survey that collects information related to health status, health care utilization and health determinants for the Canadian population. The CCHS operates on a two-year collection cycle. The first year of the survey cycle “.1” is a large sample, general population health survey, designed to provide reliable estimates at the health region level. The second year of the survey cycle “.2” is a smaller survey designed to provide provincial level results on specific focused health topics. This Microdata File contains data collected in the fourth year of collection for the CCHS (Cycle 2.2). Information was collected between January 2004 and January 2005 in the ten provinces. The CCHS (Cycle 2.2) collected responses from persons of all ages, living in private occupied dwellings. Excluded from the sampling frame were individuals living in the three Territories, on Indian Reserves and on Crown Lands, institutional residents, full-time members of the Canadian Forces, and residents of certain remote regions. This document has been produced to facilitate the manipulation of the CCHS (Cycle 2.2) microdata file, which is described in detail in the following text and appendices. Any questions about the data sets or their use should be directed to: Electronic Products Help Line: 1 (800) 949-9491 For custom tabulations or general data support: Client Custom Services, Health Statistics Division: (613) 951-1746 E-mail: [email protected] For remote access support: (613) 951-1653 E-mail: [email protected] Fax: (613) 951-4198
1

CCHS 2.2 - Nutrition: General Health & 24-Hour Dietary Recall Components – User Guide
2. CCHS background and objectives In 1991, the National Task Force on Health Information cited a number of issues and problems with the health information system. These problems were: • data were fragmented and incomplete; • data could not be easily shared; • data were not being analysed to the fullest extent; and • the survey results were not consistently reaching Canadians.1 In responding to the needs, the Canadian Institute for Health Information (CIHI), Statistics Canada and Health Canada have joined forces to create a Health Information Roadmap. The Roadmap is a direct response to the concerns and desires of more than 500 individuals representing a wide range of organizations and interest groups. Early in 1999, the three national organizations listed above conducted a broadly based national consultation on health information needs. Participants stressed that national agencies must work together to strengthen Canada’s health information system, and must build on and contribute to the considerable investments and expertise at local, regional, and provincial/territorial levels.2 The Roadmap represents an important contribution to building a comprehensive national health information system and infrastructure to provide Canadians with the information they need to maintain and improve Canada’s health system and the population’s health.3 What is needed is a co-ordinated plan of action. No single government or organization can combat the above-noted problems alone. Co-operation at all levels – national, provincial, territorial, regional and local health organizations – is a prerequisite for success.4 The plan of action starts by seeking answers to two crucial questions:5 1. How healthy is the health care system? 2. How healthy are Canadians? The first question encompasses the effectiveness, efficiency and responsiveness of the health care system. Generally, an effective, efficient and responsive health care system is one that offers the quality of care Canadians expect.6 The second question is broader, and addresses the basic objective of the system: is the health of Canadians improving? To answer this, a strong health information system is needed.7 This information system must embrace six principle characteristics.8 The information system must be:
1. Canadian Institute for Health Information, Health Canada and Statistics Canada. 1999. Health Information Roadmap: Responding to Needs. ISBN 1-895581-30-3. p.3. (http://www.cihi.ca) 2. Ibid. p.1. 3. Ibid. p.1. 4. Ibid. p.3. 5. Ibid. p.3. 6. Ibid. p.3. 7. Ibid. p.5. 8. Expansion on these characteristics is described in Canadian Institute for Health Information. 1999. Health Information Roadmap: Responding to Needs. ISBN 1-895581-30-3. (http://www.cihi.ca)
2

CCHS 2.2 - Nutrition: General Health & 24-Hour Dietary Recall Components – User Guide
• secure and respectful of the privacy of Canadians; • consistent; • relevant; • integrable; • flexible; • user-friendly and accessible.
This new health information system needs to be timely, provide person-oriented information, and have common data standards with other Canadian health surveys, such as the National Population Health Survey (NPHS). The new system must also provide: new or expanded data sets; data on health services; data on outcomes, health status and non-medical determinants of health; data on outcomes of selected health interventions; implement special studies involving priority issues; data on costs per service; information exchange protocols; expanded analytical and dissemination capacity, and public reports on the health care system.9 Given this mandate, the Canadian Community Health Survey (CCHS) was conceived. The format, content and objectives of the CCHS evolved through extensive consultation with key experts and federal, provincial and community health region stakeholders to determine their data requirements.10 The primary objectives of the CCHS are to: • Provide timely, reliable, cross-sectional estimates of health determinants, health status and
health system utilization across Canada; • Gather data at the sub-provincial levels of geography; • Create a flexible survey instrument that meets specific health region data gaps; develops
focused survey content for key data; and deals with emerging health and health care issues as they arise.
As a key component of the Population Health Survey Program of Statistics Canada, the CCHS helps fulfil broader requirements of health issues in Canada. These requirements are: • Aid in the development of public policy; • Provide data for analytical studies that will assist in understanding the determinants of
health; • Collect data on the economic, social, demographic, occupational and environmental
correlates of health; • Increase the understanding of the relationship between health status and health care
utilization. The purpose of this document is to follow through on the mandate of collecting reliable, relevant information on health services, health status, and health issues of importance to Canadians, and disseminate this information to the public.
9. Ibid. p.11-14. 10. Canadian Institute for Health Information / Statistics Canada .1999. Roadmap Initiative … Launching the Process. ISBN 1-895581-70-2. p.19.
3

CCHS 2.2 - Nutrition: General Health & 24-Hour Dietary Recall Components – User Guide
3. Nutrition survey — background and objectives Diet is considered a modifiable risk factor for health which affects every Canadian. The last national population-based survey on food consumption and related nutrition assessment was conducted in 1972. Throughout the 1990s, Health Canada collaborated with each province in conducting dietary assessment surveys. Due to many factors, data from those provincial nutrition surveys were not able to provide comprehensive national information regarding the dietary patterns of Canadians.
In recognition of a critical need for more extensive and timely information about the nutrition of Canadians, it was decided that Cycle 2.2 of CCHS would focus on nutrition. The survey was conducted from January 14, 2004 to January 21, 2005 targeting a collected sample size of 30,000 respondents from all age groups, aged 0 and older, living in private occupied dwellings in the ten provinces. Excluded from the sampling frame were residents of the three territories, persons living on Indian reserves or Crown Lands, persons living in institutions, full-time members of the Canadian Forces and residents of some remote regions. The primary goal of the Nutrition Survey is to provide reliable, timely information about dietary intake, nutritional well-being and their key determinants to inform and guide programs, policies and activities of federal and provincial governments and local health agencies. The main objectives of the survey include:
• estimating the distribution of usual dietary intake in terms of foods, food groups, dietary supplements, nutrients and eating patterns among a representative sample of Canadians at national and provincial levels;
• gathering physical measurements for accurate body weight and height assessment; • measuring the prevalence of household food insecurity,11 • collecting data on selected health conditions and socio-economic and demographic
characteristics of respondents. The resulting survey is composed of two distinct, yet complementary parts: (1) the general health component, which includes vitamin and mineral supplements, and (2) the 24-hour dietary recall component. The general health component, as its name implies, collected information on the respondent’s general health status, including chronic conditions, as well as health-related behaviours such as the consumption of vitamin and mineral supplements, fruit and vegetable consumption, physical and sedentary activities, measured height and weight and smoking and alcohol consumption. Socio-demographic characteristics were also collected as part of the general health component. The 24-hour dietary recall component was designed to collect information on all the foods and beverages consumed during the previous day’s 24 hours from midnight to midnight. Respondents were asked to provide information on the time the food was consumed, the occasion (e.g., breakfast, lunch), additions to foods (e.g., butter on toast), detailed food descriptions, amounts consumed, and whether the meal was prepared at home or elsewhere.
11. The term “food insecurity” refers to limited or uncertain availability of nutritionally adequate foods or limited (or uncertain) ability to acquire acceptable foods in socially accepted ways.
4

CCHS 2.2 - Nutrition: General Health & 24-Hour Dietary Recall Components – User Guide
4. Survey content This section provides a general summary of the content selected for inclusion in the Nutrition Survey. The survey content was developed based on an ongoing consultation between Statistics Canada and members of an Expert Advisory Group held from early 2000 to the end of 2003. Members were drawn from across Canada, including Health Canada’s Food and Nutrition Surveillance System Working Group, members of the Federal/ Provincial/ Territorial Group on Nutrition, provincial nutrition survey experts, regional nutritionists working in local health agencies, and academics. The end result of the consultation was the survey questionnaire which is composed of two components: (1) General Health and (2) 24-Hour Dietary Recall. The general health component collects information about respondents such as height and weight, physical activities, and chronic health conditions as well as their socio-demographic characteristics, and consumption of vitamin and mineral supplements. The 24-hour dietary recall component collects information about all the foods and beverages a respondent consumed during the previous 24 hours, from midnight to midnight. It asks respondents about the time the food was consumed; the name of the eating occasion (e.g. breakfast, lunch); additions to foods (e.g. butter on toast); detailed food descriptions and amounts of the reported foods; and whether the meal was prepared at home or elsewhere. Approximately 30% of respondents from all age groups were selected to participate in a second 24-hour dietary recall. The second dietary recall interview — usually conducted 3 to 10 days after the initial interview – is used to measure how much a person’s diet changes from one day to the next. Note that during the second recall interview, only the 24-hour recall component was administered. A summary describing each component of the questionnaire is provided below. 4.1 “General Health” component The General Health component is comprised of 18 modules listed below in the order they were presented to respondents:
1 – General health 2 – Physical activities 3 – Sedentary activities 4 – Children’s physical activities 5 – Self-reported height and weight 6 – Vitamin and mineral supplements 7 – Vitamin and mineral supplement details 8 – Measured height and weight 9 – Women’s health 10 – Fruit and vegetable consumption 11 – Chronic health conditions 12 – Smoking 13 – Alcohol 14 – Food security 15 – Socio-demographic characteristics 16 – Labour force 17 – Income 18 – Administration
5
CCHS 2.2 - Nutrition: General Health & 24-Hour Dietary Recall Components – User Guide
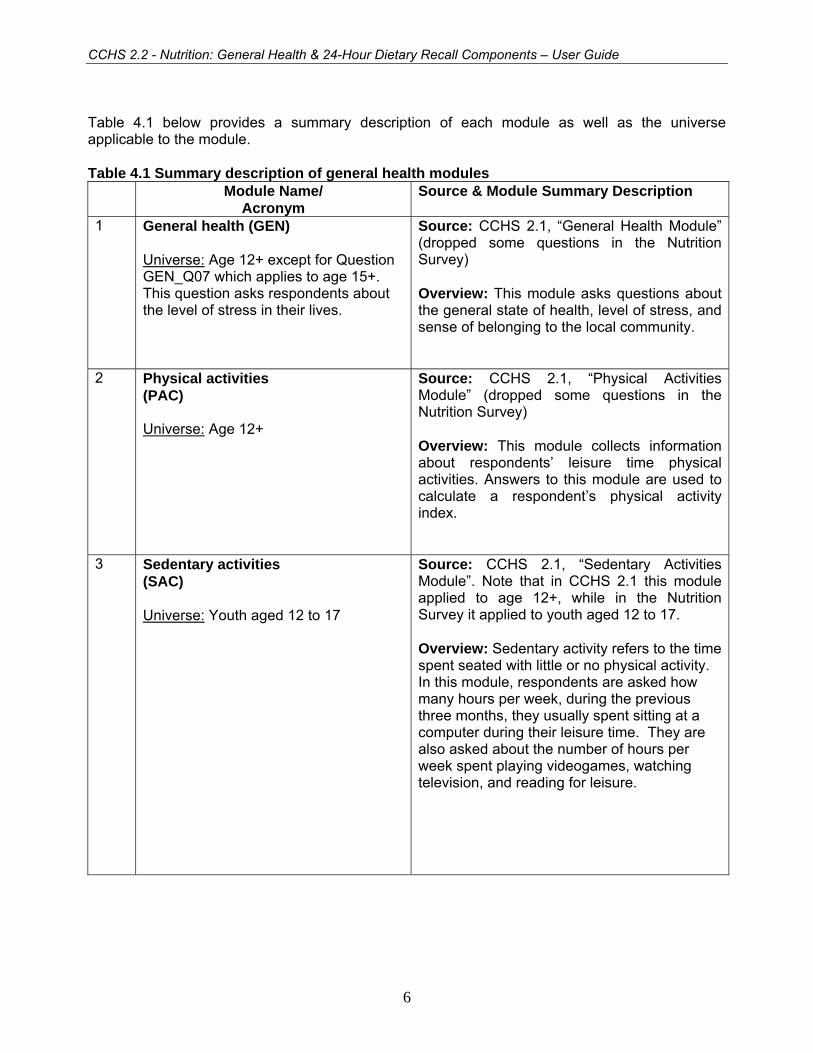
Table 4.1 below provides a summary description of each module as well as the universe applicable to the module. Table 4.1 Summary description of general health modules Module Name/
Acronym Source & Module Summary Description
1 General health (GEN) Universe: Age 12+ except for Question GEN_Q07 which applies to age 15+. This question asks respondents about the level of stress in their lives.
Source: CCHS 2.1, “General Health Module” (dropped some questions in the Nutrition Survey) Overview: This module asks questions about the general state of health, level of stress, and sense of belonging to the local community.
2 Physical activities (PAC) Universe: Age 12+
Source: CCHS 2.1, “Physical Activities Module” (dropped some questions in the Nutrition Survey) Overview: This module collects information about respondents’ leisure time physical activities. Answers to this module are used to calculate a respondent’s physical activity index.
3 Sedentary activities (SAC) Universe: Youth aged 12 to 17
Source: CCHS 2.1, “Sedentary Activities Module”. Note that in CCHS 2.1 this module applied to age 12+, while in the Nutrition Survey it applied to youth aged 12 to 17. Overview: Sedentary activity refers to the time spent seated with little or no physical activity. In this module, respondents are asked how many hours per week, during the previous three months, they usually spent sitting at a computer during their leisure time. They are also asked about the number of hours per week spent playing videogames, watching television, and reading for leisure.
6

CCHS 2.2 - Nutrition: General Health & 24-Hour Dietary Recall Components – User Guide
Module Name/ Acronym
Source & Module Summary Description
4 Children’s physical activity (CPA) Universe: Children aged 6 to 11
Source: Adapted from 2001/2002 Health Behaviour in School-Aged Children (HBSC) survey questionnaire.12 Overview: Children’s physical activity differs from that of adults. This module asks about physical activity of children aged 6 to 11 at school and outside school. Questions about frequency of watching TV and spending time on a computer are also asked.
5 Self-reported height and weight (HWT) Universe: Age 18+, sub-sample
Source: CCHS 2.1, “Height and Weight Module”. Note that in CCHS 2.1 this module applied to age 12 and over, while in the Nutrition Survey the module applied to age 18 and over. Overview: This module includes a series of questions asking respondents aged 18 and over to report their height and weight. Note: The Nutrition Survey includes two modules related to height and weight: One is called “Self-reported Height and Weight” (HWT) where the respondent is asked to self-report his/her height and weight; the other module is called “Measured Height and Weight” (MHW), where the interviewer is the one measuring the respondent’s height and weight.
While all respondents aged 2 and up are given the MHW module, only 10% of the sample aged 18 and older are given both modules HWT and MHW. The reason for giving some adult respondents both modules is to try and assess the difference between self-reported and measured height and weight.
12. Survey of Health Behaviour in School-Aged Children (HBSC) is sponsored by the World Health Organization (WHO). The survey is a cross-national study on school-aged children and it is conducted every four years in more than 20 countries. HSBC has been carried out in Canada since 1990 by Queen’s University in partnership with Health Canada. More information is available online at: www.phac-aspc.gc.ca/dca-dea/7-18yrs-ans/hbschealth_e.html.
7

CCHS 2.2 - Nutrition: General Health & 24-Hour Dietary Recall Components – User Guide
Module Name/ Acronym
Source & Module Summary Description
6 Vitamin and mineral supplements (NSP) Universe: All ages
Source: This is a new module developed specifically for CCHS Cycle 2.2. Overview: This module includes questions about any vitamin or mineral supplements consumed during the past month. Note that information on herbal preparations (e.g. Ginkgo, Ginseng, St.John’s Wort, etc.) was not collected. For information on combining the food and supplement nutrient data, please consult the Appendix.
7 Vitamin and mineral supplement details (NSD) Universe: All ages
Source: This is a new module developed specifically for CCHS Cycle 2.2. Overview: This module is a follow-up to the “Vitamin and Mineral Supplements Module” (NSP) and it captures the details for each vitamin and mineral supplement reported including the Drug Identification Number (DIN). In addition, it includes questions on the frequency and amount of consumption. (Note that the application allowed respondents to report the details for up to 10 supplements.) For information on combining the food and supplement nutrient data, please consult the Appendix.
8

CCHS 2.2 - Nutrition: General Health & 24-Hour Dietary Recall Components – User Guide
Module Name/ Acronym
Source & Module Summary Description
8 Measured height and weight (MHW) Universe: Age 2+
Source: This is a new module developed specifically for CCHS Cycle 2.2. Overview: After obtaining the respondent’s permission, the interviewer proceeds to measure the respondent’s height and weight using a scale and a measuring tape. In cases where respondents are not willing to be measured, they are asked to self-report. Respondents who are not physically able to participate in physical measurements (e.g. can not stand unassisted or are in a wheelchair), are asked to self report their height and weight.
9 Women’s health (WHC) Universe: Females aged 9 and up
Source: Questions WHC_Q03, WHC_Q04, WHC_Q05 and WHC_Q08 are adapted from previous CCHS Cycles. The remaining questions are new and developed specifically for CCHS Cycle 2.2. Overview: Nutritional needs of women and young girls vary at different stages of their lives. For instance, they need more folic acid when pregnant and more iron during the years when they are menstruating. This module collects information from female respondents about the age of their first period and whether they are pregnant, breastfeeding, or taking birth control pills.
10 Fruit and vegetable consumption (FVC) Universe: Age 6 months and over
Source: CCHS 2.1, “Fruit and Vegetable Consumption Module”. Note that in CCHS 2.1 this module applied to persons aged 12+, while in the Nutrition Survey it applies to persons aged 6 months and older.
Overview: This module includes questions about the respondent’s usual consumption of juice, fruit, and vegetables.
9
CCHS 2.2 - Nutrition: General Health & 24-Hour Dietary Recall Components – User Guide
Module Name/ Acronym
Source & Module Summary Description
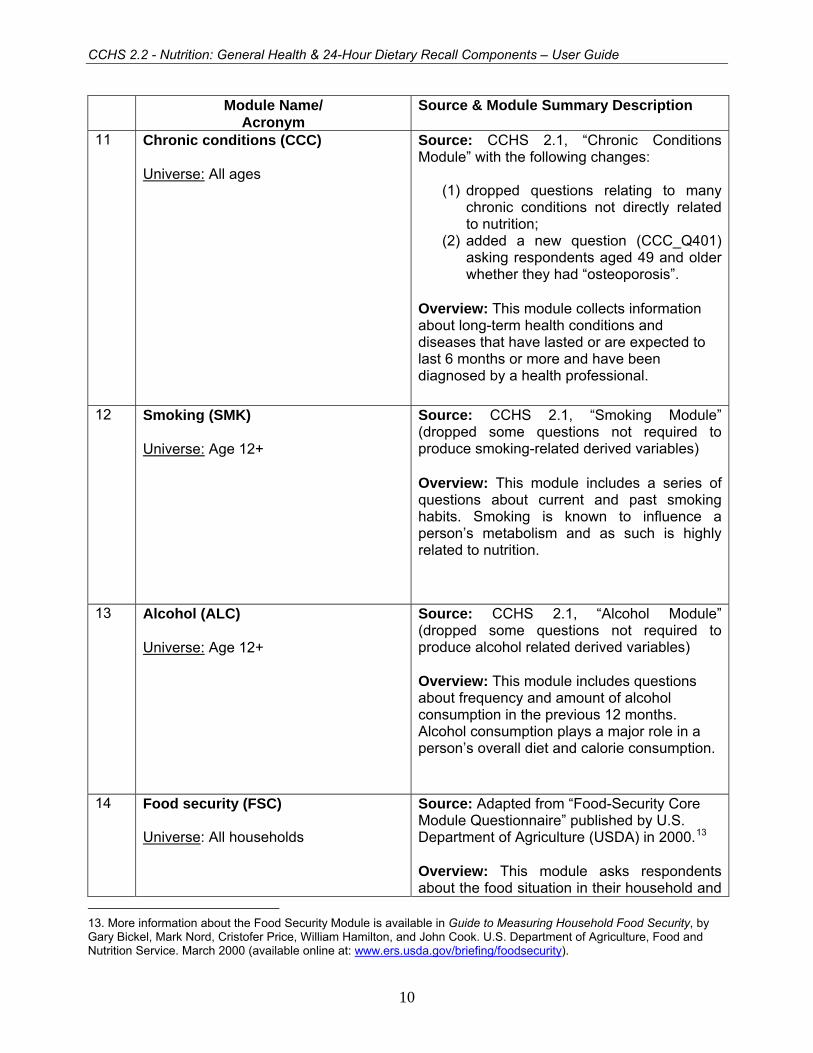
11 Chronic conditions (CCC) Universe: All ages
Source: CCHS 2.1, “Chronic Conditions Module” with the following changes:
(1) dropped questions relating to many chronic conditions not directly related to nutrition;
(2) added a new question (CCC_Q401) asking respondents aged 49 and older whether they had “osteoporosis”.
Overview: This module collects information about long-term health conditions and diseases that have lasted or are expected to last 6 months or more and have been diagnosed by a health professional.
12 Smoking (SMK) Universe: Age 12+
Source: CCHS 2.1, “Smoking Module” (dropped some questions not required to produce smoking-related derived variables) Overview: This module includes a series of questions about current and past smoking habits. Smoking is known to influence a person’s metabolism and as such is highly related to nutrition.
13 Alcohol (ALC) Universe: Age 12+
Source: CCHS 2.1, “Alcohol Module” (dropped some questions not required to produce alcohol related derived variables) Overview: This module includes questions about frequency and amount of alcohol consumption in the previous 12 months. Alcohol consumption plays a major role in a person’s overall diet and calorie consumption.
14 Food security (FSC) Universe: All households
Source: Adapted from “Food-Security Core Module Questionnaire” published by U.S. Department of Agriculture (USDA) in 2000.13 Overview: This module asks respondents about the food situation in their household and
13. More information about the Food Security Module is available in Guide to Measuring Household Food Security, by Gary Bickel, Mark Nord, Cristofer Price, William Hamilton, and John Cook. U.S. Department of Agriculture, Food and Nutrition Service. March 2000 (available online at: www.ers.usda.gov/briefing/foodsecurity).
10

CCHS 2.2 - Nutrition: General Health & 24-Hour Dietary Recall Components – User Guide
Module Name/ Acronym
Source & Module Summary Description
whether they were able to afford the food they needed in the previous 12 months. In this module, all questions have two characteristics in common: (1) Each question aims to assure that the reported condition or behaviour occurred due to household financial limitations by including phrases such as “because you and other adults in the household couldn’t afford that” or “because there wasn’t enough money for food.” (2) Each question asks whether the reported condition or behaviour occurred during the past 12 months. Note that this module is asked of a knowledgeable member of a household.
15 Socio-demographic characteristics (SDE) Universe: All ages
Source: CCHS 2.1, “Socio-Demographic Characteristics Module” with the following changes:
(1) in the Nutrition Survey, in order to meet the needs of a Health Canada sample buy-in to study the off-reserve First Nations population, a new response category of “Aboriginal” was added to Question SDE_Q7 (People living in Canada come from many different cultural and racial backgrounds. [Are/Is] [you/he/she]:). In addition, a new follow-up question (SDE_Q7B) was added for respondents who identified themselves as “Aboriginal” when answering Question SDE_Q7. The follow-up question asks Aboriginal respondents whether they are North American Indian, Métis, or Inuit.
(2) dropped questions about “sexual
orientation” and “participation in wartime services”.
Overview: This module includes questions about immigrant status, country of birth, ethnic origin, language, and school or university attendance.
11

CCHS 2.2 - Nutrition: General Health & 24-Hour Dietary Recall Components – User Guide
Module Name/ Acronym
Source & Module Summary Description
16 Labour force (LBF) Universe: Age 15 – 75
Source: CCHS 2.1, “Labour Force Module” (dropped some questions not required to produce Labour Force related derived variables) Overview: The “Labour Force” module includes questions about the respondent’s labour force activities in the past year, including job attachment, job search, and hours and weeks worked.
17 Income (INC) Universe: All ages
Source: CCHS 2.1, “Income Module” Overview: This module includes a series of questions about household income (i.e. total income before taxes and deductions of all household members) and personal income.
18 Administration (ADM) Universe: All ages
Source: CCHS 2.1, “Administration Module” (dropped some questions in the Nutrition Survey).
Overview: In this last module, respondents were asked to provide their provincial health card number in order to link their survey information to their provincial health information (if the respondent gave permission to link). Also, permission was asked to share the respondent’s information with Health Canada and the provincial ministries of health.
12

CCHS 2.2 - Nutrition: General Health & 24-Hour Dietary Recall Components – User Guide
4.2 “24-Hour Dietary Recall” component The 24-hour dietary recall is the main component of the CCHS 2.2 survey. This component uses an innovative computer-assisted interviewing instrument called the Automated Multiple-Pass Method (AMPM), which helps respondents remember and report the foods they consumed during the 24-hour period prior to the interview, from midnight to midnight. AMPM consists of a specialized software program originally developed by the United States Department of Agriculture (USDA) for collecting food intake information. In collaboration with Health Canada, the application was updated to account for differences in foods available to Canadian consumers, as well as differences in food preparation and in ethnic foods consumed. The adapted version of AMPM, which was used in the 24-hour dietary recall component of the CCHS 2.2, was composed of five steps. Each step was designed to help keep respondents interested and engaged in the interview process, and to help them remember all the foods and beverages they consumed during the previous 24-hour period. The five-step interview process consists of:
1. Quick List: The Quick List step is designed to get a quick collection of easily remembered foods, including snacks and water. In this step, the respondent reports a listing of all foods and beverages consumed in a 24-hour period during the day before the interview in any order he/she wishes (without being interrupted by the interviewer). That is, the respondent is free of the burden of reporting the foods in a chronological order, so his/her mind can be free to reflect on the foods actually eaten.
2. Forgotten Foods: This step is designed to collect foods that may have been forgotten
during the “Quick List” step. The respondent answers a series of questions probing for forgotten foods from nine categories: non-alcoholic beverages, alcoholic beverages, sweets, savoury snacks, fruits, vegetables, cheese, breads and rolls, and any other types of foods.
3. Time and Occasion: The respondent reports the time he/she began eating or drinking
each of the reported foods and what he/she would call the eating occasion (e.g. breakfast, lunch) - as defined by the respondent - for this food. These questions are designed to help the respondent remember and report his/her eating patterns over the past 24-hour period, as well as to group together the foods eaten at the same time.
4. Detail Cycle: This step is reserved for more difficult and detail-oriented questions, carefully
executed by the interviewer after having developed a rapport with the respondent. The respondent answers standardized questions to probe for detailed information about each food and beverage reported in the earlier steps. The questions include probes for: food descriptions, food amounts, additions to the foods, and preparation methods. A "Food Model Booklet" is used as the main measuring guide to help the respondent describe the size or amount of the food consumed. The booklet contains pictures of various sizes of glasses, mugs, bowls, mounds/pats/spreads, and circles. In addition, it includes a grid, two wedges, and a page of shapes and chicken pieces. Reviews of eating occasions and times between occasions are included in this step to elicit forgotten foods. Once information about the eating occasion is complete, then the respondent is asked where the meal was prepared.
5. Final Review: A final probe is administered to collect additional foods that may have been consumed, but not remembered or mentioned earlier during the interview.
13
CCHS 2.2 - Nutrition: General Health & 24-Hour Dietary Recall Components – User Guide
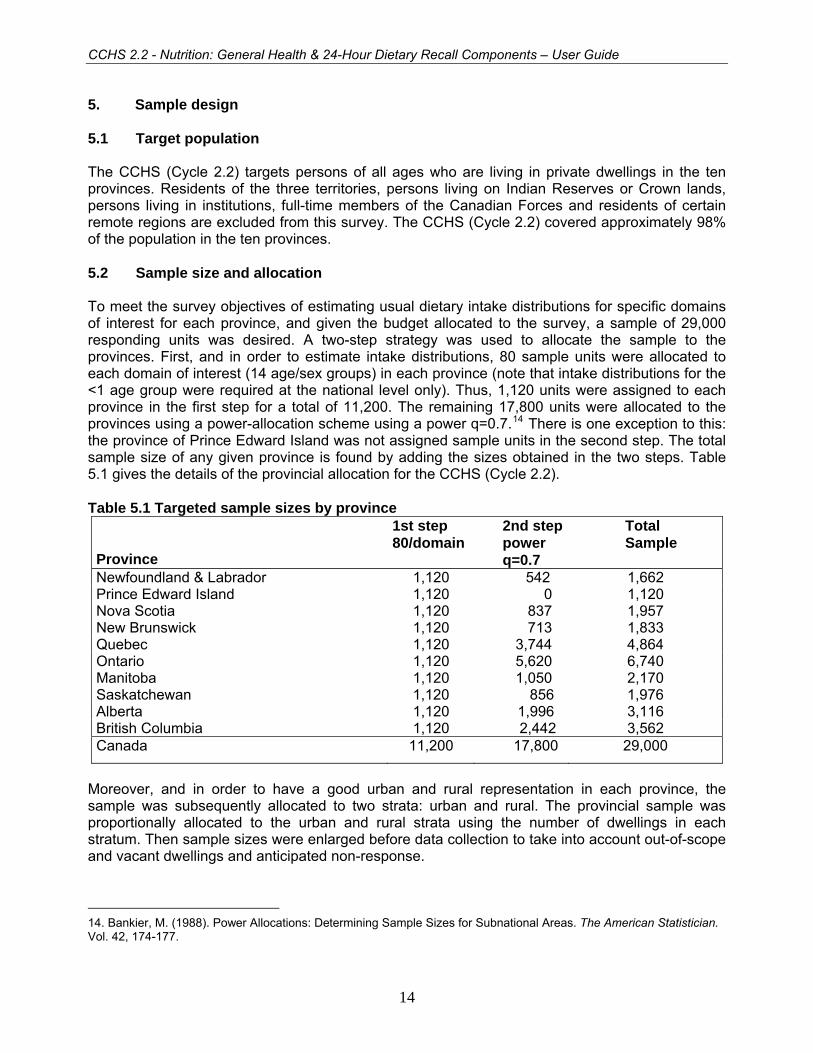
5. Sample design 5.1 Target population The CCHS (Cycle 2.2) targets persons of all ages who are living in private dwellings in the ten provinces. Residents of the three territories, persons living on Indian Reserves or Crown lands, persons living in institutions, full-time members of the Canadian Forces and residents of certain remote regions are excluded from this survey. The CCHS (Cycle 2.2) covered approximately 98% of the population in the ten provinces. 5.2 Sample size and allocation To meet the survey objectives of estimating usual dietary intake distributions for specific domains of interest for each province, and given the budget allocated to the survey, a sample of 29,000 responding units was desired. A two-step strategy was used to allocate the sample to the provinces. First, and in order to estimate intake distributions, 80 sample units were allocated to each domain of interest (14 age/sex groups) in each province (note that intake distributions for the <1 age group were required at the national level only). Thus, 1,120 units were assigned to each province in the first step for a total of 11,200. The remaining 17,800 units were allocated to the provinces using a power-allocation scheme using a power q=0.7.14 There is one exception to this: the province of Prince Edward Island was not assigned sample units in the second step. The total sample size of any given province is found by adding the sizes obtained in the two steps. Table 5.1 gives the details of the provincial allocation for the CCHS (Cycle 2.2). Table 5.1 Targeted sample sizes by province
Province
1st step 80/domain
2nd steppower q=0.7
Total Sample
Newfoundland & Labrador 1,120 542 1,662 Prince Edward Island 1,120 0 1,120 Nova Scotia 1,120 837 1,957 New Brunswick 1,120 713 1,833 Quebec 1,120 3,744 4,864 Ontario 1,120 5,620 6,740 Manitoba 1,120 1,050 2,170 Saskatchewan 1,120 856 1,976 Alberta 1,120 1,996 3,116 British Columbia 1,120 2,442 3,562 Canada 11,200 17,800 29,000
Moreover, and in order to have a good urban and rural representation in each province, the sample was subsequently allocated to two strata: urban and rural. The provincial sample was proportionally allocated to the urban and rural strata using the number of dwellings in each stratum. Then sample sizes were enlarged before data collection to take into account out-of-scope and vacant dwellings and anticipated non-response.
14. Bankier, M. (1988). Power Allocations: Determining Sample Sizes for Subnational Areas. The American Statistician. Vol. 42, 174-177.
14

CCHS 2.2 - Nutrition: General Health & 24-Hour Dietary Recall Components – User Guide
5.3 Provincial sample buy-ins Prior to the start of the data collection, the provinces of Manitoba, Ontario and Prince Edward Island provided extra funds so that a larger sample of dwellings could be selected. The purpose of these buy-ins was to get sufficient sample size in order to provide reliable estimates for sub-provincial areas for key domains of interest for Manitoba and Ontario. For Prince Edward Island the purpose of the buy-in was to increase the targeted number of respondents in 11 age/sex domains of interest (age/sex groups: 4-8 all, 9-13*M/F, 14-18*M/F, 19-30*M/F, 31-50*M/F and 51-70*M/F). Manitoba added 1,500 sample units, Ontario added 4,360 sample units while Prince Edward Island added 300 units. The province of Manitoba was divided into 4 regions. The allocation of the 3,670 units was performed in such a way to ensure a minimum number of 80 sample units for 6 age-sex domains of interest (age/sex groups: 1-3 all, 4-8 all, 9-13*M/F and 14-18*M/F) for each region. (Two of these regions have been combined on the public use microdata file due to their small population size. See page 3 of Appendix E.) The province of Ontario was divided into 7 regions and the allocation of the 11,100 was performed to ensure a minimum of 80 sample units for 10 age/sex domains of interest (age/sex groups: 1-3 all, 4-8 all, 9-13*M/F, 14-18*M/F, 19-70*M/F and 71+*M/F) for each region. Table 5.2 gives the sample allocation by sub-provincial area for the provinces of Manitoba and Ontario. Table 5.2 Allocation by region for Manitoba and Ontario with buy-in Sub-provincial Area Sample Size Manitoba 3,670 Burntwood-Norman-Churchill 665 Assiniboine-Parkham-Brandon 825 N.Eastman-S.Eastman-Interlake-Central 955 Winnipeg 1,225 Ontario 11,100 Southwest 1,600 Central South 1,500 Central West 1,700 Central East 1,600 Toronto 1,600 East 1,600 North 1,500
15

CCHS 2.2 - Nutrition: General Health & 24-Hour Dietary Recall Components – User Guide
5.4 Sampling of households from the various sample frames The CCHS (Cycle 2.2) used various frames to select the sample of households from which different sampling strategies were used. Those sample frames are:
• an area frame, • a list frame of CCHS (Cycle 2.1) dwelling addresses and • a list frame of dwelling addresses created from the Manitoba and Prince Edward Island
Healthcare registries. 5.4.1 Sampling of households from the area frame The CCHS (Cycle 2.2) primarily used the area frame designed for the Canadian Labour Force Survey (LFS) to select the sample of households. The sampling plan of the LFS is a multistage stratified cluster design in which the dwelling is the final sampling unit.15 In the first stage homogeneous strata were formed and independent samples of clusters were drawn from each stratum. In the second stage dwelling lists were prepared for each cluster and dwellings, or households, were selected from the lists. For the purpose of the plan, each province is divided into three types of regions: major urban centres, cities and rural regions. Geographic or socio-economic strata are created within each major urban centre. Within the strata, between 150 and 250 dwellings are regrouped to create clusters. Some urban centres have separate strata for apartments or for census enumeration areas (EA) in which the average household income is high. In each stratum, six clusters or residential buildings (sometimes 12 or 18 apartments) are chosen by a random sampling method with a probability proportional to size (PPS), the size of which corresponds to the number of households. The number six was used throughout the sample design to allow a one-sixth rotation of the sample every month for the LFS. The other cities and rural regions of each province are stratified first on a geographical basis, then according to socio-economic characteristics. In the majority of strata, six clusters (usually census EAs) are selected using the PPS method. Where there is low population density, a three-step plan is used whereby two or three primary sampling units (PSU), which normally correspond to groups of EAs, are selected. Each PSU is then divided into clusters, six of which are sampled. The selection is made at each step using the PPS method. Once the new clusters are listed, the sample is obtained using a systematic sampling of dwellings. Table 5.3 gives an overview of the types of PSUs used for the entire LFS sample. The yield is the number of households selected within the framework of the LFS for a given month. As the sampling rates are determined in advance, there is frequently a difference between the expected sample size and the numbers that are obtained. The yield of the sample, for example, is sometimes excessive. This especially happens in sectors where there is an increase in the number of dwellings due to new construction, for example. To reduce the cost of collection, any excessive output is corrected by eliminating, from the beginning, a part of the units selected and by modifying the weight of the sample design. Such an operation, usually conducted at an aggregate level, is called sample stabilization. Moreover, one increases the required size of the sample by households to account for vacant or out-of-scope dwellings, experience having shown that 12% of all dwellings are not occupied by households that are part of the field of observation
15. Statistics Canada (1998). Methodology of the Canadian Labour Force Survey. Statistics Canada. Cat. No. 71-526-XPB.
16

CCHS 2.2 - Nutrition: General Health & 24-Hour Dietary Recall Components – User Guide
(certain dwellings are vacant or occupied seasonally, others are occupied by households that are not targeted by the survey).
Table 5.3 Major first-stage units, sizes and yields
Area
PSU Size
(households per PSU)
Yields (sampled
households) Toronto, Montréal, Vancouver Cluster 200-250 6 Other cities Cluster 150-200 8 Apartment frame Apartment Varies 5 Most rural areas / small urban centres Enumeration area 300 10
Requirements specific to CCHS (Cycle 2.2) led to some modifications to this sampling strategy. To get a base sample of 23,400 respondents for CCHS (Cycle 2.2), 31,000 dwellings must be selected from the area frame (to account for vacant dwellings and non-responding households). On an on-going monthly basis the LFS design provides approximately 68,000 dwellings distributed across the various economic regions in the ten provinces, whereas the CCHS (Cycle 2.2) required a total of 31,000 dwellings distributed in the urban and rural strata of all provinces or regions (for Manitoba and Ontario), which have different geographic boundaries from those of the LFS economic regions. Overall, the CCHS (Cycle 2.2) required a lower number of dwellings than those generated by the LFS selection mechanism, or an adjustment factor of 0.45 (31,000/68,000). At the urban/rural level in provinces or regions, however, the adjustment factors varied from 0.25 to 3.0, which required certain adjustments.
The changes made to the selection mechanism in regions varied depending on the size of the adjustment factors. For regions that had a factor smaller than or equal to 1, the number of PSUs selected was reduced if necessary. For example, if the factor was 0.5 then only 3 PSUs were selected in each stratum instead of the usual number of 6 PSUs. For those with a factor greater than 1, the sampling process of dwellings within a PSU was repeated for a subset of the selected PSUs that were part of the same region. For example, if the factor was 1.6 then the selection of dwellings within a PSU was repeated for 4 of the 6 PSUs in all strata in that region. When a repeated selection of dwelling within a PSU was necessary and no more dwellings were available in that PSU, then another PSU was selected. Where the chosen approach created an unnecessary surplus of dwellings, stabilisation was performed. 5.4.2 Sampling of households from the list frame of CCHS (Cycle 2.1) dwellings In order to ensure the minimum sample in each age/sex group and especially for the younger age groups, the area frame was supplemented with a secondary frame in all provinces but Manitoba and Prince Edward Island. The secondary frame was necessary because it would have been difficult to find a sufficient number of households with young persons from the area frame as household-level information was not available prior to data collection. This secondary frame was created using the household information of respondents from the regional component of the CCHS (Cycle 2.1) which started its 12-month data collection in January 2003. Households in which there was at least one individual aged 18 or less at the time of CCHS (Cycle 2.1) data collection became part of a list of dwelling addresses. That list of dwelling addresses was then used to supplement the area frame sample of households to increase the probability of finding households with individuals aged 18 or less. It is of importance to mention that the majority of dwelling addresses used to create the list frame came from the area frame portion of the CCHS (Cycle 2.1); only a few dwellings addresses came from the telephone frame portion. The list was then stratified by
17

CCHS 2.2 - Nutrition: General Health & 24-Hour Dietary Recall Components – User Guide
province and urban/rural zone (Ontario was stratified by region instead of an urban and rural indicator), and a sample of municipalities and/or cities was selected at the first stage using a probability-proportional-to-size systematic strategy. A sample of dwelling addresses was then systematically selected at the second stage. To get a base sample of 11,000 responding households, approximately 16,500 dwellings must be selected from the list frame to account for vacant dwellings and non-response. 5.4.3 Sampling of households from the provincial healthcare registries Because of the provincial sample buy-ins and in order to ensure the minimum sample in each age/sex group, especially in younger age groups, the area frame was supplemented with a different secondary frame in Manitoba and Prince Edward Island. The different secondary frame was necessary because there were not enough households with young persons from the "area frame" portion of CCHS (Cycle 2.1) sample to meet the sample buy-in objectives. This secondary frame was created using the household information of health insurance cardholders as provided to Statistics Canada by the Manitoba and Prince Edward Island Ministries of Health. The two ministries provided a list of dwelling addresses along with the household composition living at these dwellings in terms of number of individuals per key age groups. Households in which there was at least one individual aged 18 or less became part of a list of dwelling addresses. That list of dwelling addresses was then used to supplement the area frame sample of households to increase the probability of finding households with individuals aged 18 or less. The list was then stratified by region in Manitoba and urban/rural zone in Prince Edward Island, and a sample of municipalities and/or cities was selected at the first stage using a probability-proportional-to-size systematic strategy. A sample of dwelling addresses was then systematically selected at the second stage. To get a base sample of 1,900 responding households, approximately 3,000 dwellings must be selected from the list frame to account for vacant dwellings and non-response. 5.5 Sampling of respondents Selection of individual respondents was designed to reach the targeted number of respondents in all domains of interest in each province and/or region.16 The selection strategy was designed to consider user needs, cost, design efficiency, response burden and operational constraints. For the CCHS (Cycle 2.2), it was decided to select one person per household using varying probabilities of selection that vary by age and by sampling frame. Several scenarios using various parameters were simulated with the objective of identifying an optimal approach that would guarantee the minimum number of individuals in each domain of interest in each province and/or region without generating extreme sampling weights at the end. Table 5.4 gives by age and by sampling frame the selection weight multiplicative factors used to determine the probabilities of selection of individuals in sampled households. As an example, for a three-person household selected from the area frame (two 31+ adults and one 15-year-old), the teenager had 3 times more chances of being selected than the adults. The person-level sampling strategy as described above combined with the household-level sampling strategy using two frames provided the minimum number of 80 responding units per domain of interest for almost all provinces and/or regions.
16. Pierre, F. and Béland, Y. (2004). Sélection des personnes dans l’Enquête Canadienne sur la Nutrition. 2004 Proceedings of the Survey Methods Section. Hamilton: Statistical Society of Canada.
18

CCHS 2.2 - Nutrition: General Health & 24-Hour Dietary Recall Components – User Guide
Table 5.4 Relative probabilities of selection for person-level sampling strategy by age by frame
Frame Selection weight multiplicative factor for selection
< 1 1-3 4-8 9-13 14-18 19-30 31+ Area 1 3 3 3 3 3 1 List 1 2 1 1 1 0 0
5.6 Sample allocation over the collection period
In order to balance interviewer workload and to minimize possible seasonal effects on certain key characteristics, the initial sample of dwellings was allocated at random, within each region, over the 11 months of data collection (the 12th month is generally used to try, one last time, to encourage non-respondents to participate in the survey). For operational constraints, all dwellings of a PSU selected from the area frame were assigned to the same collection period (Q1: January to March 2004, Q2: April and May 2004, Q3: June to August 2004 and Q4: September to November 2004). It is also important to mention that data collection continued until late January 2005 in order to improve response rates. 5.7 Special buy-in sample by Health Canada In addition to the three provincial buy-ins described earlier, Health Canada provided extra funds so that a larger sample of off-reserve aboriginals could be interviewed in order to obtain national-level intake distributions for 4 age-sex domains of interest (19-30*M/F and 31-50*M/F). To reach the minimum number of 80 respondents per domain of interest an additional 980 sample units were allocated to the 10 provinces and added to the regular CCHS (Cycle 2.2) sample. Those 980 extra sample units were selected from a separate list frame created using the CCHS (Cycle 2.1) area frame sample in the ten provinces. This frame was created using the household information of respondents from Cycle 2.1, which started its 12-month data collection in January 2003. Households for which the selected respondent reported being aboriginal in CCHS (Cycle 2.1) became part of a list of dwelling addresses which was then used to increase the probability of finding households with aboriginals (in fact, the list contained 980 addresses). The person-level sampling strategy applied for this portion of the sample is the one described in Section 5.5. The reader should, however, note that the variable “aboriginal status” has been removed from the Public Use Microdata File for confidentiality purposes. This variable can only be accessed through the use of the master file which resides at Statistics Canada and in the Regional Data Centres or through the use of the share file in the provincial Ministries of Health, at Health Canada and at the Public Health Agency of Canada. 5.8 Assessing the intra-individual variability In order to assess the within-person variation in an individual’s nutrient intake data which occurs naturally due to the day-to-day variety in people’s food intake in industrialised countries, a second 24-hour dietary recall measure was collected on a subsample of 10,150 individuals in order to allow for adjusting the intake distributions. The subsample size was allocated to the 10 provinces in such a way that there would be a minimum number of second recalls in all 14 age-sex domains of interest to allow for the adjustments. Those individuals were re-contacted 3 to 10 days after the first interview for a 30-minute interview conducted over the phone (only the 24-hour recall module was administered).
19

CCHS 2.2 - Nutrition: General Health & 24-Hour Dietary Recall Components – User Guide
Note: The within-person variation increases the variance of the distribution of observed intakes17 which harms the estimation of the population “at risk” (end tails of the intake distributions). This is because it includes both the within-person (day-to-day) variation and the individual-to-individual variation, thus leading to estimates of inadequacy or excess that are likely to be higher than the true prevalence. As it is important for this survey to get accurate prevalence estimates of the populations at risk in terms of several nutrients for more in-depth studies, the distributions of observed intakes must be adjusted to more closely reflect only the individual-to-individual variability in intakes.
17. Nusser, S.M., Carriquiry, A.L., Dodd, K.W. and Fuller, W.A. (1996). A Semiparametric Transformation Approach to Estimating Usual Daily Intake Distributions. Journal of American Statistical Association. 91: 1440-1449.
20

CCHS 2.2 - Nutrition: General Health & 24-Hour Dietary Recall Components – User Guide
6. Data collection Data for Cycle 2.2 of the CCHS were collected between January 14, 2004 and January 21, 2005. Data collection was divided into four quarters:
Quarter 1 January 1 – March 31, 2004 Quarter 2 April 1 – May 31 Quarter 3 June 1 – August 31 Quarter 4 September 1 – January 21, 2005
6.1 Questionnaire design The Cycle 2.2 questionnaire was administered using a computer-assisted interviewing (CAI) application. CAI offers a number of data quality advantages over other collection methods. First, question text including reference periods and pronouns is customised automatically based on factors such as the age and sex of the respondent, the date of the interview, and answers to previous questions. Second, edits to check for inconsistent answers or out-of-range responses are applied automatically and on-screen prompts are shown when an invalid entry is recorded. In this way, immediate feedback is given to the interviewer so that he/she is able to correct any inconsistencies. Third, questions that are not applicable to the respondent are skipped automatically. 6.2 Field test The draft questionnaire was tested during a field test conducted from June 1st to July 7th of 2003. The test was conducted in the Atlantic provinces, Quebec, and British Columbia using a sample of 700 units. The main objectives of the field test were to:
• assess the overall length of the survey and individual sections of the questionnaire; • evaluate respondents’ reactions to all survey questions; • test the willingness of respondents to participate in a second 24-hour dietary recall over the
telephone; • assess protocols and responses related to the collection of measured height and weight; • assess the effectiveness of field operation procedures, interviewer training and the
computerized interviewing application. 6.3 Collection personnel (training, supervision and control) For CCHS 2.2, interviewers received 3.5 days of training to ensure that they had a proper understanding of the survey concepts and procedures. The training was given by the survey collection manager or senior interviewer. This included reviewing the Interviewer’s Manual, completing mock interviews, answering test questions posed by senior interviewers and discussing any data collection issues. During data collection, interviewers reported to senior interviewers who were responsible for ensuring that interviewers were familiar with the survey concepts and procedures. The senior interviewers ensured that prompt follow-up action was taken for refusal and other non-response cases. If necessary, non-response cases were transferred to a senior interviewer and reassigned. The senior interviewers in turn reported to collection managers located at Statistics Canada’s Regional Offices.
21

CCHS 2.2 - Nutrition: General Health & 24-Hour Dietary Recall Components – User Guide
The completed interviews were transmitted daily to Statistics Canada’s Head Office using a secure telephone transmission directly from the interviewer’s home. The completed interviews were verified for accuracy at Head Office and any inconsistencies were communicated back to the interviewers on an ongoing basis. 6.4 Data collection method Data collection began in January 2004 and was conducted over 12 months. This helped balance interview workload and minimize seasonal effects on certain health-related characteristics, such as physical activity and variation in food availability due to season. At the initial contact, interviewers visited all selected dwellings. The first part of the interview involved a listing of all household members which included the collection of relationship information between household members (i.e. mother, father, brother, sister etc.) as well as gathering basic demographic characteristics such as age, sex, date of birth, marital status and dwelling information. Once the basic household information was collected, one household member was randomly selected to be the survey respondent. Only one member of each household was chosen to participate in the survey. Once a respondent had been selected, interviewers were instructed to administer the questionnaire directly to the selected respondent. The first interview with the selected respondent consisted of two components: the “24-hour dietary recall” and the “general health questionnaire”. Interviewers were instructed to conduct the first interview in person in the respondent’s home. Approximately 30% of respondents were also asked to complete a second 24-hour dietary recall over the phone, within 3 to 10 days after the initial interview. In-person interviews were accepted for the second interview in rare circumstances where the respondent did not have a phone or preferred to do the interview in person. In the provinces of Quebec and British Columbia a subset of second interviews were intentionally conducted in person to allow for the analysis of potential bias in the second interview due to mode of collection. The overall length of the first interview including the 24-hour recall component was on average about 60 minutes. The second recall interview was on average approximately 30 minutes in length. Note that when the selected respondent was not available at the time of the visit, interviewers were instructed to return at a later date. Every effort was made to conduct the first 24-hour dietary recall interview in person. Collection by telephone was authorized only when travel costs were prohibitive or the respondent absolutely refused to conduct the interview in person. The variable ADMD_N09 indicates whether the interview was conducted in person, over the telephone or using a combination of the two techniques. In the end, 7% of respondents had their first 24-hour dietary recall interview completed over the telephone. 6.5 Proxy interviews The questionnaire was designed to be answered by the selected respondent. However, a proxy interview was required in cases where the respondent was aged 11 or under. For children under the age of 6, the parent was the only person providing the information. It was felt that for children of this age group, parents had much more control over what their children ate. In the instances where parents could not provide the details, such as meals eaten at a daycare, parents were asked to contact the persons responsible to fill in the details as much as possible. For children
22

CCHS 2.2 - Nutrition: General Health & 24-Hour Dietary Recall Components – User Guide
aged 6 to 11 the interview was conducted with assistance from the parent (see the following table for a summary of the type of interview conducted according to the respondent’s age). The variable ADMD_PRX indicates whether or not the interview was conducted with a proxy. Table 6.1 Proxy interview types
Age of selected respondent Interview type
0-5 years
Proxy • The parent or guardian was asked to provide the child’s
nutritional information. • The child did not have to be present for the interview. • If the child was available, the parent or guardian was
asked to help take the child’s height and weight measurements.
6-11 years
Parent-assisted proxy • The child was asked to provide his/her own data with the
help of his/her parent or guardian. • The child did not have to be present during the entire
interview, but he/she had to be present for the 24-dietary recall component.
• The child’s height and weight were measured by the interviewer, once the parent’s permission was granted.
12 and up
No proxy • Respondents were asked to provide their own information. • Respondents aged 12 to 17 had their parent or guardian
answer the modules on: Income, Food Security, and data sharing and linking agreements.
6.6 Minimising non-response Prior to the first contact by an interviewer, an introductory letter and brochure were delivered to each selected dwelling with a valid mailing address. These documents explained the importance of the survey and provided examples of how the collected data would be used. Interviewers were instructed to make all reasonable attempts to obtain a completed interview. When the timing of the interviewer's visit was inconvenient, an appointment was made to visit at a more convenient time. If no one was at home, numerous call-backs were made. For individuals who at first refused to participate in the survey, a letter was sent from the nearest Statistics Canada’s Regional Office to the respondent, stressing the importance of the survey and the household's collaboration. This was followed by a second call (or visit) from a senior interviewer or another interviewer to convince the respondent of the importance of participating in the survey. During the final months of the data collection, non-response cases and selected persons who had previously refused were again approached and encouraged to participate in the survey. This diligence in contact resulted in stronger survey results by maximising the response rate. To reduce the impact of language as a barrier to conducting interviews, each of the Statistics Canada’s Regional Offices recruited interviewers with a wide range of language competencies. In
23

CCHS 2.2 - Nutrition: General Health & 24-Hour Dietary Recall Components – User Guide
instances where an interviewer could not speak the same language as the respondent, a member of the household (if available) was allowed to translate the survey questions and the responses. To ensure that data quality was maintained during collection, a monitoring system was put in place. Various aspects related to the interview process were monitored at the interviewer level such as average interview time and non-response items. Regular weekly feedback from Head Office to the regional offices helped maintain and correct problems as they occurred. A validation process was also put in place in the field to monitor the quality of the work performed by the interviewers. At the end of the data collection, a national response rate of 76.5% was achieved. Detailed information about response rates is available in the section titled “Data Quality”. 6.7 Special circumstances during data collection 6.7.1 Measuring height and weight Previous cycles of CCHS collected self-reported information on respondent’s height and weight. Studies have shown that with this approach, people have a tendency not to report the information accurately. For the first time, it was with Cycle 2.2 that after getting permission to proceed, interviewers measured the respondent’s height and weight following a standard protocol using a scale and a measuring tape. Interviewers were trained to explain all procedures to the respondent before beginning the measurements. If respondents aged 12 and over were not willing to be measured by the interviewer, they were asked to self-report their height and weight. In cases where respondents were not physically able to participate (e.g. in a wheelchair or requiring mobility aids to stand), they were asked for self-reported measurements. For respondents aged 2 to 11, if they or their parent were not willing to allow physical measurements, a parent’s report of the child’s height and weight was accepted. Note that information about height and weight was not collected for respondents aged less than 2 years. In order to ensure accuracy and consistency among the height and weight measures several procedures were put in place. First, high quality scales were used. They did not require calibration, were easy to use and very accurate considering their portability (50 grams). Measuring height was a slightly more complicated procedure. Due to the constraint that interviewers were not trained health professionals, the procedure had to be non-technical and non-invasive. The procedure was developed with experts in the field to meet this objective. A training video was developed to ensure consistency among interviewers across the country. Further, to ensure consistency among interviewers a test requiring interviewers to measure the same test subject was conducted after each training session. Any discrepancies between interviewers were addressed at that time and retraining took place if required. All height and weight measurements were also monitored throughout collection to assess the need for further training. A complete description of the protocols followed by interviewers when measuring height and weight is provided in the table below.
24

CCHS 2.2 - Nutrition: General Health & 24-Hour Dietary Recall Components – User Guide
Procedures for height and weight measurements General procedures: 1 - All procedures should be explained to the respondent before beginning, 2 - Do not read the measurement out loud. If the respondent requests the measurement, you can then report it to them. 3 - When taking measurements, stand to the side and slightly away from the respondent. Lean in to take measurement, always allowing the respondent to maintain his/her ‘personal space’. Never stand directly in front of, or behind a respondent. Weight measurement procedures: Tool(s): Scale and ¼ inch thick solid plastic board Place the scale on the solid plastic board on an even surface for weight measurement. If possible the surface should not be carpeted. Always reset the scale by pressing the button located on the front of the scale. This can be set with the tip of your toe. Wait until the display is 0.000 and in the top left corner of the scale a small “0” appears. Once both are visible, you are ready to weigh the respondent. Note: If the scale displays anything other than “0.000” when resetting, this means the batteries are low. Each interviewer will be provided with one extra set of batteries in case the original set does wear out. Height measurement procedures: Tool(s): Measuring tape, ¼ inch thick solid plastic board, triangular marking board, post-it paper, and pencil/pen. 1 - Take the height measurement in a room with a smooth surface (no carpet or thinnest carpet). 2 - Set the solid plastic board against flat wall. Try to avoid baseboards if possible. 3 - Place post-it note on wall at approximately the respondent’s height. 4 - Respondent is asked to (preferably without footwear and hats):
- Stand erect and arms hanging at sides; - Feet together; - Heels and back in contact with wall; - Look straight ahead; - Stand as tall as possible; - Tuck in chin; - Take a deep breath while the measurement is taken.
5 - Using the marking board, place it against the wall and lower it until it depresses the hair and makes firm contact. 6 - Ensure the bottom of the marking board is parallel to the floor. 7 - Mark with a pencil at the lowest point where the marking board meets the post-it note. 8 - Ask the respondent to step away from the wall so that you can measure the distance from the floor to the mark on the post-it note. 9 – Using the tape measure extend it to the plastic board and record the measurement at the mark to the nearest 0.5 cm. 10 – Ensure that the tape is vertical with the wall and does not bend when it touches the floor.
25

CCHS 2.2 - Nutrition: General Health & 24-Hour Dietary Recall Components – User Guide
6.7.2 Vitamin and mineral supplement data collection The vitamin and mineral supplements module of the general health component collected detailed information on supplements consumed by a respondent (up to a maximum of ten). Respondents were asked to provide the bottle or package of each of their supplements, and, if possible, the Drug Identification Number (DIN) found on the package was recorded. The computer assisted interviewer (CAI) application was equipped with a copy of the September 2003 Drug Product Database (DPD), so that the DIN entered by the interviewer could be immediately checked on the DPD. If the DIN entered was found in the database, the brand name associated with that DIN was automatically filled into question VMDD_N2 to be confirmed by the interviewer. If the DIN was not found in the database, the interviewer recorded the name of the product and up to two ingredients and their concentrations. For each supplement, respondents were also asked the frequency of its consumption in the past month (number of times per day, week, or month), the number of times they took a supplement on each day it was consumed (for respondents reporting weekly or monthly consumption) and the amount of the supplement consumed each time (e.g. 3 tablets per occasion). 6.7.3 24-hour dietary recall interview application The 24-hour dietary recall is the main component of the CCHS 2.2 survey. This component uses a computer-based interviewing application called Automated Multiple-Pass Method (AMPM). This computerized food data collection instrument was originally developed by the United States Department of Agriculture (USDA). Through consultation with Health Canada’s nutrition experts, the AMPM was translated into French and adapted to collect data for Canadian foods. The AMPM was written using the Blaise programming language which is used widely in North America for authoring data collection instruments. The AMPM includes an extensive compilation of standardized food-specific questions and possible response options. It features an automated routing of questions based on previous answers. This interview application uses a five-step system to guide respondents through a 24-hour reference period of food intake. The application provides different opportunities for respondents to recall all foods, including beverages, consumed during the 24-hour period prior to the interview, from midnight to midnight. Details that affect the nutrient composition are also collected, such as additions to foods, food amounts, and cooking methods. For specific food items, the product brand names are also obtained. In addition, the information about the time the food was consumed, the eating occasion, and the location where it was prepared are recorded.18 A major advantage of using this AMPM application was that a trained nutritionist was not required to conduct the interview. However, this application was one of the most complex computer-based applications ever implemented in the field by Statistics Canada. To deal with the complexity of the application, much of the interviewer training focused around using the application and practising many scenarios possibly occurring in the field. Interviewers received 3.5 days of training before going out into the field.
18. Please refer to section 4.2 for additional information on AMPM.
26

CCHS 2.2 - Nutrition: General Health & 24-Hour Dietary Recall Components – User Guide
6.7.3.1 AMPM features for recording food details and amounts During the data collection, when using the AMPM interview application, the foods reported by respondents were selected from a file called the “Main Food List” (MFL) and recorded in a table called the “Respondent Food List” (RFL). The MFL is a master list of over 2,500 foods that automatically opens when the interviewer enters at least three letters of a food name. Frequency data from earlier US and Canadian provincial nutrition surveys were used to identify commonly eaten foods to place on the MFL. Because of the large number and the diversity of foods in Canada, many different “food detail questions” along with a very large number of possible response options for each question are included in the AMPM. Each response is programmed to automatically go to the next appropriate question.19 In the AMPM, to facilitate the link between the 2,500 MFL foods and the food detail questions, the foods were grouped into 132 food categories. A food category code attached to each food signals to the AMPM application the appropriate set of questions to ask in order to collect the detailed descriptions about the foods and beverages reported as well as the amounts eaten. For example, the application asks questions such as: “What kind was it?”, “What were the ingredients?”, “Was it fresh, canned, frozen, dried, cooked, or something else?” etc. In other words, depending on the food category, the AMPM application automatically probes the respondent for all the required information. For instance, if the respondent reported having a “toast for breakfast”, the following question would appear to collect the food details: “Was it white, wheat, whole wheat, rye, pumpernickel, multigrain or something else?” Following this type of probe questions are the quantity questions, such as “How many slices of this toast did you actually eat?” Note that the quantity question asks for the actual amount of the food item eaten, not the amount served. A respondent may report amounts of foods in many ways. Units for estimating the amount of food eaten vary with the type of food. Response options may include the following:20
• Volume measures: tablespoon, cup, fluid ounce, quart, millilitre, litre, etc. • Weight measures: ounce, gram, pound, etc. • Dimensions: length, width, height, diameter • General measures: relative sizes (small, medium, large),
container units (bottle, can, carton, juice box) • Specific measures for brand name foods • Food model measures contained in the Food Model Booklet.21
19. Raper, N., Perloff, B., Ingwersen, L., Steinfeldt, L., Anand, J. An overview of USDA’s Dietary Intake Data System. Journal of Food Composition and Analysis 17 (2004) 545-555. 20. Raper, N., Perloff, B., Ingwersen, L., Steinfeldt, L., Anand, J. An overview of USDA’s Dietary Intake Data System. Journal of Food Composition and Analysis 17 (2004) 545-555. 21. During the interview, when collecting the 24-hour dietary recall information, a "Food Model Booklet" is used as the main measuring guide to help the respondent describe the size or amount of the food consumed. The booklet contains pictures of various sizes of glasses, mugs, bowls, mounds/pats/spreads, and circles. In addition, it includes a grid, two wedges, and a page of shapes and chicken pieces.
27

CCHS 2.2 - Nutrition: General Health & 24-Hour Dietary Recall Components – User Guide
6.7.4 Interviewing children and youth In the previous CCHS cycles, the target population was respondents aged 12 and over. Cycle 2.2 is the first CCHS cycle that includes children under 12. Therefore, a series of guidelines were developed to facilitate interviewing children and youth. When interviewing youth (age 12 to 17), parents or guardians were provided with an introductory letter. The letter explained the purpose of collecting information from youth and the list of topics to be covered during the survey. Interviewers were instructed to obtain verbal permission from the parent/guardian to interview the selected youth. In cases where it was difficult to obtain privacy to interview the youth, the interviewer was instructed to propose to the parent/guardian that the interviewer read the questions out loud and have the child enter his/her answers directly on the computer. If privacy and confidentiality could not be respected, the case was to be coded as a refusal with a permanent note indicating that privacy/confidentiality could not be respected. Notice of the data sharing and linking agreement was given to all respondents. However, for children under the age of 18, it was the parent/guardian who was asked to give the consent. For young children (age 0 to 5), the interview was conducted with the parent only. Both the parent and child could provide answers when the selected respondent was aged between 6 and 11. More details on proxy interviewing can be found in section 6.5. 6.8 Privacy To ensure the quality of the data collected, every effort was made to conduct interviews in private. In some situations, the respondent allowed another person to be present. Flags on the data files22 indicate whether somebody other than the respondent was present during the interview (ADMD_N10) and whether the interviewer felt that the respondent’s answers were influenced by the presence of the other person (ADMD_N11).
22. These flags are available on the following two data files: HS (also called “General Health and 24-hour Dietary Recall” file) and HS_SIDE.
28

CCHS 2.2 - Nutrition: General Health & 24-Hour Dietary Recall Components – User Guide
7. Data processing 7.1 Editing The interview application program in the CCHS 2.2 is comprised of two distinct, yet complementary parts: (1) the general health component, which includes the vitamin and mineral supplements and (2) the 24-hour dietary recall component. 7.1.1 Editing of the “general health” data The “general health” component, as its name implies, collects information about the respondent’s general health status, including chronic conditions as well as health-related behaviours such as physical and sedentary activities, smoking habits, food insecurity and alcohol consumption. It also gathers information about the respondent’s physical height and weight along with his/her socio-demographic characteristics. The computer-assisted interviewing (CAI) application was used when collecting the “general health” data. This application was programmed in Blaise using an approach similar to the interview application program developed for other CCHS cycles. Most editing of the data for this component was performed at the time of the interview, where the CAI application prevented interviewers from entering out-of-range values. Flow errors were controlled through programmed skip patterns. For example, CAI ensured that questions which applied only to children were not asked of adult respondents. In response to some types of inconsistent or unusual reporting, warning messages were invoked but no corrective action was taken at the time of the interview. Where appropriate, edits were instead developed to be performed after data collection at the Head Office. Inconsistencies were usually corrected by setting one or both of the variables in question to “not stated”. 7.1.2 Editing of vitamin and mineral supplement data DIN edits Editing of the vitamin and mineral supplement DINs consisted of two stages. The first stage was done in the field by the interviewers by matching the DIN and product name on the packaging to the DIN and product name on their laptop version of the DPD. In a small number of cases, invalid DINs were returned to head office. These DINs were then sent for a second round of edits to correct the original DIN. Many of these cases involved the digits of the DIN being entered in an incorrect order or having Os entered instead of zeros. As well, products which were determined to be herbal supplements and those which contain vitamins and/or minerals other than those profiled, were removed from the data file. In cases where there was a DIN edit, the flag VMDDFDIN on the vitamin and minerals details (VMD) file is set to 2. Non-DIN edits The second group of edits consisted of non-DIN edits. Approximately 3% of records required a non-DIN edit. Cases were first examined to identify outliers. Cases where the amount of each nutrient consumed from a supplement was at least twice the average calculated in the British Columbia (for adults) and the Quebec (for children) provincial nutrition surveys were reviewed by nutrition experts.
29

CCHS 2.2 - Nutrition: General Health & 24-Hour Dietary Recall Components – User Guide
These non-DIN edits resulted in changes to the consumption pattern variables (VMDD_3, VMDD_N3, VMDD_4 and VMDD_5). In some cases, these records had repetitive responses that were likely due to the respondent misinterpreting the questions in the module. For example, some respondents reported very large numbers for both the number of units of supplements taken each time (VMDD_5) and the number of times the supplement was taken in a day (VMDD_3). These records were examined in closer detail to determine if the amount consumed was reasonable. Records for which the consumption pattern seemed unreasonable were edited. In cases where there was a non-DIN edit, the flag VMDDFEDT on the vitamin and minerals details (VMD) file is set to 2. 7.1.3 Calculation of supplement strength The vitamin and mineral description (VDC) file contains a record for each supplement, which includes the strengths of each nutrient contained in the supplement. These nutrient strengths are calculated by multiplying the amount of each ingredient as listed on the DPD by a content factor. The content factor describes how much of the nutrient is contained in that ingredient based on factors such as availability of the nutrient and its absorption. For example, the content factors representing the amount of iron contained in ferrous gluconate and the iron in ferrous sulfate will be different. In some cases, supplements may have several sources of a nutrient. In these cases the nutrient strength is calculated for each ingredient separately and then added together. From this calculation, nutrients are reported in standardized reporting units (for example, iron will always be reported in mg). Users should be aware that because of this calculation the ingredient strengths listed on product packaging or the DPD may not match the nutrient strengths listed on the VDC. The amount of each nutrient in a given supplement is presented on the VDC in terms of the dosage unit used on the DPD. The dosage unit is the combination of dosage (the measurement value e.g. 1, 5, 10) and the dosage form (e.g. tablet, mg, etc). For example, the dosage unit of an iron supplement could be 2 tablets daily. The dosage unit as it appears on the DPD is used to calculate nutrient strengths and may not match the recommended dosage unit found on the product package (which could vary according to the age of the consumer). The nutrient values on the vitamin and mineral details (VMD) file and the vitamin and mineral summary (VSD) file represent daily averages. More information on these calculations can be found in the derived variables documentation. 7.1.4 Editing of the “24-hour dietary recall” data The 24-hour dietary recall was designed to collect information on all foods and beverages consumed during the 24-hour period prior to the interview, from midnight to midnight. This component also employed a CAI application. However, this application is different in some aspects, as it has been adapted from a computer-based interviewing application called Automated Multiple-Pass Method (AMPM) developed by the United States Department of Agriculture (USDA). AMPM is a computerized food data collection instrument which has been widely used in the US nutrition surveys. For CCHS 2.2, the AMPM application was updated to better reflect the Canadian food standards and availability. The AMPM includes an extensive compilation of standardized food-specific questions and possible response options. During the data collection, incorrect entries were minimized due to the automated routing of questions and built-in edits contained in the AMPM. The following edit
30

CCHS 2.2 - Nutrition: General Health & 24-Hour Dietary Recall Components – User Guide
checks were also included in the AMPM to ensure the data quality and logical consistency of the food data:23
• an “eating occasion edit” was inserted to prevent the reporting of two different eating occasions at the same time (except for food items that were reported as “extended consumption”24);
• “impossible combination” check edits were inserted to prevent illogical response
combinations when multiple responses were allowed. For example, for the question about the type of potato chips, edits did not allow certain combinations of responses, such as “fat free” and “regular”;
• missing data edits reminded the interviewer that certain information had to be entered
before going to the next question. For example, if a respondent reported eating a green salad, but the interviewer did not enter any green vegetables (e.g. lettuce, spinach, etc.) as ingredients, then an edit would prompt him/her for a “greens” entry.
7.2 Minimum completion requirements One of the first steps in the CCHS 2.2 processing was to define the requirements for what was considered a responding household. In some cases, no information was collected for a sampled household. This happened, for example, when an interviewer was unable to make contact with a selected household for the entire collection period. In other cases, the household refused to participate in the survey. Special circumstances, such as an illness or death in a family, or extreme weather conditions also prevented some interviews from taking place. In such situations where there was no adequate information available, the household was dropped from the responding sample and treated as non-response. In some cases, it was possible to carry out some part of the interview, but a complete interview was not obtained for a variety of reasons. Some respondents were willing to give only a certain amount of time to the completion of the survey. In other cases, an interviewer completed a portion of the survey with the respondent and made an appointment to continue at another time but was unable to re-contact the respondent. In such situations, it was necessary to come up with criteria for deciding what to do with these “partial” interviews. For CCHS 2.2, it was decided that to qualify as a “partial interview”, the respondent must have completed the 24-hour dietary recall component as well as a minimum part of the general health questionnaire up to the end of the Food Security module. Anything less was considered a non-response – i.e. the household was dropped from the responding sample. The variable ADMD_STA indicates whether a case was partially or fully completed.
23. Raper, N., Perloff, B., Ingwersen, L., Steinfeldt, L., Anand, J. An overview of USDA’s Dietary Intake Data System. Journal of Food Composition and Analysis 17 (2004) 545-555. 24. For data collection, interviewers were instructed to encourage respondents to report eating occasions at distinct times if they could. However, the “extended consumption” occasion was used when an eating activity was virtually continuous without a distinct start or end OR when the respondent could more easily recall the total amount consumed as opposed to the specific times (for example, sipping cups of coffee from the same 8-cup pot).
31

CCHS 2.2 - Nutrition: General Health & 24-Hour Dietary Recall Components – User Guide
7.3 Coding of open-ended questions 7.3.1 Non-food related coding In the “general health” component of the questionnaire, pre-coded response categories were supplied for all suitable variables. In the event that a respondent’s answer could not be easily assigned to an existing response category, several survey questions allowed the interviewer to enter a long-answer text in the "Other-specify" category. All such questions with “Other-specify” entries were closely examined by the survey processing unit at Head Office. For example, the Question PSS_N2 (which is about reasons why the interviewer could not measure a respondent’s height and weight) contained a list of response categories that had "Other-specify" as the final category. These write-in answers were examined at the Head Office. They were either recoded or remained as “Other.” The recoding was done into already existing or specially created response categories. The new response categories of MHWD_N2I to MHWD_N2L were created for this question in response to information collected in this way. 7.3.2 Vitamin and mineral supplement coding Approximately one third of all reported vitamin and mineral supplement records were missing a DIN and had to be manually coded at head office. A much smaller proportion of records contained invalid DINs that had to be sent for editing. In total, almost 35% of records required manual DIN coding or editing. The database used to code supplement records that were missing DINs was different from the DPD database that was used by the interviewers during collection. It was a combination of the spring 2005 DPD and the Nutrition Survey System (NSS) database. The two databases were combined to create a more complete and accurate database for coding supplements that were missing DINs. In cases where a DIN was not provided by the respondent, the product description was used to match the supplement to a similar DIN. DINs were assigned based on the age and sex of the respondent. For example, if the respondent was a child then an age-appropriate DIN was assigned. If a single match still was not possible, then the most frequently reported DIN for that supplement type was assigned. In cases where the DIN was assigned during head office processing, the flag VMDDFDIN on the vitamin and minerals details (VMD) file is set to 2. Two additional supplements, which were not on the September 2003 version of the DPD, are included in these data: salmon oil and a children’s multivitamin. These two products were reported frequently enough to warrant their inclusion. Salmon oil was given a DIN of “1” and the DIN of the children’s multivitamin was taken from a more recent version of the DPD. 7.3.3 Food-related The 24-hour dietary recall component of the questionnaire includes a question about where the meal was prepared. If the answer was anything other than “home”, then the respondent was asked about the location. A number of pre-coded response categories allowed respondents to select locations such as “Restaurant with waiter/waitress”, “Take out”, “Cafeteria”, etc.25 25. For infants and children who were breast-fed, the location question was not asked because the concept of “location of food preparation” is not relevant to breast-feeding.
32

CCHS 2.2 - Nutrition: General Health & 24-Hour Dietary Recall Components – User Guide
In cases where the respondent’s answer could not be assigned to any existing response category, the interviewer had the option of entering a text response in the “Other-specify” category. After the data collection, these write-in answers were examined at Statistics Canada Head Office. They were either recoded or remained as “Other”. The recoding was done into already existing categories or specially created response categories. Consequently, the new response categories of “Grocery/corner/other types of store“(FIDD_LOT = 13) and “At work” (FIDD_LOT = 14) were created for this question. 7.4 NSS and food coding This section provides an overview of the NSS system and the CCHS 2.2 food coding process. During the CCHS 2.2 data collection, a total of 742,080 food items were reported by respondents. Almost 55% of those reported foods were auto-coded (411,782) and the remaining 45% (329,577) were manually coded. 621 food items could not be coded. 7.4.1 Automated food coding The 24-hour dietary recall component of the CCHS 2.2 survey questionnaire collected information about everything that a respondent ate or drank within a 24-hour period. The food interview data files were imported into an in-house computer-based system developed by Statistics Canada to automatically code food items reported by respondents and assign them a Nutrition Survey System (NSS) food code. The NSS is a food and nutrient database system developed by Health Canada which contains food descriptions and associated food codes as well as the nutrient profiles for each food item (for more information about the NSS, see sub-section 7.4.5.) The in-house automated food coding system was applied to the responses to the detailed food questions. It was determined that one NSS food code could be automatically assigned to a set of responses to the food-related questions. The correspondence between the set of responses and the assigned NSS food code was verified with Health Canada prior to implementation. Assigning food codes automatically saves time and increases the data quality by eliminating potential coding inconsistencies. 7.4.2 Manual food coding In the CCHS 2.2, not all reported foods could be auto-coded by the in-house automated food coding system. Therefore, experienced data entry clerks supervised by a nutritionist manually coded foods or beverages that were not coded automatically. The most time-consuming step in this survey was the manual food coding which began in May 2004 and was completed in late 2005. For food items that were left uncoded, Statistics Canada developed another in-house computer-based system to carry out the manual food coding. This system, using the NSS food data files, allowed the examination of the responses to the food questions and finding a match from the NSS food database. Manual coding of the uncoded food items involved a multi-step process. First, a coder typed a key name for a basic food or recipe in the search feature. The system then displayed all NSS food descriptions that contained matching terms. Once the coder selected the most appropriate matching food, the in-house system automatically assigned the corresponding NSS food code to the reported food item. For example, if the respondent’s food detail description
33

CCHS 2.2 - Nutrition: General Health & 24-Hour Dietary Recall Components – User Guide
indicated that he/she had a glass of orange juice with added calcium that was not made from concentrate, the data clerk would use the search feature and then select the description “ORANGE JUICE, CHILLED, ENRICHED WITH CALCIUM”. Once this description was selected, the system would automatically assign the NSS food code of 500691 to the reported food item. If the reported food item was a “basic food” such as milk or cheese which would not be modified by the respondent, then the coder would select a food item from the NSS database to closely match the reported food. If the reported food item was a “recipe food”26, then a recipe from the NSS recipe database would be used. For food items identified as recipes, a recipe modification feature allowed the coder to view the pre-defined recipes listing ingredients and their amounts. Recipes were modified to match the food item consumed by the respondent by substituting ingredients, adjusting an ingredient portion amount, removing or deleting an existing ingredient. During the manual food coding, when a new or unusual food was reported which could not be found in the NSS database or the food could not be closely matched, the system allowed the food to be flagged as unknown food item. For CCHS 2.2, Health Canada’s nutritionists from the Bureau of Nutritional Sciences (BNS) were consulted. They conducted research into each “unknown food” to determine how the nutritional make-up of the reported food item varied from similar foods currently coded in the NSS system. Depending on their recommendations, each “unknown food” was resolved by coding it to a similar existing food item from the NSS database, by selecting and modifying an existing recipe, or by adding a new food item to the database if the food was new to the Canadian market. Statistics Canada’s data entry clerks received training about food coding and NSS functions by expert staff with a background in nutrition from the Health Canada’s Bureau of Nutritional Sciences. Statistics Canada made special arrangements with Health Canada so that one of their nutrition experts could be available on-site at Statistics Canada to supervise coders and ensure the quality and completeness of the data. Once the intake data were coded, Statistics Canada hired nutrition experts from Health Canada to review and resolve difficult coding situations. The Health Canada’s nutrition research team at the Bureau of Nutritional Sciences and the Bureau of Biostatistics and Computer Applications was also consulted for reviewing and approving complex coding situations, and for calculating nutrient intakes. 7.4.3 Calculation of food portion sizes An in-house computer-based system was developed by Statistics Canada to systematically convert reported food portion sizing into gram weights, liquid volume into millilitres, and solid volume into cubic centimetres. These units were selected to facilitate the export of the CCHS food data into the NSS system once the reported foods were coded. The in-house system, using the NSS database, assigned the matching values in the appropriate measuring units to each food item based upon the responses to questions concerning the food amounts consumed. The Health Canada’s nutrition research team was consulted for reviewing and approving complex food sizing
26. The general rule is that a food is a “recipe” when it has more than one ingredient in it. For example, an apple, a steak or a piece of cheese are all basic foods while beef stew, a sandwich and a pancake are all recipe foods.
34

CCHS 2.2 - Nutrition: General Health & 24-Hour Dietary Recall Components – User Guide
situations. As shown in Table 7.1 below, the respondents were able to report the amount consumed in five different ways and each was handled differently by the in-house system. Table 7.1 Food portion conversion methods
Food amount reporting type Conversion method
1- General sizing terms (This included grams, millilitres, and ounces.)
Simple conversion to grams or millilitres
2 - Standard food portion sizes (This included teaspoons, cups, etc.)
Conversion based on standard amounts
3 – Modelling (This included all food portion sizes from the “Food Model Booklet.”27)
Conversion based on pre-determined amounts
4 – Item-specific food portion sizes (e.g. one medium, one carrot, one bun)
Conversion based on NSS values or by amounts as determined by Health Canada
5 - Other specified food portion sizes (e.g. one bite, one serving)
Conversion based on amounts as determined by Health Canada
Once the measuring values in the appropriate units were assigned to the portion sizes reported for each food, the food data were imported from the in-house system into the NSS system. In the NSS system, all volumes (liquid and solid) were converted into gram amounts based upon conversion factors found within the NSS database. 7.4.4 Importing food data into NSS Once the reported foods were coded and food portion sizes were converted into gram amounts, the food data were imported into the NSS system. At this point, the NSS was used to perform quality review and editing of the data (e.g. identifying extreme nutrient amounts and extreme portion amounts), and to calculate the nutritional composition of the foods consumed. 7.4.5 An overview: Nutrition Survey System (NSS) The NSS is a custom-designed computerized food and nutrient database system developed by the research team at the Bureau of Nutritional Sciences (BNS) and the Bureau of Biostatistics and Computer Applications at Health Canada.28 The NSS database system includes food descriptions, food portions and their weights, and the nutrient values for each food item. In addition, each food item has a unique Food Code in the NSS database. The NSS database system can be used to perform multiple functions including: calculating food portion sizes and assigning gram weights (based on the reported food portion), quality review and data editing (e.g. identifying extreme nutrient amounts and extreme portion amounts), and calculating the nutritional composition of the foods consumed. The NSS database content was built using a combination of several food and nutrient databases including: 27. During the interview, when collecting the 24-hour dietary recall information, a "Food Model Booklet" is used as the main measuring guide to help the respondent describe the size or amount of the food consumed. The booklet contains pictures of various sizes of glasses, mugs, bowls, mounds/pats/spreads, and circles. In addition, it includes a grid, two wedges, and a page of shapes and chicken pieces. 28. B.C. Ministry of Health Services. British Columbia Nutrition Survey: Report on Energy and Nutrient Intakes. March 2004. Available at: http://www.healthservices.gov.bc.ca/prevent/nutrition.
35

CCHS 2.2 - Nutrition: General Health & 24-Hour Dietary Recall Components – User Guide
• Canadian Nutrient File (CNF) • Recipe Database • Survey Foods
Canadian Nutrient File: The CNF is a computerized, bilingual food composition database containing average values for nutrients in foods available in Canada. The CNF data are compiled at the BNS of Health Canada. Much of the data contained in the CNF have been derived from the United States Department of Agriculture (USDA) Nutrient Database for Standard Reference. Foods included in the USDA database which are non-existent on the Canadian market are excluded from the CNF. Other modifications included in the CNF consist of Canadian levels of fortification and regulatory standards, along with the addition of the Canadian-only food items and some unique Canadian brand names.29 The CNF database is updated on an ongoing basis. The CNF version that was used for the CCHS 2.2 was the CNF supplemented 2001b which was the CNF 9th edition since 1981. This CNF version contained up to 112 nutrients described for 4,923 foods. Recipe database: In addition to the CNF, the NSS database system contains a “recipe database” which includes nearly 3,000 recipes, adapted from the United States Department of Agriculture (USDA) recipe database. The recipe database was adapted to reflect the Canadian food supply and Canadian recipes (e.g. poutine). The CCHS 2.2 used the recipe database to capture the information about nutrients contained in mixed dishes reported by respondents. Survey foods: The “survey foods” database contains the relevant nutrient information about new foods or local foods that are not included in the CNF or in the “recipe database”. 7.5 Verification/validation of food data With help from Health Canada’s nutrition experts, many procedures were implemented to ensure accuracy of the food data. Verification included outlier detection (e.g. extreme nutrient amounts, extreme portion amounts) and identification of incomplete meals and interviews. Below is a summary list of examples of strategies applied to CCHS 2.2 to determine the overall acceptability of each 24-hour dietary intake data:
• Review of food items reporting a total gram amount over 1,000 grams or a total gram amount <=1 gram
• Review of all recipes where an ingredient makes up less than 1% of the total weight • Conducting outlier analyses at the food item level for various profiles such as energy,
lipids, proteins, sodium, calcium, iron, vitamin C, folate, vitamin A, and caffeine • Conducting outlier analyses focusing on total energy • Conducting analysis of unusual demographic and food combinations. For example:
o Breastmilk consumption reported by adults o Respondents over one year old declaring only breastmilk or formula o Respondents < 12 years old drinking alcohol beverages o Respondents < 10 years old drinking tea or coffee o Meals reported at unusual times o Extremely large quantities of foods
29. Health Canada. Canadian Nutrient File – User’s Guide, 2005. Available at: www.hc-sc.gc.ca/fn-an/nutrition/fiche-nutri-data/cnf_downloads-telechargement_fcen_e.html (accessed February 2006).
36

CCHS 2.2 - Nutrition: General Health & 24-Hour Dietary Recall Components – User Guide
• Review of food intake data for all children under one year of age (approximately 290 cases)
7.6 Verification/validation of vitamin and mineral supplement data With help from Health Canada’s nutrition experts, many procedures were implemented to ensure accuracy of the vitamin and mineral supplement data. Verification procedures included ensuring the validity of all DINs, outlier detection, and analysis of unusual consumption patterns. The following is a list of strategies applied to the CCHS 2.2 vitamin and mineral supplement data to determine its accuracy:
• Review of supplement DINs to ensure they were accurate (for example, on further examination, some DINs that first appeared to be correct actually had small errors, such as an “O” instead of a “0” or two numbers transposed).
• Ensuring assignment of the most-appropriate DIN to all records requiring manual coding • Review of supplements to ensure they contained vitamins and/or minerals (any herbal or
homeopathic supplements were removed) • Review of supplements to ensure they contained the vitamins and/or minerals considered
for this survey (supplements that contained only nutrients that were not being profiled were removed)
• Records with nutrient values that were at least double the average intake in the British Columbia or Quebec nutrition surveys were reviewed
• Records with unusual consumption patterns were analyzed. This included cases where a respondent reported taking a high number of doses relatively few times in the month, or the number of times the supplement was taken per day and the number of doses taken each time were the same.
• Supplements taken in packs were reviewed to ensure the dose and dosage form were accurate
• All manually coded children and infant records were examined to ensure they were not coded to adult supplements
7.7 Creation of derived and grouped variables To facilitate the data analysis and to minimise the risk of errors, a number of variables on the file have been derived by combining variables contained in the survey questionnaire. In some cases, the derived variables (DVs) are straightforward, involving collapsing response categories. In other cases, several variables have been combined to create a new variable. The DV document provides details of how these more complex variables were derived. Derived variables generally have a "D", "G", or “F” in the fifth character of the variable name. 7.8 Weighting The principle behind estimation in a probability sample is that each person in the sample "represents", besides himself or herself, several other persons not in the sample. For example, in a simple random 2% sample (1/50) of the population, each person in the sample represents 50 persons in the population. In the terminology used here, it can be said that each person has a weight of 50.
37

CCHS 2.2 - Nutrition: General Health & 24-Hour Dietary Recall Components – User Guide
The weighting phase is a step that calculates, for each record, what this number is. This weight appears on the microdata file, and must be used to derive meaningful estimates for the population as a whole from the survey data. For example, if the number of individuals who smoke daily is to be estimated, it is done by selecting the records referring to those individuals in the sample having that characteristic and summing the weights entered on those records. Details of the method used to calculate sampling weights are presented in the section titled Weighting. It should be noted that due to the high item non-response to the measured height and weight questions, a special weight WTSD_MHW was estimated specifically to be used when performing analysis involving measured height and weight. Note that a household weight was also created to analyse household issues relevant to nutrition, such as food security. The household weight is available in a separate data file and its relevant information can be found in the document titled “Canadian Community Health Survey (CCHS) Cycle 2.2 (Nutrition) – Household Weights” (Statistics Canada, June 2006). 7.9 Suppression of confidential information It should be noted that the public use microdata file (PUMF) differs in a number of important respects from the survey “master file” held by Statistics Canada. These differences are the result of actions taken to protect the anonymity of individual survey respondents. Protection of respondents is assured through suppression of individual values, variable grouping, and variable capping. Users requiring access to information excluded from the public use microdata files have three options: purchase custom tabulations; contact the Research Data Centres,30 or use the remote access service.
30. The most current information about the Research Data Centres can be found at: http://www.statcan.ca/english/rdc/index.htm.
38

CCHS 2.2 - Nutrition: General Health & 24-Hour Dietary Recall Components – User Guide
8. Data file structure There were 35,107 respondents in the CCHS 2.2 survey. The first interview with the selected respondents consisted of conducting both components of the survey questionnaire: the “general health” and the “24-hour dietary recall”. A second interview consisting of only the 24-hour dietary recall was conducted with approximately 30% of these respondents. This second interview was scheduled to be conducted 3 to 10 days after the first interview and on a different day of the week to measure the change in a person’s diet from one day to another. The CCHS 2.2 data have been released in three waves. The first wave occurred in July 2005 and consisted of releasing the “general health” data including chronic health conditions, Body Mass Index (BMI) as well as health-related behaviours such as physical and sedentary activities, smoking habits, and alcohol consumption. The data release of July 6, 2006 (the second wave) consisted of integrating the data from the 24-hour dietary recall component with the data from the first wave (excluding the vitamin and mineral supplement data). This current release of April 2008 (the third wave) contains files for the vitamin and mineral supplement data. Also part of this third release are new income and geography population size derived variables. To ensure that all food and non-food data are provided in a user-friendly format, the CCHS 2.2 data have been made available in a number of data files, with appropriate linking key variables required to merge files. 8.1 Description of data files The CCHS 2.2 data are contained in ten data files containing information from the general health component (including the vitamin and mineral supplement data), and the 24-hour dietary recall components of the survey. Below is a summary description of the ten data files (see also Data File Diagram): File 1: General Health, vitamin and mineral supplements and 24-Hour Dietary Recall - HS.txt
• The HS (General Health, vitamin and mineral supplements and 24-Hour Dietary Recall) file is a combination of the first release “general health” data, the second release “24-hour dietary recall” and the third release “vitamin and mineral supplement’ data.
• The three components contain: • General Health – the results of questionnaire responses • Vitamin and mineral supplements – flags to indicate if a respondent reported consuming a
specific nutrient from a vitamin or mineral supplement. It is important to note that nutrient intakes from each supplement can be found on the VMD file and the sum of nutrient intakes from all vitamin and mineral supplements can be found on the VSD file.
• 24-Hour Dietary Recall - The sum of nutrients from food sources consumed in a • single day reported during the first 24-hour dietary recall. In other words, this file contains
all the data from the first wave, one record per respondent, but augmented with a roll-up of the respondent’s nutrient intake from the first dietary recall. This dataset is intended to meet the basic needs of the majority of data users.
• A data dictionary along with topical and alphabetical indexes and record layouts in both SAS and SPSS formats are available.
39

CCHS 2.2 - Nutrition: General Health & 24-Hour Dietary Recall Components – User Guide
File 2: Recall 24-Hour - R24.txt • The Recall 24-Hour (R24) file contains a summary of nutrient intake from food sources
consumed in a single day for each of the first and second dietary recall interviews. • This file also contains the general food-related data collected during the 24-hour dietary
recalls, such as information about salt consumption (e.g. type of salt consumed and frequency of salt added during cooking), whether the reported intake was usual or unusual for the respondent, and a count of the number of foods reported during the first and second recall.
• A data dictionary along with topical and alphabetical indexes and record layouts in both SAS and SPSS formats are available.
File 3: Food and Ingredient Details - FID.txt
• The Food and Ingredient Details (FID) file contains the nutrient values for basic food levels31 and ingredient food levels32 in each of the first and second dietary recall interviews.
• When the 24-hour dietary recall information was collected, respondents were able to select the food portion size from a general pre-set list (e.g. one tablespoon) using a portion model (e.g. one piece 2 cm by 2cm by 2cm) or by a pre-set list based upon the food item selected (e.g. one medium banana). The nutrient values available in this FID file are based on the reported food amount converted into a gram weight (for more information about calculation
file. Note that the recipe level
ut. These files can be appended to
d alphabetical indexes and record layouts in both SAS and SPSS formats are available.
summed up to
), time (FIDD_TIM), location (FIDDDLOC), and occasion (FIDD_OCC) on the FRL file.
of food amounts, please see section 7.4.3). • Each ingredient food level has a recipe number (RECIPEID), time (FIDD_TIM), location
(FIDDDLOC), and occasion (FIDD_OCC) on the FID information is found on the Food Recipe Level (FRL) file.
• The FID and FRL files have the exact same record layocombine the basic food, recipes and their ingredients.
• A data dictionary along with topical an
File 4: Food Recipe Level - FRL.txt
• The Food Recipe Level (FRL) file contains nutrient values for main recipe levels33 and sub-recipe levels.34 For example, if a main recipe has ingredients, the ingredients are found in the Food and Ingredient Detail (FID) file, but the rolled-up nutrient values of these ingredients are in this FRL file. This is also true for sub-recipe levels. For example, if you have a third sub-recipe level, the ingredients for the third level are summed up for the third sub-recipe level. For the second sub-recipe level, the ingredients are thenthe second sub-level including the ingredients of the third sub-recipe level.
• Each recipe level has a recipe number (RECIPEID
31. A “basic food level” can be classified in two ways. First, when the food cannot be broken down into other food items (e.g. an apple or 2% milk). Second, when the food item is a recipe, but no nutritional information (nutritional content and sizing) is currently available for the ingredients which make up the recipe (e.g. some granola bars). 32. “Ingredient food levels” are food items which are components of a recipe. For example, cheese, commercial bread, and margarine are identified as ingredient food levels for a “Cheese sandwich”. 33. “Main recipe levels” refers to recipe foods that can be broken down into ingredients AND the nutritional information (nutritional content and portion sizing) is available for ALL the ingredients contained in the recipe. Foods at the main recipe level have an associated set of ingredient food levels and may also have associated sub-recipe levels. Examples of foods identified at the main recipe level include a hamburger, a pizza, or homemade bread. 34. “Sub-recipe levels” are embedded recipes within the main recipe level and they have their own set of associated ingredient food levels. For example, the “Egg Benedict with Hollandaise Sauce” is identified as the main recipe level and the Hollandaise sauce as the sub-recipe level.
40
CCHS 2.2 - Nutrition: General Health & 24-Hour Dietary Recall Components – User Guide
• The FID and FRL files have the exact same record layout. These files can be appended to combine the basic food, recipes and their ingredients.
• A data dictionary along with topical and alphabetical indexes and record layouts in both SAS and SPSS formats are available.
File 5: Vitamin and Mineral Summary file – VSD.txt
• The VSD file is a roll-up file containing one record for every respondent, regardless of whether or not they reported consuming a supplement.
• The VSD file contains the variables corresponding to whether or not a respondent consumed supplements and the number of different supplements consumed (VSDD_01 and VSDD_13 respectively), as well as variables for the average daily intake of each nutrient consumed from all supplements.
• A data dictionary along with topical and alphabetical indexes and record layouts in both SAS and SPSS formats are available.
File 6: Vitamin and Mineral Details file – VMD.txt
• The VMD file contains a unique record for each supplement taken by each respondent. Respondents who did not report consuming a supplement will not have a record on the VMD file. Since respondents were allowed to report up to a maximum of 10 different supplements, it is possible to have 10 records for one individual on the file.
• Each record on the VMD file contains the respondent’s consumption pattern and average daily nutrient intake from that supplement
• A data dictionary along with topical and alphabetical indexes and record layouts in both SAS and SPSS formats are available.
File 7: Food Description - FDC.txt
• The Food Description (FDC) file contains the nutrient values for basic food levels and recipe levels. The nutrient values available in this file correspond to one gram weight value for a basic food or recipe.
• The FDC file also contains food groupings and descriptions as well as food codes from a variety of food and nutrient databases. For example, FDC includes:
a) Nutrition Survey System (NSS) food codes and food descriptions that were available to the CCHS 2.2 during the coding of the reported foods;
b) Canadian Nutrient File (CNF) food group codes; c) BNS food and recipe groups and codes that were developed by the Bureau of
Nutritional Sciences (BNS) at Health Canada in the early 1990s based on the British and American food group systems.35
• A data dictionary along with topical and alphabetical indexes and record layouts in both SAS and SPSS formats are available.
File 8: Vitamin and Mineral Description File -VDC.txt
• For each DIN, the VDC file contains a product description, along with the ATC and AHFS codes. Also on the VDC are the dosage unit (dosage and dosage form), as well as the nutrient profile per dosage unit.
35. The “BNS food and recipe groups” provide the means a) to categorize and then summarize the detailed food and recipe information collected in nutrition surveys and b) to facilitate analyses of the composition of the diet. Health Canada, the Provincial Health Ministries and universities have also used the BNS food and recipe groups to assess the contribution of food categories to intake of selected nutrients by age/sex groups, income, education, and eating locations, among other variables.
41

CCHS 2.2 - Nutrition: General Health & 24-Hour Dietary Recall Components – User Guide
• The information for each nutrient is shown in standardized reporting units (for example, iron is listed in mg).
• Unlike the FDC, only the supplements that were consumed by respondents are included in the VDC.
• A data dictionary along with topical and alphabetical indexes and record layouts in both SAS and SPSS formats are available.
File 9: Cycle 2.2 Data for SIDE Software – HS_SIDE.txt
• The HS_SIDE file was created to adapt the HS (General and 24-Hour Dietary Recall) file for use with SIDE software. This software is used for estimating dietary intake distribution estimations.36
• SIDE needs an input file that has one record per respondent times the maximum number of 24-hour dietary recalls conducted with the respondent. Since respondents can have up to two dietary recalls and there were 35,107 respondents in the CCHS 2.2 survey, the HS_SIDE file has 70,214 (35,107 times 2) records. For respondents who did not have a second dietary recall interview, the first general health interview data was repeated but the 24-hour recall values were set to “missing”.
• In the HS_SIDE file, the variable SUPPID identifies whether the record is a first dietary recall or a second recall.
• For HS_SIDE file, a numeric key SIDEID which replaces the SAMPLEID alphanumeric variable was created.
• In the HS (also called General and 24-Hour Dietary Recall) file, in cases where the nutrient values were not available, the “not currently available” code was assigned to these nutrients. However, since SIDE could not use this code, the “not currently available” code was converted to a “missing” code in HS_SIDE file in order to enable data analysis using SIDE.
• The HS (General and 24-Hour Dietary Recall) data dictionary along with record layouts can be used as supporting documentation for the HS_SIDE file. The only difference between the HS and HS_SIDE files in terms of variables are the additional SIDEID and SUPPID variables that were added at the end of the HS_SIDE file.
File 10: Metadata
• This is the electronic data dictionary in a database format.
36. The SIDE software was developed at the Center for Survey Statistics and Methodology of Iowa State University in cooperation with the USDA Agriculture Research Service in 1996. For more information about SIDE and the HS_SIDE file, please see the Statistics Canada document entitled “Canadian Community Health Survey (CCHS) Cycle 2.2 (Nutrition) – Software for Intake Distribution Estimation (SIDE) Documentation” (June 2006).
42
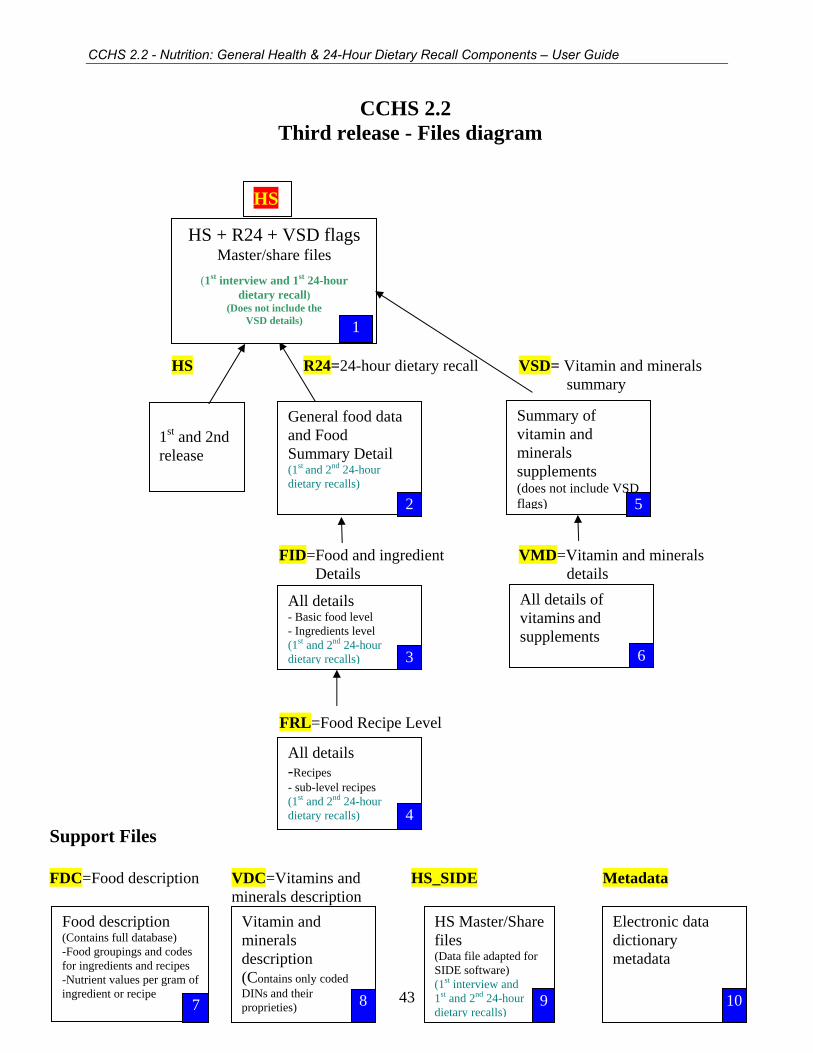
CCHS 2.2 - Nutrition: General Health & 24-Hour Dietary Recall Components – User Guide
CCHS 2.2 Third release - Files diagram
HS R24=24-hour dietary recall VSD= Vitamin and minerals summary
FID=Food and ingredient VMD=Vitamin and minerals Details details
FRL=Food Recipe Level Support Files FDC=Food description VDC=Vitamins and HS_SIDE Metadata minerals description
HS
HS + R24 + VSD flags Master/share files
(1st interview and 1st 24-hour dietary recall)
(Does not include the VSD details) 1
Summary of vitamin and minerals supplements (does not include VSD flags)
General food data and Food Summary Detail
1st and 2nd release
(1st and 2nd 24-hour dietary recalls) 2 5
All details of vitamins and supplements 6
All details - Basic food level - Ingredients level (1st and 2nd 24-hour dietary recalls) 3
All details -Recipes - sub-level recipes (1st and 2nd 24-hour dietary recalls) 4
Vitamin and minerals description (Contains only coded DINs and their proprieties) 8
Food description HS Master/Share files
Electronic data dictionary metadata
(Contains full database) -Food groupings and codes for ingredients and recipes
(Data file adapted for SIDE software)
-Nutrient values per gram of ingredient or recipe
(1st interview and 1st and 2nd 24-hour dietary recalls)
43 9 107

CCHS 2.2 - Nutrition: General Health & 24-Hour Dietary Recall Components – User Guide
8.2 Important key variables and definitions There are several variables included in specific data files which require further explanation, listed below. This information will be helpful for a better understanding of the data files and how to link them. (For a full description of all variables included in each data file, see appropriate data dictionary reports.) SAMPLEID: A unique household identifier which is assigned to each respondent in the survey. SUPPID: A unique 24-hour dietary recall identifier which is assigned to each respondent’s recall. Respondents can have up to two dietary recalls. SEQID: A unique sequential number within a 24-hour dietary recall which is used to identify a food item (basic food level, ingredient food level or recipe level) reported by a respondent. SEQID is also useful in linking the ingredients with their associated recipes when appending one nutrient file to another file. RECIPEID: A unique recipe number within a 24-hour dietary recall which could be used to link a recipe with its associated set of ingredients. Recipes can be found on the Food Recipe Level (FRL) file. Ingredients associated with a specific RECIPEID number within a 24-hour dietary recall can be found on the Food and Ingredient Details (FID) file. SIDEID: A unique household identifier which is assigned to each respondent in the survey. SIDEID is for use with the SIDE software. This software is used for estimating dietary intake distributions. FIDD_CDE: This variable represents the Nutrition Survey System (NSS) food code. It is a unique code for each food item. Each NSS code has a specific nutrient profile assigned to it. This variable can be found on FID, FRL, and FDC files. FIDD_FID: This variable is referred to as a basic food, ingredient or recipe identifier. That is, it distinguishes between basic food levels, ingredient food levels, main recipe levels, and sub-recipe levels. This variable can be found on FID, FRL, and FDC files. VMDDCDIN: This variable represents the Drug Identification Number (DIN). It is a unique code for each vitamin/mineral supplement. Each DIN has a specific nutrient profile assigned to it. This variable can be found on VMD and VDC files. 8.3 Key variables for linking data files There are a number of key variables included in the data files which should be used to link or append the files. The following table identifies key variable(s) for linking or appending the data files. Note that other types of file linkage are not possible or not recommended.
Link file to file key variable(s) HS R24 SAMPLEID HS FID SAMPLEID HS FRL SAMPLEID HS VSD SAMPLEID HS VMD SAMPLEID R24 FID SAMPLEID, SUPPID
44
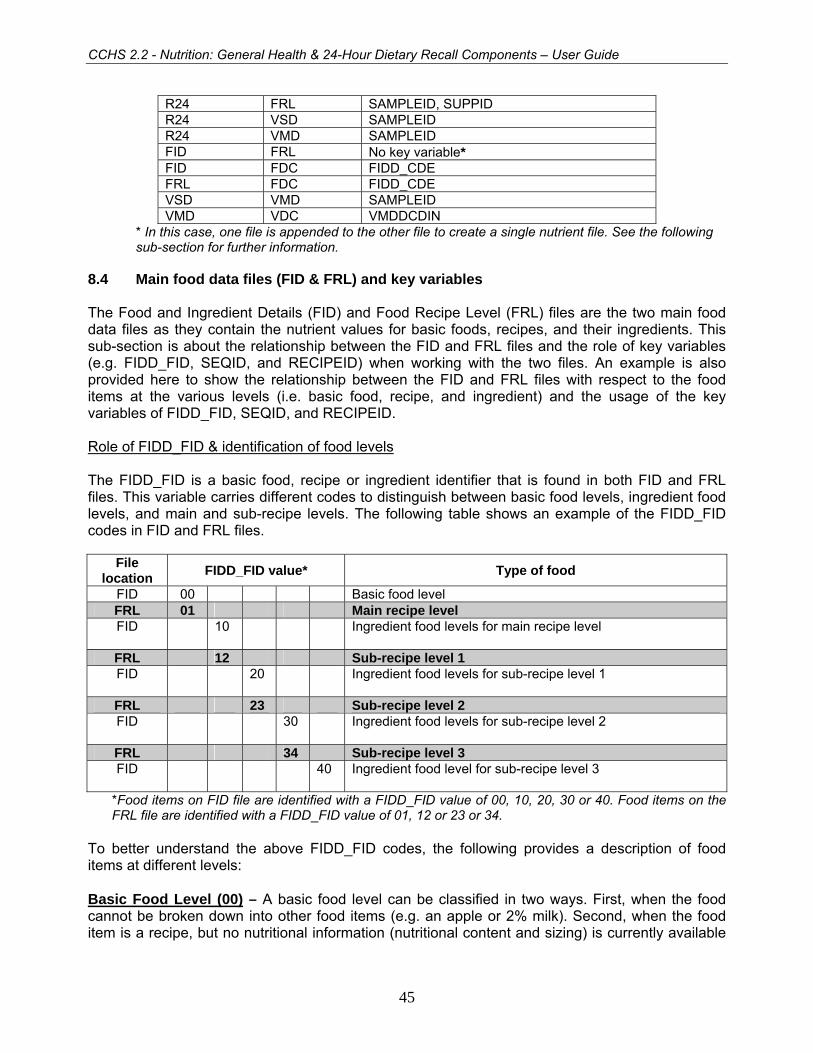
CCHS 2.2 - Nutrition: General Health & 24-Hour Dietary Recall Components – User Guide
R24 FRL SAMPLEID, SUPPID R24 VSD SAMPLEID R24 VMD SAMPLEID FID FRL No key variable* FID FDC FIDD_CDE FRL FDC FIDD_CDE VSD VMD SAMPLEID VMD VDC VMDDCDIN
* In this case, one file is appended to the other file to create a single nutrient file. See the following sub-section for further information.
8.4 Main food data files (FID & FRL) and key variables The Food and Ingredient Details (FID) and Food Recipe Level (FRL) files are the two main food data files as they contain the nutrient values for basic foods, recipes, and their ingredients. This sub-section is about the relationship between the FID and FRL files and the role of key variables (e.g. FIDD_FID, SEQID, and RECIPEID) when working with the two files. An example is also provided here to show the relationship between the FID and FRL files with respect to the food items at the various levels (i.e. basic food, recipe, and ingredient) and the usage of the key variables of FIDD_FID, SEQID, and RECIPEID. Role of FIDD_FID & identification of food levels The FIDD_FID is a basic food, recipe or ingredient identifier that is found in both FID and FRL files. This variable carries different codes to distinguish between basic food levels, ingredient food levels, and main and sub-recipe levels. The following table shows an example of the FIDD_FID codes in FID and FRL files.
File location FIDD_FID value* Type of food
FID 00 Basic food level FRL 01 Main recipe level FID 10 Ingredient food levels for main recipe level
FRL 12 Sub-recipe level 1 FID 20 Ingredient food levels for sub-recipe level 1
FRL 23 Sub-recipe level 2 FID 30 Ingredient food levels for sub-recipe level 2
FRL 34 Sub-recipe level 3 FID 40 Ingredient food level for sub-recipe level 3
*Food items on FID file are identified with a FIDD_FID value of 00, 10, 20, 30 or 40. Food items on the FRL file are identified with a FIDD_FID value of 01, 12 or 23 or 34.
To better understand the above FIDD_FID codes, the following provides a description of food items at different levels: Basic Food Level (00) – A basic food level can be classified in two ways. First, when the food cannot be broken down into other food items (e.g. an apple or 2% milk). Second, when the food item is a recipe, but no nutritional information (nutritional content and sizing) is currently available
45

CCHS 2.2 - Nutrition: General Health & 24-Hour Dietary Recall Components – User Guide
for the ingredients which make up the recipe (e.g. some granola bars). The basic food level data can be found on the FID data file. Main Recipe Level (01) – Main recipe level refers to recipe foods that can be broken down into ingredients AND the nutritional information (nutritional content and portion sizing) is available for ALL the ingredients contained in the recipe. Foods at the main recipe level have an associated set of ingredient food levels and may also have associated sub-recipe levels. Examples of foods identified at the main recipe level include a hamburger, a pizza, or homemade bread. The main recipe level data can be found on the FRL data file. Ingredient Food Levels (10, 20, 30, 40) – Ingredient food levels are foods which are components of a recipe. For example, cheese, commercial bread, and margarine are identified as ingredient food levels for a “Cheese Sandwich”. The ingredient food level data can be found on the FID data file. Sub-Recipe Levels (12, 23, 34) – Sub-recipe levels are embedded recipes within the main recipe level and they have their own set of associated ingredient food levels. For example, the “Eggs Benedict with Hollandaise Sauce” identified as the main recipe and the Hollandaise sauce as the sub-recipe level. The sub-recipe level data can be found on the FRL data file. Example of how to use the key variables when working with FID and FRL files The following table is an example showing the relationship between the FID and FRL files with respect to the food items at the various levels and the usage of the FIDD_FID, SEQID, and RECIPEID variables. This example is for ONE respondent with FOUR consumed food items (note that the main level for each food item consumed is numbered and it is in BOLD). When reviewing the table below, note that:
• The values assigned to SEQID are unique within a 24-hour dietary recall in the FID and FRL files. These values remain in sequence for the respondent.
• All ingredient food levels for a given recipe level including sub-recipe levels have the same RECIPEID value.
• Associated ingredient food levels on the FID and FRL files share the same time (FIDD_TIM), occasion (FIDD_OCC), and location (FIDDDLOC).
46

CCHS 2.2 - Nutrition: General Health & 24-Hour Dietary Recall Components – User Guide
FID File FRL File Ex. Food Item
FIDD_FID SEQID RECIPEID FIDD_FID SEQID RECIPEID* 1 Cheese, Processed Food, Cheddar 00 1 0 * 2 Cheese Sandwich 01 2 1
Cheese Processed Food, Cheddar 10 3 1 Bread, White 10 4 1 Margarine, Tub 10 5 1
* 3 Croissant Sandwich with Bacon, Egg and Cheese 01 6 2 Pork Cured, Bacon 10 7 2 Croissant, Butter 10 8 2 Cheese Processed Food, Cheddar 10 9 2 Egg Omelet or Scrambled Egg 12 10 2 Milk, Fluid 20 11 2 Margarine, Tub 20 12 2 Salt 20 13 2 Egg, Chicken 20 14 2
* 4 Croissant Sandwich with Breaded Ham 01 15 3 Croissant, Butter 10 16 3 Cheese Processed Food, Cheddar 10 17 3 Egg Omelet or Scrambled Egg with Breaded Ham 12 18 3 Milk, Fluid 20 19 3 Margarine, Tub 20 20 3 Salt 20 21 3 Egg, Chicken 20 22 3 Ham, Breaded, Fried 23 23 3 Pork, Cured, Ham 30 24 3 Egg, Chicken 30 25 3 Bread Crumbs 30 26 3 Vegetable Oil 30 27 3
* Example #1: “Cheese, Processed Food, Cheddar” is a basic food level item that can be found on the FID file only. It has no ingredient food levels and no sub-recipe levels. * Example #2: “Cheese Sandwich” is a main recipe level food item that can be found on the FRL file. The ingredient food levels of this recipe can be found on the FID file. There are no sub-recipe levels. * Example #3: “Croissant Sandwich with Bacon, Egg and Cheese” is a main recipe level food item with one sub-recipe level that can be found on the FRL file. All ingredient food levels of both the main recipe and sub-recipe levels can be found on the FID file. Note that the food items in italics represent the ingredients of the sub-recipe ‘Egg Omelet or Scrambled Egg’. * Example #4: “Croissant Sandwich with Breaded Ham” is a main recipe level food item with two sub-recipe levels that can be found on the FRL file. All ingredient food levels of both main recipe and all of the sub-recipe levels can be found on the FID file. Note that the food items in italics represent the ingredient food levels of the sub-recipe level ‘Egg Omelet or Scrambled Egg With Breaded Ham’. The food items in bold represent the ingredient food levels of the sub-recipe level 2, ‘Ham, Breaded, Fried’.
47

CCHS 2.2 - Nutrition: General Health & 24-Hour Dietary Recall Components – User Guide
9. Weighting In order for estimates produced from survey data to be representative of the covered population, and not just the sample itself, users must incorporate the survey weights in their calculations. A survey weight is given to each person included in the final sample, that is, the sample of persons having answered the survey. This weight corresponds to the number of persons in the entire population that are represented by the respondent. As described in section 5, CCHS (Cycle 2.2) had recourse to five sampling frames for its sample selection: an area frame acting as the primary frame, three list frames targeting mainly persons aged 18 or less and a supplementary frame used to reach more off-reserve aboriginals. The three types of frames (area, list and supplementary) were combined in order to answer the provinces' needs. Note that only one list frame could be used for a given province. The weighting strategy was developed by treating the five frames independently. Weights resulting from these frames are afterwards combined into a single set of weights through steps called "integration". After some adjustments, this integrated weight becomes the final weight. 9.1 Sample weighting As mentioned previously, units from the five frames are treated separately up to the integration step. Sub-section 9.1.1 provides details on the weighting strategy for the area frame, while sub-section 9.1.2 deals with the strategy for the list frame of CCHS 2.1. Sub-sections 9.1.3 and 9.1.4 concern the other two list frames and describe respectively the weighting of the Prince Edward Island (PEI) and Manitoba Healthcare registries. Sub-section 9.1.5 presents the weighting strategy for the supplement on off-reserve aboriginals. The integration of the area frame with the list frames is discussed in 9.1.6 whereas the integration of the off reserve aboriginal frame units is explained in 9.1.7. This is followed by the two last weighting steps, that is, the adjustment controlling for the seasonal and the day of the week effects and the post-stratification, which are described in sub-sections 9.1.8 and 9.1.9, respectively. Finally, section 9.2 presents the weighting strategy used to create the extra weight associated with the sub-sample of respondents for which exact weight and height measures were taken. Diagram A presents an overview of the different adjustments, part of the weighting strategy, in the order in which they are applied. A numbering system is used to identify each adjustment applied to the weight and will be used throughout the section. Letters A, L, P, M and S are used as prefixes to refer to adjustments applied to the units on the Area frame, CCHS 2.1 List frame, PEI Healthcare registry, Manitoba Healthcare registry and Supplementary aboriginal frame respectively. The prefix I identifies adjustments applied from the Integration steps.
48

CCHS 2.2 - Nutrition: General Health & 24-Hour Dietary Recall Components – User Guide
Diagram A: Weighting Strategy Overview
Area frame
Sample decrease
A1
Removal of out-of-scope
unit sA2
Person le el vweig ht
A4
Person non-response
A5
PEI Healthcareregistry
ManitobaHealthcare
registry
Ineligible citiesM2
AddressesInvalid
M1
Householdnon-response
M4
Person levelweight
M5
Personnon-response
M6
Householdnon-response
P2
Person levelweight
P3
Personnon-response
P4
Household non-response
S1
Person le el vweight
S2
Person non-response
S3
Initial weight A0
Household non-response
A3
Initial w ight eL0
Household non-response
L1
Person le el vweight
L2
Person non-response
L3
Initial weightP0
Removal ofout-of-scope
unitsP1
Initial weightM0
Initial w ight eS0
Removal ofout-of-scope
unitsM3
Integration of thearea with
list frames
I1
Integration ofsupplementary
aboriginal fram e I2
Seasonal and day ofthe week effects
I3
List frame o2.1
fCCHS
Supplementa y raborigin l a
frame
Post-stratification I4
49

CCHS 2.2 - Nutrition: General Health & 24-Hour Dietary Recall Components – User Guide
9.1.1 Weighting of the area frame sample A0 – Initial weight Since the mechanism established for the Labour Force Survey (LFS) was used to select the area frame sample, the initial weights had to be computed with respect to that mechanism. First, within each stratum defined by the LFS, clusters (primary sampling units) are selected with probabilities proportional to population size (based on 1991 Census counts). Next, dwellings are sampled within each selected cluster using systematic sampling. The product of the probabilities for each of these selections represents the overall probability of selection, and the inverse of that probability is used as the CCHS (Cycle 2.2) area frame initial weight. For more details about the selection mechanism, as well as a more complete definition of strata and clusters, refer to Statistics Canada (1998).37 A1 – Sample decrease Some modifications were made to the default LFS mechanism at the time of sample selection for CCHS (Cycle 2.2). The LFS design provides approximately 68,000 dwellings nationally, while CCHS (Cycle 2.2) requirements in terms of sample size were lower. Modifications were made in order to reduce the sample by removing extraneous households from the sample to get the desired sample size. As this modification reduced the sample size, adjustments to the weighting were needed in order to reflect the actual probability of selection. An adjustment factor, A1, representing the sample decrease rate was calculated. However, the sample decrease was not needed in some strata of PEI, Ontario and Manitoba where the sample size provided by the LFS design was insufficient. Indeed, for some strata, the sample was increased in order to reach the requirements in term of sample size for Cycle 2.2 of the CCHS. For those strata, the adjustment factor represents a sample increase instead of representing a sample decrease. The initial weight, A0, was multiplied by this adjustment factor, resulting in weight A1. A2 – Removal of out-of-scope units Among all dwellings sampled, a certain proportion is identified during collection as being out-of-scope. Dwellings that are demolished or under construction, vacant, seasonal or secondary, and institutions are examples of out-of-scope cases for CCHS (Cycle 2.2). These dwellings were simply removed from the sample, leaving only a sample that consisted of in-scope dwellings. They maintain the same weight as in the previous step, which is now called A2. A3 – Household non-response During collection, a certain proportion of visited dwellings inevitably resulted in non-response. This usually occurs when the household occupying the dwelling refuses to participate in the survey, provides unusable data, or cannot be reached for an interview. Weights of the non-responding households were distributed using homogeneous response classes to the responding households. The CHAID (Chi-Square Automatic Interaction Detector) algorithm, available in Knowledge Seeker,38 was used to identify the best characteristics to divide the sample into groups that were dissimilar with respect to response/non-response. Note that the groups were formed 37. STATISTICS CANADA. 1998. Methodology of the Canadian Labour Force Survey. Statistics Canada. Cat. No. 71-526-XPB. Ottawa. 38. ANGOSS Software. 1995. Knowledge Seeker IV for Windows - User's Guide. ANGOSS Software International Limited.
50
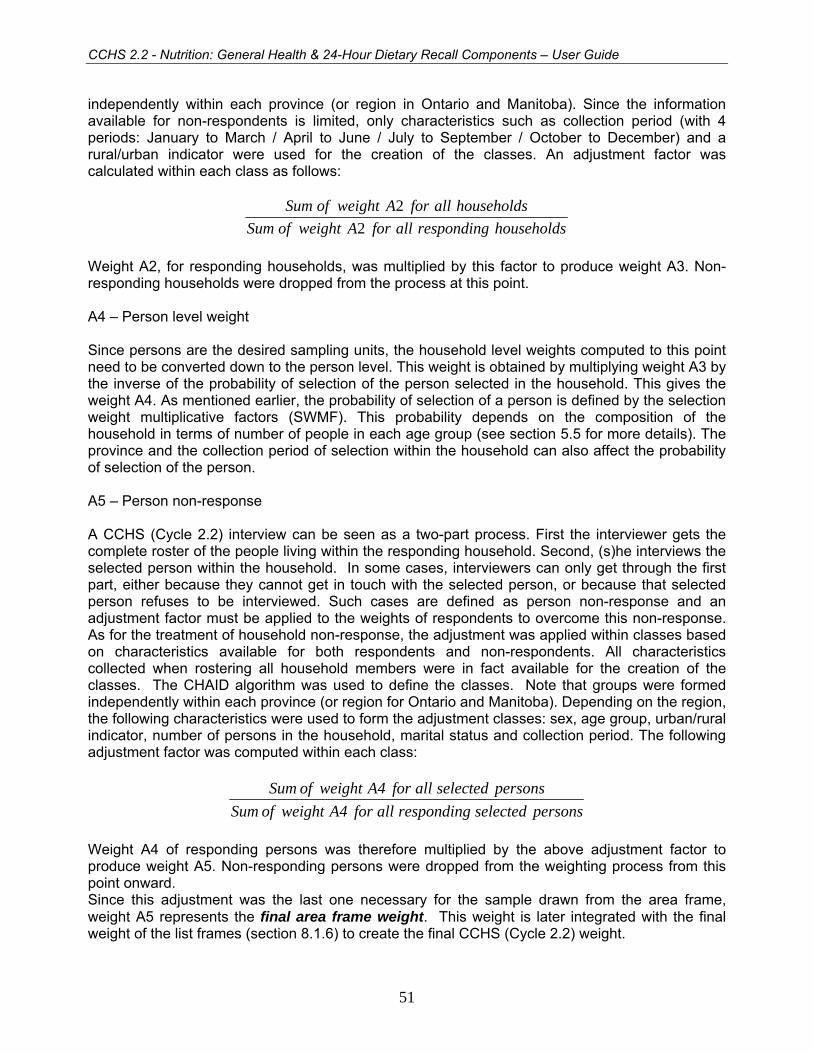
CCHS 2.2 - Nutrition: General Health & 24-Hour Dietary Recall Components – User Guide
independently within each province (or region in Ontario and Manitoba). Since the information available for non-respondents is limited, only characteristics such as collection period (with 4 periods: January to March / April to June / July to September / October to December) and a rural/urban indicator were used for the creation of the classes. An adjustment factor was calculated within each class as follows:
householdsrespondingallforAweightofSumhouseholdsallforAweightofSum
22
Weight A2, for responding households, was multiplied by this factor to produce weight A3. Non-responding households were dropped from the process at this point. A4 – Person level weight
Since persons are the desired sampling units, the household level weights computed to this point need to be converted down to the person level. This weight is obtained by multiplying weight A3 by the inverse of the probability of selection of the person selected in the household. This gives the weight A4. As mentioned earlier, the probability of selection of a person is defined by the selection weight multiplicative factors (SWMF). This probability depends on the composition of the household in terms of number of people in each age group (see section 5.5 for more details). The province and the collection period of selection within the household can also affect the probability of selection of the person.
A5 – Person non-response A CCHS (Cycle 2.2) interview can be seen as a two-part process. First the interviewer gets the complete roster of the people living within the responding household. Second, (s)he interviews the selected person within the household. In some cases, interviewers can only get through the first part, either because they cannot get in touch with the selected person, or because that selected person refuses to be interviewed. Such cases are defined as person non-response and an adjustment factor must be applied to the weights of respondents to overcome this non-response. As for the treatment of household non-response, the adjustment was applied within classes based on characteristics available for both respondents and non-respondents. All characteristics collected when rostering all household members were in fact available for the creation of the classes. The CHAID algorithm was used to define the classes. Note that groups were formed independently within each province (or region for Ontario and Manitoba). Depending on the region, the following characteristics were used to form the adjustment classes: sex, age group, urban/rural indicator, number of persons in the household, marital status and collection period. The following adjustment factor was computed within each class:
personsselectedrespondingallforA4weightofSumpersonsselectedallforA4weightofSum
Weight A4 of responding persons was therefore multiplied by the above adjustment factor to produce weight A5. Non-responding persons were dropped from the weighting process from this point onward. Since this adjustment was the last one necessary for the sample drawn from the area frame, weight A5 represents the final area frame weight. This weight is later integrated with the final weight of the list frames (section 8.1.6) to create the final CCHS (Cycle 2.2) weight.
51

CCHS 2.2 - Nutrition: General Health & 24-Hour Dietary Recall Components – User Guide
9.1.2 Weighting of the CCHS 2.1 list frame As mentioned previously, the CCHS 2.1 list frame was used in order to reach minimal needed sample sizes for the population aged 18 years old or younger (as well as 71 years old and above for Ontario). This frame was used to complement the area frame for every province except for Manitoba and PEI where Healthcare registries were used as list frames. Households that are present on the CCHS 2.1 list frame come mainly from the CCHS 2.1 area frame since information relative to the address is available for all of these units. Respondents interviewed in person for the collection mode effect study39 are also present on the CCHS 2.1 list frame because of the availability of the complete address. Finally, since the CCHS 2.1 area frame could not provide enough households with persons aged 18 or younger in the provinces of Nova-Scotia and New-Brunswick and for the region of Toronto in Ontario, the respondents of the CCHS 2.1 telephone frame of those areas were added to the frame.
Note that even though the CCHS 2.1 list frame was targeting people up to the age of 18 years, it was possible to get respondents that are older than 18 years old from that frame. Indeed, since the household living at the dwelling could have changed since Cycle 2.1, it is possible that the new household does not include any person aged 18 or younger. However, for operational purposes, the interviewers had to conduct the interview even if there was no one in the targeted age group in the selected household. This explains why there are respondents older than 18 years old coming from the CCHS 2.1 list frame. L0 – Initial weight
The CCHS 2.1 list frame initial weight was computed according to the features of this frame. The sample was drawn in two stages. For the first two quarters of Cycle 2.2, the sample was selected using a list containing only respondents who had completed their interviews for Cycle 2.1. This file contained only respondents of the first 8 months of collection of CCHS 2.1. For the sample of the last two quarters, the complete CCHS 2.1 sample was available and was used as a frame. This frame contains all households with persons aged 18 years old or younger (and 71 plus in Ontario) of the CCHS 2.1 area frame as well as households from the collection effect mode study and from the telephone frame in provinces where those cases were needed.
A stratified two stage sample design was used to select the sample from the CCHS 2.1 list frame. The frame was stratified by province (and regions in Ontario) and urban/rural zone. At the first stage, a list of municipalities (and/or cities) was selected using a systematic proportional to size design. The variable of size used to determine the importance of a municipality was the sum of Cycle 2.1 weights of households with persons aged 18 or younger. By doing this, the more households of that type in a municipality, the greater its probability of being selected. The weight that is used to compute the size of the municipalities is the weight A4 from Cycle 2.1, that is, the household weight compensated for household non-response (see PUMF user guide of Cycle 2.140 for more details). Then, from the selected municipalities, a sample of dwelling addresses was selected using a systematic design. Households living at selected addresses were part of the sample. The probability of selection of a household is therefore the product of probabilities of 39. St-Pierre, M. and Y. Béland. 2004. "Mode Effects in the Canadian Community Health Survey: a Comparison of CAPI and CATI." Proceedings of the American Statistical Association Annual Meeting, Survey Research Methods Section. Toronto, Canada: American Statistical Association. 40. Statistics Canada. 2005. The Canadian Community Health Survey (Cycle 2.1) – Guide, Statistics Canada Catalogue no. 82M0013GPE. Ottawa.
52

CCHS 2.2 - Nutrition: General Health & 24-Hour Dietary Recall Components – User Guide
selection at each stage multiplied by the probability of selection at Cycle 2.1. The initial weight is the inverse of the probability of selection for Cycle 2.2 multiplied by the weight A4 of Cycle 2.1.
For units coming from the Cycle 2.1 telephone frame, the calculation of the initial weight is slightly different because of the differences in the design. Indeed, to be selected from the telephone frame, an address had to be in a municipality that was already selected from the area component of the list frame. All addresses that were not in those municipalities were excluded from the telephone component of the list frame. Moreover, the initial weight must account for the fact that some addresses on the telephone frame are invalid because of missing information related to the addresses. Those addresses are excluded from the frame.
L1 – Household non-response The adjustment applied here to compensate for the effect of household non-response is identical to the one applied for the area frame (adjustment A3). In addition to the variables that were used for the area frame, the “Dwelling type” variable coming from Cycle 2.1 could be used in the creation of the classes. In fact, that variable was the most significant variable to define the adjustment classes for most of the provinces. The adjustment factor calculated within each class was obtained as follows:
householdsrespondingallforLweightsofSumhouseholdsallforLweightsofSum
00
The weight L0 of responding households was multiplied by this factor to produce the weight L1. Non-responding households were removed from the process at this point.
Note that out-of-scope units are not removed from the sample before the non-response processing. These cases are considered as non-respondents instead. This can be explained by the fact that selected households were respondents for Cycle 2.1 and hence in-scope for the survey. The loss of their weight would cause an underestimation of the number of dwellings in the country. The dwellings that were in-scope for Cycle 2.1 but out-of-scope for Cycle 2.2 counterbalance for the ones that were out-of-scope for Cycle 2.1 but in-scope for Cycle 2.2. L2 – Person level weight As for adjustment A4, this adjustment converts the household level weight to a person level weight. Since the algorithm of selection of the person within the household is the same as the one used for the area frame, computation of the adjustment factor was done the same way. The only difference lies in the fact that persons aged more than 18 living in a household with at least one member aged 18 or less did not have a chance of selection, except in Ontario where persons aged 71 plus also had a chance to be selected. This factor, multiplied by the weight L1, gave the weight L2. L3 - Person non-response This adjustment was similar to the adjustment A5 used for the area frame. It consisted of compensating for the effect of non-response at the person level. As for A5, an approach based on adjustment classes was used, where classes were defined from variables available for all selected persons, respondent or not (see A5 for the list of variables available). The selected person’s age group and marital status, the number of persons in the household and the collection period of the
53

CCHS 2.2 - Nutrition: General Health & 24-Hour Dietary Recall Components – User Guide
interview were the variables used to create the classes. Within each class, an adjustment factor was calculated as follows:
personsselectedrespondingallforLweightsofSumpersonsselectedallforLweightsofSum
22
The weight L2 of responding persons was therefore multiplied by this adjustment factor to produce the weight L3. Non-responding persons were dropped out of the weighting process at this point.
Since this adjustment was the last one necessary for the sample drawn from the CCHS 2.1 list frame, weight L3 represents the final CCHS 2.1 list frame weight. This weight is later integrated with the final weight of the area frame (section 9.1.6) to create the final CCHS (Cycle 2.2) weight. 9.1.3 Weighting of the Prince Edward Island Healthcare registry As for the CCHS 2.1 list frame, the PEI Healthcare registry is a list frame of addresses used to target certain age groups in order to obtain required sample sizes for those groups. For PEI, in addition to those 18 years old or younger, the age groups 19-30 and 71+ were also target groups. The frame created from the PEI Healthcare registry is actually a list of addresses with at least one person of the target groups at the moment of creation of the frame. As for the CCHS 2.1 list frame, it is possible that the households living at the selected addresses at the moment of collection for CCHS 2.2 did not have anybody from the target age groups. For these households, the interview was conducted nevertheless by selecting a person from a group not targeted by the registry.
P0 - Initial weight
The sample design used to select units from the PEI Healthcare registry is simpler than the ones used for the area and CCHS 2.1 list frame samples. The frame was divided into two strata, one urban and one rural. A systematic sample of addresses was selected within each stratum. The initial weight P0 is the inverse of the probability of selection of the address.
P1 - Removal of out-of-scope units The definition of an out-of-scope unit is the same as the one of the area frame. Dwellings that are demolished or under construction, vacant, seasonal or secondary are considered as out-of-scope cases. As for the area frame, these cases were simply removed from the process, leaving only in-scope dwellings in the sample. These in-scope dwellings kept the same weight as in the previous step, now called weight P1.
54

CCHS 2.2 - Nutrition: General Health & 24-Hour Dietary Recall Components – User Guide
P2 – Household non-response
The adjustment applied here to compensate for the effect of household non-response is identical to the one applied for the area frame (adjustment A3). However, since the number of variables that are available on the PEI Healthcare registry is limited and the sample size is small, no variable was significant for the creation of the classes. The adjustment applied was the same for all respondents of the province. The adjustment factor calculated to the provincial scale was obtained as follows:
householdsrespondingallforPweightsofSumhouseholdsallforPweightsofSum
11
The weight P1 of responding households was multiplied by this factor to produce the weight P2. Non-responding households were removed from the process at this point.
P3 – Person level weight As for adjustment A4, this adjustment converts the household level weight to a person level weight. Since the algorithm of selection of the person within the household is the same as the one used for the area frame, computation of the adjustment factor was done the same way. The only difference is that persons who were not in the target groups, that is, are 31-70 years old, and were living with at least one person who is at most 18 years old did not have a chance of selection. This factor, multiplied by the weight P2, gave the weight P3.
P4 - Person non-response This adjustment is similar to the adjustment A5 used for the area frame. It consists of compensating for the effect of non-response at the person level. As for A5, an approach based on adjustment classes was used, where classes were defined from variables available for all selected persons, respondent or not (see A5 for the list of variables available). However, as was the case for household non-response, no variable was used to define the adjustment classes. There is hence only one class, the province, for which an adjustment factor was calculated as follows:
personsselectedrespondingallforPweightsofSumpersonsselectedallforPweightsofSum
33
The weight P3 of responding persons was therefore multiplied by this adjustment factor to produce the weight P4. Non-responding persons were dropped out of the weighting process at this point.
Since this adjustment was the last one necessary for the sample drawn from the PEI Healthcare registry, weight P4 represents the final PEI Healthcare registry weight. This weight is later integrated with the final weight of the area frame (section 8.1.6) to create the final CCHS (Cycle 2.2) weight.
55

CCHS 2.2 - Nutrition: General Health & 24-Hour Dietary Recall Components – User Guide
9.1.4 Weighting of the Manitoba Healthcare registry As for the CCHS 2.1 list frame, the Manitoba Healthcare registry is a list frame of addresses used to target people aged 18 years old or younger. The frame created from the Manitoba Healthcare registry is actually a list of addresses with at least one person aged 18 or younger at the moment of creation of the frame. As for the CCHS 2.1 list frame, it is possible that the households living at the selected addresses at the moment of collection for CCHS 2.2 did not include anybody in that age group. For these households, the interview was conducted nevertheless by selecting a person from an age group not targeted by the registry.
A feature of the Manitoba Healthcare registry prevented some households from being selected. Indeed, some addresses were missing or invalid and no phone number was available. For the PEI Healthcare registry, the phone number was used to contact households for which the address was missing or invalid. This enabled the interviewer to ask for the address of the household. Of course, this was impossible to repeat that procedure with the Manitoba Healthcare registry. Invalid and missing addresses as well as cities with large proportions of these addresses were excluded from the frame and hence did not have any chance of being part of the sample.
M0 – Initial weight
The sampling in Manitoba was done at the regional level for the 4 regions. For the Winnipeg region, the sample plan included two stages. First, the region was stratified using the city as stratification variable. At first stage, clusters formed using the first three characters of the postal code were selected with probability proportional to the number of addresses within each cluster. A systematic sample of addresses was then selected within each cluster at the second stage. For the remaining three regions, we formed strata using the city and the first three characters of the postal code. Then, a systematic sample of addresses was selected within each stratum. The initial weight is the inverse of the probability of selection of the address.
M1 – Invalid addresses
As mentioned earlier, the Manitoba Healthcare registry contains addresses for which it would have been impossible for the interviewer to get in contact with the household because of information missing. Most of these addresses are in fact post office boxes without street number or name. Since those addresses could not be selected, an adjustment was applied to take care of the loss of these addresses. The adjustment was applied at the cluster level. The clusters are defined by the three characters of the postal code. The adjustment M1 applied within each cluster is the following:
cluster the in addresses valid of Numbercluster the in addresses of number Total
The weight M1 is obtained by multiplying the weight M0 by the adjustment M1.
M2 – Ineligible cities
In order to avoid sending interviewers for a small number of cases, cities for which the number of valid addresses was too small or for which the proportion of valid addresses was too low were excluded from the frame. In order to keep the representativeness at the region level, the weight of
56

CCHS 2.2 - Nutrition: General Health & 24-Hour Dietary Recall Components – User Guide
the ineligible cities was redistributed to the eligible ones. The adjustment factor M2 was computed this way:
region the of cities eligible the in addresses of number Totalregion the in addresses of number Total
The weight M1, multiplied by the adjustment M2, gave the weight M2.
M3 - Removal of out-of-scope units The definition of an out-of-scope unit is the same as the one of the area frame. Dwellings that are demolished or under construction, vacant, seasonal or secondary are considered as out-of-scope cases. As for the area frame, these cases were simply removed from the process, leaving only in-scope dwellings in the sample. These in-scope dwellings kept the same weight as in the previous step (weight M2), now called weight M3.
M4 – Household non-response
The adjustment applied here to compensate for the effect of household non-response is identical to the one applied for the area frame (adjustment A3). In contrast to the PEI Healthcare registry, some variables could be used in the creation of the adjustment classes. Indeed, the number of children and adults in the household (according to the information on the frame) and the collection period were used to create the classes for some regions. The adjustment factor calculated within each class was obtained as follows:
householdsrespondingallforMweightsofSumhouseholdsallforMweightsofSum
33
The weight M3 of responding households was multiplied by this factor to produce the weight M4. Non-responding households were removed from the process at this point.
M5 – Person level weight As for adjustment A4, this adjustment converts the household level weight to a person level weight. Since the algorithm of selection of the person within the household is the same as the one used for the area frame, computation of the adjustment factor was done the same way. This factor, multiplied by the weight M4, gave the weight M5.
M6 - Person non-response This adjustment was similar to the adjustment A5 used for the area frame. It consisted of compensating for the effect of non-response at the person level. As for A5, an approach based on adjustment classes was used, where classes were defined from variables available for all selected persons, respondent or not (see A5 for the list of variables available). There is only one region out of four where a variable was significant to explain the non-response. The number of persons in the household and the number of persons less than 12 years old in the household are those variables. For the others, the adjustment was applied uniformly at the regional scale. Within each class, an adjustment factor was calculated as follows:
57

CCHS 2.2 - Nutrition: General Health & 24-Hour Dietary Recall Components – User Guide
personsselectedrespondingallforMweightsofSumpersonsselectedallforMweightsofSum
55
The weight M5 of responding persons was therefore multiplied by this adjustment factor to produce the weight M6. Non-responding persons were dropped out of the weighting process at this point.
Since this adjustment was the last one necessary for the sample drawn from the Manitoba Healthcare registry, weight M6 represents the final Manitoba Healthcare registry weight. This weight is later integrated with the final weight of the area frame (section 8.1.6) to create the final CCHS (Cycle 2.2) weight.
9.1.5 Weighting of the supplementary aboriginal frame An extra sample was selected in order to get a minimum sample size in terms of off-reserve non-Métis aboriginals. To achieve those sample size requirements, we needed first to identify which households could contain aboriginals. In order to do that, the CCHS Cycle 2.1 respondents were used once again. Every household for which the respondent declared being aboriginal for the Cycle 2.1 was part of the supplementary aboriginal frame.
S0 – Initial weight
The supplementary aboriginal sample is actually a census of all households for which the CCHS 2.1 respondent declared being aboriginal. The initial weight S0 is equal to the CCHS 2.1 household weight A4 adjusted for non-response (see PUMF user guide of Cycle 2.1).
S1 – Household non-response
The adjustment applied here to compensate for the effect of household non-response is similar to the ones applied for the other frames. One of the differences comes from the fact that classes are built from groupings of provinces instead of individual provinces because of the very small sample sizes involved. Provinces were grouped this way: East (NL, PEI, NS and NB), Centre (QC and ON) and West (AB and BC). Manitoba and Saskatchewan did not require grouping. The only variable that came out to be significant for the creation of the classes was the collection period. The adjustment factor calculated within the province was obtained as follows:
householdsrespondingallforSweightsofSumhouseholdsallforSweightsofSum
00
The weight S0 of responding households was multiplied by this factor to produce the weight S1. Non-responding households were removed from the process at this point.
As for the CCHS 2.1 list frame, out-of-scope units were not removed before processing the non-response. They are considered as non-respondents for the same reasons as described in L1.
58

CCHS 2.2 - Nutrition: General Health & 24-Hour Dietary Recall Components – User Guide
S2 – Person level weight
As for the other frames, this adjustment converts the household level weight to a person level weight by multiplying by the inverse of the probability of selection of the person within the household. One should note that the selected person is not necessarily an aboriginal. It is possible that the selected person is different than the one that was selected for CCHS 2.1 and that this person is not aboriginal. This particularity is taken into account during the integration step (I2). This factor, multiplied by the weight S1, gave the weight S2.
S3 - Person non-response
This adjustment is similar to the ones applied to the units of the other frames. It consists of compensating for the effect of non-response at the person level. The adjustment classes were created using the same groupings of provinces as for the household non-response (S1). The classes were defined from variables available for all selected persons, respondent or not (see A5 for the list of variables available). The sex was the most significant variable in the creation of the classes. Within each class, an adjustment factor was calculated as follows:
personsselectedrespondingallforSweightsofSumpersonsselectedallforSweightsofSum
22
The weight S2 of responding persons was therefore multiplied by this adjustment factor to produce the weight S3. Non-responding persons were dropped out of the weighting process at this point.
Since this adjustment was the last one necessary for the sample drawn from the supplementary aboriginal frame, weight S3 represents the final supplementary aboriginal frame weight. This weight is later integrated with the final weight of the other frames (section 8.1.7) to create the final CCHS (Cycle 2.2) weight. 9.1.6 Integration of the area and list frames (I1) This step consists of integrating the final area frame sampling weights and the final list frames' (CCHS 2.1 list frame, PEI and Manitoba Healthcare registries) sampling weights. As mentioned before, the CCHS 2.1 list frame was not used in the provinces where the Healthcare registries were used. There was only one list frame within a province. A method of integration41 was applied to create a single weight from the ones that were created before this point. An adjustment factor between 0 and 1 was determined in such a way that it represented the relative importance of each sample in the total sample. This relative importance was measured in terms of sample size and design effect. The larger the proportion a sample represented in the total sample, the higher was its relative importance in the total sample. For the design effect, the relative importance was bigger for units coming from the frame that had the smallest design effect (or variance).
However, the integration strategy had to be adjusted for the Cycle 2.2 to take account of the special features of the list frames. Indeed, since the coverage of the list frames in terms of household types differs from that of the area frame, the integration must take this difference into account. This is the reason why the integration was done separately for different types of respondents. These types are defined by the household composition in terms of age groups. Table 41. Skinner, C.J. and Rao, J.N.K. 1996. "Estimation in Dual Frame Surveys with Complex Designs." Journal of the American Statistical Association, 91, 433, 349-356.
59

CCHS 2.2 - Nutrition: General Health & 24-Hour Dietary Recall Components – User Guide
9.1 presents a comparison between the area frame coverage and the list frames’ coverage. Note that in order to simplify the notation, from now on, the word adult will be used to represent persons that are older than 18 years old whereas child will refer to persons that are 18 years old or younger.
Table 9.1 Coverage of the area and list frames for each type of respondent
Coverage Types of respondents * Area frame List frames A) Adults living in households with at least one child
Complete Null
B) Adults living in households without a child Complete Low C) Children Complete Good
*More types of respondents are added to this list for Ontario and PEI. Those types are the persons aged 71 years old and over living in households with at least one child. Moreover, for PEI, another type of respondent is added, that is, the persons aged 19-30 years old living in households with at least one child. All those types of respondents have complete coverage on the area frame and good coverage on the list frames.
A) Integration of adults living in households with at least one child
Since we could not get this type of respondent from the list frames, no adjustment is applied to the weight of these respondents. They keep the same weight as the final area frame weight (A5) that is now named I1.
B) Integration of adults living in households without a child
This type of respondent is present on the list frames, but in much smaller proportion than on the area frame. Indeed, since the list frames were created only from households with at least one child at the moment of their creation, the probability of finding household without a child is lower than when using the area frame. In addition, the sum of all household level weights of the list frames should represent the number of households with at least one child at the moment of their creation. However, because we get other types of households at the moment of collection, a part of the weights that should have represented households with at least one child is transferred to households without a child. This implies that the sum of weights of each of the household types underestimates the total population of those types of household. In order to represent well the adults living in households without a child on the list frames, an adjustment to the weights is applied before the integration. The area frame is used as a reference to compute the following adjustment within each province (or region for Ontario and Manitoba):
child a withouthouseholds from adults of )prov the on depending M6or P4 L3, weightsof Sumchild a withouthouseholds from adults of A6 weightsof Sum
.(
60
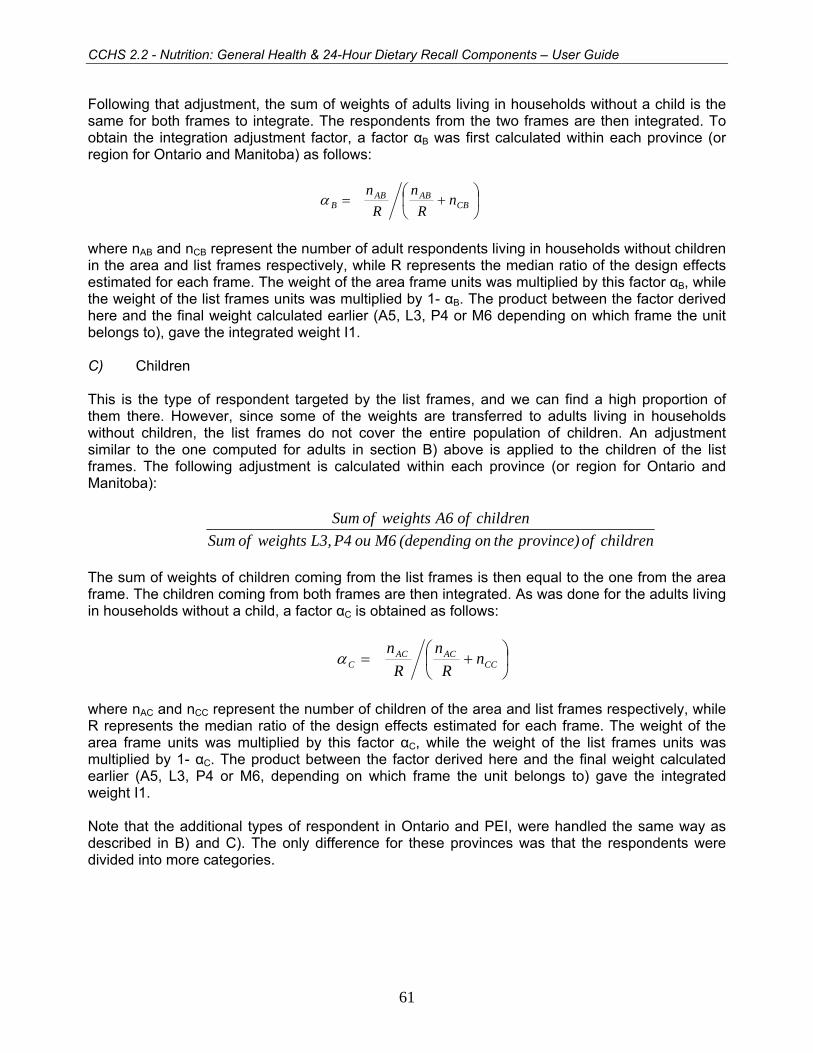
CCHS 2.2 - Nutrition: General Health & 24-Hour Dietary Recall Components – User Guide
Following that adjustment, the sum of weights of adults living in households without a child is the same for both frames to integrate. The respondents from the two frames are then integrated. To obtain the integration adjustment factor, a factor αB was first calculated within each province (or region for Ontario and Manitoba) as follows:
⎟⎠
⎞⎜⎝
⎛ += CBABAB
B nR
nR
nα
where nAB and nCB represent the number of adult respondents living in households without children in the area and list frames respectively, while R represents the median ratio of the design effects estimated for each frame. The weight of the area frame units was multiplied by this factor αB, while the weight of the list frames units was multiplied by 1- αB. The product between the factor derived here and the final weight calculated earlier (A5, L3, P4 or M6 depending on which frame the unit belongs to), gave the integrated weight I1.
C) Children
This is the type of respondent targeted by the list frames, and we can find a high proportion of them there. However, since some of the weights are transferred to adults living in households without children, the list frames do not cover the entire population of children. An adjustment similar to the one computed for adults in section B) above is applied to the children of the list frames. The following adjustment is calculated within each province (or region for Ontario and Manitoba):
children of province) the on (depending ou M6 P4 L3, weightsof Sumchildren of A6 weightsof Sum
The sum of weights of children coming from the list frames is then equal to the one from the area frame. The children coming from both frames are then integrated. As was done for the adults living in households without a child, a factor αC is obtained as follows:
⎟⎠⎞
⎜⎝⎛ += CC
ACACC n
Rn
Rn
α
where nAC and nCC represent the number of children of the area and list frames respectively, while R represents the median ratio of the design effects estimated for each frame. The weight of the area frame units was multiplied by this factor αC, while the weight of the list frames units was multiplied by 1- αC. The product between the factor derived here and the final weight calculated earlier (A5, L3, P4 or M6, depending on which frame the unit belongs to) gave the integrated weight I1.
Note that the additional types of respondent in Ontario and PEI, were handled the same way as described in B) and C). The only difference for these provinces was that the respondents were divided into more categories.
61

CCHS 2.2 - Nutrition: General Health & 24-Hour Dietary Recall Components – User Guide
9.1.7 Integration of the aboriginal frame with the other frames (I2) After integrating the area frame with the list frames, the last step in order to get one final sample is the integration of units coming from the aboriginal frame with units coming from the other frames. The principle is practically the same as the one of the integration I1. The respondents are divided into two categories: aboriginals and non-aboriginals. The weight of the aboriginal frame respondents is adjusted using the counts of the area frame before integrating by respondent type, that is, aboriginal or not. An integration factor is calculated based on the relative importance in terms of sample sizes of each frame. The following factor is computed within each province (or region in Ontario and Manitoba) for each type of respondent:
SI
IS nn
n+
=α
where nI and nS represent the number of respondents (aboriginals or not depending on the case) coming from the frames integrated in I1 and of the aboriginal frame respectively. The weight of the integrated frames units was multiplied by the factor αS, while the weight of the aboriginal frame units was multiplied by 1- αS. The product between the factor derived here and the final weight calculated earlier (I1 or S3 depending on which frame the unit belongs to), gave the weight I2. 9.1.8 Seasonal and day of the week effect (I3) The CCHS (Cycle 2.2) had initially planned to allocate the data collection equally throughout the twelve months of the survey’s reference year, partly to control for the seasonal effect in the data collected. However, some events affected these plans, with the result that an additional adjustment had to be added to ensure that there was no seasonal effect in the estimates produced using CCHS (Cycle 2.2) data. In addition to that, since the day of the week may have an impact on the intake of certain foods, particular attention had to be paid to the day of the interview. Indeed, if for instance the intake of a certain food is a lot higher during weekend days than during week days and if most interviews were conducted during the weekend, the intake of that food would surely be overestimated. The adjustment applied in I3 was done to reduce the effect of the season and of the day of the week. The adjustment is done so that the sum of the weights of all units interviewed during one of the four seasons would represent exactly 25 % of the total sum of weights of the province (or region in Ontario and Manitoba). Moreover, the adjustment ensures that the sum of weights for the interviews conducted on week days represents 4/7 of the weights of the season and the sum of weights of interviews conducted on weekend days represents 3/7 of the weights of the season because weekends were defined as including Friday, Saturday and Sunday. In other words, after applying the adjustment, the portion of the sample interviewed each season represented 25 % of the total population for each province and the portion of the sample interviewed on a week day represented 4/7 of the same population. The four seasons defined for the CCHS (Cycle 2.2) are the periods covering October to December, January to March, April to June and July to September. For the weekday/weekend day indicator, interviews that were conducted from Tuesday to Friday were considered as weekday interviews whereas interviews that were conducted from Saturday to Monday were considered as weekend interviews. The weekend is defined that way because the intake reported was associated with the previous day, therefore, a Monday interview asked about foods eaten on Sunday, for example. The adjustment factor I3 used to control the seasonal and the day of the week effect for a person interviewed during season S, is defined as:
62

CCHS 2.2 - Nutrition: General Health & 24-Hour Dietary Recall Components – User Guide
⎪⎪⎪
⎩
⎪⎪⎪
⎨
⎧
==
=
==
=
1 I if S seasonduring dinterviewe 1I with samplethe for I2 weightsof sumx 4
1I with sampletotal the for I2 weightsof Sumx
0 I if S seasonduring dinterviewe 0I with samplethe for I2 weightsof sumx 4
0I with sampletotal the for I2 weightsof Sumx
74
73
Where I = week day / weekend day indicator (=1 for week day, 0 otherwise) This adjustment applied to the weight I2 results in the weight I3. Note that following the series of adjustments applied to the respondents, some units may come out with outlier weights compared with other units of the same province. Some respondents could represent a large proportion of their province and hence strongly influence estimates for their province. In order to prevent that, the weight of the outlier units that represent a large proportion of their province-age-sex group is adjusted downward. Similarly, the weights that are considered abnormally low are adjusted upward. 9.1.9 Post-stratification (I4) The final step necessary to obtain the final CCHS (Cycle 2.2) weight was the post-stratification. Post-stratification was done to ensure that the sum of the final weights corresponded to the population estimates defined at the province level and at the region level for Ontario and Manitoba for all 15 DRI groups. Those groups of interest are defined by the age groups <1, 1-3, 4-8, without sex distinction as well as age groups 9-13, 14-18, 19-30, 31-50, 51-70, 71+, for males and females separately. The population estimates were based on the 2001 Census counts and counts of birth, death, immigration and emigration. The average of these 2004 monthly estimates for each of the province-age-sex (region-age-sex in Ontario and Manitoba) post-strata was used to post-stratify. The weight I3 was therefore adjusted to obtain the final weight I4 with the help of the adjustment factor I4 defined as follows:
respondent the of group sex-age-province the for I3 weightsof Sumrespondent the ofgroupsex-age-province the for estimate Population
Consequently, the weight I4 corresponds to the final CCHS (Cycle 2.2) weight that can be found on the data file with the variable name WTSD_M. 9.2 Weighting of the sub-sample with height and weight measures Initially, we planned to take measures of height and weight for all respondents aged two years old and over. However, some events changed this plan in such a way that it was impossible to take the measures for about 40 per cent of the sample. Refusal by the respondent to be measured, problems with measuring equipment, respondents too tall to be measured by the interviewer and interviews conducted on the phone are all examples of situations where the measures could not be taken on the respondents. Given the high number of respondents without measures of height and weight, it was decided to create a new weight that would apply only to the sub-sample of respondents for which measures were taken.
63

CCHS 2.2 - Nutrition: General Health & 24-Hour Dietary Recall Components – User Guide
MHW0 – Initial weight
The weighting strategy to create the height and weight measures weight is exactly the same as the regular weighting until step I3. The initial weight MHW0 is then equal to the integrated weight before post-stratification, that is, the weight I3.
MHW1 – Weight for measures of height and weight
This is the step where respondents who do not have height and weight measures are temporarily removed from the sample. The sampling weight of these respondents is redistributed to the respondents for which we have the measures. Note that the weight WTSD_MHW was created in order to analyse variables related to the BMI and is missing for some respondents even if we have height and weight measures for them. The BMI was not computed for those respondents because we could not tell whether or not those women were pregnant, and we do not compute the BMI for pregnant women. In order to reduce the bias that could have been introduced by the removal of the respondents without measures, the redistribution of the weight was done within homogeneous respondent classes in terms of probability of having the measures or not. Those classes were created using the same technique as the one used for the non-response, that is, using the CHAID algorithm available in Knowledge Seeker. Contrary to the non-response processing, all CCHS Cycle 2.2 variables were available for the respondents with or without measures. They all could be used in the creation of the classes. The age, sex, revenue, level of education and the number of foods declared for the 24-hour intake recall were the variables that were used most often in the creation of the classes. Many other variables correlated with the variable of interest were also used. Classes were created independently within each province (or region in Ontario and Manitoba) and the following adjustment factor was computed within each class:
measuresbody withsrespondent all for MHWO weightsof Sumsrespondent all for MHWO weightsof Sum
The weight MHW0 of respondents with body measures was multiplied by this adjustment factor to produce the weight MHW1. Respondents without body measures were dropped out of the weighting process at this point.
MHW2 – Post-stratification The post-stratification is basically the same as the one applied for the regular weighting. It is applied for the same regions and age-sex groups as was done in I4 except for the age groups <1 year and 1-3 years old which were modified because measures were not taken for respondents less than 2 years old. The sampling weight of pregnant women is then masked on the PUMF to preserve confidentiality. The weight MHW2 corresponds to the final CCHS (Cycle 2.2) weight for the height and weight sub-sample that can be found on the data file with the variable name WTSD_MHW.
64

CCHS 2.2 - Nutrition: General Health & 24-Hour Dietary Recall Components – User Guide
10. Data quality 10.1 Limitations of the data 10.1.1 Limitations of the 24-hour dietary recall data The 24-hour dietary recall component of the CCHS 2.2 questionnaire collects information about the kinds and amounts of foods consumed by respondents during the 24-hour period prior to the interview, from midnight to midnight. The recall component uses a computer-assisted interviewing instrument called Automated Multiple-Pass Method (AMPM) which was developed by the Food Surveys Research Group (FSRG) at the US Department of Agriculture (USDA). In collaboration with Health Canada, the AMPM was adapted to reflect the Canadian food supply and incorporate the metric system, and the tool was translated into French. The data obtained from the 24-hour dietary recalls are used to estimate food and nutrient intakes of respondents. However, the intake data are subject to sources of error which can affect data accuracy. According to Health Canada’s report titled The Canadian Community Health Survey, Cycle 2.2, Nutrition (2004): A Guide to Accessing and Interpreting the Data (July 2006), the two major sources of error are related to:42 1) the dietary information reported by survey participants. For example, food intakes could have been underreported because respondents forgot to mention or omitted reporting certain foods perceived as less healthy such as high-fat and/or high-sugar food items and alcohol. In some cases, the amount reported for the food item might not be precise because some respondents might have wrongly reported the amount served, but not the amount that was actually eaten.43 2) the data processing system which is used for coding the reported foods and calculating the nutrients contained in the foods. The database component of the Nutrition Survey System (NSS) was used in CCHS 2.2 for calculating the nutrient intakes of respondents. The NSS database contains the Canadian Standard Food Composition database, the Canadian Nutrient File, a modified version of the USDA CSFII recipe database and survey-specific foods. However, this database may not be complete for all nutrients and does not contain all the foods available in Canada. For more information about the factors affecting the accuracy of the 24-hour dietary recall intake data, see Health Canada’s report available at http://www.hc-sc.gc.ca/fn-an/surveill/nutrition/commun/index_e.html. A summary of the potential sources of error is listed in the table below: 42. Health Canada. Canadian Community Health Survey, (CCHS) 2.2, Nutrition (2004): A Guide to Accessing and Interpreting the Data. July 2006. Available at: http://www.hc-sc.gc.ca/fn-an/surveill/nutrition/commun/index_e.html. 43. Interviewers were instructed to record the amount of the food item eaten, not served. They were trained to probe carefully because respondents may be so intent on describing the size of the serving that they forget that the whole portion was not eaten.
65
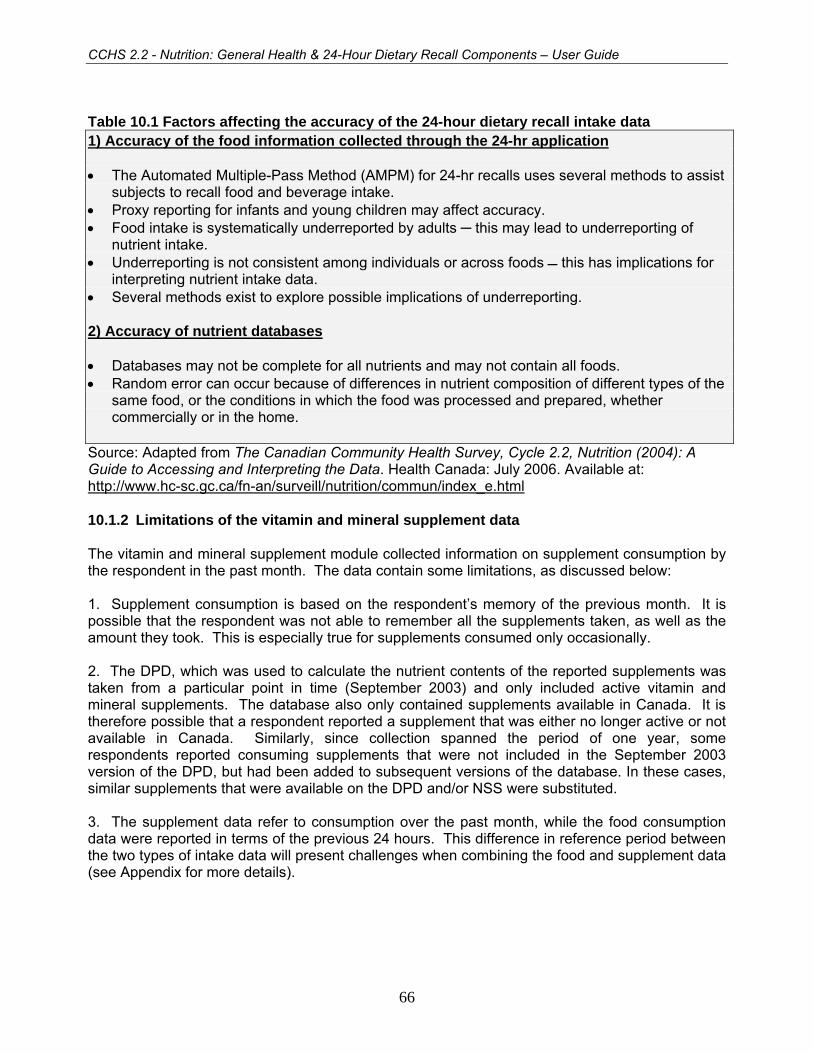
CCHS 2.2 - Nutrition: General Health & 24-Hour Dietary Recall Components – User Guide
Table 10.1 Factors affecting the accuracy of the 24-hour dietary recall intake data 1) Accuracy of the food information collected through the 24-hr application • The Automated Multiple-Pass Method (AMPM) for 24-hr recalls uses several methods to assist
subjects to recall food and beverage intake. • Proxy reporting for infants and young children may affect accuracy. • Food intake is systematically underreported by adults ─ this may lead to underreporting of
nutrient intake. • Underreporting is not consistent among individuals or across foods this has implications for
interpreting nutrient intake data. • Several methods exist to explore possible implications of underreporting. 2) Accuracy of nutrient databases • Databases may not be complete for all nutrients and may not contain all foods. • Random error can occur because of differences in nutrient composition of different types of the
same food, or the conditions in which the food was processed and prepared, whether commercially or in the home.
Source: Adapted from The Canadian Community Health Survey, Cycle 2.2, Nutrition (2004): A Guide to Accessing and Interpreting the Data. Health Canada: July 2006. Available at: http://www.hc-sc.gc.ca/fn-an/surveill/nutrition/commun/index_e.html 10.1.2 Limitations of the vitamin and mineral supplement data The vitamin and mineral supplement module collected information on supplement consumption by the respondent in the past month. The data contain some limitations, as discussed below: 1. Supplement consumption is based on the respondent’s memory of the previous month. It is possible that the respondent was not able to remember all the supplements taken, as well as the amount they took. This is especially true for supplements consumed only occasionally. 2. The DPD, which was used to calculate the nutrient contents of the reported supplements was taken from a particular point in time (September 2003) and only included active vitamin and mineral supplements. The database also only contained supplements available in Canada. It is therefore possible that a respondent reported a supplement that was either no longer active or not available in Canada. Similarly, since collection spanned the period of one year, some respondents reported consuming supplements that were not included in the September 2003 version of the DPD, but had been added to subsequent versions of the database. In these cases, similar supplements that were available on the DPD and/or NSS were substituted. 3. The supplement data refer to consumption over the past month, while the food consumption data were reported in terms of the previous 24 hours. This difference in reference period between the two types of intake data will present challenges when combining the food and supplement data (see Appendix for more details).
66

CCHS 2.2 - Nutrition: General Health & 24-Hour Dietary Recall Components – User Guide
10.2 Response rates In total and after removing the out-of-scope units, 45,889 households were selected to participate in the CCHS (Cycle 2.2). Out of these selected households a response was obtained for 38,725 which results in an overall household-level response rate of 84.4%. Among these responding households 38,725 individuals (one per household) were selected to participate in the survey, out of which a response was obtained for 35,107, which results in an overall person-level response rate of 90.7%. At the Canada level, this would yield a combined response rate of 76.5% for the CCHS (Cycle 2.2). Table 10.2 provides combined response rates as well as relevant information for calculation of them by province, health region or combined health region. The various components of the equation should be handled as follows to correctly compute combined response rates. Household-level response rate
HHRR = # of responding households in all frames all in-scope households in the frames
Person-level response rate
PPRR = # of responding persons in all frames all in-scope persons in the frames
Combined response rate = HHRR x PPRR
Using the information found in Table 9.1, we would calculate the combined response rate for Canada thus:
HHRR = 21 382 + 17 343 = 38 725 = 0,844 25 436 + 20 453 45 889
PPRR = 19 312 + 15 795 = 35 107 = 0,907 21 382 + 17 343 38 725
Combined response rate = 0.844 x 0.907
= 0.765
= 76.5%
67

CCHS 2.2 - Nutrition: General Health & 24-Hour Dietary Recall Components – User Guide
Table 10.2
Tableau 10.2 Area frame / Base aréolaire Other frames / Autres bases
All cases /
Tous les cas
Prov.
Prov.
Health Region
Région socio-
sanitaire
# in scope
HH
# mén. cibles
# resp. HH
# mén. rép.
HH resp. rates
Taux
de rép. mén.
# pers. select.
# pers. sélect.
# resp.
# rép.
Pers.resp.rates
Taux
derép.
pers.
Resp.rates
Tauxde
rép.
# in scope
HH
# mén.cibles
# resp.HH
# mén.rép.
HHresp.rates
Taux
derép.mén.
# pers. select.
# pers. sélect.
# resp.
# rép.
Pers. resp. rates
Taux
de rép.
pers.
Resp.rates
Tauxde
rép.
Combinedresp. rates
Taux
de rép.
combiné
CA Total 25436 21382 84.1 21382 19312 90.3 75.9 20453 17343 84.8 17343 15795 91.1 77.2 76.5
NL Total 1405 1273 90.6 1273 1189 93.4 84.6 677 604 89.2 604 545 90.2 80.5 83.3
PE Total 769 690 89.7 690 618 89.6 80.4 1037 896 86.4 896 812 90.6 78.3 79.2
NS Total 1275 1110 87.1 1110 1002 90.3 78.6 894 798 89.3 798 703 88.1 78.6 78.6
NB Total 1414 1227 86.8 1227 1060 86.4 75.0 742 646 87.1 646 573 88.7 77.2 75.7
QC Total 3741 3080 82.3 3080 2799 90.9 74.8 2569 2166 84.3 2166 1981 91.5 77.1 75.8
ON Total 7366 5947 80.7 5947 5273 88.7 71.6 7647 6244 81.7 6244 5648 90.5 73.9 72.7
35901 1025 859 83.8 859 783 91.2 76.4 1170 963 82.3 963 877 91.1 75.0 75.6
35902 963 759 78.8 759 645 85.0 67.0 1017 811 79.7 811 706 87.1 69.4 68.2
35903 1129 940 83.3 940 834 88.7 73.9 1135 961 84.7 961 878 91.4 77.4 75.6
35904 1063 853 80.2 853 754 88.4 70.9 1118 912 81.6 912 837 91.8 74.9 72.9
35905 975 747 76.6 747 662 88.6 67.9 1026 817 79.6 817 721 88.2 70.3 69.1
35906 1044 827 79.2 827 727 87.9 69.6 1096 878 80.1 878 799 91.0 72.9 71.3
35907 1167 962 82.4 962 868 90.2 74.4 1085 902 83.1 902 830 92.0 76.5 75.4
MA Total 2694 2374 88.1 2374 2211 93.1 82.1 2375 2112 88.9 2112 1983 93.9 83.5 82.7
46901* 705 628 89.1 628 583 92.8 82.7 1424 1272 89.3 1272 1193 93.8 83.8 83.4
46903 846 760 89.8 760 710 93.4 83.9 555 488 87.9 488 462 94.7 83.2 83.7
46904 1143 986 86.3 986 918 93.1 80.3 396 352 88.9 352 328 93.2 82.8 81.0
SK Total 1582 1331 84.1 1331 1195 89.8 75.5 1064 930 87.4 930 846 91.0 79.5 77.1
AB Total 2472 2083 84.3 2083 1894 90.9 76.6 1433 1232 86.0 1232 1127 91.5 78.6 77.4
BC Total 2718 2267 83.4 2267 2071 91.4 76.2 2015 1715 85.1 1715 1577 92.0 78.3 77.1
* = collapsed health regions
68

CCHS 2.2 - Nutrition: General Health & 24-Hour Dietary Recall Components – User Guide
10.3 Survey errors
The estimates derived from this survey are based on a sample of individuals. Somewhat different figures might have been obtained if a complete census had been taken using the same questionnaire, interviewers, supervisors, processing methods, etc. as those actually used. The difference between the estimates obtained from the sample and the results from a complete count under similar conditions is called the sampling error of the estimate.
Errors which are not related to sampling may occur at almost every phase of a survey operation. Interviewers may misunderstand instructions, respondents may make errors in answering questions, the answers may be incorrectly entered on the computer and errors may be introduced in the processing and tabulation of the data. These are all examples of non-sampling errors.
10.3.1 Non-sampling errors
Over a large number of observations, randomly occurring errors will have little effect on estimates derived from the survey. However, errors occurring systematically will contribute to biases in the survey estimates. Considerable time and effort was made to reduce non-sampling errors in the survey. Quality assurance measures were implemented at each step of data collection and processing to monitor the quality of the data. These measures included the use of highly skilled interviewers, extensive training with respect to the survey procedures and questionnaire, and the observation of interviewers to detect problems. Testing of the CAI application and field tests were also essential procedures to ensure that data collection errors were minimized.
A major source of non-sampling errors in surveys is the effect of non-response on the survey results. The extent of non-response varies from partial non-response (failure to answer just one or some questions) to total non-response. Partial non-response to CCHS (Cycle 2.2) was minimal; once the questionnaire was started, it tended to be completed with very little non-response. Total non-response occurred either because a person refused to participate in the survey, or because the interviewer was unable to contact the selected person. Total non-response was handled by adjusting the weight of persons who responded to the survey to compensate for those who did not respond. See section 9 for details of the weight adjustment for non-response.
10.3.2 Sampling errors
Since it is an unavoidable fact that estimates from a sample survey are subject to sampling error, sound statistical practice calls for researchers to provide users with some indication of the magnitude of this sampling error. The basis for measuring the potential size of sampling errors is the standard deviation of the estimates derived from survey results. However, because of the large variety of estimates that can be produced from a survey, the standard deviation of an estimate is usually expressed relative to the estimate to which it pertains. This resulting measure, known as the coefficient of variation (CV) of an estimate, is obtained by dividing the standard deviation of the estimate by the estimate itself and is expressed as a percentage of the estimate. For example, suppose hypothetically that one estimates that 25% of Canadians aged 12 and over are regular smokers and that this estimate is found to have a standard deviation of 0.003. Then the CV of the estimate is calculated as:
(0.003/0.25) x 100% = 1.20%
69

CCHS 2.2 - Nutrition: General Health & 24-Hour Dietary Recall Components – User Guide
Statistics Canada commonly uses CV results when analyzing data, and urges users producing estimates from CCHS (Cycle 2.2) data files to also do so. For details on how to determine CVs, see section 12. For guidelines on how to interpret CV results, see the table at the end of sub-section 11.5.
70

CCHS 2.2 - Nutrition: General Health & 24-Hour Dietary Recall Components – User Guide
11. Guidelines for tabulation, analysis and release This section of the documentation outlines the guidelines to be adhered to by users tabulating, analyzing, publishing or otherwise releasing any data derived from the survey microdata file. With the aid of these guidelines, users of microdata should be able to produce figures that are in close agreement with those produced by Statistics Canada and, at the same time, will be able to develop currently unpublished figures in a manner consistent with these established guidelines. 11.1 Rounding guidelines In order that estimates for publication or other release derived from this microdata file correspond to those produced by Statistics Canada, users are urged to adhere to the following guidelines regarding the rounding of such estimates:
a) Estimates in the main body of a statistical table are to be rounded to the nearest hundred units using the normal rounding technique. In normal rounding, if the first or only digit to be dropped is 0 to 4, the last digit to be retained is not changed. If the first or only digit to be dropped is 5 to 9, the last digit to be retained is raised by one. For example, in normal rounding to the nearest 100, if the last two digits are between 00 and 49, they are changed to 00 and the preceding digit (the hundreds digit) is left unchanged. If the last digits are between 50 and 99 they are changed to 00 and the proceeding digit is incremented by 1;
b) Marginal sub-totals and totals in statistical tables are to be derived from their corresponding unrounded components and then are to be rounded themselves to the nearest 100 units using normal rounding;
c) Averages, proportions, rates and percentages are to be computed from unrounded components (i.e., numerators and/or denominators) and then are to be rounded themselves to one decimal using normal rounding. In normal rounding to a single digit, if the final or only digit to be dropped is 0 to 4, the last digit to be retained is not changed. If the first or only digit to be dropped is 5 to 9, the last digit to be retained is increased by 1;
d) Sums and differences of aggregates (or ratios) are to be derived from their corresponding unrounded components and then are to be rounded themselves to the nearest 100 units (or the nearest one decimal) using normal rounding;
e) In instances where, due to technical or other limitations, a rounding technique other than normal rounding is used, resulting in estimates to be published or otherwise released that differ from corresponding estimates published by Statistics Canada, users are urged to note the reason for such differences in the publication or release document(s);
f) Under no circumstances are unrounded estimates to be published or otherwise released by users. Unrounded estimates imply greater precision than actually exists. 11.2 Sample weighting guidelines for tabulation The sample design used for this survey was not self-weighting. That is to say, the sampling weights are not identical for all individuals in the sample. When producing simple estimates, including the production of ordinary statistical tables, users must apply the proper sampling weight. If proper weights are not used, the estimates derived from the microdata files cannot be
71

CCHS 2.2 - Nutrition: General Health & 24-Hour Dietary Recall Components – User Guide
considered to be representative of the survey population, and will not correspond to those produced by Statistics Canada.
Users should also note that some software packages might not allow the generation of estimates that exactly match those available from Statistics Canada, because of their treatment of the weight field.
11.2.1 Definitions: categorical estimates, quantitative estimates
Before discussing how the survey data can be tabulated and analyzed, it is useful to describe the two main types of point estimates of population characteristics that can be generated from the microdata file.
Categorical Estimates:
Categorical estimates are estimates of the number or percentage of the surveyed population possessing certain characteristics or falling into some defined category. The number of individuals who smoke daily is an example of such an estimate. An estimate of the number of persons possessing a certain characteristic may also be referred to as an estimate of an aggregate.
Example of Categorical Question:
At the present do/does ... smoke cigarettes daily, occasionally or not at all? (SMKD_202)
__ Daily __ Occasionally __ Not at all
Quantitative estimates:
Quantitative estimates are estimates of totals or of means, medians and other measures of central tendency of quantities based upon some or all of the members of the surveyed population.
An example of a quantitative estimate is the average number of cigarettes smoked per day by individuals who smoke daily. The numerator is an estimate of the total number of cigarettes smoked per day by individuals who smoke daily, and its denominator is an estimate of the number of individuals who smoke daily.
Example of quantitative question:
How many cigarettes do/does you/he/she smoke each day now? (SMKD_204) |_|_| Number of cigarettes
72

CCHS 2.2 - Nutrition: General Health & 24-Hour Dietary Recall Components – User Guide
11.2.2 Tabulation of categorical estimates Estimates of the number of people with a certain characteristic can be obtained from the microdata file by summing the final weights of all records possessing the characteristic of interest. Proportions and ratios of the form are obtained by: Y / X ˆˆ
a) summing the final weights of records having the characteristic of interest for the numerator
( X ); b) summing the final weights of records having the characteristic of interest for the
denominator ( Y ); then c) dividing the numerator estimate by the denominator estimate.
11.2.3 Tabulation of quantitative estimates Estimates of sums or averages for quantitative variables can be obtained using the following three steps (only step a) is necessary to obtain the estimate of a sum):
a) multiplying the value of the variable of interest by the final weight and summing this quantity
over all records of interest to obtain the numerator ( X );
b) summing the final weights of records having the characteristic of interest for the denominator ( Y ); then
c) dividing the numerator estimate by the denominator estimate.
For example, to obtain the estimate of the average number of cigarettes smoked each day by individuals who smoke daily, first compute the numerator ( X ) by calculating the product between the value of variable SMKD_204 and the weight WTSD_M. Next, sum this value over those records with a value of "daily" to the variable SMKD_202. The denominator (Y ) is obtained by summing the final weight of those records with a value of "daily" to the variable SMKD_202. Divide (
ˆ
X ) by ( ) to obtain the average number of cigarettes smoked each day by daily smokers. Y
73
CCHS 2.2 - Nutrition: General Health & 24-Hour Dietary Recall Components – User Guide
11.3 Guidelines for statistical analysis The CCHS is based upon a complex design, with stratification and multiple stages of selection, and unequal probabilities of selection of respondents. Using data from such complex surveys presents problems to analysts because the survey design and the selection probabilities affect the estimation and variance calculation procedures that should be used.
While many analysis procedures found in statistical packages allow weights to be used, the meaning or definition of the weight in these procedures can differ from what is appropriate in a sample survey framework, with the result that while in many cases the estimates produced by the packages are correct, the variances that are calculated are almost meaningless.
For many analysis techniques (for example linear regression, logistic regression, analysis of variance), a method exists that can make the application of standard packages more meaningful. If the weights on the records are rescaled so that the average weight is one (1), then the results produced by the standard packages will be more reasonable; they still will not take into account the stratification and clustering of the sample design, but they will take into account the unequal probabilities of selection. The rescaling can be accomplished by using in the analysis a weight equal to the original weight divided by the average of the original weights for the sampled units (people) contributing to the estimator in question.
In order to provide a means of assessing the quality of tabulated estimates, Statistics Canada has produced a set of Approximate Coefficients of Variations Tables (commonly referred to as "CV Tables") for the CCHS. These tables can be used to obtain approximate coefficients of variation for categorical-type estimates and proportions. See section 12 for more details.
11.4 Software for Intake Distribution (SIDE)
Two food consumption concepts must be distinguished when working with food data: one-day intake and usual intake. One-day intake is the total nutrient intake over a 24-hour period. These data are collected during an interview in which respondents are asked to describe everything they ate from midnight to midnight the previous day. Usual intake is an overview of food typically consumed in a day.
Usual intake cannot be directly estimated based on one-day intake. Usual intake varies from one individual to another. One-day intake, too, varies from one individual to another, but for a given individual, it also varies from day to day. Therefore, to estimate usual intake, it is necessary to interview some respondents more than once and then separate the variation within an individual’s intake and that between individuals. To do this, Software for Intake Distribution Estimation (SIDE), developed by Iowa State University to separate these variance components, was used. With a series of mathematical transformations, the software is able to estimate each component of the variance and to estimate the distribution of usual intake of a nutrient. For more information about SIDE, please see the Statistics Canada’s document titled “Canadian Community Health Survey (CCHS) Cycle 2.2 (Nutrition) – Software for Intake Distribution Estimation (SIDE) Documentation” (June 2006).
74

CCHS 2.2 - Nutrition: General Health & 24-Hour Dietary Recall Components – User Guide
11.5 Release guidelines Before releasing and/or publishing any estimate from the microdata file, users must first determine the number of sampled respondents having the characteristic of interest (for example, the number of respondents who smoke when interested in the proportion of smokers for a given population). If this number is less than 30, the weighted estimate should not be released regardless of the value of the coefficient of variation for this estimate. For weighted estimates based on sample sizes of 30 or more, users should determine the coefficient of variation of the rounded estimate and follow the guidelines below.
Table 11.1: Sampling Variability Guidelines Type of Estimate CV (in %) Guidelines
Acceptable 0.0 ≤ CV ≤ 16.6 Estimates can be considered for general unrestricted release. Requires no special notation.
Marginal 16.6 < CV ≤ 33.3
Estimates can be considered for general unrestricted release but should be accompanied by a warning cautioning subsequent users of the high sampling variability associated with the estimates. Such estimates should be identified by the letter E (or in some other similar fashion).
Unacceptable CV > 33.3
Statistics Canada recommends not releasing estimates of unacceptable quality. However, if the user chooses to do so, then estimates should be flagged with the letter F (or in some other fashion) and the following warning should accompany the estimates: “The user is advised that . . . (specify the data) . . . do not meet Statistics Canada’s quality standards for this statistical program. Conclusions based on these data will be unreliable and most likely invalid. These data and any consequent findings should not be published. If the user chooses to publish these data or findings, then this disclaimer must be published with the data.”
75
CCHS 2.2 - Nutrition: General Health & 24-Hour Dietary Recall Components – User Guide
12. Approximate sampling variability tables In order to supply coefficients of variation that would be applicable to a wide variety of categorical estimates produced from this microdata file and that could be readily accessed by the user, a set of Approximate Sampling Variability Tables (also referred to as CV tables), has been produced. These "look-up" tables allow the user to obtain an approximate coefficient of variation based on the size of the estimate calculated from the survey data. The coefficients of variation (CV) are derived using the variance formula for simple random sampling and incorporating a factor which reflects the multi-stage, clustered nature of the sample design. This factor, known as the design effect, was determined by first calculating design effects for a wide range of characteristics and then choosing, for each table produced, a conservative value among all design effects relative to that table. The value chosen was then used to generate a table that applies to the entire set of characteristics.
The design effects, sample sizes and population counts used to produce the Approximate Sampling Variability Tables as well as the tables are presented in Appendix E. One should note that there are two sets of CV tables, one set for the total sample and one for the sub-sample with exact measures of body mass index. The set of tables to use depends on the characteristic that is estimated. If the characteristic to estimate is based on a variable related to the sub-sample with exact body mass index measures (see section 12.2 for the list of variables), the CV tables of that sub-sample must be used. If the characteristic to estimate is not based on one of those variables, the total sample CV tables must be used. All coefficients of variation in the Approximate Sampling Variability Tables are approximate and, therefore, unofficial. Options concerning the computation of exact coefficients of variation are discussed in sub-section 12.7. Remember: As indicated in Sampling Variability Guidelines in section 11.5, if the number of observations on which an estimate is based is less than 30, the weighted estimate should not be released regardless of the value of the coefficient of variation. Coefficients of variation based on small sample sizes are too unpredictable to be adequately represented in the tables. 12.1 How to use the CV tables for categorical estimates The following rules should enable the user to determine the approximate coefficients of variation from the Sampling Variability Tables for estimates of the number, proportion or percentage of the surveyed population possessing a certain characteristic and for ratios and differences between such estimates. Rule 1: Estimates of numbers possessing a characteristic (aggregates) The coefficient of variation depends only on the size of the estimate itself. On the appropriate Approximate Sampling Variability Table, locate the estimated number in the left-most column of the table (headed "Numerator of Percentage") and follow the asterisks (if any) across to the first figure encountered. Since not all the possible values for the estimate are available, the smallest value which is the closest must be taken (as an example, if the estimate is equal to 1,700 and the two closest available values are 1,000 and 2,000, the first has to be chosen). This figure is the approximate coefficient of variation.
76

CCHS 2.2 - Nutrition: General Health & 24-Hour Dietary Recall Components – User Guide
Rule 2: Estimates of proportions or percentages possessing a characteristic The coefficient of variation of an estimated proportion (or percentage) depends on both the size of the proportion and the size of the numerator upon which the proportion is based. Estimated proportions are relatively more reliable than the corresponding estimates of the numerator of the proportion when the proportion is based upon a sub-group of the population. This is due to the fact that the coefficients of variation of the latter type of estimates are based on the largest entry in a row of a particular table, whereas the coefficients of variation of the former type of estimators are based on some entry (not necessarily the largest) in that same row. (Note that in the tables the CVs decline in value reading across a row from left to right). For example, the estimated proportion of individuals who smoke daily out of those who smoke at all is more reliable than the estimated number who smoke daily. When the proportion (or percentage) is based upon the total population covered by each specific table, the CV of the proportion is the same as the CV of the numerator of the proportion. In this case, this is equivalent to applying Rule 1. When the proportion (or percentage) is based upon a subset of the total population (e.g., those who smoke at all), reference should be made to the proportion (across the top of the table) and to the numerator of the proportion (down the left side of the table). Since not all the possible values for the proportion are available, the smallest value which is the closest must be taken (for example, if the proportion is 23% and the two closest values available in the column are 20% and 25%, 20% must be chosen). The intersection of the appropriate row and column gives the coefficient of variation.
Rule 3: Estimates of differences between aggregates or percentages The standard error of a difference between two estimates is approximately equal to the square root of the sum of squares of each standard error considered separately. That is, the standard error of a difference ( ) is: 12
ˆˆˆ XXd −=
) X( + ) X( = 222
112
d αασ ˆˆˆ
where is estimate 1, is estimate 2, and α1 and α2 are the coefficients of variation of and
respectively. The coefficient of variation of is given by
1X 2X 1X
2X d d / dˆˆσ . This formula is accurate for
the difference between independent populations or subgroups, but is only approximate otherwise. It will tend to overstate the error, if and are positively correlated and understate the error if
and are negatively correlated. X 1ˆ X 2ˆ
X 1ˆ X 2ˆ
77

CCHS 2.2 - Nutrition: General Health & 24-Hour Dietary Recall Components – User Guide
Rule 4: Estimates of ratios In the case where the numerator is a subset of the denominator, the ratio should be converted to a percentage and Rule 2 applied. This would apply, for example, to the case where the denominator is the number of individuals who smoke at all and the numerator is the number of individuals who smoke daily out of those who smoke at all. Consider the case where the numerator is not a subset of the denominator, as for example, the ratio of the number of individuals who smoke daily or occasionally as compared to the number of individuals who do not smoke at all. The standard deviation of the ratio of the estimates is approximately equal to the square root of the sum of squares of each coefficient of variation considered separately multiplied by , where is the ratio of the estimates ( ). That is, the standard error of a ratio is:
R R X / X = R 21 ˆˆˆ
αασ 22
12
R + R = ˆˆ
where α1 and α2 are the coefficients of variation of and respectively. X 1ˆ X 2ˆ
The coefficient of variation of R is given by αασ 22
12
R + = R / ˆˆ . The formula will tend to overstate the error, if and are positively correlated and understate the error if and are negatively correlated.
X 1ˆ X 2ˆ X 1ˆ X 2ˆ
Rule 5: Estimates of differences of ratios In this case, Rules 3 and 4 are combined. The CVs for the two ratios are first determined using Rule 4, and then the CV of their difference is found using Rule 3. 12.2 Examples of using the CV tables for categorical estimates The following "real life" examples are included to assist users in applying the foregoing rules. Example 1: Estimates of numbers possessing a characteristic (aggregates) Suppose that a user estimates that 5,137,429 individuals (aged 12 and over) smoke daily in Canada. How does the user determine the coefficient of variation of this estimate? 1) Refer to the CANADA level CV table. 2) The estimated aggregate (5,137,429) does not appear in the left-hand column (the "Numerator of Percentage" column), so it is necessary to use the smallest figure closest to it, namely 5,000,000. 3) The coefficient of variation for an estimated aggregate (expressed as a percentage) is found by referring to the first non-asterisk entry on that row, namely, 2.8%. 4) So the approximate coefficient of variation of the estimate is 2.8%. According to the Sampling Variability Guidelines presented in Section 10.4, the finding that there were 5,137,429
78
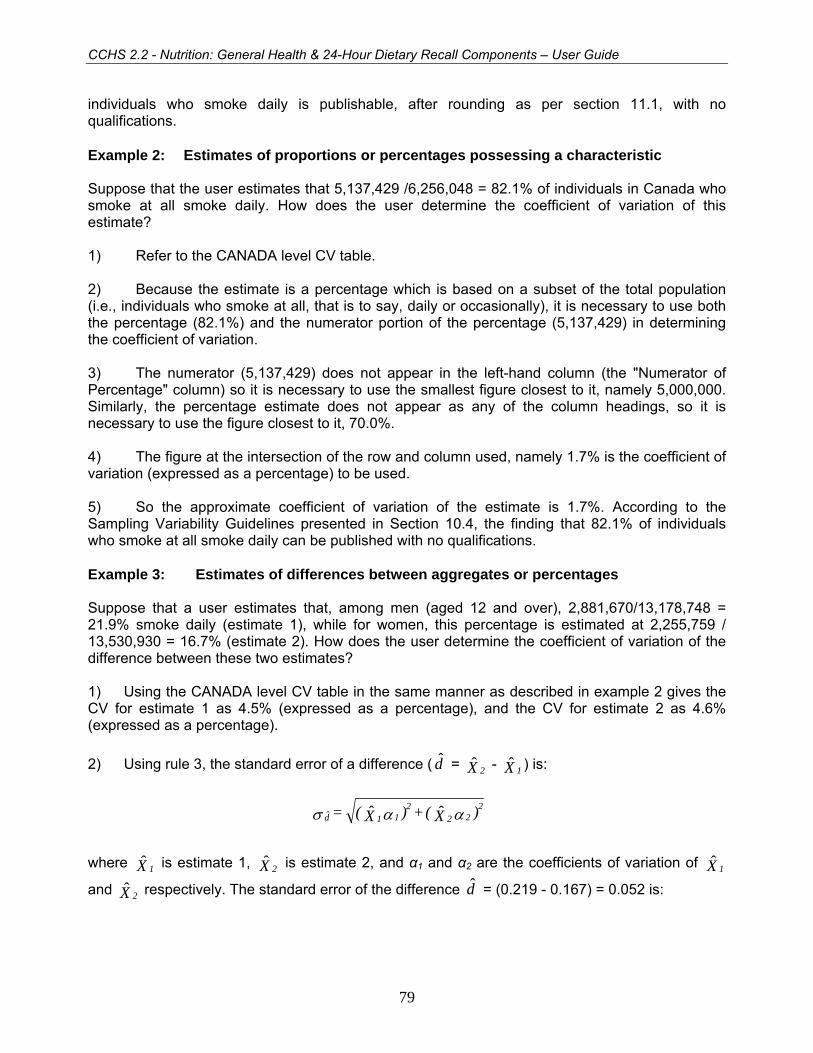
CCHS 2.2 - Nutrition: General Health & 24-Hour Dietary Recall Components – User Guide
individuals who smoke daily is publishable, after rounding as per section 11.1, with no qualifications. Example 2: Estimates of proportions or percentages possessing a characteristic Suppose that the user estimates that 5,137,429 /6,256,048 = 82.1% of individuals in Canada who smoke at all smoke daily. How does the user determine the coefficient of variation of this estimate? 1) Refer to the CANADA level CV table. 2) Because the estimate is a percentage which is based on a subset of the total population (i.e., individuals who smoke at all, that is to say, daily or occasionally), it is necessary to use both the percentage (82.1%) and the numerator portion of the percentage (5,137,429) in determining the coefficient of variation. 3) The numerator (5,137,429) does not appear in the left-hand column (the "Numerator of Percentage" column) so it is necessary to use the smallest figure closest to it, namely 5,000,000. Similarly, the percentage estimate does not appear as any of the column headings, so it is necessary to use the figure closest to it, 70.0%. 4) The figure at the intersection of the row and column used, namely 1.7% is the coefficient of variation (expressed as a percentage) to be used. 5) So the approximate coefficient of variation of the estimate is 1.7%. According to the Sampling Variability Guidelines presented in Section 10.4, the finding that 82.1% of individuals who smoke at all smoke daily can be published with no qualifications. Example 3: Estimates of differences between aggregates or percentages Suppose that a user estimates that, among men (aged 12 and over), 2,881,670/13,178,748 = 21.9% smoke daily (estimate 1), while for women, this percentage is estimated at 2,255,759 / 13,530,930 = 16.7% (estimate 2). How does the user determine the coefficient of variation of the difference between these two estimates? 1) Using the CANADA level CV table in the same manner as described in example 2 gives the CV for estimate 1 as 4.5% (expressed as a percentage), and the CV for estimate 2 as 4.6% (expressed as a percentage).
2) Using rule 3, the standard error of a difference ( = - ) is: d X 2ˆ X 1ˆ
) X( + ) X( = 222
112
d αασ ˆˆˆ
where is estimate 1, is estimate 2, and α1 and α2 are the coefficients of variation of
and respectively. The standard error of the difference = (0.219 - 0.167) = 0.052 is: X 1ˆ X 2ˆ X 1ˆ
X 2ˆ d
79

CCHS 2.2 - Nutrition: General Health & 24-Hour Dietary Recall Components – User Guide
01200460167004502190ˆ
. = )].)(.[( + )].)(.[( = 22
dσ
3) The coefficient of variation of is given by d d / dˆˆσ = 0.012/0.052 = 0.231.
4) So the approximate coefficient of variation of the difference between the estimates is 23.1% (expressed as a percentage). According to the Sampling Variability Guidelines presented in Section 10.4, this estimate can be published with no qualifications. Example 4: Estimates of ratios
Suppose that the user estimates that 5,137,429 individuals smoke daily, while 1,118,619 individuals smoke occasionally. The user is interested in comparing the estimate of daily to occasional smokers in the form of a ratio. How does the user determine the coefficient of variation of this estimate?
1) First of all, this estimate is a ratio estimate, where the numerator of the estimate (= ) is the number of individuals who smoke occasionally. The denominator of the estimate (= ) is the number of individuals who smoke daily.
X 1ˆ
X 2ˆ
2) Refer to the CANADA level CV table. 3) The numerator of this ratio estimate is 1,118,244. The smallest figure closest to it is 1,000,000. The coefficient of variation for this estimate (expressed as a percentage) is found by referring to the first non-asterisk entry on that row, namely, 6.9%. 4) The denominator of this ratio estimate is 5,137,429. The figure closest to it is 5,000,000. The coefficient of variation for this estimate (expressed as a percentage) is found by referring to the first non-asterisk entry on that row, namely, 2.8%. 5) So the approximate coefficient of variation of the ratio estimate is given by rule 4, which is,
ααα 22
12
R + = ˆ ,
That is,
074.0
028.0069.0ˆ
=
)( + )( = 22Rα
where α1 and α2 are the coefficients of variation of and respectively. The obtained ratio of occasional to daily smokers is 1,118,619/5,137,429 which is 0.22:1. The coefficient of variation of this estimate is 7.4% (expressed as a percentage), which is releasable with no qualifications, according to the Sampling Variability Guidelines presented in Section 10.4.
X 1ˆ X 2ˆ
80

CCHS 2.2 - Nutrition: General Health & 24-Hour Dietary Recall Components – User Guide
12.3 How to use the CV tables to obtain confidence limits Although coefficients of variation are widely used, a more intuitively meaningful measure of sampling error is the confidence interval of an estimate. A confidence interval constitutes a statement on the level of confidence that the true value for the population lies within a specified range of values. For example a 95% confidence interval can be described as follows: if sampling of the population is repeated indefinitely, each sample leading to a new confidence interval for an estimate, then in 95% of the samples the interval will cover the true population value. Using the standard error of an estimate, confidence intervals for estimates may be obtained under the assumption that under repeated sampling of the population, the various estimates obtained for a population characteristic are normally distributed about the true population value. Under this assumption, the chances are about 68 out of 100 that the difference between a sample estimate and the true population value would be less than one standard error, about 95 out of 100 that the difference would be less than two standard errors, and about 99 out of 100 that the differences would be less than three standard errors. These different degrees of confidence are referred to as the confidence levels. Confidence intervals for an estimate, X , are generally expressed as two numbers, one below the estimate and one above the estimate, as ( X -k, X +k), where k is determined depending upon the level of confidence desired and the sampling error of the estimate. Confidence intervals for an estimate can be calculated directly from the Approximate Sampling Variability Tables by first determining from the appropriate table, the coefficient of variation of the estimate X , and then using the following formula to convert to a confidence interval CI:
] Xz + X , Xz - X [ = CI XXX αα ˆˆ ˆˆˆˆ
where α X is determined coefficient of variation for X , and z = 1 if a 68% confidence interval is desired z = 1.6 if a 90% confidence interval is desired z = 2 if a 95% confidence interval is desired
z = 3 if a 99% confidence interval is desired. Note: Release guidelines presented in section 10.4 which apply to the estimate also apply to the confidence interval. For example, if the estimate is not releasable, then the confidence interval is not releasable either.
81

CCHS 2.2 - Nutrition: General Health & 24-Hour Dietary Recall Components – User Guide
12.4 Example of using the CV tables to obtain confidence limits A 95% confidence interval for the estimated proportion of individuals who smoke daily from those who smoke at all (from example 2, sub-section 12.2) would be calculated as follows:
X = 0.821
z = 2
α X = 0.017 is the coefficient of variation of this estimate as determined from the
tables.
CIX = {0.821 - (2) (0.821) (0.017), 0.821 + (2) (0.821) (0.017)}
CIX = {0.793, 0.849} 12.5 How to use the CV tables to do a Z-test Standard errors may also be used to perform hypothesis testing, a procedure for distinguishing between population parameters using sample estimates. The sample estimates can be numbers, averages, percentages, ratios, etc. Tests may be performed at various levels of significance, where a level of significance is the probability of concluding that the characteristics are different when, in fact, they are identical. Let and be sample estimates for 2 characteristics of interest. Let the standard error of the difference - be
X 1ˆ X 2ˆ
X 1ˆ X 2ˆ σ d If the ratio of - over X 1ˆ X 2ˆ σ d is between -2 and 2, then no conclusion about the difference between the characteristics is justified at the 5% level of significance. If however, this ratio is smaller than -2 or larger than +2, the observed difference is significant at the 0.05 level.
12.6 Example of using the CV tables to do a Z-test Let us suppose we wish to test, at 5% level of significance, the hypothesis that there is no difference between the proportion of men who smoke daily AND the proportion of women who smoke daily. From example 3, sub-section 11.2, the standard error of the difference between these two estimates was found to be = 0.012. Hence,
3.4012.0052.0
012.0167.0219.0ˆˆ
ˆ = = - = X - X =z
d
21
σ
Since z = 4.3 is greater than 2, it must be concluded that there is a significant difference between the two estimates at the 0.05 level of significance. Note that the two sub-groups compared are considered as being independent, so the test is correct.
82

CCHS 2.2 - Nutrition: General Health & 24-Hour Dietary Recall Components – User Guide
12.7 Exact variances/coefficients of variation All coefficients of variation in the Approximate Sampling Variability Tables (CV Tables) are indeed approximate and, therefore, unofficial. The computation of exact coefficients of variation is not a straightforward task since there is no simple mathematical formula that would account for all CCHS sampling frame and weighting aspects. Therefore, other methods such as resampling methods must be used in order to estimate measures of precision. Among these methods, the bootstrap method is the one recommended for analysis of CCHS data.
The computation of coefficients of variation (or any other measure of precision) with the use of the bootstrap method requires access to information that is considered confidential and not available on the public use microdata file. This computation must be done using the Master file. Access to the Master file is discussed in section 13.4.
For the computation of coefficients of variation, the bootstrap method is advised. A macro program, called “Bootvar”, was developed in order to give users easy access to the bootstrap method. The Bootvar program is available in SAS and SPSS formats, and is made up of macros that calculate the variances of totals, ratios, differences between ratios, and linear and logistic regressions.
There are a number of reasons why a user may require an exact variance. A few are given below. Firstly, if a user desires estimates at a geographic level other than those available in the tables (for example, at the rural/urban level), then the CV tables provided are not adequate. Coefficients of variation of these estimates may be obtained using "domain" estimation techniques through the exact variance program. Secondly, should a user require more sophisticated analyses such as estimates of parameters from linear regressions or logistic regressions, the CV tables will not provide correct associated coefficients of variation. Although some standard statistical packages allow sampling weights to be incorporated in the analyses, the variances that are produced often do not take into account the stratified and clustered nature of the design properly, whereas the exact variance program would do so. Thirdly, for estimates of quantitative variables, separate tables are required to determine their sampling error. Since most of the variables for the CCHS are primarily categorical in nature, this has not been done. Thus, users wishing to obtain coefficients of variation for quantitative variables can do so through the exact variance program. As a general rule, however, the coefficient of variation of a quantitative total will be larger than the coefficient of variation of the corresponding category estimate (i.e., the estimate of the number of persons contributing to the quantitative estimate). If the corresponding category estimate is not releasable, the quantitative estimate will not be either. For example, the coefficient of variation of the estimate of the total number of cigarettes smoked each day by individuals who smoke daily would be greater than the coefficient of variation of the corresponding estimate of the number of individuals who smoke daily. Hence if the coefficient of variation of the latter is not releasable, then the coefficient of variation of the corresponding quantitative estimate will also not be releasable. Lastly, should users find themselves in a position where they can use the CV tables, but this renders a coefficient of variation in the "marginal" range (16.6% - 33.3%), the user should release
83

CCHS 2.2 - Nutrition: General Health & 24-Hour Dietary Recall Components – User Guide
the associated estimate with a warning cautioning users of the high sampling variability associated with the estimate. This would be a good opportunity to recalculate the coefficient of variation through the exact variance program to find out if it is releasable without a qualifying note. The reason for this is that the coefficients of variation produced by the tables are based on a wide range of variables and are therefore considered crude, whereas the exact variance program would give an exact coefficient of variation associated with the variable in question.
12.8 Release cut-offs for the CCHS Appendix E presents tables giving the minimum cut-offs for estimates of totals at the Canada, provincial and health region levels and those for various age groups at the Canada level. There are tables for the total sample and tables for the exact measured body mass index sub-sample. Estimates smaller than the value given in the "Marginal" column may not be released under any circumstances.
84
CCHS 2.2 - Nutrition: General Health & 24-Hour Dietary Recall Components – User Guide
13. File usage
This section begins by describing the different weight variables of the public use microdata file and explains how they should be used when doing tabulations. This is followed by an explanation of the variable naming convention that is employed by the CCHS. The last part of the section discusses alternate approaches for data access available to analysts. 13.1 Principal sampling weight First, the weight variable WTSD_M represents the principal CCHS Cycle 2.2 sampling weight. For a given respondent, the sampling weight can be interpreted as the number of people the respondent represents in the population. The sampling weight must always be used when computing statistical estimates in order to make inference at the population level possible. The weight variable WTSD_M must always be used, except if the analysis includes variables related to the exact measured body mass index. The production of unweighted estimates is not recommended; the sample allocation, as well as the survey design specifics, causes such results to be biased in correctly representing the population. Refer to section 9 on weighting for a more detailed explanation of the creation of this weight. Note that a household weight was also created to analyse household issues relevant to nutrition, such as food security. The household weight is available in a separate data file and its relevant information can be found in the document titled “Canadian Community Health Survey (CCHS) Cycle 2.2 (Nutrition) – Household Weights” (Statistics Canada, June 2006). 13.2 Exact measured body mass index weight Most of the variables can be analysed using the weight WTSD_M. However, in order to analyse variables related to the exact measured body mass index, the weight WTSD_MHW must be used. Here is the list of variables for which that weight variable must be used: MHWDGHTM, MHWDGWTK, MHWDGBMI, MHWDGISW and MHWDGCOL. For example, if we are interested in crossing the body mass index (BMI) classification for persons 18 years old and over (MHWDGISW) with the education level of the respondent (EDUDDR04), we must use the weight WTSD_MHW, even if the variable EDUDDR04 is available for all respondents. Tables 13.1 and 13.2 give the results of that cross-tabulation using the wrong and the right weight respectively.
85

CCHS 2.2 - Nutrition: General Health & 24-Hour Dietary Recall Components – User Guide
Table 13.1 Results using the wrong weight (WTSD_M) EDUDDR04
MHWDGISW
Less than secondary school graduation
Secondary school graduation, no post-secondary education
Some post-secondary education
Post-secondary degree/diploma
Total
Underweight 70,580 52,770 29,913 118,747 272,010
Normal weight 790,927 1,049,469 551,367 2,966,304 5,358,068Overweight 962,170 819,911 439,929 2,623,916 4,845,925Obese – Class I,II,III 841,368 634,189 262,474 1,439,233 3,177,264
Total 2,665,045 2,556,339 1,283,683 7,148,200 13,653,267 Table 13.2 Results using the right weight (WTSD_MHW) EDUDDR04
MHWDGISW
Less than secondary school graduation
Secondary school graduation, no post-secondary education
Some post-secondary education
Post-secondary degree/diploma
Total
Underweight 114,036 94,632 49,768 212,880 471,315
Normal weight 1,328,276 1,864,471 960,449 5,075,780 9,228,976
Overweight 1,692,783 1,436,898 763,445 4,662,882 8,556,007
Obese – Class I,II,III 1,410,899 1,113,254 436,421 2,512,821 5,473,395
Total 4,545,994 4,509,255 2,210,083 12,464,363 23,729,693 Note that the weight WTSD_MHW was created in order to analyse variables related to the BMI and is missing for some respondents even if valid height and weight measurements were reported. BMI is not calculated for pregnant women. In some cases, according to the answers provided, it was not possible to determine the pregnancy status of a female respondent. 13.3 Variable naming convention The CCHS adopted a variable naming convention that allows data users to easily use and identify the data based on module and cycle. The variable naming convention includes the following mandatory requirements: restrict variable names to a maximum of 8 characters for ease of use by analytical software products; identify the survey occasion (Cycle 2.2, 1.2 …) in the name; and allow conceptually identical variables to be easily identifiable over survey occasions. The variable
86

CCHS 2.2 - Nutrition: General Health & 24-Hour Dietary Recall Components – User Guide
names for these identical modules and questions should only differ in the cycle position identifying the particular survey occasion in which they were collected. 13.3.1 Variable name component structure in CCHS Each of the eight characters in a variable name contains information about the type of data contained in the variable. Positions 1-3: Module/Questionnaire section name Position 4: Survey cycle Position 5: Variable type Positions 6-8: Question number For example: The variable from question 202, Smoking Module, CCHS Cycle 2.2 (SMKD_202): Position 1-3: SMK smoking module Position 4: D Cycle 2.2 Position 5: _ underscore ( _ = collected data) Position 6-8: 202 question number & answer option
13.3.2 Positions 1-3: Variable / Questionnaire section name The following values are used for the section name component of the variable name:
ADM Administrative information INC Income ALC Alcohol use LBF Labour force CCC Chronic conditions MHW Measured height and weight CPA Children's’ physical activity PAC Physical activity
DHH Demographic and household variables R24 24-Hour Dietary Recall
EDU Education SAC Sedentary activity FSC Food security SAM Sample identifiers FSD Food summary detail SDC Sociodemographic identifiers FVC Fruit and vegetable consumption SMK Smoking GEN General health VSD Vitamin summary detail GEO Geographic identifiers WHC Women’s health HWT Self-reported height and weight WTS Weights
13.3.3 Position 4: Cycle Cycle Description A Cycle 1.1: Canadian Community Health Survey : Regional level survey, stratified by health region : Common content and optional content selected by health region : Estimates for health regions, provinces, territories and Canada B Cycle 1.2: Canadian Community Health Survey, Mental Health and Well-Being : Provincial level survey : Focus content with additional, general content
87

CCHS 2.2 - Nutrition: General Health & 24-Hour Dietary Recall Components – User Guide
: Estimates for the provinces and Canada C Cycle 2.1: Canadian Community Health Survey : Regional level survey, stratified by health region : Common content and optional content selected by health region : Estimates for health regions, provinces, territories and Canada D Cycle 2.2: Canadian Community Health Survey, Nutrition : Provincial level survey : Focus content with additional, general content : Estimates for the provinces and Canada 13.3.4 Position 5: Variable type
_ Collected variable A variable that appeared directly on the questionnaire
C Coded variable A variable coded from one or more collected variables (e.g., SIC, Standard Industrial Classification code)
D Derived variable A variable calculated from one or more collected or coded variables, usually calculated during head office processing (e.g., Health Utility Index)
F Flag variable A variable calculated from one or more collected variables (like a derived variable), but usually calculated by the data collection computer application for later use during the interview (e.g., work flag)
G Grouped variable Collected, coded, suppressed or derived variables collapsed into groups (e.g., age groups)
13.3.5 Positions 6-8: Variable name In general, the last three positions follow the variable numbering used on the questionnaire. The letter "Q" used to represent the word "question" is removed, and all question numbers are presented in a two-digit or three-digit format. For example, question Q01A in the questionnaire becomes simply 01A, and question Q15 becomes simply 15. For questions which have more than one response option, the final position in the variable naming sequence is represented by a letter. For this type of question, new variables were created to differentiate between a “yes” or “no” answer for each response option. For example, if Q2 had 4 response options, the new questions would be named 2A for option 1, 2B for option 2, 2C for option 3, etc. If only options 2 and 3 were selected, then 2A = No, 2B = Yes, 2C = Yes and 2D = No. 13.4 Access to Master file data In order to protect the confidentiality of respondents participating in the survey, microdata files must meet stringent security and confidentiality standards required by the Statistics Act before they are released for public access. To ensure that these standards have been achieved, each microdata file goes through a formal review process to ensure that an individual cannot be identified. Rare values in variables that may lead to identification of an individual are suppressed
88
CCHS 2.2 - Nutrition: General Health & 24-Hour Dietary Recall Components – User Guide
on the file or are collapsed to broader categories so that individual disclosure is minimized. Frequently, these are the variables that are most critical for doing a complete and comprehensive analysis of the survey data. Since a significant amount of resources is spent on collecting these data, ensuring that the microdata files reach their full analytical potential is important for a complete return on the statistical investment. One approach for any user is the production of custom tabulations done by the Client Custom Services staff in Health Statistics Division. This service allows users who do not possess knowledge of tabulation software products to get custom results. The results are screened for confidentiality and reliability concerns before release. There is a charge for this service. A second approach is the Research Data Centres Program, which allows researchers to submit to Statistics Canada a research project that uses data from the Master File. These projects are accepted based on a set of specific rules. When the project is accepted, the researcher is designated as a "deemed employee" of Statistics Canada for the duration of the research, and given access to the Master File data from designated Statistics Canada sites. For more information, please consult the Statistics Canada webpage: http://www.statcan.ca/english/rdc/index.htm. Finally, the remote access service to the survey master file is another way to have access to these data if for some reason, the user cannot access a RDC. Each purchaser of the microdata product can be supplied with a ‘dummy’ test master file and a corresponding record layout. With this, the user can spend time developing a set of analytical computer programs using the test file to confirm that the program commands are functioning correctly. At that point, the code for the custom tabulations is then sent via e-mail to [email protected]. The code will then be transferred into Statistics Canada’s internal secured network and processed using the appropriate master file of CCHS Cycle 2.2 data. Estimates generated will be released to the user, subject to meeting the guidelines for analysis and release outlined in Section 10 of this document. Results are screened for confidentiality and reliability concerns and, once these have been addressed, the output is returned to the client. There is no charge for this service.
89

CCHS 2.2 - Nutrition: General Health & 24-Hour Dietary Recall Components – User Guide
Appendix 1: Analytical issues 1. Vitamin and mineral supplement data Vitamin and mineral supplement data files With the Wave 3 release of the CCHS 2.2 files, data on vitamin and mineral supplement consumption are now available. These data are available in a number of different files, including:
1. Vitamin and Mineral Description (VDC) file: This is an administrative type database in that it does not contain information provided by respondents, but rather provides information on the supplements that were consumed by respondents. The file contains the Drug Identification Number (DIN), the product description, the dosage and dosage form, as well as the ingredients and their concentrations per dosage unit. In contrast to the Food Description File (FDC), the VDC contains only records for vitamin and mineral supplements reported by at least one respondent.
2. Vitamin and Mineral Detail (VMD) file: This file provides information for each supplement
consumed by a respondent. In this file, respondents have one record per supplement consumed (up to a maximum of ten). Respondents who did not consume any supplements are not included on this file. Variables on this file include the DIN, the consumption pattern, a derived variable that indicates the number of days in a month the supplement was consumed, as well as the average daily nutrient intakes from each supplement.
3. Vitamin and Mineral Summary (VSD) file: This file contains one record for each
respondent, even respondents who did not consume any supplements. Variables on this file include whether the respondent consumed a supplement, the number of different supplements consumed, and the total average daily nutrient intake from all supplements.
4. HS and HS_SIDE file: Flags indicating whether a respondent consumed a nutrient in
supplement form are included on the HS and HS_SIDE files. Also on these files are variables which indicate whether the respondent consumed a supplement and the number of different supplements consumed. The HS_SIDE file contains the same variables as the HS file, except in a format to be used with the SIDE software.
Not all analysis will require the use of all the files. For some analysis, the VSD will meet the user’s needs if the user is interested only in total nutrient intakes from supplements. Analysts interested in combining the food and supplement data to determine levels of nutrient inadequacy in the population will likely be more interested in the VMD in order to examine patterns of supplement consumption to identify infrequent consumers. Combining food and supplement data Analytical challenges The Wave 3 release includes separate nutrient intakes from food and supplements. Statistics Canada will not be combining the food and supplement data together for users. Combining these data is complicated in that it requires a number of assumptions on the part of the analyst. Furthermore, these assumptions will change depending on the type of analysis being performed. These decisions are best left to the analyst to make on a case by case basis. When combining the food and supplement data, users should be aware of a number of issues, including:
90

CCHS 2.2 - Nutrition: General Health & 24-Hour Dietary Recall Components – User Guide
1. Daily intake versus usual intake: The supplement data were collected as part of the
general health component and not part of the 24 hour recall. The questions on supplement consumption referred to consumption over the past 30 days. Because of this we do not have a measure of daily intake for supplements as we do for food.
2. No second recall: Because the supplement data were collected as part of the general
health component, we do not have a second recall as we do for food. It is therefore impossible to know how the day-to-day variation in supplement consumption influences the day-to-day variation based on food. This will affect the adjustments that are done using SIDE to calculate usual intake from daily intake.
3. Infrequent consumers: These respondents are an issue regardless of whether the data
were collected as part of the second recall or not. These are people who take supplements occasionally and possibly in very large doses. Infrequent consumers have high within person variance.
4. Not all nutrients can be combined: Vitamin E is included on the supplement file but not the
food files. As well, there are many more fat variables for food than for supplements. Finally, Vitamin A cannot be combined as it is measured differently for food and supplements.
Methods The distinction between daily and usual intake is very important to keep in mind when combining the food and supplement data. Daily intake is calculated from one dietary recall. It exhibits variation not only between individuals but also between days in one individual (within person variance). Usual intake is the long-run average intake. In order to calculate usual intake SIDE (or a similar software) is used to adjust the first recall with the second recall to remove the within person variance. The supplement module on the CCHS 2.2 measures usual intake (consumption over a thirty day period). However, we do not have a measure of daily intake from a dietary recall. Without a measure of daily intake it is impossible to asses the effects of within person variability on supplement consumption. The British Columbia Nutrition Survey (BCNS) collected information on daily and usual intake, which made it possible to assess the effects of within person variance. The BCNS found that in their survey, within person variance was extremely small, approaching zero for 80% to 90% of the sample. Thus, most respondents consumed supplements on a regular basis. Within person variability in the CCHS 2.2 sample is unknown. While Statistics Canada will not be combining the food and supplement intake data, there are a number of strategies analysts can use to combine these data. Listed below are three common methods that have been used with other datasets to combine food and supplement data.
1. Method One: The first method is the ideal method in that it adjusts for within person variance for both food and supplements. Because this method requires at least two recalls for both the food and supplement data it cannot be used with the CCHS 2.2 dataset. To combine food and supplement data the user would:
o Add daily food intake and daily supplement intake (first recall)
91

CCHS 2.2 - Nutrition: General Health & 24-Hour Dietary Recall Components – User Guide
o Add daily food intake and daily supplement intake (second recall) o Adjust first recall with second recall
While this method does account for within person variability in both food and supplement consumption, infrequent consumers remain a problem with this method. These respondents may only take supplements occasionally. Thus infrequent consumers who consumed on the days of the recalls would be counted as being regular consumers, while consumers who did not consume on the days of the recalls would not be captured. A similar problem is consumers who took very large doses on the days of the recalls but not on a regular basis. These respondents could skew the distribution with their very large but infrequent intake.
2. Method Two: The second method, while not ideal, is possible with the CCHS 2.2 dataset.
To use this method, the user needs to make the assumption that within person variability in supplement consumption is zero. This would be the case for respondents who consumed the same supplement every day in the same amount. With this method, the user would:
o Add daily food intake (first recall) and average supplement intake o Add daily food intake (second recall) and average supplement intake o Adjust first recall with second recall
The main limitation of this approach is that it assumes the within person variance in supplement consumption is zero, which is not the case. The degree to which within person variance exists in the CCHS 2.2 is unknown and cannot be assessed without a measure of usual and daily intake. At the very least, the user should look at the supplement consumption pattern containing the nutrient of interest to assess the validity of the assumption. Another assumption with this method is that all supplements are being absorbed in the same way. Because we are using an average daily intake over a 30 day period, the assumption is that taking one dose daily is the same as taking the equivalent dose weekly. This may or may not be the case, depending on the nutrient and the supplement.
3. Method Three: As with the second approach, to apply this approach, the user assumes
that the consumption of supplements is the same every day (within person variance is zero). For this approach, the user would:
o Adjust the first food recall with the second food recall o Add the adjusted food intake and average supplement intake (unadjusted)
The difference between this method and the previous method is the timing of the adjustment to calculate usual intake from daily intake. With the second method food and supplement intakes are added together before the first recall is adjusted by the second recall. With the third method, food and supplement intakes are added after the adjustment for usual intake. As with the second method, the main limitation with this approach is that within person variance is not zero. As well, we are assuming that all supplements are being absorbed in the same way. In addition, the user is also assuming that food and supplement intakes are independent. We know that this is not necessarily true as past research has found that supplement consumers are more likely to have adequate nutrient intakes. Finally, this
92

CCHS 2.2 - Nutrition: General Health & 24-Hour Dietary Recall Components – User Guide
method also requires the use of an individual usual intake. Even if SIDE can be used to derive such an individual usual intake, the result could be biased, especially with only two dietary recalls. According to the theory, with only two dietary recalls, only group usual intake distributions should be done.
While it is possible to combine the food and supplement information, data users need to be aware of the issues surrounding this type of analysis. The analyst will need to make assumptions which can have an impact on how the results are analyzed and interpreted. Data users are encouraged to refer to the following documents outlining the methods described above in more detail. References British Columbia Ministry of Health Services: British Columbia Nutrition Survey, Report on Energy and Nutrient Intakes. 2004. Carriquiry, AL: Estimation of Usual Intake Distributions of Nutrients and Foods. The Journal of Nutrition 2003: 601S-608S. Dwyer J, Picciano MF, Raiten DJ and Members of the Steering Committee: Estimation of Usual Intakes: What we Eat in America—NHANES. The Journal of Nutrition 2003: 609S-623S.
93

CCHS 2.2 - Nutrition: General Health & 24-Hour Dietary Recall Components – User Guide
2. Household food security status Introduction Since 2004, Statistics Canada has collected detailed data on income-related household food security on selected cycles of the Canadian Community Health Survey (CCHS). The food security module included in these cycles of the CCHS – the Household Food Security Survey Module (HFSSM) – was adapted from the United States Food Security Survey Module. The HFSSM contains 18 questions about the food security situation in the household over the previous 12 months. Ten questions relate to the situation of adult household members or that of the household in general, while eight questions relate to the experience of the children in the household. The number of affirmative responses to these questions is used to derive food security status. The original derived variable of household food security status that is included in the CCHS dataset (i.e., FSCnDHFS) is based on the standard methodology historically used in the United States. For more information on this method of measuring household food security and how this variable is derived, please see the derived variables documentation. Compared to the food security derived variable published on the CCHS 2.2 data file (the U.S. standard method), Health Canada used a different method to derive the food security status estimates published in its 2007 report entitled Canadian Community Health Survey, Cycle 2.2, Nutrition (2004) – Income-Related Household Food Security in Canada. A brief description of the differences between the U.S. standard method to derive food security status and the Health Canada method appears below. Users of these data are encouraged to consult Income-Related Household Food Security in Canada for more information about the methodology used by Health Canada. Key Methodological Changes in Deriving Food Security Status: Health Canada The Health Canada method results in three categories of food security status compared to the four that are included in the CCHS dataset, based on the original U.S. standard method. The three categories of food security status derived by the Health Canada method are: 1. food secure: no, or one indication of difficulty with income-related food access 2. moderately food insecure: indication of compromise in quality and/or quantity of food
consumed 3. severely food insecure: indication of reduced food intake and disrupted eating patterns. The Health Canada method differs from the U.S. standard method in two other aspects:
• In determining the food security status of households with children, the U.S. standard method considers all 18 items of the HFSSM in one scale. Conversely, the Health Canada method first determines the food security status of adult members of the household and food security status of child members of the household. If the status of either the adult or child members is food insecure, so is the household. This modification, on its own, would result in somewhat lower estimates of household food insecurity compared to the U.S. method.
• According to the Health Canada method, the threshold for food insecurity is set at two affirmative responses – a lower threshold than traditionally used in the U.S. (i.e. three). This change, on its own, would result in higher estimates of food insecurity when compared to the standard U.S. method.
94

CCHS 2.2 - Nutrition: General Health & 24-Hour Dietary Recall Components – User Guide
Analyzing the Data: Use of Statistical Weights Analysis of the food security variables using the person weight variable will produce estimates of the number of people living in households with a given food security status, as well as associated prevalence rates. It is important to note that this is different than estimating the number of individuals with a given food security status, a concept which cannot be measured using the HFSSM. For CCHS 2.2, it is also possible to analyze the data using the household weight variable. Analysis with the household weight will yield estimates of the number of households with a given food security status. This is appropriate as the data collected using the HFSMM are reflective of the household, not the individual respondent. Household weights for the HFSMM are currently only available for the CCHS 2.2. However, household weights will soon be made available for Cycle 3.1 for analysis at the provincial and territorial level of geography only. For methodological reasons, household weights cannot be produced for health regions. Beginning with Cycle 4.1, provincial and territorial household weights will become a standard product. For more information regarding the use of household weights, please consult the CCHS 2.2 Nutrition Household Weights documentation published by Statistics Canada. For Further Information If you have questions or require further information, please send an e-mail to [email protected] or [email protected]
95