canadian preferred shares report - michael fahy $us-pay preferred ... investor has converted to a...
TRANSCRIPT

CIBC Wood Gundy is a division of CIBC World Markets Inc., P.O. Box 500, 161 Bay Street, Toronto, Canada M5J 2S8 (416) 594-7000 www.cibcwoodgundy.com
Market Recap and Commentary Last year was a tough one for global equity markets, however it will undoubtedly mark a year many Canadian preferred share investors will want to forget. The S&P/TSX Preferred Share Index fell 19.3% — only 2008 was a worse year in its 13-year history. Including dividends, the preferred share index generated a -15.0% return in 2015, significantly lagging the S&P/TSX Composite Index (-8.3%) and the FTSE TMX Canada Universe Bond Index (+3.5%). The price performance of the Canadian preferred share market over the past 13 months can be principally attributed to the decline in interest rates. Most sensitive to interest rates are fixed-reset and floating rate preferreds, which declined 24.0% and 29.2%, respectively, in 2015. To a lesser extent perpetual (-7.0%) and retractable (-4.8%) preferreds also ended the year off below where they started. While the Canadian preferred share market’s path has become more strongly correlated with falling interest rates there have been other potent forces at work.
One of the key market movers over the past three months in particular has been the issuance of more than $2.7 billion in new preferreds. Given recent investor aversion towards preferreds, issuers have been forced to get creative with their offerings in order to spur demand in preferred shares. This led to the creation of fixed-reset preferred shares with a floor on the reset rate. This will protect buyers of the preferreds from any further interest rate declines — perhaps an empty insurance policy given the 5-Year Government of Canada bond yield (5YR GoC) is a mere 0.68%. While these new instruments have high coupons, they still represent a relatively cheap method of raising capital in the eyes of issuers, given rising corporate bond yields.
Last year’s price declines prompted some investors to take advantage of tax-loss selling in December. Many of those investors appeared keen on maintaining exposure to the asset class, and thus bought preferred share exchange-traded funds (ETFs), which saw inflows spike 430% in December compared to the average over the previous 11 months. The vast inflows enjoyed by these ETFs added considerable buying pressure into the market, helping to end the year off on a positive note.
Canadian Preferred Shares Report February 2016
Preferred Share Returnsa S&P/TSX Prefs vs GoC 5-Yr Yield Preferred Share Type YTD Average Yield
Source: Bloomberg
Retractable 0.1% 5.52% Perpetual -2.8% 5.82% Fixed-Reset -13.4% 7.01% Floating Rate -6.9% 5.08% Index Name Total Return S&P/TSX Preferred Share Index -10.4% FTSE TMX Corporate Bond Index 0.0% S&P/TSX Composite -1.2% Source: Bloomberg and FTSE TMX Global Debt Capital Markets; a – As of January 29, 2016
Inside This Issue 2 DBRS Rating Changes 3 Reset & Exchange Options 5 New Developments 6 Retractable Preferred Shares
Cash Retractable
Soft Retractable
7 Perpetual Preferred Shares Cumulative
Non-Cumulative
12 Fixed-Reset Preferred Shares Cumulative
Non-Cumulative
16 Floating Rate Preferred Shares Cumulative
Non-Cumulative
18 $US-Pay Preferred Shares Fixed-Resets
Retractable
Structured
19 Structured Preferred Shares Possible Early Redemption
No Early Redemption
21 Index of Preferred Shares 24 Disclosures & Disclaimers

Investment Strategy Group | Canadian Preferred Shares Report
Heading into 2016, the sharp decline in the price of oil coupled with growing concerns over global growth resulted in investors pricing in an additional rate cut by the Bank of Canada (BoC). This resulted in the S&P/TSX Preferred Share Index losing 9.0% over the first 20 days of the year. Despite the BoC holding firm on January 20, signaling that it will wait for fiscal stimulus to have a chance to formulate and play out, rates continued their slide downward, taking the preferred share market with them. 2016 Market Outlook Looking forward to the rest of 2016, we foresee a continuation of the factors currently impacting the market. The Canadian preferred share market remains an ideal place for issuers to raise capital without diluting their common shareholders holdings’ or increasing leverage through debt issuance. Preferred shares will most likely experience downward pressure each time an attractive new issue comes to market as investors roll out of existing holdings to buy the one with better protection to falling rates. Regardless of any other factor, depressed interest rates will continue to be the dark cloud hanging over the head of the preferred share market. While the BoC opted to keep interest rates steady at its January decision we know from experience that it will do whatever it takes to keep the economy afloat, even if that means additional monetary stimulus in the form of rate cuts. In this regard, investors can look to the path of crude oil prices, the underlying cause of Canada’s low interest rates, for signs of when the interest rate factor can return to being a positive factor for their fixed-reset and floating rate issues. DBRS Ratings Changes
Exhibit 1: Recent DBRS Rating Changes
Issuer Symbols Action Rating Trend Date
Brookfield Renewable Energy Partners L.P. BRF.PR.A; B; C; E; F Under Review - Developing Pfd-3H -- Jan 13, 2016
Sun Life Financial Inc. SLF.PR.A; B; C; D; E; G; J; H; I Downgraded Pfd-2 Stb Dec 17, 2015
Power Financial Corp. PWF.PR.A; E; F; G; H; I; K; L; O; P; R; S; T Downgraded Pfd-2H Stb Dec 17, 2015
Power Corporation of Canada POW.PR.A; B; C; D; E; F; G Downgraded Pfd-2 Stb Dec 17, 2015
Great-West Lifeco Inc. GWO.PR.F; G; H; I; L; M; N; P; Q; R; S Downgraded Pfd-2H Stb Dec 17, 2015
Manulife Financial Corp. MFC.PR.A; B Downgraded Pfd-2 Stb Dec 17, 2015
Co-operators General Insurance Company CCS.PR.C Upgraded Pfd-2L Stb Dec 17, 2015
Intact Financial Corp. IFC.PR.A; C Upgraded Pfd-2 Stb Dec 17, 2015
Big Bank Big Oil Split Corp. BBO.PR.A Downgraded Pfd-3 -- Dec 17, 2015
Shaw Communications Inc. SJR.PR.A Under Review - Negative Pfd-3 -- Dec 17, 2015
Source: DBRS

Investment Strategy Group | Canadian Preferred Shares Report
Resets & Exchange Options From the beginning of November into January there have been eight conversion options for fixed-reset investors to consider. Recall that fixed-reset preferred share investors have the option to convert their fixed-reset preferreds into floating-rate preferreds on the reset date as long as the issue is not called1. As investors contemplated the probability that interest rates will be lower for longer they have become more reluctant to convert their fixed-resets to floating rate. This is despite fixed rate coupons being reset substantially lower and the fact that, in certain periods, the spread between the 5YR GoC and 90-Day T-Bill was near historic lows at the time of reset. The remainder of 2016 will see 24 fixed-reset issues face a reset with the average reset spread of these issues being 2.32%. Given our view that interest rates in 2016 will remain under pressure we believe that few issuers will call their preferred shares that come up for reset as it will be much cheaper for them to let the share roll over to a lower coupon for another five years. When determining whether to remain in the fixed-rate issue or convert to a floating rate issue we encourage investors to consider not only where interest rates are today but also where they may be further down the road. If you’re of the conviction that the 90-Day T-Bill will average a rate greater than the existing 5YR GoC over the next 5 year period, you may want to
consider taking the floating rate option. We would like to remind investors that once an investor has converted to a floating rate issue they have the option to switch back to the fixed-rate issue on the subsequent reset date. 1. Always check a prospectus to ensure this option is available
Exhibit 2: Past Conversions
Source: Bloomberg; a – Over the five-year Government of Canada bond yield; b – Not enough shares elected for conversion in order for floating rate shares to be issued; c – Shares not yet trading as of pricing date; d – Calculated as 3.9x 5YR GoC
90-Day T-Bill Rate vs. 5-Year GoC Rate Over The Past Five Years
Source: Bloomberg
Series Symbol Price 29-Jan-16 DBRS Rating Reset Spreada Reset Date
Dividend Rate Exchangeable Into
Share Allocation Series Symbol Price
29-Jan-16 Floating Rate Terms Previous Current Fixed-Rate Floating Rate
R BCE.PR.R $16.65 Pfd-3H -- d 1-Dec-15 4.49% 4.13% Q N/Ab N/Ab 50% - 100% of Prime 98% 2%
1 CPX.PR.A $9.30 Pfd-3L 2.17% 31-Dec-15 4.60% 3.06% 2 N/Ab N/Ab 90-Day T-Bill Yld +2.17% 81% 19%
I FFH.PR.I $15.75 Pfd-3 2.85% 31-Dec-15 5.00% 3.71% J FFH.PR.J $14.20 90-Day T-Bill Yld +2.85% 87% 13%
N GWO.PR.N $12.02 Pfd-2H 1.30% 31-Dec-15 3.64% 2.18% O GWO.PR.O $12.00 90-Day T-Bill Yld +1.30% 85% 15%
A INE.PR.A $12.60 NR 2.79% 15-Jan-16 5.00% 3.61% B N/Ab N/Ab 90-Day T-Bill Yld +2.79% 89% 11%
5 TRP.PR.C $11.29 Pfd-2L 1.54% 30-Jan-16 4.40% 2.26% 6 TRP.PR.I N/Ac 90-Day T-Bill Yld +1.54% 91% 9%
P PWF.PR.P $12.04 Pfd-2H 1.60% 31-Jan-16 4.40% 2.10% Q PWF.PR.Q N/Ac 90-Day T-Bill Yld +1.60% 80% 20%
32 BNS.PR.Z $18.89 Pfd-2H 1.34% 2-Feb-16 3.70% 1.84% 33 BNS.PR.F N/Ac 90-Day T-Bill Yld +1.34% 68% 32%

Investment Strategy Group | Canadian Preferred Shares Report
Exhibit 3: Preferred Shares With Reset Dates In 2016
Current: Potential New:a DBRS Price Annual Annual Next Call Annual Annual Symbol Rating 29-Jan-16 Div % Div $ Price Date Yield to Terms of Reset Div % Div $
BCE Inc. BCE.PR.M Pfd-3H $13.63 4.85% $1.21 $ 25.00 31-Mar-2016 85.64% 5YR GoC Yld +2.09% 2.77% $0.69 First National Financial Corp. FN.PR.A Pfd-3 $9.63 4.65% $1.16 $ 25.00 31-Mar-2016 162.62% 5YR GoC Yld +2.07% 2.75% $0.69 GMP Capital Inc. GMP.PR.B Pfd-3L *- $9.35 5.50% $1.38 $ 25.00 31-Mar-2016 171.05% 5YR GoC Yld +2.89% 3.57% $0.89 Husky Energy Inc. HSE.PR.A Pfd-2L $8.90 4.45% $1.11 $ 25.00 31-Mar-2016 184.02% 5YR GoC Yld +1.73% 2.41% $0.60 RONA Inc. RON.PR.A Pfd-4H $13.10 5.25% $1.31 $ 25.00 31-Mar-2016 93.34% 5YR GoC Yld +2.65% 3.33% $0.83 TransAlta Corp. TA.PR.D Pfd-3 $7.85 4.60% $1.15 $ 25.00 31-Mar-2016 222.12% 5YR GoC Yld +2.03% 2.71% $0.68 BCE Inc. BCE.PR.G Pfd-3H $13.17 4.50% $1.13 $ 25.00 1-May-2016 91.95% ≥80% of 5YR GoC Yld -- -- CU Inc. CIU.PR.C Pfd-2H $10.87 3.80% $0.95 $ 25.00 1-Jun-2016 134.37% 5YR GoC Yld +1.36% 2.04% $0.51 Manulife Financial Corp. MFC.PR.F Pfd-2 $12.04 4.20% $1.05 $ 25.00 19-Jun-2016 112.01% 5YR GoC Yld +1.41% 2.09% $0.52 Brookfield Asset Management Inc. BAM.PR.R Pfd-2L $13.85 5.40% $1.35 $ 25.00 30-Jun-2016 85.37% 5YR GoC Yld +2.30% 2.98% $0.75 Brookfield Office Properties Inc. BPO.PR.N Pfd-3 $14.19 6.15% $1.54 $ 25.00 30-Jun-2016 81.58% 5YR GoC Yld +3.07% 3.75% $0.94 Shaw Communications Inc. SJR.PR.A Pfd-3 *- $11.52 4.50% $1.13 $ 25.00 30-Jun-2016 121.88% 5YR GoC Yld +2.00% 2.68% $0.67 Capstone Infrastructure Corp. CSE.PR.A NR $13.01 5.00% $1.25 $ 25.00 31-Jul-2016 96.97% 5YR GoC Yld +2.71% 3.39% $0.85 BCE Inc. BCE.PR.I Pfd-3H $13.00 4.15% $1.04 $ 25.00 1-Aug-2016 96.30% ≥80% of 5YR GoC Yld -- -- Bank of Montreal BMO.PR.Q Pfd-2H $18.57 3.90% $0.98 $ 25.00 25-Aug-2016 37.25% 5YR GoC Yld +1.15% 1.83% $0.46 Brookfield Office Properties Inc. BPO.PR.R Pfd-3 $15.65 5.10% $1.28 $ 25.00 30-Sep-2016 65.86% 5YR GoC Yld +3.48% 4.16% $1.04 Canaccord Genuity Group Inc. CF.PR.A Pfd-3L $8.73 5.50% $1.38 $ 25.00 30-Sep-2016 198.19% 5YR GoC Yld +3.21% 3.89% $0.97 Intact Financial Corp. IFC.PR.C Pfd-2 $16.20 4.20% $1.05 $ 25.00 30-Sep-2016 59.19% 5YR GoC Yld +2.66% 3.34% $0.84 Sun Life Financial Inc. SLF.PR.H Pfd-2 $14.61 3.90% $0.98 $ 25.00 30-Sep-2016 76.13% 5YR GoC Yld +2.17% 2.85% $0.71 BCE Inc. BCE.PR.T Pfd-3H $13.04 3.39% $0.85 $ 25.00 1-Nov-2016 96.61% ≥80% of 5YR GoC Yld -- -- Brookfield Asset Management Inc. BAM.PR.G Pfd-2L $12.55 3.80% $0.95 $ 25.00 1-Nov-2016 104.90% ≥80% of 5YR GoC Yld -- -- Manulife Financial Corp. MFC.PR.G Pfd-2 $17.89 4.40% $1.10 $ 25.00 19-Dec-2016 45.91% 5YR GoC Yld +2.90% 3.58% $0.90 BCE Inc. BCE.PR.K Pfd-3H $12.48 4.15% $1.04 $ 25.00 31-Dec-2016 108.66% 5YR GoC Yld +1.88% 2.56% $0.64 Sun Life Financial Inc. SLF.PR.I Pfd-2 $17.20 4.25% $1.06 $ 25.00 31-Dec-2016 51.54% 5YR GoC Yld +2.73% 3.41% $0.85
Source: Bloomberg; a – Assuming 5YR GoC at the time of reset is 0.68%

Investment Strategy Group | Canadian Preferred Shares Report
New Developments While not completely immune to the factors currently impacting the market, the introduction of fixed-resets with a floor on the reset rate offer investors with assurance that the size of their coupons will remain intact regardless of where interest rates trend in the future. As outlined by OSFI, the Canadian banks are not eligible to incorporate floors in their Non-Viability Contingent Capital preferred shares1. In order to compete with this new type of preferred share banks have turned to attracting investors by offering high coupons and reset spreads. Recent issues from the banks have come out with initial yields between 5.50% and 5.60% and reset spreads between 4.51% and 4.90%, which towers over the average reset spread on existing bank fixed-resets of 2.24%. As regulatory measures continue to increase the minimum threshold of Tier 1 capital requirements from the banks the market should continue to expect additional preferred share issuance from the banks in 2016 to meet those requirements.
Another new development in the preferred share space has been the significant increase in participation from institutional players. Institutional presence has been especially noticed in the new issuance market, putting pressure on the fill rates for retail investors. This was most recently exemplified with the recent with the recent TD Bank Series 12 offering, where the entire $400 million upsize due to high demand went solely to institutional investors. Given the high yields offered in the preferred share market by higher quality issues (i.e. banks), we suspect that institutional presence in the Canadian preferred share market will continue to grow.
1. Refer to our Q1/2014 issue of the Canadian Preferred Share Report for more information on the topic of NVCC preferred shares Exhibit 4: New Issuance From November 2015
Series Symbol Type DBRS Rating
Price 29-Jan-16
Annual Div Rate
Annual Div. $
Current Yield
Next Call Terms Of Reset
Price Date AltaGas Ltd. I ALA.PR.I Fixed-Reset Pfd-3 $24.21 5.25% $1.31 5.42% $ 25.00 31-Dec-2020 5YR GoC Yld +4.19% min. 5.25%
Westcoast Energy Inc. 10 W.PR.K Fixed-Reset Pfd-2L $24.59 5.25% $1.31 5.34% $ 25.00 15-Jan-2021 5YR GoC Yld +4.26% min. 5.25%
Royal Bank of Canada BK RY.PR.Q Fixed-Reset Pfd-2 $25.69 5.50% $1.38 5.35% $ 25.00 24-May-2021 5YR GoC Yld +4.53%
The Bank of Nova Scotia 34 BNS.PR.E Fixed-Reset Pfd-2 $25.55 5.50% $1.38 5.38% $ 25.00 25-Apr-2021 5YR GoC Yld +4.51%
TD Bank 12 TD.PF.G Fixed-Reset Pfd-2 $25.73 5.50% $1.38 5.34% $ 25.00 30-Apr-2021 5YR GoC Yld +4.66%
National Bank 34 NA.PR.X Fixed-Reset NR $24.97 5.60% $1.40 5.61% $ 25.00 15-May-2021 5YR GoC Yld +4.90%
Pembina Pipeline 11 PPL.PR.K Fixed-Reset NR $23.40 5.75% $1.44 6.14% $ 25.00 1-Mar-2021 5YR GoC Yld +5.00% min. 5.75%
Source: Bloomberg
New Issue Announcements Drag The Market Even Lower
Source: Bloomberg
CHRISTOPHER ANTONY Investment Strategy Group

Retractable Preferred Shares PRIOR_CLOSE_MIDShares O/S Price Dividend
Preferred Share Issue Symbol (millions) Par 29-Jan-16 Yield Dividend Dates Annual Price Yield to Yield SpreadCash Retractables - CumulativeBrookfield Investments Corporation 4.70% Cl 1 Senior Pfd Ser A BRN.PR.A 6.0 Pfd-2L $25.00 $25.21 4.66% Mar 31/Jun 30/Sep 30/Dec 31 1.18$ Anytime $25.00 NA NA NACanadian General Inv, Ltd 3.9% Cl A Ser 3 CGI.PR.C 3.0 Pfd-1L $25.00 $25.00 3.90% Mar 15/Jun 15/Sep 15/Dec 15 0.98$ Anytime $25.00 NA NA NA
15-Jun-2016 *** $25.00 1.96% NA NACanadian General Inv, Ltd 3.75% Cl A Ser 4 CGI.PR.D 3.0 Pfd-1L $25.00 $24.05 3.90% Mar 15/Jun 15/Sep 15/Dec 15 0.94$ 15-Jun-2018 $26.00 7.32% 0.42% 6.90%
15-Jun-2019 $25.75 5.99% 0.45% 5.54%15-Jun-2020 $25.50 5.27% 0.56% 4.72%15-Jun-2021 $25.25 4.83% 0.71% 4.13%15-Jun-2022 $25.00 4.53% 0.86% 3.67%15-Jun-2023 *** $25.00 4.44% 1.00% 3.44%
Dundee Corp. 5.0% 1st Pfd, Ser 4* DC.PR.C 6.0 NR $17.84 $16.15 5.52% Mar 31/Jun 30/Sep 30/Dec 31 0.89$ Anytime $17.84 NA NA NA30-Jun-2016 *** $17.84 13.22% NA NA
DREAM Unlimited Corp.7% 1st Pfd, Ser 1* DRM.PR.A 5.1 NR $7.16 $7.15 7.01% Mar 31/Jun 30/Sep 30/Dec 31 0.50$ Anytime $7.16 NA NA NAAnytime *** $7.16 NA NA NA
Soft Retractables - CumulativeBirchliff Energy Ltd. 7.0% Ser C BIR.PR.C 2.0 N/A $25.00 $18.41 9.51% Mar 31/Jun 30/Sep 30/Dec 31 1.75$ 30-Jun-2018 $25.75 22.87% 0.42% 22.45%
30-Jun-2019 $25.50 18.26% 0.45% 17.80%30-Jun-2020 $25.00 15.59% 0.56% 15.02%30-Jun-2020 *** $25.00 15.59% 0.56% 15.02%
Brookfield Office Properties Inc. 5.0% Cl AAA Ser J BPO.PR.J 7.0 Pfd-3 $25.00 $25.15 4.97% Mar 31/Jun 30/Sep 30/Dec 31 1.25$ Anytime *** $25.00 NA NA NABrookfield Office Properties Inc. 5.2% Cl AAA Ser K BPO.PR.K 5.0 Pfd-3 $25.00 $25.08 5.18% Mar 31/Jun 30/Sep 30/Dec 31 1.30$ Anytime $25.33 NA NA NA
Anytime $25.00 NA NA NA31-Dec-2016 *** $25.00 4.88% NA NA
Brookfield Office Properties Inc. 5.75% Cl AAA Ser H BPO.PR.H 7.0 Pfd-3 $25.00 $25.18 5.71% Mar 31/Jun 30/Sep 30/Dec 31 1.44$ Anytime $25.00 NA NA NAAnytime *** $25.00 NA NA NA
Fortis Inc. 4.9% Ser E FTS.PR.E 8.0 Pfd-2L $25.00 $25.34 4.83% Mar 1/Jun 1/Sep 1/Dec 1 1.23$ Anytime $25.25 NA NA NA1-Jun-2016 $25.00 1.08% NA NA1-Sep-2016 *** $25.00 2.30% NA NA
Notes:*** = Retraction Date* Cash retractable can be converted to common shares in certain circumstances by dividing the applicable redemption price by the greater of $2 or the 95% average weighted trading price of the common sharesCanadian government bond equivalents and spreads are calculated by interpolating a standard Canadian Government Bond Yield Curve.For redemption / retraction dates within one year, total return is displayed in lieu of yield to redemption / retraction.Redemption dates that have passed are not displayed. If the first redemption date has passed, most preferred shares are callable at anytime at prices that may differ from the table.Rating DBRS: /*+ Review for Possible Upgrade , /*- Review for Possible Downgrade, /* Review with Direction UncertainPLEASE LOOK TO THE ISSUE'S PROSPECTUS FOR FULL DETAILS.Price Date = Jan-29-2016
Call / Retraction*** Can Govt - EquivalentDate
Rating DBRS
Source: Bloomberg, Financial Post DataGroup Retractables ‐ 6

Perpetual Preferred Shares PRIOR_CLOSE_MIDShares O/S Price
Preferred Share Issue Symbol (millions) Par 29-Jan-16 Yield Dividend Dates Annual Price Yield to Yield SpreadCumulativeAtlantic Power Preferred Equity Ltd 4.85% Ser 1 AZP.PR.A 5.0 NR $25.00 $10.60 11.44% Mar 31/Jun 30/Sep 30/Dec 31 1.21$ Anytime $25.25 NA NA NA
30-Jun-2016 $25.00 141.55% NA NABombardier Inc. 6.25% Ser 4 BBD.PR.C 9.4 NR $25.00 $9.72 16.08% Jan 31/Apr 30/Jul 31/Oct 31 1.56$ Anytime $25.00 NA NA NABrookfield Asset Mgmt. Inc. 4.75% Cl A Ser 17 BAM.PR.M 8.0 Pfd-2L $25.00 $19.28 6.16% Mar 31/Jun 30/Sep 30/Dec 31 1.19$ Anytime $25.00 NA NA NABrookfield Asset Mgmt. Inc. 4.75% Cl A Ser 18 BAM.PR.N 8.0 Pfd-2L $25.00 $19.27 6.16% Mar 31/Jun 30/Sep 30/Dec 31 1.19$ Anytime $25.25 NA NA NA
30-Jun-2016 $25.00 32.81% NA NABrookfield Asset Mgmt. Inc. 4.85% Cl A Ser 36 BAM.PF.C 8.0 Pfd-2L $25.00 $19.48 6.22% Mar 31/Jun 30/Sep 30/Dec 31 1.21$ 31-Mar-2018 $26.00 19.42% 0.42% 19.00%
31-Mar-2019 $25.75 14.66% 0.43% 14.22%31-Mar-2020 $25.50 12.22% 0.52% 11.69%31-Mar-2021 $25.25 10.75% 0.68% 10.06%31-Mar-2022 $25.00 9.76% 0.83% 8.93%
Brookfield Asset Mgmt. Inc. 4.9% Cl A Ser 37 BAM.PF.D 8.0 Pfd-2L $25.00 $19.75 6.20% Mar 31/Jun 30/Sep 30/Dec 31 1.23$ 30-Sep-2018 $26.00 16.23% 0.42% 15.81%30-Sep-2019 $25.75 13.02% 0.48% 12.54%30-Sep-2020 $25.50 11.21% 0.60% 10.60%30-Sep-2021 $25.25 10.05% 0.75% 9.30%30-Sep-2022 $25.00 9.25% 0.90% 8.35%
Brookfield Renewable Power Preferred Equity Inc. 5% Cl A Ser 5 BRF.PR.E 7.0 Pfd-3H * $25.00 $17.70 7.06% Jan 31/Apr 30/Jul 31/Oct 31 1.25$ 30-Apr-2018 $26.00 23.57% 0.42% 23.15%30-Apr-2019 $25.75 17.76% 0.44% 17.32%30-Apr-2020 $25.50 14.74% 0.54% 14.20%30-Apr-2021 $25.25 12.90% 0.69% 12.21%30-Apr-2022 $25.00 11.66% 0.84% 10.82%
Brookfield Renewable Power Preferred Equity Inc. 5% Cl A Ser 6 BRF.PR.F 7.0 Pfd-3H * $25.00 $17.59 7.11% Jan 31/Apr 30/Jul 31/Oct 31 1.25$ 31-Jul-2018 $26.00 22.05% 0.42% 21.62%31-Jul-2019 $25.75 17.11% 0.46% 16.65%31-Jul-2020 $25.50 14.41% 0.58% 13.84%31-Jul-2021 $25.25 12.72% 0.73% 11.99%31-Jul-2022 $25.00 11.56% 0.88% 10.68%
Canadian Utilities Ltd 4.9% 2nd Pfd Ser AA CU.PR.D 6.0 Pfd-2H $25.00 $21.38 5.73% Mar 1/Jun 1/Sep 1/Dec 1 1.23$ 1-Sep-2017 $26.00 18.60% 0.43% 18.18%1-Sep-2018 $25.75 13.01% 0.42% 12.58%1-Sep-2019 $25.50 10.58% 0.47% 10.11%1-Sep-2020 $25.25 9.23% 0.59% 8.63%1-Sep-2021 $25.00 8.37% 0.74% 7.63%
Canadian Utilities Ltd 4.9% 2nd Pfd Ser BB CU.PR.E 6.0 Pfd-2H $25.00 $21.43 5.72% Mar 1/Jun 1/Sep 1/Dec 1 1.23$ 1-Sep-2017 $26.00 18.44% 0.43% 18.01%1-Sep-2018 $25.75 12.90% 0.42% 12.48%1-Sep-2019 $25.50 10.50% 0.47% 10.03%1-Sep-2020 $25.25 9.17% 0.59% 8.57%1-Sep-2021 $25.00 8.32% 0.74% 7.58%
Canadian Utilities Ltd 4.5% 2nd Pfd Ser CC CU.PR.F 7.0 Pfd-2H $25.00 $19.82 5.68% Mar 1/Jun 1/Sep 1/Dec 1 1.13$ 1-Jun-2018 $26.00 17.38% 0.42% 16.96%1-Jun-2019 $25.75 13.35% 0.45% 12.90%1-Jun-2020 $25.50 11.21% 0.55% 10.66%1-Jun-2021 $25.25 9.89% 0.70% 9.19%1-Jun-2022 $25.00 9.00% 0.86% 8.14%
Call Can Govt - EquivalentRating DBRS Date
Dividend
Source: Bloomberg, Financial Post DataGroup Perpetuals ‐ 7

Perpetual Preferred Shares PRIOR_CLOSE_MIDShares O/S Price
Preferred Share Issue Symbol (millions) Par 29-Jan-16 Yield Dividend Dates Annual Price Yield to Yield SpreadCall Can Govt - EquivalentRating
DBRS DateDividend
Canadian Utilities Ltd 4.5% 2nd Pfd Ser DD CU.PR.G 9.0 Pfd-2H $25.00 $19.50 5.77% Mar 1/Jun 1/Sep 1/Dec 1 1.13$ 1-Sep-2018 $26.00 16.87% 0.42% 16.44%1-Sep-2019 $25.75 13.28% 0.47% 12.81%1-Sep-2020 $25.50 11.29% 0.59% 10.69%1-Sep-2021 $25.25 10.02% 0.74% 9.28%1-Sep-2022 $25.00 9.15% 0.89% 8.26%
CU Inc. 4.6% Ser 1 CIU.PR.A 4.6 Pfd-2H $25.00 $19.80 5.81% Mar 1/Jun 1/Sep 1/Dec 1 1.15$ Anytime $25.25 NA NA NA1-Jun-2016 $25.00 29.17% NA NA
Emera Inc. 4.5% 1st Pfd. Ser E EMA.PR.E 5.0 Pfd-3H * $25.00 $19.30 5.83% Feb 15/May 15/Aug 15/Nov 15 1.13$ 15-Aug-2018 $26.00 17.00% 0.42% 16.57%15-Aug-2019 $25.75 13.33% 0.47% 12.86%15-Aug-2020 $25.50 11.30% 0.58% 10.72%15-Aug-2021 $25.25 10.02% 0.73% 9.29%15-Aug-2022 $25.00 9.15% 0.88% 8.26%
Enbridge Inc. 5.5% Ser A ENB.PR.A 5.0 Pfd-3H $25.00 $22.75 6.04% Mar 1/Jun 1/Sep 1/Dec 1 1.38$ Anytime $25.00 NA NA NAFortis Inc. 4.9% Ser F FTS.PR.F 5.0 Pfd-2L $25.00 $22.00 5.57% Mar 1/Jun 1/Sep 1/Dec 1 1.23$ Anytime $25.00 NA NA NAFortis Inc. 4.75% Ser J FTS.PR.J 8.0 Pfd-2L $25.00 $21.33 5.57% Mar 1/Jun 1/Sep 1/Dec 1 1.19$ 1-Dec-2017 $26.00 16.71% 0.42% 16.29%
1-Dec-2018 $25.75 12.23% 0.42% 11.81%1-Dec-2019 $25.50 10.13% 0.49% 9.64%1-Dec-2020 $25.25 8.91% 0.63% 8.28%1-Dec-2021 $25.00 8.12% 0.78% 7.34%
George Weston Ltd 5.8% Ser I WN.PR.A 9.4 Pfd-3 $25.00 $25.09 5.78% Mar 15/Jun 15/Sep 15/Dec 15 1.45$ Anytime $25.00 NA NA NAGeorge Weston Ltd. 4.75% Ser V WN.PR.E 8.0 Pfd-3 $25.00 $20.85 5.70% Jan 1/Apr 1/Jul 1/Oct 1 1.19$ Anytime $25.00 NA NA NAGeorge Weston Ltd. 5.2% Ser III WN.PR.C 8.0 Pfd-3 $25.00 $22.67 5.73% Jan 1/Apr 1/Jul 1/Oct 1 1.30$ Anytime $25.00 NA NA NAGeorge Weston Ltd. 5.2% Ser IV WN.PR.D 8.0 Pfd-3 $25.00 $22.70 5.73% Jan 1/Apr 1/Jul 1/Oct 1 1.30$ Anytime $25.00 NA NA NAInnergex Renewable Power Preferred Equity 5.75% Ser C INE.PR.C 2.0 NR $25.00 $17.70 8.12% Jan 15/Apr 15/Jul 15/Oct 15 1.44$ 15-Jan-2018 $26.00 27.41% 0.42% 27.00%
15-Jan-2019 $25.75 20.01% 0.43% 19.58%15-Jan-2020 $25.50 16.42% 0.50% 15.92%15-Jan-2021 $25.25 14.31% 0.65% 13.66%15-Jan-2022 $25.00 12.93% 0.80% 12.14%
Loblaw Companies Ltd. 5.3% Cum. 2nd Pref., Series B L.PR.B 9.0 Pfd-3 $25.00 $22.65 5.85% Mar 31/Jun 30/Sep 30/Dec 31 1.33$ 30-Jun-2020 $26.00 8.78% 0.56% 8.22%30-Jun-2021 $25.75 8.02% 0.71% 7.31%30-Jun-2022 $25.50 7.50% 0.87% 6.64%30-Jun-2023 $25.25 7.13% 1.01% 6.13%30-Jun-2024 $25.00 6.86% 1.12% 5.74%
Westcoast Energy Inc. 5.5% 1st Pfd Ser 7 W.PR.H 6.0 Pfd-2L $25.00 $22.24 6.18% Jan 15/Apr 15/Jul 15/Oct 15 1.38$ Anytime $25.00 NA NA NAWestcoast Energy Inc. 5.6% 1st Pfd Ser 8 W.PR.J 6.0 Pfd-2L $25.00 $22.33 6.27% Jan 15/Apr 15/Jul 15/Oct 15 1.40$ Anytime $25.00 NA NA NANon-CumulativeBank of Montreal 5.25% Cl B Ser 14 BMO.PR.K 10.0 Pfd-2H $25.00 $25.35 5.18% Feb 25/May 25/Aug 25/Nov 25 1.31$ Anytime $25.25 NA NA NA
25-Nov-2016 $25.00 2.52% NA NABank of Montreal 5.8% Cl B Ser 15 BMO.PR.L 10.0 Pfd-2H $25.00 $25.78 5.62% Feb 25/May 25/Aug 25/Nov 25 1.45$ Anytime $25.50 NA NA NA
25-May-2016 $25.25 -0.66% NA NA25-May-2017 $25.00 3.09% 0.43% 2.65%
Source: Bloomberg, Financial Post DataGroup Perpetuals ‐ 8

Perpetual Preferred Shares PRIOR_CLOSE_MIDShares O/S Price
Preferred Share Issue Symbol (millions) Par 29-Jan-16 Yield Dividend Dates Annual Price Yield to Yield SpreadCall Can Govt - EquivalentRating
DBRS DateDividend
Bank of Montreal 5.0% Cl B Ser 35 - NVCC BMO.PR.Z 6.0 Pfd-2 $25.00 $22.79 5.48% Feb 25/May 25/Aug 25/Nov 25 1.25$ 25-Aug-2020 $26.00 7.99% 0.59% 7.40%24-Aug-2021 $25.75 7.33% 0.74% 6.59%23-Aug-2022 $25.50 6.87% 0.89% 5.99%22-Aug-2023 $25.25 6.55% 1.02% 5.52%20-Aug-2024 $25.00 6.30% 1.13% 5.17%
Bank of Nova Scotia 4.5% Ser 14 BNS.PR.L 13.8 Pfd-2H $25.00 $24.33 4.62% Jan 28/Apr 28/Jul 28/Oct 28 1.13$ Anytime $25.25 NA NA NA27-Apr-2016 $25.00 3.89% NA NA
Bank of Nova Scotia 4.5% Ser 15 BNS.PR.M 13.8 Pfd-2H $25.00 $24.32 4.63% Jan 28/Apr 28/Jul 28/Oct 28 1.13$ Anytime $25.25 NA NA NA27-Jul-2016 $25.00 5.09% NA NA
Bank of Nova Scotia 5.25% Ser 16 BNS.PR.N 13.8 Pfd-2H $25.00 $25.45 5.16% Jan 28/Apr 28/Jul 28/Oct 28 1.31$ Anytime $25.50 NA NA NAAnytime $25.25 NA NA NA
27-Jan-2017 $25.00 3.39% NA NABank of Nova Scotia 5.6% Ser 17 BNS.PR.O 9.2 Pfd-2H $25.00 $25.69 5.45% Jan 28/Apr 28/Jul 28/Oct 28 1.40$ Anytime $25.50 NA NA NA
26-Apr-2016 $25.25 -0.38% NA NA26-Apr-2017 $25.00 3.37% 0.43% 2.94%
Co-operators General Insurance Co. 5% Cl E Ser C CCS.PR.C 4.0 Pfd-2L $25.00 $22.00 5.68% Mar 31/Jun 30/Sep 30/Dec 31 1.25$ Anytime $25.25 NA NA NA30-Jun-2016 $25.00 16.47% NA NA
E-L Financial Corp. 4.75% Ser 2 ELF.PR.G 4.0 NR $25.00 $20.91 5.68% Jan 17/Apr 17/Jul 17/Oct 17 1.19$ Anytime $25.00 NA NA NAE-L Financial Corp. 5.3% Ser 1 ELF.PR.F 4.0 NR $25.00 $22.08 6.00% Jan 17/Apr 17/Jul 17/Oct 17 1.33$ Anytime $25.00 NA NA NAE-L Financial Corp. 5.5% Ser 3 ELF.PR.H 4.0 NR $25.00 $23.37 5.88% Jan 17/Apr 17/Jul 17/Oct 17 1.38$ 17-Apr-2017 $26.00 14.85% 0.43% 14.41%
17-Apr-2018 $25.75 10.20% 0.42% 9.78%17-Apr-2019 $25.50 8.49% 0.44% 8.05%17-Apr-2020 $25.25 7.60% 0.53% 7.07%17-Apr-2021 $25.00 7.07% 0.69% 6.38%
Great-West Lifeco 5.4% Non-Cum. 1st Pfd Ser P GWO.PR.P 10.0 Pfd-2H $25.00 $24.15 5.59% Mar 31/Jun 30/Sep 30/Dec 31 1.35$ 31-Mar-2017 $26.00 12.34% 0.44% 11.90%31-Mar-2018 $25.75 8.68% 0.42% 8.26%31-Mar-2019 $25.50 7.36% 0.43% 6.93%31-Mar-2020 $25.25 6.69% 0.52% 6.17%31-Mar-2021 $25.00 6.29% 0.68% 5.61%
Great-West Lifeco Inc. 4.5% 1st Pfd Ser I GWO.PR.I 12.0 Pfd-2H $25.00 $21.15 5.32% Mar 31/Jun 30/Sep 30/Dec 31 1.13$ Anytime $25.00 NA NA NAGreat-West Lifeco Inc. 4.85% 1st Pfd Ser H GWO.PR.H 12.0 Pfd-2H $25.00 $21.99 5.51% Mar 31/Jun 30/Sep 30/Dec 31 1.21$ Anytime $25.00 NA NA NAGreat-West Lifeco Inc. 5.9% 1st Pfd Ser F GWO.PR.F 7.7 Pfd-2H $25.00 $25.27 5.84% Mar 31/Jun 30/Sep 30/Dec 31 1.48$ Anytime $25.00 NA NA NAGreat-West Lifeco Inc. 5.2% 1st Pfd Ser G GWO.PR.G 12.0 Pfd-1 $25.00 $23.24 5.59% Mar 31/Jun 30/Sep 30/Dec 31 1.30$ Anytime $25.00 NA NA NAGreat-West Lifeco Inc. 5.2% 1st Pfd Ser S GWO.PR.S 8.0 Pfd-2H $25.00 $24.26 5.41% Mar 31/Jun 30/Sep 30/Dec 31 1.31$ 30-Jun-2019 $26.00 7.45% 0.45% 6.99%
30-Jun-2020 $25.75 6.75% 0.56% 6.19%30-Jun-2021 $25.50 6.32% 0.71% 5.61%30-Jun-2022 $25.25 6.03% 0.87% 5.17%30-Jun-2023 $25.00 5.83% 1.01% 4.82%
Great-West Lifeco Inc. 5.65% 1st Pfd Ser L GWO.PR.L 6.8 Pfd-2H $25.00 $24.88 5.68% Mar 31/Jun 30/Sep 30/Dec 31 1.41$ Anytime $25.75 NA NA NA31-Dec-2016 $25.50 8.18% NA NA31-Dec-2017 $25.25 6.71% 0.42% 6.29%31-Dec-2018 $25.00 6.03% 0.43% 5.60%
Great-West Lifeco Inc. 5.8% 1st Pfd Ser M GWO.PR.M 6.0 Pfd-2H $25.00 $25.76 5.63% Mar 31/Jun 30/Sep 30/Dec 31 1.45$ Anytime $26.00 NA NA NA31-Mar-2016 $25.75 1.36% NA NA31-Mar-2017 $25.50 5.25% 0.44% 4.81%31-Mar-2018 $25.25 5.01% 0.42% 4.59%31-Mar-2019 $25.00 4.94% 0.43% 4.51%
Source: Bloomberg, Financial Post DataGroup Perpetuals ‐ 9

Perpetual Preferred Shares PRIOR_CLOSE_MIDShares O/S Price
Preferred Share Issue Symbol (millions) Par 29-Jan-16 Yield Dividend Dates Annual Price Yield to Yield SpreadCall Can Govt - EquivalentRating
DBRS DateDividend
Great-West Lifeco Inc. 5.15% 1st Pfd Ser Q GWO.PR.Q 8.0 Pfd-2H $25.00 $23.23 5.54% Mar 31/Jun 30/Sep 30/Dec 31 1.29$ 30-Sep-2017 $26.00 12.48% 0.42% 12.06%30-Sep-2018 $25.75 9.40% 0.42% 8.98%30-Sep-2019 $25.50 8.03% 0.48% 7.56%30-Sep-2020 $25.25 7.26% 0.60% 6.65%30-Sep-2021 $25.00 6.77% 0.75% 6.02%
Great-West Lifeco Inc. 4.8% 1st Pfd Ser R GWO.PR.R 8.0 Pfd-2H $25.00 $21.63 5.55% Mar 31/Jun 30/Sep 30/Dec 31 1.20$ 31-Dec-2017 $26.00 15.20% 0.42% 14.78%31-Dec-2018 $25.75 11.38% 0.43% 10.95%31-Dec-2019 $25.50 9.54% 0.50% 9.04%31-Dec-2020 $25.25 8.46% 0.65% 7.82%31-Dec-2021 $25.00 7.76% 0.79% 6.97%
HSBC Bank Canada 5.0% Cl 1 Ser D HSB.PR.D 7.0 Pfd-2 $25.00 $25.01 5.00% Mar 31/Jun 30/Sep 30/Dec 31 1.25$ Anytime $25.00 NA NA NAHSBC Bank Canada 5.1% Cl 1 Ser C HSB.PR.C 7.0 Pfd-2 $25.00 $25.00 5.10% Mar 31/Jun 30/Sep 30/Dec 31 1.28$ Anytime $25.00 NA NA NAIGM Financial Inc. 5.9% 1st Pfd Ser B IGM.PR.B 6.0 Pfd-2H $25.00 $24.85 5.94% Jan 31/Apr 30/Jul 31/Oct 31 1.48$ Anytime $25.75 NA NA NA
31-Dec-2016 $25.50 8.08% NA NA31-Dec-2017 $25.25 6.76% 0.42% 6.34%31-Dec-2018 $25.00 6.14% 0.43% 5.72%
Industrial Alliance Insurance & Financial Svcs Inc. 4.6% Cl A Ser B IAG.PR.A 5.0 Pfd-2H $25.00 $20.88 5.51% Mar 31/Jun 30/Sep 30/Dec 31 1.15$ Anytime $25.00 NA NA NAManulife Financial Corp. 4.5% Cl A Ser 3 MFC.PR.C 12.0 Pfd-2 $25.00 $20.98 5.36% Mar 19/Jun 19/Sep 19/Dec 19 1.13$ Anytime $25.00 NA NA NAManulife Financial Corp. 4.65% Cl A Ser 2 MFC.PR.B 14.0 Pfd-2 $25.00 $21.39 5.43% Mar 19/Jun 19/Sep 19/Dec 19 1.16$ Anytime $25.00 NA NA NAPower Corp of Canada 5.0% 1st Pfd Ser D POW.PR.D 10.0 Pfd-2 $25.00 $21.70 5.76% Jan 15/Apr 15/Jul 15/Oct 15 1.25$ Anytime $25.00 NA NA NAPower Corp of Canada 5.35% 1st Pfd Ser B POW.PR.B 8.0 Pfd-2 $25.00 $22.92 5.84% Jan 15/Apr 15/Jul 15/Oct 15 1.34$ Anytime $25.00 NA NA NAPower Corp of Canada 5.6% 1st Pfd Ser A POW.PR.A 6.0 Pfd-2 $25.00 $24.18 5.79% Jan 15/Apr 15/Jul 15/Oct 15 1.40$ Anytime $25.00 NA NA NAPower Corp of Canada 5.8% 1st Pfd Ser C POW.PR.C 6.0 Pfd-2 $25.00 $25.02 5.80% Jan 15/Apr 15/Jul 15/Oct 15 1.45$ Anytime $25.00 NA NA NAPower Corp. 5.6% Non-Cum. Ser G POW.PR.G 8.0 Pfd-2 $25.00 $24.17 5.79% Jan 15/Apr 15/Jul 15/Oct 15 1.40$ 15-Apr-2017 $26.00 12.03% 0.43% 11.60%
15-Apr-2018 $25.75 8.68% 0.42% 8.26%15-Apr-2019 $25.50 7.44% 0.44% 7.00%15-Apr-2020 $25.25 6.80% 0.53% 6.27%15-Apr-2021 $25.00 6.42% 0.69% 5.74%
Power Financial Corp 5.25% 1st Pfd Ser E PWF.PR.F 8.0 Pfd-2H $25.00 $22.50 5.83% Jan 31/Apr 30/Jul 31/Oct 31 1.31$ Anytime $25.00 NA NA NAPower Financial Corp 5.5% 1st Pfd Ser D PWF.PR.E 6.0 Pfd-2H $25.00 $23.43 5.87% Jan 31/Apr 30/Jul 31/Oct 31 1.38$ Anytime $25.00 NA NA NAPower Financial Corp 5.75% 1st Pfd Ser H PWF.PR.H 6.0 Pfd-2H $25.00 $24.73 5.81% Jan 31/Apr 30/Jul 31/Oct 31 1.44$ Anytime $25.00 NA NA NAPower Financial Corp 5.9% 1st Pfd Ser F PWF.PR.G 6.0 Pfd-2H $25.00 $25.18 5.86% Jan 31/Apr 30/Jul 31/Oct 31 1.48$ Anytime $25.00 NA NA NAPower Financial Corp 6.0% 1st Pfd Ser I PWF.PR.I 8.0 Pfd-2H $25.00 $25.50 5.88% Jan 31/Apr 30/Jul 31/Oct 31 1.50$ Anytime $25.00 NA NA NAPower Financial Corp. 4.95% 1st Pfd Ser K PWF.PR.K 10.0 Pfd-2H $25.00 $21.41 5.78% Jan 31/Apr 30/Jul 31/Oct 31 1.24$ Anytime $25.00 NA NA NAPower Financial Corp. 5.1% 1st Pfd Ser L PWF.PR.L 8.0 Pfd-2H $25.00 $21.97 5.80% Jan 31/Apr 30/Jul 31/Oct 31 1.28$ Anytime $25.00 NA NA NAPower Financial Corp. 5.5% Non-Cum. 1st Pfd Ser R PWF.PR.R 10.0 Pfd-2H $25.00 $23.70 5.80% Jan 31/Apr 30/Jul 31/Oct 31 1.38$ 30-Apr-2017 $26.00 13.16% 0.43% 12.73%
30-Apr-2018 $25.75 9.34% 0.42% 8.92%30-Apr-2019 $25.50 7.90% 0.44% 7.46%30-Apr-2020 $25.25 7.15% 0.54% 6.61%30-Apr-2021 $25.00 6.69% 0.69% 6.00%
Source: Bloomberg, Financial Post DataGroup Perpetuals ‐ 10
Perpetual Preferred Shares PRIOR_CLOSE_MIDShares O/S Price
Preferred Share Issue Symbol (millions) Par 29-Jan-16 Yield Dividend Dates Annual Price Yield to Yield SpreadCall Can Govt - EquivalentRating
DBRS DateDividend
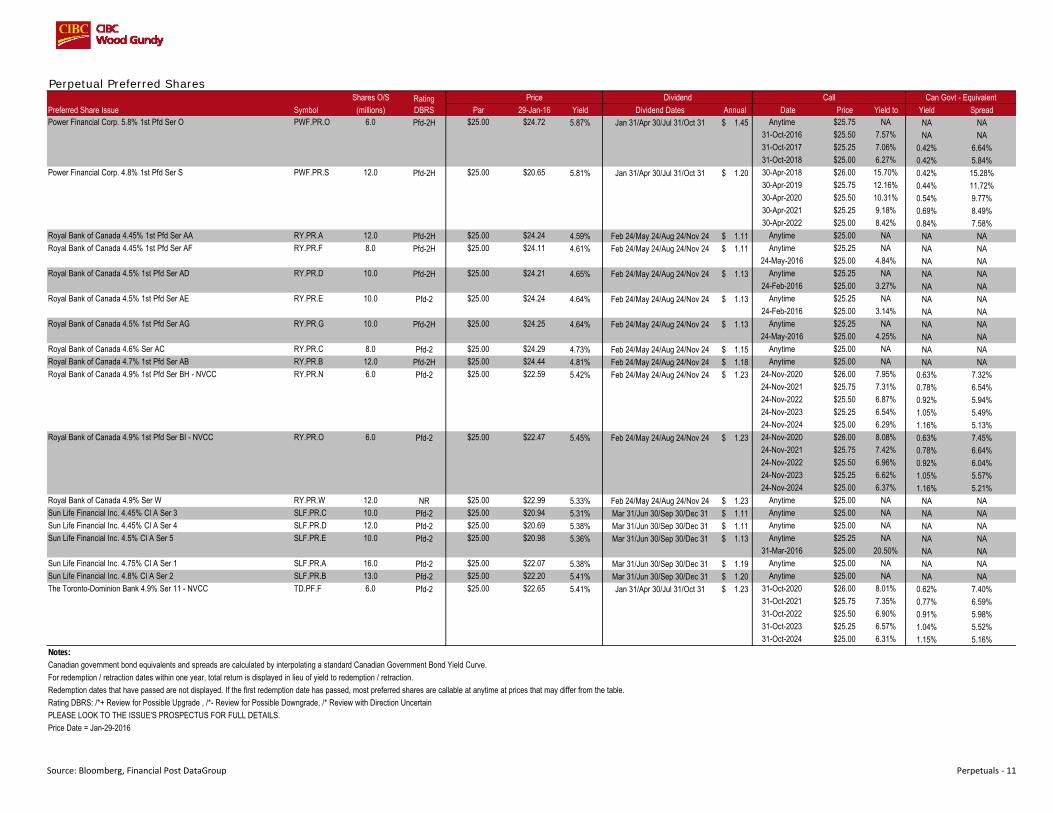
Power Financial Corp. 5.8% 1st Pfd Ser O PWF.PR.O 6.0 Pfd-2H $25.00 $24.72 5.87% Jan 31/Apr 30/Jul 31/Oct 31 1.45$ Anytime $25.75 NA NA NA31-Oct-2016 $25.50 7.57% NA NA31-Oct-2017 $25.25 7.06% 0.42% 6.64%31-Oct-2018 $25.00 6.27% 0.42% 5.84%
Power Financial Corp. 4.8% 1st Pfd Ser S PWF.PR.S 12.0 Pfd-2H $25.00 $20.65 5.81% Jan 31/Apr 30/Jul 31/Oct 31 1.20$ 30-Apr-2018 $26.00 15.70% 0.42% 15.28%30-Apr-2019 $25.75 12.16% 0.44% 11.72%30-Apr-2020 $25.50 10.31% 0.54% 9.77%30-Apr-2021 $25.25 9.18% 0.69% 8.49%30-Apr-2022 $25.00 8.42% 0.84% 7.58%
Royal Bank of Canada 4.45% 1st Pfd Ser AA RY.PR.A 12.0 Pfd-2H $25.00 $24.24 4.59% Feb 24/May 24/Aug 24/Nov 24 1.11$ Anytime $25.00 NA NA NARoyal Bank of Canada 4.45% 1st Pfd Ser AF RY.PR.F 8.0 Pfd-2H $25.00 $24.11 4.61% Feb 24/May 24/Aug 24/Nov 24 1.11$ Anytime $25.25 NA NA NA
24-May-2016 $25.00 4.84% NA NARoyal Bank of Canada 4.5% 1st Pfd Ser AD RY.PR.D 10.0 Pfd-2H $25.00 $24.21 4.65% Feb 24/May 24/Aug 24/Nov 24 1.13$ Anytime $25.25 NA NA NA
24-Feb-2016 $25.00 3.27% NA NARoyal Bank of Canada 4.5% 1st Pfd Ser AE RY.PR.E 10.0 Pfd-2 $25.00 $24.24 4.64% Feb 24/May 24/Aug 24/Nov 24 1.13$ Anytime $25.25 NA NA NA
24-Feb-2016 $25.00 3.14% NA NARoyal Bank of Canada 4.5% 1st Pfd Ser AG RY.PR.G 10.0 Pfd-2H $25.00 $24.25 4.64% Feb 24/May 24/Aug 24/Nov 24 1.13$ Anytime $25.25 NA NA NA
24-May-2016 $25.00 4.25% NA NARoyal Bank of Canada 4.6% Ser AC RY.PR.C 8.0 Pfd-2 $25.00 $24.29 4.73% Feb 24/May 24/Aug 24/Nov 24 1.15$ Anytime $25.00 NA NA NARoyal Bank of Canada 4.7% 1st Pfd Ser AB RY.PR.B 12.0 Pfd-2H $25.00 $24.44 4.81% Feb 24/May 24/Aug 24/Nov 24 1.18$ Anytime $25.00 NA NA NARoyal Bank of Canada 4.9% 1st Pfd Ser BH - NVCC RY.PR.N 6.0 Pfd-2 $25.00 $22.59 5.42% Feb 24/May 24/Aug 24/Nov 24 1.23$ 24-Nov-2020 $26.00 7.95% 0.63% 7.32%
24-Nov-2021 $25.75 7.31% 0.78% 6.54%24-Nov-2022 $25.50 6.87% 0.92% 5.94%24-Nov-2023 $25.25 6.54% 1.05% 5.49%24-Nov-2024 $25.00 6.29% 1.16% 5.13%
Royal Bank of Canada 4.9% 1st Pfd Ser BI - NVCC RY.PR.O 6.0 Pfd-2 $25.00 $22.47 5.45% Feb 24/May 24/Aug 24/Nov 24 1.23$ 24-Nov-2020 $26.00 8.08% 0.63% 7.45%24-Nov-2021 $25.75 7.42% 0.78% 6.64%24-Nov-2022 $25.50 6.96% 0.92% 6.04%24-Nov-2023 $25.25 6.62% 1.05% 5.57%24-Nov-2024 $25.00 6.37% 1.16% 5.21%
Royal Bank of Canada 4.9% Ser W RY.PR.W 12.0 NR $25.00 $22.99 5.33% Feb 24/May 24/Aug 24/Nov 24 1.23$ Anytime $25.00 NA NA NASun Life Financial Inc. 4.45% Cl A Ser 3 SLF.PR.C 10.0 Pfd-2 $25.00 $20.94 5.31% Mar 31/Jun 30/Sep 30/Dec 31 1.11$ Anytime $25.00 NA NA NASun Life Financial Inc. 4.45% Cl A Ser 4 SLF.PR.D 12.0 Pfd-2 $25.00 $20.69 5.38% Mar 31/Jun 30/Sep 30/Dec 31 1.11$ Anytime $25.00 NA NA NASun Life Financial Inc. 4.5% Cl A Ser 5 SLF.PR.E 10.0 Pfd-2 $25.00 $20.98 5.36% Mar 31/Jun 30/Sep 30/Dec 31 1.13$ Anytime $25.25 NA NA NA
31-Mar-2016 $25.00 20.50% NA NASun Life Financial Inc. 4.75% Cl A Ser 1 SLF.PR.A 16.0 Pfd-2 $25.00 $22.07 5.38% Mar 31/Jun 30/Sep 30/Dec 31 1.19$ Anytime $25.00 NA NA NASun Life Financial Inc. 4.8% Cl A Ser 2 SLF.PR.B 13.0 Pfd-2 $25.00 $22.20 5.41% Mar 31/Jun 30/Sep 30/Dec 31 1.20$ Anytime $25.00 NA NA NAThe Toronto-Dominion Bank 4.9% Ser 11 - NVCC TD.PF.F 6.0 Pfd-2 $25.00 $22.65 5.41% Jan 31/Apr 30/Jul 31/Oct 31 1.23$ 31-Oct-2020 $26.00 8.01% 0.62% 7.40%
31-Oct-2021 $25.75 7.35% 0.77% 6.59%31-Oct-2022 $25.50 6.90% 0.91% 5.98%31-Oct-2023 $25.25 6.57% 1.04% 5.52%31-Oct-2024 $25.00 6.31% 1.15% 5.16%
Notes:Canadian government bond equivalents and spreads are calculated by interpolating a standard Canadian Government Bond Yield Curve.For redemption / retraction dates within one year, total return is displayed in lieu of yield to redemption / retraction.Redemption dates that have passed are not displayed. If the first redemption date has passed, most preferred shares are callable at anytime at prices that may differ from the table.Rating DBRS: /*+ Review for Possible Upgrade , /*- Review for Possible Downgrade, /* Review with Direction UncertainPLEASE LOOK TO THE ISSUE'S PROSPECTUS FOR FULL DETAILS.Price Date = Jan-29-2016
Source: Bloomberg, Financial Post DataGroup Perpetuals ‐ 11

Fixed-Reset Preferred SharesShares O/S Price
Preferred Share Issue Symbol (millions) Par 29-Jan-16 Yield Dividend Dates Annual Date Price Yield to Yield SpreadCumulativeAimia Inc. 6.25%, Series 3 AIM.PR.C 6.0 Pfd-3L $25.00 $14.25 10.96% Mar 31/Jun 30/Sep 30/Dec 31 $1.56 31-Mar-2019 $25.00 27.28% 0.43% 26.84% 5YR GoC Yld +4.20%Aimia Inc. 4.5%, Series 1 AIM.PR.A 4.0 Pfd-3L $25.00 $10.49 10.72% Mar 31/Jun 30/Sep 30/Dec 31 $1.13 31-Mar-2020 $25.00 29.25% 0.52% 28.73% 5YR GoC Yld +3.75%Algonquin Power & Utilities Corp. 4.50%, Series A AQN.PR.A 4.8 Pfd-3L $25.00 $15.16 7.42% Mar 31/Jun 30/Sep 30/Dec 31 $1.13 31-Dec-2018 $25.00 23.86% 0.43% 23.43% 5YR GoC Yld +2.94%Algonquin Power & Utilities Corp. 5.00%, Series D AQN.PR.D 4.0 Pfd-3L $25.00 $18.80 6.65% Mar 31/Jun 30/Sep 30/Dec 31 $1.25 31-Mar-2019 $25.00 15.23% 0.43% 14.79% 5YR GoC Yld +3.28%AltaGas Ltd. 4.75%, Series G ALA.PR.G 8.0 Pfd-3 $25.00 $17.50 6.79% Mar 31/Jun 30/Sep 30/Dec 31 $1.19 30-Sep-2019 $25.00 15.88% 0.48% 15.41% 5YR GoC Yld +3.06%AltaGas Ltd. 3.38%, Series A ALA.PR.A 5.5 Pfd-3 $25.00 $14.86 5.69% Mar 31/Jun 30/Sep 30/Dec 31 $0.85 30-Sep-2020 $25.00 15.99% 0.60% 15.39% 5YR GoC Yld +2.66%AltaGas Ltd. 5.0%, Series E ALA.PR.E 8.0 Pfd-3 $25.00 $17.90 6.98% Mar 31/Jun 30/Sep 30/Dec 31 $1.25 31-Dec-2018 $25.00 17.96% 0.43% 17.54% 5YR GoC Yld +3.17%AltaGas Ltd. 5.25%, Series I ALA.PR.I 8.0 Pfd-3 $25.00 $24.21 5.42% Mar 31/Jun 30/Sep 30/Dec 31 $1.31 31-Dec-2020 $25.00 NA NA NA 5YR GoC Yld +4.19% (min. 5.25%)Atlantic Power Preferred Equity Ltd. 5.57%, Series 2 AZP.PR.B 2.3 NR $25.00 $11.02 12.64% Mar 31/Jun 30/Sep 30/Dec 31 $1.39 31-Dec-2019 $25.00 30.96% 0.50% 30.46% 5YR GoC Yld +4.18%BCE Inc. 3.152%, Series Z BCE.PR.Z 1.2 Pfd-3H $25.00 $12.70 6.20% Mar 1/Jun 1/Sep 1/Dec 1 $0.79 1-Dec-2017 $25.00 43.33% 0.42% 42.91% ≥80% of 5YR GoC YldBCE Inc. 3.393%, Series T BCE.PR.T 4.4 Pfd-3H $25.00 $13.04 6.50% Feb 1/May 1/Aug 1/Nov 1 $0.85 1-Nov-2016 $25.00 96.61% NA NA ≥80% of 5YR GoC YldBCE Inc. 3.45%, Series AA BCE.PR.A 10.1 Pfd-3H $25.00 $13.54 6.37% Mar 1/Jun 1/Sep 1/Dec 1 $0.86 1-Sep-2017 $25.00 45.56% 0.43% 45.13% ≥80% of 5YR GoC YldBCE Inc. 3.55%, Series AC BCE.PR.C 5.1 Pfd-3H $25.00 $14.35 6.18% Mar 1/Jun 1/Sep 1/Dec 1 $0.89 1-Mar-2018 $25.00 32.34% 0.42% 31.93% ≥80% of 5YR GoC YldBCE Inc. 4.15%, Series AK BCE.PR.K 25.0 Pfd-3H $25.00 $12.48 8.31% Mar 31/Jun 30/Sep 30/Dec 31 $1.04 31-Dec-2016 $25.00 108.66% NA NA 5YR GoC Yld +1.88%BCE Inc. 4.15%, Series AI BCE.PR.I 10.8 Pfd-3H $25.00 $13.00 7.98% Feb 1/May 1/Aug 1/Nov 1 $1.04 1-Aug-2016 $25.00 96.30% NA NA ≥80% of 5YR GoC YldBCE Inc. 4.25%, Series AQ BCE.PR.Q 9.2 Pfd-3H $25.00 $17.45 6.09% Mar 31/Jun 30/Sep 30/Dec 30 $1.06 30-Sep-2018 $25.00 19.23% 0.42% 18.80% 5YR GoC Yld +2.64%BCE Inc. 4.13%, Series R BCE.PR.R 8.0 Pfd-3H $25.00 $16.65 6.20% Mar 1/Jun 1/Sep 1/Dec 1 $1.03 1-Dec-2020 $25.00 13.59% 0.63% 12.96% ≥80% of 5YR GoC YldBCE Inc. 4.50%, Series AG BCE.PR.G 10.8 Pfd-3H $25.00 $13.17 8.54% Feb 1/May 1/Aug 1/Nov 1 $1.13 1-May-2016 $25.00 91.95% NA NA ≥80% of 5YR GoC YldBCE Inc. 3.11%, Series AF BCE.PR.F 6.7 Pfd-3H $25.00 $13.20 5.89% Feb 1/May 1/Aug 1/Nov 1 $0.78 1-Feb-2020 $25.00 20.80% 0.50% 20.30% ≥80% of 5YR GoC YldBCE Inc. 4.55%, Series AO BCE.PR.O 3.4 Pfd-3H $25.00 $17.98 6.33% Mar 31/Jun 30/Sep 30/Dec 31 $1.14 31-Mar-2017 $25.00 35.68% 0.44% 35.25% 5YR GoC Yld +3.09%BCE Inc. 4.85%, Series AM BCE.PR.M 11.5 Pfd-3H $25.00 $13.63 8.90% Mar 31/Jun 30/Sep 30/Dec 31 $1.21 31-Mar-2016 $25.00 85.64% NA NA 5YR GoC Yld +2.09%Birchcliff Energy Ltd. 8%, Series A BIR.PR.A 2.0 NR $25.00 $15.30 13.07% Mar 31/Jun 30/Sep 30/Dec 31 $2.00 30-Sep-2017 $25.00 42.40% 0.42% 41.98% 5YR GOC Yld +6.83%Bombardier Inc. 3.134%, Series 3 BBD.PR.D 2.3 NR $25.00 $6.04 12.97% Jan 31/Apr 30/Jul 31/Oct 31 $0.78 1-Aug-2017 $25.00 115.24% 0.43% 114.81% ≥80% of 5YR GoC YldBrookfield Asset Management Inc. 3.80%, Series 9 BAM.PR.G 7.0 Pfd-2L $25.00 $12.55 7.57% Feb 1/May 1/Aug 1/Nov 1 $0.95 1-Nov-2016 $25.00 104.90% NA NA ≥80% of 5YR GoC YldBrookfield Asset Management Inc. 4.20%, Series 34 BAM.PF.B 10.0 Pfd-2L $25.00 $17.54 5.99% Mar 31/Jun 30/Sep 30/Dec 31 $1.05 31-Mar-2019 $25.00 16.72% 0.43% 16.28% 5YR GoC Yld +2.63%Brookfield Asset Management Inc. 4.40%, Series 38 BAM.PF.E 8.0 Pfd-2L $25.00 $17.90 6.15% Mar 31/Jun 30/Sep 30/Dec 31 $1.10 31-Mar-2020 $25.00 13.58% 0.52% 13.06% 5YR GoC Yld +2.55%Brookfield Asset Management Inc. 4.50%, Series 26 BAM.PR.T 10.0 Pfd-2L $25.00 $14.70 7.65% Mar 31/Jun 30/Sep 30/Dec 31 $1.13 31-Mar-2017 $25.00 55.64% 0.44% 55.20% 5YR GoC Yld +2.31%Brookfield Asset Management Inc. 4.50%, Series 32 BAM.PF.A 12.0 Pfd-2L $25.00 $18.55 6.06% Mar 31/Jun 30/Sep 30/Dec 31 $1.13 30-Sep-2018 $25.00 16.96% 0.42% 16.54% 5YR GoC Yld +2.90%Brookfield Asset Management Inc. 4.50%, Series 40 BAM.PF.F 12.0 Pfd-2L $25.00 $19.00 5.92% Mar 31/Jun 30/Sep 30/Dec 31 $1.13 30-Sep-2019 $25.00 12.99% 0.48% 12.52% 5YR GoC Yld +2.86%Brookfield Asset Management Inc. 4.60%, Series 28 BAM.PR.X 9.4 Pfd-2L $25.00 $12.84 8.96% Mar 31/Jun 30/Sep 30/Dec 31 $1.15 30-Jun-2017 $25.00 57.93% 0.43% 57.50% 5YR GoC Yld +1.80%Brookfield Asset Management Inc. 4.80%, Series 30 BAM.PR.Z 10.0 Pfd-2L $25.00 $18.42 6.51% Mar 31/Jun 30/Sep 30/Dec 31 $1.20 31-Dec-2017 $25.00 22.43% 0.42% 22.01% 5YR GoC Yld +2.96%Brookfield Asset Management Inc. 5.40%, Series 24 BAM.PR.R 11.0 Pfd-2L $25.00 $13.85 9.75% Mar 31/Jun 30/Sep 30/Dec 31 $1.35 30-Jun-2016 $25.00 85.37% NA NA 5YR GoC Yld +2.30%Brookfield Asset Management Inc. 4.50%, Series 42 BAM.PF.G 12.0 Pfd-2L $25.00 $18.45 6.10% Mar 31/Jun 30/Sep 30/Dec 31 $1.13 30-Jun-2020 $25.00 12.44% 0.56% 11.87% 5YR GoC Yld +2.84%Brookfield Asset Management Inc. 5.00%, Series 44 BAM.PF.H 10.0 Pfd-2L $25.00 $25.48 4.91% Mar 31/Jun 30/Sep 30/Dec 31 $1.25 31-Dec-2020 $25.00 4.67% 0.65% 4.02% 5YR GoC Yld +4.17% (min. 5%)Brookfield Infrastructure Partners L.P. 4.5%, Series 1 BIP.PR.A 5.0 NR $25.00 $17.93 6.27% Mar 31/Jun 30/Sep 30/Dec 31 $1.13 30-Jun-2020 $25.00 13.19% 0.56% 12.63% 5YR GoC Yld +3.56%Brookfield Office Properties Inc. 4.75%, Series AA BPO.PR.A 12.0 Pfd-3 $25.00 $15.98 7.43% Mar 31/Jun 30/Sep 30/Dec 31 $1.19 31-Dec-2019 $25.00 17.96% 0.50% 17.46% 5YR GoC Yld +3.15%Brookfield Office Properties Inc. 4.60%, Series T BPO.PR.T 10.0 Pfd-3 $25.00 $15.48 7.43% Mar 31/Jun 30/Sep 30/Dec 31 $1.15 31-Dec-2018 $25.00 23.17% 0.43% 22.74% 5YR GoC Yld +3.16%Brookfield Office Properties Inc. 5.10%, Series R BPO.PR.R 10.0 Pfd-3 $25.00 $15.65 8.15% Mar 31/Jun 30/Sep 30/Dec 31 $1.28 30-Sep-2016 $25.00 65.86% NA NA 5YR GoC Yld +3.48%Brookfield Office Properties Inc. 5.15%, Series P BPO.PR.P 12.0 Pfd-3 $25.00 $14.63 8.80% Mar 31/Jun 30/Sep 30/Dec 31 $1.29 31-Mar-2017 $25.00 57.15% 0.44% 56.71% 5YR GoC Yld +3.00%Brookfield Office Properties Inc. 6.15%, Series N BPO.PR.N 11.0 Pfd-3 $25.00 $14.19 10.84% Mar 31/Jun 30/Sep 30/Dec 31 $1.54 30-Jun-2016 $25.00 81.58% NA NA 5YR GoC Yld +3.07%Brookfield Renewable Power Preferred Equity Inc. 4.40%, Series 3 BRF.PR.C 10.0 Pfd-3H * $25.00 $16.45 6.69% Jan 31/Apr 30/Jul 31/Oct 31 $1.10 31-Jul-2019 $25.00 17.77% 0.46% 17.31% 5YR GoC Yld +2.94%
Rating DBRS Terms of ResetCan Govt - EquivalentCall / ResetDividend
Source: Bloomberg, Financial Post DataGroup Fixed‐Resets ‐ 12

Fixed-Reset Preferred SharesShares O/S Price
Preferred Share Issue Symbol (millions) Par 29-Jan-16 Yield Dividend Dates Annual Date Price Yield to Yield SpreadRating DBRS Terms of ResetCan Govt - EquivalentCall / ResetDividend
Brookfield Renewable Power Preferred Equity Inc. 3.355%, Series 1 BRF.PR.A 5.5 Pfd-3H * $25.00 $14.60 5.74% Jan 31/Apr 30/Jul 31/Oct 31 $0.84 30-Apr-2020 $25.00 17.45% 0.54% 16.91% 5YR GoC Yld +2.62%Canaccord Genuity Group Inc. 5.50%, Series A CF.PR.A 4.5 Pfd-3L $25.00 $8.73 15.75% Mar 31/Jun 30/Sep 30/Dec 31 $1.38 30-Sep-2016 $25.00 198.19% NA NA 5YR GoC Yld +3.21%Canaccord Genuity Group Inc. 5.75%, Series C CF.PR.C 4.0 Pfd-3L $25.00 $10.15 14.16% Mar 31/Jun 30/Sep 30/Dec 31 $1.44 30-Jun-2017 $25.00 80.81% 0.43% 80.38% 5YR GoC Yld +4.03%Canadian Utilities Limited 4%, Series Y CU.PR.C 13.0 Pfd-2H $25.00 $17.38 5.75% Mar 1/Jun 1/Sep 1/Dec 1 $1.00 1-Jun-2017 $25.00 34.25% 0.43% 33.82% 5YR GoC Yld +2.40%Canadian Utilities Limited 4.5%, Series FF CU.PR.I 10.0 Pfd-2H $25.00 $25.01 4.50% Mar 1/Jun 1/Sep 1/Dec 1 $1.13 1-Dec-2020 $25.00 4.67% 0.63% 4.04% 5YR GoC Yld +3.69% (min. 4.5%)Capital Power Corporation 4.50%, Series 5 CPX.PR.E 8.0 Pfd-3L $25.00 $12.27 9.17% Mar 31/Jun 30/Sep 30/Dec 31 $1.13 30-Jun-2018 $25.00 37.97% 0.42% 37.55% 5YR GoC Yld +3.15%Capital Power Corporation 3.06%, Series 1 CPX.PR.A 5.0 Pfd-3L $25.00 $9.30 8.23% Mar 31/Jun 30/Sep 30/Dec 31 $0.77 31-Dec-2020 $25.00 26.32% 0.65% 25.68% 5YR GoC Yld +2.17%Capital Power Corporation 4.60%, Series 3 CPX.PR.C 6.0 Pfd-3L $25.00 $12.69 9.06% Mar 31/Jun 30/Sep 30/Dec 31 $1.15 31-Dec-2018 $25.00 31.20% 0.43% 30.78% 5YR GoC Yld +3.23%Capstone Infrastructure Corporation 5%, Series A CSE.PR.A 3.0 NR $25.00 $13.01 9.61% Jan 31/Apr 30/Jul 31/Oct 31 $1.25 31-Jul-2016 $25.00 96.97% NA NA 5YR GoC Yld +2.71%CU Inc. 3.80%, Series 4 CIU.PR.C 3.0 Pfd-2H $25.00 $10.87 8.74% Mar 1/Jun 1/Sep 1/Dec 1 $0.95 1-Jun-2016 $25.00 134.37% NA NA 5YR GoC Yld +1.36%Dundee Corporation 5.688% First Pfce., Series 2 DC.PR.B 3.5 NR $25.00 $10.80 13.17% Mar 31/Jun 30/Sep 30/Dec 31 $1.42 30-Sep-2019 $25.00 33.42% 0.48% 32.94% 5YR GoC Yld +4.10%Element Financial Corporation 6.40%, Series E EFN.PR.E 5.0 Pfd-3 $25.00 $21.35 7.49% Jan 17/Apr 17/Jul 17/Oct 17 $1.60 30-Sep-2019 $25.00 11.44% 0.48% 10.97% 5YR GoC Yld +4.72%Element Financial Corporation 6.50%, Series C EFN.PR.C 5.1 Pfd-3 $25.00 $21.58 7.53% Mar 31/Jun 30/Sep 30/Dec 31 $1.63 31-Mar-2019 $25.00 12.00% 0.43% 11.57% 5YR GoC Yld +4.81%Element Financial Corporation 6.60%, Series A EFN.PR.A 4.0 Pfd-3 $25.00 $21.35 7.73% Mar 31/Jun 30/Sep 30/Dec 31 $1.65 31-Dec-2018 $25.00 12.96% 0.43% 12.54% 5YR GoC Yld +4.71%Element Financial Corporation 6.5%, Series G EFN.PR.G 6.9 Pfd-3 $25.00 $23.35 6.96% Mar 31/Jun 30/Sep 30/Dec 31 $1.63 30-Sep-2020 $25.00 8.38% 0.60% 7.78% 5YR GoC Yld +5.34%Emera Incorporated 4.10% Pref., Series C EMA.PR.C 10.0 Pfd-3H * $25.00 $16.52 6.20% Feb 15/May 15/Aug 15/Nov 15 $1.03 15-Aug-2018 $25.00 21.83% 0.42% 21.40% 5YR GoC Yld +2.65%Emera Incorporated 4.25% Pref., Series F EMA.PR.F 8.0 Pfd-3H * $25.00 $17.52 6.06% Feb 15/May 15/Aug 15/Nov 15 $1.06 15-Feb-2020 $25.00 14.05% 0.51% 13.54% 5YR GoC Yld +2.63%Emera Incorporated 2.555%, Series A EMA.PR.A 3.9 Pfd-3H * $25.00 $11.65 5.48% Feb 15/May 15/Aug 15/Nov 15 $0.64 15-Aug-2020 $25.00 21.12% 0.58% 20.54% 5YR GoC Yld +1.84%Enbridge Inc. 4%, Series 3 ENB.PR.Y 24.0 Pfd-3H $25.00 $13.69 7.30% Mar 1/Jun 1/Sep 1/Dec 1 $1.00 1-Sep-2019 $25.00 23.28% 0.47% 22.81% 5YR GOC Yld +2.38%Enbridge Inc. 4%, Series B ENB.PR.B 20.0 Pfd-3H $25.00 $12.73 7.86% Mar 1/Jun 1/Sep 1/Dec 1 $1.00 1-Jun-2017 $25.00 61.67% 0.43% 61.24% 5YR GoC Yld +2.40%Enbridge Inc. 4%, Series D ENB.PR.D 18.0 Pfd-3H $25.00 $12.95 7.72% Mar 1/Jun 1/Sep 1/Dec 1 $1.00 1-Mar-2018 $25.00 39.67% 0.42% 39.25% 5YR GoC Yld +2.37%Enbridge Inc. 4%, Series F ENB.PR.F 20.0 Pfd-3H $25.00 $13.58 7.36% Mar 1/Jun 1/Sep 1/Dec 1 $1.00 1-Jun-2018 $25.00 33.50% 0.42% 33.08% 5YR GoC Yld +2.51%Enbridge Inc. 4%, Series H ENB.PR.H 14.0 Pfd-3H $25.00 $12.95 7.72% Mar 1/Jun 1/Sep 1/Dec 1 $1.00 1-Sep-2018 $25.00 32.88% 0.42% 32.45% 5YR GoC Yld +2.12%Enbridge Inc. 4.0%, Series N ENB.PR.N 18.0 Pfd-3H $25.00 $13.96 7.16% Mar 1/Jun 1/Sep 1/Dec 1 $1.00 1-Dec-2018 $25.00 27.29% 0.42% 26.87% 5YR GoC Yld +2.65%Enbridge Inc. 4.0%, Series P ENB.PR.P 16.0 Pfd-3H $25.00 $13.79 7.25% Mar 1/Jun 1/Sep 1/Dec 1 $1.00 1-Mar-2019 $25.00 25.95% 0.43% 25.52% 5YR GoC Yld +2.50%Enbridge Inc. 4.0%, Series R ENB.PR.T 16.0 Pfd-3H $25.00 $13.89 7.20% Mar 1/Jun 1/Sep 1/Dec 1 $1.00 1-Jun-2019 $25.00 24.13% 0.45% 23.68% 5YR GoC Yld +2.50%Enbridge Inc. 4.40%, Series 11 ENB.PF.C 20.0 Pfd-3H $25.00 $15.50 7.10% Mar 1/Jun 1/Sep 1/Dec 1 $1.10 1-Mar-2020 $25.00 18.04% 0.51% 17.53% 5YR GoC Yld +2.64%Enbridge Inc. 4.40%, Series 13 ENB.PF.E 14.0 Pfd-3H $25.00 $15.62 7.04% Mar 1/Jun 1/Sep 1/Dec 1 $1.10 1-Jun-2020 $25.00 17.11% 0.55% 16.56% 5YR GoC Yld +2.66%Enbridge Inc. 4.40%, Series 15 ENB.PF.G 11.0 Pfd-3H $25.00 $15.70 7.01% Mar 1/Jun 1/Sep 1/Dec 1 $1.10 1-Sep-2020 $25.00 16.35% 0.59% 15.76% 5YR GoC Yld +2.68%Enbridge Inc. 4.40%, Series 7 ENB.PR.J 10.0 Pfd-3H $25.00 $14.40 7.64% Mar 1/Jun 1/Jul 1/Dec 1 $1.10 1-Mar-2019 $25.00 24.91% 0.43% 24.48% 5YR GoC Yld +2.57%Enbridge Inc. 4.40%, Series 9 ENB.PF.A 11.0 Pfd-3H $25.00 $15.45 7.12% Mar 1/Jun 1/Sep 1/Dec 1 $1.10 1-Dec-2019 $25.00 18.95% 0.49% 18.46% 5YR GoC Yld +2.66%Fairfax Financial Holdings Limited 2.91%, Series E FFH.PR.E 4.3 Pfd-3 $25.00 $12.15 5.99% Mar 31/Jun 30/Sep 30/Dec 31 $0.73 31-Mar-2020 $25.00 22.30% 0.52% 21.77% 5YR GoC Yld +2.16%Fairfax Financial Holdings Limited 3.318%, Series G FFH.PR.G 7.4 Pfd-3 $25.00 $14.10 5.88% Mar 31/Jun 30/Sep 30/Dec 31 $0.83 30-Sep-2020 $25.00 17.22% 0.60% 16.61% 5YR GoC Yld +2.56%Fairfax Financial Holdings Limited 3.708%, Series I FFH.PR.I 10.5 Pfd-3 $25.00 $15.75 5.89% Mar 31/Jun 30/Sep 30/Dec 31 $0.93 31-Dec-2020 $25.00 14.47% 0.65% 13.82% 5YR GoC Yld +2.85%Fairfax Financial Holdings Limited 5%, Series K FFH.PR.K 9.5 Pfd-3 $25.00 $17.38 7.19% Mar 31/Jun 30/Sep 30/Dec 31 $1.25 31-Mar-2017 $25.00 39.61% 0.44% 39.18% 5YR GoC Yld +3.51%Fairfax Financial Holdings Limited 4.578%, Series C FFH.PR.C 6.0 Pfd-3 $25.00 $18.08 6.33% Mar 31/Jun 30/Sep 30/Dec 31 $1.14 31-Dec-2019 $25.00 14.05% 0.50% 13.55% 5YR GoC Yld +3.15%Fairfax Financial Holdings Limited 4.75%, Series M FFH.PR.M 9.2 Pfd-3 $25.00 $19.83 5.99% Mar 31/Jun 30/Sep 30/Dec 31 $1.19 31-Mar-2020 $25.00 11.17% 0.52% 10.65% 5YR GoC Yld +3.98%First National Financial Corporation 4.65%, Series 1 FN.PR.A 4.0 Pfd-3 $25.00 $9.63 12.07% Mar 31/Jun 30/Sep 30/Dec 31 $1.16 31-Mar-2016 $25.00 162.62% NA NA 5YR GoC Yld +2.07%Fortis Inc. 3.883% First Pfce., Series G FTS.PR.G 9.2 Pfd-2L $25.00 $16.24 5.98% Mar 1/Jun 1/Sep 1/Dec 1 $0.97 1-Sep-2018 $25.00 22.55% 0.42% 22.12% 5YR GoC Yld +2.13%Fortis Inc. 4.0% First Pfce., Series K FTS.PR.K 10.0 Pfd-2L $25.00 $16.29 6.14% Mar 1/Jun 1/Sep 1/Dec 1 $1.00 1-Mar-2019 $25.00 19.68% 0.43% 19.25% 5YR GOC Yld +2.05%Fortis Inc. 4.10% First Pfce., Series M FTS.PR.M 24.0 Pfd-2L $25.00 $18.15 5.65% Mar 1/Jun 1/Sep 1/Dec 1 $1.03 1-Dec-2019 $25.00 13.66% 0.49% 13.17% 5YR GOC Yld +2.48%Fortis Inc. 2.50% First Pfce., Series H FTS.PR.H 7.0 Pfd-2L $25.00 $12.93 4.83% Mar 1/Jun 1/Sep 1/Dec 1 $0.63 1-Jun-2020 $25.00 19.40% 0.55% 18.85% 5YR GoC Yld +1.45%GMP Capital Inc. 5.50%, Series B GMP.PR.B 4.6 Pfd-3L *- $25.00 $9.35 14.71% Mar 31/Jun 30/Sep 30/Dec 31 $1.38 31-Mar-2016 $25.00 171.05% NA NA 5YR GoC Yld +2.89%Husky Energy Inc. 4.45%, Series 1 HSE.PR.A 12.0 Pfd-2L $25.00 $8.90 12.50% Mar 31/Jun 30/Sep 30/Dec 31 $1.11 31-Mar-2016 $25.00 184.02% NA NA 5YR GoC Yld +1.73%Husky Energy Inc. 4.5%, Series 3 HSE.PR.C 10.0 Pfd-2L $25.00 $14.28 7.88% Mar 31/Jun 30/Sep 30/Dec 31 $1.13 31-Dec-2019 $25.00 21.02% 0.50% 20.52% 5YR GoC Yld +3.13%
Source: Bloomberg, Financial Post DataGroup Fixed‐Resets ‐ 13

Fixed-Reset Preferred SharesShares O/S Price
Preferred Share Issue Symbol (millions) Par 29-Jan-16 Yield Dividend Dates Annual Date Price Yield to Yield SpreadRating DBRS Terms of ResetCan Govt - EquivalentCall / ResetDividend
Husky Energy Inc. 4.5%, Series 5 HSE.PR.E 8.0 Pfd-2L $25.00 $15.30 7.35% Mar 31/Jun 30/Sep 30/Dec 31 $1.13 31-Mar-2020 $25.00 18.13% 0.52% 17.61% 5YR GoC Yld +3.57%Husky Energy Inc. 4.6%, Series 7 HSE.PR.G 6.0 Pfd-2L $25.00 $15.50 7.42% Mar 31/Jun 30/Sep 30/Dec 31 $1.15 30-Jun-2020 $25.00 17.22% 0.56% 16.66% 5YR GoC Yld +3.52%Innergex Renewable Energy Inc. 5%, Series A INE.PR.A 3.4 NR $25.00 $12.60 9.92% Jan 15/Apr 15/Jul 15/Oct 15 $1.25 15-Jan-2016 $25.00 NA NA NA 5YR GoC Yld +2.79%Northland Power Inc. 5%, Series 3 NPI.PR.C 4.8 NR $25.00 $16.80 7.44% Mar 31/Jun 30/Sep 30/Dec 31 $1.25 31-Dec-2017 $25.00 28.13% 0.42% 27.71% 5YR GoC Yld +3.46%Northland Power Inc. 3.51%, Series 1 NPI.PR.A 4.5 NR $25.00 $13.53 6.49% Mar 31/Jun 30/Sep 30/Dec 31 $0.88 30-Sep-2020 $25.00 18.54% 0.60% 17.93% 5YR GoC Yld +2.80%Pembina Pipeline Corporation 4.25%, Series 1 PPL.PR.A 10.0 Pfd-3 $25.00 $13.61 7.81% Mar 1/Jun 1/Sep 1/Dec 1 $1.06 1-Dec-2018 $25.00 27.93% 0.42% 27.51% 5YR GoC Yld +2.47%Pembina Pipeline Corporation 4.50%, Series 7 PPL.PR.G 10.0 Pfd-3 $25.00 $15.46 7.28% Mar 1/Jun 1/Sep 1/Dec 1 $1.13 1-Dec-2019 $25.00 18.52% 0.49% 18.03% 5YR GoC Yld +2.94%Pembina Pipeline Corporation 4.70%, Series 3 PPL.PR.C 6.0 Pfd-3 $25.00 $14.84 7.92% Mar 1/Jun 1/Sep 1/Dec 1 $1.18 1-Mar-2019 $25.00 23.45% 0.43% 23.03% 5YR GoC Yld +2.60%Pembina Pipeline Corporation 5.0%, Series 5 PPL.PR.E 10.0 Pfd-3 $25.00 $16.50 7.58% Mar 1/Jun 1/Sep 1/Dec 1 $1.25 1-Jun-2019 $25.00 18.84% 0.45% 18.39% 5YR GoC Yld +3.00%Pembina Pipeline Corporation 4.75%, Series 9 PPL.PR.I 9.0 Pfd-3 $25.00 $18.72 6.34% Mar 1/Jun 1/Sep 1/Dec 1 $1.19 1-Dec-2020 $25.00 11.51% 0.63% 10.88% 5YR GoC Yld +3.91%Pembina Pipeline Corporation 5.75%, Series 11 PPL.PR.K 6.8 NR $25.00 $23.40 6.14% Mar 1/Jun 1/Sep 1/Dec 1 $1.44 1-Mar-2021 $25.00 NA NA NA 5YR GoC Yld +5.00% (min. 5.75%)RONA Inc. 5.25%, Series 6 RON.PR.A 6.9 Pfd-4H $25.00 $13.10 10.02% Mar 31/Jun 30/Sep 30/Dec 31 $1.31 31-Mar-2016 $25.00 93.34% NA NA 5YR GoC Yld +2.65%Shaw Communications Inc. 4.50%, Series A SJR.PR.A 12.0 Pfd-3 *- $25.00 $11.52 9.77% Mar 31/Jun 30/Sep 30/Dec 31 $1.13 30-Jun-2016 $25.00 121.88% NA NA 5YR GoC Yld +2.00%TransAlta Corporation 4.60%, Series A TA.PR.D 12.0 Pfd-3 $25.00 $7.85 14.65% Mar 31/Jun 30/Sep 30/Dec 31 $1.15 31-Mar-2016 $25.00 222.12% NA NA 5YR GoC Yld +2.03%TransAlta Corporation 4.60%, Series C TA.PR.F 11.0 Pfd-3 $25.00 $10.25 11.22% Mar 31/Jun 30/Sep 30/Dec 31 $1.15 30-Jun-2017 $25.00 77.64% 0.43% 77.21% 5YR GoC Yld +3.10%TransAlta Corporation 5%, Series E TA.PR.H 9.0 Pfd-3 $25.00 $11.25 11.11% Mar 31/Jun 30/Sep 30/Dec 31 $1.25 30-Sep-2017 $25.00 60.14% 0.42% 59.71% 5YR GoC Yld +3.65%TransAlta Corporation 5.30%, Series G TA.PR.J 6.6 Pfd-3 $25.00 $12.84 10.32% Mar 31/Jun 30/Sep 30/Dec 31 $1.33 30-Sep-2019 $25.00 26.78% 0.48% 26.30% 5YR GoC Yld +3.80%TransCanada Corporation 4%, Series 3 TRP.PR.B 8.5 Pfd-2L $25.00 $10.35 5.20% Mar 31/Jun 30/Sep 30/Dec 31 $0.54 30-Jun-2020 $25.00 24.22% 0.56% 23.66% 5YR GoC Yld +1.28%TransCanada Corporation 4%, Series 7 TRP.PR.D 24.0 Pfd-2L $25.00 $16.70 5.99% Jan 30/Apr 30/Jul 30/Oct 30 $1.00 30-Apr-2019 $25.00 17.69% 0.44% 17.25% 5YR GoC Yld +2.38%TransCanada Corporation 4.25%, Series 9 TRP.PR.E 18.0 Pfd-2L $25.00 $17.31 6.14% Jan 30/Apr 30/Jul 30/Oct 30 $1.06 30-Oct-2019 $25.00 15.20% 0.48% 14.72% 5YR GoC Yld +2.35%TransCanada Corporation 4.4%, Series 5 TRP.PR.C 12.7 Pfd-2L $25.00 $11.29 9.74% Jan 30/Apr 30/Jul 30/Oct 30 $1.10 30-Jan-2016 $25.00 NA NA NA 5YR GoC Yld +1.54%TransCanada Corporation 3.266%, Series 1 TRP.PR.A 9.5 Pfd-2L $25.00 $14.55 5.61% Mar 31/Jun 30/Sep 30/Dec 31 $0.82 31-Dec-2019 $25.00 18.69% 0.50% 18.19% 5YR GoC Yld +1.92%TransCanada Corporation 3.8%, Series 11 TRP.PR.G 10.0 Pfd-2L $25.00 $18.64 5.10% Feb 28/May 31/Aug 31/Nov 30 $0.95 30-Nov-2020 $25.00 10.83% 0.63% 10.19% 5YR GoC Yld +2.96%Valener Inc. 4.35%., Series A VNR.PR.A 4.0 Pfd-2L $25.00 $16.43 6.62% Jan 15/Apr 15/Jul 15/Oct 15 $1.09 15-Oct-2017 $25.00 31.32% 0.42% 30.89% 5YR GoC Yld +2.81%Veresen Inc. 4.4%, Series A VSN.PR.A 8.0 Pfd-3 $25.00 $12.40 8.87% Mar 31/Jun 30/Sep 30/Dec 31 $1.10 30-Sep-2017 $25.00 51.97% 0.42% 51.55% 5YR GoC Yld +2.92%Veresen Inc. 5.0%, Series C VSN.PR.C 6.0 Pfd-3 $25.00 $13.65 9.16% Mar 31/Jun 30/Sep 30/Dec 31 $1.25 31-Mar-2019 $25.00 27.06% 0.43% 26.63% 5YR GoC Yld +3.01%Veresen Inc. 5.0%, Series E VSN.PR.E 8.0 Pfd-3 $25.00 $17.10 7.31% Mar 31/Jun 30/Sep 30/Dec 31 $1.25 30-Jun-2020 $25.00 15.09% 0.56% 14.53% 5YR GoC Yld +4.27%Westcoast Energy Inc., Series 10 W.PR.K 4.6 Pfd-2L $25.00 $24.59 5.34% Jan 15/Apr 15/Jul 15/Oct 15 $1.31 15-Jan-2021 $25.00 NA NA NA 5YR GoC Yld +4.26% (min. 5.25%)Non-Cumulative Bank of Montreal 3.39%, Series 16 BMO.PR.M 6.3 Pfd-2H $25.00 $23.74 3.57% Feb 25/May 25/Aug 25/Nov 25 $0.85 25-Aug-2018 $25.00 5.43% 0.42% 5.01% 5YR GoC Yld +1.65%Bank of Montreal 3.90%, Series 25 BMO.PR.Q 11.6 Pfd-2H $25.00 $18.57 5.25% Feb 25/May 25/Aug 25/Nov 25 $0.98 25-Aug-2016 $25.00 37.25% NA NA 5YR GoC Yld +1.15%Bank of Montreal 4.0%, Series 27 - NVCC BMO.PR.S 20.0 Pfd-2 $25.00 $17.56 5.69% Feb 25/May 25/Aug 25/Nov 25 $1.00 25-May-2019 $25.00 15.59% 0.45% 15.14% 5YR GOC Yld +2.33%Bank of Montreal 3.90%, Series 29 - NVCC BMO.PR.T 16.0 Pfd-2 $25.00 $17.10 5.70% Feb 25/May 25/Aug 25/Nov 25 $0.98 25-Aug-2019 $25.00 15.54% 0.47% 15.07% 5YR GoC Yld +2.24%Bank of Montreal 3.80%, Series 31 - NVCC BMO.PR.W 12.0 Pfd-2 $25.00 $16.85 5.64% Feb 25/May 25/Aug 25/Nov 25 $0.95 25-Nov-2019 $25.00 15.14% 0.49% 14.65% 5YR GoC Yld +2.22%Bank of Montreal 3.8%, Series 33 - NVCC BMO.PR.Y 8.0 Pfd-3H * $25.00 $19.37 4.90% Feb 25/May 25/Aug 25/Nov 25 $0.95 25-Aug-2020 $25.00 9.94% 0.59% 9.35% 5YR GoC Yld +2.71%The Bank of Nova Scotia 3.35%, Series 18 BNS.PR.P 7.5 Pfd-2H $25.00 $23.99 3.49% Jan 28/Apr 28/Jul 28/Oct 28 $0.84 26-Apr-2018 $25.00 5.31% 0.42% 4.89% 5YR GoC Yld +2.05%The Bank of Nova Scotia 3.61%, Series 20 BNS.PR.Q 8.0 Pfd-2H $25.00 $23.76 3.80% Jan 28/Apr 28/Jul 28/Oct 28 $0.90 26-Oct-2018 $25.00 5.61% 0.42% 5.18% 5YR GoC Yld +1.70%The Bank of Nova Scotia 3.83%, Series 22 BNS.PR.R 9.4 Pfd-2H $25.00 $23.94 4.00% Jan 28/Apr 28/Jul 28/Oct 28 $0.96 26-Jan-2019 $25.00 5.40% 0.43% 4.98% 5YR GoC Yld +1.88%The Bank of Nova Scotia 1.82%, Series 30 BNS.PR.Y 6.1 Pfd-2H $25.00 $19.40 2.35% Jan 28/Apr 28/Jul 28/Oct 28 $0.46 26-Apr-2020 $25.00 8.14% 0.54% 7.61% 5YR GoC Yld +1.00%The Bank of Nova Scotia 3.70%, Series 32 BNS.PR.Z 11.2 Pfd-2H $25.00 $18.89 4.90% Jan 31/Apr 30/Jul 31/Oct 31 $0.93 2-Feb-2016 $25.00 NA NA NA 5YR GoC Yld +1.34%The Bank of Nova Scotia 5.50%, Series 34 - NVCC BNS.PR.E 14.0 Pfd-2 $25.00 $25.55 5.38% Jan 29/Apr 28/Jul 29/Oct 29 $1.38 25-Apr-2021 $25.00 NA NA NA 5YR GoC Yld +4.51%Canadian Imperial Bank of Commerce 3.90%, Series 39 - NVCC CM.PR.O 16.0 Pfd-2 $25.00 $17.78 5.48% Jan 28/Apr 28/Jul 28/Oct 28 $0.98 31-Jul-2019 $25.00 14.63% 0.46% 14.17% 5YR GoC Yld +2.32%Canadian Imperial Bank of Commerce 3.75%, Series 41 - NVCC CM.PR.P 12.0 Pfd-2 $25.00 $17.20 5.45% Jan 28/Apr 28/Jul 28/Oct 28 $0.94 31-Jan-2020 $25.00 14.13% 0.50% 13.63% 5YR GoC Yld +2.24%Canadian Imperial Bank of Commerce 3.6%, Series 43 - NVCC CM.PR.Q 12.0 Pfd-2 $25.00 $19.10 4.71% Jan 28/Apr 28/Jul 28/Oct 28 $0.90 31-Jul-2020 $25.00 10.24% 0.58% 9.66% 5YR GoC Yld +2.79%Canadian Western Bank 4.40%, Series 5 - NVCC CWB.PR.B 5.0 Pfd-3 $25.00 $15.68 7.02% Jan 31/Apr 30/Jul 31/Oct 31 $1.10 30-Apr-2019 $25.00 20.42% 0.44% 19.98% 5YR GoC Yld +2.76%
Source: Bloomberg, Financial Post DataGroup Fixed‐Resets ‐ 14

Fixed-Reset Preferred SharesShares O/S Price
Preferred Share Issue Symbol (millions) Par 29-Jan-16 Yield Dividend Dates Annual Date Price Yield to Yield SpreadRating DBRS Terms of ResetCan Govt - EquivalentCall / ResetDividend
Equitable Group Inc. 6.35%, Series 3 EQB.PR.C 3.0 NR $25.00 $20.36 7.80% Mar 31/Jun 30/Sep 30/Dec 31 $1.59 30-Sep-2019 $25.00 13.01% 0.48% 12.54% 5YR GoC Yld +4.78%Great-West Lifeco Inc. 2.176%, Series N GWO.PR.N 8.5 Pfd-2H $25.00 $12.02 4.53% Mar 31/Jun 30/Sep 30/Dec 31 $0.54 31-Dec-2020 $25.00 18.60% 0.65% 17.96% 5YR GoC Yld +1.30%Industrial Alliance Insurance and Financial Seriesvices Inc. 4.3%, Series G IAG.PR.G 10.0 Pfd-2H $25.00 $19.11 5.63% Mar 31/Jun 30/Sep 30/Dec 31 $1.08 30-Jun-2017 $25.00 25.02% 0.43% 24.59% 5YR GoC Yld +2.85%Intact Financial Corporation 4.20%, Series 1 IFC.PR.A 10.0 Pfd-2 $25.00 $14.23 7.38% Mar 31/Jun 30/Sep 30/Dec 31 $1.05 31-Dec-2017 $25.00 36.96% 0.42% 36.54% 5YR GoC Yld +1.72%Intact Financial Corporation 4.20%, Series 3 IFC.PR.C 10.0 Pfd-2 $25.00 $16.20 6.48% Mar 31/Jun 30/Sep 30/Dec 31 $1.05 30-Sep-2016 $25.00 59.19% NA NA 5YR GoC Yld +2.66%Laurentian Bank of Canada 4%, Series 11 LB.PR.F 4.0 Pfd-3H $25.00 $23.46 4.26% Mar 15/Jun 15/Sep 15/Dec 15 $1.00 15-Dec-2017 $25.00 7.91% 0.42% 7.49% 5YR GoC Yld +2.60%Laurentian Bank of Canada 4.3%, Series 13 - NVCC LB.PR.H 5.0 Pfd-3 $25.00 $17.35 6.20% Mar 15/Jun 15/Sep 15/Dec 15 $1.08 15-Jun-2019 $25.00 16.58% 0.45% 16.13% 5YR GoC Yld +2.55%Manulife Financial Corporation 4.2%, Series 3 MFC.PR.F 8.0 Pfd-2 $25.00 $12.04 8.72% Mar 19/Jun 19/Sep 19/Dec 19 $1.05 19-Jun-2016 $25.00 112.01% NA NA 5YR GoC Yld +1.41%Manulife Financial Corporation 4.40%, Series 5 MFC.PR.G 8.0 Pfd-2 $25.00 $17.89 6.15% Mar 19/Jun 19/Sep 19/Dec 19 $1.10 19-Dec-2016 $25.00 45.91% NA NA 5YR GoC Yld +2.90%Manulife Financial Corporation 4.60%, Series 7 MFC.PR.H 10.0 Pfd-2 $25.00 $19.45 5.91% Mar 19/Jun 19/Sep 19/Dec 19 $1.15 19-Mar-2017 $25.00 29.07% 0.44% 28.63% 5YR GoC Yld +3.13%Manulife Financial Corporation 4.40%, Series 9 MFC.PR.I 10.0 Pfd-2 $25.00 $18.26 6.02% Mar 19/Jun 19/Sep 19/Dec 19 $1.10 19-Sep-2017 $25.00 25.64% 0.43% 25.21% 5YR GoC Yld +2.86%Manulife Financial Corporation 4.0%, Series 11 MFC.PR.J 8.0 Pfd-2 $25.00 $17.50 5.71% Mar 19/Jun 19/Sep 19/Dec 19 $1.00 19-Mar-2018 $25.00 22.44% 0.42% 22.03% 5YR GoC Yld +2.61%Manulife Financial Corporation 3.80%, Series 13 MFC.PR.K 8.0 Pfd-2 $25.00 $16.51 5.75% Mar 19/Jun 19/Sep 19/Dec 19 $0.95 19-Sep-2018 $25.00 21.26% 0.42% 20.84% 5YR GOC Yld +2.22%Manulife Financial Corporation 3.90%, Series 15 MFC.PR.L 8.0 Pfd-2 $25.00 $16.87 5.78% Mar 19/Jun 19/Sep 19/Dec 19 $0.98 19-Jun-2019 $25.00 16.95% 0.45% 16.49% 5YR GOC Yld +2.16%Manulife Financial Corporation 3.90%, Series 17 MFC.PR.M 14.0 Pfd-2 $25.00 $17.90 5.45% Mar 19/Jun 19/Sep 19/Dec 19 $0.98 19-Dec-2019 $25.00 13.62% 0.49% 13.13% 5YR GoC Yld +2.36%Manulife Financial Corporation 3.80%, Series 19 MFC.PR.N 10.0 Pfd-2 $25.00 $17.67 5.38% Mar 19/Jun 19/Sep 19/Dec 19 $0.95 19-Mar-2020 $25.00 13.30% 0.52% 12.79% 5YR GoC Yld +2.30%National Bank of Canada 3.80%, Series 28 NA.PR.Q 8.0 Pfd-2 $25.00 $23.38 4.06% Feb 15/May 15/Aug 15/Nov 15 $0.95 15-Nov-2017 $25.00 7.65% 0.42% 7.23% 5YR GoC Yld +2.43%National Bank of Canada 4.1%, Series 30 - NVCC NA.PR.S 14.0 Pfd-2L $25.00 $17.42 5.88% Feb 15/May 15/Aug 15/Nov 15 $1.03 15-May-2019 $25.00 16.13% 0.44% 15.68% 5YR GoC Yld +2.40%National Bank of Canada 3.90%, Series 32 - NVCC NA.PR.W 12.0 Pfd-2L $25.00 $16.64 5.86% Feb 15/May 15/Aug 15/Nov 15 $0.98 15-Feb-2020 $25.00 15.08% 0.51% 14.57% 5YR GoC Yld +2.25%National Bank of Canada 5.60%, Series 34 - NVCC NA.PR.X 16.0 NR $25.00 $24.97 5.61% Feb 15/May 15/Aug 15/Nov 15 $1.40 15-May-2021 $25.00 NA NA NA 5YR GoC Yld +4.90%Power Financial Corporation 4.4%, Series P PWF.PR.P 9.0 Pfd-2H $25.00 $12.04 9.14% Jan 31/Apr 30/Jul 31/Oct 31 $1.10 31-Jan-2016 $25.00 NA NA NA 5YR GoC Yld +1.60%Power Financial Corporation 4.20%, Series T PWF.PR.T 8.0 Pfd-2H $25.00 $21.38 4.91% Jan 31/Apr 30/Jul 31/Oct 31 $1.05 31-Jan-2019 $25.00 9.86% 0.43% 9.43% 5YR GoC Yld +2.37%Royal Bank of Canada 3.90%, Series BB - NVCC RY.PR.H 20.0 Pfd-2 $25.00 $17.44 5.59% Feb 24/May 24/Aug 24/Nov 24 $0.98 24-Aug-2019 $25.00 14.93% 0.47% 14.47% 5YR GoC Yld +2.26%Royal Bank of Canada 3.52%, Series AJ RY.PR.I 13.6 Pfd-2H $25.00 $23.80 3.70% Feb 24/May 24/Aug 24/Nov 24 $0.88 24-Feb-2019 $25.00 5.16% 0.43% 4.73% 5YR GoC Yld +1.93%Royal Bank of Canada 4.26%, Series AL RY.PR.L 12.0 Pfd-2H $25.00 $24.90 4.28% Feb 24/May 24/Aug 24/Nov 24 $1.07 24-Feb-2019 $25.00 4.31% 0.43% 3.89% 5YR GoC Yld +2.67%Royal Bank of Canada 4.0%, Series AZ - NVCC RY.PR.Z 20.0 Pfd-2 $25.00 $17.44 5.73% Feb 24/May 24/Aug 24/Nov 24 $1.00 24-May-2019 $25.00 15.84% 0.45% 15.39% 5YR GoC Yld +2.21%Royal Bank of Canada 3.6%, Series BD - NVCC RY.PR.J 20.0 Pfd-2 $25.00 $18.55 4.85% Feb 24/May 24/Aug 24/Nov 24 $0.90 24-May-2020 $25.00 11.17% 0.55% 10.62% 5YR GoC Yld +2.74%Royal Bank of Canada 3.60%, Series BF - NVCC RY.PR.M 21.0 Pfd-2 $25.00 $18.44 4.88% Feb 24/May 24/Aug 24/Nov 24 $0.90 24-Nov-2020 $25.00 10.58% 0.63% 9.95% 5YR GoC Yld +2.62%Royal Bank of Canada 5.50%, Series BK - NVCC RY.PR.Q 22.0 Pfd-2 $25.00 $25.69 5.35% Feb 24/May 24/Aug 24/Nov 24 $1.38 24-May-2021 $25.00 NA NA NA 5YR GoC Yld +4.53%Sun Life Financial Inc. 2.275%, Series 8R SLF.PR.G 5.2 Pfd-2 $25.00 $13.25 4.29% Mar 31/Jun 30/Sep 30/Dec 31 $0.57 30-Jun-2020 $25.00 18.03% 0.56% 17.46% 5YR GoC Yld +1.41%Sun Life Financial Inc. 3.9%, Series 10R SLF.PR.H 8.0 Pfd-2 $25.00 $14.61 6.67% Mar 31/Jun 30/Sep 30/Dec 31 $0.98 30-Sep-2016 $25.00 76.13% NA NA 5YR GoC Yld +2.17%Sun Life Financial Inc. 4.25%, Series 12R SLF.PR.I 12.0 Pfd-2 $25.00 $17.20 6.18% Mar 31/Jun 30/Sep 30/Dec 31 $1.06 31-Dec-2016 $25.00 51.54% NA NA 5YR GoC Yld +2.73%The Toronto-Dominion Bank 3.90%, Series 1 - NVCC TD.PF.A 20.0 Pfd-2 $25.00 $17.43 5.59% Jan 31/Apr 30/Jul 31/Oct 31 $0.98 31-Oct-2019 $25.00 14.55% 0.48% 14.06% 5YR GoC Yld +2.24%The Toronto-Dominion Bank 3.80%, Series 3 - NVCC TD.PF.B 20.0 Pfd-2 $25.00 $17.40 5.46% Jan 31/Apr 30/Jul 31/Oct 31 $0.95 31-Jul-2019 $25.00 15.19% 0.46% 14.73% 5YR GoC Yld +2.27%The Toronto-Dominion Bank 3.75%, Series 5 - NVCC TD.PF.C 20.0 Pfd-2 $25.00 $17.40 5.39% Jan 31/Apr 30/Jul 31/Oct 31 $0.94 31-Jan-2020 $25.00 13.79% 0.50% 13.29% 5YR GoC Yld +2.25%The Toronto-Dominion Bank 3.371%, Series S TD.PR.S 5.4 Pfd-2H $25.00 $24.10 3.50% Jan 31/Apr 30/Jul 31/Oct 31 $0.84 31-Jul-2018 $25.00 4.93% 0.42% 4.51% 5YR GoC Yld +1.60%The Toronto-Dominion Bank 3.5595%, Series Y TD.PR.Y 5.5 Pfd-2H $25.00 $23.87 3.73% Jan 31/Apr 30/Jul 31/Oct 31 $0.89 31-Oct-2018 $25.00 5.35% 0.42% 4.93% 5YR GoC Yld +1.68%The Toronto-Dominion Bank 3.6%, Series 7 - NVCC TD.PF.D 14.0 Pfd-2 $25.00 $19.05 4.72% Jan 31/Apr 30/Jul 31/Oct 31 $0.90 31-Jul-2020 $25.00 10.30% 0.58% 9.72% 5YR GoC Yld +2.79%The Toronto-Dominion Bank 3.7%, Series 9 - NVCC TD.PF.E 8.0 Pfd-2 $25.00 $20.00 4.63% Jan 31/Apr 30/Jul 31/Oct 31 $0.93 31-Oct-2020 $25.00 8.93% 0.62% 8.31% 5YR GoC Yld +2.87%The Toronto-Dominion Bank 5.6%, Series 12 - NVCC TD.PF.G 28.0 Pfd-2 $25.00 $25.73 5.34% Jan 31/Apr 30/Jul 31/Oct 31 $1.38 30-Apr-2021 $25.00 5.17% 0.69% 4.48% 5YR GoC Yld +4.66%Notes:Canadian government bond equivalents and spreads are calculated by interpolating a standard Canadian Government Bond Yield Curve.For redemption / retraction dates within one year, total return is displayed in lieu of yield to redemption / retraction.Redemption dates that have passed are not displayed. If the first redemption date has passed, most preferred shares are callable at anytime at prices that may differ from the table.Rating DBRS: /*+ Review for Possible Upgrade , /*- Review for Possible Downgrade, /* Review with Direction UncertainPLEASE LOOK TO THE ISSUE'S PROSPECTUS FOR FULL DETAILS.** Non-Viability Contingent Capital (NVCC)Price Date = Jan-29-2016
Source: Bloomberg, Financial Post DataGroup Fixed‐Resets ‐ 15

Floating-Rate Preferred Shares PRIOR_CLOSE_MIDShares O/S Price Dividend
Preferred Share Issue Symbol (millions) Par 29-Jan-16 Yield Dividend Dates Annual** Date Price Floating Rate TermsCumulativeAimia Inc. Ser 2 AIM.PR.B 2.9 Pfd-3L $25.00 $9.80 10.74% Mar 31/Jun 30/Sep 30/Dec 31 $1.05 31-Mar-2020 * $25.00 3M GoC T-Bill Yld +3.75%AltaGas Ltd. Series B ALA.PR.B 2.5 Pfd-3 $25.00 $13.68 5.70% Mar 31/Jun 30/Sep 30/Dec 31 $0.78 01-Apr-2020 * $25.00 3M GoC T-Bill Yld +2.66%Atlantic Power Preferred Equity Ltd., Series 3 AZP.PR.C 1.7 NR $25.00 $9.50 12.21% Mar 31/Jun 30/Sep 30/Dec 31 $1.16 31-Dec-2019 * $25.00 3M GoC T-Bill Yld +4.18%BCE Inc. 1st Pfd Ser AB BCE.PR.B 9.9 Pfd-3H $25.00 $13.29 5.08% Monthly -12 $0.68 Anytime $25.50 Floor (50% of Prime)/Ceiling (100% of Prime)BCE Inc. 1st Pfd Ser S BCE.PR.S 3.6 Pfd-3H $25.00 $13.00 5.19% Monthly -12 $0.68 Anytime $25.50 Floor (50% of Prime)/Ceiling (100% of Prime)BCE Inc. 1st Pfd Ser Y BCE.PR.Y 8.8 Pfd-3H $25.00 $13.15 5.13% Monthly -12 $0.68 Anytime $25.50 Floor (50% of Prime)/Ceiling (100% of Prime)BCE Inc. Cl A Ser AE BCE.PR.E 9.3 Pfd-3H $25.00 $13.15 5.13% Monthly -12 $0.68 Anytime $25.50 Floor (50% of Prime)/Ceiling (100% of Prime)BCE Inc. Cl A Ser AH BCE.PR.H 3.2 Pfd-3H $25.00 $13.00 5.19% Monthly -12 $0.68 Anytime $25.50 Floor (50% of Prime)/Ceiling (100% of Prime)BCE Inc. Cl A Ser AJ BCE.PR.J 3.2 Pfd-3H $25.00 $12.95 5.21% Monthly -12 $0.68 Anytime $25.50 Floor (50% of Prime)/Ceiling (100% of Prime)BCE Inc.1st Pfd Ser AD BCE.PR.D 14.9 Pfd-3H $25.00 $13.13 5.14% Monthly -12 $0.68 Anytime $25.50 Floor (50% of Prime)/Ceiling (100% of Prime)Bombardier Inc. Ser 2 BBD.PR.B 9.7 NR $25.00 $6.45 10.47% Monthly -15 $0.68 Anytime $25.50 Floor (50% of Prime)/Ceiling (100% of Prime)Brookfield Office Properties Inc.Ser V BPO.PR.X 1.8 Pfd-3 $25.00 $9.60 4.92% Feb 14/May 14/Aug 14/Nov 14 $0.47 Anytime $25.00 70% of Prime x $25.00Brookfield Office Properties Inc. Ser W BPO.PR.W 3.8 Pfd-3 $25.00 $12.90 3.66% Feb 14/May 14/Aug 14/Nov 14 $0.47 Anytime $25.00 70% of Prime x $25.00Brookfield Office Properties Inc. Ser Y BPO.PR.Y 2.8 Pfd-3 $25.00 $12.90 3.66% Feb 14/May 14/Aug 14/Nov 14 $0.47 Anytime $25.00 70% of Prime x $25.00Brookfield Asset Mgmt. Inc. Cl A Ser 13 BAM.PR.K 10.0 Pfd-2L $25.00 $10.00 4.73% Mar 31/Jun 30/Sep 30/Dec 31 $0.47 Anytime $25.00 70% of Prime x $25.00Brookfield Asset Mgmt. Inc. Cl A Ser 2 BAM.PR.B 9.8 Pfd-2L $25.00 $9.96 4.74% Mar 31/Jun 30/Sep 30/Dec 31 $0.47 Anytime $25.00 70% of Prime x $25.00Brookfield Asset Mgmt. Inc. Cl A Ser 4 BAM.PR.C 4.0 Pfd-2L $25.00 $9.95 4.75% Mar 31/Jun 30/Sep 30/Dec 31 $0.47 Anytime $25.00 70% of Prime x $25.00Brookfield Asset Mgmt. Inc. Cl A Ser 8 BAM.PR.E 4.0 Pfd-2L $25.00 $13.15 5.13% Monthly -12 $0.68 Anytime $25.50 Floor (50% of Prime)/Ceiling (100% of Prime)Brookfield Renewable Power Pref Equity Fund Ser 2 BRF.PR.B 4.5 Pfd-3H * $25.00 $12.88 5.98% Jan 31/Apr 30/July 31/Oct 31 $0.77 30-Apr-2020 * $25.00 3M GoC T-Bill Yld +2.62%Dundee Corporation, Series 3 DC.PR.D 1.7 NR $25.00 $8.85 12.88% Mar 31/Jun 30/Sep 30/Dec 31 $1.14 30-Sep-2019 * $25.00 3M GoC T-Bill Yld +4.10%Emera Inc, Series B EMA.PR.B 2.1 Pfd-3H * $25.00 $11.50 5.00% Feb 15/May 15/Aug 15/Nov 15 $0.58 15-Aug-2020 * $25.00 3M GoC T-Bill Yld +1.84%Fairfax Financial Holdings Limited, Series D FFH.PR.D 4.0 Pfd-3 $25.00 $16.20 5.57% Mar 31/Jun 30/Sep 30/Dec 31 $0.90 31-Dec-2019 * $25.00 3M GoC T-Bill Yld +3.15%Fairfax Financial Holdings Limited, Series F FFH.PR.F 3.6 Pfd-3 $25.00 $11.42 5.74% Mar 31/Jun 30/Sep 30/Dec 31 $0.66 31-Mar-2020 * $25.00 3M GoC T-Bill Yld +2.16%Fairfax Financial Holdings Limited, Series H FFH.PR.H 2.6 Pfd-3 $25.00 $14.39 5.25% Mar 31/Jun 30/Sep 30/Dec 31 $0.76 01-Apr-2020 * $25.00 3M GoC T-Bill Yld +2.56%Fairfax Financial Holdings Limited, Series J FFH.PR.J 1.5 Pfd-3 $25.00 $14.20 5.83% Mar 31/Jun 30/Sep 30/Dec 31 $0.83 31-Dec-2020 * $25.00 3M GoC T-Bill Yld +2.85%Fortis Inc. Ser I FTS.PR.I 3.0 Pfd-2L $25.00 $10.45 4.57% Mar 1/Jun 1/Sep 1/Dec 1 $0.48 30-Jun-2020 * $25.00 3M GoC T-Bill Yld +1.45%Northland Power Inc., Series 2 NPI.PR.B 1.5 NR $25.00 $12.25 6.65% Mar 31/Jun 30/Sep 30/Dec 31 $0.82 01-Jul-2020 * $25.00 3M GoC T-Bill Yld +2.80%Power Corp of Canada 1st Pfd 1986 Ser POW.PR.F 0.4 Pfd-2 $50.00 $29.00 3.26% Jan 15/Apr 15/Jul 15/Oct 15 $0.95 Anytime $50.00 70% of Prime x $50.00Power Financial Corp 1st Pfd Ser A PWF.PR.A 4.0 Pfd-2H $25.00 $11.26 4.20% Feb 15/May 15/Aug 15/Nov 15 $0.47 Anytime $25.00 70% of Prime x $25.00Thomson Reuters Corp Ser II TRI.PR.B 6.0 Pfd-3H $25.00 $10.98 4.30% Mar 31/Jun 30/Sep 30/Dec 31 $0.47 Anytime $25.00 70% of Prime x $25.00TransCanada Corporation, Series 2 TRP.PR.F 12.5 Pfd-2L $25.00 $11.94 4.98% Mar 31/Jun 30/Sep 30/Dec 31 $0.60 31-Dec-2019 * $25.00 3M GoC T-Bill Yld +1.92%TransCanada Corporation, Series 4 TRP.PR.H 5.5 Pfd-2L $25.00 $9.15 4.75% Mar 31/Jun 30/Sep 30/Dec 31 $0.44 30-Jun-2020 * $25.00 3M GoC T-Bill Yld +1.28%
Rating DBRS
Call
Source: Bloomberg, Financial Post DataGroup Floating‐Rates ‐ 16

Floating-Rate Preferred Shares PRIOR_CLOSE_MIDShares O/S Price Dividend
Preferred Share Issue Symbol (millions) Par 29-Jan-16 Yield Dividend Dates Annual** Date Price Floating Rate TermsRating DBRS
Call
Non-CumulativeBank of Montreal Ser 17 BMO.PR.R 5.7 Pfd-2H $25.00 $22.50 2.34% Feb 25/May 25/Aug 25/Nov 25 $0.53 25-Aug-2018 * $25.00 3M GoC T-Bill Yld +1.65%Bank of Nova Scotia Ser 19 BNS.PR.A 6.3 Pfd-2H $25.00 $22.51 2.79% Jan 28/Apr 28/Jul 28/Oct 28 $0.63 26-Apr-2018 * $25.00 3M GoC T-Bill Yld +2.05%Bank of Nova Scotia Ser 21 BNS.PR.B 6.0 Pfd-2H $25.00 $21.80 2.48% Jan 28/Apr 28/Jul 28/Oct 28 $0.54 26-Oct-2018 * $25.00 3M GoC T-Bill Yld +1.70%Bank of Nova Scotia Ser 23 BNS.PR.C 2.6 Pfd-2H $25.00 $22.26 2.63% Jan 28/Apr 28/Jul 28/Oct 28 $0.59 26-Jan-2019 * $25.00 3M GoC T-Bill Yld +1.88%Bank of Nova Scotia Ser 31 BNS.PR.D 4.5 NR $25.00 $18.55 1.97% Jan 31/Apr 30/July 31/Oct 31 $0.37 26-Apr-2020 * $25.00 3M GoC T-Bill Yld +1.00%Great-West Lifeco Ser O GWO.PR.O 1.5 NR $25.00 $12.00 3.67% Mar 31/June 30/Sep 30/Dec 31 $0.44 31-Dec-2020 * $26.00 3M GoC T-Bill Yld +1.30%Royal Bank Series AK RY.PR.K 2.4 Pfd-2 $25.00 $21.83 2.74% Feb 24/May 24/Aug 24/Nov 24 $0.60 24-Feb-2019 * $25.00 3M GoC T-Bill Yld +1.93%Sun Life Financial Ser 9QR SLF.PR.J 6.0 Pfd-2 $25.00 $11.53 4.05% Mar 31/Jun 30/Sep 30/Dec 31 $0.47 30-Jun-2020 * $25.00 3M GoC T-Bill Yld +1.41%Toronto-Dominion Bank Ser T TD.PR.T 4.6 Pfd-2H $25.00 $22.16 2.32% Jan 31/Apr 30/Jul 31/Oct 31 $0.52 31-Jul-2018 * $25.00 3M GoC T-Bill Yld +1.60%Toronto-Dominion Bank Ser Z TD.PR.Z 4.5 Pfd-2H $25.00 $22.15 2.42% Jan 31/Apr 30/Jul 31/Oct 31 $0.54 31-Oct-2018 * $25.00 3M GoC T-Bill Yld +1.68%Notes:
Canadian Prime Rate as of 29-Jan-16: 2.7%3M Canadian T-bill Yield as of 29-Jan-16: 0.456%* Callable on date shown and every five years thereafter at $25.00 per share; otherwise callable anytime at $25.50** = Indicated dividend, based on current level for the reference rate (3M GoC T-bill Yield or Canadian Prime Rate); see floating rate termsCanadian government bond equivalents and spreads are calculated by interpolating a standard Canadian Government Bond Yield Curve.For redemption / retraction dates within one year, total return is displayed in lieu of yield to redemption / retraction.Redemption dates that have passed are not displayed. If the first redemption date has passed, most preferred shares are callable at anytime at prices that may differ from the table.Rating DBRS: /*+ Review for Possible Upgrade , /*- Review for Possible Downgrade, /* Review with Direction UncertainPLEASE LOOK TO THE ISSUE'S PROSPECTUS FOR FULL DETAILS.Price Date = Jan-29-2016
Source: Bloomberg, Financial Post DataGroup Floating‐Rates ‐ 17

US$ Pay Canadian Preferred Shares PRIOR_CLOSE_MIDShares O/S Price Dividend
Preferred Share Issue Symbol (millions) Par 29-Jan-16 Yield Dividend Dates Annual Date Price Yield to Yield SpreadFixed ResetAltaGas Ltd. 4.4% Cum. 5-Year Rate Reset Pref., Series C ALA.PR.U 8.0 Pfd-3 $25.00 $17.52 6.28% Mar 31/Jun 30/Sep 30/Dec 31 $1.10 30-Sep-2017 $25.00 27.87% 0.67% 27.20% 5YR USG Yld +3.58%Enbridge Inc. 4.0% Cum. 5-Year Rate Reset Pref., Series J ENB.PR.U 8.0 Pfd-3H $25.00 $14.85 6.73% Mar 1/Jun 1/Sep 1/Dec 1 $1.00 1-Jun-2017 $25.00 47.86% 0.57% 47.29% 5YR USG Yld +3.05%Enbridge Inc. 4.0% Cum. 5-Year Rate Reset Pref., Series L ENB.PF.U 16.0 Pfd-3H $25.00 $15.10 6.62% Mar 1/Jun 1/Sep 1/Dec 1 $1.00 1-Sep-2017 $25.00 39.60% 0.65% 38.95% 5YR USG Yld +3.15%Enbridge Inc. 4.0% Cum. Reset Pref., Series 1 ENB.PR.V 16.0 Pfd-3H $25.00 $15.00 6.67% Mar 1/Jun 1/Sep 1/Dec 1 $1.00 1-Jun-2018 $25.00 28.55% 0.84% 27.71% 5YR USG Yld +3.14%Enbridge Inc. 4.4% Cum. Reset Pref., Series 5 ENB.PF.V 8.0 Pfd-3H $25.00 $15.06 7.30% Mar 1/Jun 1/Sep 1/Dec 1 $1.10 1-Mar-2019 $25.00 23.20% 0.99% 22.21% 5YR USG Yld +2.82%Soft-Retractables: CumulativeBrookfield Office Properties Inc. 5.25% Cl AAA Ser G BPO.PR.U 3.4 Pfd-3 $25.00 $25.05 5.24% Mar 31/Jun 30/Sep 30/Dec 31 $1.31 Anytime *** $25.00 NA NA NAStructured Preferred Shares - With Possible Early Redemption DatesBrookfield Property Split Corp. Cum. Class A Pref., Series 1 BPS.PR.U 1.0 N/A $25.00 $25.05 5.24% Mar 31/Jun 30/Sep 30/Dec 31 $1.31 Anytime *** $25.00 NA NA NANotes:US government bond equivalents and spreads are calculated by interpolating a standard US Government Bond Yield Curve.For redemption / retraction dates within one year, total return is displayed in lieu of yield to redemption / retraction.Redemption dates that have passed are not displayed. If the first redemption date has passed, most preferred shares are callable at anytime at prices that may differ from the table.Rating DBRS: /*+ Review for Possible Upgrade , /*- Review for Possible Downgrade, /* Review with Direction UncertainPLEASE LOOK TO THE ISSUE'S PROSPECTUS FOR FULL DETAILS.Price Date = Jan-29-2016
U.S Govt - EquivalentCall / Retraction***Rating DBRS Terms of Reset
Source: Bloomberg, Financial Post DataGroup US$ Pay Canadian ‐ 18

Structured Preferred Shares - With Possible Early Redemption DatesShares O/S Price
Preferred Share Issue Symbol (millions) Par 29-Jan-16 Yield Dividend Dates Annual** Date Approx Price * Yield to Yield Spread5Banc Split Inc. 4.75% Cum. Cl C FBS.PR.C 1.1 Pfd-2 $10.00 $10.07 4.72% Mar 15/Jun 15/Sep 15/Dec 15 $0.48 Annual $10.00 NA NA NA
15-Dec-2016 *** $10.00 4.03% NA NAAllBanc Split Corp. 4% Cl C Ser 1 Cum. ABK.PR.C 0.7 Pfd-2 $31.64 $31.50 4.02% Mar 10/Jun 10/Sep 10/Dec 10 $1.27 Annual $31.64 NA NA NA
9-Mar-2018 *** $31.64 4.53% 0.42% 4.11%AllBanc Split Corp. II 4.25% Ser 1 ALB.PR.B 0.8 Pfd-2 $21.80 $21.90 4.23% Feb 28/May 31/Aug 31/Nov 30 $0.93 Annual $21.80 NA NA NA
28-Feb-2016 *** $21.80 0.59% NA NAPartners Value Split Corp. 4.95% Cum. Cl AA Ser 1 PVS.PR.A 2.1 Pfd-2L $25.00 $25.10 4.93% Mar 7/Jun 7/Sep 7/Dec 7 $1.24 Anytime $25.00 NA NA NA
25-Mar-2016 *** $25.00 1.07% NA NAPartners Value Split Corp. 4.35% Cum. Cl AA Ser 3 PVS.PR.B 7.6 Pfd-2L $25.00 $23.86 4.56% Mar 7/Jun 7/Sep 7/Dec 7 $1.09 Anytime $25.75 NA NA NA
10-Jan-2017 $25.50 11.87% NA NA10-Jan-2018 $25.25 7.78% 0.42% 7.37%10-Jan-2019 *** $25.00 6.33% 0.43% 5.90%
Partners Value Split Corp. 4.85% Cum. Cl AA Ser 5 PVS.PR.C 5.0 Pfd-2L $25.00 $24.50 4.95% Mar 7/Jun 7/Sep 7/Dec 7 $1.21 Anytime $25.50 NA NA NA10-Dec-2016 $25.25 8.06% NA NA10-Dec-2017 *** $25.00 6.45% 0.42% 6.03%
Partners Value Split Corp. 4.5% Cum. Cl AA Ser 6 PVS.PR.D 8.0 Pfd-2L $25.00 $22.30 5.04% Mar 7/Jun 7/Sep 7/Dec 7 $1.13 Anytime $26.00 NA NA NA8-Oct-2019 $25.50 8.66% 0.48% 8.18%8-Oct-2020 $25.25 7.63% 0.61% 7.02%8-Oct-2021 *** $25.00 6.97% 0.76% 6.22%
Brookfield Property Split Corp. 5.75% Cum. Class A Pref., Series 2 BPS.PR.A 1.0 N/A $25.00 $25.10 5.73% Mar 31/Jun 30/Sep 30/Dec 31 $1.44 Anytime $25.00 NA NA NABrookfield Property Split Corp. 5% Cum. Class A Pref., Series 3 BPS.PR.B 1.0 NR $25.00 $25.05 4.99% Mar 31/Jun 30/Sep 30/Dec 31 $1.25 Anytime $25.00 NA NA NABrookfield Property Split Corp. 5.25% Cum. Class A Pref., Series 4 BPS.PR.C 1.0 N/A $25.00 $25.10 5.18% Mar 31/Jun 30/Sep 30/Dec 31 $1.30 Anytime $25.00 NA NA NABig 8 Split Inc. 5.75% Class C Pfd Ser 1 BIG.PR.D 1.7 Pfd-2L $10.00 $10.30 4.37% Mar 15/Jun 15/Sep 15/Dec 15 $0.45 Annual $10.00 NA NA NA
15-Dec-2018 *** $10.00 3.62% 0.43% 3.19%Global Champions Split Corp. Cl A Ser 1 GCS.PR.A 2.0 Pfd-2 $25.00 $23.88 4.19% Jan 15/Apr 15/Jul 15/Oct 15 $1.00 Anytime $26.00 NA NA NA
31-Jul-2017 $25.50 8.65% 0.43% 8.23%31-Jul-2018 $25.25 6.42% 0.42% 6.00%31-Jul-2019 *** $25.00 5.48% 0.46% 5.02%
Newgrowth Corp. 4.15% Cum. Cl B Ser 3 NEW.PR.D 2.5 Pfd-2 $32.07 $32.10 4.15% Mar 26/Jun 26/Sep 26/Dec 26 $1.33 Annual $32.07 NA NA NA26-Jul-2019 *** $32.07 4.26% 0.46% 3.80%
R SPLIT III CORP 4.25% Class B Series 1 RBS.PR.B 0.5 Pfd-2 $13.60 $13.81 4.19% Feb 28/May 31/Aug 31/Nov 30 $0.58 Annual $13.60 NA NA NA31-May-2017 *** $13.60 3.64% 0.43% 3.21%
Notes:* = Approximate redemption / retraction values; ** = Dividends are subject to change on a monthly basis; *** = Mandatory Redemption, Approximate redemption / retraction valuesAnnual* = Possible early redemption dates are on a annual basis back from the mandatory redemption datesCanadian government bond equivalents and spreads are calculated by interpolating a standard Canadian Government Bond Yield Curve.For redemption / retraction dates within one year, total return is displayed in lieu of yield to redemption / retraction.Redemption dates that have passed are not displayed. If the first redemption date has passed, most preferred shares are callable at anytime at prices that may differ from the table.Rating DBRS: /*+ Review for Possible Upgrade , /*- Review for Possible Downgrade, /* Review with Direction UncertainPLEASE LOOK TO THE ISSUE'S PROSPECTUS FOR FULL DETAILS.Price Date = Jan-29-2016
Possible Early Redemption / Mandatory*** Can Govt - EquivalentRating DBRS
Dividend
Source: Bloomberg, Financial Post DataGroup Structured Preferred Shares ‐ Possible Early Redemption Dates ‐ 19
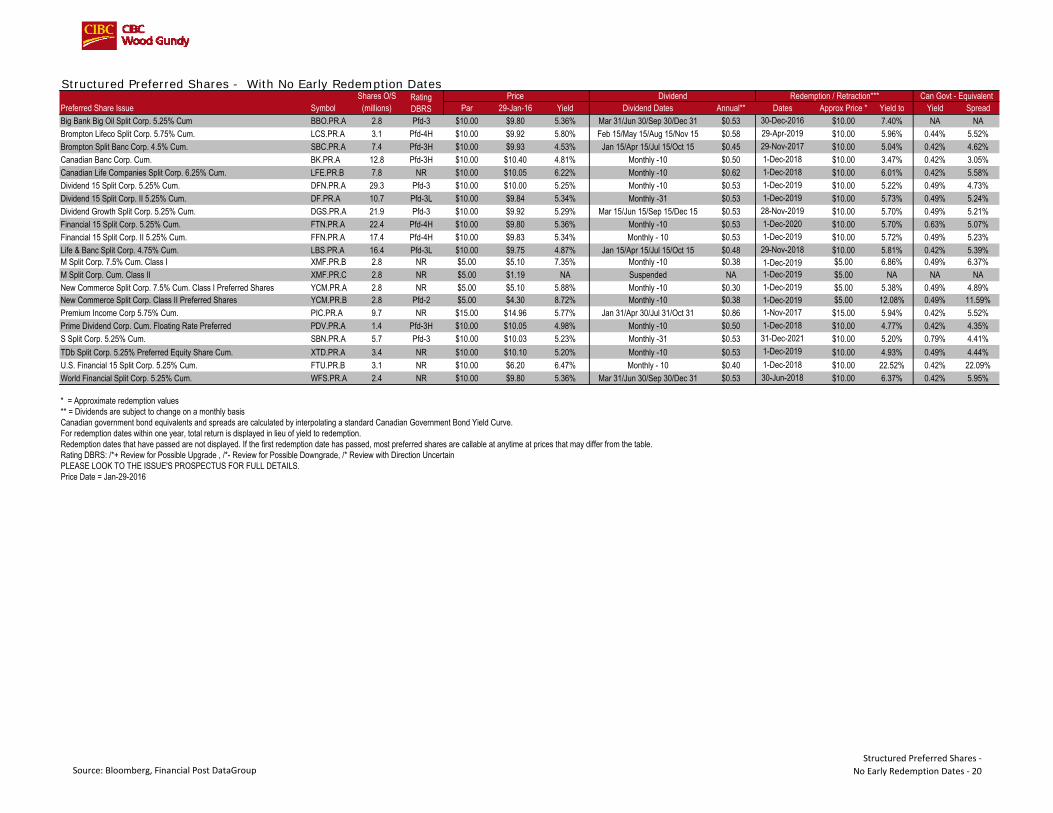
Structured Preferred Shares - With No Early Redemption DatesShares O/S Price
Preferred Share Issue Symbol (millions) Par 29-Jan-16 Yield Dividend Dates Annual** Dates Approx Price * Yield to Yield SpreadBig Bank Big Oil Split Corp. 5.25% Cum BBO.PR.A 2.8 Pfd-3 $10.00 $9.80 5.36% Mar 31/Jun 30/Sep 30/Dec 31 $0.53 30-Dec-2016 $10.00 7.40% NA NABrompton Lifeco Split Corp. 5.75% Cum. LCS.PR.A 3.1 Pfd-4H $10.00 $9.92 5.80% Feb 15/May 15/Aug 15/Nov 15 $0.58 29-Apr-2019 $10.00 5.96% 0.44% 5.52%Brompton Split Banc Corp. 4.5% Cum. SBC.PR.A 7.4 Pfd-3H $10.00 $9.93 4.53% Jan 15/Apr 15/Jul 15/Oct 15 $0.45 29-Nov-2017 $10.00 5.04% 0.42% 4.62%Canadian Banc Corp. Cum. BK.PR.A 12.8 Pfd-3H $10.00 $10.40 4.81% Monthly -10 $0.50 1-Dec-2018 $10.00 3.47% 0.42% 3.05%Canadian Life Companies Split Corp. 6.25% Cum. LFE.PR.B 7.8 NR $10.00 $10.05 6.22% Monthly -10 $0.62 1-Dec-2018 $10.00 6.01% 0.42% 5.58%Dividend 15 Split Corp. 5.25% Cum. DFN.PR.A 29.3 Pfd-3 $10.00 $10.00 5.25% Monthly -10 $0.53 1-Dec-2019 $10.00 5.22% 0.49% 4.73%Dividend 15 Split Corp. II 5.25% Cum. DF.PR.A 10.7 Pfd-3L $10.00 $9.84 5.34% Monthly -31 $0.53 1-Dec-2019 $10.00 5.73% 0.49% 5.24%Dividend Growth Split Corp. 5.25% Cum. DGS.PR.A 21.9 Pfd-3 $10.00 $9.92 5.29% Mar 15/Jun 15/Sep 15/Dec 15 $0.53 28-Nov-2019 $10.00 5.70% 0.49% 5.21%Financial 15 Split Corp. 5.25% Cum. FTN.PR.A 22.4 Pfd-4H $10.00 $9.80 5.36% Monthly -10 $0.53 1-Dec-2020 $10.00 5.70% 0.63% 5.07%Financial 15 Split Corp. II 5.25% Cum. FFN.PR.A 17.4 Pfd-4H $10.00 $9.83 5.34% Monthly - 10 $0.53 1-Dec-2019 $10.00 5.72% 0.49% 5.23%Life & Banc Split Corp. 4.75% Cum. LBS.PR.A 16.4 Pfd-3L $10.00 $9.75 4.87% Jan 15/Apr 15/Jul 15/Oct 15 $0.48 29-Nov-2018 $10.00 5.81% 0.42% 5.39%M Split Corp. 7.5% Cum. Class I XMF.PR.B 2.8 NR $5.00 $5.10 7.35% Monthly -10 $0.38 1-Dec-2019 $5.00 6.86% 0.49% 6.37%M Split Corp. Cum. Class II XMF.PR.C 2.8 NR $5.00 $1.19 NA Suspended NA 1-Dec-2019 $5.00 NA NA NANew Commerce Split Corp. 7.5% Cum. Class I Preferred Shares YCM.PR.A 2.8 NR $5.00 $5.10 5.88% Monthly -10 $0.30 1-Dec-2019 $5.00 5.38% 0.49% 4.89%New Commerce Split Corp. Class II Preferred Shares YCM.PR.B 2.8 Pfd-2 $5.00 $4.30 8.72% Monthly -10 $0.38 1-Dec-2019 $5.00 12.08% 0.49% 11.59%Premium Income Corp 5.75% Cum. PIC.PR.A 9.7 NR $15.00 $14.96 5.77% Jan 31/Apr 30/Jul 31/Oct 31 $0.86 1-Nov-2017 $15.00 5.94% 0.42% 5.52%Prime Dividend Corp. Cum. Floating Rate Preferred PDV.PR.A 1.4 Pfd-3H $10.00 $10.05 4.98% Monthly -10 $0.50 1-Dec-2018 $10.00 4.77% 0.42% 4.35%S Split Corp. 5.25% Cum. SBN.PR.A 5.7 Pfd-3 $10.00 $10.03 5.23% Monthly -31 $0.53 31-Dec-2021 $10.00 5.20% 0.79% 4.41%TDb Split Corp. 5.25% Preferred Equity Share Cum. XTD.PR.A 3.4 NR $10.00 $10.10 5.20% Monthly -10 $0.53 1-Dec-2019 $10.00 4.93% 0.49% 4.44%U.S. Financial 15 Split Corp. 5.25% Cum. FTU.PR.B 3.1 NR $10.00 $6.20 6.47% Monthly - 10 $0.40 1-Dec-2018 $10.00 22.52% 0.42% 22.09%World Financial Split Corp. 5.25% Cum. WFS.PR.A 2.4 NR $10.00 $9.80 5.36% Mar 31/Jun 30/Sep 30/Dec 31 $0.53 30-Jun-2018 $10.00 6.37% 0.42% 5.95%
* = Approximate redemption values** = Dividends are subject to change on a monthly basisCanadian government bond equivalents and spreads are calculated by interpolating a standard Canadian Government Bond Yield Curve.For redemption dates within one year, total return is displayed in lieu of yield to redemption.Redemption dates that have passed are not displayed. If the first redemption date has passed, most preferred shares are callable at anytime at prices that may differ from the table.Rating DBRS: /*+ Review for Possible Upgrade , /*- Review for Possible Downgrade, /* Review with Direction UncertainPLEASE LOOK TO THE ISSUE'S PROSPECTUS FOR FULL DETAILS.Price Date = Jan-29-2016
Can Govt - EquivalentRedemption / Retraction***Rating DBRS
Dividend
Source: Bloomberg, Financial Post DataGroupStructured Preferred Shares ‐
No Early Redemption Dates ‐ 20

Index Of Preferred Shares A Bank of Nova Scotia 5.5% Ser 34 BNS.PR.E 14 Brookfield Asset Mgmt Inc. 4.9% Cl A Ser 37 BAM.PF.D 7
Aimia Inc. 6.5% Ser 1 AIM.PR.A 12 BCE Inc. 4.15% Ser AK BCE.PR.K 12 Brookfield Asset Mgmt Inc. 5.0% Cl A Ser 44 BAM.PF.H 12Aimia Inc. Ser 2 AIM.PR.B 16 BCE Inc. 4.25% Series AQ BCE.PR.Q 12 Brookfield Asset Mgmt Inc. 5.4% Cl A Ser 24 BAM.PR.R 12Aimia Inc. 6.25% Ser 3 AIM.PR.C 12 BCE Inc. 4.331% Ser Z BCE.PR.Z 12 Brookfield Asset Mgmt Inc. Cl A Ser 13 BAM.PR.K 16Algonquin Power & Utilities Corp. 4.50% Ser A AQN.PR.A 12 BCE Inc. 4.35% Cl A Ser AG BCE.PR.G 12 Brookfield Asset Mgmt Inc. Cl A Ser 2 BAM.PR.B 16Algonquin Power & Utilities Corp. 5% Ser D AQN.PR.D 12 BCE Inc. 4.4% Cl A Ser AF BCE.PR.F 12 Brookfield Asset Mgmt Inc. Cl A Ser 4 BAM.PR.C 16Allbanc Split Corp. 4% Cl C Pref. ABK.PR.C 19 BCE Inc. 4.502% Ser T BCE.PR.T 12 Brookfield Asset Mgmt Inc. Cl A Ser 8 BAM.PR.E 16AllBanc Split Corp. II 4.25% Ser 1 ALB.PR.B 19 BCE Inc. 4.54% Ser R BCE.PR.R 12 Brookfield Infrastructure Partners LP 4.5% Ser 1 BIP.PR.A 12AltaGas Ltd. 4,75% Ser E ALA.PR.G 12 BCE Inc. 4.55% Series AO BCE.PR.O 12 Brookfield Investments Corp. 4.7% Cl 1 Senior Ser A BRN.PR.A 6AltaGas Ltd. 4.40% Ser C ALA.PR.U 18 BCE Inc. 4.65% Cl A Ser AI BCE.PR.I 12 Brookfield Office Properties Inc. 4.60% Cl AAA Ser T BPO.PR.T 12AltaGas Ltd. 5.0% Ser A ALA.PR.A 12 BCE Inc. 4.8% Ser AA BCE.PR.A 12 Brookfield Office Properties Inc. 4.75% Cl AAA, Ser AA BPO.PR.A 12AltaGas Ltd. 5.0% Ser E ALA.PR.E 12 BCE Inc. 4.85% Series AM BCE.PR.M 12 Brookfield Office Properties Inc. 5.0% Cl AAA Ser J BPO.PR.J 6AltaGas Ltd. 5.25% Ser I ALA.PR.I 12 BCE Inc. 5.54% Ser AC BCE.PR.C 12 Brookfield Office Properties Inc. 5.1% Cl AAA Ser R BPO.PR.R 12Atlantic Power Preferred Equity Ltd 4.85% Ser 1 AZP.PR.A 7 BCE Inc. Cl A Ser AE BCE.PR.E 16 Brookfield Office Properties Inc. 5.15% Cl AAA Ser P BPO.PR.P 12Atlantic Power Preferred Equity Ltd 7.0% Ser 2 AZP.PR.B 12 BCE Inc. Cl A Ser AH BCE.PR.H 16 Brookfield Office Properties Inc. 5.2% Cl AAA Ser K BPO.PR.K 6Atlantic Power Preferred Equity Ltd. Ser 3 AZP.PR.C 16 BCE Inc. Ser AB BCE.PR.B 16 Brookfield Office Properties Inc. 5.25% Cl AAA Ser G BPO.PR.U 18
BCE Inc. Ser AD BCE.PR.D 16 Brookfield Office Properties Inc. 5.75% Cl AAA Ser H BPO.PR.H 6 B BCE Inc. Ser S BCE.PR.S 16 Brookfield Office Properties Inc. 6.15% Cl AAA Ser N BPO.PR.N 12
Bank of Montreal 5.25% Cl B Ser 14 BMO.PR.K 8 BCE Inc. Ser Y BCE.PR.Y 16 Brookfield Office Properties Inc. Cl AAA Ser V BPO.PR.X 16Bank of Montreal 5.8% Cl B Ser 15 BMO.PR.L 8 BCE Inc.Cl A Ser AJ BCE.PR.J 16 Brookfield Office Properties Inc. Cl AAA Ser W BPO.PR.W 16Bank of Montreal 5.2% Ser 16 BMO.PR.M 14 Big 8 Split Inc. Ser 1 BIG.PR.D 19 Brookfield Office Properties Inc. Cl AAA Ser Y BPO.PR.Y 16Bank of Montreal 3.9% Cl B Ser 25 BMO.PR.Q 14 Big Bank Big Oil Split Corp. 5.25% Cum BBO.PR.A 20 Brookfield Property Split Cl A, Ser 4 BPS.PR.C 19Bank of Montreal Floating Rate Cl B Pref Ser 17 BMO.PR.R 17 Birchcliff Energy Ltd. 7% Ser C BIR.PR.C 6 Brookfield Property Split Ser 1 BPS.PR.U 18Bank of Montreal 4.0% Cl B Ser 27 BMO.PR.S 14 Birchcliff Energy Ltd. 8% Ser A BIR.PR.A 12 Brookfield Property Split Ser 2 BPS.PR.A 19Bank of Montreal 3.9% Cl B Ser 29 BMO.PR.T 14 Bombardier Inc. 5.476% Ser 3 BBD.PR.D 12 Brookfield Property Split Ser 3 BPS.PR.B 19Bank of Montreal 3.8% Cl B Ser 31 BMO.PR.W 14 Bombardier Inc. 6.25% Ser 4 BBD.PR.C 7 Brookfield Renewable Power Equity Inc. 5.25% Ser 1 BRF.PR.A 13Bank of Montreal 3.8% Ser 33 BMO.PR.Y 14 Bombardier Inc. Ser 2 BBD.PR.B 16 Brookfield Renewable Power Equity Inc. Ser 2 BRF.PR.B 16Bank of Montreal 5.0% Cl B Ser 35 BMO.PR.Z 9 Brompton Lifeco Split Corp. 5.25% Cum. LCS.PR.A 20 Brookfield Renewable Power Equity Inc. 4.4% Cl A Ser 3 BRF.PR.C 12Bank of Nova Scotia Ser 19 BNS.PR.A 17 Brompton Split Banc Corp. 5.25% Cum. SBC.PR.A 20 Brookfield Renewable Power Equity Inc. 5% Cl A Ser 5 BRF.PR.E 7Bank of Nova Scotia Floating Cl A Ser 21 BNS.PR.B 17 Brookfield Asset Mgmt Inc. 4.2% Cl A Ser 34 BAM.PF.B 12 Brookfield Renewable Power Equity Inc. 5% Cl A Ser 6 BRF.PR.F 7Bank of Nova Scotia Floating Cl A Ser 23 BNS.PR.C 17 Brookfield Asset Mgmt Inc. 4.35% Cl A Ser 9 BAM.PR.G 12Bank of Nova Scotia Ser 31 BNS.PR.D 17 Brookfield Asset Mgmt Inc. 4.4% Cl A Ser 38 BAM.PF.E 12 CBank of Nova Scotia 4.5% Ser 14 BNS.PR.L 9 Brookfield Asset Mgmt Inc. 4.5% Cl A Ser 26 BAM.PR.T 12 Canaccord Financial 5.5% Ser A CF.PR.A 13Bank of Nova Scotia 4.5% Ser 15 BNS.PR.M 9 Brookfield Asset Mgmt Inc. 4.5% Cl A Ser 32 BAM.PF.A 12 Canaccord Financial 5.75% Ser C CF.PR.C 13Bank of Nova Scotia 5.25% Ser 16 BNS.PR.N 9 Brookfield Asset Mgmt Inc. 4.5% Cl A Ser 40 BAM.PF.F 12 Canadian Banc Recovery Corp. Floating Rate BK.PR.A 20Bank of Nova Scotia 5.6% Ser 17 BNS.PR.O 9 Brookfield Asset Mgmt Inc. 4.50% Cl A, Ser 42 BAM.PF.G 12 Canadian General Inv, Ltd 3.9% Cl A Ser 3 CGI.PR.C 6Bank of Nova Scotia 5.0% Ser 18 BNS.PR.P 14 Brookfield Asset Mgmt Inc. 4.6% Cl A Ser 28 BAM.PR.X 12 Canadian General Investments, Ltd. 3.75% Cl A Ser 4 CGI.PR.D 6Bank of Nova Scotia 5.0% Ser 20 BNS.PR.Q 14 Brookfield Asset Mgmt Inc. 4.75% Cl A Ser 17 BAM.PR.M 7 Canadian Life Companies Split Corp. 6.25% LFE.PR.B 20Bank of Nova Scotia 5.0% Ser 22 BNS.PR.R 14 Brookfield Asset Mgmt Inc. 4.75% Cl A Ser 18 BAM.PR.N 7 Canadian Utilities 4.0% Cum. Ser Y CU.PR.C 13Bank of Nova Scotia 3.85% Ser 30 BNS.PR.Y 14 Brookfield Asset Mgmt Inc. 4.8% Cum. Ser 30 BAM.PR.Z 12 Canadian Utilities Ltd. 4.5% Ser CC CU.PR.F 7Bank of Nova Scotia 3.7% Ser 32 BNS.PR.Z 14 Brookfield Asset Mgmt Inc. 4.85% Cl A Ser 36 BAM.PF.C 7 Canadian Utilities Ltd. 4.5% Ser DD CU.PR.G 8
February 2016

Canadian Utilities Ltd. 4.9% Ser AA CU.PR.D 7 Enbridge Inc. 4.0% Ser N ENB.PR.N 13 Great-West Lifeco Inc. 4.85% 1st Ser H GWO.PR.H 9Canadian Utilities Ltd. 4.9% Ser BB CU.PR.E 7 Enbridge Inc. 4.0% Ser P ENB.PR.P 13 Great-West Lifeco Inc. 5.15% Ser Q GWO.PR.Q 10Canadian Utilities Ltd. 4.5% Ser FF CU.PR.I 13 Enbridge Inc. 4.0% Ser R ENB.PR.T 13 Great-West Lifeco Inc. 5.2% 1st Ser G GWO.PR.G 9Canadian Western Bank 4.4% Ser 5 CWB.PR.B 14 Enbridge Inc. 4.40% Ser 11 ENB.PF.C 13 Great-West Lifeco Inc. 5.25% 1st Ser S GWO.PR.S 9Capital Power Corp. 4.50% Ser 5 CPX.PR.E 13 Enbridge Inc. 4.40% Ser 13 ENB.PF.E 13 Great-West Lifeco Inc. 5.65% 1st Ser L GWO.PR.L 9Capital Power Corp. 4.6% Ser 1 CPX.PR.A 13 Enbridge Inc. 4.40% Ser 15 ENB.PF.G 13 Great-West Lifeco Inc. 5.8% 1st Ser M GWO.PR.M 9Capital Power Corp. 4.60% Ser 3 CPX.PR.C 13 Enbridge Inc. 4.40% Ser 5 ENB.PF.V 18 Great-West Lifeco Inc. 5.9% 1st Ser F GWO.PR.F 9Capstone Infrastructure Corp. 5.0% Ser A CSE.PR.A 13 Enbridge Inc. 4.40% Ser 7 ENB.PR.J 13 Great-West Lifeco Inc. Floating Ser O GWO.PR.O 17CIBC 3.75% Cl A, Series 41 CM.PR.P 14 Enbridge Inc. 4.40% Ser 9 ENB.PF.A 13CIBC 3.9% Cl A Ser 39 CM.PR.O 14 Enbridge Inc. 5.5% Ser A ENB.PR.A 8 HCIBC 3.6% Cl A Ser 43 CM.PR.Q 14 Equitable Group Inc. 7.25% Ser 1 Pfd EQB.PR.C 15 HSBC Bank Canada 5.0% Cl 1 Ser D HSB.PR.D 10Co-operators General Insurance Co. 5% Cl E Ser C CCS.PR.C 9 HSBC Bank Canada 5.1% Cl 1 Ser C HSB.PR.C 10CU Inc. 3.8% Ser 4 CIU.PR.C 13 F Husky Energy Inc. 4.45% Ser 1 HSE.PR.A 13CU Inc. 4.6% Ser 1 CIU.PR.A 8 Fairfax Financial Holdings Ltd. 5.75% Ser C FFH.PR.C 13 Husky Energy Inc. 4.5% Ser 3 HSE.PR.C 13
Fairfax Financial Holdings Limited Series D FFH.PR.D 16 Husky Energy Inc. 4.5% Ser 5 HSE.PR.E 14 D Fairfax Financial Holdings Ltd. 4.75% Ser E FFH.PR.E 13 Husky Energy Inc. 4.6% Ser 7 HSE.PR.G 14
Dividend 15 Split Corp. 5.25% Cum. DFN.PR.A 20 Fairfax Financial Holdings Ltd. Ser F FFH.PR.F 16Dividend 15 Split Corp. II 5.25% Cum. DF.PR.A 20 Fairfax Financial Holdings Ltd. 5.0% Ser G FFH.PR.G 13 IDividend Growth Split Corp. 5.25% Cum. DGS.PR.A 20 Fairfax Financial Holdings Ltd. 5.0% Ser I FFH.PR.I 13 IGM Financial Inc. 5.9% 1st Ser B IGM.PR.B 10DREAM UnLtd. Corp. 7% , Ser 1 DRM.PR.A 6 Fairfax Financial Holdings Ltd. 5.0% Ser K FFH.PR.K 13 Industrial Alliance 4.6% Cl A Series B IAG.PR.A 10Dundee Corp. 5% , Ser 4 DC.PR.C 6 Fairfax Financial Holdings Ltd. 4.75% Ser M FFH.PR.M 13 Industrial Alliance Insurance & Financial Svcs 4.3% Cl A Ser G IAG.PR.G 15Dundee Corp. 6.75% Ser 2 DC.PR.B 13 Fairfax Financial Holdings Ltd. Floating Ser J FFH.PR.J 16 Innergex Renewable Energy Inc. 5.0% Ser A INE.PR.A 14Dundee Corp. Floating Ser 3 DC.PR.D 16 Financial 15 Split Corp. 5.25% Cum. FTN.PR.A 20 Innergex Renewable Energy Inc. 5.75% Ser C INE.PR.C 8
Financial 15 Split Corp. II 5.25% Cum. FFN.PR.A 20 Intact Financial Corp. 4.2% Ser 1 IFC.PR.A 15 E First National Financial Corp. 4.65% Cum. Ser 1 FN.PR.A 13 Intact Financial Corp. 4.2% Ser 3 IFC.PR.C 15
E-L Financial Corp. 4.75% Ser 2 ELF.PR.G 9 Fortis Inc. 4.9% Ser E FTS.PR.E 6E-L Financial Corp. 5.3% Ser 1 ELF.PR.F 9 Fortis Inc. 4.9% Ser F FTS.PR.F 8 LE-L Financial Corp. 5.5% Ser 3 ELF.PR.H 9 Fortis Inc. 5.25% Ser G FTS.PR.G 13 Laurentian Bank of Canada 4% Cl A Ser 11 LB.PR.F 15Element Financial 6.6% Ser A EFN.PR.A 13 Fortis Inc. 4.25% Ser H FTS.PR.H 13 Laurentian Bank of Canada 4.3% Cl A Ser 13 LB.PR.H 15Element Financial 6.5% Ser C EFN.PR.C 13 Fortis Inc. Ser I FTS.PR.I 16 Life & Banc Split Corp. 5.25% Cum. LBS.PR.A 20Element Financial 6.4% Ser E EFN.PR.E 13 Fortis Inc. 4.75% , Ser J FTS.PR.J 8 Loblaw Companies Ltd. 5.3% 2nd Ser B L.PR.B 8Element Financial 6.5% Ser G EFN.PR.G 13 Fortis Inc. 4.0% Ser K FTS.PR.K 13Emera Inc. 4.4% 1st Ser A EMA.PR.A 13 Fortis Inc. 4.1% Ser M FTS.PR.M 13 MEmera Inc. Ser B EMA.PR.B 16 M Split Corp. 7.5% Cum. Class I XMF.PR.B 20Emera Inc. 4.10% First Pref. Ser C EMA.PR.C 13 G M Split Corp. Class II Pref. XMF.PR.C 20Emera Inc. 4.5% Ser E EMA.PR.E 8 George Weston Ltd 5.8% Ser I WN.PR.A 8 Manulife Financial Corp. 4.65% Cl A Ser 2 MFC.PR.B 10Emera Inc. 4.25% Ser F EMA.PR.F 13 George Weston Ltd. 4.75% Ser V WN.PR.E 8 Manulife Financial Corp. 4.5% Cl A Ser 3 MFC.PR.C 10Enbridge Inc. 4% Ser 1 ENB.PR.V 18 George Weston Ltd. 5.2% Ser III WN.PR.C 8 Manulife Financial Corp. 4.2% Cl 1 Ser 3 MFC.PR.F 15Enbridge Inc. 4.0% Cum. Ser B ENB.PR.B 13 George Weston Ltd. 5.2% Ser IV WN.PR.D 8 Manulife Financial Corp. 4.4% Cl 1 Ser 5 MFC.PR.G 15Enbridge Inc. 4.0% Cum. Ser D ENB.PR.D 13 Global Champions Split Corp. 4% Cl A Ser 1 GCS.PR.A 19 Manulife Financial Corp. 4.6% Non-Cum. Cl 1 MFC.PR.H 15Enbridge Inc. 4.0% Cum. Ser F ENB.PR.F 13 GMP Capital 5.5% Cum. Ser B GMP.PR.B 13 Manulife Financial Corp. 4.40% Cl 1 Ser 9 MFC.PR.I 15Enbridge Inc. 4.0% Cum. Ser H ENB.PR.H 13 Great-West Lifeco 5.4% Non-Cum. 1st Ser P GWO.PR.P 9 Manulife Financial Corp. 4.0% Cl 1 Ser 11 MFC.PR.J 15Enbridge Inc. 4.0% Cum. Ser J (US$) ENB.PR.U 18 Great-West Lifeco Inc. 3.65% 1st Ser N GWO.PR.N 15 Manulife Financial Corp. 3.8% Cl 1 Ser 13 MFC.PR.K 15Enbridge Inc. 4.0% Ser 3 ENB.PR.Y 13 Great-West Lifeco Inc. 4.5% 1st Ser I GWO.PR.I 9 Manulife Financial Corp. 3.9% Cl A Ser 15 MFC.PR.L 15Enbridge Inc. 4.0% Ser L ENB.PF.U 18 Great-West Lifeco Inc. 4.8% Ser R GWO.PR.R 10 Manulife Financial Corp. 3.9% Cl A Ser 17 MFC.PR.M 15
February 2016

Manulife Financial Corp. 3.80% Cl, Ser 19 MFC.PR.N 15 Power Financial Corp. 4.80% Cum Ser S PWF.PR.S 11 TPower Financial Corp 4.20% Ser T PWF.PR.T 15 TD Bank 3.9% Cl A 1st Ser 1 TD.PF.A 15
N Premium Income Corp 5.75% Cum. PIC.PR.A 20 TD Bank 3.8% Cl A 1st Ser 3 TD.PF.B 15National Bank of Canada 3.80% Ser 28 NA.PR.Q 15 Prime Dividend Corp. Cum. Floating Rate Preferred PDV.PR.A 20 TD Bank 3.75% Cl A, Ser 5 TD.PF.C 15National Bank of Canada 4.10% Ser 30 NA.PR.S 15 TD Bank 3.6% Cl A, Ser 7 TD.PF.D 15National Bank of Canada 3.90% Ser 32 NA.PR.W 15 R TD Bank 3.7% Cl A, Ser 9 TD.PF.E 15National Bank of Canada 5.60% Ser 34 NA.PR.X 15 R Split III Corp. Cl B Pref. RBS.PR.B 19 TD Bank 4.9% Cl A, Ser 11 TD.PF.F 11New Commerce Split Corp. 7.50% Cum. Class I Pfd YCM.PR.A 20 Rona 5.25% Cum. Cl A Ser 6 RON.PR.A 14 TD Bank 5.6% Cl A, Ser 12 TD.PF.G 15New Commerce Split Corp. Class II Preferred Shares YCM.PR.B 20 Royal Bank of Canada 4.45% Ser AA RY.PR.A 11 TD Bank 5.0% Cl A 1st Ser S TD.PR.S 15Newgrowth Corp. 5.25% Cum. Cl B Ser 3 NEW.PR.D 19 Royal Bank of Canada 4.7% Ser AB RY.PR.B 11 TD Bank Floating Rate Cl A 1st Pref Ser T TD.PR.T 17Northland Power Inc. 5% Ser 3 NPI.PR.C 14 Royal Bank of Canada 4.6% Ser AC RY.PR.C 11 TD Bank 5.1% Cl A 1st Ser Y TD.PR.Y 15Northland Power Preferred Equity Inc. 5.25% Ser 1 NPI.PR.A 14 Royal Bank of Canada 4.5% Ser AD RY.PR.D 11 TD Bank Floating Rate Cl A 1st Pref Ser Z TD.PR.Z 17
Royal Bank of Canada 4.5% Ser AE RY.PR.E 11 TDb Split Corp. 5.25% Preferred Equity Share Cum. XTD.PR.A 20 P Royal Bank of Canada 4.45% Ser AF RY.PR.F 11 Thomson Reuters Corp Ser II TRI.PR.B 16
Partners Value Split Ser 1 PVS.PR.A 19 Royal Bank of Canada 4.5% Ser AG RY.PR.G 11 TransAlta Corp. 4.6% 1st Ser A TA.PR.D 14Partners Value Split Ser 3 PVS.PR.B 19 Royal Bank of Canada 3.9% Ser BB RY.PR.H 15 TransAlta Corp. 4.6% 1st Ser C TA.PR.F 14Partners Value Split Ser 5 PVS.PR.C 19 Royal Bank of Canada 5% Ser AJ RY.PR.I 15 TransAlta Corp. 5% Ser E TA.PR.H 14Partners Value Split Ser 6 PVS.PR.D 19 Royal Bank of Canada 3.6% Ser BD RY.PR.J 15 TransAlta Corp. 5,3% Ser G TA.PR.J 14Pembina Pipeline Corporation 4.25% Cl A, Ser 1 PPL.PR.A 14 Royal Bank of Canada Floating Rate Ser AK RY.PR.K 17 TransCanada Corp. 4.6% 1st Ser 1 TRP.PR.A 14Pembina Pipeline Corporation 4.70% Cl A, Ser 3 PPL.PR.C 14 Royal Bank of Canada 5.6% Ser AL RY.PR.L 15 TransCanada Corp. 4.0% 1st Ser 3 TRP.PR.B 14Pembina Pipeline Corporation 5% Cl A, Ser 5 PPL.PR.E 14 Royal Bank of Canada 3.6% Ser BF RY.PR.M 15 TransCanada Corp. 4.4% 1st Ser 5 TRP.PR.C 14Pembina Pipeline Corporation 4.5% Cl A, Ser 7 PPL.PR.G 14 Royal Bank of Canada 4.9% Ser BH RY.PR.N 11 TransCanada Corp. 4% Ser 7 TRP.PR.D 14Pembina Pipeline Corporation 4.75% Cl A, Ser 9 PPL.PR.I 14 Royal Bank of Canada 4.9% Ser BI RY.PR.O 11 TransCanada Corp. 4.25% 1st Ser 9 TRP.PR.E 14Pembina Pipeline Corporation 5.75% Cl A, Ser 11 PPL.PR.K 14 Royal Bank of Canada 5.5% Ser BK RY.PR.Q 15 TransCanada Corp. Ser 2 TRP.PR.F 16Power Corp of Canada 1st 1986 Ser POW.PR.F 16 Royal Bank of Canada 4.9% Ser W RY.PR.W 11 TransCanada Corp. 3.8% 1st Ser 11 TRP.PR.G 14Power Corp of Canada 5.0% 1st Ser D POW.PR.D 10 Royal Bank of Canada 4% Ser AZ RY.PR.Z 15 TransCanada Corp. Ser 4 TRP.PR.H 16Power Corp of Canada 5.35% 1st Ser B POW.PR.B 10Power Corp of Canada 5.6% 1st Ser A POW.PR.A 10 S UPower Corp of Canada 5.8% 1st Ser C POW.PR.C 10 S Split Corp. 5.25% Cum. SBN.PR.A 20 U.S. Financial 15 Split Corp. 5.25% FTU.PR.B 20Power Corp. 5.6% Non-Cum. Ser G POW.PR.G 10 Shaw Communications 4.50% Cum. Ser A SJR.PR.A 14Power Financial Corp 1st Ser A PWF.PR.A 16 Sun Life Financial Inc. 4.75% Cl A Ser 1 SLF.PR.A 11 VPower Financial Corp 5.5% 1st Ser D PWF.PR.E 10 Sun Life Financial Inc. 4.8% Cl A Ser 2 SLF.PR.B 11 Valener Inc. 4.35% Ser A VNR.PR.A 14Power Financial Corp 5.25% 1st Ser E PWF.PR.F 10 Sun Life Financial Inc. 4.45% Cl A Ser 3 SLF.PR.C 11 Veresen Inc. 4.4% Cum Ser A VSN.PR.A 14Power Financial Corp 5.9% 1st Ser F PWF.PR.G 10 Sun Life Financial Inc. 4.45% Cl A Ser 4 SLF.PR.D 11 Veresen Inc. 5.0% Cum Ser C VSN.PR.C 14Power Financial Corp 5.75% 1st Ser H PWF.PR.H 10 Sun Life Financial Inc. 4.5% Cl A Ser 5 SLF.PR.E 11 Veresen Inc. 5.0% Cum Ser E VSN.PR.E 14Power Financial Corp 6.0% 1st Ser I PWF.PR.I 10 Sun Life Financial Inc. 4.35% Cl A Ser 8R SLF.PR.G 15Power Financial Corp 4.95% 1st Ser K PWF.PR.K 10 Sun Life Financial Inc. 3.9% Non-Cum. Ser 10R SLF.PR.H 15 WPower Financial Corp 5.1% 1st Ser L PWF.PR.L 10 Sun Life Financial Inc. 4.25% Cl A Ser 12R SLF.PR.I 15 Westcoast Energy Inc. 5.5% 1st Ser 7 W.PR.H 8Power Financial Corp 5.8% 1st Ser O PWF.PR.O 11 Sun Life Financial Inc. Ser 9QR SLF.PR.J 17 Westcoast Energy Inc. 5.6% 1st Ser 8 W.PR.J 8Power Financial Corp 4.4% 1st Series P PWF.PR.P 15 Westcoast Energy Inc. 5.6% 1st Ser 9 W.PR.K 14Power Financial Corp. 5.5% Non-Cum. 1st Ser R PWF.PR.R 10 World Financial Split Corp. 5.25% Cum. WFS.PR.A 20
February 2016

Investment Strategy Group | Canadian Preferred Shares Report
Disclosures And Disclaimers Companies Mentioned In This Report That Are Covered By CIBC World Markets Stock Prices as of 02/08/2016: Toronto-Dominion Bank (2a, 2b, 2c, 2e, 2g, 3a, 3c, 7) (TD-TSX, C$52.40, Sector Outperformer)
Key To Important Disclosure Footnotes: 1 CIBC World Markets Corp. makes a market in the securities of this company. 2a This company is a client for which a CIBC World Markets company has performed investment banking services in the past 12 months. 2b CIBC World Markets Corp. has managed or co-managed a public offering of securities for this company in the past 12 months. 2c CIBC World Markets Inc. has managed or co-managed a public offering of securities for this company in the past 12 months. 2d CIBC World Markets Corp. has received compensation for investment banking services from this company in the past 12 months. 2e CIBC World Markets Inc. has received compensation for investment banking services from this company in the past 12 months. 2f CIBC World Markets Corp. expects to receive or intends to seek compensation for investment banking services from this company in the next 3 months. 2g CIBC World Markets Inc. expects to receive or intends to seek compensation for investment banking services from this company in the next 3 months. 3a This company is a client for which a CIBC World Markets company has performed non-investment banking, securities-related services in the past 12 months. 3b CIBC World Markets Corp. has received compensation for non-investment banking, securities-related services from this company in the past 12 months. 3c CIBC World Markets Inc. has received compensation for non-investment banking, securities-related services from this company in the past 12 months. 4a This company is a client for which a CIBC World Markets company has performed non-investment banking, non-securities-related services in the past 12 months. 4b CIBC World Markets Corp. has received compensation for non-investment banking, non-securities-related services from this company in the past 12 months. 4c CIBC World Markets Inc. has received compensation for non-investment banking, non-securities-related services from this company in the past 12 months. 5a The CIBC World Markets Corp. analyst(s) who covers this company also has a long position in its common equity securities. 5b A member of the household of a CIBC World Markets Corp. research analyst who covers this company has a long position in the common equity securities of this company. 6a The CIBC World Markets Inc. fundamental analyst(s) who covers this company also has a long position in its common equity securities. 6b A member of the household of a CIBC World Markets Inc. fundamental research analyst who covers this company has a long position in the common equity securities of this company. 6c One or more members of Investment Strategy Group who was involved in the preparation of this report, and/or a member of their household(s), has a long position in the common equity securities of this company. 7 CIBC World Markets Corp., CIBC World Markets Inc., and their affiliates, in the aggregate, beneficially own 1% or more of a class of equity securities issued by this company. 8 A partner, director or officer of CIBC World Markets Inc. or any analyst involved in the preparation of this research report has provided services to this company for remuneration in the past 12 months. 9 A senior executive member or director of Canadian Imperial Bank of Commerce ("CIBC"), the parent company to CIBC World Markets Inc. and CIBC World Markets Corp., or a member of his/her household
is an officer, director or advisory board member of this company or one of its subsidiaries. 10 Canadian Imperial Bank of Commerce ("CIBC"), the parent company to CIBC World Markets Inc. and CIBC World Markets Corp., has a significant credit relationship with this company. 11 The equity securities of this company are restricted voting shares. 12 The equity securities of this company are subordinate voting shares. 13 The equity securities of this company are non-voting shares. 14 The equity securities of this company are limited voting shares.

Investment Strategy Group | Canadian Preferred Shares Report
This report is issued and approved for distribution to clients in Canada by registered representatives of CIBC Wood Gundy, a division of CIBC World Markets Inc., Member of the Canadian Investor Protection Fund and Member of the Investment Industry Regulatory Organization of Canada, and by its affiliates via their registered representatives. This report is not authorized for distribution in the United States. This document and any of the products and information contained herein are not intended for the use of private investors in the United Kingdom.
This report is provided for informational purposes only and does not constitute an offer or solicitation to buy or sell any securities discussed herein in any jurisdiction where such offer or solicitation would be prohibited.
The securities mentioned in this report may not be suitable for all types of investors. This report does not take into account the investment objectives, financial situation or specific needs of any particular client of CIBC Wood Gundy. Recipients should consider this report as only a single factor in making an investment decision and should not rely solely on investment recommendations contained herein, if any, as a substitution for the exercise of independent judgment of the merits and risks of investments. CIBC Wood Gundy suggests that, prior to making an investment decision with respect to any security recommended in this report, the recipient should contact one of our client advisers in the recipient’s jurisdiction to discuss the recipient’s particular circumstances. Non-client recipients of this report should consult with an independent financial advisor prior to making any investment decision based on this report or for any necessary explanation of its contents. CIBC Wood Gundy will not treat non-client recipients as its clients by virtue of their receiving this report. Past performance is not a guarantee of future results, and no representation or warranty, express or implied, is made regarding future performance of any security mentioned in this report.
Information, opinions and statistical data contained in this report were obtained or derived from sources believed to be reliable, but CIBC Wood Gundy does not represent that any such information, opinion or statistical data is accurate or complete (with the exception of information contained in the Important Disclosures section of this report provided by CIBC World Markets or individual research analysts), and they should not be relied upon as such. All estimates, opinions and recommendations expressed herein constitute judgments as of the date of this report and are subject to change without notice.
Nothing in this report constitutes legal, accounting or tax advice. Since the levels and bases of taxation can change, any reference in this report to the impact of taxation should not be construed as offering tax advice on the tax consequences of investments. As with any investment having potential tax implications, clients should consult with their own independent tax adviser.
© 2016 CIBC World Markets Inc. All rights reserved. Unauthorized use, distribution, duplication or disclosure without the prior written permission of CIBC World Markets is prohibited by law and may result in prosecution.