canadian regional housing outlook - august 2015
DESCRIPTION
TD Economics' Regional Housing Report dated August 31, 2015TRANSCRIPT

REGIONAL HOUSING REPORT
TD Economics
CANADIAN REGIONAL HOUSING OUTLOOK: THE POWER OF LOW INTEREST RATES
August 31, 2015
Diana Petramala, Economist, 416-982-6420
Highlights
• Withhousingmarketsfromcoast-to-coastcontinuingtobeatexpectations,TDEconomicshasup-gradedits2015/2016forecastsformajorurbanmarkets.
• AdropinCanadianborrowingratesthroughthefirsthalfofthisyearwill likelycontinuetoboosthousingdemandthroughthesummerandearlyfallmonths.However,oncetheimpactofpastratereductionwanesbythelatestagesof2015,itishardtopointtoacatalystforafurtheraccelerationinhousingmarketactivity.
• Withhouseholdsrushingtotakeadvantageofrecordlowinterestratesandwithaffordabilitylikelytocontinueeroding,weexpectsalesinthisyear’sfastestgrowingmarketstofallbackinlinewiththeirlonger-termaveragenextyear,andforpricegrowthtotaperoff.
• HousingactivityinthePrairieregionwillcontinuetobeconstrainedbylowoilprices,tougherlabourmarketconditionsandarisinginventoryofhomesforsaleonthemarket.
• WeakerdemographicsarelikelytocontinuetoweighonmarketseastofToronto.However,fromacyclicalperspective,Montreal,QuébecCityandHalifaxwillbebrightspotsin2015and2016.
The Canadian housing market continues to surpass expectations. In a recent TD Economics report, “Rate Cut Not a Game Changer for Canada’s Housing Market”, we highlighted forecast upgrades to Canadian existing home sales and average existing home prices relative to our last housing market update released in February. However, housing tends to be a regional story. In this follow up piece, we turn our attention to conditions in Canada’s 15 largest hous-ing markets. While we have upwardly adjusted the housing market forecast for most urban markets across the country, there still exists a significant regional divide in performances.
The unanticipated strength in housing activity from coast to coast has occurred despite a disappointing economic show-ing during the first half of the year. While the hit to the oil sector has been deeper and more pronounced than we had expected, other areas of the economy – in particular non-resource exports – also fell short. Nonetheless, an offshoot of the economic weakness both in Canada and abroad has been a lower trajectory of interest rates, with 5-year fixed mortgage rates dropping by a full 55 basis points between January and April. In July, the Bank of Canada reduced its overnight rate by a quarter of a percentage point for the second time this year, to 0.50%. The low rate environment has helped to keep
-12.0-10.0-8.0-6.0-4.0-2.00.02.04.06.08.0
Halifax
SaintJohn
QuébecC
ity
Montréal
Ottaw
a
Toronto
Ham
ilton
Winnipeg
Regina
Saskatoon
Calgary
Edm
onton
Vancouver
Victoria
asofAugust2015
asofFeb2015
Source:CanadianRealEstateAssociation.Forecast byTDEconomicsasofAugust2015.
CHART 1: TD ECONOMICS' PROJECTION FOR AVERAGE EXISTING HOME PRICES
AverageY/Y%Changein2015/2016
@TD_Economics
TD Economics | www.td.com/economics
2August 31, 2015
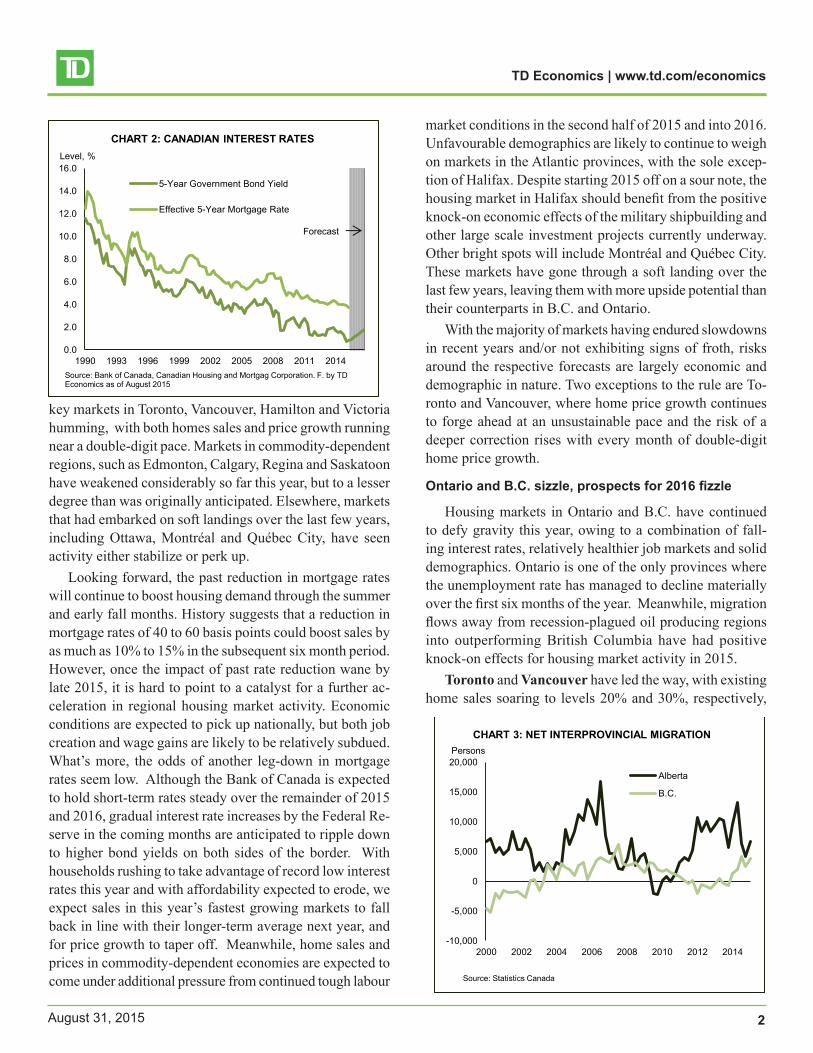
market conditions in the second half of 2015 and into 2016. Unfavourable demographics are likely to continue to weigh on markets in the Atlantic provinces, with the sole excep-tion of Halifax. Despite starting 2015 off on a sour note, the housing market in Halifax should benefit from the positive knock-on economic effects of the military shipbuilding and other large scale investment projects currently underway. Other bright spots will include Montréal and Québec City. These markets have gone through a soft landing over the last few years, leaving them with more upside potential than their counterparts in B.C. and Ontario.
With the majority of markets having endured slowdowns in recent years and/or not exhibiting signs of froth, risks around the respective forecasts are largely economic and demographic in nature. Two exceptions to the rule are To-ronto and Vancouver, where home price growth continues to forge ahead at an unsustainable pace and the risk of a deeper correction rises with every month of double-digit home price growth.
Ontario and B.C. sizzle, prospects for 2016 fizzle
Housing markets in Ontario and B.C. have continued to defy gravity this year, owing to a combination of fall-ing interest rates, relatively healthier job markets and solid demographics. Ontario is one of the only provinces where the unemployment rate has managed to decline materially over the first six months of the year. Meanwhile, migration flows away from recession-plagued oil producing regions into outperforming British Columbia have had positive knock-on effects for housing market activity in 2015.
Toronto and Vancouver have led the way, with existing home sales soaring to levels 20% and 30%, respectively,
key markets in Toronto, Vancouver, Hamilton and Victoria humming, with both homes sales and price growth running near a double-digit pace. Markets in commodity-dependent regions, such as Edmonton, Calgary, Regina and Saskatoon have weakened considerably so far this year, but to a lesser degree than was originally anticipated. Elsewhere, markets that had embarked on soft landings over the last few years, including Ottawa, Montréal and Québec City, have seen activity either stabilize or perk up.
Looking forward, the past reduction in mortgage rates will continue to boost housing demand through the summer and early fall months. History suggests that a reduction in mortgage rates of 40 to 60 basis points could boost sales by as much as 10% to 15% in the subsequent six month period. However, once the impact of past rate reduction wane by late 2015, it is hard to point to a catalyst for a further ac-celeration in regional housing market activity. Economic conditions are expected to pick up nationally, but both job creation and wage gains are likely to be relatively subdued. What’s more, the odds of another leg-down in mortgage rates seem low. Although the Bank of Canada is expected to hold short-term rates steady over the remainder of 2015 and 2016, gradual interest rate increases by the Federal Re-serve in the coming months are anticipated to ripple down to higher bond yields on both sides of the border. With households rushing to take advantage of record low interest rates this year and with affordability expected to erode, we expect sales in this year’s fastest growing markets to fall back in line with their longer-term average next year, and for price growth to taper off. Meanwhile, home sales and prices in commodity-dependent economies are expected to come under additional pressure from continued tough labour
0.0
2.0
4.0
6.0
8.0
10.0
12.0
14.0
16.0
1990 1993 1996 1999 2002 2005 2008 2011 2014
5-YearGovernmentBondYield
Effective5-YearMortgageRate
Source:BankofCanada,CanadianHousing andMortgagCorporation.F.byTDEconomicsasofAugust2015
CHART 2: CANADIAN INTEREST RATES
Forecast
Level, %
-10,000
-5,000
0
5,000
10,000
15,000
20,000
2000 2002 2004 2006 2008 2010 2012 2014
Alberta
B.C.
Source:StatisticsCanada
CHART 3: NET INTERPROVINCIAL MIGRATION Persons

TD Economics | www.td.com/economics
3August 31, 2015
above their 10-year averages in July. Existing home price growth topped 11% Y/Y in both markets in the same month. There had been a surge in new condo completions in Toronto at the start of this year, leading to a sharp jump in the unsold inventory of units on the market. However, strength in exist-ing home sales has helped to absorb some of these excesses and kept condo prices growing at a healthy clip of 4% Y/Y. The Vancouver condo market has tightened over the last three months, following a marked slowdown in condo construction since 2012. And, condo prices in Vancouver are growing at a slightly faster 6% Y/Y pace. Conditions in the single-family-detached home market are particularly tight, with prices reaching 16% Y/Y in Vancouver and 13% Y/Y in Toronto in July.
While much of the focus has remained on Toronto and Vancouver, markets in Hamilton and Victoria have also witnessed surging activity, seemingly benefitting from their proximity to Toronto and Vancouver, better pricing and/or housing choice. Met with a relatively stable number of homes for sale on the market, the recent surge in demand has pushed a number of major housing markets across Ontario and British Columbia into seller’s territory, as evidenced by a sales-to-listings ratio of over 60.
The current pace of housing activity across Ontario and B.C. is unlikely to be sustained through the rest of 2015 and 2016. Broadly, home prices are currently growing at more than twice the pace of income gains, and housing affordabil-ity is eroding, particularly in Toronto and Vancouver. Given lofty prices, Toronto and Vancouver are likely the most vul-nerable should a rise in bond yields in 2016 and beyond get passed along to mortgage rates. However, with the economic backdrop remaining comparatively favourable in Ontario and B.C., a severe correction in housing activity will likely be avoided. Following an estimated expansion of roughly 8-10% in 2015, average home price growth in Ontario and B.C. is poised to slow to just 3-5% next year. At this rate, the degree of price over-valuation – which we estimate at around 10-15% – is likely to remain, leaving these markets vulnerable to the adverse impact of an unanticipated shock to either interest rates or the unemployment rate. Please see a TD Economics recent report on risks facing the Toronto and Vancouver housing markets for further information.
New home construction is likely to pick up in the near-term from what has been a multi-year slowdown in both Toronto and Vancouver. New home construction is a lag-ging indicator. As such, over the second half of this year, we expect starts to take their cue from a spike in new home
0
2
4
6
8
10
12
14
16
18
2005 2007 2009 2011 2013 2015
RestofOntarioandB.C.
TorontoandVancouver
Source:CanadianRealEstateAssociation
CHART 4: EXISTING HOME SALES
Forecast
000's ofUnits
0
200
400
600
800
1000
1200
1400
1600
1800
2000Q2 2006Q2 2012Q2
Regina
Saskatoon
CHART 5: ACTIVE LISTINGS OF CONDOS
Source:CanadianReal EstateAssociation
4-Quarter MovingAverage
0
10
20
30
40
50
60
70
1990 1993 1996 1999 2002 2005 2008 2011 2014
Canada
Toronto
Vancouver
CanadianLong-RunHistoricalAverage(1990-2014)
Source:CREA,StatisticsCanada.*Assumingaveragehomeprice,25%downpayment,25yearamortization.
CHART 6: INDEX OF HOUSING AFFORDABILITY EstimatedMortgagePaymentsonanAveragedPriceHouseasa%ofAverageHouseholdIncome*

TD Economics | www.td.com/economics
4August 31, 2015
flects in part the mitigating effects of lower interest rates this year. Indeed, after plunging in the late fall and early winter months, resale activity started to recover across these four key western markets. As importantly, downward pressure on listings has eased, helping to restore balance to the markets. Having said that, housing activity is still depressed relative to last year’s highs. Of these four markets, Calgary and Edmonton have seen the biggest hit to demand, with sales down 27% and 14%, respectively, relative to peak levels reached in October/November of last year. In Calgary, single-family detached home prices managed to rise in July, albeit by only 0.5% Y/Y, while condo prices were down 1.6% relative to last year levels. In contrast, average home price growth has remained remarkably stable in Edmonton, maintaining a 3% Y/Y pace. Average existing home prices have faced more pronounced pressure in Regina, falling 5% relative to year-ago levels in July. The drop in prices in Regina reflects higher supply more so than lower demand, as many years of robust building activity has led to an upward trend in the number of homes for sale on the market.
Notwithstanding the recent modest recovery in sales, we believe that the housing market correction in Calgary, Ed-monton, Saskatoon and Regina has not yet run full course. In contrast to housing, the economic contraction observed this year, particularly in Alberta, has been deeper than we had expected and the drop in oil prices more sustained. Unem-ployment rates, which have already increased significantly in recent months, are likely to continue to head higher. Ac-cordingly, home sales and prices in these housing markets are likely to remain under downward pressure. Regina and Saskatoon are likely to record particular weakness in both construction and existing home prices due to an elevated
sales to record levels during the spring and summer months. However, a pick-up in new home construction in Toronto will only add to a large pipeline of supply already underway, setting the stage for a weaker level of starts in 2016.
The Ottawa market has been bucking the trend of strength witnessed in Ontario as a whole this year. On the plus side, following 3 years of declining home sales and weaker prices in the city, the low interest rate environment has helped to stabilize market conditions and push price growth up to 2.0% Y/Y in 2015. The market had fallen vic-tim to a number of years of overbuilding, the implications of which are still being felt. The number of listings in the Ottawa market is at a 15 year high and the market is still trending close to buyer’s territory. Ottawa has always been a market heavily dependent on government employment. In a fiscally constrained world, job prospects in Ottawa are likely to remain soft in the coming months, keeping housing activity in check.
Housing in the Prairies facing tough economic times
Housing markets in commodity-dependent markets in the Prairie regions were hit hard at the start of the year. As oil prices sank, sentiment faltered. Existing home sales plunged in Calgary, Edmonton, Saskatoon and Regina. At the same time, listings spiked as investors became worried about future economic prospects. In early 2015, it seemed like these major markets were headed for a sharp housing market correction, not unlike what was experienced during the 2008/2009 economic recession.
Despite the continued low oil price environment, the market has shown more resilience than we had anticipated during the first half of 2015. This development likely re-
0
1000
2000
3000
4000
5000
6000
7000
2001Q1 2007Q1 2013Q1
CHART 7: ACTIVE LISTINGS IN OTTAWA
Source:CanadianReal EstateAssociation
4-QuarterMovingAverage
-6.0 -4.0 -2.0 0.0 2.0 4.0
Winnipeg
Regina
Saskatoon
Calgary
Edmonton
Source:Canadian RealEstateAssociation
CHART 8: PRAIRIE REGION AVERAGE EXISTING HOME PRICES
Year-to-Date%Chg. asofJuly2015

TD Economics | www.td.com/economics
5August 31, 2015
inventory of homes for sale, following what has been a long period of overbuilding. The markets in Calgary and Edmonton remain tight, but market pressures are starting to ease, as evidenced by a decline in the active sales-to-listings ratio. In addition, the number of days it takes to sell a house has risen from 33 last July to 40 this year. Meanwhile, the number of new homes under construction is at record levels with many of these units beginning to reach completion at a time when demand is weak, which will only add to further downward pressure on home prices. The inventory accu-mulation is expected to be more pronounced in Edmonton, where there are more units under construction per person than in Toronto and Vancouver. All told, weak housing mar-ket conditions in most urban markets in the Prairie region will extend into 2016.
The Winnipeg housing market started 2015 off on shaky ground, with sales down almost 6% year-over-year in July and home prices flat over the first 6-months of the year, extending what was a marked slowdown in housing activity in 2014. However, Winnipeg is one market in the Prairie region that is likely to be relatively immune to the economic consequences of falling oil prices. The economy is a more diversified than its counterparts in Saskatchewan and Alberta. And, the employment market has made quite the comeback through the first half of this year, adding roughly 10,000 new jobs since December of the last year. As such, home sales will likely pick up this year and into 2016. However, there was a jump in the number of newly completed units in 2013 and 2014, and builders are holding onto a record number of newly completed but unabsorbed units. The level of inventory is lofty when compared to the overall size of the market. As such, the Winnipeg market has been pushed into balanced territory, following a 15 year streak of being in seller’s territory. The turnaround in home sales this year will help mop up some of the excess that exist, but prices and construction activity are likely to remain under pressure in 2015 and 2016.
Montréal and Québec City bright spots in 2016
The Quebec provincial economy is expected to receive a notable boost from a revival in its export sector, along with improving U.S. demand and a lower Canadian dollar. The combination of low interest rates and better economic pros-pects have helped kick-start a recovery in housing market activity in Montréal and Québec City, following what has been a three year soft landing. Existing home sales are up 6% year-to-date in both Montréal and Québec City. That said,
0.0
0.5
1.0
1.5
2.0
2.5
2010Q1 2011Q1 2012Q1 2013Q1 2014Q1 2015Q1
CalgaryEdmontonReginaSaskatoon
Source:CanadianRealEstateAssociation
CHART 9: WESTERN PROVINCES HOMES SALES-TO-ACTIVE LISTINGS
=loosermarketconditions
2-QuarterMovingAverage
0.0
2.0
4.0
6.0
8.0
10.0
12.0
14.0
16.0
18.0
20.0
Mar-2001 Mar-2004 Mar-2007 Mar-2010 Mar-2013
Toronto Vancouver
Calgary Edmonton
Source:StatisticsCanada, CanadianHousingandMortgageCorporation
CHART 10: NEW UNITS UNDER CONSTRUCTION
Per1,000ofPeople
0.0
1.0
2.0
3.0
4.0
5.0
6.0
7.0
8.0
9.0
2010 2011 2012 2013 2014 2015
Winnipeg
Calgary
Edmonton
Source:StatisticsCanada
CHART 11: SELECT WESTERN CANADA UNEMPLOYMENT RATES
%

TD Economics | www.td.com/economics
6August 31, 2015
challenge across the region, with population growth stalled across most provinces in the Atlantic area.
Halifax, however, has been slow out of the gate, with existing home sales down 7% on a year-to-date basis. De-spite the slow start, its housing market is set to outperform all other urban markets in the Atlantic region over the rest of 2015 and into 2016, supported by a relatively strong eco-nomic outperformance. The unemployment rate in Halifax has trended lower, the city has the fastest growing popula-tion among most Atlantic cities, and the start of the military shipbuilding project is expected to boost economic fortunes through 2015 and 2016. Existing home sales are expected to rebound in the second half of 2015, and grow solidly next year. Home price growth is expected to clock in at near 2% this year and next, after stagnating in 2014. Construction activity in Halifax has already picked up steam, mostly in the market for purpose built rentals. An aging population in the city has left a need for rental properties which should continue to support construction activity.
Given a high dependency on the commodity sector, the drop in oil prices is taking a heavy toll on the economy and housing markets in Newfoundland and Labrador. Exist-ing home sales are projected to decline this year, bringing the string of consecutive annual drops to three, while prices are on track to fall 4%. However, prospects for a modest recovery in oil prices next year will help stabilize the housing market. New home construction has likely already bottomed, with housing starts falling almost 70% since September 2012, hitting their lowest level in over 10 years in July of this year, suggesting there is less scope for further weakness through the rest of the year and into next.
following two years of weak housing demand, the two mar-kets remain in buyer’s territory, which is reflected in muted price growth so far this year. With momentum in housing demand expected to carry forward into the second half of this year, some of the excesses will likely be absorbed, help-ing to bring the markets back to balance. Having already gone through a soft landing, these urban markets remain relatively less frothy than in the past and when compared to Toronto and Vancouver. However, beyond a likely cyclical improvement in activity, higher long term interest rates and relatively weak demographics will continue to work against household formation from a medium-term perspective. Net migration (including immigration and interprovincial migra-tion) into Quebec is at a 15-year low and the population in both markets has been increasing at less than 1.0% Y/Y since 2012. So while more balanced market conditions will help to hold home price growth in the range of 1.5% to 2.0%, construction activity is likely to remain relatively low over the remainder of the forecast period.
Most Atlantic markets face demographic challenges
The low interest rate environment has helped spark a modest recovery in resale activity in many urban markets in the Atlantic provinces, following two consecutive years of declines in home sales. Year-to-date, sales were up 2.6% in Newfoundland, 7.0% in New Brunswick (led by a 9.6% gain in Saint John) and 11% in PEI. However, the past weakness in demand pushed most Atlantic markets into buyer’s ter-ritory as measured by the sales-to-new listings ratio, which is likely to keep a lid on home price growth through the rest of 2015 and 2016. In additions, beyond a cyclical rebound in 2015, an aging population is likely to remain a long-term
-0.5 0.0 0.5 1.0 1.5
Newfoundland
PrinceEdwardIsland
NovaScotia
NewBrunswick
Quebec
RestofCanada
Source:StatisticsCanada
CHART 12: POPULATION GROWTH
Year-to-date%ChangeinJuly2015
-10.0 -5.0 0.0 5.0 10.0 15.0
NFLD
PEI
NS
Halifax
NB
SaintJohn
Montreal
QuebecCity
Source:CanadianRealEstateAssociation
CHART 13: AVERAGE EXISTING HOME SALES
Year-to-Date %ChangeasofJuly2015

TD Economics | www.td.com/economics
7August 31, 2015
Diana Petramala, Economist 416-982-6420
Summing it all Up
When we sum it all up, the overall Canadian housing market appears set for another record breaking year in 2015, supported by low interest rates. The majority of the strength this year has occurred in major markets situated in Ontario and British Columbia. However, as the year pro-gresses, we expect a pick-up across most markets outside of commodity-dependent economies. But, the pace of growth will be restrained as the positive influence on demand from low interest rates fizzles late this year. Nationally, average existing home prices will likely grow by over 7% this year, before cooling to just 1.0% next year. Housing Starts are likely to average roughly 190,000 this year before easing back to a more sustainable pace of 165,000 to 170,000 next year.
-1.0
-0.5
0.0
0.5
1.0
1.5
2.0
2.5
3.0
3.5
4.0
2013 2014 2015F 2016F 2013 2014 2015F 2016F
Source:Quebec FederationofHousing.F.byTDEconomicsasofAugust2015
CHART 14: QUEBEC AVERAGE EXISTING HOME PRICES
QuébecCity Montréal
Year-over-Year%Change

TD Economics | www.td.com/economics
8August 31, 2015
SUMMARY TABLES
2012 2013 2014 2015F 2016F 2012 2013F 2014 2015F 2016F
CANADA 454.3 457.6 481.2 502.6 486.7 CANADA -1.1 0.7 5.1 4.5 -3.2
N. & L. 4.7 4.3 4.1 4.1 4.0 N. & L. 3.8 -7.5 -4.7 -0.6 -2.4St.John's* -- -- -- -- -- St.John's* -- -- -- -- --
P.E.I. 1.6 1.4 1.4 1.6 1.7 P.E.I. 6.1 -11.7 -3.2 14.8 4.9
N.S. 10.4 9.2 8.8 8.0 8.3 N.S. 1.3 -12.4 -3.6 -9.7 4.0Halifax 6.2 5.2 4.9 4.4 4.6 Halifax 2.0 -16.9 -6.5 -10.0 6.2
N.B. 6.4 6.3 6.3 6.6 6.7 N.B. -3.0 -1.9 -0.1 4.8 2.6SaintJohn 1.6 1.6 1.6 1.6 1.6 SaintJohn 2.2 -1.3 0.2 3.2 0.3
Québec 77.4 71.2 70.7 74.1 75.9 Québec 0.3 -8.0 -0.7 4.8 2.5QuébecCity 7.2 6.3 6.5 6.8 7.0 QuébecCity -0.3 -13.1 3.2 4.5 3.9Montréal 40.1 36.5 35.8 37.9 39.2 Montréal -0.7 -9.0 -2.0 6.1 3.2
Ontario 196.8 197.4 204.7 225.3 220.2 Ontario -2.0 0.3 3.7 10.0 -2.2Ottawa 14.5 14.1 14.1 14.7 15.0 Ottawa -0.4 -3.1 0.3 4.2 2.2Toronto 88.2 88.9 93.3 104.2 100.0 Toronto -3.9 0.9 4.9 11.8 -4.1Hamilton 13.0 13.5 14.3 15.7 14.3 Hamilton -6.4 3.3 6.3 9.7 -9.0
Manitoba 13.9 13.7 13.8 14.1 14.2 Manitoba 0.2 -1.2 0.3 2.1 0.8Winnipeg 12.1 12.1 12.1 12.4 12.4 Winnipeg -1.7 0.0 0.5 1.8 0.7
Sask. 13.9 13.5 13.9 12.2 12.3 Sask. 5.7 -2.4 2.5 -12.4 0.9Regina 4.0 3.7 3.7 3.4 3.4 Regina 1.4 -6.6 1.0 -9.1 1.3Saskatoon 5.4 5.5 6.0 5.2 5.3 Saskatoon 4.1 2.7 8.2 -13.6 2.6
Alberta 60.4 66.1 71.8 56.0 52.5 Alberta 12.3 9.5 8.6 -22.0 -6.2Calgary 26.6 30.0 33.6 23.7 21.6 Calgary 18.6 12.5 12.2 -29.4 -9.1Edmonton 18.6 20.3 20.5 18.0 16.9 Edmonton 5.5 9.3 1.1 -12.1 -6.4
B.C. 67.6 72.9 84.0 100.0 91.0 B.C. -11.8 7.8 15.2 19.0 -9.0Vancouver 25.4 29.0 33.7 41.8 36.7 Vancouver -22.7 13.9 16.2 24.2 -12.2Victoria 5.5 5.7 6.4 7.6 6.4 Victoria -5.5 4.3 11.9 18.9 -15.4
000'sofunits
Source:CanadianRealEstateAssociation
AnnualpercentchangeTABLE 1: EXISTING HOME SALES
F.ByTDEconomicsasofAugust2015
*InsufficientData

TD Economics | www.td.com/economics
9August 31, 2015
2012 2013 2014 2015F 2016F 2012 2013 2014 2015F 2016F
CANADA 361.5 381.7 407.0 435.8 440.1 CANADA 0.3 5.6 6.6 7.1 1.0
N. & L. 269.2 283.7 284.3 271.7 263.3 N. & L. 7.6 5.4 0.2 -4.4 -3.1St.John's* -- -- -- -- -- St.John's* -- -- -- -- --
P.E.I. 152.7 155.1 165.1 168.1 172.0 P.E.I. 3.7 1.6 6.4 1.8 2.3
N.S. 218.2 216.3 213.7 212.7 216.5 N.S. 2.8 -0.9 -1.2 -0.5 1.8Halifax 269.3 274.2 275.3 279.2 285.2 Halifax 3.6 1.8 0.4 1.4 2.2
N.B. 159.4 161.4 161.1 160.9 164.2 N.B. 0.2 1.3 -0.2 -0.1 2.0SaintJohn 166.6 172.1 169.8 163.2 162.3 SaintJohn -1.9 3.3 -1.3 -3.9 -0.5
Québec 264.6 267.7 271.4 274.0 277.9 Québec 4.1 1.2 1.4 0.9 1.4QuébecCity 258.1 267.2 265.3 268.6 274.7 QuébecCity 5.2 3.5 -0.7 1.3 2.3Montréal 322.1 324.1 331.8 336.8 344.0 Montréal 4.1 0.6 2.4 1.5 2.1
Ontario 381.7 401.2 429.2 462.5 476.1 Ontario 5.0 5.1 7.0 7.8 2.9Ottawa 351.0 356.4 360.7 368.3 375.4 Ottawa 2.3 1.6 1.2 2.1 1.9Toronto 495.0 521.8 563.5 614.4 639.3 Toronto 6.8 5.4 8.0 9.0 4.1Hamilton 358.1 381.2 404.5 436.8 454.9 Hamilton 7.8 6.5 6.1 8.0 4.2
Manitoba 246.6 260.7 264.7 268.8 274.4 Manitoba 4.9 5.7 1.5 1.5 2.1Winnipeg 254.0 268.5 271.9 275.2 279.2 Winnipeg 5.3 5.7 1.3 1.2 1.4
Sask. 275.2 287.5 297.9 297.8 297.8 Sask. 6.4 4.5 3.6 0.0 0.0Regina 301.0 310.9 314.7 307.7 304.0 Regina 8.9 3.3 1.2 -2.2 -1.2Saskatoon 319.3 331.0 340.8 344.6 339.5 Saskatoon 6.1 3.7 2.9 1.1 -1.5
Alberta 362.0 380.2 399.8 389.1 378.1 Alberta 2.6 5.0 5.2 -2.7 -2.8Calgary 410.8 436.6 459.5 451.3 441.7 Calgary 2.2 6.3 5.2 -1.8 -2.1Edmonton 333.2 343.6 361.3 366.7 357.1 Edmonton 2.9 3.1 5.2 1.5 -2.6
B.C. 512.9 537.6 570.2 624.5 640.0 B.C. -7.9 4.8 6.1 9.5 2.5Vancouver 725.6 767.4 813.2 889.1 921.9 Vancouver -6.1 5.8 6.0 9.3 3.7Victoria 482.0 476.7 495.4 515.4 533.7 Victoria -2.9 -1.1 3.9 4.0 3.5
AnnualpercentchangeTABLE 2: AVERAGE EXISTING HOME PRICE
Canadian$,000's
F.ByTDEconomicsasofAugust2015
*InsufficientData
Source:CanadianRealEstateAssociation

TD Economics | www.td.com/economics
10August 31, 2015
2012 2013 2014 2015F 2016F 2012 2013 2014 2015F 2016F
CANADA 214.8 187.9 188.6 185.9 165.7 CANADA 10.8 12.5- 0.3 1.4- 10.9-
N. & L. 3.9 2.9 2.2 1.9 1.9 N. & L. 11.4 26.3- 22.9- 13.0- 0.5 St.John's* 2.2 1.7 1.2 0.9 0.9 St.John's* 12.0 19.5- 31.9- 22.1- 1.1
P.E.I. 0.95 0.64 0.52 0.43 0.58 P.E.I. 0.3 33.2- 18.9- 16.7- 34.9
N.S. 4.6 3.9 3.1 4.0 4.1 N.S. 2.2- 14.4- 21.4- 30.3 2.5 Halifax 2.8 2.4 1.8 2.7 2.8 Halifax 6.8- 11.4- 27.6- 53.0 3.7
N.B. 3.3 2.8 2.3 1.9 2.1 N.B. 0.3- 13.4- 18.8- 18.0- 13.8 SaintJohn 0.4 0.3 0.2 0.2 0.3 SaintJohn 1.7- 22.3- 16.9- 21.5- 88.9
Québec 47.2 37.6 38.9 35.9 36.0 Québec 2.3- 20.3- 3.4 7.8- 0.3 QuébecCity 6.4 4.7 4.4 4.9 4.8 QuébecCity 71.8- 27.1- 5.4- 10.7 2.0- Montréal 20.6 15.6 18.6 17.0 16.2 Montréal 9.4- 24.1- 19.1 8.7- 4.7-
Ontario 77.4 60.9 58.3 63.0 55.0 Ontario 14.2 21.4- 4.3- 8.1 12.7- Ottawa 6.0 6.6 5.8 4.0 3.8 Ottawa 4.0 8.9 12.3- 30.5- 5.0- Toronto 48.1 33.5 28.7 39.0 32.0 Toronto 21.0 30.3- 14.3- 35.7 17.9- Hamilton 3.0 2.7 2.8 2.0 2.2 Hamilton 20.6 8.8- 3.7 28.8- 10.0
Manitoba 7.3 7.5 6.2 6.3 6.4 Manitoba 21.3 2.6 17.4- 1.7 1.6 Winnipeg 4.1 4.7 4.2 4.3 4.4 Winnipeg 22.0 15.7 9.9- 1.4 2.3
Sask. 10.0 8.3 8.2 6.0 5.1 Sask. 42.6 17.1- 0.2- 27.3- 15.8- Regina 3.1 3.1 2.2 1.4 1.1 Regina 82.6 0.9 28.7- 37.1- 21.4- Saskatoon 3.8 3.0 3.5 2.1 1.6 Saskatoon 25.4 20.6- 16.7 39.6- 23.8-
Alberta 33.3 36.1 40.5 35.0 27.8 Alberta 30.4 8.2 12.5 13.7- 20.5- Calgary 12.8 12.6 17.1 11.0 10.0 Calgary 38.2 2.0- 36.0 35.7- 9.1- Edmonton 12.8 14.7 13.9 16.0 12.0 Edmonton 37.6 14.4 5.6- 15.3 25.0-
B.C. 27.5 27.1 28.3 31.5 26.7 B.C. 4.4 1.5- 4.6 11.1 15.3- Vancouver 19.0 18.7 19.2 21.0 19.0 Vancouver 6.5 1.7- 2.8 9.3 9.5- Victoria 1.7 1.7 1.3 1.8 1.7 Victoria 3.5 0.9- 22.0- 33.2 5.7-
TABLE 3: HOUSING STARTS
Source:CanadianMortgageandHousingCorporation,StatisticsCanada
F.ByTDEconomicsasofAugust2015
PercentchangeThousandsofUnits

TD Economics | www.td.com/economics
11August 31, 2015
2012 2013 2014 2015F 2016F 2012 2013 2014 2015F 2016F
CANADA 52.1 52.8 53.7 55.9 52.9 CANADA 1.1- 0.7 0.9 2.2 3.0-
N. & L. 49.9 42.7 37.3 36.9 35.5 N. & L. 0.5 7.1- 5.4- 0.4- 1.4- St.John's* -- -- -- -- -- St.John's* -- -- -- -- --
P.E.I. 50.3 40.3 36.1 42.3 40.1 P.E.I. 2.9 10.0- 4.2- 6.2 2.2-
N.S. 51.2 43.9 43.0 36.8 36.5 N.S. 0.4 7.3- 0.9- 6.2- 0.3- Halifax 59.5 47.6 45.8 39.6 42.2 Halifax 0.3 11.9- 1.9- 6.1- 2.6
N.B. 41.6 41.4 38.3 41.2 42.8 N.B. 4.0- 0.2- 3.1- 2.9 1.7 SaintJohn 36.2 37.6 35.7 38.6 40.1 SaintJohn 3.2- 1.4 1.9- 2.8 1.5
Québec 49.4 45.7 44.0 46.0 46.5 Québec 0.7- 3.7- 1.7- 2.0 0.5 QuébecCity 56.9 49.4 48.5 49.9 51.7 QuébecCity 1.4- 7.5- 0.9- 1.4 1.8 Montréal 52.0 47.3 46.0 48.5 49.6 Montréal 1.4- 4.7- 1.4- 2.5 1.1
Ontario 54.9 54.8 56.0 60.6 58.1 Ontario 2.4- 0.1- 1.2 4.6 2.5- Ottawa 51.2 47.0 45.3 45.5 46.3 Ottawa 4.9- 4.1- 1.7- 0.2 0.8 Toronto 55.5 56.5 59.5 65.5 61.8 Toronto 6.5- 1.1 2.9 6.1 3.7- Hamilton 70.8 71.6 73.7 75.8 63.7 Hamilton 4.1 0.8 2.1 2.0 12.1-
Manitoba 71.9 65.0 57.7 54.1 53.3 Manitoba 1.2- 6.8- 7.3- 3.6- 0.8- Winnipeg 72.5 66.5 58.9 55.6 55.5 Winnipeg 2.5- 6.1- 7.5- 3.4- 0.1-
Sask. 55.4 49.2 46.0 39.8 40.6 Sask. 2.9 6.2- 3.1- 6.2- 0.8 Regina 62.2 51.7 44.9 44.4 47.7 Regina 0.3 10.5- 6.8- 0.4- 3.3 Saskatoon 52.8 48.7 46.5 38.0 39.8 Saskatoon 2.4 4.1- 2.1- 8.5- 1.8
Alberta 58.6 64.3 64.6 53.8 47.2 Alberta 7.8 5.7 0.3 10.9- 6.6- Calgary 63.2 70.2 69.9 59.4 49.4 Calgary 11.9 7.0 0.3- 10.5- 10.1- Edmonton 56.7 65.0 62.7 51.0 43.0 Edmonton 3.3 8.3 2.3- 11.7- 8.0-
B.C. 42.6 49.5 55.8 65.1 57.9 B.C. 5.1- 7.0 6.2 9.3 7.1- Vancouver 42.4 51.3 58.4 69.8 57.9 Vancouver 11.3- 8.9 7.1 11.4 11.8- Victoria 42.8 49.9 55.1 63.8 54.5 Victoria 0.2- 7.1 5.2 8.8 9.4-
F.ByTDEconomicsasofAugust2015
*InsufficientData
Source:CanadianRealEstateAssociation
Percent PercentchangeTABLE 4: SALES-TO-NEW LISTINGS RATIO

TD Economics | www.td.com/economics
12August 31, 2015
2012 2013 2014 2015F 2016F 2012 2013 2014 2015F 2016F
CANADA 5.2 5.3 5.5 5.7 5.6 CANADA 0.2- 0.1 0.2 0.2 0.1-
N. & L. 4.7 4.7 4.4 4.1 3.8 N. & L. 0.4 0.1- 0.3- 0.3- 0.2- St.John's* -- -- -- -- -- St.John's* -- -- -- -- --
P.E.I. 2.8 2.8 2.9 2.8 2.8 P.E.I. 0.0 0.0- 0.1 0.0- 0.0-
N.S. 3.9 3.7 3.6 3.5 3.4 N.S. 0.0- 0.2- 0.2- 0.1- 0.0- Halifax 4.0 3.9 3.8 3.8 3.7 Halifax 0.0- 0.1- 0.1- 0.1- 0.0-
N.B. 3.0 2.9 2.8 2.7 2.7 N.B. 0.1- 0.0- 0.1- 0.1- 0.0- SaintJohn 3.1 3.1 3.0 2.8 2.7 SaintJohn 0.2- 0.0 0.1- 0.2- 0.1-
Québec 4.6 4.5 4.4 4.3 4.3 Québec 0.0 0.1- 0.1- 0.1- 0.1- QuébecCity 3.6 3.6 3.5 3.4 3.4 QuébecCity 0.1 0.0- 0.1- 0.1- 0.0- Montréal 5.3 5.1 5.1 5.0 5.0 Montréal 0.0 0.2- 0.0- 0.1- 0.0-
Ontario 5.3 5.3 5.5 5.8 5.8 Ontario 0.1 0.1 0.2 0.3 0.0- Ottawa 4.1 4.0 3.9 3.9 3.9 Ottawa 0.1- 0.1- 0.1- 0.0- 0.0- Toronto 6.2 6.3 6.6 7.0 7.0 Toronto 0.2 0.1 0.3 0.4 0.1 Hamilton 4.5 4.6 4.7 4.9 5.0 Hamilton 0.2 0.1 0.1 0.2 0.1
Manitoba 3.8 3.9 3.9 3.8 3.8 Manitoba 0.0 0.1 0.1- 0.1- 0.0- Winnipeg 3.6 3.7 3.5 3.5 3.4 Winnipeg 0.0 0.0 0.1- 0.1- 0.1-
Sask. 3.9 4.0 4.0 3.9 3.8 Sask. 0.2 0.1 0.0 0.1- 0.1- Regina 4.3 4.3 4.3 4.1 3.9 Regina 0.3 0.1 0.1- 0.2- 0.2- Saskatoon 4.5 4.6 4.6 4.5 4.3 Saskatoon 0.2 0.1 0.0- 0.1- 0.2-
Alberta 4.0 4.1 4.2 4.0 3.7 Alberta 0.0 0.1 0.1 0.2- 0.2- Calgary 3.8 4.0 4.0 3.9 3.7 Calgary 0.0- 0.1 0.1 0.2- 0.2- Edmonton 4.2 4.3 4.4 4.3 4.1 Edmonton 0.0 0.0 0.1 0.1- 0.2-
B.C. 7.9 8.0 8.2 8.7 8.7 B.C. 1.0- 0.1 0.2 0.5 0.0- Vancouver 10.3 10.4 10.8 11.6 11.8 Vancouver 1.1- 0.2 0.4 0.8 0.2 Victoria 8.1 7.7 7.8 7.8 7.9 Victoria 0.6- 0.4- 0.1 0.1 0.0
F.ByTDEconomicsasofAugust2015
*InsufficientData
Source:CanadianRealEstateAssociation,StatisticsCanada
Level PercentchangeTABLE 6: PRICE-TO-INCOME RATIO

TD Economics | www.td.com/economics
13August 31, 2015
ThisreportisprovidedbyTDEconomics.Itisforinformationalandeducationalpurposesonlyasofthedateofwriting,andmaynotbeappropriateforotherpurposes.Theviewsandopinionsexpressedmaychangeatanytimebasedonmarketorotherconditionsandmaynotcometopass.Thismaterialisnotintendedtoberelieduponasinvestmentadviceorrecommendations,doesnotconstituteasolicitationtobuyorsellsecuritiesandshouldnotbeconsideredspecificlegal,investmentortaxadvice.ThereportdoesnotprovidematerialinformationaboutthebusinessandaffairsofTDBankGroupandthemembersofTDEconomicsarenotspokespersonsforTDBankGroupwithrespecttoitsbusinessandaffairs.Theinformationcontainedinthisreporthasbeendrawnfromsourcesbelievedtobereliable,butisnotguaranteedtobeaccurateorcomplete.Thisreportcontainseconomicanalysisandviews,includingaboutfutureeconomicandfinancialmarketsperformance.Thesearebasedoncertainassumptionsandotherfactors,andaresubjecttoinherentrisksanduncertainties.Theactualoutcomemaybemateriallydifferent.TheToronto-DominionBankanditsaffiliatesandrelatedentitiesthatcomprisetheTDBankGrouparenotliableforanyerrorsoromissionsintheinformation,analysisorviewscontainedinthisreport,orforanylossordamagesuffered.
2012 2013 2014 2015F 2016F 2012 2013 2014 2015F 2016F
CANADA 52.1 52.8 53.7 55.9 52.9 CANADA 1.1- 0.7 0.9 2.2 3.0-
N. & L. 49.9 42.7 37.3 36.9 35.5 N. & L. 0.5 7.1- 5.4- 0.4- 1.4- St.John's* -- -- -- -- -- St.John's* -- -- -- -- --
P.E.I. 50.3 40.3 36.1 42.3 40.1 P.E.I. 2.9 10.0- 4.2- 6.2 2.2-
N.S. 51.2 43.9 43.0 36.8 36.5 N.S. 0.4 7.3- 0.9- 6.2- 0.3- Halifax 59.5 47.6 45.8 39.6 42.2 Halifax 0.3 11.9- 1.9- 6.1- 2.6
N.B. 41.6 41.4 38.3 41.2 42.8 N.B. 4.0- 0.2- 3.1- 2.9 1.7 SaintJohn 36.2 37.6 35.7 38.6 40.1 SaintJohn 3.2- 1.4 1.9- 2.8 1.5
Québec 49.4 45.7 44.0 46.0 46.5 Québec 0.7- 3.7- 1.7- 2.0 0.5 QuébecCity 56.9 49.4 48.5 49.9 51.7 QuébecCity 1.4- 7.5- 0.9- 1.4 1.8 Montréal 52.0 47.3 46.0 48.5 49.6 Montréal 1.4- 4.7- 1.4- 2.5 1.1
Ontario 54.9 54.8 56.0 60.6 58.1 Ontario 2.4- 0.1- 1.2 4.6 2.5- Ottawa 51.2 47.0 45.3 45.5 46.3 Ottawa 4.9- 4.1- 1.7- 0.2 0.8 Toronto 55.5 56.5 59.5 65.5 61.8 Toronto 6.5- 1.1 2.9 6.1 3.7- Hamilton 70.8 71.6 73.7 75.8 63.7 Hamilton 4.1 0.8 2.1 2.0 12.1-
Manitoba 71.9 65.0 57.7 54.1 53.3 Manitoba 1.2- 6.8- 7.3- 3.6- 0.8- Winnipeg 72.5 66.5 58.9 55.6 55.5 Winnipeg 2.5- 6.1- 7.5- 3.4- 0.1-
Sask. 55.4 49.2 46.0 39.8 40.6 Sask. 2.9 6.2- 3.1- 6.2- 0.8 Regina 62.2 51.7 44.9 44.4 47.7 Regina 0.3 10.5- 6.8- 0.4- 3.3 Saskatoon 52.8 48.7 46.5 38.0 39.8 Saskatoon 2.4 4.1- 2.1- 8.5- 1.8
Alberta 58.6 64.3 64.6 53.8 47.2 Alberta 7.8 5.7 0.3 10.9- 6.6- Calgary 63.2 70.2 69.9 59.4 49.4 Calgary 11.9 7.0 0.3- 10.5- 10.1- Edmonton 56.7 65.0 62.7 51.0 43.0 Edmonton 3.3 8.3 2.3- 11.7- 8.0-
B.C. 42.6 49.5 55.8 65.1 57.9 B.C. 5.1- 7.0 6.2 9.3 7.1- Vancouver 42.4 51.3 58.4 69.8 57.9 Vancouver 11.3- 8.9 7.1 11.4 11.8- Victoria 42.8 49.9 55.1 63.8 54.5 Victoria 0.2- 7.1 5.2 8.8 9.4-
F.ByTDEconomicsasofAugust2015
*InsufficientData
Source:CanadianRealEstateAssociation
Percent PercentchangeTABLE 4: SALES-TO-NEW LISTINGS RATIO