canberra public schools census august 2017 · canberra public schools census august 2017 . ... high...
TRANSCRIPT

Canberra Public Schools Census
August 2017
This publication provides information on students enrolled in Canberra public schools at 4 August 2017.
Release date: 8 December 2017

Canberra Public Schools Census August 2017
ACT Education Directorate P a g e | 2
Introduction
This publication presents the results from the Canberra school census conducted on Friday 4 August 2017. The census covers enrolments in public schools from preschool to year 12.
This publication also presents information on the number of persons of school age who undertook school equivalent courses through home education or the Canberra Institute of Technology.
Student enrolments
At August 2017 census, there were 46,566 students enrolled in Canberra public schools. This represented an increase of 1,649 enrolments (3.7%) since August 2016. From August 2013 to August 2017, enrolments increased by 5,519 students (13.4%).
There were:
• 29,532 students enrolled in public primary schools. This represents an increase of 1,234 enrolments (4.4%) since August 2016. Preschool enrolments increased by 74 students (1.6%) to 4,677 students; while kindergarten to year 6 enrolments increased by 1,160 students (4.9%) to 24,855 students.
• 10,666 students enrolled in public high schools, an increase of 293 enrolments (2.8%) since August 2016.
• 6,368 students enrolled in public colleges, an increase of 122 enrolments (2.0%) since August 2016.
Table 1: Enrolments by level of schooling, 2013 to 20171, 2
Level of schooling 2013 2014 2015 2016 2017 Preschool 4,583 4,873 4,740 4,603 4,677 Primary (K-6) 20,639 21,437 22,526 23,695 24,855 High 9,969 9,912 10,053 10,373 10,666 College 5,856 6,014 6,197 6,246 6,368 Total all schools 41,047 42,236 43,516 44,917 46,566
1 Includes a small number of students who attended more than one school. 2 Includes students from specialist schools.
Enrolments of Aboriginal and Torres Strait Islander students
At August 2017 census, there were 1,850 Aboriginal and Torres Strait Islander children and young people enrolled in Canberra public schools. This represents an increase of 73 enrolments (4.1%) since August 2016. Enrolments of Aboriginal and Torres Strait Islander students increased by 428 students (30.1%) since August 2013.
Table 2: Enrolments Aboriginal and Torres Strait Islander students by level of schooling, 2013 to 20171, 2
Level of schooling 2013 2014 2015 2016 2017 Preschool 212 267 288 251 289 Primary (K-6) 719 776 840 905 933 High 350 352 366 406 422 College 141 173 195 215 206 Total all schools 1,422 1,568 1,689 1,777 1,850
1 Includes a small number of students who attended more than one school. 2 Includes students from specialist schools.
Canberra Public Schools Census August 2017
ACT Education Directorate P a g e | 3
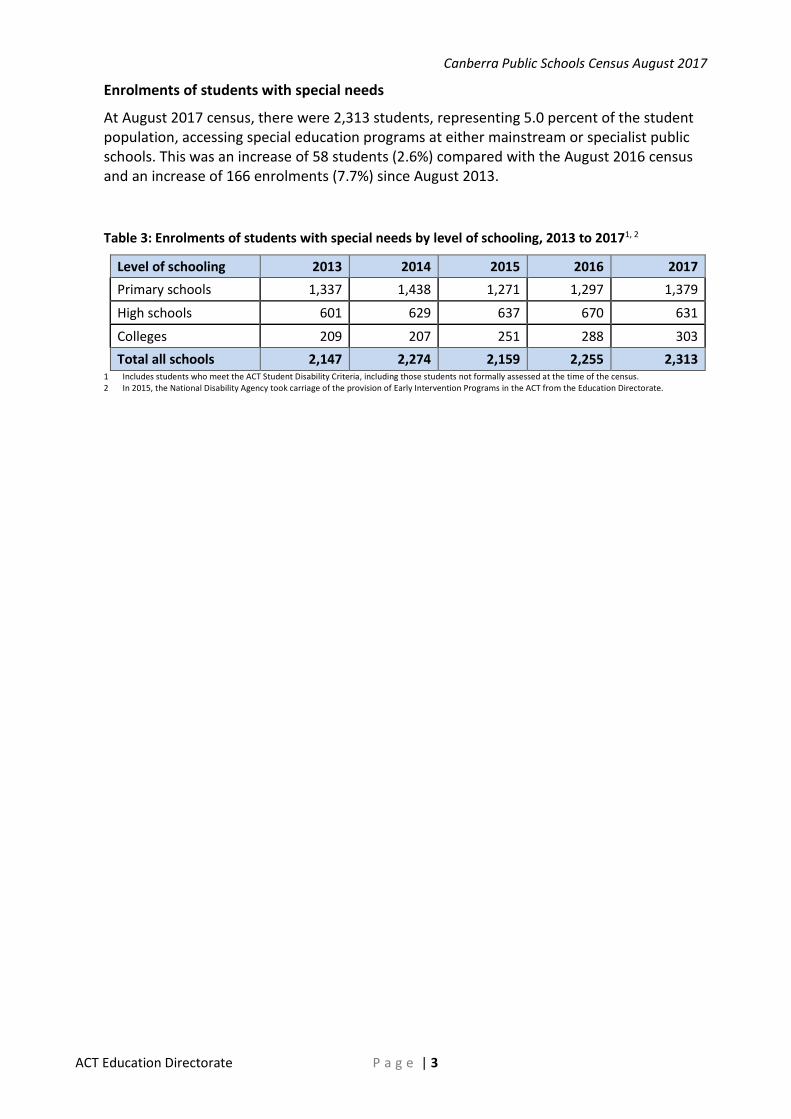
Enrolments of students with special needs
At August 2017 census, there were 2,313 students, representing 5.0 percent of the student population, accessing special education programs at either mainstream or specialist public schools. This was an increase of 58 students (2.6%) compared with the August 2016 census and an increase of 166 enrolments (7.7%) since August 2013.
Table 3: Enrolments of students with special needs by level of schooling, 2013 to 20171, 2
Level of schooling 2013 2014 2015 2016 2017 Primary schools 1,337 1,438 1,271 1,297 1,379
High schools 601 629 637 670 631
Colleges 209 207 251 288 303 Total all schools 2,147 2,274 2,159 2,255 2,313
1 Includes students who meet the ACT Student Disability Criteria, including those students not formally assessed at the time of the census. 2 In 2015, the National Disability Agency took carriage of the provision of Early Intervention Programs in the ACT from the Education Directorate.
Canberra Public Schools Census August 2017
ACT Education Directorate P a g e | 4
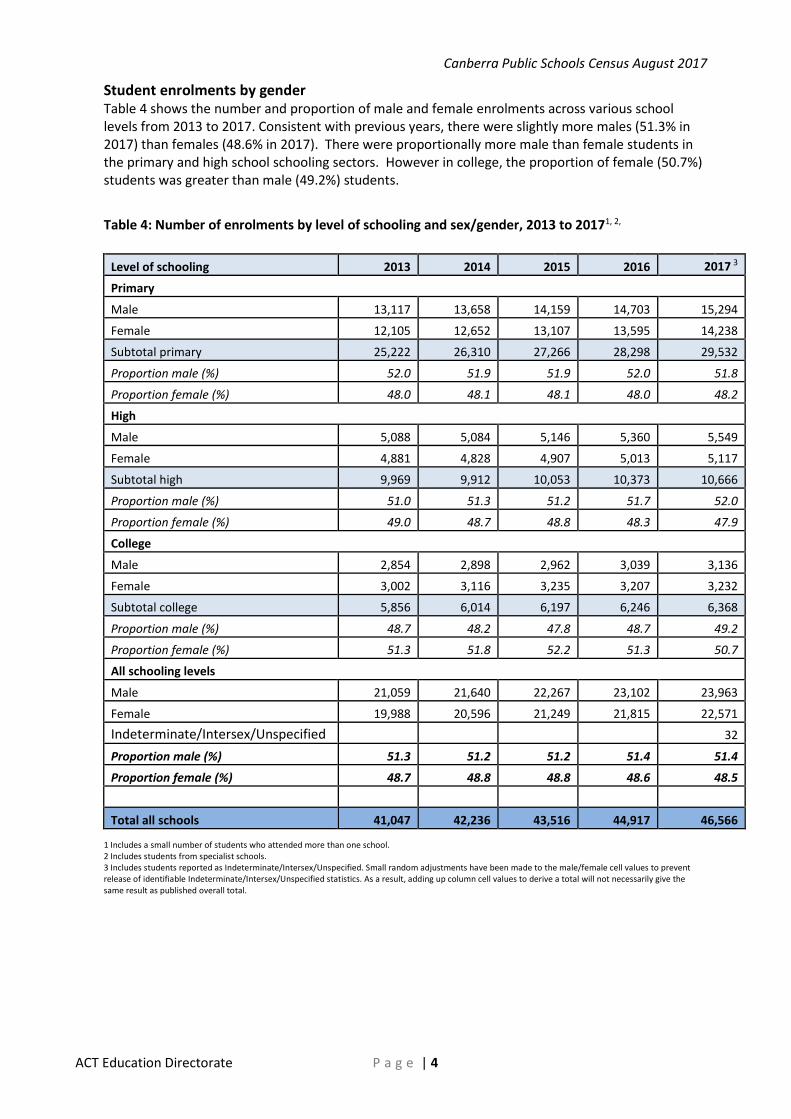
Student enrolments by gender Table 4 shows the number and proportion of male and female enrolments across various school levels from 2013 to 2017. Consistent with previous years, there were slightly more males (51.3% in 2017) than females (48.6% in 2017). There were proportionally more male than female students in the primary and high school schooling sectors. However in college, the proportion of female (50.7%) students was greater than male (49.2%) students.
Table 4: Number of enrolments by level of schooling and sex/gender, 2013 to 20171, 2,
Level of schooling 2013 2014 2015 2016 2017 3
Primary
Male 13,117 13,658 14,159 14,703 15,294
Female 12,105 12,652 13,107 13,595 14,238
Subtotal primary 25,222 26,310 27,266 28,298 29,532
Proportion male (%) 52.0 51.9 51.9 52.0 51.8
Proportion female (%) 48.0 48.1 48.1 48.0 48.2
High
Male 5,088 5,084 5,146 5,360 5,549
Female 4,881 4,828 4,907 5,013 5,117
Subtotal high 9,969 9,912 10,053 10,373 10,666
Proportion male (%) 51.0 51.3 51.2 51.7 52.0
Proportion female (%) 49.0 48.7 48.8 48.3 47.9
College
Male 2,854 2,898 2,962 3,039 3,136
Female 3,002 3,116 3,235 3,207 3,232
Subtotal college 5,856 6,014 6,197 6,246 6,368
Proportion male (%) 48.7 48.2 47.8 48.7 49.2
Proportion female (%) 51.3 51.8 52.2 51.3 50.7
All schooling levels
Male 21,059 21,640 22,267 23,102 23,963
Female 19,988 20,596 21,249 21,815 22,571 Indeterminate/Intersex/Unspecified 32
Proportion male (%) 51.3 51.2 51.2 51.4 51.4
Proportion female (%) 48.7 48.8 48.8 48.6 48.5
Total all schools 41,047 42,236 43,516 44,917 46,566 1 Includes a small number of students who attended more than one school. 2 Includes students from specialist schools. 3 Includes students reported as Indeterminate/Intersex/Unspecified. Small random adjustments have been made to the male/female cell values to prevent release of identifiable Indeterminate/Intersex/Unspecified statistics. As a result, adding up column cell values to derive a total will not necessarily give the same result as published overall total.
Canberra Public Schools Census August 2017
ACT Education Directorate P a g e | 5
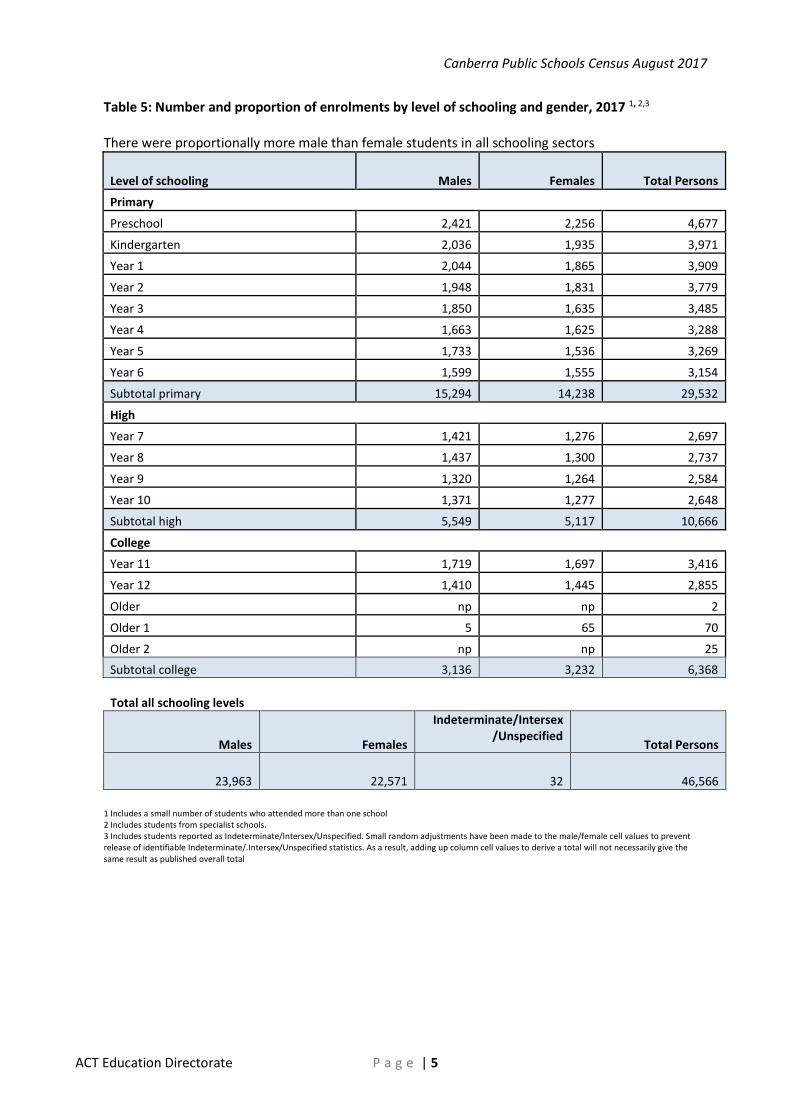
Table 5: Number and proportion of enrolments by level of schooling and gender, 2017 1, 2,3
There were proportionally more male than female students in all schooling sectors
Level of schooling Males Females Total Persons
Primary
Preschool 2,421 2,256 4,677
Kindergarten 2,036 1,935 3,971
Year 1 2,044 1,865 3,909
Year 2 1,948 1,831 3,779
Year 3 1,850 1,635 3,485
Year 4 1,663 1,625 3,288
Year 5 1,733 1,536 3,269
Year 6 1,599 1,555 3,154
Subtotal primary 15,294 14,238 29,532
High
Year 7 1,421 1,276 2,697
Year 8 1,437 1,300 2,737
Year 9 1,320 1,264 2,584
Year 10 1,371 1,277 2,648
Subtotal high 5,549 5,117 10,666
College
Year 11 1,719 1,697 3,416
Year 12 1,410 1,445 2,855
Older np np 2
Older 1 5 65 70
Older 2 np np 25 Subtotal college 3,136 3,232 6,368 Total all schooling levels
Males Females
Indeterminate/Intersex /Unspecified
Total Persons
23,963 22,571 32 46,566 1 Includes a small number of students who attended more than one school 2 Includes students from specialist schools. 3 Includes students reported as Indeterminate/Intersex/Unspecified. Small random adjustments have been made to the male/female cell values to prevent release of identifiable Indeterminate/.Intersex/Unspecified statistics. As a result, adding up column cell values to derive a total will not necessarily give the same result as published overall total

Canberra Public Schools Census August 2017
ACT Education Directorate P a g e | 6
Table 6: Number and proportion of Aboriginal and Torres Strait Islander enrolments and Non-Indigenous students by level of schooling and year level, 20171, 2
Level of Schooling Aboriginal and Torres Strait Islander students
Proportion of Aboriginal and Torres Strait Islander students (%) Non-Indigenous Not stated Total
Primary
Preschool 289 6.1 4,387 1 4,677
Kindergarten 136 3.4 3,834 1 3,971
Year 1 160 4.0 3,745 4 3,909
Year 2 151 3.9 3,626 2 3,779
Year 3 122 3.5 3,360 3 3,485
Year 4 123 3.7 3,163 2 3,288
Year 5 134 4.0 3,134 1 3,269
Year 6 107 3.3 3,039 8 3,154
Subtotal primary 1,222 4.1 28,288 22 29,532
High
Year 7 110 4.0 2,581 6 2,697
Year 8 118 4.3 2,614 5 2,737
Year 9 89 3.4 2,487 8 2,584
Year 10 105 3.9 2,528 15 2,648
Subtotal high 422 3.9 10,210 34 10,666
College
Year 11 109 3.1 3285 22 3,416
Year 12 81 2.8 2758 16 2,855
Older 10 83.3 2 0 12
Older 1 6 10.0 60 0 66
Older 2 0 0.0 19 0 19
Subtotal college 206 3.2 6,124 38 6,368
Total all schools 1,850 3.9 44,622 94 46,566

Canberra Public Schools Census August 2017
ACT Education Directorate P a g e | 7
Table 7: Number of primary school enrolments by year level, network and school, 20171,2,3
P K Year 1 Year 2 Year 3 Year 4 Year 5 Year 6 Total Belconnen Network Aranda Primary School 65 82 85 93 85 70 80 61 621
Charnwood-Dunlop School 92 44 29 48 30 28 31 30 332 Charnwood-Dunlop School IEC na 20 5 4 8 7 3 6 53 Evatt Primary School 63 41 29 44 31 36 39 44 327 Florey Primary School 73 63 56 68 64 62 57 68 511 Fraser Primary School 65 76 66 65 65 64 59 54 514
Giralang Primary School 44 44 55 39 35 53 29 39 338
Hawker Primary School 44 47 46 56 54 37 48 49 381 Kaleen Primary School 66 68 96 77 71 82 71 71 602 Kingsford Smith School 77 51 72 69 68 66 71 66 540 Kingsford Smith Koori Preschool 14 na na na na na na na 14 Latham Primary School 44 40 32 43 40 39 36 44 318
Macgregor Primary School 87 72 74 95 68 69 81 50 596
Macquarie Primary School 42 54 53 60 40 53 58 48 408 Maribyrnong Primary School 86 60 71 49 65 26 36 34 427 Miles Franklin Primary School 88 74 66 80 80 72 56 52 568 Mount Rogers Primary School 107 74 82 60 53 63 49 54 542 Southern Cross Early Childhood School 87 49 36 29 na na na na 201
Weetangera Primary School 58 52 61 45 63 60 68 59 466
Subtotal Belconnen 1,202 1,011 1,014 1,024 920 887 872 829 7,759 North/Gungahlin Network Ainslie School 58 43 47 47 42 58 57 50 402 Amaroo School 132 145 155 133 141 151 158 129 1,144 Campbell Primary School 64 58 59 45 46 41 32 48 393
Cranleigh School 18 11 15 13 17 4 9 7 94
Franklin Early Childhood School 128 78 61 35 na na na na 302 Gold Creek School 119 105 85 81 75 70 81 78 694 Harrison School 132 170 168 175 172 142 156 163 1,278 Jervis Bay School 14 9 5 4 4 8 7 8 59 Lyneham Primary School 77 57 63 64 57 60 55 83 516
Majura Primary School 88 88 80 81 87 63 78 75 640
Neville Bonner Primary School 209 126 105 102 81 65 38 38 764 Ngunnawal Primary School 121 91 103 82 74 72 72 76 691 Ngunnawal Koori Preschool 14 na na na na na na na 14 North Ainslie Primary School 85 78 95 71 83 64 76 61 613 North Ainslie Primary School IEC na 11 4 3 7 2 6 6 39
O'Connor Cooperative School 20 21 19 9 na na na na 69
Palmerston District Primary School 110 97 93 75 68 60 59 45 607 Palmerston District Primary School IEC na 7 3 1 4 2 3 3 23 Turner School 55 65 58 73 76 82 70 76 555 Subtotal North/Gungahlin 1,444 1,260 1,218 1,094 1,034 944 957 946 8,897

Canberra Public Schools Census August 2017
ACT Education Directorate P a g e | 8
Table 7: Number of primary school enrolments by year level, network and school, 20171,2,3 (continued)
P K Year
1 Year 2 Year 3 Year 4 Year 5 Year 6 Total South/Weston Network Arawang Primary School 88 61 75 68 67 64 43 50 516 Chapman Primary School 87 83 83 85 83 79 70 77 647 Charles Weston School Coombs 68 43 33 35 18 30 29 18 274 Curtin Primary School 62 79 64 74 78 75 74 68 574 Duffy Primary School 67 54 49 51 58 51 58 38 426 Farrer Primary School 49 39 45 47 51 43 51 49 374 Forrest Primary School 44 65 57 64 76 76 70 71 523 Garran Primary School 44 69 87 99 83 87 81 82 632 Hughes Primary School 44 35 51 62 60 56 54 53 415 Hughes Primary School IEC na 14 9 4 7 4 2 4 44 Lyons Early Childhood School 64 44 23 23 na na na na 154 Malkara School 10 14 11 11 4 6 14 9 79 Mawson Primary School 66 64 73 53 64 58 37 39 454 Narrabundah Early Childhood School 79 28 20 13 na na na na 140 Narrabundah Koori Preschool 20 na na na na na na na na Red Hill Primary School 85 84 84 82 94 100 90 86 705 Telopea Park School na 87 88 89 82 71 71 67 555 Torrens Primary School 64 52 66 77 56 65 58 62 500 Yarralumla Primary School 75 76 46 68 51 37 36 29 418 Subtotal South/Weston 1,016 991 964 1,005 932 902 838 802 7,450 Tuggeranong Network Bonython Primary School 44 34 47 48 44 36 40 28 321 Calwell Primary School 62 33 33 35 33 29 40 23 288 Caroline Chisholm School 45 43 48 43 40 53 48 44 364 Charles Conder Primary School 108 55 48 46 32 30 36 43 398 Fadden Primary School 43 37 40 48 52 41 55 37 353 Gilmore Primary School 22 9 20 16 16 11 16 13 123 Gordon Primary School 110 68 66 64 60 49 55 56 528 Gowrie Primary School 43 46 41 46 29 30 29 31 295 Isabella Plains Early Childhood School 87 48 38 23 na na na na 196 Monash Primary School 45 58 53 64 67 41 57 56 441 Namadgi School 84 44 59 45 60 59 64 70 485 Richardson Primary School 42 20 24 11 16 25 23 26 187 Richardson Koori Preschool 20 na na na na na na na 20 Taylor Primary School 66 60 48 42 31 31 21 31 330 Theodore Primary School 67 51 52 52 43 43 46 34 388 Wanniassa Hills Primary School 65 49 67 42 42 44 40 53 402 Wanniassa Hills Primary School IEC na 12 na 1 1 4 2 1 21 Wanniassa School 43 42 29 30 33 29 30 31 267 Wanniassa Koori Preschool 19 na na na na na na na 19 Subtotal Tuggeranong 1,015 709 713 656 599 555 602 577 5,426 Total primary schools 4,677 3,971 3,909 3,779 3,485 3,288 3,269 3,154 29,532 1 Includes a small number of students who attended more than one school. 2 Includes students from specialist schools. 3 Educational services at Jervis Bay School are provided by the ACT Education Directorate under a Memorandum of Understanding with the Australian Government. IEC - Intensive English Centre. na - Not applicable.
Canberra Public Schools Census August 2017
ACT Education Directorate P a g e | 9
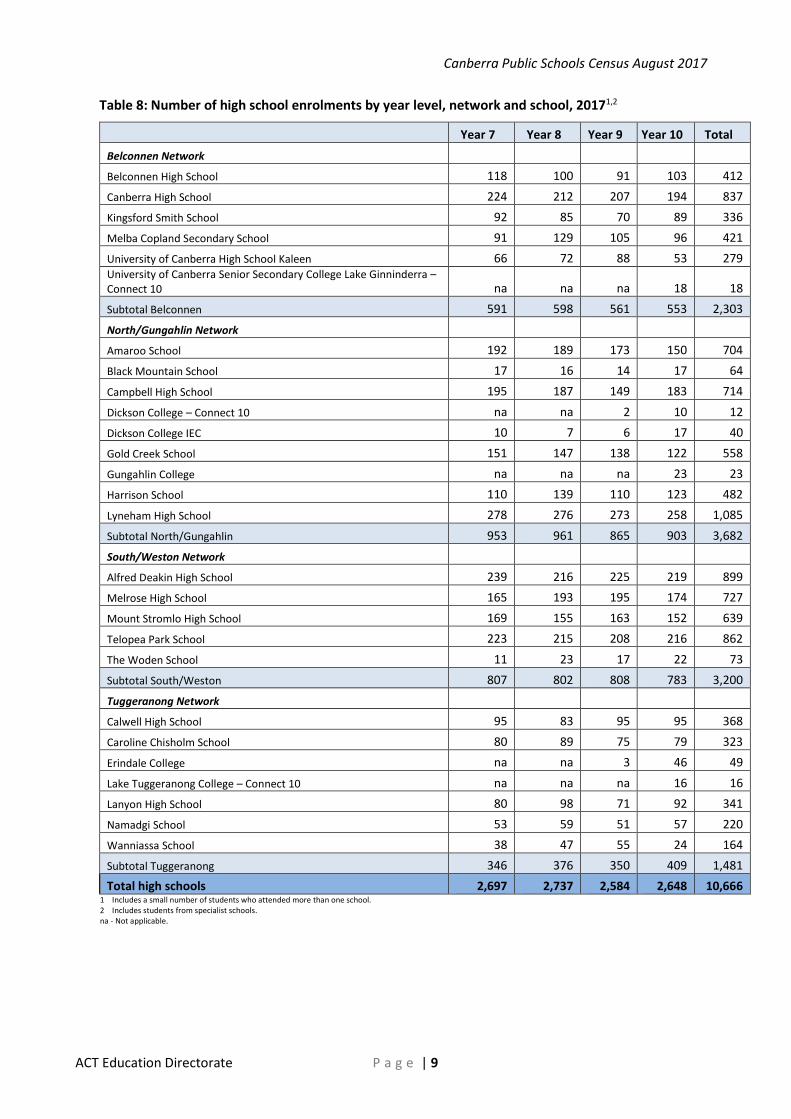
Table 8: Number of high school enrolments by year level, network and school, 20171,2
Year 7 Year 8 Year 9 Year 10 Total
Belconnen Network
Belconnen High School 118 100 91 103 412 Canberra High School 224 212 207 194 837 Kingsford Smith School 92 85 70 89 336 Melba Copland Secondary School 91 129 105 96 421 University of Canberra High School Kaleen 66 72 88 53 279 University of Canberra Senior Secondary College Lake Ginninderra – Connect 10 na na na 18 18 Subtotal Belconnen 591 598 561 553 2,303 North/Gungahlin Network Amaroo School 192 189 173 150 704 Black Mountain School 17 16 14 17 64
Campbell High School 195 187 149 183 714
Dickson College – Connect 10 na na 2 10 12 Dickson College IEC 10 7 6 17 40 Gold Creek School 151 147 138 122 558 Gungahlin College na na na 23 23 Harrison School 110 139 110 123 482
Lyneham High School 278 276 273 258 1,085
Subtotal North/Gungahlin 953 961 865 903 3,682 South/Weston Network Alfred Deakin High School 239 216 225 219 899 Melrose High School 165 193 195 174 727 Mount Stromlo High School 169 155 163 152 639
Telopea Park School 223 215 208 216 862
The Woden School 11 23 17 22 73 Subtotal South/Weston 807 802 808 783 3,200 Tuggeranong Network Calwell High School 95 83 95 95 368 Caroline Chisholm School 80 89 75 79 323
Erindale College na na 3 46 49
Lake Tuggeranong College – Connect 10 na na na 16 16 Lanyon High School 80 98 71 92 341 Namadgi School 53 59 51 57 220 Wanniassa School 38 47 55 24 164 Subtotal Tuggeranong 346 376 350 409 1,481 Total high schools 2,697 2,737 2,584 2,648 10,666
1 Includes a small number of students who attended more than one school. 2 Includes students from specialist schools. na - Not applicable.

Canberra Public Schools Census August 2017
ACT Education Directorate P a g e | 10
Table 9: Number of college enrolments by year level, network and school, 20171, 2
Year 11 Year 12 Older Total
Belconnen Network
Hawker College 208 221 - 429 Melba Copland Secondary School 122 51 - 173 University of Canberra Senior Secondary College Lake Ginninderra 312 271 2 585 Subtotal Belconnen 642 543 2 1,187
North/Gungahlin Network
Black Mountain School 19 20 - 39 Dickson College 432 346 - 778 Dickson College Secondary IEC 21 - - 21 Gungahlin College 603 488 - 1,091 Subtotal North/Gungahlin 1,075 854 - 1,929
South/Weston Network
The Canberra College 527 444 - 971 The Canberra College - CCCares 34 13 93 140 Narrabundah College 504 460 - 964 The Woden School 9 13 - 22 Subtotal South/Weston 1,074 930 93 2,097
Tuggeranong Network
Erindale College 242 220 - 462 Lake Tuggeranong College 383 308 2 693 Subtotal Tuggeranong 625 528 2 1,155 Total colleges 3,416 2,855 97 6,368
1 Includes a small number of students who attended more than one school. 2 Includes students from specialist schools. - Nil.

Canberra Public Schools Census August 2017
ACT Education Directorate P a g e | 11
Students to teacher ratio
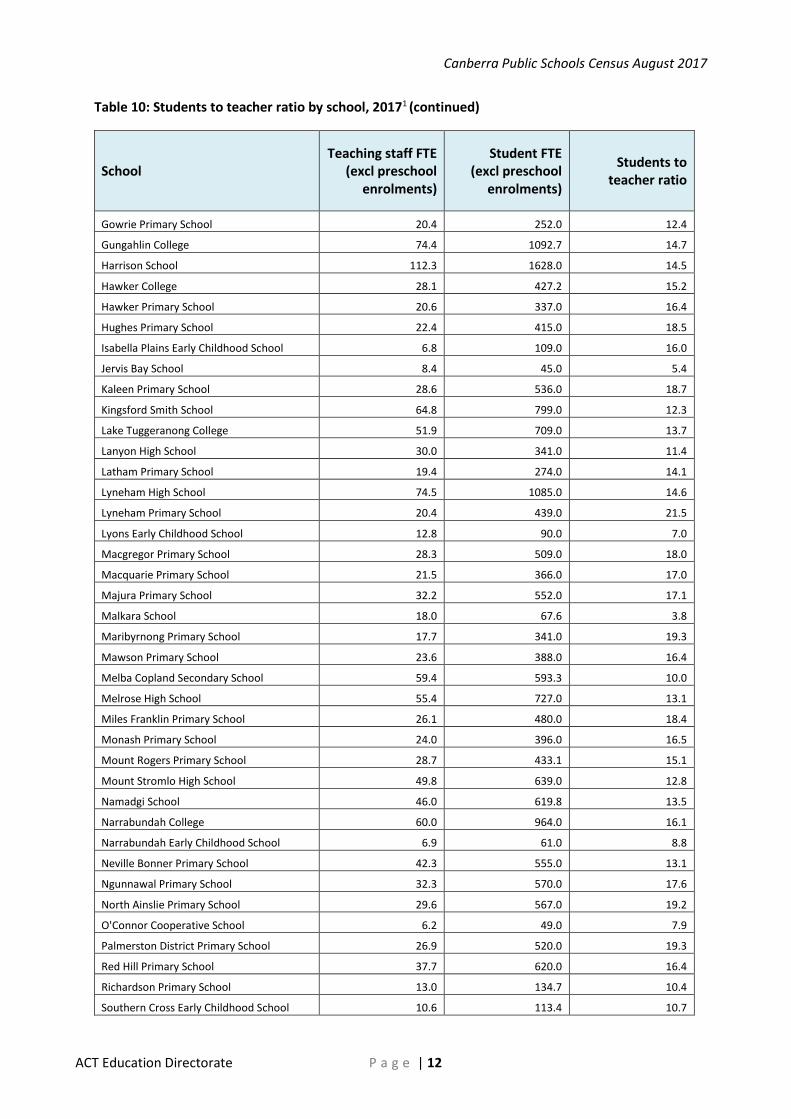
Table 10 shows students to teacher ratios for Canberra public schools. The students to teacher ratio takes account of all teaching resources allocated to support students. Students to teacher ratios are calculated by dividing the total Full-Time Equivalent (FTE) students by the FTE teaching staff. Table 10: Students to teacher ratio by school, 20171
School Teaching staff FTE
(excl preschool enrolments)
Student FTE (excl preschool
enrolments)
Students to teacher ratio
Ainslie School 24.9 344.0 13.8
Alfred Deakin High School 61.4 898.8 14.6
Amaroo School 114.1 1716.0 15.0
Aranda Primary School 36.3 556.0 15.3
Arawang Primary School 23.9 428.0 17.9
Belconnen High School 31.4 412.0 13.1
Black Mountain School 21.8 103.0 4.7
Bonython Primary School 16.8 277.0 16.5
Calwell High School 28.0 368.0 13.1
Calwell Primary School 13.9 226.0 16.3
Campbell High School 52.6 714.0 13.6
Campbell Primary School 18.6 329.0 17.7
Canberra College, The 75.4 1110.6 14.7
Canberra High School 61.9 836.0 13.5
Caroline Chisholm School 56.5 642.0 11.4
Chapman Primary School 27.8 558.8 20.1
Charles Conder Primary School 21.2 290.0 13.7
Charles Weston School 20.2 206.0 10.2
Charnwood-Dunlop School 17.5 293.0 16.7
Cranleigh School 14.4 75.1 5.2
Curtin Primary School 26.9 511.4 19.0
Dickson College 62.3 851.0 13.7
Duffy Primary School 22.0 359.0 16.3
Erindale College 36.1 510.6 14.1
Evatt Primary School 20.4 262.9 12.9
Fadden Primary School 17.8 310.0 17.4
Farrer Primary School 20.2 325.0 16.1
Florey Primary School 23.2 437.1 18.8
Forrest Primary School 29.8 479.0 16.1
Franklin Early Childhood School 9.6 174.0 18.1
Fraser Primary School 29.7 448.1 15.1
Garran Primary School 32.0 587.4 18.4
Gilmore Primary School 10.5 101.0 9.6
Giralang Primary School 21.4 294.0 13.7
Gold Creek School 83.2 1133.0 13.6
Gordon Primary School 29.0 418.0 14.4
Canberra Public Schools Census August 2017
ACT Education Directorate P a g e | 12
Table 10: Students to teacher ratio by school, 20171 (continued)
School Teaching staff FTE
(excl preschool enrolments)
Student FTE (excl preschool
enrolments)
Students to teacher ratio
Gowrie Primary School 20.4 252.0 12.4
Gungahlin College 74.4 1092.7 14.7
Harrison School 112.3 1628.0 14.5
Hawker College 28.1 427.2 15.2
Hawker Primary School 20.6 337.0 16.4
Hughes Primary School 22.4 415.0 18.5
Isabella Plains Early Childhood School 6.8 109.0 16.0
Jervis Bay School 8.4 45.0 5.4
Kaleen Primary School 28.6 536.0 18.7
Kingsford Smith School 64.8 799.0 12.3
Lake Tuggeranong College 51.9 709.0 13.7
Lanyon High School 30.0 341.0 11.4
Latham Primary School 19.4 274.0 14.1
Lyneham High School 74.5 1085.0 14.6
Lyneham Primary School 20.4 439.0 21.5
Lyons Early Childhood School 12.8 90.0 7.0
Macgregor Primary School 28.3 509.0 18.0
Macquarie Primary School 21.5 366.0 17.0
Majura Primary School 32.2 552.0 17.1
Malkara School 18.0 67.6 3.8
Maribyrnong Primary School 17.7 341.0 19.3
Mawson Primary School 23.6 388.0 16.4
Melba Copland Secondary School 59.4 593.3 10.0
Melrose High School 55.4 727.0 13.1
Miles Franklin Primary School 26.1 480.0 18.4
Monash Primary School 24.0 396.0 16.5
Mount Rogers Primary School 28.7 433.1 15.1
Mount Stromlo High School 49.8 639.0 12.8
Namadgi School 46.0 619.8 13.5
Narrabundah College 60.0 964.0 16.1
Narrabundah Early Childhood School 6.9 61.0 8.8
Neville Bonner Primary School 42.3 555.0 13.1
Ngunnawal Primary School 32.3 570.0 17.6
North Ainslie Primary School 29.6 567.0 19.2
O'Connor Cooperative School 6.2 49.0 7.9
Palmerston District Primary School 26.9 520.0 19.3
Red Hill Primary School 37.7 620.0 16.4
Richardson Primary School 13.0 134.7 10.4
Southern Cross Early Childhood School 10.6 113.4 10.7

Canberra Public Schools Census August 2017
ACT Education Directorate P a g e | 13
Table 10: Students to teacher ratio by school, 20171 (continued)
School Teaching staff FTE
(excl preschool staff)
Student FTE (excl preschool
enrolments)
Students to teacher ratio
Taylor Primary School 20.2 264.0 13.1
Telopea Park School 100.0 1417.0 14.2
Theodore Primary School 22.2 320.4 14.4
Torrens Primary School 25.4 436.0 17.2
Turner School 42.2 500.0 11.8
University of Canberra High School Kaleen 26.5 278.6 10.5 University of Canberra Senior Secondary College Lake Ginninderra 46.0 578.0 12.6
Wanniassa Hills Primary School 25.0 358.0 14.3
Wanniassa School 38.4 387.4 10.1
Weetangera Primary School 23.0 407.5 17.7
Woden School, The 26.8 95.0 3.5
Yarralumla Primary School 20.5 343.0 16.7
Canberra public schools total 2920.8 41814.5 14.3 1 Excludes preschool students and preschool teaching staff.
Non-school education
It is recognised that there are alternative educational pathways for students to undertake school level courses other than by attending an ACT public or non-government school. At August 2017, 303 children and young people were home educated in the ACT. In addition, a further 191 students who were of school age undertook school equivalent courses at the Canberra Institute of Technology.
Canberra Public Schools Census August 2017
ACT Education Directorate P a g e | 14
Explanatory Notes
Reference date
The 2017 August census was conducted on Friday 4 August 2017.
Scope and coverage
The August census included all ACT public schools providing primary, secondary and specialist education. Jervis Bay School was included in Canberra public primary schools as the ACT Education Directorate administers the Jervis Bay School for the Australian Government under a service agreement.
Collection
Canberra public school census data was electronically downloaded from the Directorate’s centralised administrative system.
Student enrolments
The census included students who were officially enrolled in a school on census day and who were active in a primary, secondary or specialist education program at that school. Students who were absent for more than four continuous school weeks prior to census date were included if the principal received written documentation signed by the guardian indicating that the student was to return to school on or before 18 August 2017.
Primary school level
The primary school level of schooling included students from preschool to year 6. Preschool level data also included students who were attending a preschool program as an early entry student.
High school level
The high school level of schooling included those students in years 7, 8, 9 and 10.
College level
The college level of schooling included those students in years 11 and 12 as well as those students defined as older.
Specialist schools
Specialist schools cater for students with a moderate to profound intellectual disability, severe Autism Spectrum Disorder or with multiple disabilities that require intensive levels of support.
Older students (O)
A student who is commencing or recommencing studies after their original cohort has graduated is eligible to study an abridged package. Such students are classified as Older. Students studying an abridged package in secondary colleges fall into two categories: • Students who study an abridged package over one year. These students are identified with an
academic year of O.
Canberra Public Schools Census August 2017
ACT Education Directorate P a g e | 15
• Students who study an abridged package over two years. These students are identified with an academic year of O2 in their final year of study and an academic year of O1 prior to their final year.
Connect 10
The Connect 10 program supports students to develop a personal pathway plan that may include one or more of the following goals: completion of year 10 Certificate, transition to years 11 and 12, vocational learning, employment and/or re-engagement with high school. Students in the program are an appropriate age for year 9 or 10 and their participation must be approved by a referral panel. The length of placement is long term, designed to engage students in learning and training and transition to future pathways.
Connect 10 programs were conducted at Lake Tuggeranong College, Dickson College and University of Canberra Senior Secondary College Lake Ginninderra.
Introductory English Centres
Introductory English Centres (IECs) are for students who require intensive full-time English language instruction.
There were five IECs in the primary sector, conducted at Charnwood-Dunlop School, Hughes Primary School, North Ainslie Primary School, Palmerston District Primary School and Wanniassa Hills Primary School. There was one IEC in the secondary sector, conducted at Dickson College.
© ACT Government, 2017
This publication has been produced by the ACT Education Directorate. Apart from any use permitted under the Copyright Act 1968, no part of this publication may be reproduced by any process without written permission. Requests should be made to the Directorate.
Comments and suggestions regarding this publication are welcomed and should be forwarded to the Directorate.
Published by: Education Directorate, ACT Government
GPO Box 158
Canberra City ACT 2601
Telephone: 132 281
Website: https://www.education.act.gov.au/