cancer clinical trials in the genomic era richard simon, d.sc. chief, biometric research branch...
TRANSCRIPT

Cancer Clinical Trials in the Genomic Era
Richard Simon, D.Sc.Chief, Biometric Research
BranchNational Cancer Institutehttp://brb.nci.nih.gov

Prognostic biomarkers Measured before treatment to indicate long-term outcome for patients untreated or receiving standard treatment
May reflect both disease aggressiveness and effect of standard treatment
Used to determine who needs more intensive treatment
Predictive biomarkers Measured before treatment to identify who will benefit from a particular treatment
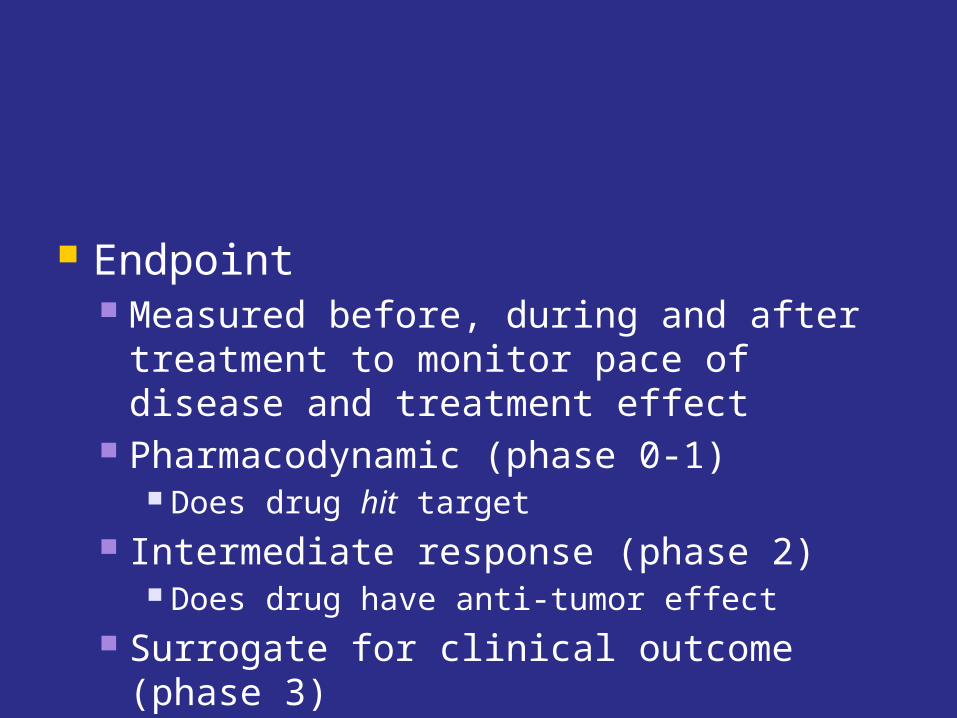
Endpoint Measured before, during and after treatment to monitor pace of disease and treatment effect
Pharmacodynamic (phase 0-1) Does drug hit target
Intermediate response (phase 2) Does drug have anti-tumor effect
Surrogate for clinical outcome (phase 3)

Prognostic & Predictive Biomarkers
Single gene or protein measurement
Scalar index or classifier that summarizes contributions of multiple genes

Prognostic & Predictive Biomarkers
in Genomic Oncology
Many cancer treatments benefit only a minority of patients to whom they are administered
Being able to predict which patients are likely to benefit can Help patients get an effective treatment Help control medical costs Improve the success rate of clinical drug development

Validation = Fitness for Intended Use

Biomarker Validity
Analytical validity Measures what it’s supposed to Reproducible and robust
Clinical validity (correlation) It correlates with something clinically
Medical utility Actionable resulting in patient benefit

Clinical Utility
Biomarker informs action that benefits patient by improving treatment decisions Identify patients who have very good prognosis on standard treatment and do not require more intensive regimens
Identify patients who are likely or unlikely to benefit from a specific regimen
Objective:Use biomarkers to
Develop effective treatments
Know who needs these treatments and who benefits from them
9
Prognostic markers
There is an enormous published literature on prognostic markers in cancer.
Very few prognostic markers (factors) are recommended for measurement by ASCO, are approved by FDA or are reimbursed for by payers. Very few play a role in treatment decisions.
Prognostic Biomarkers Can be Therapeutically
Relevant
<10% of node negative ER+ breast cancer patients require or benefit from the cytotoxic chemotherapy that they receive

OncotypeDx Recurrence Score
Intended use: Patients with node negative estrogen receptor positive breast cancer who are going to receive an anti-estrogen drug following local surgery/radiotherapy
Identify patients who have such good prognosis that they are unlikely to derive much benefit from adjuvant chemotherapy

Selected patients relevant for the intended use
Analyzed the data to see if the recurrence score identified a subset with such good prognosis that the absolute benefit of chemotherapy would at best be very small in absolute terms
Used an analytically validated test


Major problems with prognostic studies of gene
expression signatures
Inadequate focus on intended use
Reporting highly biased estimates of predictive value
Major problems with prognostic studies of gene
expression signatures
Inadequate focus on intended use Cases selected based on availability of specimens rather than for relevance to intended use
Heterogeneous sample of patients with mixed stages and treatments. Attempt to disentangle effects using regression modeling
Too a great a focus on which marker is prognostic or independently prognostic, not whether the marker is effective for intended use
Goodness of fit is not a proper measure of predictive accuracy
Odds ratios and hazards ratios are not proper measures of prediction accuracy
Statistical significance of regression coefficients are not proper measures of predictive value

Goodness of Fit vs Prediction Accuracy
For p>n problems, fit of a model to the same data used to develop it is no evidence of prediction accuracy for independent data

Simulation Training Validation
1
2
3
4
5
6
7
8
9
10
p=7.0e-05
p=0.70
p=4.2e-07
p=0.54
p=2.4e-13
p=0.60
p=1.3e-10
p=0.89
p=1.8e-13
p=0.36
p=5.5e-11
p=0.81
p=3.2e-09
p=0.46
p=1.8e-07
p=0.61
p=1.1e-07
p=0.49
p=4.3e-09
p=0.09

Validation of Prognostic Model
Completely independent validation dataset
Splitting dataset into training and testing sets Evaluate 1 completely specified model on test set
Cross-validation

Leave-one-out Cross Validation for
Classifier of Two Classes
Full dataset P={1,2,…,n} Omit case 1
V1={1}; T1={2,3,…,n} Develop classifier using training set T1
Classify cases in V1 and count whether classification is correct or not
Repeat for case 2,3,… Total number of mis-classified cases
Complete cross Validation
Cross-validation simulates the process of separately developing a model on one set of data and predicting for a test set of data not used in developing the model All aspects of the model development process must be repeated for each loop of the cross-validation Feature selection Tuning parameter optimization

Cross Validation
The cross-validated estimate of misclassification error is an estimate of the prediction error for the model fit applying the specified algorithm to full dataset

Prediction on Simulated Null Data
Simon et al. J Nat Cancer Inst 95:14, 2003
Generation of Gene Expression Profiles
• 20 specimens (Pi is the expression profile for specimen i)
• Log-ratio measurements on 6000 genes
• Pi ~ MVN(0, I6000)
• Can we distinguish between the first 10 specimens (Class 1) and the last 10 (Class 2)?
Prediction Method
• Compound covariate predictor built from the log-ratios of the 10 most differentially expressed genes.

Number of misclassifications
0 1 2 3 4 5 6 7 8 9 10 11 12 13 14 15 16 17 18 19 20
Pro
po
rtio
n o
f sim
ula
ted
da
ta s
ets
0.00
0.05
0.10
0.90
0.95
1.00
Cross-validation: none (resubstitution method)Cross-validation: after gene selectionCross-validation: prior to gene selection

Cross-validation Estimate of Prediction Error
26
Develop predictive classifier model M(x;A,D) by
applying algorithm A to full data-set D
Ex PE(M(x);A,D) is expected misclassification error
for future use of the classifier.
Ex PE(M(x);A,D) ED Ex PE(M(x);A,D)
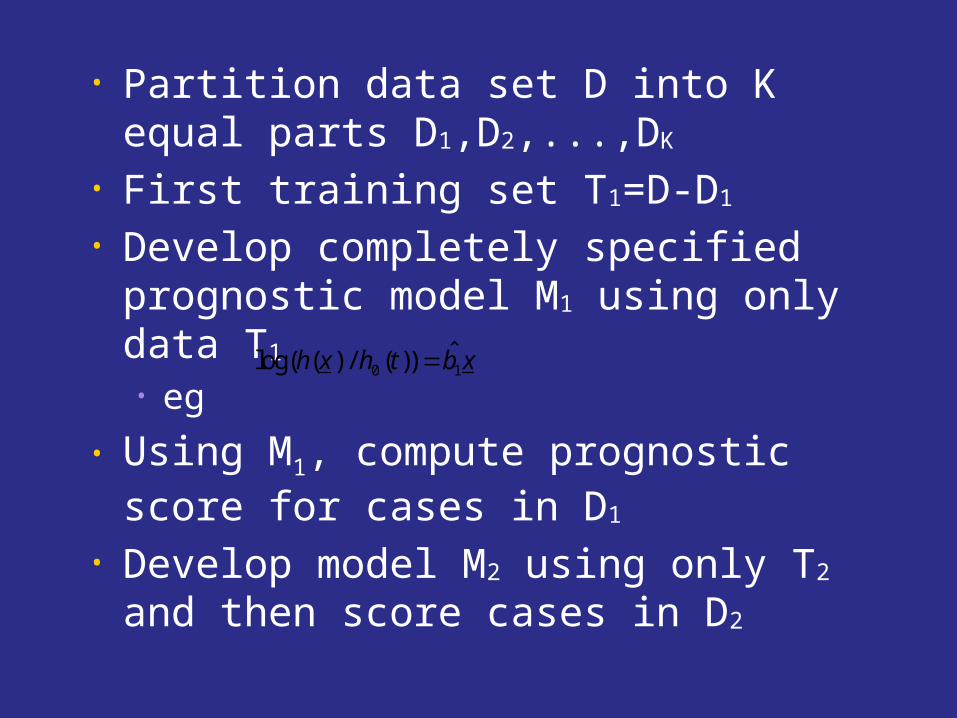
• Partition data set D into K equal parts D1,D2,...,DK
• First training set T1=D-D1
• Develop completely specified prognostic model M1 using only data T1
• eg
• Using M1, compute prognostic score for cases in D1
• Develop model M2 using only T2 and then score cases in D2
log(h(x) / h0 (t)) b1x

Repeat for ... TK -> MK -> DK
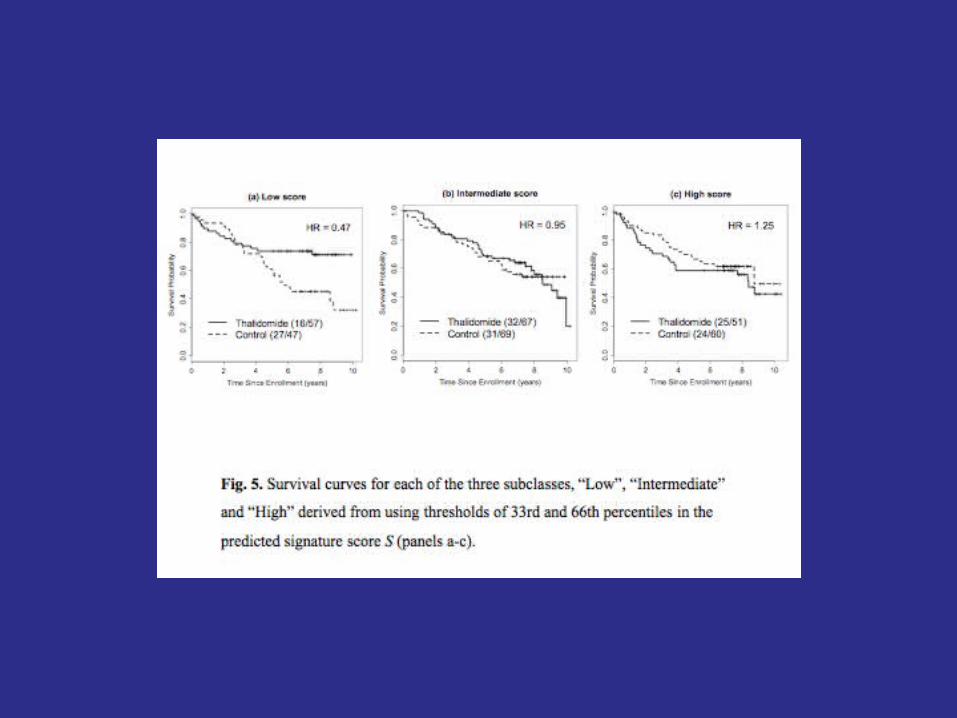
Group patients into 2 or more risk groups based on their cross-validated scores
Calculate Kaplan-Meier survival curve for each risk-group

To evaluate significance, the log-rank test cannot be used for cross-validated Kaplan-Meier curves because the survival times are not independent

• Statistical significance can be properly evaluated by approximating the null distribution of the cross-validated log-rank statistic
• Permute the survival times and repeat the entire cross-validation procedure to generate new cross-validated K-M curves for low risk and high risk groups– Compute log-rank statistic for the curves
• Repeat for many sets of permutations

Predictive Biomarkers
Cancers of a primary site often represent a heterogeneous group of diverse molecular entities which vary fundamentally with regard to the oncogenic mutations that cause them
their responsiveness to specific drugs
In most positive phase III clinical trials comparing a new treatment to control, most of the patients treated with the new treatment did not benefit. Adjuvant breast cancer: 70% long-term disease-free survival on control. 80% disease-free survival on new treatment. 70% of patients don’t need the new treatment. Of the remaining 30%, only 1/3rd benefit.

Predictive Biomarkers Estrogen receptor over-expression in breast cancer
Anti-estrogens, aromatase inhibitors HER2 amplification in breast cancer
Trastuzumab, Lapatinib OncotypeDx gene expression recurrence score in N+
ER+ breast cancer Low score -> not responsive to chemotherapy
KRAS in colorectal cancer WT KRAS = cetuximab or panitumumab
EGFR mutation in NSCLC EGFR inhibitor
V600E mutation in BRAF of melanoma vemurafenib
ALK translocation in NSCLC crizotinib


Standard Paradigm of Phase III Clinical
Trials Broad eligibility Base primary analysis on ITT eligible population
Don’t size for subset analysis, allocate alpha for subset analysis or trust subset analysis Only believe subset analysis if overall treatment effect is significant and interaction is significant
Standard Paradigm Sometimes Leads to
Treating many patients with few benefiting Small average treatment effects Problematic for health care economics
Inconsistency in results among studies
False negative studies

The standard approach to designing phase III clinical
trials is based on two assumptions
Qualitative treatment by subset interactions are unlikely
“Costs” of over-treatment are less than “costs” of under-treatment
Subset Analysis In the past generally used as secondary analyses Numerous subsets examined No control of type I error Trial not sized for subset analysis

Neither conventional approaches to subset analysis nor the broad eligibility paradigm are adequate for genomic based oncology clinical trials
We need a prospective approach that includes Preserving study-wise type I error Sizing the study for the primary analysis that includes any subset analysis
If there are multiple subsets, replacing subset analysis with development and internal unbiased evaluation of an indication classifier

Although the randomized clinical trial remains of fundamental importance for predictive genomic medicine, some of the conventional wisdom of how to design and analyze rct’s requires re-examination
The concept of doing an rct of thousands of patients to answer a single question about average treatment effect for a target population presumed homogeneous with regard to the direction of treatment efficacy in many cases no longer has an adequate scientific basis

How can we develop new drugs in a manner more consistent with modern tumor biology and obtain reliable information about what regimens work for what kinds of patients?

Development is Most Efficient Development is Most Efficient When the Scientific Basis for When the Scientific Basis for the Clinical Trial is Strongthe Clinical Trial is Strong
Having an important molecular Having an important molecular targettarget
Having a drug that is deliverable Having a drug that is deliverable at a dose and schedule that can at a dose and schedule that can effectively inhibit the targeteffectively inhibit the target
Having a pre-treatment assay that Having a pre-treatment assay that can identify the patients for can identify the patients for whom the molecular target is whom the molecular target is driving progression of disease driving progression of disease
When the Biology is Clear the Development Path is
Straightforward
Develop a classifier that identifies the patients likely (or unlikely) to benefit from the new drug
Develop an analytically validated test Measures what it should accurately and reproducibly
Design a focused clinical trial to evaluate effectiveness of the new treatment in test + patients

Using phase II data, develop predictor of response to new drug
Develop Predictor of Response to New Drug
Patient Predicted Responsive
New Drug Control
Patient Predicted Non-Responsive
Off Study
Targeted (Enrichment) Design

Predictive Biomarkers Estrogen receptor over-expression in breast cancer
Anti-estrogens, aromatase inhibitors HER2 amplification in breast cancer
Trastuzumab, Lapatinib OncotypeDx gene expression recurrence score in
breast cancer Low score for ER+ node - -> no chemotherapy
KRAS in colorectal cancer WT KRAS = cetuximab or panitumumab
EGFR mutation in NSCLC EGFR inhibitor
V600E mutation in BRAF of melanoma vemurafenib
ALK translocation in NSCLC crizotinib
Evaluating the Efficiency of Evaluating the Efficiency of Targeted DesignTargeted Design
Simon R and Maitnourim A. Evaluating the Simon R and Maitnourim A. Evaluating the efficiency of targeted designs for randomized efficiency of targeted designs for randomized clinical trials. Clinical Cancer Research clinical trials. Clinical Cancer Research 10:6759-63, 2004; Correction and supplement 10:6759-63, 2004; Correction and supplement 12:3229, 200612:3229, 2006
Maitnourim A and Simon R. On the efficiency of Maitnourim A and Simon R. On the efficiency of targeted clinical trials. Statistics in Medicine targeted clinical trials. Statistics in Medicine 24:329-339, 2005.24:329-339, 2005.

Relative efficiency of targeted Relative efficiency of targeted design depends on design depends on proportion of patients test positiveproportion of patients test positive specificity of treatment effect for specificity of treatment effect for test positive patientstest positive patients
When less than half of patients are When less than half of patients are test positive and the drug has test positive and the drug has minimal benefit for test negative minimal benefit for test negative patients, the targeted design patients, the targeted design requires dramatically fewer requires dramatically fewer randomized patients than the randomized patients than the standard design in which the marker standard design in which the marker is not usedis not used

Two Clinical Trial Designs
Standard design Randomized comparison of new drug E to control C without the test for screening patients
Targeted design Test patients Randomize only test + patients
Treatment effect D+ in test + patients
Treatment effect D- in test – patients
Proportion of patients test + is p+
Size each design to have power 0.9 and significance level 0.05

RandRat = nuntargeted/ntargeted
If D-=0, RandRat = 1/ p+2
if p+=0.5, RandRat=4 If D-= D+/2, RandRat = 4/(p+ +1)2
if p+=0.5, RandRat=16/9=1.77
RandRat
D
pD (1 p )D
2
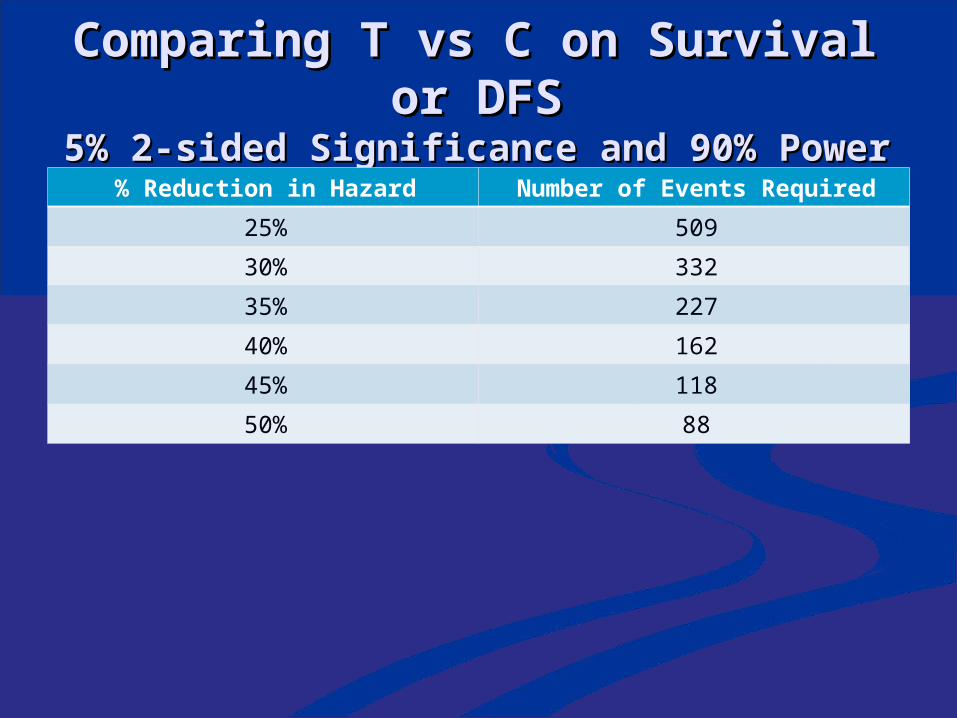
Comparing T vs C on Survival Comparing T vs C on Survival or DFSor DFS
5% 2-sided Significance and 90% Power 5% 2-sided Significance and 90% Power % Reduction in Hazard Number of Events Required
25% 509
30% 332
35% 227
40% 162
45% 118
50% 88
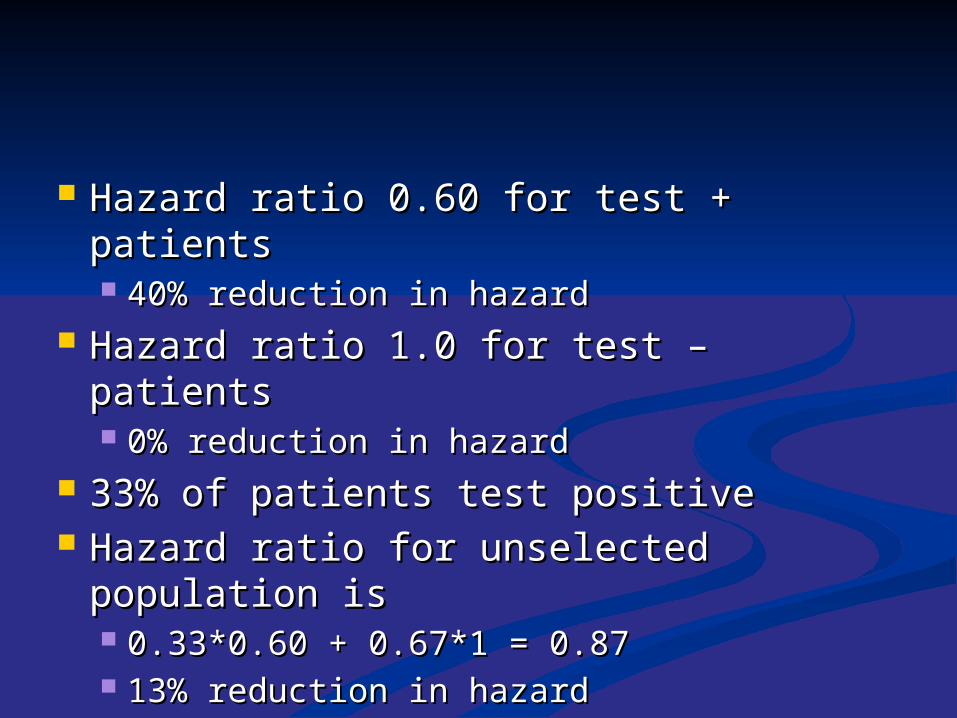
Hazard ratio 0.60 for test + Hazard ratio 0.60 for test + patientspatients 40% reduction in hazard40% reduction in hazard
Hazard ratio 1.0 for test – Hazard ratio 1.0 for test – patientspatients 0% reduction in hazard0% reduction in hazard
33% of patients test positive33% of patients test positive Hazard ratio for unselected Hazard ratio for unselected population is population is 0.33*0.60 + 0.67*1 = 0.870.33*0.60 + 0.67*1 = 0.87 13% reduction in hazard13% reduction in hazard

To have 90% power for detecting To have 90% power for detecting 40% reduction in hazard within 40% reduction in hazard within a biomarker positive subseta biomarker positive subset Number of events within subset = Number of events within subset = 162162
To have 90% power for detecting To have 90% power for detecting 13% reduction in hazard overall13% reduction in hazard overall Number of events = 2172Number of events = 2172
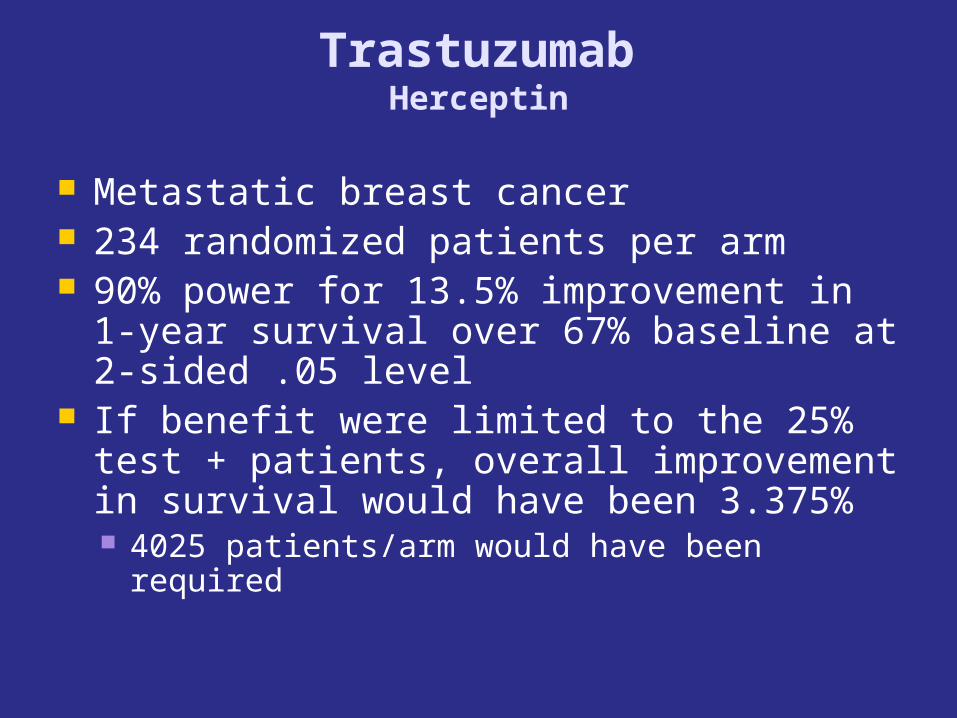
TrastuzumabHerceptin
Metastatic breast cancer 234 randomized patients per arm 90% power for 13.5% improvement in 1-year survival over 67% baseline at 2-sided .05 level
If benefit were limited to the 25% test + patients, overall improvement in survival would have been 3.375% 4025 patients/arm would have been required

Web Based Software for Web Based Software for Planning Clinical Trials Planning Clinical Trials of Treatments with a of Treatments with a Candidate Predictive Candidate Predictive
BiomarkerBiomarker http://brb.nci.nih.gov http://brb.nci.nih.gov
Regulatory Pathway for Test
Companion diagnostic test with intended use of identifying patients who have disease subtype for which the drug is proven effective

Implications for Early Phase Studies
Need to design and size early phase studies to discover an effective predictive biomarker for identifying the correct target population
Need to establish an analytically validated test for measuring the predictive marker in the phase III pivotal studies

When the drug is specific for one target and the biology is
well understood
May need to evaluate several candidate tests e.g. protein expression of target or amplification of gene
Phase II trials sized for adequate numbers of test positive patients and to determine appropriate cut-point of positivity
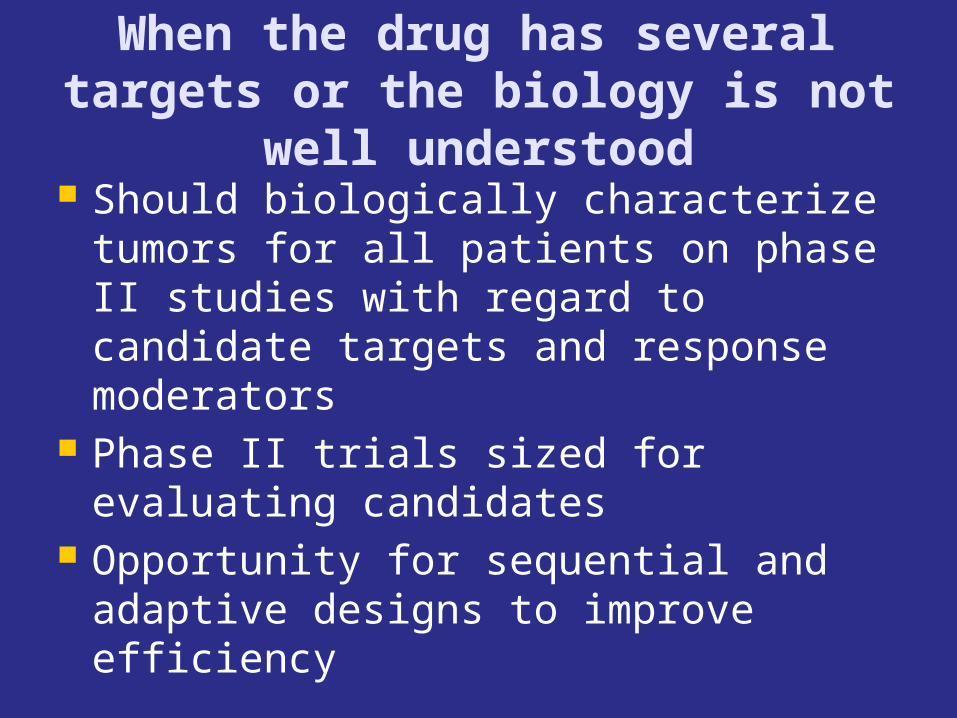
When the drug has several targets or the biology is not
well understood Should biologically characterize tumors for all patients on phase II studies with regard to candidate targets and response moderators
Phase II trials sized for evaluating candidates
Opportunity for sequential and adaptive designs to improve efficiency

Empirical screening of expression profiles or mutations
to develop predictive marker
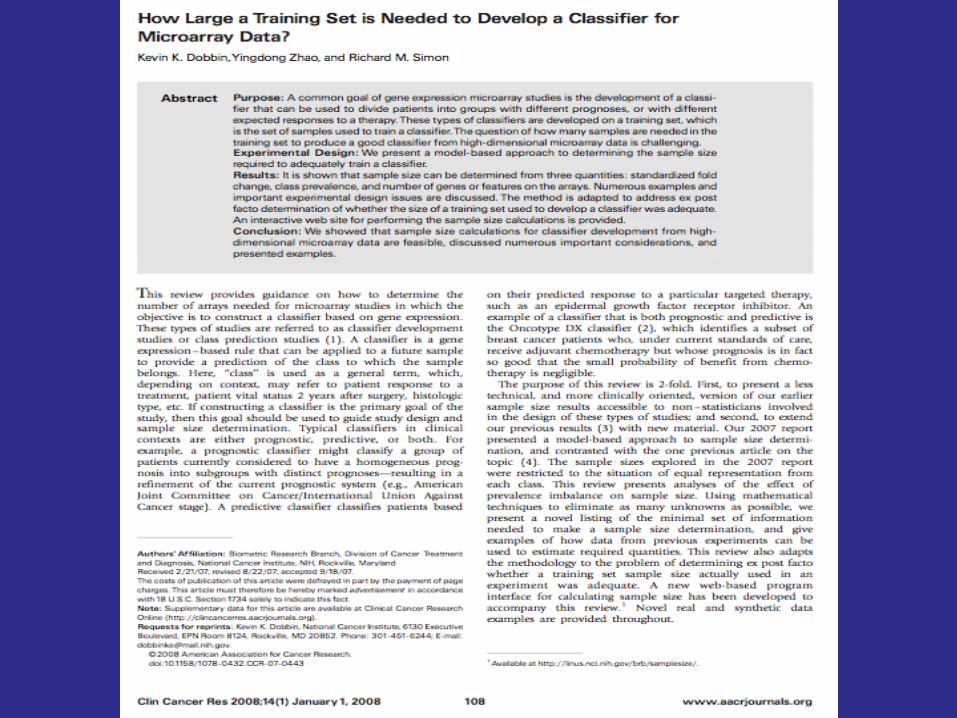
Should re-think whether to develop the drug
Larger sample size required Dobbin, Zhao, Simon, Clinical Ca Res 14:108, 2008.
Use of archived samples from previous negative phase III trial
Use of large disease specific panel of molecularly characterized human tumor cell lines to identify predictive marker
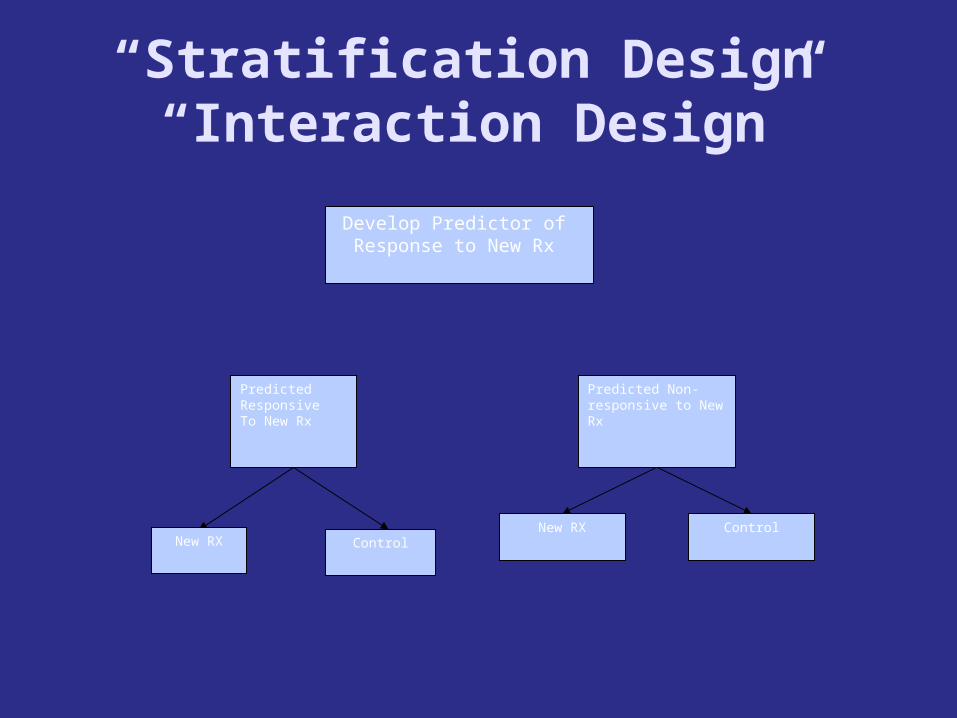
“Stratification Design”“Interaction Design”
Develop Predictor of Response to New Rx
Predicted Non-responsive to New Rx
Predicted ResponsiveTo New Rx
ControlNew RX Control
New RX
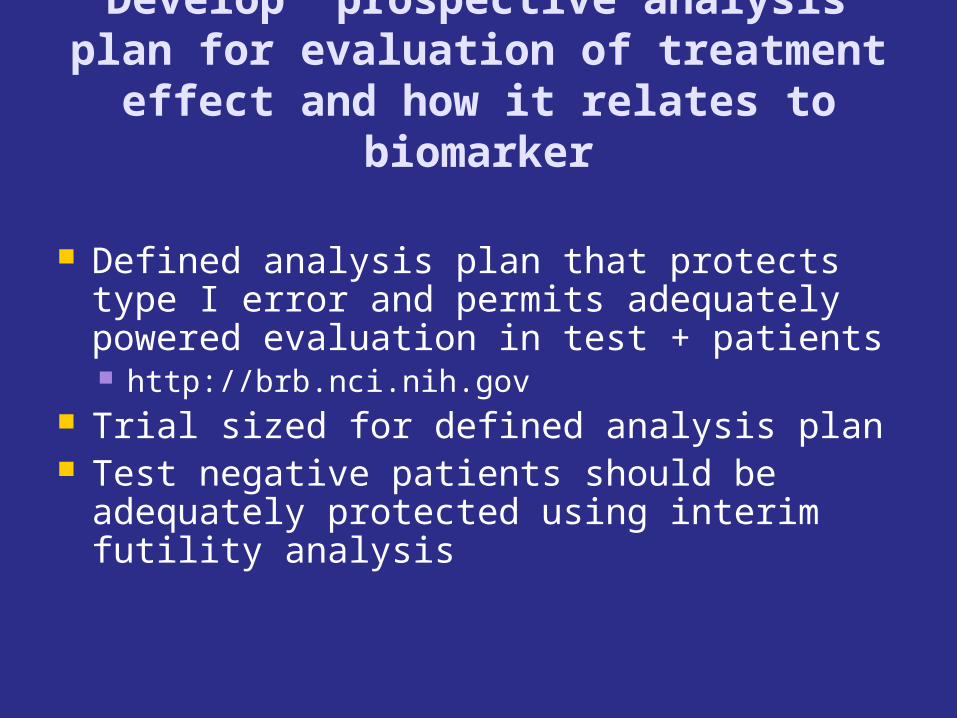
Develop prospective analysis plan for evaluation of treatment
effect and how it relates to biomarker
Defined analysis plan that protects type I error and permits adequately powered evaluation in test + patients http://brb.nci.nih.gov
Trial sized for defined analysis plan Test negative patients should be adequately protected using interim futility analysis

Fallback Analysis Plan Test average treatment effect at reduced level p0
If significant claim broad effectiveness If overall effect is not significant, test treatment effect in marker + subset at level .05-p0
If significant claim effectiveness for marker + subset
Claim of significance for marker + subset should not require either Overall significance Significant interaction 67
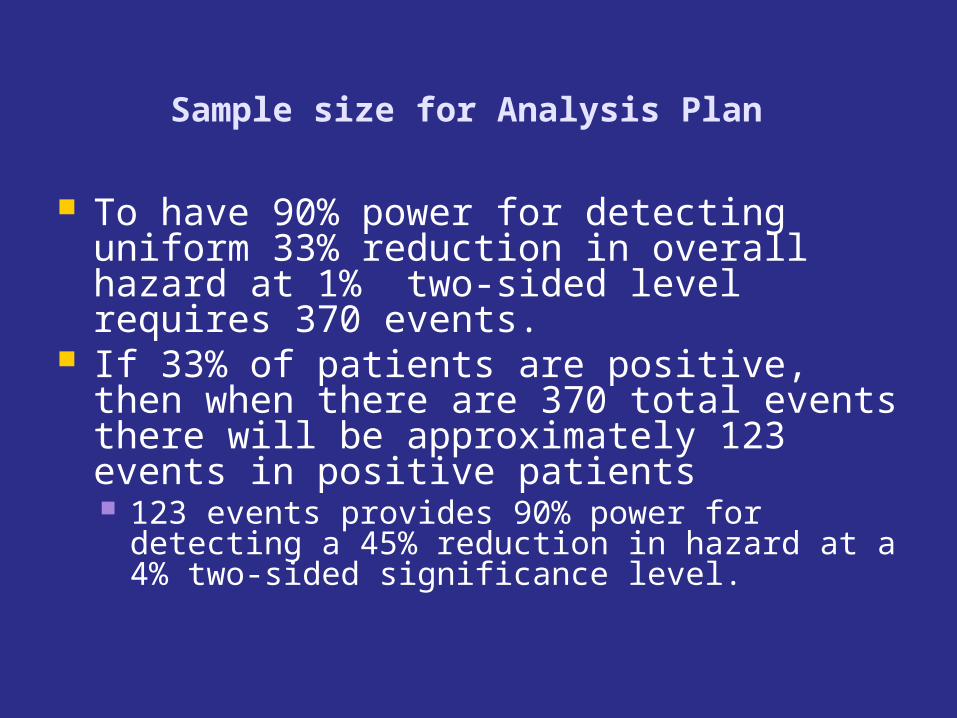
Sample size for Analysis Plan
To have 90% power for detecting uniform 33% reduction in overall hazard at 1% two-sided level requires 370 events.
If 33% of patients are positive, then when there are 370 total events there will be approximately 123 events in positive patients 123 events provides 90% power for detecting a 45% reduction in hazard at a 4% two-sided significance level.


treatment effect in test + patients
treatment effect in test - patients
Two-point priors for and with values {0,*}

Pr[ 0] p00
Pr[ 0 | *] r1
Pr[ 0 | *] r2
Strong confidence in test: Small r2 and large r1
Weak confidence in test: Small r2 and small r1
p00 selected to control type I error rates

Bayesian Two-Stage DesignRCT With Single Binary Marker
73
=treatment effect in test + stratum
=treatment effect in test - stratum
Four point prior for ( , ) (0,0),(*,0),(0,*),(*,*)
Prior paramaterized by
Pr[ 0], Pr[ 0 | *], Pr[ 0 | *]
Interim futility analysis for test - stratum and for study
after first stage based on Pr[ 0 | D1] and Pr[ 0 | D1]
Final analysis: Test Ho : 0 and H0 : 0 based on
posterior probabilities.
Type I errors controlled by cut-off on threshold on posterior
probabilities for rejection of hypotheses
Type II errors controlled by sample size as determined by simulation
Developed for time-to-event data.

Adaptive Threshold Design
Randomized clinical trial of E vs C Single candidate biomarker with K candidate cut-points
Entry not restricted by biomarker value
“Adaptive” in the sense that no pre-specified cut-point is provided. Eligibility is not changed during trial based on interim results
75

Final Analysis in Two Parts
Test global null hypothesis that treatment E is equivalent to C in efficacy for all biomarker values
If global null hypothesis is rejected, develop information about how effectiveness of E depends on biomarker value
76

lk likelihood ratio of treatment effect for B bk
l* max l1, l2 , ..., lK
Test strong null hypothesis:
Approximate null distribution of l* by permuting
treatment labels, re-calculating {lk }and l* and repeating
for 1000 permutations
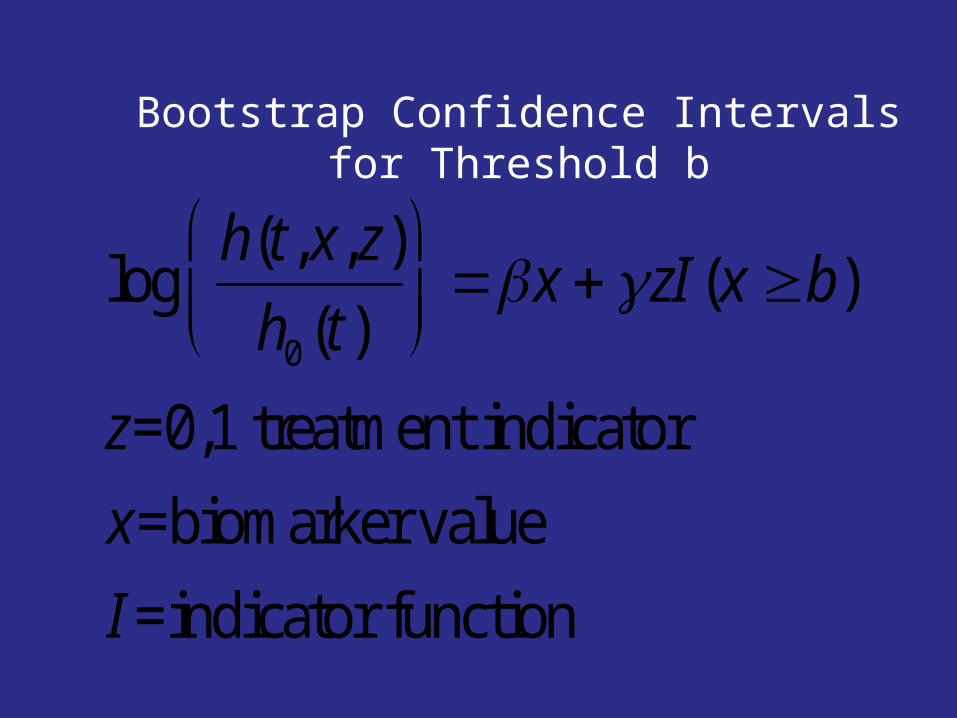
logh(t, x, z)
h0 (t)
x zI(x b)
z=0,1 treatment indicator
x=biomarker value
I=indicator function
Bootstrap Confidence Intervals for Threshold b
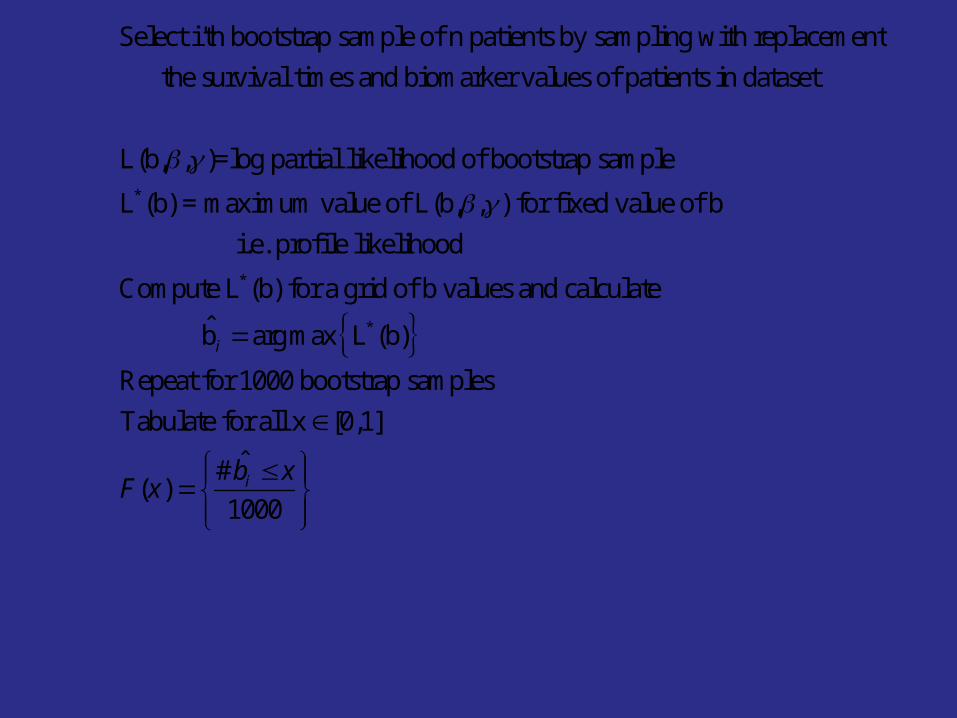
Select i'th bootstrap sample of n patients by sampling with replacement
the survival times and biomarker values of patients in dataset
L(b,,)=log partial likelihood of bootstrap sample
L*(b) = maximum value of L(b,,) for fixed value of b
i.e. profile likelihood
Compute L*(b) for a grid of b values and calculate
bi arg max L*(b) Repeat for 1000 bootstrap samples
Tabulate for all x [0,1]
F(x) # bi x
1000
The confidence interval for the cut-point can be used to inform treatment decisions for future
patients

For patient with marker value x
Pr[patient benefits from new rx] Pr[x b]
F(x)
F(x) Cumulative distribution of b from bootstrap


Key Points It can be beneficial not to define a cut-point for the biomarker prior to conducting the phase III clinical trial The phase II database may be inadequate with regard to number of cases, lack of control group, different endpoint
The only thing that stands in the way of a more informative phase III trial is the aspirin paradigm that the ITT analysis of the eligible population is required to serve as a basis for approval 83
The Biology is Often Not So The Biology is Often Not So ClearClear
Cancer biology is complex and it is Cancer biology is complex and it is not always possible to have the not always possible to have the right single predictive classifier right single predictive classifier identified with an appropriate cut-identified with an appropriate cut-point by the time the phase 3 trial point by the time the phase 3 trial of a new drug is ready to start of a new drug is ready to start accrualaccrual

85
With a Small Number of With a Small Number of Candidate BiomarkersCandidate BiomarkersBiomarker Selection Biomarker Selection
DesignDesignBased on Adaptive Threshold Based on Adaptive Threshold
DesignDesignW Jiang, B Freidlin & R SimonW Jiang, B Freidlin & R Simon
JNCI 99:1036-43, 2007JNCI 99:1036-43, 2007
Biomarker Selection DesignBiomarker Selection Design
Have identified K candidate Have identified K candidate biomarkers Bbiomarkers B11 , …, B , …, BKK thought to thought to be predictive of patients be predictive of patients likely to benefit from T likely to benefit from T relative to Crelative to C
Cut-points not necessarily Cut-points not necessarily established for each biomarkerestablished for each biomarker
Eligibility not restricted by Eligibility not restricted by candidate markerscandidate markers

Marker Selection Design

Designs When there are Many Candidate Markers and Multi-marker Classifiers are of
Interest


Adaptive Signature Design

The indication classifier is not a binary classifier of whether a patient has good prognosis or poor prognosis
It is a “two sample classifier” of whether the prognosis of a patient on E is better than the prognosis of the patient on C
The indication classifier maps the vector of candidate covariates into {E,C} indicating which treatment is predicted superior for that patient
The classifier need not use all the covariates but variable selection must be determined using only the training set Variable selection may be based on selecting variables with apparent interactions with treatment, with cut-off for variable selection determined by cross-validation within training set for optimal classification
The indication classifier can be a probabilistic classifier
92
93
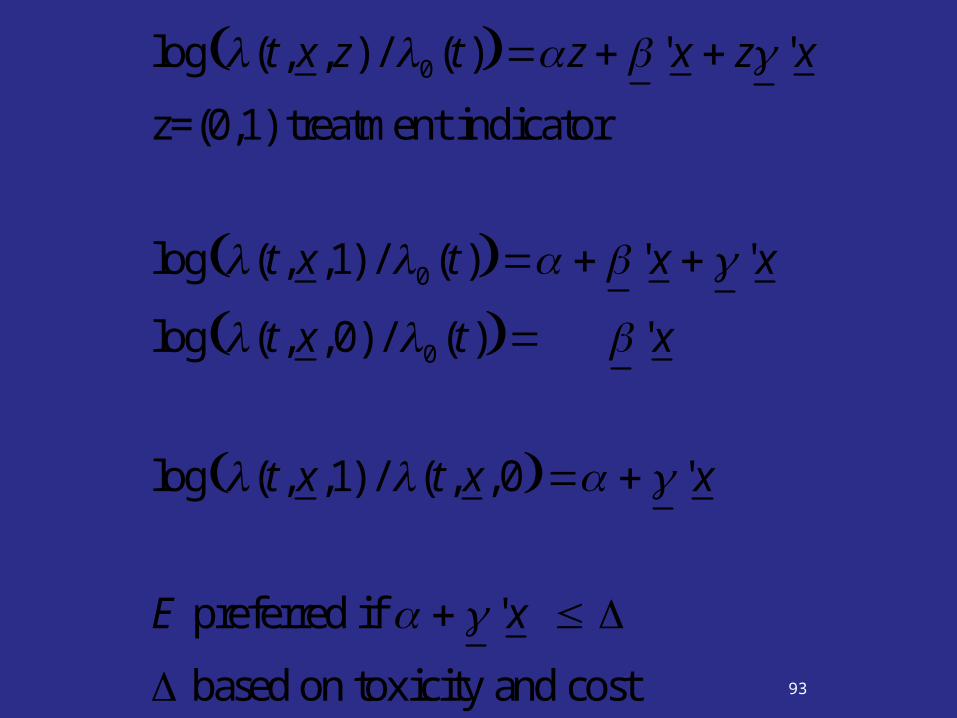
log (t, x, z) / 0 (t) z ' x z ' x
z=(0,1) treatment indicator
log (t, x,1) / 0 (t) ' x ' x
log (t, x,0) / 0 (t) ' x
log (t, x,1) / (t, x,0 ' x
E preferred if ' x
based on toxicity and cost

94
' x : N ( ' x, 2 (x))
2 (x) (1, x)'(1, x)
Pr E preferred Pr ' x
Pr ' x ' x
(x)
' x
(x)
B ' x
(x)
95
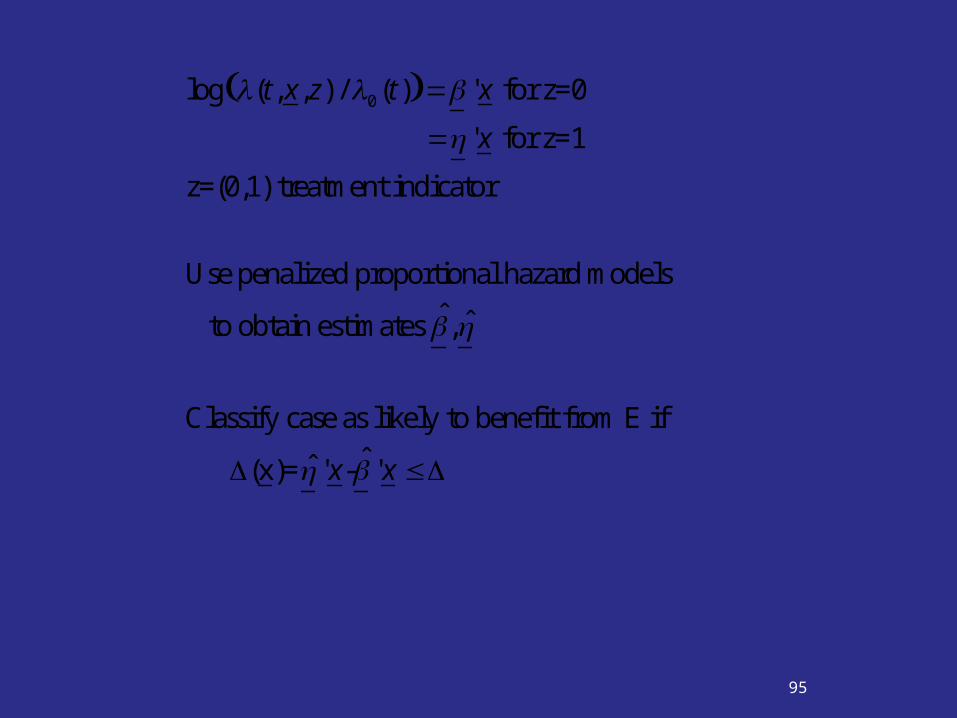
log (t, x, z) / 0 (t) ' x for z=0
' x for z=1
z=(0,1) treatment indicator
Use penalized proportional hazard models
to obtain estimates ,
Classify case as likely to benefit from E if
(x)= ' x- ' x
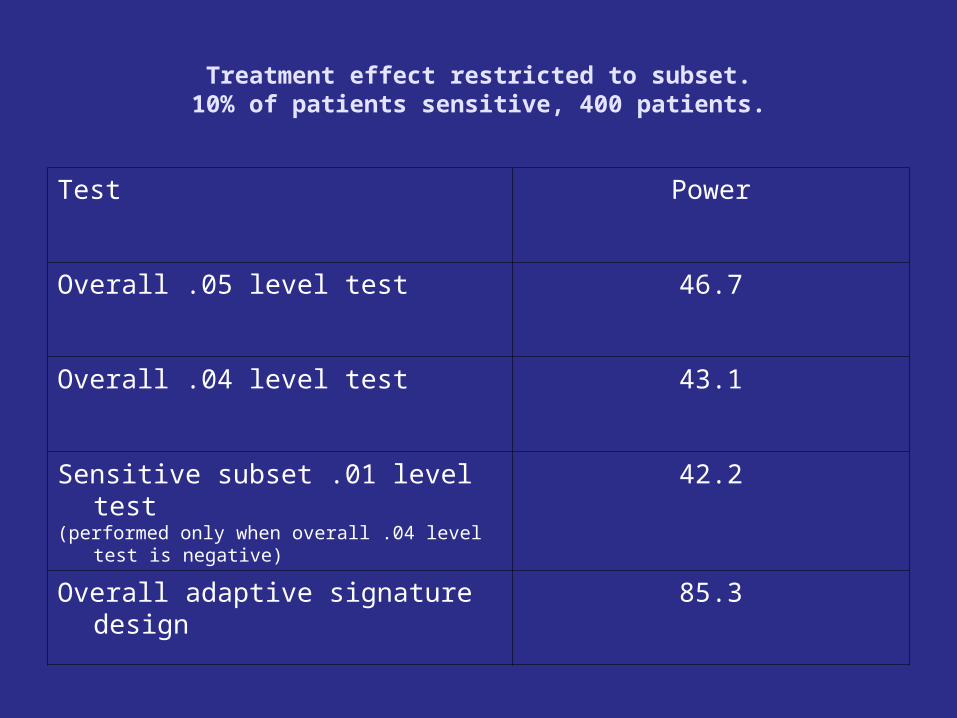
Treatment effect restricted to subset.10% of patients sensitive, 400 patients.
Test Power
Overall .05 level test 46.7
Overall .04 level test 43.1
Sensitive subset .01 level test(performed only when overall .04 level test is negative)
42.2
Overall adaptive signature design 85.3

Overall treatment effect, no subset effect. 400 patients
Test Power
Overall .05 level test 74.2
Overall .04 level test 70.9
Sensitive subset .01 level test 1.0
Overall adaptive signature design 70.9

This approach can be used with any set of candidate predictors
The approach can also be used to identify the subset of patients who don’t benefit from the new treatment when the overall ITT comparison is significant

Key Idea
Replace multiple significance testing by development of one indication classifier and obtain unbiased estimates of the properties of that classifier if used on future patients


• At the conclusion of the trial randomly partition the patients into K approximately equally sized sets P1 , … , PK
• Let D-i denote the full dataset minus data for patients in Pi
• Omit patients in P1
• Apply the defined algorithm to analyze the data in D-1 to obtain a classifier M-1
• Classify each patient j in P1 using model M-1
• Record the treatment recommendation E or C

• Repeat the above steps for all K loops of the cross-validation (develop classifier from scratch in each loop and classify omitted patients)
• When cross-validation is completed, all patients have been classified once as what their optimal treatment is predicted to be

• Let S denote the set of patients for whom treatment E is predicted optimal
• Compare outcomes for patients in S who actually received E to those in S who actually received C
• Compute Kaplan Meier curves of those receiving E and those receiving C
• Let z = standardized log-rank statistic

Test of Significance for Effectiveness of E vs C
• Compute statistical significance of z by randomly permuting treatment labels and repeating the entire cross-validation procedure to obtain a new set S’ and a new logrank statistic z’
• Do this 1000 or more times to generate the permutation null distribution of treatment effect for the patients in S

• The size of the E vs C treatment effect for the indicated population is (conservatively) estimated by the Kaplan Meier survival curves of E and of C in S

Cross-Validated Adaptive Signature Design
• Define indication classifier development algorithm A
• Apply algorithm to full dataset to develop indication classifier for use in future patients M(x;A,P)
• Using K fold cross validation
• Classify patients in test sets based on classifiers developed in training sets; e.g. yi=M(xi;A,P-i)
• S={i : yi = E}
• Compare E to C in S and estimate size of treatment effect
• is an estimate of the size of the treatment effect
for future patients with M(x;A,P)=E
(S)
(S)

Cross-Validated Adaptive Signature Design
• Approximate null distribution of
• Permute treatment labels
• Repeat complete cross-validation procedure
• Generate permutation distribution of the
values for permuted data
• Test null hypothesis that the treatment effect in classifier positive patients is null using as test statistic cross-validated estimate of treatment effect in positive patients
(S)
(S ')

70% Response to E in Sensitive Patients25% Response to E Otherwise
25% Response to C30% Patients Sensitive
ASD CV-ASD
Overall 0.05 Test 0.830 0.838
Overall 0.04 Test 0.794 0.808
Sensitive Subset 0.01 Test
0.306 0.723
Overall Power 0.825 0.918

25% Response to T 25% Response to CNo Subset Effect
ASD CV-ASD
Overall 0.05 Test 0.047 0.056
Overall 0.04 Test 0.04 0.048
Sensitive Subset 0.01 Test
0.001 0
Overall Power 0.041 0.048


The Objectives of a Phase III Clinical Trial
• Test the global null hypothesis that the new treatment E is uniformly ineffective relative to a control C for all patients while preserving the type I error of the study
• If the global null hypothesis is rejected, develop an internally validated labeling indication for informing physicians in their decisions about which patients they treat with the drug.
• Not a hypothesis testing problem

Prediction Based Clinical Trials
• We can evaluate our methods for analysis of clinical trials in terms of their effect on patient outcome via informaing therapeutic decision making

KM (t*; E, S) estimated dfs at t* for patients in S on rx E
KM (t*;C, S) estimated dfs at t* for patients in S on rx C
KM (t*; E, S ) estimated dfs at t* for patients in S on rx E
KM (t*;C, S ) estimated dfs at t* for patients in S on rx C
=proportion of patients in S
Expected t* Year DFS Using Indication ClassifierKM (t*; E, S) (1 )KM (t*;C, S )

Expected t* Year DFS With
Conventional Analysis
KM (t*; E, P) if poverall 0.05
KM (t*;C, P) otherwise
Prediction Based Clinical Trials
• By switching from subset analysis to development of indication classifiers and by using re-sampling and careful prospective planning, we can more adequately evaluate new methods for analysis of clinical trials in terms of improving patient outcome by informing therapeutic decision making
• By applying the classifier development algorithm to the full dataset D, an indication classifier is developed for informing how future patients should be treated
• M(x;A, D) for all x vectors.
• The cross validation merely serves to
• provide an estimate of the treatment effect for future patients with M(x;A, D)=E
• and to provide a significance test of the null hypothesis that the treatment effect is zero
• The stability of the indication classifier M(x;A,D)can be evaluated by examining the consistency of classifications M(xi;A, B) for bootstrap samples B from D.

• Although there may be less certainty about exactly which types of patient benefit from E relative to C, classification may be better than for standard clinical trials in which all patients are classified based on results of testing the single overall null hypothesis
• This approach can also be used to identify the subset of patients who don’t benefit from a new regimen C in cases where E is superior to C overall at the first stage of analysis. The patients in SC= D – S are not predicted to benefit from E. Survivals of E vs C can be examined for patients in that subset and a permutation based confidence interval for the hazard ratio calculated.
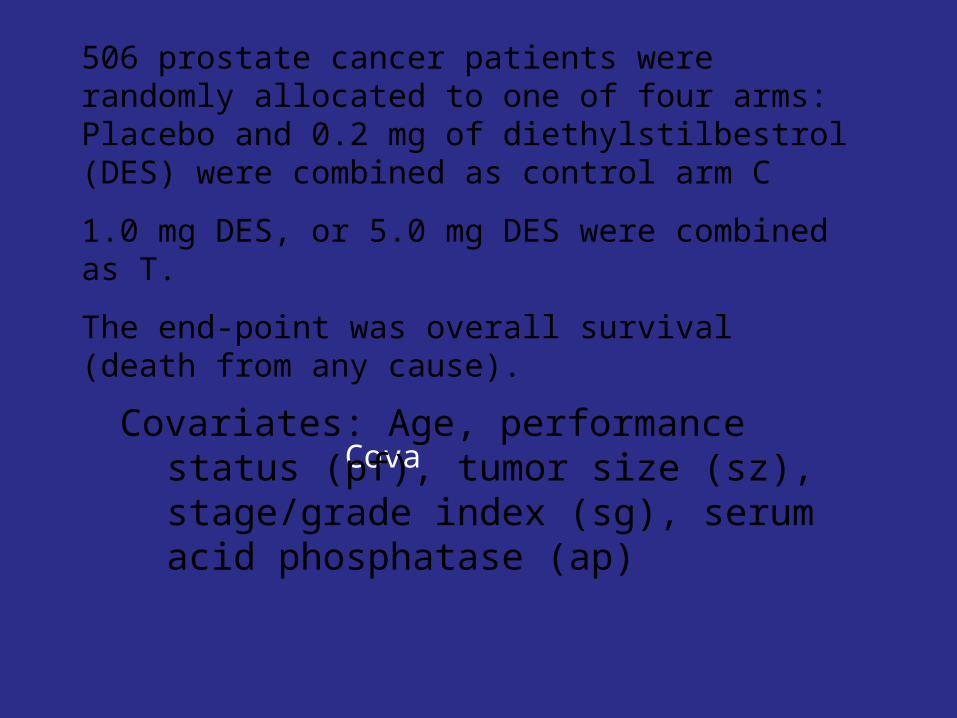
506 prostate cancer patients were randomly allocated to one of four arms: Placebo and 0.2 mg of diethylstilbestrol (DES) were combined as control arm C
1.0 mg DES, or 5.0 mg DES were combined as T.
The end-point was overall survival (death from any cause).
CovaCovariates: Age, performance
status (pf), tumor size (sz), stage/grade index (sg), serum acid phosphatase (ap)

Figure 1: Overall analysis. The value of the log-rank statistic is 2.9 and the corresponding p-value is 0.09. The new treatment thus shows no benefit overall at the
0.05 level.

Figure 2: Cross-validated survival curves for patients predicted to benefit from the new treatment. log-rank
statistic = 10.0, permutation p-value is .002

Figure 3: Survival curves for cases predicted not to benefit from the new treatment. The value of the log-rank
statistic is 0.54.


Marker Strategy Design
Marker Strategy Design
Generally very inefficient because some (many) patients in both randomization groups receive the same treatment
Often poorly informative Not measuring marker in control group means that merits of complex marker treatment strategies cannot be dissected

Validation of Predictive BiomarkerStratification Design
Develop Predictor of Response to New Rx
Predicted Non-responsive to New Rx
Predicted ResponsiveTo New Rx
ControlNew RX Control
New RX

Prospective-Retrospective Study

In some cases a trial with optimal structure for evaluating a new
biomarker will have been previously performed and will have pre-
treatment tumor specimens archived Under certain conditions, a focused analysis based on specimens from the previously conducted clinical trial can provide highly reliable evidence for the medical utility of a prognostic or predictive biomaker
In some cases, it may be the only way of obtaining high level evidence

Prospective-
Retrospective Design

Conclusions of Simon, Paik, Hayes
Claims of medical utility for prognostic and predictive biomarkers based on analysis of archived tissues can have either a high or low level of evidence depending on several key factors.
These factors include the analytical validation of the assay, the nature of the study from which the specimens were archived, the number and condition of the specimens, and the development prior to assaying tissue of a focused written plan for analysis of a completely specified biomarker classifier.
Studies using archived tissues from prospective clinical trials, when conducted under ideal conditions and independently confirmed can provide the highest level of evidence.
Traditional analyses of prognostic or predictive factors, using non analytically validated assays on a convenience sample of tissues and conducted in an exploratory and unfocused manner provide a very low level of evidence for clinical utility.

Guidelines Proposed by Simon, Paik, Hayes
Prospective-retrospective design
1. Adequate archived tissue from an appropriately designed phase III clinical trial must be available on a sufficiently large number of patients that the appropriate biomarker analyses have adequate statistical power and that the patients included in the evaluation are clearly representative of the patients in the trial.
2. The test should be analytically validated for use with archived tissue.
3. Testing should be performed blinded to the clinical data.
4. The analysis plan for the biomarker evaluation should be completely specified in writing prior to the performance of the biomarker assays on archived tissue and should be focused on evaluation of a single completely defined classifier.
5. The results should be validated using specimens from a similar, but separate study involving archived tissues.

Acknowledgements
Kevin Dobbin Boris Freidlin Wenyu Jiang Aboubakar Maitournam Shigeyuki Matsui Michael Radmacher Jyothi Subramanian Yingdong Zhao