cancer copyright © 2018 mek inhibition induces …...yohe et al., sci. transl. med. 10, eaan4470...
TRANSCRIPT
Yohe et al., Sci. Transl. Med. 10, eaan4470 (2018) 4 July 2018
S C I E N C E T R A N S L A T I O N A L M E D I C I N E | R E S E A R C H A R T I C L E
1 of 17
C A N C E R
MEK inhibition induces MYOG and remodels super-enhancers in RAS-driven rhabdomyosarcomaMarielle E. Yohe1,2*†, Berkley E. Gryder1†, Jack F. Shern2, Young K. Song1, Hsien-Chao Chou1, Sivasish Sindiri1, Arnulfo Mendoza2, Rajesh Patidar1, Xiaohu Zhang3, Rajarashi Guha3‡, Donna Butcher4, Kristine A. Isanogle5, Christina M. Robinson5, Xiaoling Luo6, Jin-Qiu Chen6, Ashley Walton1, Parirokh Awasthi5, Elijah F. Edmondson4, Simone Difilippantonio5, Jun S. Wei1, Keji Zhao7, Marc Ferrer3, Craig J. Thomas3, Javed Khan1*
The RAS isoforms are frequently mutated in many types of human cancers, including PAX3/PAX7 fusion-negative rhabdomyosarcoma. Pediatric RMS arises from skeletal muscle progenitor cells that have failed to differentiate normally. The role of mutant RAS in this differentiation blockade is incompletely understood. We demonstrate that oncogenic RAS, acting through the RAF–MEK [mitogen-activated protein kinase (MAPK) kinase]–ERK (extra-cellular signal–regulated kinase) MAPK effector pathway, inhibits myogenic differentiation in rhabdomyosarcoma by repressing the expression of the prodifferentiation myogenic transcription factor, MYOG. This repression is mediated by ERK2-dependent promoter-proximal stalling of RNA polymerase II at the MYOG locus. Small-molecule screening with a library of mechanistically defined inhibitors showed that RAS-driven RMS is vulnerable to MEK inhibition. MEK inhibition with trametinib leads to the loss of ERK2 at the MYOG promoter and releases the tran-scriptional stalling of MYOG expression. MYOG subsequently opens chromatin and establishes super-enhancers at genes required for late myogenic differentiation. Furthermore, trametinib, in combination with an inhibitor of IGF1R, potently decreases rhabdomyosarcoma cell viability and slows tumor growth in xenograft models. Therefore, this combination represents a potential therapeutic for RAS-mutated rhabdomyosarcoma.
INTRODUCTIONMore than 30% of all human malignancies, including pancreatic, colorectal and lung cancer, head and neck cancer, melanoma, and hematologic malignancies, are driven by mutant RAS isoforms (1). Despite this knowledge, effective therapies targeting oncogenic muta-tions in RAS isoforms have yet to be designed. Current attempts to therapeutically target RAS are focused on inhibition of the predominant downstream signaling pathways that are important for maintenance of cell growth and proliferation, such as the RAF–MEK [mitogen- activated protein kinase (MAPK) kinase]–ERK (extracellular signal– regulated kinase) MAPK pathway and the phosphatidylinositol 3-kinase (PI 3-kinase)–AKT–mammalian target of rapamycin (mTOR) pathway (2). Although clinical responses to inhibitors targeting these pathways are frequent, the durability of the response is limited by incomplete apoptosis and the subsequent development of resistance to the targeted agent (3, 4). In addition to its well-characterized roles in malignant transformation and tumor progression, RAS plays a cell type–specific role in cellular differentiation. Expression of on-cogenic RAS isoforms inhibits differentiation of neutrophil precursors
(5), thyroid epithelial cells (6), and skeletal muscle cells (7). The mech-anism by which oncogenic RAS affects differentiation is incompletely understood, but restoration of differentiation represents a potential therapy for RAS-mutated cancers.
PAX3/7 fusion-negative rhabdomyosarcoma (FN-RMS) arises from skeletal muscle precursors that have failed to differentiate normally despite the expression of the myogenic master transcription factor MYOD1. The most common somatic mutations in FN-RMS tumors are oncogenic changes in the RAS isoforms (NRAS, HRAS, or KRAS) at near equivalent frequency (8, 9). The distribution of RAS mutations in FN-RMS is unusual because, among the human RAS-driven tumors, only multiple myeloma has a high frequency of mutation of more than one RAS isoform (2). Clonal analysis suggests that RAS muta-tions occur early in the development of RMS (10), and functional studies confirm that RAS mutation is a driving event. For example, growth of RD (an FN-RMS cell line with an activating mutation in NRAS) is dependent on the RAS-RAF-MEK-ERK MAPK signaling pathway (11). Animal models of FN-RMS confirm a central role for aberrant RAS activity in FN-RMS tumorigenesis (12–19). In addi-tion, a high-throughput small-molecule screen for myogenic differ-entiating agents in RD identified a MEK inhibitor (20), although the mechanism of the differentiation was not reported. The mechanistic link between aberrant RAS activity and an inability to implement a differentiation program has not previously been described in FN-RMS.
Here, we use a combination of high-throughput drug screening and genome-wide approaches to demonstrate that aberrant MAPK activity both maintains tumor cell proliferation and prevents myogenic differentiation. Suppression of the myogenic differentiation program occurs through transcriptional reprogramming driven by changes in RNA polymerase II (Pol II) activity, chromatin accessibility, histone mod-ifications, and transcription factor deposition. This transcriptional re-programming is reversed through the action of trametinib (also called
1Oncogenomics Section, Genetics Branch, National Cancer Institute, National Institutes of Health (NIH), Bethesda, MD 20892, USA. 2Pediatric Oncology Branch, National Cancer Institute, NIH, Bethesda, MD 20892, USA. 3Division of Preclinical Innovation, National Center for Advancing Translational Sciences, NIH, Bethesda, MD 20892, USA. 4Pathology/Histotechnology Laboratory, Leidos Biomedical Research Inc., Frederick National Laboratory for Cancer Research, NIH, Frederick, MD 21702, USA. 5Laboratory Animal Sciences Program, Leidos Biomedical Research Inc., Frederick National Laboratory for Cancer Research, NIH, Frederick, MD 21701, USA. 6Collabo-rative Protein Technology Resource, National Cancer Institute, NIH, Bethesda, MD 20892, USA. 7Systems Biology Center, National Heart Lung and Blood Institute, NIH, Bethesda, MD 20892, USA.*Corresponding author. Email: [email protected] (M.E.Y.); [email protected] (J.K.)†These authors contributed equally to this work.‡Present address: Vertex Pharmaceuticals, Boston, MA 02210, USA.
Copyright © 2018 The Authors, some rights reserved; exclusive licensee American Association for the Advancement of Science. No claim to original U.S. Government Works
by guest on February 21, 2020
http://stm.sciencem
ag.org/D
ownloaded from

Yohe et al., Sci. Transl. Med. 10, eaan4470 (2018) 4 July 2018
S C I E N C E T R A N S L A T I O N A L M E D I C I N E | R E S E A R C H A R T I C L E
2 of 17
GSK1120212), a U.S. Food and Drug Administration–approved, second-generation inhibitor of MEK1/2 (21). We further show that trametinib, in combination with an inhibitor of IGF1R (BMS-754807), suppresses tumor growth in xenograft models of RAS- mutated RMS, providing a strong rationale for the clinical testing of this drug combination in patients with FN-RMS driven by onco-genic RAS.
RESULTSOncogenic RAS blocks myoblast differentiation through the MAPK pathwayConstitutively active mutants of NRAS and HRAS block differentia-tion in C2C12 mouse myoblasts (7), but the RAS effector pathway responsible for this block has not been elucidated. To determine which pathway is critical for maintenance of the differentiation block, we created stable C2C12 lines expressing constitutively active versions of three RAS effectors: BRAF V600E, myristoylated AKT (Myr-AKT), and RALA Q75L (fig. S1A). Expression of BRAF V600E blocked myogenic differentiation, as evidenced by reduced differentiation and fusion indices in C2C12 myoblasts (Fig. 1A). These results corroborate previous reports in which expression of BRAF, activated by either truncation or constitutive membrane association, in myoblasts pre-vented terminal differentiation (22–25). Expression of Myr-AKT enhanced C2C12 differentiation, which is consistent with the fact that treatment of myoblasts with inhibitors of AKT or its activator, PI 3- kinase, blocks differentiation (26, 27), whereas loss of PTEN, a negative regulator of PI 3-kinase, increases differentiation and in-duces skeletal muscle hypertrophy (28). Expression of Myr-AKT also induced myocyte hypertrophy as shown by increased myocyte width. Expression of constitutively active RALA also enhanced C2C12 dif-ferentiation (Fig. 1A), in contrast to previous reports in which ex-pression of a RAS mutant that can engage only the RALA activator, RALGDS, prevents myoblast differentiation (29). These results high-light the centrality of the MAPK pathway in the establishment of a myoblast differentiation block.
Oncogenic RAS is necessary for FN-RMS cell survivalAs detailed above, mutant RAS is an important oncogenic driver in FN-RMS. Several of the established human FN-RMS cell lines cur-rently in use have oncogenic mutations in one of the RAS isoforms (30). We tested whether expression of oncogenic RAS was necessary for the survival of these cell lines. Stable knockdown of NRAS expression in RD, which expresses NRAS Q61H, using short hair-pin RNA led to decreased cell viability in a clonogenic assay (fig. S1B). These results are consistent with a previous study that showed the antiproliferative effects of decreased NRAS expression in RD using cell titer assays (11). We extended the analysis to show that decreased NRAS expression resulted in the induction of cell death by apoptosis, as determined by immunoblot for cleaved poly(adenosine 5′- diphosphate–ribose) polymerase and cleaved caspase-3, in RD. In addition, knock down of NRAS expression de-creased levels of phospho-ERK, suggesting that the RAF-MEK-ERK MAPK pathway is activated down stream of mutant NRAS in RD (fig. S1B). Similarly, stable knockdown of HRAS expression in SMS-CTR, which expresses HRAS Q61K, led to decreased cell viability, induction of apoptosis, and decreased phospho-ERK (fig. S1C). These results confirm the dependency of FN-RMS cell lines on ex-pression of oncogenic NRAS and HRAS.
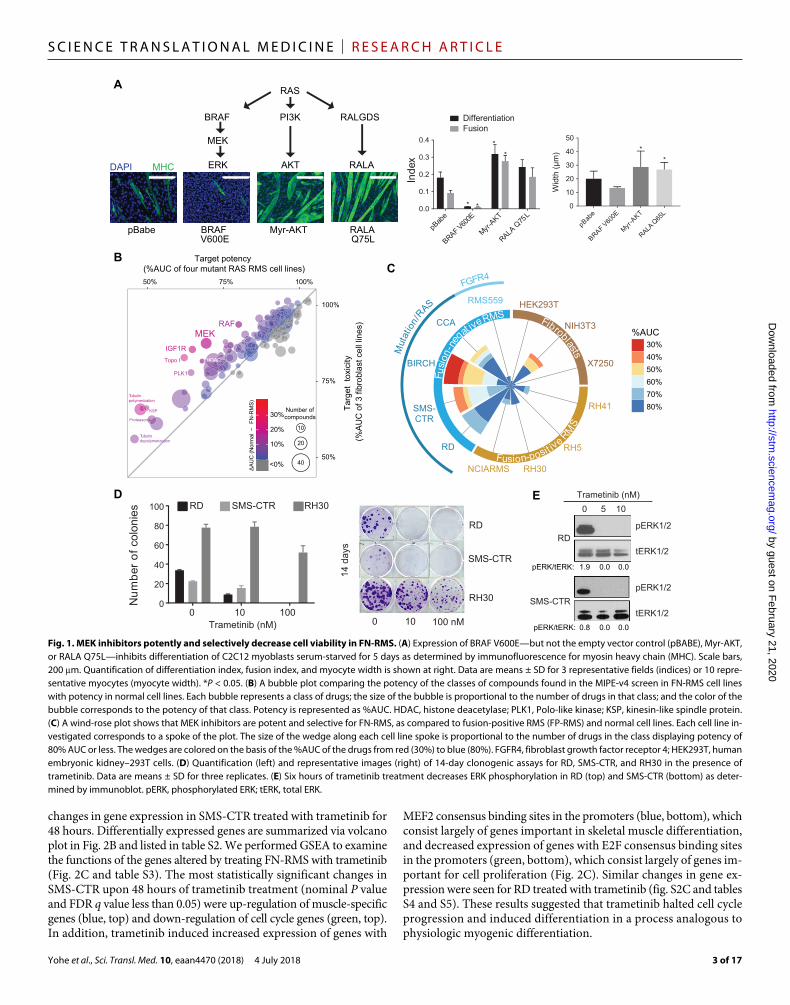
MEK inhibitors potently and selectively decrease FN-RMS viabilityTo identify pathways of vulnerability in FN-RMS in an unbiased manner, we performed a dose-response drug screen for cell viability using a panel of 1912 drugs (31). In this analysis, 12 cell lines were used: 4 PAX3–FP-RMS cell lines, 5 FN-RMS cell lines (4 of which express mutant RAS), and 3 nontransformed cell lines. To identify classes of drugs that selectively inhibited viability of FN-RMS cell lines but not the FP-RMS or nontransformed cell lines, we grouped the compounds by target subcategory and obtained a measure of the in vitro toxicity for each target subcategory in the three categories of cell lines. The potency of a compound was defined by its percent area under the cell viability dose-response curve (%AUC) (table S1 and Fig. 1B). MEK inhibitors (P = 0.000728), IGF1R inhibitors (P = 0.00158), and topoisomerase I inhibitors (P = 0.000724) were selec-tive for RAS-mutated RMS as compared to the nontransformed cell lines. Of these classes of drugs, only the MEK inhibitors were selective for RAS-mutated RMS as compared to FP-RMS (P = 1.25 × 10⁻⁵), and therefore, this class was chosen for further study. A summary of the cell viability results for the MEK inhibitors across all the cell lines tested is shown via wind-rose plot in Fig. 1C. The MEK inhibitors as a class were potent in RAS-mutated FN-RMS cell lines, especially BIRCH and SMS-CTR, whereas the RMS559 cell line, which lacks mutant RAS but harbors a fibroblast growth factor receptor 4 mutation (V550L), was insensitive. In addition, MEK inhibitors had minimal potency in FP-RMS or the human fibroblast cell lines. Dose-response curves for each of the MEK1/2 inhibitors included in the screen are shown in fig. S1D.
Trametinib, a specific, non–adenosine 5′-triphosphate competitive allosteric inhibitor of MEK1/2, was the most consistently effective MEK inhibitor in FN-RMS cell lines, with submicromolar median inhibitory concentration (IC50) values in SMS-CTR, BIRCH, and RD but micromolar IC50 values in the FP-RMS cell lines (RH30, RH4, and RH5) (fig. S1D). We confirmed this result of the high-throughput screen by showing that trametinib decreased cell viability in RD and SMS-CTR but not in RH30 in a 14-day clonogenic assay (Fig. 1D). Trametinib treatment of FN-RMS cells in vitro inhibited phosphoryla-tion of the MEK targets, ERK1/2 (Fig. 1E); however, this inhibition of phosphorylation is short-lived, with rebound ERK phosphoryla-tion observed in SMS-CTR treated with 100 nM trametinib in as few as 24 hours (fig. S1E).
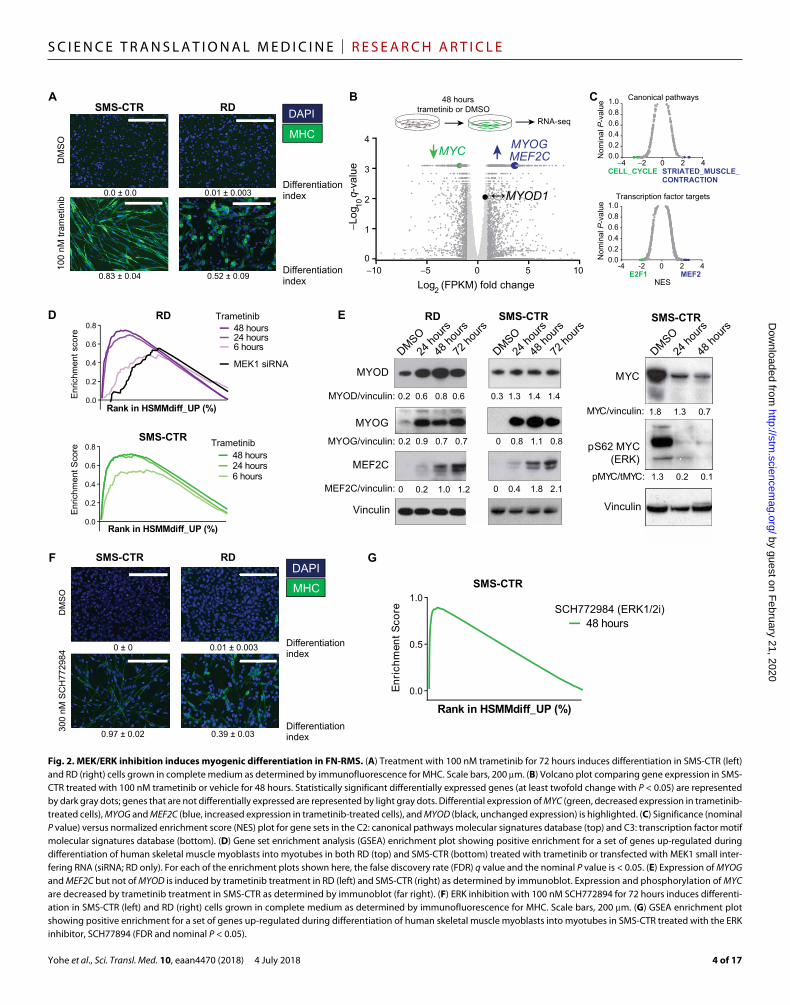
MEK inhibition induces differentiation in FN-RMSMEK inhibition with trametinib in melanoma cells is largely cytostatic (2). Cell cycle analysis revealed that, as expected, trametinib treatment induced G1 arrest in RD and SMS-CTR (fig. S2A, top). This growth arrest is associated with an induction of p21 expression, consistent with previous results in RD cells using the MEK inhibitor, UO126 (fig. S2A, bottom) (32). Because MAPK signaling inhibits myoblast differentiation (Fig. 1A), we hypothesized that inhibition of this path-way with trametinib in FN-RMS cells would lead to differentiation of FN-RMS cells. In accordance with this hypothesis, we detected MHC after 48 hours of trametinib treatment in SMS-CTR and RD (Fig. 2A), suggesting differentiation via a myogenic pathway. Trametinib induced differentiation in additional RAS-mutated RMS cell lines (BIRCH and JR1) but not in a RAS-wild type, FP-RMS cell line (RH30), suggesting that this phenomenon is specific to RAS-mutated RMS (fig. S2B).
To define the mechanism by which trametinib induces differentia-tion in FN-RMS, we used RNA sequencing (RNA-seq) to measure
by guest on February 21, 2020
http://stm.sciencem
ag.org/D
ownloaded from
Yohe et al., Sci. Transl. Med. 10, eaan4470 (2018) 4 July 2018
S C I E N C E T R A N S L A T I O N A L M E D I C I N E | R E S E A R C H A R T I C L E
3 of 17
changes in gene expression in SMS-CTR treated with trametinib for 48 hours. Differentially expressed genes are summarized via volcano plot in Fig. 2B and listed in table S2. We performed GSEA to examine the functions of the genes altered by treating FN-RMS with trametinib (Fig. 2C and table S3). The most statistically significant changes in SMS-CTR upon 48 hours of trametinib treatment (nominal P value and FDR q value less than 0.05) were up-regulation of muscle-specific genes (blue, top) and down-regulation of cell cycle genes (green, top). In addition, trametinib induced increased expression of genes with
MEF2 consensus binding sites in the promoters (blue, bottom), which consist largely of genes important in skeletal muscle differentiation, and decreased expression of genes with E2F consensus binding sites in the promoters (green, bottom), which consist largely of genes im-portant for cell proliferation (Fig. 2C). Similar changes in gene ex-pression were seen for RD treated with trametinib (fig. S2C and tables S4 and S5). These results suggested that trametinib halted cell cycle progression and induced differentiation in a process analogous to physiologic myogenic differentiation.
C B
HDAC
IGF1R
KSP
MEK
PLK1
Proteasome
RAF
Topo I
Tubulindepolymerization
Tubulinpolymerization
50%
75%
100%
50% 75% 100%
20
40
10%
20%
30%
Target potency(%AUC of four mutant RAS RMS cell lines)
Targ
et t
oxic
ity(%
AU
C o
f 3 fi
brob
last
cel
l lin
es)
10
Number of compounds
∆A
UC
(Nor
mal
− F
N-R
MS
)
<0%
D E
A RAS
BRAF PI3K RALGDS
AKT RALAMHCDAPI
SMS-CTR
0.8
0.0
pERK/tERK:
1.9
0.0
pERK1/2
tERK1/2
0 5 10Trametinib (nM)
pERK1/2
tERK1/2
RD
MEK
ERK
pBabe BRAF V600E
Myr-AKT RALA Q75L
pBabe
BRAF V600E
Myr-A
KT
RALAQ65
L0
10
20
30
40
50
Wid
th (µ
m) *
*
Num
bero
fcol
onie
s
0 10 1000
20
40
60
80
100 RD SMS-CTR RH30
14 d
ays
RD
SMS-CTR
RH30
0 10 100 nMTrametinib (nM)
DifferentiationFusion
pBab
e
BRAF V600E
Myr-AKT
RALAQ75
L0.0
0.1
0.2
0.3
0.4
Inde
x
* *
**
0.0
0.0
pERK/tERK:
%AUC30%40%50%60%70%80%
HEK293T
NIH3T3
X7250
RH41
RH5
RH30NCIARMS
RD
SMS-CTR
BIRCH
CCA
RMS559
Fibroblasts
Fusio
n-ne
gat ive RMS
Fusion- posit ive RM
S
Mut
atio
n/ RAS
FGFR4
Fig. 1. MEK inhibitors potently and selectively decrease cell viability in FN-RMS. (A) Expression of BRAF V600E—but not the empty vector control (pBABE), Myr-AKT, or RALA Q75L—inhibits differentiation of C2C12 myoblasts serum-starved for 5 days as determined by immunofluorescence for myosin heavy chain (MHC). Scale bars, 200 m. Quantification of differentiation index, fusion index, and myocyte width is shown at right. Data are means ± SD for 3 representative fields (indices) or 10 repre-sentative myocytes (myocyte width). *P < 0.05. (B) A bubble plot comparing the potency of the classes of compounds found in the MIPE-v4 screen in FN-RMS cell lines with potency in normal cell lines. Each bubble represents a class of drugs; the size of the bubble is proportional to the number of drugs in that class; and the color of the bubble corresponds to the potency of that class. Potency is represented as %AUC. HDAC, histone deacetylase; PLK1, Polo-like kinase; KSP, kinesin-like spindle protein. (C) A wind-rose plot shows that MEK inhibitors are potent and selective for FN-RMS, as compared to fusion-positive RMS (FP-RMS) and normal cell lines. Each cell line in-vestigated corresponds to a spoke of the plot. The size of the wedge along each cell line spoke is proportional to the number of drugs in the class displaying potency of 80% AUC or less. The wedges are colored on the basis of the %AUC of the drugs from red (30%) to blue (80%). FGFR4, fibroblast growth factor receptor 4; HEK293T, human embryonic kidney–293T cells. (D) Quantification (left) and representative images (right) of 14-day clonogenic assays for RD, SMS-CTR, and RH30 in the presence of trametinib. Data are means ± SD for three replicates. (E) Six hours of trametinib treatment decreases ERK phosphorylation in RD (top) and SMS-CTR (bottom) as deter-mined by immunoblot. pERK, phosphorylated ERK; tERK, total ERK.
by guest on February 21, 2020
http://stm.sciencem
ag.org/D
ownloaded from
Yohe et al., Sci. Transl. Med. 10, eaan4470 (2018) 4 July 2018
S C I E N C E T R A N S L A T I O N A L M E D I C I N E | R E S E A R C H A R T I C L E
4 of 17
A 48 hourstrametinib or DMSO
RNA-seq
Log (FPKM) fold change−10 −5 0 5 100
1
2
3
4
−Log
q
-val
ue
MYOG
MEF2CMYC
B
SMS-CTR
Rank in HSMMdiff_UP (%)0.0
0.2
0.4
0.6
0.8
24 hours48 hours
6 hours
RD
0.0
0.2
0.4
0.6
0.824 hours48 hours
6 hours
MEK1 siRNA
Rank in HSMMdiff_UP (%)
Trametinib
Trametinib
Enr
ichm
ent s
core
Enr
ichm
ent S
core
D
F
Rank in HSMMdiff_UP (%)
Enric
hmen
tSco
re
0.0
0.5
1.0SMS-CTR
SCH772984 (ERK1/2i)48 hours
G
MHC
DAPISMS-CTR RD
100
nM tr
amet
inib
DM
SO
Canonical pathways
−4 −2 0 2 40.00.20.40.60.81.0
Transcription factor targets
NES
-4 -2 0 2 40.00.20.40.60.81.0
Nom
inal
P-v
alue
Nom
inal
P-v
alue
C
CELL_CYCLE STRIATED_MUSCLE_CONTRACTION
E2F1 MEF2
MYC
pS62 MYC (ERK)
MYOD/vinculin:
MYOG/vinculin:
MEF2C/vinculin:
0.2 0.6 0.8 0.6 0.3 1.3 1.4 1.4
0.2 0.9 0.7 0.7 0 0.8 1.1 0.8
0 0.2 1.0 1.2 0 0.4 1.8 2.1
MYC/vinculin:
pMYC/tMYC:
1.8 1.3 0.7
1.3 0.2 0.1
E
MYOD
MYOG
MEF2C
DMSO24
hours
48 ho
urs
72 ho
urs
DMSO24
hours
48 ho
urs
72 ho
urs
DMSO24
hours
48 ho
ursRD SMS-CTR
VinculinVinculin
0 ± 0 0.01 ± 0.003
0.97 ± 0.02 0.39 ± 0.03
MHC
DAPISMS-CTR RD
DM
SO
300
nM S
CH
7729
84
Differentiationindex0.0 ± 0.0
0.83 ± 0.04
0.01 ± 0.003
0.52 ± 0.09Differentiationindex
↔ MYOD1
SMS-CTR
Differentiationindex
Differentiationindex
2
10
Fig. 2. MEK/ERK inhibition induces myogenic differentiation in FN-RMS. (A) Treatment with 100 nM trametinib for 72 hours induces differentiation in SMS-CTR (left) and RD (right) cells grown in complete medium as determined by immunofluorescence for MHC. Scale bars, 200 m. (B) Volcano plot comparing gene expression in SMS-CTR treated with 100 nM trametinib or vehicle for 48 hours. Statistically significant differentially expressed genes (at least twofold change with P < 0.05) are represented by dark gray dots; genes that are not differentially expressed are represented by light gray dots. Differential expression of MYC (green, decreased expression in trametinib- treated cells), MYOG and MEF2C (blue, increased expression in trametinib-treated cells), and MYOD (black, unchanged expression) is highlighted. (C) Significance (nominal P value) versus normalized enrichment score (NES) plot for gene sets in the C2: canonical pathways molecular signatures database (top) and C3: transcription factor motif molecular signatures database (bottom). (D) Gene set enrichment analysis (GSEA) enrichment plot showing positive enrichment for a set of genes up-regulated during differentiation of human skeletal muscle myoblasts into myotubes in both RD (top) and SMS-CTR (bottom) treated with trametinib or transfected with MEK1 small inter-fering RNA (siRNA; RD only). For each of the enrichment plots shown here, the false discovery rate (FDR) q value and the nominal P value is < 0.05. (E) Expression of MYOG and MEF2C but not of MYOD is induced by trametinib treatment in RD (left) and SMS-CTR (right) as determined by immunoblot. Expression and phosphorylation of MYC are decreased by trametinib treatment in SMS-CTR as determined by immunoblot (far right). (F) ERK inhibition with 100 nM SCH772894 for 72 hours induces differenti-ation in SMS-CTR (left) and RD (right) cells grown in complete medium as determined by immunofluorescence for MHC. Scale bars, 200 m. (G) GSEA enrichment plot showing positive enrichment for a set of genes up-regulated during differentiation of human skeletal muscle myoblasts into myotubes in SMS-CTR treated with the ERK inhibitor, SCH77894 (FDR and nominal P < 0.05).
by guest on February 21, 2020
http://stm.sciencem
ag.org/D
ownloaded from

Yohe et al., Sci. Transl. Med. 10, eaan4470 (2018) 4 July 2018
S C I E N C E T R A N S L A T I O N A L M E D I C I N E | R E S E A R C H A R T I C L E
5 of 17
To confirm this hypothesis, we used existing RNA-seq data (33) to create a human myogenic differentiation signature (HSMMdiff_UP; table S6). There was up-regulation of this signature in RD and SMS-CTR treated with trametinib for as few as 6 hours, and this effect became more pronounced over time (Fig. 2D). We further confirmed these expression changes at the protein level. For example, expres-sion of the myogenic transcription factors MYOD and MYOG was induced by trametinib treatment in SMS-CTR and RD at the RNA level [Fig. 2B (blue) and fig. S2C], as well as the protein level (Fig. 2E), after 24 hours of trametinib treatment. RNA and protein expression of MEF2A increased in RD and SMS-CTR at the RNA and protein level, but this induction required 48 hours of treatment. MYC RNA and protein expression, as well as phosphorylation at S62, which stabilizes the MYC protein in an ERK-dependent manner (34), de-creased with trametinib treatment in SMS-CTR (Fig. 2E). MYC mRNA expression did not change with trametinib treatment in RD (fig. S2C), although protein expression decreased (fig. S2D). Thus, MYC, in-duced and stabilized by aberrant ERK signaling, may play a role in FN-RMS cell proliferation and the maintenance of the differentiation block.
Induction of differentiation by trametinib was not due to an off-target effect of the drug, because siRNA-mediated knockdown of MEK1 expression decreased cell viability and induced differentia-tion in RD and SMS-CTR (fig. S2E). The myogenic differentiation signature was also enriched in RD transfected with MEK1 siRNA (Fig. 2D). Other agents that induce G1 arrest, such as the CDK4/6 inhibitor palbociclib, did not induce differentiation in SMS-CTR (fig. S2F). These results suggest that induction of myogenic differ-entiation is not solely a result of cell cycle inhibition.
Because a variety of MEK substrates in addition to ERK have recently been identified (35), we evaluated whether trametinib in-duced myogenic differentiation specifically through the inhibition of ERK. ERK inhibitors were not included in the initial drug screen (table S1). The ERK inhibitors—SCH772984, ulixertinib, and Vx11e—decreased cell viability more potently in SMS-CTR than in RD (fig. S2G). SCH772984, which functions both as a direct ERK1/2 kinase inhibitor and as an inhibitor of ERK phosphorylation by MEK (36), was the most potent of the ERK inhibitors studied, whereas the direct ERK1/2 kinase inhibitors, Vx11e and ulixertinib, were slightly less potent. SCH772984, like trametinib, induced G1 arrest (fig. S2H) and differentiation in RD and SMS-CTR (Fig. 2F). In addition, the myogenic differentiation signature was enriched in SMS-CTR treated with SCH77284 (Fig. 2G and table S2). These data suggest that differentia-tion in mutant RAS-driven RMS occurs through inhibition of ERK.
MEK inhibition releases ERK2 from myogenic differentiation genesThe fact that ERK2 directly impinges on chromatin to regulate the expression of developmental genes in embryonic stem (ES) cells (37, 38) led us to hypothesize that ERK2 plays a role in maintaining the block in myogenic differentiation. To test this, we first mapped the genome-wide profile of ERK2-chromatin interactions in SMS-CTR using chromatin immunoprecipitation sequencing (ChIP-seq). We identified a total of 3742 ERK2 binding sites (P < 1 × 10⁻³), 12% of which are promoter-proximal (table S7 and fig. S3A). Functional annotation of the ERK2 targets using Genomic Regions Enrich-ment of Annotations Tool (GREAT) ontology (39) revealed a strong association with muscle-specific processes and differentiation (Fig. 3A, top). This association appears to be cell type–dependent
because, in SK-N-AS, a neuroblastoma cell line with mutant NRAS (Q61K), there was a strong association with neural crest cell–specific genes (fig. S3B, top). Motif analysis of the ERK2-bound loci identified enriched motifs for known myogenic transcription factors including MYF5, MYOD, and MYOG, as well as known substrates of MAPK sig-naling including the AP-1 family of transcription factors (FOSL1, FOSL2, and JUN) (Fig. 3A, bottom). Enrichment for AP-1, but not myogenic, transcription factor motifs was maintained in SK-N-AS (fig. S3B, bot-tom), again indicating that ERK2-bound loci are lineage-specific.
We also performed ERK2 ChIP-seq analysis on SMS-CTR treated with trametinib. The ERK2 signal intensity decreased by at least two-fold at about 50% of ERK-binding sites with trametinib treatment (P = 2.8 × 10−53, paired t test; Fig. 3B). For a subset of genes (n = 25), trametinib treatment resulted in both decreased ERK2 deposition in the promoter and increased gene expression [at least twofold increase in fragments per kilobase of transcript per million mapped reads (FPKM); table S7]. For these genes, the significantly enriched gene ontology terms “sarcomere,” “myofibril,” and “contractile fiber” [DAVID (Database for Annotation, Visualization, and Integrated Discovery) (40); P < 0.05, Bonferroni correction applied) are consistent with these genes being important for myogenesis. Examples of genes for which trame-tinib decreased promoter ERK deposition and increased gene expres-sion include the myogenic transcription factor MYOG (Fig. 3B, right).
In mouse ES cells, developmental genes are held in a poised state to facilitate rapid induction of gene expression. The poised state is marked by the presence of histone modifications associated with both transcriptional activation (for example, H3K27ac) and tran-scriptional repression (for example, H3K27me3), as well as a poised form of RNA Pol II that is phosphorylated on S5 of the C-terminal domain repeats by ERK2 (38). During normal differentiation, H3K27me3 is re-moved, and S2 residues in the C-terminal domain are phosphorylated by P-TEFb, thus marking these genes as active and allowing transcrip-tional elongation. To test the hypothesis that MYOG expression is regulated in this way in FN-RMS, we first performed ChIP-seq experi-ments for H3K27me3 and H3K27ac in the presence and absence of trametinib. Substantial deposition of H3K27ac but not of H3K27me3 was observed at the MYOG locus (Fig. 3C, left), in contrast to the FBXO32 locus, which is known to be repressed in a PRC2- dependent manner in RMS (41), which shows deposition of H3K27me3 but not of H3K27ac (Fig. 3C, right). Deposition of H3K27ac and H3K27me3 at the MYOG locus was unchanged by trametinib treatment despite the increase in the gene’s expression (Figs. 3D and 2E) and loss of ERK2 deposition (also shown by ChIP-qPCR in Fig. 3E). This result was unexpected given that H3K27ac deposition did increase at the MYOG locus during the transition from normal skeletal muscle myo-blasts to myotubes (fig. S3C).
We then tested the hypothesis that ERK-dependent phosphoryla-tion of RNA Pol II is responsible for repression of MYOG expres-sion in FN-RMS by performing ChIP-seq experiments for total RNA Pol II, as well as for RNA Pol II phosphorylated at S2 and S5 residues in the C-terminal domain. RNA Pol II accumulated in the promoter- proximal region of MYOG (Fig. 3F) in control cells rather than the transcriptional start site region (TSSR; fig. S3D). Upon trametinib treatment, RNA Pol II signal was decreased in the promoter-proximal region and increased both in the TSSR and throughout the body of the gene (Fig. 3F), causing little change in pausing index (42). This indicates that RNA Pol II promoter stalling (failed TSS entry) rather than pausing was associated with suppression of MYOG transcription (fig. S3, D to E). S5-phosphorylated RNA Pol II also accumulated in
by guest on February 21, 2020
http://stm.sciencem
ag.org/D
ownloaded from

Yohe et al., Sci. Transl. Med. 10, eaan4470 (2018) 4 July 2018
S C I E N C E T R A N S L A T I O N A L M E D I C I N E | R E S E A R C H A R T I C L E
6 of 17
AGO biological process
–Log10 (binomial P value)0 10 20 30 40
Regulation of myoblast differentiationEmbryonic skeletal morphogenesis
Regulation of chondrocyte differentiationNeural tube development
Muscle system processMuscle contraction
ER
K2
peak
on
tolo
gy
Myo
geni
c TF
sAP
-1 T
Fs
Motif Name P value
MYODMYOG
MYF5
FOSL2
JUN
FOSL1
ER
K2
peak
m
otif
enric
hmen
t
C2C12
HRASQ61L
KRASG12V
NRAS Q61K
0
1
2
3
4
5
ChIP: ERK2 at MYOG promoter
Myo
blas
ts
0
2
4
6
P < 0.001P < 0.00001
P < 0.0001P < 0.000001
Myo
tube
sVector
% In
put D
NA
RN
A e
xpre
ssio
n (F
PK
M)
0
2
4ERK2
Tram
etin
ib
% In
put D
NA
DM
SO
10,000
7.5
1034
900
ERK2DMSOtrametinib
Pol IIDMSOtrametinib
Pol II S5-phosDMSOtrametinib
RNA-seqDMSOtrametinib
RRPM
RRPM
RRPM
RPM
B
0
200
400
600
800
RR
PM
(spi
ke-in
nor
mal
ized
)
P = 2.8 × 10–53
DMSO Trametinib
1
10
100
1000
Log2 (RRPM) fold change
Dis
tanc
e to
nea
rest
TS
S
0
150
Cou
nt
ERK2 ChIP-seq ± trametinib
−5 0 5
MYOG
C D
E F G
SMS-CTR MYOG
203,050 kb 203,062 kbchr1:
Pol II S2-phosDMSOtrametinib
H3K27me3
H3K27ac
RNA-seq
H3K27me3
H3K27ac
RNA-seq
ERK2RRPM
DM
SO
Tram
etin
ib
ERK2RRPM
FBXO32MYOG
3
18
10,000
36
3
18
10,000
36
chr8:124549772-124556697chr1:203048393-203064310
0
100
200
300
400
MYOG
P = 0.0443
DM
SO
Tram
etin
ib
P = 0.00035
1 × 10–219
1 × 10–188
1 × 10–186
1 × 10–111
1 × 10–99
1 × 10–98
36RPM
Fig. 3. ERK2 inhibits RMS differentiation by stalling transcription of MYOG. (A) ERK2 peaks in SMS-CTR are enriched for pathways important for muscle contraction and development (top), and these peaks are enriched with binding motifs for myogenic and AP-1 transcription factors (bottom). GO, gene ontology. (B) Promoter-proximal ERK2 ChIP-seq peaks that decrease in signal intensity [reported as reference-adjusted reads per million mapped reads (RRPM)] with trametinib treatment, visualized as a box plot (left). The difference in ERK2 signal intensity with trametinib treatment is statistically significant (paired t test). The promoters for which there was a decrease greater than twofold in ERK2 signal intensity are colored teal in the scatter plot at right. The promoters of myogenic transcription factors MYOG and MEF2A are highlighted. (C) Representative ChIP-seq tracks for H3K27me3 (gray), H3K27ac (yellow), and ERK2 (pink), as well as RNA-seq tracks at the MYOG locus (left) and the FBXO32 locus (right) in dimethlysulfoxide (DMSO; top) and trametinib-treated (bottom) SMS-CTR cells. (D) Expression of MYOG as determined by RNA-seq in SMS-CTR in the presence and absence of trametinib. Data are means ± SD for three replicates; P value generated from unpaired t test with Welch’s correction. (E) ChIP–quantitative polymerase chain reaction (qPCR) for ERK2 at the MYOG promoter in SMS-CTR in the presence and absence of trametinib. Results are presented as percentage of input material. Data are means ± SD of three replicates; P value generated from unpaired t test. (F) Representative ChIP-seq tracks for ERK2 (pink), total RNA Pol II (green), S5-phosphorylated Pol II (purple), and S2-phosphorylated Pol II (blue), as well as RNA-seq (gray) tracks at the MYOG locus in the presence and absence of trametinib. (G) ChIP-qPCR for ERK2 at the MYOG promoter in C2C12 expressing mutant RAS isoforms (left) or during normal differentiation (right). Results are presented as percentage of input material. Data are means ± SD of three replicates; P values generated from unpaired t test.
by guest on February 21, 2020
http://stm.sciencem
ag.org/D
ownloaded from
Yohe et al., Sci. Transl. Med. 10, eaan4470 (2018) 4 July 2018
S C I E N C E T R A N S L A T I O N A L M E D I C I N E | R E S E A R C H A R T I C L E
7 of 17
the promoter-proximal region of MYOG in control cells, but this deposition of S5-phosphorylated RNA Pol II decreased in the pres-ence of trametinib. In contrast, S2-phosphorylated RNA Pol II was almost absent in the control cells, indicating very little transcrip-tional elongation, but was detected in the region downstream of the poly-adenylation signal in trametinib-treated cells, indicating active transcriptional elongation (Fig. 3F). These data suggest that, in RAS- mutated RMS, ERK2 represses MYOG expression through promoter- proximal binding leading to S5-phosphorylation and stalling of RNA Pol II. Consistent with this, selective inhibition of the RNA polymerase C-terminal domain kinases CDK7 (THZ1) and CDK9 (flavopiridol) blocks the trametinib-dependent induction of MYOG expression in SMS-CTR (fig. S3F).
To confirm that ERK2 deposition at the MYOG promoter is a function of signaling downstream of mutant RAS, we overexpressed oncogenic forms of HRAS, KRAS, and NRAS in C2C12 mouse myo-blasts (fig. S3G). As expected, the C2C12 cells overexpressing oncogenic RAS failed to differentiate under serum-starved conditions (fig. S3H), whereas vector control cells readily differentiated. ERK2 deposition was increased at the MYOG promoter in C2C12 cells overexpressing oncogenic RAS (Fig. 3G, left). In RAS–wild-type C2C12 cells, serum starvation resulted in loss of ERK2 at the MYOG promoter (Fig. 3G, right), analogous to MEK inhibition in FN-RMS. These data sup-port the hypothesis that ERK2 plays a role in suppressing myogenic differentiation by directly impinging on the MYOG promoter, both in FN-RMS and in normal myoblasts.
MEK inhibition induces changes in chromatin accessibility in RAS-mutated RMSOur data support a model whereby, in RAS-mutated FN-RMS, ERK2 phosphorylates and stalls RNA Pol II at the MYOG promoter, preventing expression despite an active chromatin state. With the continuous MAPK signaling that results from the oncogenic RAS mutation, ERK2 remains at this site, preventing RNA Pol II TSS loading and elongation on the MYOG gene. In the presence of the MEK inhibitor, trametinib, ERK2 is no longer localized at the MYOG promoter, leading to promoter release of RNA Pol II, allowing com-plete transcription of MYOG. During normal muscle development, expression of MYOG triggers the expression of myotube-specific genes (43). Therefore, we hypothesized that MYOG induction in FN-RMS would similarly induce expression of myotube-specific genes. Con-sistent with this idea, we observed that overexpression of MYOG in RD cells did induce phenotypic differentiation (fig. S4A).
To further interrogate whether induction of these differentiation genes was driven by alterations in chromatin accessibility, we compared the changes in chromatin accessibility, as defined by deoxyribonuclease (DNase) hypersensitivity, between DMSO- and trametinib-treated SMS-CTR (fig. S4B). Regions for which alterations in DNase hyper-sensitivity peak intensity were consistent across two biological rep-licates were identified as increased accessibility (n = 9779), unchanged, or decreased accessibility (n = 8569) (table S8). Motif analysis showed that the basic helix-loop-helix (bHLH) transcription factor motifs were strongly enriched in the regions in which chromatin accessibility is increased because of trametinib treatment. Basic leucine zipper (bZIP) motifs, such as those for the AP-1 transcription factors whose ex-pression is increased by active ERK, were enriched in the decreased accessibility regions (Fig. 4A). Gene ontology analysis showed that the increased accessibility regions were enriched in genes important for skeletal muscle development, whereas decreased accessibility regions
were enriched in ERK-induced negative regulators of the MAPK pathway (Fig. 4B) (44). Genome-wide assessment of MYOG occupancy was also performed by ChIP-seq analysis. We identified very few MYOG peaks in control cells, consistent with the low MYOG expression in these cells (n = 782); however, the number of MYOG peaks markedly in-creased in the presence of trametinib (n = 9337, fig. S4C). MYOG deposition increased in the increased accessibility regions, but MYOG was largely absent in the decreased accessibility regions (Fig. 4C).
The related bHLH transcription factors, MYC and MYOD, play antagonizing roles in the induction of normal myogenic differentiation (45, 46). The roles that these transcription factors play in trametinib- induced differentiation of FN-RMS were assessed with ChIP-seq experiments, which identified 19,135 MYOD peaks and 3383 MYC peaks in vehicle (DMSO)–treated SMS-CTR cells (table S9). In ad-dition, patterns of key histone marks and CTCF were used to define chromatin states with ChromHMM (47). This analysis determined that, although MYC associates primarily with active promoters in FN-RMS, consistent with its role in other cancers as a general tran-scriptional amplifier (48), MYOD was predominantly localized in chromatin regions enriched with the histone modifications associated with strong enhancers (Fig. 4D), especially H3K27ac and H3K4me1/2.
In studies of differentiating murine and human skeletal muscle myoblasts, most MYOD-binding regions are shared in both the myoblast and myotube state (49, 50). Here, MYOD deposition cor-related with DNase hypersensitivity, with increasing MYOD deposi-tion in regions that increased in chromatin accessibility as a function of trametinib treatment (Fig. 4C). In contrast, MYC did not accu-mulate in the increased accessibility regions, consistent with the decrease in MYC expression due to trametinib treatment (Figs. 4C and 2E). However, for MYOD, about 40% of the binding regions were shared in the presence and absence of trametinib, whereas an additional subset of MYOD-bound regions was identified exclusively in cells treated with trametinib (fig. S4C). In addition, many genomic sites with increased chromatin accessibility as a function of trametinib treatment are co-occupied by MYOD and MYOG (Fig. 4E), suggest-ing that MYOG acts as a master transcription factor and facilitates the opening of chromatin regions and recruitment of MYOD.
DNase hypersensitivity peaks were linked to their nearest gene within topologically associated domain boundaries as previously de-scribed (51) to compare trametinib-induced changes in gene ex-pression as a function of chromatin state (Fig. 4F). This analysis showed that the expression of genes near decreased accessibility regions de-creased significantly (P < 0.0001), and expression of genes near in-creased accessibility regions increased significantly (P < 0.0001) when compared to genes near unchanged accessibility regions. Among the increased accessibility regions, the expression of genes near regions of accessible DNA that overlap with at least one MYOG peak was higher than regions lacking MYOG (Fig. 4F, right). The large ma-jority (90%) of trametinib-induced MYOG peaks occurred at en-hancers, and the deposition of H3K27ac increased at these sites with trametinib treatment, indicating that MYOG might play a role in establishing new enhancers (fig. S4D, left). However, there was no increase in H3K27ac at the promoters in which trametinib induced MYOG deposition (fig. S4D, right).
MEK inhibition remodels the super-enhancer landscape in RAS-mutated FN-RMSBecause super-enhancers are often defined by their disproportionately large H3K27ac load, we asked whether the changes in H3K27ac
by guest on February 21, 2020
http://stm.sciencem
ag.org/D
ownloaded from

Yohe et al., Sci. Transl. Med. 10, eaan4470 (2018) 4 July 2018
S C I E N C E T R A N S L A T I O N A L M E D I C I N E | R E S E A R C H A R T I C L E
8 of 17
D
E F
MYOGbHLH
bZIP
All
mot
ifs (n
= 2
64)
All
mot
ifs (n
= 2
64)
AP-1
Tram
etin
ib-in
crea
sed
mot
ifsTr
amet
inib
-dec
reas
ed m
otifs
–Log10 (motif P value)
–Log10 (motif P value)
Trametinib-increased regions
Trametinib-decreased regions
Distance to peak of DNase accessibility
Trametinib-increased pathwaysA B
Trametinib-decreased pathways
C–Log10 (binomial P value)
–Log10 (binomial P value)0 1000
0 2000
DN
ase
0 +4 kb–4 kb
DMSOTrametinib
0.2
0.4
0.6
0.8
0 +4 kb–4 kb
0.2
0.4
0.6
0 5 10 15
Nephron tubule epithelial differentiationMuscle filament sliding
Platelet formationMuscle adaptation
Striated muscle adaptationGlomerulus morphogenesis
Skeletal muscle cell differentiation
0 20 40
Neg. regulation of fibroblast growth factor signalingInactivation of MAPK activity
Neg. regulation of serine/threonine kinase activityNegative regulation of MAPK cascade
Negative regulation of transferase activityNegative regulation of kinase activity
Negative regulation of protein kinase activity
Frequency (%)
SMS-CTR chromatin
MYODMYCPeaks per Gb of chromatin state
00 1000 4000H3K
4me1
H3K
4me2
H3K
4me3
H3K
27ac
H3K
36m
e3
H3K
27m
e3
CTC
F
Gen
ome
%
52 77 49 15 4 49 54 Poised promoter 0.3
24 62 59 9 14 1 5 Flanking promoter 0.4
19 96 100 91 7 3 45 Active promoter 0.5
21 2 1 10 2 2 2 Weak enhancer 2.9
98 99 78 96 55 14 58 Strong enhancer 0.6
89 38 9 85 45 8 21 Genic enhancer 1.3
22 6 6 32 80 12 28 Transcriptional transition 1.2
1 0 0 2 85 1 4 Transcriptional elongation 3.1
0 0 0 0 6 0 0 Transcribed weak 7.0
0 0 0 0 2 1 1 Low signal 20.4
0 0 0 0 0 1 0 Heterochromatin 37.4
0 0 0 0 0 6 0 Polycomb weak repress. 20.1
2 1 1 2 1 58 9 Polycomb repressed 3.7
10 3 4 6 5 19 60 Domain insulator 1.1
500 2000
–0.2
0.0
0.2
0.4
0.6
Fold
cha
nge
log 2
(FP
KM
) D
MS
O v
s. tr
amet
inib
+ M
YO
G
No
MY
OG
Incr
ease
d
Dec
reas
ed
Unc
hang
ed
****
****
****
****
DM
SO
Tram
etin
ib
DNase-decreased DNase-increased
MYOG
MYOG
MYOD
MYOD
MYC
MYC
MY
OG
0 +4 kb–4 kb
0.4
0.8
1.2
0 +4 kb–4 kb
DMSOTrametinib
01
2
Rea
d co
unt p
er m
illio
n m
appe
d re
ads
MY
OD
0 +4 kb–4 kb
0.4
0.8
1.2
0 +4 kb–4 kb
DMSOTrametinib
01
23
4
Genomic regions
MY
C
0 +4 kb–4 kb 0 +4 kb–4 kb
DMSOTrametinib
0.0
0.1
0.2
0.3
0.4
0.5
0.0
0.2
0.4
0.6
0.8
Fig. 4. Trametinib treatment induces chromatin reorganization in SMS-CTR. (A) Hypergeometric Optimization of Motif Enrichment analysis reveals that regions with in-creased chromatin accessibility as a function of trametinib treatment are enriched with binding motifs for bHLH transcription factors (green) such as MYOG, among others (top), whereas trametinib-decreased regions are enriched with binding motifs for bZIP transcription factors (blue) such as AP-1, among others (bottom). (B) GREAT analysis shows that increased accessibility regions are enriched for pathways important for skeletal muscle development (green), among others (top), whereas decreased accessibility regions are enriched for pathways important for the negative regulation of MAPK activity (blue), among others (bottom). (C) Composite plots showing DNase hypersensitivity (silver), MYOG (light green), MYOD (dark green), and MYC (blue) signal intensities (RPM) genome-wide in the presence and absence of trametinib treatment in SMS-CTR. (D) MYC and MYOD binding sites overlap enrichments of 12 chromatin states in SMS-CTR, defined by six histone modification marks and CTCF (CCCTC-binding factor). (E) Collab-orative co-occupancy of MYC (blue), MYOD (dark green), and MYOG (light green) in the decreased and increased accessibility regions. The presence of each transcription factor at a given region is indicated by a colored line. (F) Bar charts representing the trametinib-induced fold change [log2(FPKM)] of the expression of genes nearest de-creased (blue), unchanged (gray), and increased (aqua) accessibility regions. Increased accessibility regions are further subdivided into regions lacking MYOG deposition (aqua, inset at right) and regions with at least one overlapping MYOG peak (green). Error bars represent the 95% confidence interval. ****P < 0.0001, evaluated by Welch’s t test.
by guest on February 21, 2020
http://stm.sciencem
ag.org/D
ownloaded from

Yohe et al., Sci. Transl. Med. 10, eaan4470 (2018) 4 July 2018
S C I E N C E T R A N S L A T I O N A L M E D I C I N E | R E S E A R C H A R T I C L E
9 of 17
deposition with trametinib treatment in SMS-CTR also changed which genes were associated with super-enhancers. We first identified 571 super-enhancers in SMS-CTR (Fig. 5A, top, and table S10). Because cancer cell lines frequently exhibit differences in enhancer signatures
from their corresponding primary tumors (52, 53), we identified super- enhancers in 40 additional samples, including FN-RMS cell lines and tumors, as well as normal skeletal muscle and other cancer cell lines. A clustering analysis of Pearson’s correlations of the H3K27ac signal
IGF2
MEST
MYOG
MYOD1
DUSP4
TNNT2MYH3
125005000750010,00012,500
IGF2
MEST
MYOG
MYOD1
MYH3
TNNT2
SPRY4
SPRY1
DUSP4
DMSO
0
0.2
0.4
0.6
0.8
1.0
Trametinib
Enhancers ranked by increasing H3K27ac load
H3K
27ac
sig
nal (
norm
aliz
ed)
0
0.2
0.4
0.6
0.8
1.0
125005000750010,00012,500
MYC
MYC
ID3
ID3
RAS signal–dependentsuper-enhancers lost
Myogenicsuper-enhancers gained
A BH
3K27
ac s
igna
l (no
rmal
ized
)
Myogenic super-enhancers
SPRY4
SPRY1
C
MY
OG
pea
kspe
r enh
ance
r
D
−5.0
−2.5
0.0
2.5
5.0
InducedSuppressed Retained
Sup
er-e
nhan
cer
prox
imal
gen
esfo
ld c
hang
e lo
g 2(FP
KM
)D
MS
O v
s. tr
amet
inib
DMSO Trametinib
MYH3
10 kb
33
10
3
1000
14
33
10
3
14
1000
DM
SO
26
26
SPRY1
20 kb
27
5
3
60
18
27
5
3
18
60
DM
SO
Tram
etin
ib
14
14
MYODMYC
DNase-seq
RNA-seqH3K27ac
MYOG
****
********
E
0 0.2 0.4 0.6 0.8 1
DM
SO
Tram
etin
ib
48 hours, SMS-CTR cells
DMSO
Trametinib
ID3
YBX1
SIX1
MYOD1
SIX2
TCF12
SOX8
SOX9MYC
TSC22D3
XBP1
E2F4
TSHZ3
HEYL
MYOG
HOXA9
ZNF217
AEBP2
TGIF1
ERF
ETV4
HOXA7
MYOG
HIF1A
MYOD1YBX1
ID3
SIX1
TEAD1
TCF12
SOX8
HEYL
SNAI2HOXA9
NR2F2
HOXA7
MEF2D
ERF
Super-enhancer connectivity (degree)
ZNF217XBP1SIX2TGIF1MYCSOX9E2F4ETV4HEYLTSC22D3AEBP2TSHZ3HOXA7SIX1ERFID3HOXA9YBX1SOX8TCF12MYOD1MYOGSNAI2TEAD1MEF2DHIF1ANR2F2
0
1
2
****
****
****
****
Typicalenhancers
Super-enhancers
Typicalenhancers
Super-enhancers
RAS-dependent super-enhancers
chr4:124,240,022-124,380,027
chr17:10,501,052-10,582,835
Tram
etin
ib
MYODMYC
DNase-seq
RNA-seqH3K27ac
MYOG
MYODMYC
DNase-seq
RNA-seqH3K27ac
MYOG
MYODMYC
DNase-seq
RNA-seqH3K27ac
MYOG
Fig. 5. Trametinib treatment remodels the super-enhancer landscape in SMS-CTR. (A) Ranked order of H3K27ac-loaded en-hancers in SMS-CTR treated with DMSO (top) or trametinib (bottom) reveals super-enhancers that are lost (blue), gained (gold), or unchanged (black) because of trametinib treatment. In these figures, the gray dashed line separates super- enchancers (right) from typical enhancers (left). A total of 571 super-enhancers were identified in DMSO-treated cells, and 577 were identified in cells treated with trametinib. (B) Signal tracks for MYOG (light green), MYOD (aqua), MYC (blue), and H3K27ac (yellow) ChIP-seq, DNAse sequencing (DNase- seq) (gray), and RNA-seq (dark green) experiments performed on SMS- CTR treated with DMSO or trametinib for 48 hours at the SPRY1 (Sprouty1; top) and MYH3 (embryonic MHC 3; bottom) loci. Predicted typical enhancers are shown above the signal tracks for each condition in gray; super-enhancers are red. (C) Bar charts representing the number of MYOG peaks per en-hancer in the absence and pres-ence of trametinib. ****P < 0.0001, unpaired t test with Fisher’s cor-rection. (D) Violin plots depict-ing the trametinib-induced fold change [log2(FPKM)] of the ex-pression of genes nearest the RAS- dependent, trametinib- decreased super-enhancers (blue), super-enhancers present in the absence and presence of trame-tinib (gray), and the myogenic, tra-metinib-induced super-enhancers (yellow). ****P < 0.0001, unpaired t test with Fisher’s correction. (E) Heat map of super- enhancer– associated transcrip tion factors in SMS-CTR in the absence (DMSO) and presence of trametinib, sorted by the change in total regulatory degree induced by trametinib treatment (left). The regulatory networks, as determined by COLTRON, are shown for DMSO- (right, top) and trametinib- treated (right, bottom) cells, highlighting the centrality of MYOG under the trametinib-treated condition.
by guest on February 21, 2020
http://stm.sciencem
ag.org/D
ownloaded from
Yohe et al., Sci. Transl. Med. 10, eaan4470 (2018) 4 July 2018
S C I E N C E T R A N S L A T I O N A L M E D I C I N E | R E S E A R C H A R T I C L E
10 of 17
intensity at the identified super-enhancers across these samples showed that SMS-CTR and other FN-RMS cell lines and tumors form a distinct cluster (fig. S5). These results indicate that super-enhancers are con-served among FN-RMS cell lines and tumors and that the super- enhancers in SMS-CTR are representative of FN-RMS.
To investigate how the super-enhancer landscape in RAS-mutated RMS is changed by MEK inhibition, we identified super-enhancers in trametinib-treated SMS-CTR (577 total). Comparison of the super- enhancer landscape in control and trametinib-treated cells revealed three classes of super-enhancers: those that are unchanged with tra-metinib treatment, RAS-dependent super-enhancers that are lost with trametinib treatment, and myogenic super-enhancers that are gained with trametinib treatment (Fig. 5A). Super-enhancers that are unchanged with trametinib treatment occur at loci for genes known to be highly expressed in RMS compared to normal skeletal muscle, including IGF2, MEST, MYOG, and MYOD (51).
The super-enhancers lost with trametinib treatment occur at loci known to be transcriptionally regulated by active ERK (54), including SPRY1, a negative regulator of the MAPK pathway, and MYC (Fig. 5B, top, and fig. S6A). Expression of both MYC (Fig. 2E and fig. S2E) and Sprouty1, the protein product of SPRY1 (fig. S6B), decreased with trametinib treatment, corresponding with the loss of their super- enhancers. Using ENCODE (Encyclopedia of DNA Elements) con-sortium data, we identified super-enhancers in human skeletal muscle myoblasts and myotubes (fig. S6C) (55). Although super-enhancers at IGF2 and MEST were observed in this system, super-enhancers were not observed at SPRY1 or MYC in these cells, indicating that the presence of these super-enhancers in SMS-CTR was due to oncogenic RAS. We used publicly available data to show that super-enhancers at loci encoding negative regulators of MAPK signaling, such as SPRY4, are observed in other RAS-mutated RMS cell lines and tumors but not in RAS–wild-type FN-RMS tumors or normal skeletal muscle. The SPRY4 super-enhancer was also seen in RAS-mutated cell lines de-rived from other human cancers, including hepatocellular carcinoma and colorectal carcinoma (fig. S6D).
The super-enhancers gained with trametinib treatment, such as those seen at the MYH3 locus (Fig. 5B, bottom), occur at genes expressed late in the process of myogenic differentiation (49). Super-enhancers were also gained at these loci in differentiating myotubes (fig. S6C). The super-enhancer at the MYOG locus was unchanged by trametinib (P = 0.894; Fig. 5A), consistent with the change in MYOG expression being driven by release of stalled RNA Pol II and not by alterations in his-tone acetyla tion or chromatin accessibility. The number of MYOG peaks per enhancer was highest in super-enhancers in trametinib- treated cells (Fig. 5C), suggesting that MYOG deposition assists in establishment of super-enhancers at genes important for myogenic differentiation. On a genome-wide scale, the expression of genes linked to RAS- dependent super-enhancers decreased with trametinib treatment, whereas the expression of genes linked to myogenic super- enhancers increased with trametinib treatment (Fig. 5D). We infer that the expression of mutant RAS in SMS-CTR locked the super- enhancer landscape in this myoblast-like cell type, which is effectively reversed by MEK inhibition. The expression of master transcription factors is frequently regulated by super-enhancers, and, in turn, the motifs for each cell type’s master transcription factors are commonly found in that cell’s super-enhancers (53). Assessment of the circuitry of super- enhancer–regulated transcription factors in control- and trametinib- treated SMS-CTR showed that MYOG is a central transcription factor in trametinib-treated cells (Fig. 5E), which is consistent with MYOG’s
association with regions of chromatin that increase in accessibility upon trametinib treatment (Fig. 4). MEK inhibition in RAS-mutated RMS thus induces expression of MYOG, a master transcription factor, which in turn establishes super-enhancers at myogenic loci.
MEK inhibition impairs tumor growth, induces differentiation, and prolongs murine survival in xenograft models of RAS-mutated RMSDifferentiation therapy is used effectively in the treatment of both acute promyelocytic leukemia and high-risk neuroblastoma (56) and is a promising approach for FN-RMS. To determine whether MEK inhibition might represent a strategy for differentiation therapy in RAS-mutated RMS, the effects of trametinib on in vivo tumor growth were studied. Orthotopic xenograft models of RAS-mutated RMS were made by injecting SMS-CTR, BIRCH, or RD into the gastrocnemius muscle of immunodeficient mice. Palpable tumors developed with each of the cell lines tested with an average latency of 3 weeks. Trametinib treatment inhibited tumor development and led to a significant survival advantage in SMS-CTR (P = 0.014) and BIRCH models (P = 0.0067; Fig. 6A) but had modest effects in the RD model (fig. S7, A and B). However, progressive disease was ulti-mately noted in all the RAS-mutated RMS xenografts treated with trametinib (Fig. 6A and fig. S7A). No weight loss was observed in the trametinib-treated mice (fig. S7C). Trametinib treatment decreased ERK phosphorylation by 70% within SMS-CTR tumors but by only 50% in BIRCH (Fig. 6B) and RD tumors (fig. S7D), as determined by a quantitative capillary immunoassay. Trametinib treatment also increased MYOG expression within the tumors, as determined by both immunoblot of tumor lysates (Fig. 6C and fig. S7E) and immuno-histochemistry (IHC) of formaldehyde-fixed tumors (Fig. 6D and fig. S7F), suggesting that MEK inhibition initiated differentiation of RAS-mutated RMS in vivo. Consistent with our model, at the RNA level, there was an up-regulation of genes associated with myogenically induced super-enhancers, and concomitant down-regulation of RAS- dependent super-enhancer genes (table S16), in trametinib-treated SMS- CTR tumors (Fig. 6E). However, complete phenotypic terminal differentiation was not observed in these tumor models.
Dual blockade of IGF1R and the RAS-MEK-ERK MAPK pathway synergistically inhibits FN-RMS growth in vitro and in vivoBecause progressive disease was ultimately noted in all the RAS-mutated RMS xenografts treated with trametinib, we hypothesized that a combination of pathway inhibitors would be needed to achieve du-rable remissions. To identify active combinations of drugs, an in vitro combination matrix screen was performed. The most potent 35 com-pounds from the single-agent drug screen (table S1), which included trametinib, were combined in a pairwise, all-versus-all fashion in 6 × 6 dose-response matrices on a high-throughput screening plat-form, resulting in 595 individual matrices. The drug/drug combina-tions were ranked using the excess over the highest single-agent (HSA) method. The highest scoring combination across three RAS- mutated cell lines was trametinib plus GSK-2126458, a dual PI 3-kinase/mTOR inhibitor, and other high scoring combinations included trametinib plus other inhibitors of the PI 3-kinase/mTOR/AKT pathway (table S17). Combining a MEK inhibitor and a PI 3-kinase inhibitor has been previously tested in RMS (57), but the therapeutic benefit of these combinations has been limited in clinical trials because of toxicity. On the basis of these pilot results, we performed a 10 × 10 dose- response
by guest on February 21, 2020
http://stm.sciencem
ag.org/D
ownloaded from

Yohe et al., Sci. Transl. Med. 10, eaan4470 (2018) 4 July 2018
S C I E N C E T R A N S L A T I O N A L M E D I C I N E | R E S E A R C H A R T I C L E
11 of 17
validation matrices using an expanded set of PI 3-kinase/mTOR/AKT/MEK/ERK inhibitors. This included 25 highly active agents in 96 discrete matrices (table S18). The highest scoring combination in both RD and SMS-CTR was trametinib plus BMS-754807, a small- molecule inhibitor of IGF1R (Fig. 7, A and B, and table S18). This combination was also highly synergistic in another HRAS-driven cell line, BIRCH. In addition to its effects on cell proliferation, the com-bination of trametinib and BMS-754807 induced caspase-3/7 activity (Fig. 7C) and cell surface translocation of phosphatidylserine, as de-tected by annexin V staining (Fig. 7D), in SMS-CTR, consistent with induction of apoptosis. These results suggest that there may be ther-apeutic benefit to combining a MEK inhibitor, such as trametinib, with an IGF1R inhibitor, such as BMS-754807, in RAS-driven RMS. Sim-ultaneous targeting of MEK and IGF1R has induced tumor regression in RAS-driven acute leukemia, colorectal carcinoma, and non–small cell lung cancer models but has yet to be tested in clinical trials (58–61).
In the basal state, ERK initiates a negative feedback loop by in-ducing expression of members of the dual-specificity phosphatase (DUSP) and sprouty (SPRY) families, which we show above to have RAS-dependent super-enhancers (Fig. 5). Induction of DUSPs and SPRYs leads to decreased phosphorylation of receptor tyrosine kinases, such as IGF1R, and intracellular kinases, such as RAF and MEK. In the presence of MEK inhibition, this negative regulation is lost (62). We hypothesized that trametinib treatment would induce phosphoryla-tion of IGF1R in RAS-driven RMS through loss of this negative regula-tion. We used a quantitative capillary immunoassay to confirm the results shown in fig S1E that short-term trametinib treatment (6 hours) abrogated ERK phosphorylation but that rebound ERK phosphorylation occurred with longer treatment (48 hours). In addition, AKT phosphorylation increased with trametinib treatment (Fig. 7, E and F). Finally, trametinib treatment induced IGF1R phosphorylation (Fig. 7, E and F). We further hypothesized that treatment with trametinib and the IGF1R inhibitor, BMS-754807, would prevent the phosphorylation and activation of IGF1R induced by trametinib treatment alone. Consistent with this idea, BMS-754807 treatment alone blocked the basal phosphorylation of IGF1R induced by growing cells in full serum, and the addition of BMS-754807 to trametinib prevented the phosphorylation of ERK, AKT, and IGF1R induced by treatment with trametinib alone (Fig 7F). IGF1R inhibition therefore synergizes with MEK inhibition in RAS- driven RMS by augmenting inhibition of ERK phosphorylation and inhibiting AKT phosphorylation.
To test whether the observed in vitro synergy between trametinib and BMS-754807 would correspond to therapeutic enhancement for the combination in vivo, we evaluated the SMS-CTR (Fig. 7G) and RD (fig. S8A) xenograft models. We observed a prolonged tumor growth delay for mice treated with the combination versus either single agent. In SMS-CTR, tumor growth in the combination mice began 40 days
after treatment had stopped (four tumor doubling times). In addi-tion, for SMS-CTR, the observed tumor growth delay was associated with significant prolongation of overall survival for the mice treated with the combination compared to trametinib (P < 0.0001) or BMS-754807
A
SMS-CTR
Time (days)
Tum
orvo
lum
e(m
m3
)
0 10 20 30 400
500
1000
1500
2000
Time (days)
Tum
orvo
lum
e(m
m3 )
0 10 20 30 400
5001000150020002500
p
e ed
Pece
ns
ia
Pe
v
Days ela sed
rt
urv
vl
0 10 20 30 400
50
100
Days laps
erc
ntsu
riv
al
0 10 20 30 400
50
100
VehicleTrametinib
P = 0.0114
P = 0.0067
* ** ** ********
****
****
** ** ** ******
****
**
SMS-CTR BIRCH
MYOG
Vinculin
C
Vehicle
Tum
or 1
Ttum
or 2
Trametinib
Tum
or 1
Tum
or 2
Tum
or 1
Tum
or 2
Tum
or 1
Tum
or 2
Vehicle Trametinib
B
E SMS-CTR tumors, trametinib vs. vehicle
D Vehicle
SM
S-C
TR
20.2 54.2
Trametinib
% MYOG- positive nuclei
26.5 57.4 % MYOG- positive nuclei
BIR
CH
Rank in Myogenic_Super_Enhancers_up (%)
Enr
ichm
ent s
core
Enr
ichm
ent s
core
–0.2
0.0
0.2
0.4
0.6
Rank in Ras-dependent_Super_Enhancers_DOWN (%)
–0.4
–0.2
0
0.2
0.0
0.2
0.4
0.6
Vehicl
e
Trameti
nib0
1
2
3
4
Pea
k ar
ea
Vehicl
e
Trameti
nib
Pea
k ar
ea
SMS-CTR
BIRCH
pERK1/2
BIRCH
Fig. 6. Trametinib inhibits tumor growth and induces differentiation in xeno-graft models of FN-RMS. (A) Daily trametinib inhibits tumor growth (left) and prolongs overall survival (right) in severe combined immunodeficient (SCID) Beige mice injected orthotopically with either SMS-CTR (top) or BIRCH (bottom) cell lines. *P < 0.05 and **P < 0.01, unpaired t test. (B) Trametinib decreases ERK phosphorylation in SMS-CTR and BIRCH xenografts as determined by capillary immunoassay. (C) Trametinib treatment increases MYOG expression in RD and SMS-CTR xenografts as determined by immunoblot and immunohistochemistry (D). Scale bars, 200 m. (E) GSEA comparing gene expression of SMS-CTR xenografts treated with either vehicle or trametinib shows positive enrichment of genes associated with MYOG- induced super-enhancers and negative enrichment of genes associated with RAS- dependent super-enhancers. FDR q < 0.05 and nominal P < 0.01.
by guest on February 21, 2020
http://stm.sciencem
ag.org/D
ownloaded from

Yohe et al., Sci. Transl. Med. 10, eaan4470 (2018) 4 July 2018
S C I E N C E T R A N S L A T I O N A L M E D I C I N E | R E S E A R C H A R T I C L E
12 of 17
Dosingceased
Tum
or v
olum
e(m
m3 )
0 20 40 60 800
1000
2000
3000
0 20 40 60 800
50
100
Per
cent
sur
viva
l P < 0.0001Dosingceased
A B
C
0 50 100−4000
−3000
−2000
−1000
0
1000RD
Exce
ssH
SA
*
0 50 100−4000
−3000
−2000
−1000
0
1000SMS-CTR
Exce
ssH
SA
*
0 50 100−4000
−3000
−2000
−
−1000
0
1000BIRCH
Rank
Exce
ssH
SA *
Annexin-APC
Syt
ox G
reen
DMSO Trametinib
BMS-754807
0.78 3.94
2.2593.0
102 103 104
105
102 103 104
102 103 104
102 103 104
102
103
104
105
102
103
104
105
102
103
104
105
102
103
104
1.65 21.9
23.353.2
0.80 20.7
22.256.3
2.33 40.8
46.510.4
D
SMS-CTR (HRAS)
80Time (days)
Tum
orvo
lum
e(m
m3 )
40 600
1000
2000
3000
4000
G H
0 6 24 480.0
0.1
0.2
3456
pERK/total
Peak
area
0 6 24 480.0
0.5
1.0
1.5pAKT/total
Peak
area
0 6 24 480.00
0.05
0.10
0.15
0.20
0.25pIGF1R/total
Peak
area
Vehicl
e
BMS-7548
07
Trameti
nib
Combin
ation
0.00
0.25
0.50246
pERK/total
Peak
area
RDSMS-CTR
0.0
0.2
0.4
0.6
0.8pAKT/total
Peak
area
0.0
0.1
0.2
0.3
0.4pIGF1R/total
Peak
area
E F
I
VehicleTrametinibBMS-754807
BMS-754807
Vehicl
e
BMS-7548
07
Trameti
nib
Combin
ation
Vehicl
e
BMS-7548
07
Trameti
nib
Combin
ation
Dosingceased
Time (days)Time (days)
BMS-754807 + trametinib
SMS-CTR
tumor growth
tumor shrinkage
200067022074258.22.70.910.300
00.7
62.36.92162190
550
1670
5000
Viability (%):
Trametinib (nM)
BM
S-7
5480
7 (n
M)
Caspase-3/7 activity (%):
100500
100 50 0
Delta Bliss synergy−0.4 0.40
Synergistic Antagonistic200067022074258.22.70.910.300
00.7
62.36.92162190
550
1670
5000
Trametinib (nM)
BM
S-7
5480
7 (n
M)
00.7
62.36.92162190
550
1670
5000
Trametinib (nM)
00.7
62.36.92162190
550
1670
5000
Trametinib (nM)
200067022074258.22.70.910.300
00.7
62.36.92162190
550
1670
5000
Trametinib (nM)
BM
S-7
5480
7 (n
M)
5000167055019062216.92.30.760
Tram
etin
ib (n
M)
00.7
62.36.92162190
550
1670
5000
Trametinib (nM)
5000167055019062216.92.30.760
Tram
etin
ib (n
M)
5000167055019062216.92.30.760
tram
etin
ib (n
M)
Trametinib dose duration (hours)
Trametinib dose duration (hours)
Trametinib dose duration (hours)
Trametinib +
SMS-CTR (HRAS)
Fig. 7. Matrix screen identifies a synergistic combination of an IGF1R inhibitor and a MEK inhibitor in FN-RMS. (A) Excess HSA versus rank plot representing 96 discreet synergy scores from the 10 × 10 matrix screen in RD, SMS-CTR, and BIRCH. Red bars indicate combinations of IGF1R/PI3K/mTOR/AKT and MEK/ERK inhibitors. Asterisk (*) denotes the combination of BMS-754807 and trametinib. (B) Matrix (10 × 10) plot for the combination of trametinib (0 to 5000 nM) and BMS-754807 (0 to 2000 nM) (top) or the control combination of trametinib with trametinib (bottom) in both viability (CellTiter-Glo; left) and Bliss (right) format. (C) Matrix (10 × 10) plot for caspase-3/7 activity of SMS-CTR treated for 16 hours with the combination of trametinib and BMS-754807 (left) or the control combination of trametinib with trametinib (right). (D) Annexin V staining of SMS-CTR cells treated with DMSO, 100 nM trametinib, 350 nM BMS-754807, or the combination of trametinib and BMS-754807 for 72 hours. APC, allophycocyanin. (E) Peak area of the ratio of phosphorylated to total ERK (top), S473 AKT (middle), and IGF1R (bottom) as determined by Simple Western is displayed for RD (black) and SMS-CTR (gray) treated with 100 nM trametinib for the indicated times. (F) Peak area of the ratio of phosphorylated to total ERK (top), S473 AKT (middle), and IGF1R (bottom) as determined by Simple Western is displayed for RD (black) and SMS-CTR (gray) treated with DMSO or 100 nM trametinib for 72 hours, followed by DMSO or 350 nM BMS-754807 for 3 hours. (G) Daily treatment with the combination of trametinib and BMS-754807 prolongs the time to tumor development. Dotted line indicates date at which treatment was stopped (45 days). (H) Prolongation of survival in SMS-CTR xenografts either agent alone or combined (P < 0.0001, Mantel-Cox test for the comparison between single agent and the combination). (I) Daily treatment with the combination of trametinib and BMS-754807 in large estab-lished tumors induces regression in SMS-CTR xenografts. Dotted line indicates date at which treatment was stopped (28 days).
by guest on February 21, 2020
http://stm.sciencem
ag.org/D
ownloaded from

Yohe et al., Sci. Transl. Med. 10, eaan4470 (2018) 4 July 2018
S C I E N C E T R A N S L A T I O N A L M E D I C I N E | R E S E A R C H A R T I C L E
13 of 17
alone (P < 0.0001; Fig 7H), whereas, for RD, a survival advantage was not observed for the combination (fig. S8B). In addition to causing a tumor growth delay, treatment with the combination of trametinib and BMS-754807 induced tumor regression in SMS-CTR (Fig. 7I) and sta-bilized growth of RD tumors (fig S8C). Toxicity was observed in the combination group; one mouse treated with the combination in the RD model was euthanized because of excessive body weight loss early in the study, and the combination- treated mice had the lowest body weight throughout the treatment course, which recovered when the treatment was stopped (fig. S8D). Phosphorylation of ERK and AKT, as well as expression of IGF1R, was decreased in tumor lysates from SMS-CTR xenografts treated with trametinib and BMS-754807, indicat-ing that the in vitro mechanism of synergy between these two drugs was preserved in vivo (fig. S8E). These results suggest that addition of an IGF1R inhibitor to a MEK inhibitor provided therapeutic en-hancement in RAS- mutated RMS.
DISCUSSIONWe elucidated an epigenetic mechanism by which MEK inhibition induces differentiation in FN-RMS. Our data support a model in which oncogenic RAS, signaling through the MAPK pathway, drives FN-RMS cell proliferation and inhibits the expression of MYOG, which prevents initiation of myogenic differentiation (fig. S9, left). This differentiation block is created by an interaction between ERK2 and RNA Pol II at the MYOG locus, which stalls transcription of MYOG. However, in the presence of trametinib, ERK-dependent inhibition of MYOG expression is released, and ERK-mediated activation of MYC and of AP-1–dependent cell proliferation is inhibited (fig. S9, right). MYOG subsequently binds additional skeletal muscle–specific loci and induces H3K27 acetylation, chromatin opening, and, ulti-mately, gene transcription at those loci.
Using FN-RMS as a model system, we show that MEK inhibition dramatically affects the super-enhancer landscape. The impact of RAS on the super-enhancer landscape has been previously studied in mouse embryonic fibroblasts engineered to express HRAS G12V (63) but not in patient- derived cancer cell lines. Cancer cells are known to acquire super-enhancers at the loci of known oncogenes (64). In the case of FN-RMS, we have identified super-enhancers at the loci for SPRY1 and SPRY4, as well as the known oncogene, MYC. These super-enhancers were not identified in normal human myoblasts, indicating that they are ac-quired during tumorigenesis. Furthermore, they are observed in other RAS- mutated cell lines. Therefore, RAS-driven transformation may in-duce de novo establishment of super-enhancers at loci encoding oncogenes.
Normal skeletal muscle differentiation is initiated by the coordinated action of master transcription factors, including MYOD and MYOG. MYOD activates the expression of MYOG, which interacts with the MEF2 family transcription factors to drive terminal differentiation (43). The role of the RAF-MEK-ERK MAPK pathway in this pro-cess is controversial, with evidence that this pathway has different roles in the early and later stages of differentiation. MEK and ERK inhibit the ability of MYOD to induce MYOG expression (65, 66), an early differentiation event, by binding and phosphorylating MYOD, respectively (67). Here, we show that nuclear ERK2 also inhibits MYOD function by binding chromatin and preventing MYOG ex-pression, which is supported by the fact that blocking nuclear trans-location of ERK2 induces early myogenic differentiation (68). However, genetic knockdown of ERK2 expression in myoblasts prevents fusion of myoblasts into multinucleated myotubes (69), and mice lacking
ERK1/2 selectively in skeletal muscle fibers have muscle fiber atrophy and loss (70), suggesting a critical role for MEK-ERK signaling in the later stages of myogenic differentiation.
The efficacy of MEK inhibitors in FN-RMS has been investigated previously, with conflicting results. Initial studies using the MEK in-hibitor tool compound, UO126, showed efficacy in the RD cell line in vitro and in xenograft models (71, 72). In addition, the RD cell line was sensitive to the first-generation MEK inhibitors in vitro (11, 73), but treatment of RD xenografts with one such MEK inhibitor, selumetinib, did not result in tumor growth delay in vivo (57). An in vitro screen of a panel of compounds in RD and several patient- derived tumor cell lines failed to highlight MEK inhibitors as potent inhibitors of cell viability (8). However, a sarcoma cell line screen of oncology drugs showed that the FN-RMS cell lines RD and RH36 (also known as BIRCH) (30) were sensitive to MEK inhibitors, but the dose-response curves lacked the typical sigmoidal shape (74). We also observe an atypical shape in the dose-response curve for trametinib in RD. This curve shape is likely due to the cytostatic response to trametinib in this cell line.
In our study, trametinib monotherapy was more effective in treat-ing xenografts of HRAS-mutated cell lines (SMS-CTR and BIRCH) than xenografts of the NRAS-mutated cell line, RD. MEK inhibitors had not been tested in these HRAS-mutated xenografts before this study. Several potential explanations exist for the differential sensitivity of HRAS- and NRAS-mutated FN-RMS cell lines to MEK inhibition. There are cooperative mutations in addition to the RAS mutations in these cell lines that could affect MEK inhibitor sensitivity and drive tumorigenesis. For example, because of uniparental disomy at the 11p15.5 locus, SMS-CTR and BIRCH express only mutant HRAS. Increased gene dosage of mutant NRAS increases sensitivity to MEK inhibition (75); increased gene dosage of mutant HRAS could function similarly. RD also has a loss-of-function mutation in the RAS guanosine triphosphatase– activating protein, NF1 (E977X), which could contribute to the resistance of this cell line to chemotherapeutics and targeted agents. Alternatively, the differential response between HRAS- and NRAS-mutated FN-RMS cell lines to trametinib could be due to RAS isoform–specific differences in engagement of effector pathways.
There are several limitations associated with this study. First, al-though we show that transcription of MYOG is released by MEK in-hibition, the mechanism by which ERK2 stalls MYOG transcription has not been fully elucidated. Second, although MEK inhibition induces terminal differentiation in RAS-mutated RMS cells in vitro, in tumors, MEK inhibition up-regulated a subset of downstream myogenic super- enhancer–associated genes but not a key marker of complete muscle differentiation, MYH3. Whether this lack of terminal differentiation in vivo is due to a technical issue or the incomplete elimination of intra-tumoral ERK phosphorylation will be addressed by future experiments.
In summary, we used an unbiased, high-throughput drug screen to identify the MAPK pathway as a key vulnerability in RAS-mutated RMS. Using phenotypic and transcriptomic approaches, we showed that MEK inhibition induced a skeletal muscle differentiation program in RAS-mutated RMS cells. We demonstrated that RAS-mutated RMS is locked in a myoblast-like state through ERK2 deposition at the MYOG promoter, which stalls MYOG transcription. MEK inhibition with trametinib allowed MYOG expression and enabled MYOG to induce the differentiation program. The vulnerability of RAS-mutated RMS to MEK inhibition observed in cell culture models was con-firmed in xenograft experiments where trametinib both inhibited tumor growth and induced differentiation. The in vivo tumor growth suppression observed with trametinib monotherapy was incomplete,
by guest on February 21, 2020
http://stm.sciencem
ag.org/D
ownloaded from
Yohe et al., Sci. Transl. Med. 10, eaan4470 (2018) 4 July 2018
S C I E N C E T R A N S L A T I O N A L M E D I C I N E | R E S E A R C H A R T I C L E
14 of 17
but combining trametinib with the IGF1R inhibitor, BMS-754807, achieved remissions in xenograft models of RAS-mutated RMS and represents a meaningful opportunity for clinical translation.
MATERIALS AND METHODSStudy designThis study was designed to identify drugs that would specifically in-hibit the growth of RAS-mutated RMS cells in culture and in xeno-graft models. Using the MIPE-v4 library of mechanistically characterized drugs, we identified that MEK inhibitors in general and trametinib selectively inhibited growth of RAS-mutated RMS cells as compared to cells derived from the related childhood sarcoma, PAX FP-RMS. The mechanism by which trametinib inhibits RAS-mutated RMS cell growth was assessed using a combination of cell cycle analysis, myogenic differentiation, whole-transcriptome sequencing, and im-munoblot experiments, which confirmed that trametinib induces myogenic differentiation in RAS-mutated RMS. To better under-stand how MEK inhibition induced differentiation in RMS cells, we performed various ChIP-seq and ChIP-qPCR experiments in RAS- mutated RMS cells, as well as C2C12 mouse myoblasts expressing mutant RAS isoforms. The efficacy of trametinib in three xenograft models of RAS-mutated RMS was then assessed. In each experiment, mice were randomly assigned to the treatment groups, and mice (n > 4) per group were included to achieve statistical significance. Trametinib (3 mg/kg) was administered daily by oral gavage after the establishment of palpable xenografted tumors. Tumor size was mea-sured twice a week with digital calipers, and animals were euthanized when they reached tumor end point (tumor of >2 cm in any dimension). No animals were excluded from analysis. Matrix screening experi-ments were performed to identify combinations of targeted agents that would improve outcomes in xenograft models of RAS-mutated RMS as compared to trametinib alone. The combination of trametinib and BMS-754807, an inhibitor of IGF1R, was identified as synergis-tically active in vitro. The efficacy of the combination was then assessed in xenograft models. In this case, mice were randomly assigned to the treatment groups, with n = 10 mice per group.
Clonogenic assayRD, SMS-CTR, or RH30 cells were plated at a density of 100 cells per well in six-well tissue culture plates. The plates were incubated for 2 weeks before fixing in 10% formaldehyde and staining with 0.01% crystal violet.
Differentiation assayC2C12 cells were serum-starved in Dulbecco’s modified Eagle’s medium with 2% horse serum (Gibco) for 5 days before immunofluorescence analysis. Differentiation index was calculated as the number of nuclei within an MHC-expressing cell divided by the total number of nuclei in a field. Fusion index was calculated as the number of nuclei within an MHC-expressing cell with greater than two nuclei divided by the total number of nuclei in a field. For the differentiation and fusion indices, a total of three independent fields were quantified. To de-termine myotube width, the widest portion of 10 individual myo-tubes per condition was determined.
High-throughput cell viability assaysFor each cell line tested, a total of 1000 cells per well in 5 l of com-plete RPMI 1640 medium were dispensed into 1536-well white tissue
culture plates that had been preplated with the compounds com-prising the MIPE-v4 library as previously described (76). Cells were grown in the presence of compounds for 48 hours before addition of a CellTiter-Glo luminescent cell viability assay reagent. Resultant luminescent signal was measured on a ViewLux instrument. AUC from the resultant dose-response curves was calculated using a standard trapezoidal method (31).
Immunofluorescence experimentsCells were grown in Nunc chamber slides (Lab-Tek), fixed with 4% paraformaldehyde, and permeabilized in 0.5% Triton X-100. Anti-bodies were diluted in BlockAid (Life Technologies) or 1% bovine serum albumin in phosphate-buffered saline. Coverslips were mounted with ProLong Gold with 4′,6-diamidino-2-phenylindole (Life Tech-nologies) before visualization using an EVOS FL microscope (Life Technologies).
Annexin V assaySMS-CTR cells were treated with vehicle (DMSO), 100 nM trame-tinib, 350 nM BMS-754807, or the combination of trametinib and BMS-754807 for 72 hours before harvesting and incubating with allophycocyanin- labeled human recombinant annexin V (BioLegend) and Sytox Green (Thermo Fisher Scientific) according to the manu-facturers’ instructions. Samples were read on a FACSCanto flow cytometer (BD Biosciences), and percentage of annexin positive cells was calculated in FlowJo.
Statistical analysisAll data are presented as the mean and SEM from at least three in-dependent experiments. Differences between groups were evaluated using paired Student’s t test after normal distribution was con-firmed using the Shapiro-Wilk test, with Welch’s correction applied where indicated to account for unequal variances. For mouse sur-vival curve analysis, the median survival from the different groups is presented, and the log-rank (Mantel-Cox) test was used to evalu-ate differences between the groups. Additional experimental details are available in the Supplementary Materials.
SUPPLEMENTARY MATERIALSwww.sciencetranslationalmedicine.org/cgi/content/full/10/448/eaan4470/DC1Materials and MethodsFig. S1. Trametinib decreases cell viability in RAS-mutated RMS in vitro.Fig. S2. Trametinib induces G1 arrest and differentiation in RAS-mutated RMS.Fig. S3. ERK2 is associated with developmental gene regulation in RAS-mutated cancer cell lines.Fig. S4. MYOG associates with opened chromatin in trametinib-treated RMS cells.Fig. S5. Super-enhancers in RAS-mutated RMS cell lines correlate with super-enhancers in RAS-mutated RMS tumors.Fig. S6. RAS-dependent super-enhancers are not observed in human skeletal muscle myoblasts.Fig. S7. MEK inhibition delays tumor growth in RD xenografts.Fig. S8. Combination of trametinib and BMS-754807 delays tumor growth in RD xenografts.Fig. S9. MEK inhibition induces transcriptional reprogramming analogous to myogenic differentiation in FN-RMS.Table S1. Dose response as %AUC for RMS and normal cell lines.Table S2. Differentially expressed genes in SMS-CTR treated with trametinib or SCH772984.Table S3. Differentially expressed genes in RD treated with trametinib or MEK1 siRNA SMS-CTR.Table S4. GSEA SMS-CTR treated with trametinib.Table S5. GSEA RD treated with trametinib.Table S6. HSMMdiff_UP gene set.Table S7. ERK2 ChIP-seq peaks.Table S8. Trametinib-changed DNase-seq peaks.Table S9. MYOD, MYC, and MYOG peaks in SMS-CTR treated with trametinib.Table S10. Super-enhancers with and without trametinib.Table S11. Gene Expression Omnibus data sets used in this analysis.
by guest on February 21, 2020
http://stm.sciencem
ag.org/D
ownloaded from
Yohe et al., Sci. Transl. Med. 10, eaan4470 (2018) 4 July 2018
S C I E N C E T R A N S L A T I O N A L M E D I C I N E | R E S E A R C H A R T I C L E
15 of 17
Table S12. STR genotyping of RMS cell lines used in this study.Table S13. Primers used in this study.Table S14. Vectors used in this study.Table S15. Antibodies used in this study.Table S16. RAS-dependent_SE_DOWN and Myogenic_SE_UP gene sets.Table S17. Pilot 6 × 6 matrix screen excess HSA.Table S18. Matrix screen (10 × 10) excess HSA.References (77–89)
REFERENCES AND NOTES 1. I. A. Prior, P. D. Lewis, C. Mattos, A comprehensive survey of Ras mutations in cancer.
Cancer Res. 72, 2457–2467 (2012). 2. A. D. Cox, S. W. Fesik, A. C. Kimmelman, J. Luo, C. J. Der, Drugging the undruggable RAS:
Mission possible? Nat. Rev. Drug Discov. 13, 828–851 (2014). 3. M. L. Sos, S. Fischer, R. Ullrich, M. Peifer, J. M. Heuckmann, M. Koker, S. Heynck,
I. Stückrath, J. Weiss, F. Fischer, K. Michel, A. Goel, L. Regales, K. A. Politi, S. Perera, M. Getlik, L. C. Heukamp, S. Ansén, T. Zander, R. Beroukhim, H. Kashkar, K. M. Shokat, W. R. Sellers, D. Rauh, C. Orr, K. P. Hoeflich, L. Friedman, K.-K. Wong, W. Pao, R. K. Thomas, Identifying genotype-dependent efficacy of single and combined PI3K- and MAPK-pathway inhibition in cancer. Proc. Natl. Acad. Sci. U.S.A. 106, 18351–18356 (2009).
4. J. Villanueva, J. R. Infante, C. Krepler, P. Reyes-Uribe, M. Samanta, H.-Y. Chen, B. Li, R. K. Swoboda, M. Wilson, A. Vultur, M. Fukunaba-Kalabis, B. Wubbenhorst, T. Y. Chen, Q. Liu, K. Sproesser, D. J. DeMarini, T. M. Gilmer, A.-M. Martin, R. Marmorstein, D. C. Schultz, D. W. Speicher, G. C. Karakousis, W. Xu, R. K. Amaravadi, X. Xu, L. M. Schuchter, M. Herlyn, K. L. Nathanson, Concurrent MEK2 mutation and BRAF amplification confer resistance to BRAF and MEK inhibitors in melanoma. Cell Rep. 4, 1090–1099 (2013).
5. R. L. Darley, A. K. Burnett, Mutant RAS inhibits neutrophil but not macrophage differentiation and allows continued growth of neutrophil precursors. Exp. Hematol. 27, 1599–1608 (1999).
6. G. De Vita, L. Bauer, V. M. Correa da Costa, M. De Felice, M. G. Baratta, M. De Menna, R. Di Lauro, Dose-dependent inhibition of thyroid differentiation by RAS oncogenes. Mol. Endocrinol. 19, 76–89 (2005).
7. E. N. Olson, G. Spizz, M. A. Tainsky, The oncogenic forms of N-ras or H-ras prevent skeletal myoblast differentiation. Mol. Cell. Biol. 7, 2104–2111 (1987).
8. X. Chen, E. Stewart, A. A. Shelat, C. Qu, A. Bahrami, M. Hatley, G. Wu, C. Bradley, J. McEvoy, A. Pappo, S. Spunt, M. B. Valentine, V. Valentine, F. Krafcik, W. H. Lang, M. Wierdl, L. Tsurkan, V. Tolleman, S. M. Federico, C. Morton, C. Lu, L. Ding, J. Easton, M. Rusch, P. Nagahawatte, J. Wang, M. Parker, L. Wei, E. Hedlund, D. Finkelstein, M. Edmonson, S. Shurtleff, K. Boggs, H. Mulder, D. Yergeau, S. Skapek, D. S. Hawkins, N. Ramirez, P. M. Potter, J. A. Sandoval, A. M. Davidoff, E. R. Mardis, R. K. Wilson, J. Zhang, J. R. Downing, M. A. Dyer; St. Jude Children’s Research Hospital–Washington University Pediatric Cancer Genome Project, Targeting oxidative stress in embryonal rhabdomyosarcoma. Cancer Cell 24, 710–724 (2013).
9. J. F. Shern, L. Chen, J. Chmielecki, J. S. Wei, R. Patidar, M. Rosenberg, L. Ambrogio, D. Auclair, J. Wang, Y. K. Song, C. Tolman, L. Hurd, H. Liao, S. Zhang, D. Bogen, A. S. Brohl, S. Sindiri, D. Catchpoole, T. Badgett, G. Getz, J. Mora, J. R. Anderson, S. X. Skapek, F. G. Barr, M. Meyerson, D. S. Hawkins, J. Khan, Comprehensive genomic analysis of rhabdomyosarcoma reveals a landscape of alterations affecting a common genetic axis in fusion-positive and fusion-negative tumors. Cancer Discov. 4, 216–231 (2014).
10. L. Chen, J. F. Shern, J. S. Wei, M. E. Yohe, Y. K. Song, L. Hurd, H. Liao, D. Catchpoole, S. X. Skapek, F. G. Barr, D. S. Hawkins, J. Khan, Clonality and evolutionary history of rhabdomyosarcoma. PLOS Genet. 11, e1005075 (2015).
11. Z. Li, Y. Zhang, K. Ramanujan, Y. Ma, D. G. Kirsch, D. J. Glass, Oncogenic NRAS, required for pathogenesis of embryonic rhabdomyosarcoma, relies upon the HMGA2–IGF2BP2 pathway. Cancer Res. 73, 3041–3050 (2013).
12. J. M. Blum, L. Añó, Z. Li, D. Van Mater, B. D. Bennett, M. Sachdeva, I. Lagutina, M. Zhang, J. K. Mito, L. G. Dodd, D. M. Cardona, R. D. Dodd, N. Williams, Y. Ma, C. Lepper, C. M. Linardic, S. Mukherjee, G. C. Grosveld, C.-M. Fan, D. G. Kirsch, Distinct and overlapping sarcoma subtypes initiated from muscle stem and progenitor cells. Cell Rep. 5, 933–940 (2013).
13. S. Hettmer, J. Liu, C. M. Miller, M. C. Lindsay, C. A. Sparks, D. A. Guertin, R. T. Bronson, D. M. Langenau, A. J. Wagers, Sarcomas induced in discrete subsets of prospectively isolated skeletal muscle cells. Proc. Natl. Acad. Sci. U.S.A. 108, 20002–20007 (2011).
14. D. G. Kirsch, D. M. Dinulescu, J. B. Miller, J. Grimm, P. M. Santiago, N. P. Young, G. P. Nielsen, B. J. Quade, C. J. Chaber, C. P. Schultz, O. Takeuchi, R. T. Bronson, D. Crowley, S. J. Korsmeyer, S. S. Yoon, F. J. Hornicek, R. Weissleder, T. Jacks, A spatially and temporally restricted mouse model of soft tissue sarcoma. Nat. Med. 13, 992–997 (2007).
15. D. M. Langenau, M. D. Keefe, N. Y. Storer, J. R. Guyon, J. L. Kutok, X. Le, W. Goessling, D. S. Neuberg, L. M. Kunkel, L. I. Zon, Effects of RAS on the genesis of embryonal rhabdomyosarcoma. Genes Dev. 21, 1382–1395 (2007).
16. X. Le, E. K. Pugach, S. Hettmer, N. Y. Storer, J. Liu, A. A. Wills, A. DiBiase, E. Y. Chen, M. S. Ignatius, K. D. Poss, A. J. Wagers, D. M. Langenau, L. I. Zon, A novel chemical screening strategy in zebrafish identifies common pathways in embryogenesis and rhabdomyosarcoma development. Development 140, 2354–2364 (2013).
17. C. M. Linardic, D. L. Downie, S. Qualman, R. C. Bentley, C. M. Counter, Genetic modeling of human rhabdomyosarcoma. Cancer Res. 65, 4490–4495 (2005).
18. T. McKinnon, R. Venier, B. C. Dickson, L. Kabaroff, M. Alkema, L. Chen, J. F. Shern, M. E. Yohe, J. Khan, R. A. Gladdy, Kras activation in p53-deficient myoblasts results in high-grade sarcoma formation with impaired myogenic differentiation. Oncotarget 6, 14220–14232 (2015).
19. H. Tsumura, T. Yoshida, H. Saito, K. Imanaka-Yoshida, N. Suzuki, Cooperation of oncogenic K-ras and p53 deficiency in pleomorphic rhabdomyosarcoma development in adult mice. Oncogene 25, 7673–7679 (2006).
20. E. Y. Chen, M. T. DeRan, M. S. Ignatius, K. B. Grandinetti, R. Clagg, K. M. McCarthy, R. M. Lobbardi, J. Brockmann, C. Keller, X. Wu, D. M. Langenau, Glycogen synthase kinase 3 inhibitors induce the canonical WNT/beta-catenin pathway to suppress growth and self-renewal in embryonal rhabdomyosarcoma. Proc. Natl. Acad. Sci. U.S A. 111, 5349–5354 (2014).
21. C. J. Wright, P. L. McCormack, Trametinib: First global approval. Drugs 73, 1245–1254 (2013).
22. A. K. DeChant, K. Dee, C. M. Weyman, Raf-induced effects on the differentiation and apoptosis of skeletal myoblasts are determined by the level of Raf signaling: Abrogation of apoptosis by Raf is downstream of caspase 3 activation. Oncogene 21, 5268–5279 (2002).
23. C. M. Dorman, S. E. Johnson, Activated Raf inhibits avian myogenesis through a MAPK-dependent mechanism. Oncogene 18, 5167–5176 (1999).
24. C. M. Dorman, S. E. Johnson, Activated Raf inhibits myogenesis through a mechanism independent of activator protein 1-mediated myoblast transformation. J. Biol. Chem. 275, 27481–27487 (2000).
25. S. E. Johnson, C. M. Dorman, S. A. Bolanowski, Inhibition of myogenin expression by activated Raf is not responsible for the block to avian myogenesis. J. Biol. Chem. 277, 28742–28748 (2002).
26. J. Chen, Y. Wang, M. Hamed, N. Lacroix, Q. Li, Molecular basis for the regulation of transcriptional coactivator p300 in myogenic differentiation. Sci. Rep. 5, 13727 (2015).
27. B.-H. Jiang, J. Z. Zheng, P. K. Vogt, An essential role of phosphatidylinositol 3-kinase in myogenic differentiation. Proc. Natl. Acad. Sci. U.S.A. 95, 14179–14183 (1998).
28. F. Yue, P. Bi, C. Wang, J. Li, X. Liu, S. Kuang, Conditional loss of Pten in myogenic progenitors leads to postnatal skeletal muscle hypertrophy but age-dependent exhaustion of satellite cells. Cell Rep. 17, 2340–2353 (2016).
29. M. B. Ramocki, M. A. White, S. F. Konieczny, E. J. Taparowsky, A role for RalGDS and a novel Ras effector in the Ras-mediated inhibition of skeletal myogenesis. J. Biol. Chem. 273, 17696–17701 (1998).
30. A. R. Hinson, R. Jones, L. E. Crose, B. C. Belyea, F. G. Barr, C. M. Linardic, Human rhabdomyosarcoma cell lines for rhabdomyosarcoma research: Utility and pitfalls. Front. Oncol. 3, 183 (2013).
31. L. A. Mathews Griner, R. Guha, P. Shinn, R. M. Young, J. M. Keller, D. Liu, I. S. Goldlust, A. Yasgar, C. McKnight, M. B. Boxer, D. Y. Duveau, J.-K. Jiang, S. Michael, T. Mierzwa, W. Huang, M. J. Walsh, B. T. Mott, P. Patel, W. Leister, D. J. Maloney, C. A. Leclair, G. Rai, A. Jadhav, B. D. Peyser, C. P. Austin, S. E. Martin, A. Simeonov, M. Ferrer, L. M. Staudt, C. J. Thomas, High-throughput combinatorial screening identifies drugs that cooperate with ibrutinib to kill activated B-cell-like diffuse large B-cell lymphoma cells. Proc. Natl. Acad. Sci. U.S.A. 111, 2349–2354 (2014).
32. C. Ciccarelli, F. Marampon, A. Scoglio, A. Mauro, C. Giacinti, P. De Cesaris, B. M. Zani, p21WAF1 expression induced by MEK/ERK pathway activation or inhibition correlates with growth arrest, myogenic differentiation and onco-phenotype reversal in rhabdomyosarcoma cells. Mol. Cancer 4, 41 (2005).
33. C. Trapnell, D. Cacchiarelli, J. Grimsby, P. Pokharel, S. Li, M. Morse, N. J. Lennon, K. J. Livak, T. S. Mikkelsen, J. L. Rinn, The dynamics and regulators of cell fate decisions are revealed by pseudotemporal ordering of single cells. Nat. Biotechnol. 32, 381–386 (2014).
34. R. C. Sears, The life cycle of C-myc: From synthesis to degradation. Cell Cycle 3, 1133–1137 (2004).
35. Z. Tang, S. Dai, Y. He, R. A. Doty, L. D. Shultz, S. B. Sampson, C. Dai, MEK guards proteome stability and inhibits tumor-suppressive amyloidogenesis via HSF1. Cell 160, 729–744 (2015).
36. A. Chaikuad, E. M. Tacconi, J. Zimmer, Y. Liang, N. S. Gray, M. Tarsounas, S. Knapp, A unique inhibitor binding site in ERK1/2 is associated with slow binding kinetics. Nat. Chem. Biol. 10, 853–860 (2014).
by guest on February 21, 2020
http://stm.sciencem
ag.org/D
ownloaded from

Yohe et al., Sci. Transl. Med. 10, eaan4470 (2018) 4 July 2018
S C I E N C E T R A N S L A T I O N A L M E D I C I N E | R E S E A R C H A R T I C L E
16 of 17
37. J. Göke, Y. S. Chan, J. Yan, M. Vingron, H. H. Ng, Genome-wide kinase-chromatin interactions reveal the regulatory network of ERK signaling in human embryonic stem cells. Mol. Cell 50, 844–855 (2013).
38. W.-W. Tee, S. S. Shen, O. Oksuz, V. Narendra, D. Reinberg, Erk1/2 activity promotes chromatin features and RNAPII phosphorylation at developmental promoters in mouse ESCs. Cell 156, 678–690 (2014).
39. C. Y. McLean, D. Bristor, M. Hiller, S. L. Clarke, B. T. Schaar, C. B. Lowe, A. M. Wenger, G. Bejerano, GREAT improves functional interpretation of cis-regulatory regions. Nat. Biotechnol. 28, 495–501 (2010).
40. W. Huang da, B. T. Sherman, R. A. Lempicki, Systematic and integrative analysis of large gene lists using DAVID bioinformatics resources. Nat. Protoc. 4, 44–57 (2009).
41. R. Ciarapica, E. Carcarino, L. Adesso, M. De Salvo, G. Bracaglia, P. P. Leoncini, A. Dall’agnese, F. Verginelli, G. M. Milano, R. Boldrini, A. Inserra, S. Stifani, I. Screpanti, V. E. Marquez, S. Valente, A. Mai, P. L. Puri, F. Locatelli, D. Palacios, R. Rota, Pharmacological inhibition of EZH2 as a promising differentiation therapy in embryonal RMS. BMC Cancer 14, 139 (2014).
42. P. B. Rahl, C. Y. Lin, A. C. Seila, R. A. Flynn, S. McCuine, C. B. Burge, P. A. Sharp, R. A. Young, c-Myc regulates transcriptional pause release. Cell 141, 432–445 (2010).
43. C. F. Bentzinger, Y. X. Wang, M. A. Rudnicki, Building muscle: Molecular regulation of myogenesis. Cold Spring Harb. Perspect. Biol. 4, a008342 (2012).
44. T. L. Lo, C. W. Fong, P. Yusoff, A. B. McKie, M. S. Chua, H. Y. Leung, G. R. Guy, Sprouty and cancer: The first terms report. Cancer Lett. 242, 141–150 (2006).
45. S. Kohsaka, N. Shukla, N. Ameur, T. Ito, C. K. Ng, L. Wang, D. Lim, A. Marchetti, A. Viale, M. Pirun, N. D. Socci, L. X. Qin, R. Sciot, J. Bridge, S. Singer, P. Meyers, L. H. Wexler, F. G. Barr, S. Dogan, J. A. Fletcher, J. S. Reis-Filho, M. Ladanyi, A recurrent neomorphic mutation in MYOD1 defines a clinically aggressive subset of embryonal rhabdomyosarcoma associated with PI3K-AKT pathway mutations. Nat. Genet. 46, 595–600 (2014).
46. J. H. Miner, B. J. Wold, c-myc Inhibition of MyoD and myogenin-initiated myogenic differentiation. Mol. Cell. Biol. 11, 2842–2851 (1991).
47. J. Ernst, P. Kheradpour, T. S. Mikkelsen, N. Shoresh, L. D. Ward, C. B. Epstein, X. Zhang, L. Wang, R. Issner, M. Coyne, M. Ku, T. Durham, M. Kellis, B. E. Bernstein, Mapping and analysis of chromatin state dynamics in nine human cell types. Nature 473, 43–49 (2011).
48. C. Y. Lin, J. Lovén, P. B. Rahl, R. M. Paranal, C. B. Burge, J. E. Bradner, T. I. Lee, R. A. Young, Transcriptional amplification in tumor cells with elevated c-Myc. Cell 151, 56–67 (2012).
49. Y. Cao, Z. Yao, D. Sarkar, M. Lawrence, G. J. Sanchez, M. H. Parker, K. L. MacQuarrie, J. Davison, M. T. Morgan, W. L. Ruzzo, R. C. Gentleman, S. J. Tapscott, Genome-wide MyoD binding in skeletal muscle cells: A potential for broad cellular reprogramming. Dev. Cell 18, 662–674 (2010).
50. K. L. MacQuarrie, Z. Yao, A. P. Fong, S. J. Diede, E. R. Rudzinski, D. S. Hawkins, S. J. Tapscott, Comparison of genome-wide binding of MyoD in normal human myogenic cells and rhabdomyosarcomas identifies regional and local suppression of promyogenic transcription factors. Mol. Cell. Biol. 33, 773–784 (2013).
51. B. E. Gryder, M. E. Yohe, H.-C. Chou, X. Zhang, J. Marques, M. Wachtel, B. Schaefer, N. Sen, Y. Song, A. Gualtieri, S. Pomella, R. Rota, A. Cleveland, X. Wen, S. Sindiri, J. S. Wei, F. G. Barr, S. Das, T. Andresson, R. Guha, M. Lal-Nag, M. Ferrer, J. F. Shern, K. Zhao, C. J. Thomas, J. Khan, PAX3–FOXO1 establishes myogenic super enhancers and confers BET bromodomain vulnerability. Cancer Discov. 7, 884–899 (2017).
52. B. Chapuy, M. R. McKeown, C. Y. Lin, S. Monti, M. G. Roemer, J. Qi, P. B. Rahl, H. H. Sun, K. T. Yeda, J. G. Doench, E. Reichert, A. L. Kung, S. J. Rodig, R. A. Young, M. A. Shipp, J. E. Bradner, Discovery and characterization of super-enhancer-associated dependencies in diffuse large B cell lymphoma. Cancer Cell 24, 777–790 (2013).
53. C. Y. Lin, S. Erkek, Y. Tong, L. Yin, A. J. Federation, M. Zapatka, P. Haldipur, D. Kawauchi, T. Risch, H.-J. Warnatz, B. C. Worst, B. Ju, B. A. Orr, R. Zeid, D. R. Polaski, M. Segura-Wang, S. M. Waszak, D. T. Jones, M. Kool, V. Hovestadt, I. Buchhalter, L. Sieber, P. Johann, L. Chavez, S. Gröschel, M. Ryzhova, A. Korshunov, W. Chen, V. V. Chizhikov, K. J. Millen, V. Amstislavskiy, H. Lehrach, M.-L. Yaspo, R. Eils, P. Lichter, J. O. Korbel, S. M. Pfister, J. E. Bradner, P. A. Northcott, Active medulloblastoma enhancers reveal subgroup-specific cellular origins. Nature 530, 57–62 (2016).
54. C. A. Pratilas, B. S. Taylor, Q. Ye, A. Viale, C. Sander, D. B. Solit, N. Rosen, V600EBRAF is associated with disabled feedback inhibition of RAF-MEK signaling and elevated transcriptional output of the pathway. Proc. Natl. Acad. Sci. U.S.A. 106, 4519–4524 (2009).
55. ENCODE Project Consortium, An integrated encyclopedia of DNA elements in the human genome. Nature 489, 57–74 (2012).
56. M. N. Svalina, C. Keller, YAPping about differentiation therapy in muscle cancer. Cancer Cell 26, 154–155 (2014).
57. J. Renshaw, K. R. Taylor, R. Bishop, M. Valenti, A. De Haven Brandon, S. Gowan, S. A. Eccles, R. R. Ruddle, L. D. Johnson, F. I. Raynaud, J. L. Selfe, K. Thway, T. Pietsch, A. D. Pearson, J. Shipley, Dual blockade of the PI3K/AKT/mTOR (AZD8055) and RAS/MEK/ERK (AZD6244)
pathways synergistically inhibits rhabdomyosarcoma cell growth in vitro and in vivo. Clin. Cancer Res. 19, 5940–5951 (2013).
58. H. Ebi, R. B. Corcoran, A. Singh, Z. Chen, Y. Song, E. Lifshits, D. P. Ryan, J. A. Meyerhardt, C. Benes, J. Settleman, K.-K. Wong, L. C. Cantley, J. A. Engelman, Receptor tyrosine kinases exert dominant control over PI3K signaling in human KRAS mutant colorectal cancers. J. Clin. Invest. 121, 4311–4321 (2011).
59. S. A. Flanigan, T. M. Pitts, T. P. Newton, G. N. Kulikowski, A. C. Tan, M. C. McManus, A. Spreafico, M. I. Kachaeva, H. M. Selby, J. J. Tentler, S. G. Eckhardt, S. Leong, Overcoming IGF1R/IR resistance through inhibition of MEK signaling in colorectal cancer models. Clin. Cancer Res. 19, 6219–6229 (2013).
60. M. Molina-Arcas, D. C. Hancock, C. Sheridan, M. S. Kumar, J. Downward, Coordinate direct input of both KRAS and IGF1 receptor to activation of PI3 kinase in KRAS-mutant lung cancer. Cancer Discov. 3, 548–563 (2013).
61. E. Weisberg, A. Nonami, Z. Chen, E. Nelson, Y. Chen, F. Liu, H. Cho, J. Zhang, M. Sattler, C. Mitsiades, K. K. Wong, Q. Liu, N. S. Gray, J. D. Griffin, Upregulation of IGF1R by mutant RAS in leukemia and potentiation of RAS signaling inhibitors by small-molecule inhibition of IGF1R. Clin. Cancer Res. 20, 5483–5495 (2014).
62. J. R. Dry, S. Pavey, C. A. Pratilas, C. Harbron, S. Runswick, D. Hodgson, C. Chresta, R. McCormack, N. Byrne, M. Cockerill, A. Graham, G. Beran, A. Cassidy, C. Haggerty, H. Brown, G. Ellison, J. Dering, B. S. Taylor, M. Stark, V. Bonazzi, S. Ravishankar, L. Packer, F. Xing, D. B. Solit, R. S. Finn, N. Rosen, N. K. Hayward, T. French, P. D. Smith, Transcriptional pathway signatures predict MEK addiction and response to selumetinib (AZD6244). Cancer Res. 70, 2264–2273 (2010).
63. B. Nabet, P. Ó. Broin, J. M. Reyes, K. Shieh, C. Y. Lin, C. M. Will, R. Popovic, T. Ezponda, J. E. Bradner, A. A. Golden, J. D. Licht, Deregulation of the Ras-Erk signaling axis modulates the enhancer landscape. Cell Rep. 12, 1300–1313 (2015).
64. D. Hnisz, J. Schuijers, C. Y. Lin, A. S. Weintraub, B. J. Abraham, T. I. Lee, J. E. Bradner, R. A. Young, Convergence of developmental and oncogenic signaling pathways at transcriptional super-enhancers. Mol. Cell 58, 362–370 (2015).
65. A. M. Bennett, N. K. Tonks, Regulation of distinct stages of skeletal muscle differentiation by mitogen-activated protein kinases. Science 278, 1288–1291 (1997).
66. B. Winter, H. H. Arnold, Activated raf kinase inhibits muscle cell differentiation through a MEF2-dependent mechanism. J. Cell Sci. 113 (Pt 23), 4211–4220 (2000).
67. R. L. Perry, M. H. Parker, M. A. Rudnicki, Activated MEK1 binds the nuclear MyoD transcriptional complex to repress transactivation. Mol. Cell 8, 291–301 (2001).
68. I. Michailovici, H. A. Harrington, H. H. Azogui, Y. Yahalom-Ronen, A. Plotnikov, S. Ching, M. P. Stumpf, O. D. Klein, R. Seger, E. Tzahor, Nuclear to cytoplasmic shuttling of ERK promotes differentiation of muscle stem/progenitor cells. Development 141, 2611–2620 (2014).
69. J. Li, S. E. Johnson, ERK2 is required for efficient terminal differentiation of skeletal myoblasts. Biochem. Biophys. Res. Commun. 345, 1425–1433 (2006).
70. B. Seaberg, G. Henslee, S. Wang, X. Paez-Colasante, G. E. Landreth, M. Rimer, Muscle-derived extracellular signal-regulated kinases 1 and 2 are required for the maintenance of adult myofibers and their neuromuscular junctions. Mol. Cell. Biol. 35, 1238–1253 (2015).
71. F. Marampon, G. Bossi, C. Ciccarelli, A. Di Rocco, A. Sacchi, R. G. Pestell, B. M. Zani, MEK/ERK inhibitor U0126 affects in vitro and in vivo growth of embryonal rhabdomyosarcoma. Mol. Cancer Ther. 8, 543–551 (2009).
72. F. Marampon, C. Ciccarelli, B. M. Zani, Down-regulation of c-Myc following MEK/ERK inhibition halts the expression of malignant phenotype in rhabdomyosarcoma and in non muscle-derived human tumors. Mol. Cancer 5, 31 (2006).
73. G. Schaaf, M. Hamdi, D. Zwijnenburg, A. Lakeman, D. Geerts, R. Versteeg, M. Kool, Silencing of SPRY1 triggers complete regression of rhabdomyosarcoma tumors carrying a mutated RAS gene. Cancer Res. 70, 762–771 (2010).
74. B. A. Teicher, E. Polley, M. Kunkel, D. Evans, T. Silvers, R. Delosh, J. Laudeman, C. Ogle, R. Reinhart, M. Selby, J. Connelly, E. Harris, A. Monks, J. Morris, Sarcoma cell line screen of oncology drugs and investigational agents identifies patterns associated with gene and microRNA expression. Mol. Cancer Ther. 14, 2452–2462 (2015).
75. J. Xu, K. M. Haigis, A. J. Firestone, M. E. McNerney, Q. Li, E. Davis, S.-C. Chen, J. Nakitandwe, J. Downing, T. Jacks, M. M. Le Beau, K. Shannon, Dominant role of oncogene dosage and absence of tumor suppressor activity in Nras-driven hematopoietic transformation. Cancer Discov. 3, 993–1001 (2013).
76. M. Ceribelli, P. N. Kelly, A. L. Shaffer, G. W. Wright, W. Xiao, Y. Yang, L. A. Mathews Griner, R. Guha, P. Shinn, J. M. Keller, D. Liu, P. R. Patel, M. Ferrer, S. Joshi, S. Nerle, P. Sandy, E. Normant, C. J. Thomas, L. M. Staudt, Blockade of oncogenic IB kinase activity in diffuse large B-cell lymphoma by bromodomain and extraterminal domain protein inhibitors. Proc. Natl. Acad. Sci. U.S.A. 111, 11365–11370 (2014).
77. A. Young, D. Lou, F. McCormick, Oncogenic and wild-type Ras play divergent roles in the regulation of mitogen-activated protein kinase signaling. Cancer Discov. 3, 112–123 (2013).
78. A. G. Gilmartin, M. R. Bleam, A. Groy, K. G. Moss, E. A. Minthorn, S. G. Kulkarni, C. M. Rominger, S. Erskine, K. E. Fisher, J. Yang, F. Zappacosta, R. Annan, D. Sutton, S. G. Laquerre, GSK1120212 (JTP-74057) is an inhibitor of MEK activity and activation with
by guest on February 21, 2020
http://stm.sciencem
ag.org/D
ownloaded from
Yohe et al., Sci. Transl. Med. 10, eaan4470 (2018) 4 July 2018
S C I E N C E T R A N S L A T I O N A L M E D I C I N E | R E S E A R C H A R T I C L E
17 of 17
favorable pharmacokinetic properties for sustained in vivo pathway inhibition. Cancer Res. 17, 989–1000 (2011).
79. X. Hou, F. Huang, L. F. Macedo, S. C. Harrington, K. A. Reeves, A. Greer, F. G. Finckenstein, A. Brodie, M. M. Gottardis, J. M. Carboni, P. Haluska, Dual IGF-1R/InsR inhibitor BMS-754807 synergizes with hormonal agents in treatment of estrogen-dependent breast cancer. Cancer Res. 71, 7597–7607 (2011).
80. C. Khanna, J. Prehn, C. Yeung, J. Caylor, M. Tsokos, L. Helman, An orthotopic model of murine osteosarcoma with clonally related variants differing in pulmonary metastatic potential. Clin. Exp. Metastasis 18, 261–271 (2000).
81. Y. Zhang, T. Liu, C. A. Meyer, J. Eeckhoute, D. S. Johnson, B. E. Bernstein, C. Nusbaum, R. M. Myers, M. Brown, W. Li, X. S. Liu, Model-based analysis of ChIP-Seq (MACS). Genome Biol. 9, R137 (2008).
82. S. Heinz, C. Benner, N. Spann, E. Bertolino, Y. C. Lin, P. Laslo, J. X. Cheng, C. Murre, H. Singh, C. K. Glass, Simple combinations of lineage-determining transcription factors prime cis- regulatory elements required for macrophage and B cell identities. Mol. Cell 38, 576–589 (2010).
83. J. Ernst, M. Kellis, ChromHMM: Automating chromatin-state discovery and characterization. Nat. Methods 9, 215–216 (2012).
84. W. A. Whyte, D. A. Orlando, D. Hnisz, B. J. Abraham, C. Y. Lin, M. H. Kagey, P. B. Rahl, T. I. Lee, R. A. Young, Master transcription factors and mediator establish super-enhancers at key cell identity genes. Cell 153, 307–319 (2013).
85. A. R. Quinlan, I. M. Hall, BEDTools: A flexible suite of utilities for comparing genomic features. Bioinformatics 26, 841–842 (2010).
86. L. Shen, N. Shao, X. Liu, E. Nestler, ngs.plot: Quick mining and visualization of next-generation sequencing data by integrating genomic databases. BMC Genomics 15, 284 (2014).
87. D. A. Orlando, M. W. Chen, V. E. Brown, S. Solanki, Y. J. Choi, E. R. Olson, C. C. Fritz, J. E. Bradner, M. G. Guenther, Quantitative ChIP-seq normalization reveals global modulation of the epigenome. Cell Rep. 9, 1163–1170 (2014).
88. W. Chang, A. Brohl, R. Patidar, S. Sindiri, J. F. Shern, J. S. Wei, Y. K. Song, M. E. Yohe, B. E. Gryder, S. Zhang, K. A. Calzone, N. Shivaprasad, X. Wen, T. Badgett, M. Miettinen, K. R. Hartman, J. C. League-Pascual, T. Trahair, B. C. Widemann, M. S. Merchant, R. N. Kaplan, J. C. Lin, J. Khan, Multi-dimensional ClinOmics for precision therapy of children and adolescent young adults with relapsed and refractory cancer: A report from the Center for Cancer Research. Clin. Cancer Res. (2016).
89. W. Jin, Q. Tang, M. Wan, K. Cui, Y. Zhang, G. Ren, B. Ni, J. Sklar, T. M. Przytycka, R. Childs, D. Levens, K. Zhao, Genome-wide detection of DNase I hypersensitive sites in single cells and FFPE tissue samples. Nature 528, 142–146 (2015).
Acknowledgments: We are grateful to R. Robey, C. Thiele, R. Hawley, B. Stanton, J. Madigan, M. Hall, P. Randazzo, R. Kaplan, V. Sartorelli, J. Waterfall, D. Singer, and D. Levens for helpful discussions and review of the manuscript. The content of this publication does not necessarily reflect the views or policies of the Department of Health and Human Services, nor does mention of trade names, commercial products, or organizations imply endorsement by the U.S. Government. Animal care was provided in accordance with the procedures outlined in the Guide for the Care and Use of Laboratory Animals (National Research Council, 2011; National Academies Press). Funding: This project has been funded in whole or in part with Federal funds from the National Cancer Institute, NIH, under contract no. HHSN261200800001E. M.E.Y. is funded by an Alex’s Lemonade Stand Foundation Young Investigator Award. Author contributions: M.E.Y. developed the overall concept, performed the experiments, analyzed the data, and wrote the manuscript. B.E.G. helped develop the overall concept, performed the experiments and bioinformatic experiments, analyzed the data, and edited the manuscript. Y.K.S. performed the next-generation sequencing and quantitative reverse transcription PCR experiments. H.-C.C. helped performing the ChIP-seq and DNase-seq bioinformatics experiments. J.F.S and J.S.W. helped develop the overall concept and edited the manuscript. S.S., A.W., and R.P. performed the RNA-seq analysis. X.Z. performed the high-throughput drug screening experiments. A.M., K.A.I., C.M.R, P.A., and S.D. helped design and execute xenograft experiments. D.B. and E.F.E. performed and analyzed the IHC experiments. J.-Q.C. and X.L. performed the Simple Western experiments. R.G. analyzed the high-throughput drug screening data. K.Z., C.J.T., and M.F. helped develop the overall concept. J.K. supervised the overall study, helped develop the overall concept, and edited the manuscript. Competing interests: The authors declare that they have no competing interests. Data and materials availability: Raw sequencing data and processed files have been made available through Gene Expression Omnibus SuperSeries accession number GSE85171.
Submitted 26 September 2017Accepted 6 June 2018Published 4 July 201810.1126/scitranslmed.aan4470
Citation: M. E. Yohe, B. E. Gryder, J. F. Shern, Y. K. Song, H.-C. Chou, S. Sindiri, A. Mendoza, R. Patidar, X. Zhang, R. Guha, D. Butcher, K. A. Isanogle, C. M. Robinson, X. Luo, J.-Q. Chen, A. Walton, P. Awasthi, E. F. Edmondson, S. Difilippantonio, J. S. Wei, K. Zhao, M. Ferrer, C. J. Thomas, J. Khan, MEK inhibition induces MYOG and remodels super-enhancers in RAS-driven rhabdomyosarcoma. Sci. Transl. Med. 10, eaan4470 (2018).
by guest on February 21, 2020
http://stm.sciencem
ag.org/D
ownloaded from

rhabdomyosarcomaMEK inhibition induces MYOG and remodels super-enhancers in RAS-driven
Keji Zhao, Marc Ferrer, Craig J. Thomas and Javed KhanXiaoling Luo, Jin-Qiu Chen, Ashley Walton, Parirokh Awasthi, Elijah F. Edmondson, Simone Difilippantonio, Jun S. Wei,Mendoza, Rajesh Patidar, Xiaohu Zhang, Rajarashi Guha, Donna Butcher, Kristine A. Isanogle, Christina M. Robinson, Marielle E. Yohe, Berkley E. Gryder, Jack F. Shern, Young K. Song, Hsien-Chao Chou, Sivasish Sindiri, Arnulfo
DOI: 10.1126/scitranslmed.aan4470, eaan4470.10Sci Transl Med
synergistically improved treatment efficacy in the xenografted mice.improved tumor volume and survival in xenograft mouse models. Combining trametinib and an IGF1R inhibitor chromatin and super-enhancer remodeling, which in turn resulted in cellular differentiation in cell lines andinducing epigenetic changes via the MAP kinase pathway. Treatment with the MEK/ERK inhibitor trametinib led to
. discovered that RAS blocks myogenesis in fusion-negative rhabdomyosarcoma (FN-RMS) byet alunclear. Yohe display mutated RAS, although the mechanism through which RAS promotes tumor formation has remained
Rhabdomyosarcomas occur when skeletal muscle precursors fail to differentiate. These tumors oftenMuscling in on RAS
ARTICLE TOOLS http://stm.sciencemag.org/content/10/448/eaan4470
MATERIALSSUPPLEMENTARY http://stm.sciencemag.org/content/suppl/2018/07/02/10.448.eaan4470.DC1
CONTENTRELATED
http://science.sciencemag.org/content/sci/366/6466/734.fullhttp://science.sciencemag.org/content/sci/366/6466/684.fullhttp://stm.sciencemag.org/content/scitransmed/11/497/eaaw0790.fullhttp://science.sciencemag.org/content/sci/363/6433/1280.fullhttp://stm.sciencemag.org/content/scitransmed/6/229/229ra41.fullhttp://stm.sciencemag.org/content/scitransmed/10/441/eaao4680.fullhttp://stm.sciencemag.org/content/scitransmed/9/394/eaal5253.fullhttp://stm.sciencemag.org/content/scitransmed/8/347/347ec110.full
REFERENCES
http://stm.sciencemag.org/content/10/448/eaan4470#BIBLThis article cites 88 articles, 36 of which you can access for free
PERMISSIONS http://www.sciencemag.org/help/reprints-and-permissions
Terms of ServiceUse of this article is subject to the
registered trademark of AAAS. is aScience Translational MedicineScience, 1200 New York Avenue NW, Washington, DC 20005. The title
(ISSN 1946-6242) is published by the American Association for the Advancement ofScience Translational Medicine
of Science. No claim to original U.S. Government WorksCopyright © 2018 The Authors, some rights reserved; exclusive licensee American Association for the Advancement
by guest on February 21, 2020
http://stm.sciencem
ag.org/D
ownloaded from