cancer incidence and mortality in pune … pune cancer registry divison of the bombay cancer...
TRANSCRIPT

PUNE CANCER REGISTRY DIVISION OF
THE MUMBAI CANCER REGISTRY
CANCER INCIDENCE AND MORTALITY
IN PUNE CITY
2006-2010
INDIAN CANCER SOCIETY MUMBAI, INDIA.

2
PUNE CANCER REGISTRY DIVISON OF
THE BOMBAY CANCER REGISTRY
CANCER INCIDENCE AND MORTALITY
IN PUNE CITY
2006-2010
Dr.Purvish Parikh Principal Investigator Pune Cancer Registry Indian Cancer Society
Ms.S.S.Koyande
Executive In-Charge & Co-Principal Investigator
Pune cancer Registry Indian Cancer Society
Mumbai, India
Dr.P.S.Adhav Hon. Secretary
Pune Cancer Registry Indian Cancer Society
B.J.Medical College and Hospital Pune, India
Dr.Kalpana Kulkarni
Hon.Joint Secretary Pune Cancer Registry Indian Cancer Society
B.J.Medical College and Hospital Pune, India

3
Acknowledgements The Pune Cancer Registry Division of the Mumbai Caner Registry became operative in January 1972 as a collaborative effort with the B.J.Medical College, Pune. The staff members of the department of Preventive and Social Medicine at the medical college were entrusted with the day-to-day work relating to the registry. This publication the ninth issue in the series “Cancer Morbidity and Mortality in the Pune City Agglomeration” and is based on all new cancer cases diagnosed in the resident population of Pune City during the 5-years period, 1st January 2006 to 31st December 2010. We are grateful to the administration and staff members of various hospitals and consultants in private practice in Pune and Mumbai, without whose cooperation our efforts to register all the resident cancer cases in Pune, would not have succeeded. The executive Health Officer of the Pune Municipal Corporation deserves the special mention and we sincerely thank him, for making the death records of the city population freely available to us. We also wish to thank the Director of Census Operations of the Maharashtra State, for supplying us with the population breakdown according to age, sex and religion for Pune city. We are indebted to the Dean of the Sassoon Hospital, Pune, for permitting us to examine the medical records of the hospital and providing adequate office space for our staff members. Dr.Purvish Parikh Mrs.Shravani Koyande Dr.P.S.Adhav Dr.Kalpana Kulkarni

4
STAFF OF PUNE CANCER REGISTRY (As on 01.01.2013)
Medical Social Investigators Mrs.N.S.Shaikh M.S.W. Mrs.S. Kochure, M.S.W. Research Assistant Mrs.V.V.Jahagirdar B.A.
5
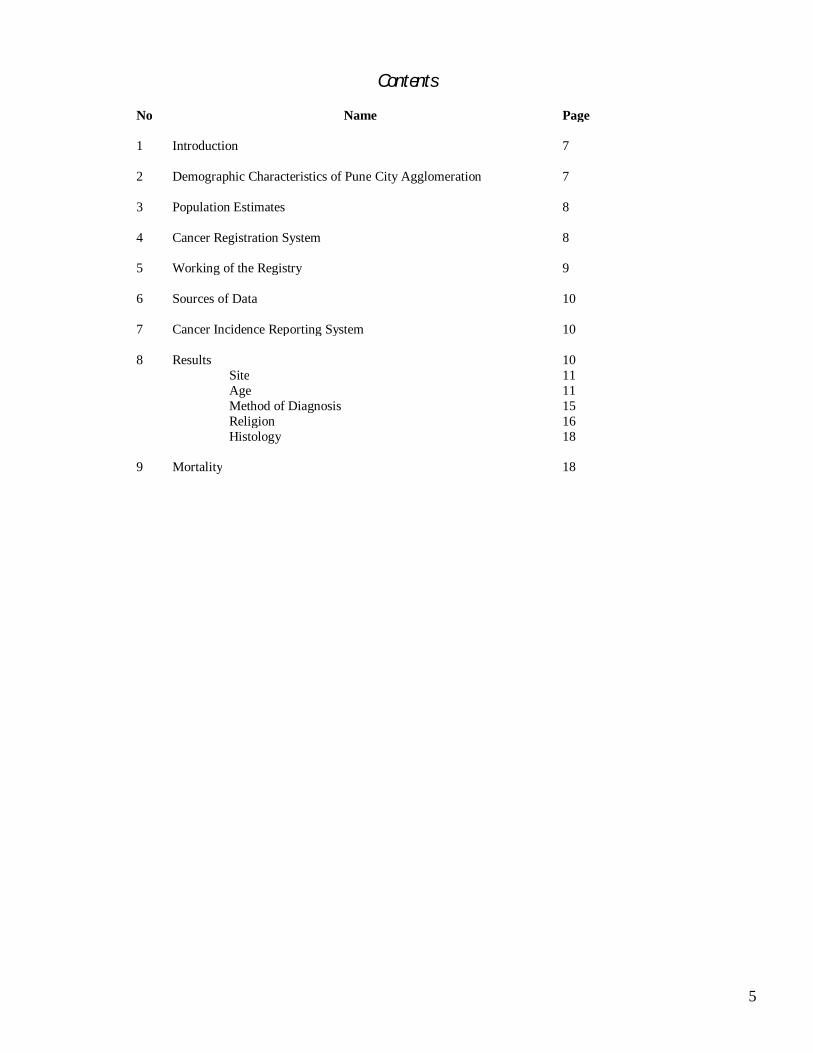
Contents
No Name Page 1 Introduction 7 2 Demographic Characteristics of Pune City Agglomeration 7 3 Population Estimates 8 4 Cancer Registration System 8 5 Working of the Registry 9 6 Sources of Data 10 7 Cancer Incidence Reporting System 10 8 Results 10 Site 11 Age 11 Method of Diagnosis 15 Religion 16 Histology 18 9 Mortality 18

6
List of Tables No Name Page
1 Estimated resident population by age and sex, as on 1st July 2008 (Mid point of the period
2006-2010), Pune City Agglomeration, Total Population (All religious community) 22
2. Estimated Resident population by religion and sex, as on 1st July 2008 (Mid point of the period 2006-2010), Pune City Agglomeration
22
3 Incident cases of cancer by source and year of registration, with percentages, Males, Pune City Agglomeration, 2006-2010
23
4 Incident cases of cancer by source and year of registration, with percentages, Females, Pune City Agglomeration, 2006-2010
23
5 Number of Incident cases of cancer by site group (ICD-10) and year of registration with percentages, Pune City Agglomeration, Male, 2006-2010
24
6 Number of Incident cases of cancer by site group (ICD-10) and year of registration with percentages, Pune City Agglomeration, Female, 2006-2010
24
7 Number of Incident cases of cancer by site (ICD-10) and age with percentages, Pune City Agglomeration, Male, 2006-2010.
25
8 Number of Incident cases of cancer by site (ICD-10) and age with percentages, Pune City Agglomeration, Female, 2006-2010.
26
9 Average Annual age-specific, World age-adjusted and truncated (35-64 years) incidence rates of newly diagnosed cancer cases per 100,000 persons Pune City Agglomeration, Male, 2006-2010.
27
10 Average Annual age-specific, World age-adjusted and truncated (35-64 years) incidence rates of newly diagnosed cancer cases per 100,000 persons Pune City Agglomeration, Female, 2006-2010.
28
11 Incident cases of cancer by site (ICD-10) and Method of Diagnosis with percentages, Pune City Agglomeration, Male, 2006-2010.
29
12 Incident cases of cancer by site (ICD-10) and Method of Diagnosis with percentages, Pune City Agglomeration, Female, 2006-2010.
30
13 Incident cases of cancer by site (ICD-10) and Religion with percentages, Pune City Agglomeration, Male, 2006-2010.
31
14 Incident cases of cancer by site (ICD-10) and Religion with percentages, Pune City Agglomeration, Female, 2006-2010.
32
15 Number of Histologically proved incident cases of histology and sex with percentages, Pune City Agglomeration, 2006-2010.
33
16 Number of cancer deaths by age and site (ICD-10), with percentages (Death in Period), Male, Pune City Agglomeration, 2006-2010.
34
17 Number of cancer deaths by age and site (ICD-10), with percentages (Death in Period), Female, Pune City Agglomeration, 2006-2010.
35
18 Age-specific, world age-adjusted and truncated (35-64 years) death rate per 100,000 persons, Male, Pune City Agglomeration, 2006-2010.
36
19 Age-specific, world age-adjusted and truncated (35-64 years) death rate per 100,000 persons, Female, Pune City Agglomeration, 2006-2010.
37
7
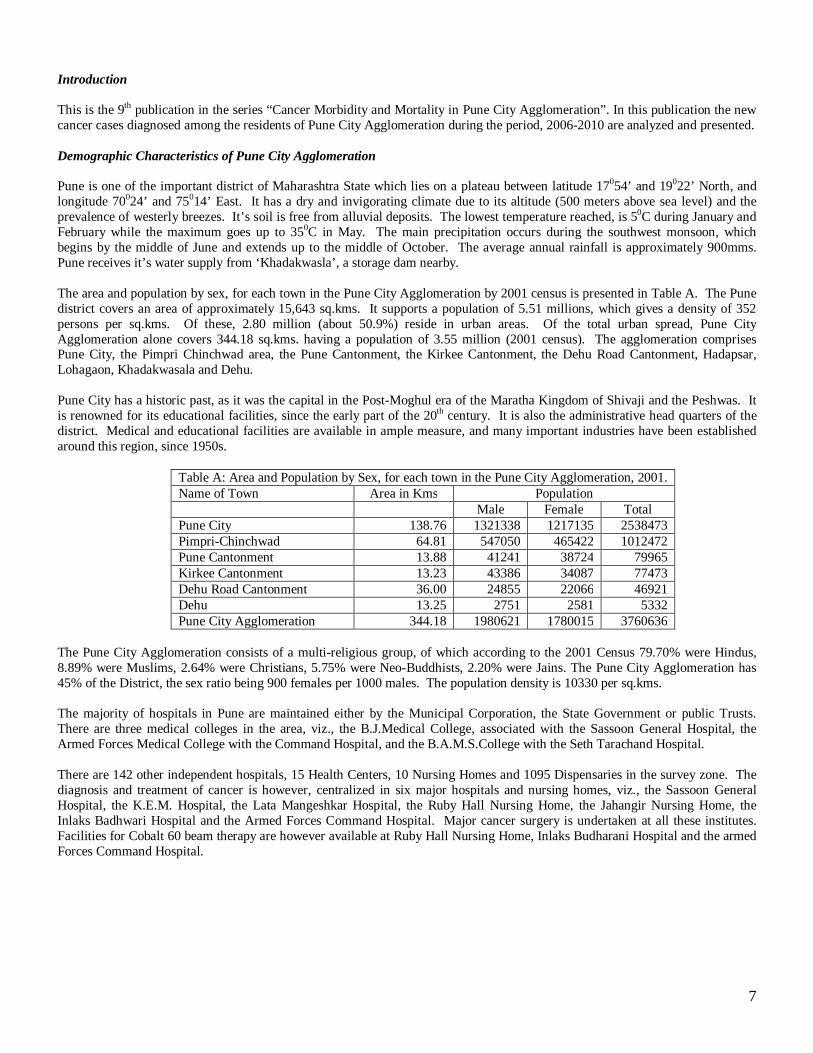
Introduction This is the 9th publication in the series “Cancer Morbidity and Mortality in Pune City Agglomeration”. In this publication the new cancer cases diagnosed among the residents of Pune City Agglomeration during the period, 2006-2010 are analyzed and presented. Demographic Characteristics of Pune City Agglomeration Pune is one of the important district of Maharashtra State which lies on a plateau between latitude 17054’ and 19022’ North, and longitude 70024’ and 75014’ East. It has a dry and invigorating climate due to its altitude (500 meters above sea level) and the prevalence of westerly breezes. It’s soil is free from alluvial deposits. The lowest temperature reached, is 50C during January and February while the maximum goes up to 350C in May. The main precipitation occurs during the southwest monsoon, which begins by the middle of June and extends up to the middle of October. The average annual rainfall is approximately 900mms. Pune receives it’s water supply from ‘Khadakwasla’, a storage dam nearby. The area and population by sex, for each town in the Pune City Agglomeration by 2001 census is presented in Table A. The Pune district covers an area of approximately 15,643 sq.kms. It supports a population of 5.51 millions, which gives a density of 352 persons per sq.kms. Of these, 2.80 million (about 50.9%) reside in urban areas. Of the total urban spread, Pune City Agglomeration alone covers 344.18 sq.kms. having a population of 3.55 million (2001 census). The agglomeration comprises Pune City, the Pimpri Chinchwad area, the Pune Cantonment, the Kirkee Cantonment, the Dehu Road Cantonment, Hadapsar, Lohagaon, Khadakwasala and Dehu. Pune City has a historic past, as it was the capital in the Post-Moghul era of the Maratha Kingdom of Shivaji and the Peshwas. It is renowned for its educational facilities, since the early part of the 20th century. It is also the administrative head quarters of the district. Medical and educational facilities are available in ample measure, and many important industries have been established around this region, since 1950s.
Table A: Area and Population by Sex, for each town in the Pune City Agglomeration, 2001. Name of Town Area in Kms Population Male Female Total Pune City 138.76 1321338 1217135 2538473 Pimpri-Chinchwad 64.81 547050 465422 1012472 Pune Cantonment 13.88 41241 38724 79965 Kirkee Cantonment 13.23 43386 34087 77473 Dehu Road Cantonment 36.00 24855 22066 46921 Dehu 13.25 2751 2581 5332 Pune City Agglomeration 344.18 1980621 1780015 3760636
The Pune City Agglomeration consists of a multi-religious group, of which according to the 2001 Census 79.70% were Hindus, 8.89% were Muslims, 2.64% were Christians, 5.75% were Neo-Buddhists, 2.20% were Jains. The Pune City Agglomeration has 45% of the District, the sex ratio being 900 females per 1000 males. The population density is 10330 per sq.kms. The majority of hospitals in Pune are maintained either by the Municipal Corporation, the State Government or public Trusts. There are three medical colleges in the area, viz., the B.J.Medical College, associated with the Sassoon General Hospital, the Armed Forces Medical College with the Command Hospital, and the B.A.M.S.College with the Seth Tarachand Hospital. There are 142 other independent hospitals, 15 Health Centers, 10 Nursing Homes and 1095 Dispensaries in the survey zone. The diagnosis and treatment of cancer is however, centralized in six major hospitals and nursing homes, viz., the Sassoon General Hospital, the K.E.M. Hospital, the Lata Mangeshkar Hospital, the Ruby Hall Nursing Home, the Jahangir Nursing Home, the Inlaks Badhwari Hospital and the Armed Forces Command Hospital. Major cancer surgery is undertaken at all these institutes. Facilities for Cobalt 60 beam therapy are however available at Ruby Hall Nursing Home, Inlaks Budharani Hospital and the armed Forces Command Hospital.
8
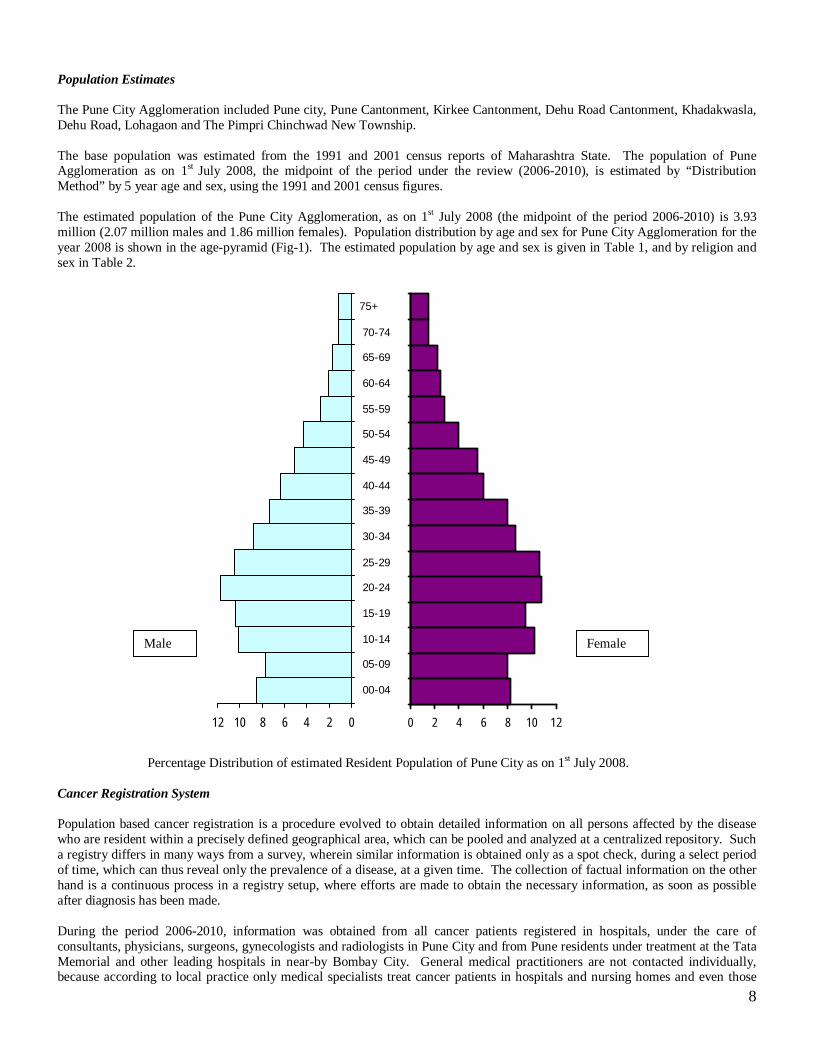
Population Estimates The Pune City Agglomeration included Pune city, Pune Cantonment, Kirkee Cantonment, Dehu Road Cantonment, Khadakwasla, Dehu Road, Lohagaon and The Pimpri Chinchwad New Township. The base population was estimated from the 1991 and 2001 census reports of Maharashtra State. The population of Pune Agglomeration as on 1st July 2008, the midpoint of the period under the review (2006-2010), is estimated by “Distribution Method” by 5 year age and sex, using the 1991 and 2001 census figures. The estimated population of the Pune City Agglomeration, as on 1st July 2008 (the midpoint of the period 2006-2010) is 3.93 million (2.07 million males and 1.86 million females). Population distribution by age and sex for Pune City Agglomeration for the year 2008 is shown in the age-pyramid (Fig-1). The estimated population by age and sex is given in Table 1, and by religion and sex in Table 2.
Percentage Distribution of estimated Resident Population of Pune City as on 1st July 2008. Cancer Registration System Population based cancer registration is a procedure evolved to obtain detailed information on all persons affected by the disease who are resident within a precisely defined geographical area, which can be pooled and analyzed at a centralized repository. Such a registry differs in many ways from a survey, wherein similar information is obtained only as a spot check, during a select period of time, which can thus reveal only the prevalence of a disease, at a given time. The collection of factual information on the other hand is a continuous process in a registry setup, where efforts are made to obtain the necessary information, as soon as possible after diagnosis has been made. During the period 2006-2010, information was obtained from all cancer patients registered in hospitals, under the care of consultants, physicians, surgeons, gynecologists and radiologists in Pune City and from Pune residents under treatment at the Tata Memorial and other leading hospitals in near-by Bombay City. General medical practitioners are not contacted individually, because according to local practice only medical specialists treat cancer patients in hospitals and nursing homes and even those
024681012
75+
70-74
65-69
60-64
55-59
50-54
45-49
40-44
35-39
30-34
25-29
20-24
15-19
10-14
05-09
00-04
0 2 4 6 8 10 12
Male Female

9
patients not admitted for hospital care are at one stage or the other referred to such specialists by the general practitioners. The death records maintained by the Pune Municipal Corporation provide a means for checking on any missed cases. Working of the Registry Staff members personally visit the wards of the co-operating hospitals regularly; to interview all confirmed cancer patients and also those who are under cancer investigation. The record files maintained by the various departments of these hospitals viz. Pathology, Hematology, Radiology and the various registers in the specialized surgical and medical wards, are also examined. The requisite details obtained for each patient, are cross-checked with the information collected from the various departments of the collaborating hospitals, to ensure completeness of records. Full information on every cancer patient registered at each and every hospital is thus obtained, irrespective of whether or not the patient is subsequently treated at the particular hospital. Additional information is obtained every time a cancer patient is re-admitted or re-examined at the institution. As a result of such data collection from different hospitals. One and the same patient is sometimes found to be registered at two or more hospitals. Care is taken, to see that multiple entries for the same patient are not made in our records. On the other hand in some instances complete medical information is obtained by combining the data obtained from two or more hospitals, of one and the same patient. Supplementary information can often be gleaned from the death records maintained by the Vital Statistics Division of the Pune Municipal Corporation. Copies are made of all death certificates, which mention cancer or tumor as the cause of death. These death certificates are then matched against the registered cases in our files. Every cancer death not traceable to an entry in our files, is labeled as an “unmatched death” and the date of death is then taken as the date of first diagnosis, and is so registered in the corresponding year’s data file. Furthermore copies of all death certificates where the term ‘Cancer’ or ‘Tumor’ is mentioned as the cause of death are individually scrutinized to confirm the statement. Only patients residing in Pune City and suburbs are included in the register so that the information collected could be related to a known population at risk. Non-residents, whose residence cannot be specifically confirmed, are also not included in the study. After collecting the necessary information from the various collaborating institutes, the proforma sheets are classified into three groups, resident, non-resident and residence not known. Non-resident cases are filed site-wise and sex-wise. If the cancer patient whose duration of residence is not known, is found enrolled in the electoral rolls, he is considered as a resident. All other cases whose duration of residence is not known, are filed alphabetically. The resident cases are cross checked with the cards of the alphabetic index. Previously reported cases were edited and the new cases were registered and filed according to the site of cancer, the sex of the patient and the registration number. Copies of the death certificates, from the Vital Statistics Department of the Municipal Corporation are classified according to residential criteria. Non-resident cases are filed alphabetically, as per cause of death and sex. Resident cases are checked with the alphabetic index. Unmatched cases are registered in the morbidity files. All deaths (matched and unmatched) are entered separately in the corresponding years death files, and are filed numerically by sex and cause of death.
10
Sources of Data Two major sources have been utilized for cancer data collection. All hospitals, nursing homes and consultants in private practice in the registry area. The Vital Statistics Division of the Department of Public Health of the Pune Municipal Corporation.
Cancer Incidence Reporting System Cancer Incidence is defined as the occurrence of new cancer cases in a defined population during a specified time period. For the purpose of this report, 2006-2010 incidence is based on those cancers registered and which were first diagnosed between 1st January 2006 and 31st December 2010 from residents of Pune City Agglomeration. All malignant tumors including those where the pathologist may merely suspected malignant changes are registered. Cases under code ‘O’ (Benign) or ‘1’ (uncertain whether benign or malignant borderline malignancy) or ‘2’ (carcinoma in situ) are not included in our files. Cancer cases where the death certificate is the only source of information, are however included. Patients, in whom cancer has been ruled out or has not yet been diagnosed, are also omitted from our register. We utilize the coding system devised by the World Health Organization using code numbers C00-C95 as published in the Manual of the International classification of Diseases, Injuries and Causes of Death (10th revision of 1990). For histology coding, the World Health Organization’s 2002 edition of International Classification of Diseases for Oncology (ICD-O) giving histogenic and malignancy codes is followed, in conjunction with the primary site codes suggested by the World Health Organization.
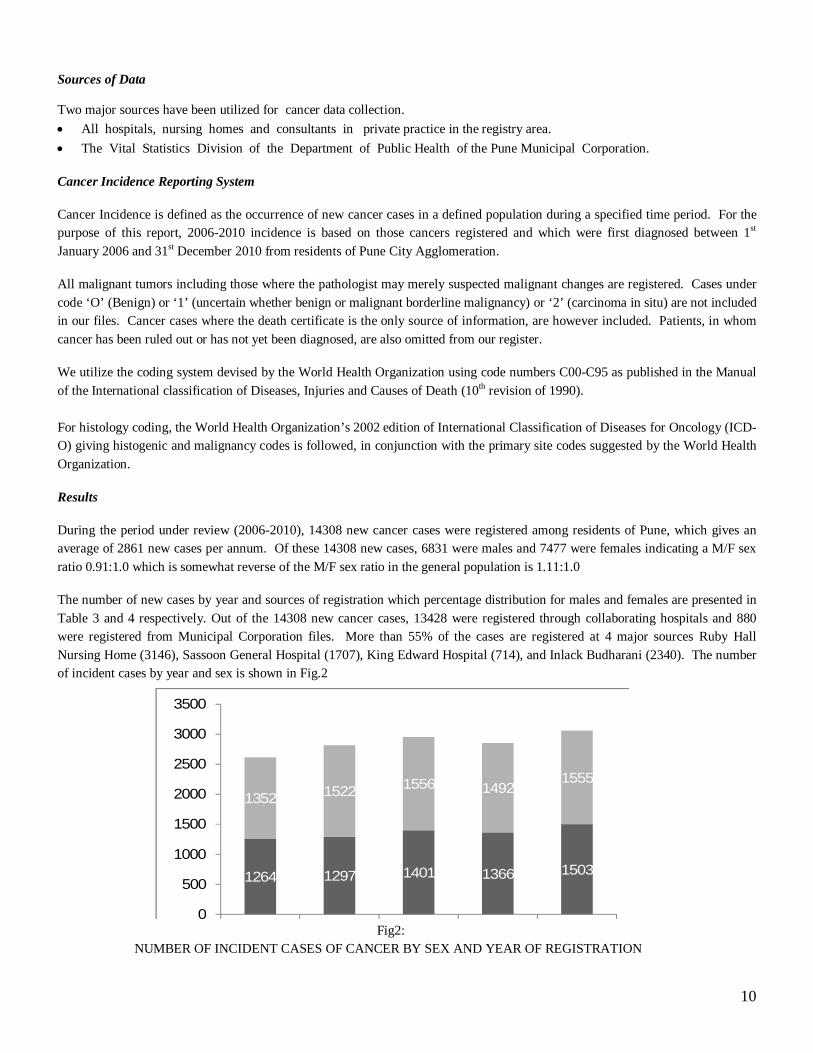
Results During the period under review (2006-2010), 14308 new cancer cases were registered among residents of Pune, which gives an average of 2861 new cases per annum. Of these 14308 new cases, 6831 were males and 7477 were females indicating a M/F sex ratio 0.91:1.0 which is somewhat reverse of the M/F sex ratio in the general population is 1.11:1.0 The number of new cases by year and sources of registration which percentage distribution for males and females are presented in Table 3 and 4 respectively. Out of the 14308 new cancer cases, 13428 were registered through collaborating hospitals and 880 were registered from Municipal Corporation files. More than 55% of the cases are registered at 4 major sources Ruby Hall Nursing Home (3146), Sassoon General Hospital (1707), King Edward Hospital (714), and Inlack Budharani (2340). The number of incident cases by year and sex is shown in Fig.2
1264 1297 1401 1366 1503
1352 1522 1556 14921555
0
500
1000
1500
2000
2500
3000
3500
Fig2: NUMBER OF INCIDENT CASES OF CANCER BY SEX AND YEAR OF REGISTRATION

11
Site
TABLE B: NUMBER OF NEW CANCER CASES BY SITEGROUP AND SEX WITH PERCENTAGE DISTRIBUTION, PUNE CITY 2006-2010. SITE GROUP MALE FEMALE TOTAL CASES % CASES % CASES % Buccal Cavity & Pharynx 1287 18.8 599 8.0 1886 13.2 Digestive Organs 1842 27.0 1132 15.1 2974 20.8 Respiratory Organs 940 13.8 369 4.9 1309 9.1 Bone, C.Tissue, Skin, & Breast 359 5.3 2437 32.6 2796 19.5 Genital Organs 674 9.9 1906 25.5 2580 18.0 Urinary Organs 381 5.6 147 2.0 528 3.7 Eye, Brain, Thyroid & Secondary 663 9.7 489 6.5 1152 8.1 Lymphomas & Leukemias 685 10.0 398 5.3 1083 7.6 Total 6831 100.0 7477 100.0 14308 100.0
The percentage distribution of new cancer cases diagnosed during 2006-2010, by site-group and year of registration for males and females is presented in Table 5 and 6 respectively. In males, the digestive system is found to be most commonest cancer site group followed by buccal mucossa and respiratory organs in each year. In females, breast ranked first followed by genital organs and digestive system. Total number of cancer cases has been gradually increased each year from 2006 to 2010, except in 2009 and then it has been dropped slightly in both the sexes. Age The number of new cancer cases by site and age are presented in Table 7 & 8 for the period 2006-2010, for males and females respectively. The current distribution of the resident population and the new cancer cases by broad age groups and sex for the period 2006-2010 is presented in Table C.
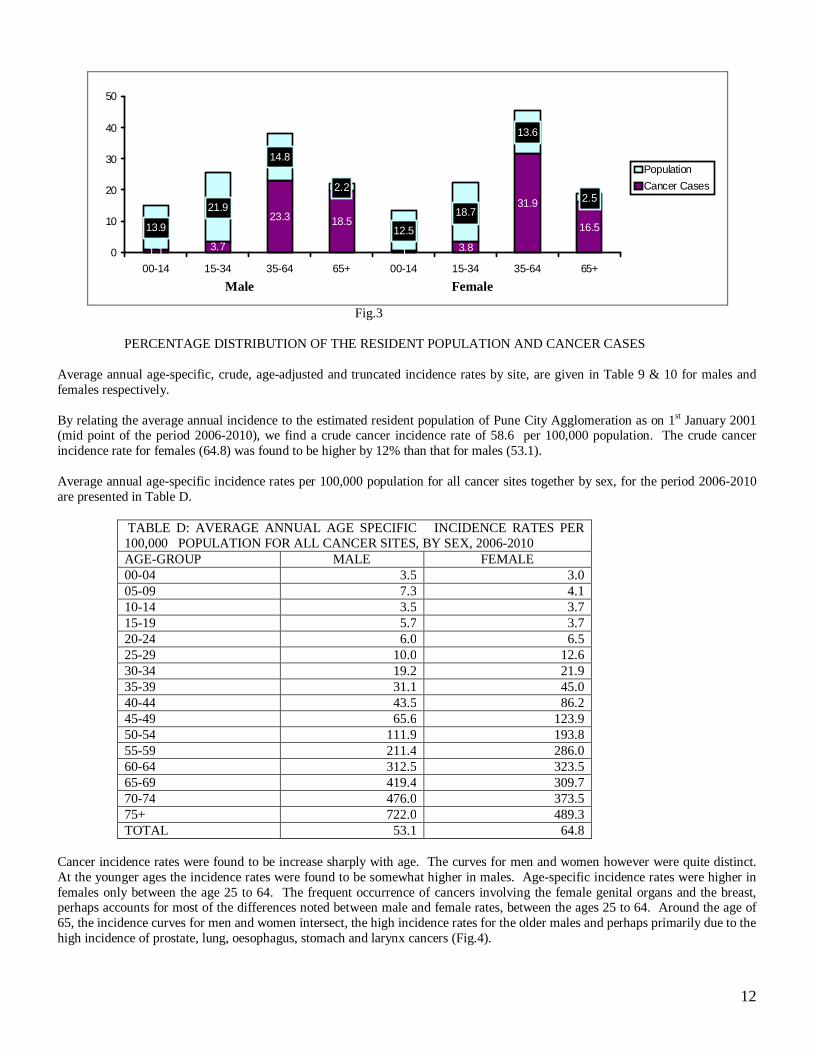
TABLE C: PERCENTAGE DISTRIBUTION OF THE RESIDENT POPULATION AND NEW CANCER CASES BY AGE AND SEX, PUNE CITY 2006-2010. AGE GROUP POPULATION NEW CANCER CASES MALE FEMALE TOTAL MALE FEMALE TOTAL 00-14 13.9 12.5 26.4 1.1 0.8 1.9 15-34 21.9 18.7 40.6 3.6 3.5 7.1 35-64 14.8 13.6 28.4 23.2 31.8 55.0 65+ 2.2 2.5 4.7 19.8 16.3 36.1 TOTAL 52.7 47.3 100.0 47.7 52.3 100.0
This clearly indicates that cancer occurs mostly at older ages, as only 1.9% of the total number of cancer cases registered, were under 15 years of age, although this age group accounts for 26.4% of the total population in the Agglomeration. The association of cancer with the aging process is clearly shown by the fact that 36.1% of the cases were diagnosed in those aged 65 and above, an age group which comprises only 4.7% of the population (Fig 3).
12
13.9
21.9
14.8
2.2
12.5
18.7
13.6
2.531.923.3
16.5
3.81
18.5
3.71.10
10
20
30
40
50
00-14 15-34 35-64 65+ 00-14 15-34 35-64 65+
PopulationCancer Cases
Fig.3 PERCENTAGE DISTRIBUTION OF THE RESIDENT POPULATION AND CANCER CASES Average annual age-specific, crude, age-adjusted and truncated incidence rates by site, are given in Table 9 & 10 for males and females respectively. By relating the average annual incidence to the estimated resident population of Pune City Agglomeration as on 1st January 2001 (mid point of the period 2006-2010), we find a crude cancer incidence rate of 58.6 per 100,000 population. The crude cancer incidence rate for females (64.8) was found to be higher by 12% than that for males (53.1). Average annual age-specific incidence rates per 100,000 population for all cancer sites together by sex, for the period 2006-2010 are presented in Table D.
TABLE D: AVERAGE ANNUAL AGE SPECIFIC INCIDENCE RATES PER 100,000 POPULATION FOR ALL CANCER SITES, BY SEX, 2006-2010 AGE-GROUP MALE FEMALE 00-04 3.5 3.0 05-09 7.3 4.1 10-14 3.5 3.7 15-19 5.7 3.7 20-24 6.0 6.5 25-29 10.0 12.6 30-34 19.2 21.9 35-39 31.1 45.0 40-44 43.5 86.2 45-49 65.6 123.9 50-54 111.9 193.8 55-59 211.4 286.0 60-64 312.5 323.5 65-69 419.4 309.7 70-74 476.0 373.5 75+ 722.0 489.3 TOTAL 53.1 64.8
Cancer incidence rates were found to be increase sharply with age. The curves for men and women however were quite distinct. At the younger ages the incidence rates were found to be somewhat higher in males. Age-specific incidence rates were higher in females only between the age 25 to 64. The frequent occurrence of cancers involving the female genital organs and the breast, perhaps accounts for most of the differences noted between male and female rates, between the ages 25 to 64. Around the age of 65, the incidence curves for men and women intersect, the high incidence rates for the older males and perhaps primarily due to the high incidence of prostate, lung, oesophagus, stomach and larynx cancers (Fig.4).
Male Female

13
0
100
200
300
400
500
600
700
800
00-0
4
05-
09
10-
14
15-
19
20-
24
25-
29
30-
34
35-
39
40-
44
4549
50-
54
55-
59
60-
64
65-
69
70-
74
75+
AGEGROUP
AGE
SPEC
IFIC
INCI
DENC
E RA
TE
MALE
FEMALE
Fig.4
AGE SPECIFIC INCIDENCE RATES PER 100,000 POPULATION, FOR ALL CANCER SITES Since the incidence of cancer is known to increase with age, comparison of the rates between different populations, should take into consideration the age composition of each group. The commonly accepted method of minimizing the difference in age distribution of the incidence rates is to base the rates to be compared, on a common age distribution. Cancer incidence rates adjusted to the age distribution, of the population of the World taken as a whole, indicated that the age-adjusted incidence rate of cancers in men at 84.4 is somewhat lower than that in women at 95.5 The most common sites of cancer based on age-adjusted incidence rates in males and females are shown in Table E. In males, prostate being the leading site with the mouth coming second in rank. Lung ranks third and larynx ranks fourth in men. Cancers of the breast are found to be predominant in females, the breast being the leading site with cervix coming second in rank. The ovary ranks third and mouth ranks fourth in women (Fig.5).
TABLE E: AVERAGE ANNUAL AGE-ADJUSTED INCIDENCE RATES BY SEX PER 100,000 POPULATION AT TEN LEADING SITE AND AT ALL SITE, 2006-2010
MALE FEMALE RANK ICD10 SITE AAR RANK ICD10 SITE AAR 1 C61 Prostate 7.3 1 C50 Breast 23.6 2 C03-06 Mouth 7.2 2 C53 Cervix 11.3 3 C34 Lung 5.6 3 C56 Ovary 5.2 4 C32 Larynx 4.7 4 C03-06 Mouth 3.8 5 C16 Oesophagus 4.7 5 C15 Oesophagus 3.2 6 C81-C85 Lymphoma 4.0 6 C54 Corpus Uteri 3.0 7 C16 Stomach 3.6 7 C34 Lung 2.8 8 C22 Liver 3.5 8 C19-21 Rectum 2.2 9 C19-21 Rectum 3.3 9 C81-85 Lymphoma 2.1 10 C01-02 Tongue 3.2 10 C18 Colon 2.0 AAR AT ALL SITES 75.9 AAR AT ALL SITES 80.2

14
Male
3.2
3.3
3.6
4
4.7
4.7
5.6
7.2
7.3
3.5
0 2 4 6 8
Leukemia
Brain
Liver
Stomach
Lymphoma
Oesophagus
Larynx
Lung
Mouth
Prostate
Age Adjusted Incidence RateFig.5
Female
2
2.1
2.8
3
3.2
3.8
5.2
11.3
23.6
2.2
0 10 20 30
Colon
Rectum
Corpus uteri
Mouth-Other
Cervix
Age Adjusted Incidence Rate
AGE ADJSUTED INCIDENCE RATES PER 100,000 POPULATION AT TEN LEADING SITES, 2006-2010.
Age reporting was found to be more reliable in the age group 35-64. The truncated incidence rates between the age 35 to 64 adjusted to the age distribution of the world population, are presented in Table F, where ten leading cancer sites ranked as per truncated rates for males and females are given (Fig. 6).
TABLE F: THE LEADING CANCER SITES BY TRUNCATED (35-64) INCIDENCE RATES PER 100,000 POPULATIN BY SEX, 2006-2010.
MALE FEMALE RANK ICD10 SITE TR RANK ICD10 SITE TR 1 C03-06 Mouth 15.1 1 C50 Breast 52.4 2 C34 Lung 7.9 2 C53 Cervix 26.7 3 C32 Larynx 7.5 3 C56 Ovary 10.1 4 C01-02 Tongue 6.5 4 C03-C06 Mouth 7.9 5 C15 Oesophagus 6.3 5 C54 Corpus Uteri 6.1 6 C81-85 Lymphoma 5.7 6 C34 Lung 5.3 6 C16 Stomach 5.4 7 C15 Oesophagus 5.0 8 C19-21 Rectum 5.3 8 C19-21 Rectum 4.1 9 C71 Brain 5.0 9 C01-02 Tongue 3.4 9 C61 Prostate 4.8 10 C81-85 Lymphoma 3.4 TR AT ALL SITES 112.8 TR AT ALL SITES 159.3
In males, the age group 35-64, cancer of the mouth rank first followed by cancer of the lung, larynx, and tongue in descending order. In females in the age-group 35-64, cancer of the breast ranks first followed by cancer of the cervix, ovary and mouth in descending order. The highest incidence rates at different age groups by primary site in males and females are presented in Table G. In children, both in males and females, leukemias were found to be predominant. In males, in the age group 35-64, other-mouth was most frequent site and above the age of 65, those were cancers of the prostate. In females, breast was the most frequent site of cancer above the age of 20.

15
Male4.8
5
5.4
5.7
6.3
6.5
7.5
7.9
15.1
5.3
0 5 10 15 20
Prostate
Brain
Rectum
Stomach
Lymphoma
Oesophagus
Tongue
Larynx
Lung
Mouth
Truncated Incidence Rate
Female3.4
3.4
5
5.3
6.1
7.9
10.1
26.7
52.4
4.1
0 20 40 60
Lymphoma
Rectum
Lung
Mouth
Cervix
Truncated Incidence Rate
Fig. 6 TRUNCATED INCIDENCE RATES PER 100,000 POPULATION AT TEN LEADING SITE, 2006-2010
TABLE G: THE HIGHEST INCIDENCE RATE BY AGE AND SEX PER 100,000 POPULATION, 2006-2010. AGE GROUP MALE FEMALE SITE RATE SITE RATE 00-04 Leukemias 1.0 Leukemias 0.9 05-09 Leukemias 2.9 Leukemias 1.3 10-14 Leukemias 1.2 Leukemias 0.9 15-19 Lymphoma 1.2 Leukemias 0.7 20-24 Brain 0.9 Breast 0.6 25-29 Brain 1.8 Breast 3.0 30-34 Tongue 2.5 Breast 7.4 35-39 Mouth 3.7 Breast 14.2 40-44 Mouth 8.1 Breast 33.1 45-49 Mouth 10.5 Breast 47.9 50-54 Mouth 14.7 Breast 64.7 55-59 Mouth 26.6 Breast 90.6 60-64 Mouth 38.4 Breast 91.5 65-69 Prostate 41.1 Breast 82.6 70-74 Prostate 71.9 Breast 84.6 75+ Prostate 154.9 Breast 120.6 ALL AGES Mouth 5.0 Breast 19.2
Method of Diagnosis An evaluation of the reliability of cancer data is usually measured by the percentage of patients having microscopic proof of diagnosis as compared with other methods which are considered less accurate. The percentage of new cancer cases diagnosed by method of diagnosis and sex is presented in Table H. During the period 2006-2010, 87.3% of the new cases recorded had microscopic confirmation of cancer. The percentage of patients diagnosed on the basis of clinical investigation was 1% and clinical alone was 5.5% and 6.2% of cases were registered from death certificates alone. The number of new cancer cases by site and method of diagnosis for males and females are presented in Table 11 and 12 respectively. The percentage distribution of the cases according to method of diagnosis is shown in Fig 7.

16
Male
DCO, 6.1Clinical, 6.1
Clin.Invest, 1.3
Microscopic, 86.5
Female
DCO, 6.2Clinical, 5
Clin.Invest, 0.8
Microscopic, 88.1
Fig. 7 PERCENTAGE DISTRIBUTION OF THE INCIDENT CASES OF CANCER BY METHOD OF DIAGNOSIS,
2006-2010 The percentage of patients having microscopic confirmation of cancer, depends primarily on the accessibility of the part affected. Histological confirmation of cancers arising in the buccal arising in the buccal cavity, pharynx and the female genital tract are thus usually available with greater frequency than for tumors at inaccessible sites, such as the digestive and respiratory systems. About 6.2% of cancer cases were registered through death certificates alone. This figure is considerably lower than in the previous years, which indicates the improvement in the coverage of the sources. Most probably these were patients with advanced disease who attended out-patient departments of various collaborating hospitals to seek medical advice at a late stage, when no active treatment was possible.
TABLE H: THE PERCENTAGE OF NEW CANCER CASES DIAGNOSED, BY METHOD OF DIAGNOSIS, 2006-2010 METHOD OF DAGNOSIS MALE FEMALE TOTAL CASES % CASES % CASES % MICROSCOPIC 5906 86.5 6586 88.1 12492 87.3 CLINICAL INVESTIGATION 91 1.3 58 0.8 149 1.0 CLINICAL 415 6.1 372 5.0 787 5.5 DCO 419 6.1 461 6.2 880 6.2 TOTAL 6831 100.0 7477 100.0 14308 100.0
Religion Considerable variation was noted in the incidence of cancer at various sites in both the sexes, in patients having their domicile in the countries and in those professing different religious faiths within a particular population, due to a variety of causes mainly endocrine, dietary or environmental. Such variations call for adequate investigations, to elucidate the complex etiology of the disease. To study the differences in cancer incidence by religion, the crude rates by religion and sex are presented in Table I. From this table it is evident that different religious groups in Pune City Agglomeration exhibit considerable variation in the total incidence of cancer in each sex.
TABLE I: CRUDE INCIDENCE RATES BY RELIGION AND SEX, 2006-2010 RELIGION MALE FEMALE HINDU 57.3 71.5 MUSLIM 54.5 52.1 CHRISTIAN 56.8 51.7 OTHERS 12.6 19.2 TOTAL 53.1 64.8
The different groups are distinguished from each other by their habits, customs and socio-economic status. Thus, even though living in the same environment, they present striking differences from each other, in the relative frequency with which cancer

17
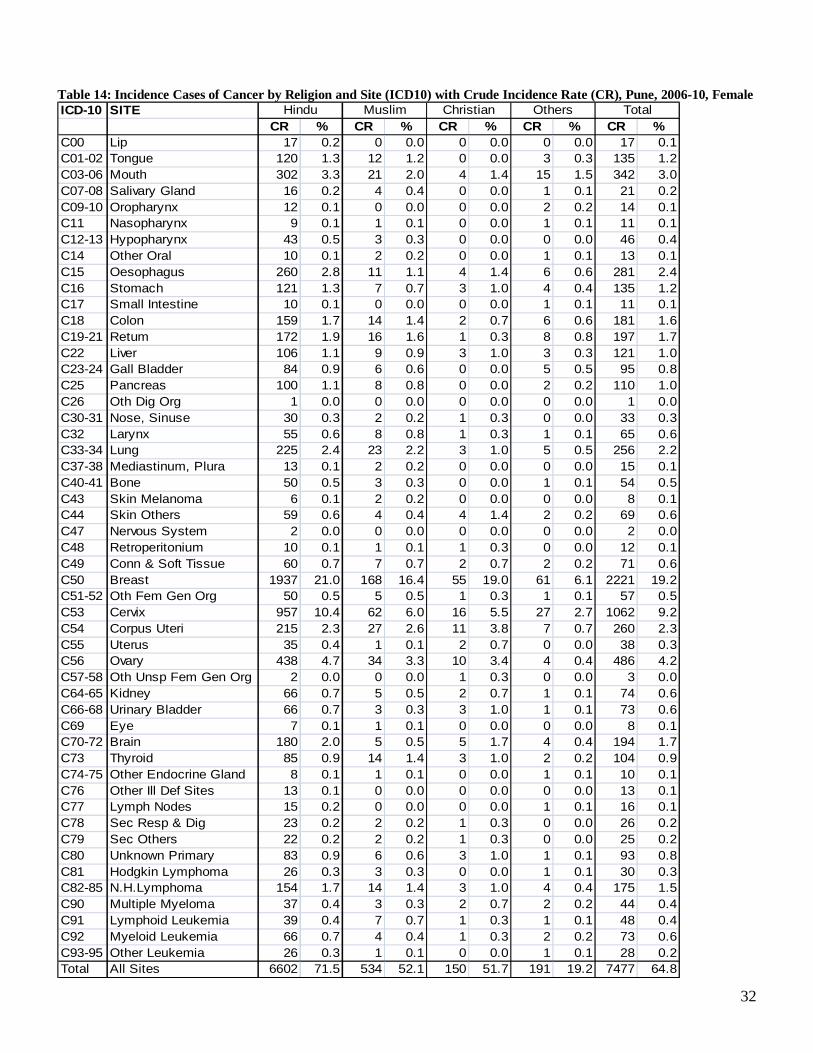
occurs at various sites. An appraisal of this situation was this considered promising, in order to study the differences in site patterns of incidence. In order to define the magnitude and nature of the differences observed, the number of cancer cases and the percentage distribution of new cases in each religious group by site, are presented in Table 13 and 14 for males and females respectively.
57.3 54.5 56.8
12.6
71.5
52.1 51.7
19.2
0
25
50
75
100
Hindu Muslim Christian Others
MaleFemale
Fig.8
CRUDE INCIDENE RATES BY RELIGION, 2006-2010. The site incidence patterns exhibit considerable differences in the various religious groups. The most common cancer sites in each religious group by sex are presented in Table J. TABLE J: FIVE MOST COMMON SITES OF CANCER IN DIFFERENT RELIGIOUS GROUPS BY SEX 2006-2010 RELIGION MALE FEMALE RANK SITE % RANK SITE % HINDU 1 Mouth 5.7 1 Breast 21.0 2 Prostate 4.8 2 Cervix 10.4 3 Lung 3.9 3 Ovary 4.7 4 Oesophagus 3.4 4 Mouth 3.2 5 Lymphoma 3.4 5 Oesophagus 2.8 MUSLIMS 1 Mouth 5.5 1 Breast 16.4 2 Prostate 4.1 2 Cervix 6.0 3 Lung 4.1 3 Ovary 3.3 4 Stomach 2.8 4 Corpus Uteri 2.6 5 U.Bladder 2.8 5 Lung 2.2 CHRISTIAN 1 Prostate 6.2 1 Breast 19.0 2 Lung 5.9 2 Cervix 5.5 3 Oesophagus 4.1 3 Corpus Uteri 3.8 3 Lymphoma 3.0 4 Ovary 3.4 3 U.Bladder 2.9 5 Brain 1.7 Among males, in Hindus and Muslims, the Mouth is the leading site of cancer, and Prostate is the leading in Christians. The Prostate is the second leading in Hindus and Muslims and lung ranks second in Christians. Among females, in Hindus, Muslims and Christians the breast is the leading site followed by the cervix.
18
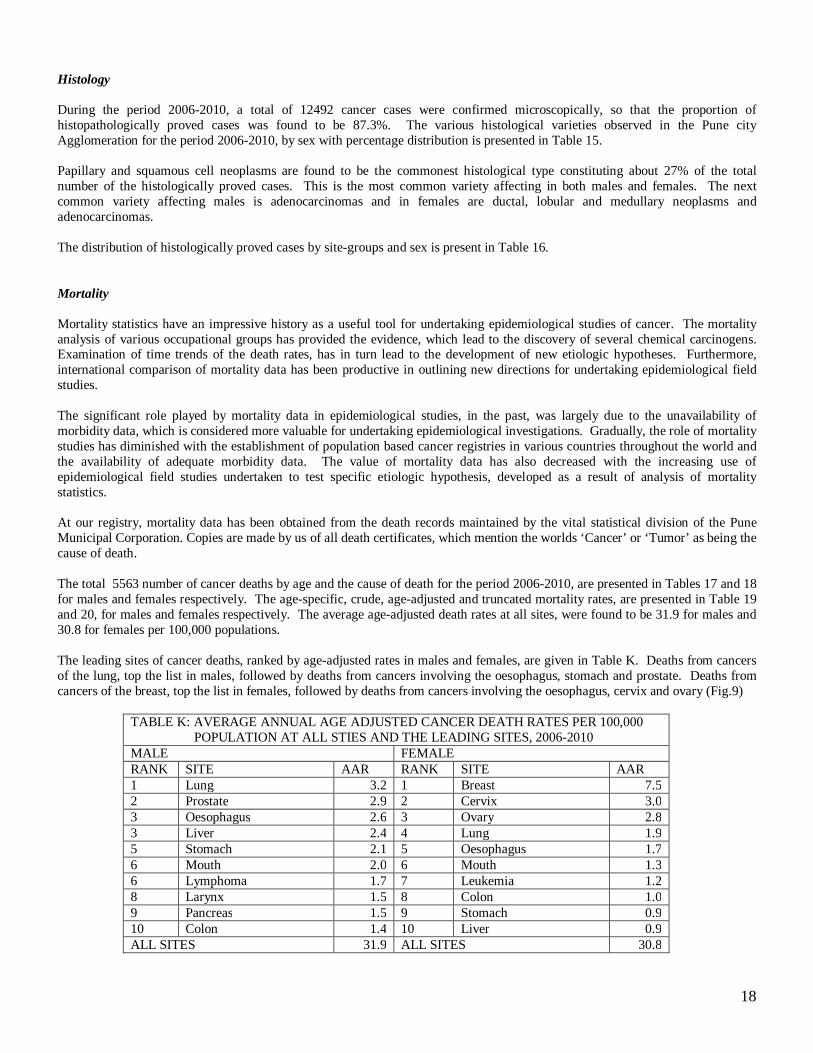
Histology During the period 2006-2010, a total of 12492 cancer cases were confirmed microscopically, so that the proportion of histopathologically proved cases was found to be 87.3%. The various histological varieties observed in the Pune city Agglomeration for the period 2006-2010, by sex with percentage distribution is presented in Table 15. Papillary and squamous cell neoplasms are found to be the commonest histological type constituting about 27% of the total number of the histologically proved cases. This is the most common variety affecting in both males and females. The next common variety affecting males is adenocarcinomas and in females are ductal, lobular and medullary neoplasms and adenocarcinomas. The distribution of histologically proved cases by site-groups and sex is present in Table 16. Mortality Mortality statistics have an impressive history as a useful tool for undertaking epidemiological studies of cancer. The mortality analysis of various occupational groups has provided the evidence, which lead to the discovery of several chemical carcinogens. Examination of time trends of the death rates, has in turn lead to the development of new etiologic hypotheses. Furthermore, international comparison of mortality data has been productive in outlining new directions for undertaking epidemiological field studies. The significant role played by mortality data in epidemiological studies, in the past, was largely due to the unavailability of morbidity data, which is considered more valuable for undertaking epidemiological investigations. Gradually, the role of mortality studies has diminished with the establishment of population based cancer registries in various countries throughout the world and the availability of adequate morbidity data. The value of mortality data has also decreased with the increasing use of epidemiological field studies undertaken to test specific etiologic hypothesis, developed as a result of analysis of mortality statistics. At our registry, mortality data has been obtained from the death records maintained by the vital statistical division of the Pune Municipal Corporation. Copies are made by us of all death certificates, which mention the worlds ‘Cancer’ or ‘Tumor’ as being the cause of death. The total 5563 number of cancer deaths by age and the cause of death for the period 2006-2010, are presented in Tables 17 and 18 for males and females respectively. The age-specific, crude, age-adjusted and truncated mortality rates, are presented in Table 19 and 20, for males and females respectively. The average age-adjusted death rates at all sites, were found to be 31.9 for males and 30.8 for females per 100,000 populations. The leading sites of cancer deaths, ranked by age-adjusted rates in males and females, are given in Table K. Deaths from cancers of the lung, top the list in males, followed by deaths from cancers involving the oesophagus, stomach and prostate. Deaths from cancers of the breast, top the list in females, followed by deaths from cancers involving the oesophagus, cervix and ovary (Fig.9)
TABLE K: AVERAGE ANNUAL AGE ADJUSTED CANCER DEATH RATES PER 100,000 POPULATION AT ALL STIES AND THE LEADING SITES, 2006-2010 MALE FEMALE RANK SITE AAR RANK SITE AAR 1 Lung 3.2 1 Breast 7.5 2 Prostate 2.9 2 Cervix 3.0 3 Oesophagus 2.6 3 Ovary 2.8 3 Liver 2.4 4 Lung 1.9 5 Stomach 2.1 5 Oesophagus 1.7 6 Mouth 2.0 6 Mouth 1.3 6 Lymphoma 1.7 7 Leukemia 1.2 8 Larynx 1.5 8 Colon 1.0 9 Pancreas 1.5 9 Stomach 0.9 10 Colon 1.4 10 Liver 0.9 ALL SITES 31.9 ALL SITES 30.8

19
Male
1.4
1.5
1.7
2
2.1
1.4
2.6
2.9
3.2
1.5
0 1 2 3 4
Colon
Pancreas
Larynx
Lymphoma
Mouth
Stomach
Liver
Oesophagus
Prostate
Lung
Age Adjusted Incidence Rate
Female
0.9
0.9
1.2
1.3
1.7
1.9
2.8
3
7.5
1
0 2 4 6 8
Liver
Stomach
Colon
Leukemia
Mouth
Oesophagus
Lung
Ovary
Cervix
Breast
Age Adjusted Incidence Rate
Fig.9
AGE-ADJUSTED DEATH RATES PER 100,000 AT TEN LEADING SITES, 2006-2010
The age specific rates were found to follow the general pattern of increase with age. The age-specific death rates for females were found to be generally lower than for males, except in the age-group 30 to 69 (Table L). This can be explained by the high mortality rates of female’s genital cancers that occurs in the reproductive age groups (Fig. 10).
TABLE L: AVERAGE ANNUAL AGE SPECIFIC MORTALITY RATES PER 100,000 POPULATIONS BY SEX, 2006-2010. AGE-GROUP MALE FEMALE 00-04 1.3 1.0 05-09 1.8 1.3 10-14 1.1 1.0 15-19 2.3 0.9 20-24 1.2 1.7 25-29 2.7 3.2 30-34 4.6 6.1 35-39 9.6 11.9 40-44 13.5 24.9 45-49 20.7 40.0 50-54 38.1 60.0 55-59 77.1 106.4 60-64 120.2 103.0 65-69 178.6 124.4 70-74 229.5 194.8 75+ 417.2 301.8 ALL AGES 21.5 24.3

20
0
100
200
300
400
500
00-0
4
05-
09
10-
14
15-
19
20-
24
25-
29
30-
34
35-
39
40-
44
45-4
9
50-
54
55-
59
60-
64
65-
69
70-
74
75+
AGEGROUP
AGE
SPEC
IFIC
INCI
DENC
E RA
TE
MALE
FEMALE
Fig.10
AGE SPECIFIC MORTLAITY RATES PER 100,000 POPULATIONS, FOR ALL CACNER SITES, 2006-2010 It is important to determine whether the pattern of age and sex in cancer mortality rates, in fact reflects the incidence rates. The relative comparison of the age distribution in the mortality and morbidity analysis and the age distribution of the population by sex, are given in Table M.
TABLE M: RELATIVE MORBIDITY AND MORTALITY RATES OF CANCER BY SEX, 2006-2010 SEX AGE POPULATION CANCER CASES INDICATOR OF
RELAT FREQ CANCER DEATH
INDICATOR OF RELAT FREQ
MALE 00-14 26.4 2.3 8.7 1.7 6.3 15-34 41.5 7.6 18.3 5.0 12.1 35-60 28 48.6 173.6 41.9 149.6 65+ 4.1 41.5 1011.9 51.4 1254.4 FEMALE 00-14 26.4 1.5 5.5 1.2 4.5 15-34 39.6 6.6 16.8 4.7 11.8 35-60 28.8 60.8 211.1 51.8 179.9 65+ 5.2 31.1 598.2 42.3 814.1 TOTAL 00-14 26.4 1.9 7.0 1.4 5.4 15-34 40.6 7.1 17.5 4.8 11.9 35-60 28.4 55.0 193.6 46.9 165.1 65+ 4.7 36.1 767.3 46.8 996.7
Cancer incidence and mortality rates were found to be very low in the younger ages. The association of cancer incidence and mortality with the aging process, is clearly shown by the fact that the percentage of registered cancer cases and the percentage of the total number of deaths occurring in persons 65 years of age and above, are 36.1% and 46.8% respectively, as this group comprises only about 4.7% of the general population. The relative cancer incidence and mortality rates increase with age, in both the sexes. Indicators of the relative incidence and mortality, show that in the age group 00-14, the incidence rates were more or less equal in both the sexes while in the age group 15-64, the incidence rates are higher than the mortality rates but thereafter the mortality rates reach higher levels in both the sexes.

21
Tables

22
Table 1: Estimated Resident Population by Age and Sex as on 1st July 2008, Pune City, Total Population (All Religious Communities) Age Group Male Female Total
# % # % # %
00-04 219226 8.5 189321 8.2 408547 8.4
05-09 198974 7.7 184412 8.0 383386 7.9
10-14 260455 10.1 234719 10.2 495174 10.1
15-19 268567 10.4 219093 9.5 487660 10.0
20-24 301882 11.7 249882 10.8 551764 11.3
25-29 270199 10.5 245117 10.6 515316 10.6
30-34 226106 8.8 200550 8.7 426656 8.7
35-39 187348 7.3 184122 8.0 371470 7.6
40-44 163553 6.4 139523 6.0 303076 6.2
45-49 131383 5.1 126055 5.5 257438 5.3
50-54 111691 4.3 92052 4.0 203743 4.2
55-59 71346 2.8 64685 2.8 136031 2.8
60-64 55231 2.1 57677 2.5 112908 2.3
65-69 43779 1.7 52570 2.3 96349 2.0
70-74 30589 1.2 33573 1.5 64162 1.3 75+ 32020 1.2 34664 1.5 66684 1.4
Total 2572349 52.7 2308015 47.3 4880364 100.0 Table 2: Estimated Resident Population by Religion and Sex, Pune City (As on 1st July 2008).
Male Female Total
Hindu 2050062 41.96 1845632 37.88 3895694 79.82
Muslims 228653 4.68 205124 4.21 433778 8.89
Christians 67912 1.39 57981 1.19 125893 2.58
Buddhist 12703 0.26 12668 0.26 25371 0.52
Jains 148038 3.03 128629 2.64 276667 5.67
Sikhs 56675 1.16 50185 1.03 106860 2.19
Others 6351 0.13 5847 0.12 12198 0.25
Unknown 1954 0.04 1949 0.04 3903 0.08
Total 2572349 52.65 2308015 47.37 4880364 100.00

23
Table 3: Number of Incident Cases of Cancer by Source of Registration and Year with Percentages, Pune City, Male, 2006-10.
SOURCE 2006 2007 2008 2009 2010 Total # % # % # % # % # % # % BHARATI 2 0.2 2 0.2 0 0.0 0 0.0 0 0.0 4 0.1 BOMBAY SMALL HOSP 20 1.6 6 0.5 6 0.4 11 0.8 15 1.0 58 0.8 CIPLA 97 7.7 101 7.8 90 6.4 68 5.0 61 4.1 417 6.1 DEENANATH 92 7.3 110 8.5 99 7.1 79 5.8 141 9.4 521 7.6 ESIS 10 0.8 14 1.1 0 0.0 0 0.0 1 0.1 25 0.4 INLAK 61 4.8 72 5.6 75 5.4 79 5.8 57 3.8 344 5.0 INLAK-R 158 12.5 135 10.4 135 9.6 107 7.8 119 7.9 654 9.6 JNH 57 4.5 71 5.5 72 5.1 71 5.2 56 3.7 327 4.8 JOSHI 0 0.0 0 0.0 24 1.7 28 2.0 33 2.2 85 1.2 KEM 64 5.1 61 4.7 77 5.5 71 5.2 50 3.3 323 4.7 OTHERS 7 0.6 23 1.8 0 0.0 0 0.0 0 0.0 30 0.4 PCH 1 0.1 0 0.0 1 0.1 0 0.0 0 0.0 2 0.0 PMC 77 6.1 81 6.2 74 5.3 93 6.8 92 6.1 417 6.1 PUNE 32 2.5 38 2.9 40 2.9 46 3.4 63 4.2 219 3.2 PUNE SMALL HOSP 106 8.4 79 6.1 110 7.9 84 6.1 135 9.0 514 7.5 RATNA 15 1.2 9 0.7 18 1.3 20 1.5 30 2.0 92 1.3 RHNH 160 12.7 162 12.5 198 14.1 196 14.3 190 12.6 906 13.3 RHNH-R 86 6.8 84 6.5 96 6.9 139 10.2 188 12.5 593 8.7 SANJEEVANI 0 0.0 16 1.2 17 1.2 21 1.5 1 0.1 55 0.8 SGH 162 12.8 157 12.1 172 12.3 139 10.2 178 11.8 808 11.8 TMH 16 1.3 25 1.9 38 2.7 48 3.5 34 2.3 161 2.4 WADIA 1 0.1 2 0.2 3 0.2 0 0.0 0 0.0 6 0.1 YCMC 40 3.2 49 3.8 56 4.0 66 4.8 59 3.9 270 4.0 Total 1264 100.0 1297 100.0 1401 100.0 1366 100.0 1503 100.0 6831 100.0
Table 4: Number of Incident Cases of Cancer by Source of Registration and Year with Percentages, Pune City, Female, 2006-10.
SOURCE 2006 2007 2008 2009 2010 Total # % # % # % # % # % # % BHARATI 1 0.1 5 0.3 4 0.3 0 0.0 0 0.0 10 0.1 BOMBAY SMALL HOSP 13 1.0 8 0.5 4 0.3 9 0.6 11 0.7 45 0.6 CIPLA 111 8.2 130 8.5 110 7.1 88 5.9 90 5.8 529 7.1 DEENANATH 94 7.0 135 8.9 88 5.7 107 7.2 171 11.0 595 8.0 ESIS 16 1.2 13 0.9 0 0.0 0 0.0 0 0.0 29 0.4 INLAK 65 4.8 94 6.2 83 5.3 83 5.6 54 3.5 379 5.1 INLAK-R 212 15.7 206 13.5 208 13.4 178 11.9 159 10.2 963 12.9 JNH 48 3.6 55 3.6 42 2.7 43 2.9 30 1.9 218 2.9 JOSHI 0 0.0 0 0.0 40 2.6 48 3.2 31 2.0 119 1.6 KEM 86 6.4 76 5.0 78 5.0 76 5.1 75 4.8 391 5.2 OTHERS 9 0.7 17 1.1 5 0.3 0 0.0 0 0.0 31 0.4 PCH 0 0.0 0 0.0 2 0.1 0 0.0 0 0.0 2 0.0 PMC 90 6.7 79 5.2 97 6.2 89 6.0 103 6.6 458 6.1 PUNE 34 2.5 41 2.7 37 2.4 45 3.0 40 2.6 197 2.6 PUNE SMALL HOSP 104 7.7 103 6.8 86 5.5 69 4.6 108 6.9 470 6.3 RATNA 13 1.0 12 0.8 10 0.6 15 1.0 11 0.7 61 0.8 RHNH 128 9.5 163 10.7 203 13.0 172 11.5 185 11.9 851 11.4 RHNH-R 101 7.5 114 7.5 174 11.2 202 13.5 205 13.2 796 10.6 SANJEEVANI 0 0.0 10 0.7 16 1.0 14 0.9 3 0.2 43 0.6 SGH 170 12.6 196 12.9 192 12.3 147 9.9 194 12.5 899 12.0 TMH 23 1.7 16 1.1 40 2.6 32 2.1 36 2.3 147 2.0 WADIA 2 0.1 1 0.1 0 0.0 0 0.0 0 0.0 3 0.0 YCMC 32 2.4 48 3.2 37 2.4 75 5.0 49 3.2 241 3.2 Total 1352 100.0 1522 100.0 1556 100.0 1492 100.0 1555 100.0 7477 100.0

24
Table 5: Number of Incident Cases of Cancer by Site Group and Year of Registration, with percentages, Pune City, Male, 2006-10. SITEGROUP
# % # % # % # % # % # %C00-C14, Lip, Oral Cavity, & Pharynx 222 17.6 231 17.8 271 19.3 275 20.1 288 19.2 1287 18.8C15-C26 Digestive Organs 345 27.3 351 27.1 376 26.8 385 28.2 385 25.6 1842 27.0C30-C39 Respiratory Systems 170 13.4 210 16.2 176 12.6 183 13.4 201 13.4 940 13.8C40-41,C45-49 Bone & Connective Tissue 38 3.0 36 2.8 45 3.2 20 1.5 39 2.6 178 2.6C43-44 Skin 19 1.5 20 1.5 19 1.4 25 1.8 11 0.7 94 1.4C50 Breast 15 1.2 5 0.4 11 0.8 17 1.2 39 2.6 87 1.3C60-63 Male Genital Organs 127 10.0 123 9.5 145 10.3 128 9.4 151 10.0 674 9.9C64-68 Urinary Oragans 71 5.6 79 6.1 63 4.5 87 6.4 81 5.4 381 5.6C69-72 Eye & Nervous System 71 5.6 60 4.6 84 6.0 61 4.5 55 3.7 331 4.8C73-75 Thyroid & Endocrine Glands 6 0.5 12 0.9 13 0.9 12 0.9 24 1.6 67 1.0C76-80 Lymphonoes and Secondary Unsp 46 3.6 40 3.1 43 3.1 60 4.4 76 5.1 265 3.9C81-90 Lymphatic System 88 7.0 85 6.6 102 7.3 78 5.7 110 7.3 463 6.8C91-95 Leukemias 46 3.6 45 3.5 53 3.8 35 2.6 43 2.9 222 3.2Total 1264 100.0 1297 100.0 1401 100.0 1366 100.0 1503 100.0 6831 100.0
Total2006 2007 2008 2009 2010
Table 6: Number of Incident Cases of Cancer by Site Group and Year of Registration, with percentages, Pune City, Female, 2006-10 SITEGROUP
# % # % # % # % # % # %C00-C14, Lip, Oral Cavity, & Pharynx 109 8.1 122 8.0 139 8.9 113 7.6 116 7.5 599 8.0C15-C26 Digestive Organs 214 15.8 237 15.6 213 13.7 235 15.8 233 15.0 1132 15.1C30-C39 Respiratory Systems 70 5.2 89 5.8 70 4.5 68 4.6 72 4.6 369 4.9C40-41,C45-49 Bone & Connective Tissue 31 2.3 22 1.4 33 2.1 29 1.9 24 1.5 139 1.9C43-44 Skin 16 1.2 16 1.1 13 0.8 20 1.3 12 0.8 77 1.0C50 Breast 362 26.8 437 28.7 469 30.1 469 31.4 484 31.1 2221 29.7C51-58 Female Genital Organs 359 26.6 368 24.2 400 25.7 381 25.5 398 25.6 1906 25.5C64-68 Urinary Oragans 26 1.9 29 1.9 27 1.7 27 1.8 38 2.4 147 2.0C69-72 Eye & Nervous System 44 3.3 42 2.8 53 3.4 31 2.1 32 2.1 202 2.7C73-75 Thyroid & Endocrine Glands 19 1.4 27 1.8 23 1.5 23 1.5 22 1.4 114 1.5C76-80 Lymphonoes and Secondary Unsp 33 2.4 33 2.2 24 1.5 36 2.4 47 3.0 173 2.3C81-90 Lymphatic System 37 2.7 60 3.9 58 3.7 43 2.9 51 3.3 249 3.3C91-95 Leukemias 32 2.4 40 2.6 34 2.2 17 1.1 26 1.7 149 2.0Total 1352 100.0 1522 100.0 1556 100.0 1492 100.0 1555 100.0 7477 100.0
Total2006 2007 2008 2009 2010

25
Table 7: Number of Incidence Cases of Cancer by Site (ICD10 & Age), with Percentages, Pune, 2006-10, Male ICD-10 SITE 0 5 10 15 20 25 30 35 40 45 50 55 60 65 70 75 99 Total %C00 Lip 0 0 0 0 0 0 0 0 0 5 1 3 4 5 1 2 0 21 0.3C01-02 Tongue 0 0 0 0 2 10 28 34 37 29 33 43 34 24 23 24 3 324 4.7C03-06 Mouth 1 2 0 1 4 5 26 35 66 69 82 95 106 82 47 45 5 671 9.8C07-08 Salivary Gland 0 1 0 0 0 2 4 2 4 2 4 4 3 8 0 4 0 38 0.6C09-10 Oropharynx 0 0 0 0 0 1 1 2 4 5 6 13 6 8 3 14 0 63 0.9C11 Nasopharynx 0 1 0 3 2 2 2 0 1 2 2 2 4 0 3 0 0 24 0.4C12-13 Hypopharynx 0 0 0 0 0 1 1 4 4 3 21 17 18 13 14 24 1 121 1.8C14 Other Oral 0 0 1 0 0 0 0 0 4 1 5 1 5 3 1 3 1 25 0.4C15 Oesophagus 0 0 0 0 1 1 6 10 14 19 38 45 53 63 44 100 2 396 5.8C16 Stomach 0 0 0 0 0 5 11 7 15 19 26 39 47 47 33 64 3 316 4.6C17 Small Intestine 0 0 0 0 0 0 0 1 1 3 1 2 1 4 3 3 0 19 0.3C18 Colon 0 0 0 4 1 5 4 8 16 18 21 30 33 34 33 52 3 262 3.8C19-21 Retum 0 0 0 2 4 12 10 11 17 17 40 34 39 50 27 39 1 303 4.4C22 Liver 1 0 0 0 1 2 3 7 9 17 26 30 44 45 39 69 1 294 4.3C23-24 Gall Bladder 0 0 0 0 0 1 3 5 4 1 5 12 10 14 12 9 0 76 1.1C25 Pancreas 0 1 0 0 2 1 0 6 4 6 22 20 37 24 16 32 1 172 2.5C26 Oth Dig Org 0 0 0 0 0 0 0 0 0 0 0 0 0 1 1 2 0 4 0.1C30-31 Nose, Sinuse 0 0 0 0 1 0 3 5 6 2 5 5 8 3 4 8 0 50 0.7C32 Larynx 0 0 0 0 1 3 3 7 16 25 34 61 66 62 57 59 1 395 5.8C33-34 Lung 0 0 0 3 3 2 8 14 15 23 58 64 55 78 63 92 1 479 7.0C37-38 Mediastinum, Plura 0 0 0 1 0 0 0 1 1 0 5 1 3 1 0 3 0 16 0.2C40-41 Bone 0 1 5 11 5 9 4 2 4 6 3 7 5 3 2 2 0 69 1.0C43 Skin Melanoma 0 1 0 1 0 0 0 1 1 0 2 1 1 1 1 0 0 10 0.1C44 Skin Others 0 0 1 2 7 2 0 4 3 2 9 6 14 11 7 16 0 84 1.2C47 Nervous System 0 0 1 0 1 0 0 1 0 2 0 0 1 1 0 1 0 8 0.1C48 Retroperitonium 0 0 0 0 0 2 0 1 2 0 1 2 1 0 1 0 0 10 0.1C49 Conn & Soft Tissue 3 1 1 4 7 4 6 8 5 6 5 10 6 10 5 10 0 91 1.3C50 Breast 0 0 0 0 1 0 5 3 6 10 11 8 8 13 11 10 1 87 1.3C60 Penis 0 0 0 0 0 0 1 5 6 7 6 8 6 13 7 9 0 68 1.0C61 Prostate 1 0 0 1 1 0 0 1 0 9 12 29 67 90 110 248 4 573 8.4C62 Testis 0 0 1 1 5 9 5 2 0 3 1 0 1 0 1 3 0 32 0.5C63 Oth Male Gen Org 0 0 0 0 0 0 0 0 0 0 0 1 0 0 0 0 0 1 0.0C64-65 Kidney 4 3 1 0 4 2 2 8 4 13 16 22 20 26 12 19 0 156 2.3C66-68 Urinary Bladder 1 0 0 1 1 0 4 4 8 13 16 25 31 35 29 55 2 225 3.3C69 Eye 2 0 0 0 0 0 0 0 1 0 0 1 0 0 0 0 0 4 0.1C70-72 Brain 7 21 6 14 13 24 27 31 19 36 23 35 20 23 17 10 1 327 4.8C73 Thyroid 0 1 0 0 1 4 7 2 0 6 6 5 8 7 4 7 0 58 0.8C74-75 Other Endocrine Gland 0 1 0 0 2 0 0 1 1 0 0 0 0 3 1 0 0 9 0.1C76 Other Ill Def Sites 0 0 0 0 0 0 2 1 1 3 4 1 2 5 3 4 0 26 0.4C77 Lymph Nodes 0 0 0 0 2 1 0 3 4 2 4 4 1 6 2 6 0 35 0.5C78 Sec Resp & Dig 0 0 0 0 0 0 2 1 1 3 1 3 7 7 3 7 0 35 0.5C79 Sec Others 0 0 0 0 1 1 0 1 2 1 2 2 4 3 2 1 0 20 0.3C80 Unknown Primary 1 1 0 1 3 1 7 5 7 9 16 14 19 21 19 25 0 149 2.2C81 Hodgkin Lymphoma 4 3 2 7 2 1 3 6 3 1 6 2 6 2 4 2 0 54 0.8C82-85 N.H.Lymphoma 2 6 12 9 4 6 17 27 23 20 27 29 29 40 36 48 0 335 4.9C90 Multiple Myeloma 0 0 0 0 0 0 0 2 7 2 8 8 12 14 13 8 0 74 1.1C91 Lymphoid Leukemia 7 24 8 3 7 7 5 1 4 5 3 2 2 4 1 3 1 87 1.3C92 Myeloid Leukemia 4 3 6 5 2 8 6 7 3 5 6 6 10 9 8 12 0 100 1.5C93-95 Other Leukemia 0 2 1 3 0 1 1 4 3 1 2 2 6 2 5 2 0 35 0.5Total All Sites 38 73 46 77 91 135 217 291 356 431 625 754 863 918 728 1156 32 6831 100.0

26
Table 8: Number of Incidence Cases of Cancer by Site (ICD10 & Age), with Percentages, Pune, 2006-10, Female ICD-10 SITE 0 5 10 15 20 25 30 35 40 45 50 55 60 65 70 75 99 Total %C00 Lip 0 0 0 0 0 0 0 1 1 1 1 2 3 5 3 0 0 17 0.2C01-02 Tongue 0 0 0 0 1 1 9 7 15 16 17 22 20 10 10 6 1 135 1.8C03-06 Mouth 0 0 0 0 2 4 4 14 21 32 46 40 63 49 26 38 3 342 4.6C07-08 Salivary Gland 0 0 0 0 0 2 1 2 2 3 1 2 0 2 3 2 1 21 0.3C09-10 Oropharynx 0 0 0 0 0 0 0 0 1 5 0 3 3 0 1 1 0 14 0.2C11 Nasopharynx 0 0 1 2 0 0 1 1 2 0 1 1 0 0 1 1 0 11 0.1C12-13 Hypopharynx 0 0 0 0 0 2 1 1 8 9 7 4 7 4 3 0 0 46 0.6C14 Other Oral 0 0 0 0 0 0 0 0 0 2 2 2 3 0 0 4 0 13 0.2C15 Oesophagus 0 0 0 0 1 1 3 8 13 27 22 27 40 42 35 62 0 281 3.8C16 Stomach 0 0 0 1 0 4 5 8 3 8 15 17 18 20 14 22 0 135 1.8C17 Small Intestine 0 0 0 0 0 0 0 0 1 1 0 1 2 0 3 3 0 11 0.1C18 Colon 0 0 0 1 4 7 1 5 10 9 12 20 19 19 31 41 2 181 2.4C19-21 Retum 0 0 0 0 1 5 5 12 11 11 19 28 32 26 24 22 1 197 2.6C22 Liver 2 1 1 0 2 2 3 5 7 3 10 13 12 17 11 32 0 121 1.6C23-24 Gall Bladder 0 0 0 0 0 1 3 3 5 7 11 11 13 9 8 24 0 95 1.3C25 Pancreas 0 0 0 0 1 1 4 3 3 8 11 9 13 19 13 25 0 110 1.5C26 Oth Dig Org 0 0 0 0 0 0 0 0 0 0 1 0 0 0 0 0 0 1 0.0C30-31 Nose, Sinuse 0 0 0 0 1 0 1 0 6 2 1 3 5 3 4 7 0 33 0.4C32 Larynx 0 0 0 0 0 0 3 3 5 3 5 3 8 9 9 17 0 65 0.9C33-34 Lung 0 0 0 0 1 2 3 12 18 20 29 36 32 34 28 40 1 256 3.4C37-38 Mediastinum, Plura 1 0 0 0 0 1 1 0 1 0 1 1 2 3 2 2 0 15 0.2C40-41 Bone 1 4 10 6 6 6 0 4 0 3 4 5 1 2 2 0 0 54 0.7C43 Skin Melanoma 0 0 0 0 0 0 1 2 0 0 0 0 1 0 1 2 1 8 0.1C44 Skin Others 0 0 1 0 0 3 3 3 4 6 4 7 7 7 11 13 0 69 0.9C47 Nervous System 0 0 0 0 1 0 0 0 0 0 0 0 1 0 0 0 0 2 0.0C48 Retroperitonium 0 0 0 1 0 0 1 0 3 1 0 1 0 2 3 0 0 12 0.2C49 Conn & Soft Tissue 1 1 2 1 3 6 2 4 6 5 9 6 6 6 5 7 1 71 0.9C50 Breast 0 1 1 0 8 37 74 131 231 302 298 293 264 217 142 209 13 2221 29.7C51-52 Oth Fem Gen Org 0 0 0 0 1 0 1 5 5 4 8 8 11 4 7 3 0 57 0.8C53 Cervix 0 0 0 0 3 16 23 79 108 136 161 142 146 114 68 60 6 1062 14.2C54 Corpus Uteri 0 0 0 0 1 3 2 9 5 20 45 40 44 42 21 27 1 260 3.5C55 Uterus 0 0 0 0 0 0 0 2 2 5 4 1 6 3 8 7 0 38 0.5C56 Ovary 2 1 3 5 5 11 15 27 34 61 53 61 54 57 36 59 2 486 6.5C57-58 Oth Unsp Fem Gen Org 0 0 0 0 0 0 0 0 0 1 0 1 0 1 0 0 0 3 0.0C64-65 Kidney 1 1 1 0 4 3 0 3 8 5 9 8 9 9 7 6 0 74 1.0C66-68 Urinary Bladder 0 0 0 1 2 0 1 1 2 1 6 9 7 10 13 20 0 73 1.0C69 Eye 2 0 0 0 0 0 2 0 1 1 1 0 1 0 0 0 0 8 0.1C70-72 Brain 5 10 7 7 11 6 17 13 12 15 22 20 14 11 10 13 1 194 2.6C73 Thyroid 0 1 0 3 6 8 10 15 10 8 6 3 13 9 4 8 0 104 1.4C74-75 Other Endocrine Gland 1 1 0 0 1 1 0 0 1 2 0 0 0 1 1 1 0 10 0.1C76 Other Ill Def Sites 1 0 0 0 1 0 0 1 1 0 1 2 3 1 0 2 0 13 0.2C77 Lymph Nodes 0 0 0 0 1 0 1 1 2 0 0 4 2 2 0 2 1 16 0.2C78 Sec Resp & Dig 0 0 0 0 0 1 2 0 1 0 2 1 3 2 7 7 0 26 0.3C79 Sec Others 0 0 1 0 0 1 1 2 1 5 2 4 4 3 0 1 0 25 0.3C80 Unknown Primary 1 1 3 1 3 1 0 3 6 7 10 10 8 9 12 17 1 93 1.2C81 Hodgkin Lymphoma 0 1 0 2 3 1 2 2 3 3 1 2 2 1 5 2 0 30 0.4C82-85 N.H.Lymphoma 1 3 2 3 2 8 8 8 13 8 20 22 15 17 24 20 1 175 2.3C90 Multiple Myeloma 0 0 0 0 0 1 1 1 2 3 2 16 8 4 2 4 0 44 0.6C91 Lymphoid Leukemia 3 7 7 5 3 3 2 2 2 4 2 1 0 1 3 3 0 48 0.6C92 Myeloid Leukemia 3 3 3 2 2 5 2 8 2 6 6 11 4 8 4 4 0 73 1.0C93-95 Other Leukemia 3 2 0 0 0 0 1 3 3 2 4 2 4 0 2 2 0 28 0.4Total All Sites 28 38 43 41 81 154 220 414 601 781 892 925 933 814 627 848 37 7477 100.0

27
Table 9: Average Annual Age-Specific, World Age Adjusted, Truncated (35-64) Incidence Rates of Cancer Cases per 100,000 Persons, Pune, 2006-10, Male ICD-10 SITE 0 5 10 15 20 25 30 35 40 45 50 55 60 65 70 75 CR AAR TRC00 Lip 0.0 0.0 0.0 0.0 0.0 0.0 0.0 0.0 0.0 0.8 0.2 0.8 1.4 2.3 0.7 1.2 0.2 0.3 0.5C01-02 Tongue 0.0 0.0 0.0 0.0 0.1 0.7 2.5 3.6 4.5 4.4 5.9 12.1 12.3 11.0 15.0 15.0 2.5 3.2 6.5C03-06 Mouth 0.1 0.2 0.0 0.1 0.3 0.4 2.3 3.7 8.1 10.5 14.7 26.6 38.4 37.5 30.7 28.1 5.2 7.2 15.1C07-08 Salivary Gland 0.0 0.1 0.0 0.0 0.0 0.1 0.4 0.2 0.5 0.3 0.7 1.1 1.1 3.7 0.0 2.5 0.3 0.4 0.6C09-10 Oropharynx 0.0 0.0 0.0 0.0 0.0 0.1 0.1 0.2 0.5 0.8 1.1 3.6 2.2 3.7 2.0 8.7 0.5 0.7 1.2C11 Nasopharynx 0.0 0.1 0.0 0.2 0.1 0.1 0.2 0.0 0.1 0.3 0.4 0.6 1.4 0.0 2.0 0.0 0.2 0.2 0.4C12-13 Hypopharynx 0.0 0.0 0.0 0.0 0.0 0.1 0.1 0.4 0.5 0.5 3.8 4.8 6.5 5.9 9.2 15.0 0.9 1.4 2.3C14 Other Oral 0.0 0.0 0.1 0.0 0.0 0.0 0.0 0.0 0.5 0.2 0.9 0.3 1.8 1.4 0.7 1.9 0.2 0.3 0.5C15 Oesophagus 0.0 0.0 0.0 0.0 0.1 0.1 0.5 1.1 1.7 2.9 6.8 12.6 19.2 28.8 28.8 62.5 3.1 4.7 6.3C16 Stomach 0.0 0.0 0.0 0.0 0.0 0.4 1.0 0.7 1.8 2.9 4.7 10.9 17.0 21.5 21.6 40.0 2.5 3.6 5.4C17 Small Intestine 0.0 0.0 0.0 0.0 0.0 0.0 0.0 0.1 0.1 0.5 0.2 0.6 0.4 1.8 2.0 1.9 0.1 0.2 0.3C18 Colon 0.0 0.0 0.0 0.3 0.1 0.4 0.4 0.9 2.0 2.7 3.8 8.4 11.9 15.5 21.6 32.5 2.0 3.0 4.3C19-21 Retum 0.0 0.0 0.0 0.1 0.3 0.9 0.9 1.2 2.1 2.6 7.2 9.5 14.1 22.8 17.7 24.4 2.4 3.3 5.3C22 Liver 0.1 0.0 0.0 0.0 0.1 0.1 0.3 0.7 1.1 2.6 4.7 8.4 15.9 20.6 25.5 43.1 2.3 3.5 4.8C23-24 Gall Bladder 0.0 0.0 0.0 0.0 0.0 0.1 0.3 0.5 0.5 0.2 0.9 3.4 3.6 6.4 7.8 5.6 0.6 0.9 1.3C25 Pancreas 0.0 0.1 0.0 0.0 0.1 0.1 0.0 0.6 0.5 0.9 3.9 5.6 13.4 11.0 10.5 20.0 1.3 2.0 3.5C26 Oth Dig Org 0.0 0.0 0.0 0.0 0.0 0.0 0.0 0.0 0.0 0.0 0.0 0.0 0.0 0.5 0.7 1.2 0.0 0.1 0.0C30-31 Nose, Sinuse 0.0 0.0 0.0 0.0 0.1 0.0 0.3 0.5 0.7 0.3 0.9 1.4 2.9 1.4 2.6 5.0 0.4 0.5 1.0C32 Larynx 0.0 0.0 0.0 0.0 0.1 0.2 0.3 0.7 2.0 3.8 6.1 17.1 23.9 28.3 37.3 36.9 3.1 4.7 7.5C33-34 Lung 0.0 0.0 0.0 0.2 0.2 0.1 0.7 1.5 1.8 3.5 10.4 17.9 19.9 35.6 41.2 57.5 3.7 5.6 7.9C37-38 Mediastinum, Plura 0.0 0.0 0.0 0.1 0.0 0.0 0.0 0.1 0.1 0.0 0.9 0.3 1.1 0.5 0.0 1.9 0.1 0.2 0.4C40-41 Bone 0.0 0.1 0.4 0.8 0.3 0.7 0.4 0.2 0.5 0.9 0.5 2.0 1.8 1.4 1.3 1.2 0.5 0.6 0.9C43 Skin Melanoma 0.0 0.1 0.0 0.1 0.0 0.0 0.0 0.1 0.1 0.0 0.4 0.3 0.4 0.5 0.7 0.0 0.1 0.1 0.2C44 Skin Others 0.0 0.0 0.1 0.1 0.5 0.1 0.0 0.4 0.4 0.3 1.6 1.7 5.1 5.0 4.6 10.0 0.7 0.9 1.3C47 Nervous System 0.0 0.0 0.1 0.0 0.1 0.0 0.0 0.1 0.0 0.3 0.0 0.0 0.4 0.5 0.0 0.6 0.1 0.1 0.1C48 Retroperitonium 0.0 0.0 0.0 0.0 0.0 0.1 0.0 0.1 0.2 0.0 0.2 0.6 0.4 0.0 0.7 0.0 0.1 0.1 0.2C49 Conn & Soft Tissue 0.3 0.1 0.1 0.3 0.5 0.3 0.5 0.9 0.6 0.9 0.9 2.8 2.2 4.6 3.3 6.2 0.7 0.9 1.2C50 Breast 0.0 0.0 0.0 0.0 0.1 0.0 0.4 0.3 0.7 1.5 2.0 2.2 2.9 5.9 7.2 6.2 0.7 0.9 1.5C60 Penis 0.0 0.0 0.0 0.0 0.0 0.0 0.1 0.5 0.7 1.1 1.1 2.2 2.2 5.9 4.6 5.6 0.5 0.8 1.2C61 Prostate 0.1 0.0 0.0 0.1 0.1 0.0 0.0 0.1 0.0 1.4 2.1 8.1 24.3 41.1 71.9 154.9 4.5 7.3 4.8C62 Testis 0.0 0.0 0.1 0.1 0.3 0.7 0.4 0.2 0.0 0.5 0.2 0.0 0.4 0.0 0.7 1.9 0.2 0.2 0.2C63 Oth Male Gen Org 0.0 0.0 0.0 0.0 0.0 0.0 0.0 0.0 0.0 0.0 0.0 0.3 0.0 0.0 0.0 0.0 0.0 0.0 0.0C64-65 Kidney 0.4 0.3 0.1 0.0 0.3 0.1 0.2 0.9 0.5 2.0 2.9 6.2 7.2 11.9 7.8 11.9 1.2 1.8 2.8C66-68 Urinary Bladder 0.1 0.0 0.0 0.1 0.1 0.0 0.4 0.4 1.0 2.0 2.9 7.0 11.2 16.0 19.0 34.4 1.7 2.7 3.5C69 Eye 0.2 0.0 0.0 0.0 0.0 0.0 0.0 0.0 0.1 0.0 0.0 0.3 0.0 0.0 0.0 0.0 0.0 0.0 0.1C70-72 Brain 0.6 2.1 0.5 1.0 0.9 1.8 2.4 3.3 2.3 5.5 4.1 9.8 7.2 10.5 11.1 6.2 2.5 3.0 5.0C73 Thyroid 0.0 0.1 0.0 0.0 0.1 0.3 0.6 0.2 0.0 0.9 1.1 1.4 2.9 3.2 2.6 4.4 0.5 0.6 0.9C74-75 Other Endocrine Gland 0.0 0.1 0.0 0.0 0.1 0.0 0.0 0.1 0.1 0.0 0.0 0.0 0.0 1.4 0.7 0.0 0.1 0.1 0.0C76 Other Ill Def Sites 0.0 0.0 0.0 0.0 0.0 0.0 0.2 0.1 0.1 0.5 0.7 0.3 0.7 2.3 2.0 2.5 0.2 0.3 0.4C77 Lymph Nodes 0.0 0.0 0.0 0.0 0.1 0.1 0.0 0.3 0.5 0.3 0.7 1.1 0.4 2.7 1.3 3.7 0.3 0.4 0.5C78 Sec Resp & Dig 0.0 0.0 0.0 0.0 0.0 0.0 0.2 0.1 0.1 0.5 0.2 0.8 2.5 3.2 2.0 4.4 0.3 0.4 0.6C79 Sec Others 0.0 0.0 0.0 0.0 0.1 0.1 0.0 0.1 0.2 0.2 0.4 0.6 1.4 1.4 1.3 0.6 0.2 0.2 0.4C80 Unknown Primary 0.1 0.1 0.0 0.1 0.2 0.1 0.6 0.5 0.9 1.4 2.9 3.9 6.9 9.6 12.4 15.6 1.2 1.7 2.4C81 Hodgkin Lymphoma 0.4 0.3 0.2 0.5 0.1 0.1 0.3 0.6 0.4 0.2 1.1 0.6 2.2 0.9 2.6 1.2 0.4 0.5 0.8C82-85 N.H.Lymphoma 0.2 0.6 0.9 0.7 0.3 0.4 1.5 2.9 2.8 3.0 4.8 8.1 10.5 18.3 23.5 30.0 2.6 3.5 4.9C90 Multiple Myeloma 0.0 0.0 0.0 0.0 0.0 0.0 0.0 0.2 0.9 0.3 1.4 2.2 4.3 6.4 8.5 5.0 0.6 0.9 1.3C91 Lymphoid Leukemia 0.6 2.4 0.6 0.2 0.5 0.5 0.4 0.1 0.5 0.8 0.5 0.6 0.7 1.8 0.7 1.9 0.7 0.8 0.5C92 Myeloid Leukemia 0.4 0.3 0.5 0.4 0.1 0.6 0.5 0.7 0.4 0.8 1.1 1.7 3.6 4.1 5.2 7.5 0.8 1.0 1.2C93-95 Other Leukemia 0.0 0.2 0.1 0.2 0.0 0.1 0.1 0.4 0.4 0.2 0.4 0.6 2.2 0.9 3.3 1.2 0.3 0.4 0.6Total All Sites 3.5 7.3 3.5 5.7 6.0 10.0 19.2 31.1 43.5 65.6 111.9 211.4 312.5 419.4 476.0 722.0 53.1 75.9 112.8

28
Table 10: Average Annual Age-Specific, World Age Adjusted, Truncated (35-64) Incidence Rates of Cancer Cases per 100,000 Persons, Pune, 2006-10, Female ICD-10 SITE 0 5 10 15 20 25 30 35 40 45 50 55 60 65 70 75 CR AAR TRC00 Lip 0.0 0.0 0.0 0.0 0.0 0.0 0.0 0.1 0.1 0.2 0.2 0.6 1.0 1.9 1.8 0.0 0.1 0.2 0.3C01-02 Tongue 0.0 0.0 0.0 0.0 0.1 0.1 0.9 0.8 2.2 2.5 3.7 6.8 6.9 3.8 6.0 3.5 1.2 1.4 3.4C03-06 Mouth 0.0 0.0 0.0 0.0 0.2 0.3 0.4 1.5 3.0 5.1 10.0 12.4 21.8 18.6 15.5 21.9 3.0 3.8 7.9C07-08 Salivary Gland 0.0 0.0 0.0 0.0 0.0 0.2 0.1 0.2 0.3 0.5 0.2 0.6 0.0 0.8 1.8 1.2 0.2 0.2 0.3C09-10 Oropharynx 0.0 0.0 0.0 0.0 0.0 0.0 0.0 0.0 0.1 0.8 0.0 0.9 1.0 0.0 0.6 0.6 0.1 0.2 0.4C11 Nasopharynx 0.0 0.0 0.1 0.2 0.0 0.0 0.1 0.1 0.3 0.0 0.2 0.3 0.0 0.0 0.6 0.6 0.1 0.1 0.2C12-13 Hypopharynx 0.0 0.0 0.0 0.0 0.0 0.2 0.1 0.1 1.1 1.4 1.5 1.2 2.4 1.5 1.8 0.0 0.4 0.5 1.2C14 Other Oral 0.0 0.0 0.0 0.0 0.0 0.0 0.0 0.0 0.0 0.3 0.4 0.6 1.0 0.0 0.0 2.3 0.1 0.2 0.3C15 Oesophagus 0.0 0.0 0.0 0.0 0.1 0.1 0.3 0.9 1.9 4.3 4.8 8.3 13.9 16.0 20.9 35.8 2.4 3.2 5.0C16 Stomach 0.0 0.0 0.0 0.1 0.0 0.3 0.5 0.9 0.4 1.3 3.3 5.3 6.2 7.6 8.3 12.7 1.2 1.5 2.5C17 Small Intestine 0.0 0.0 0.0 0.0 0.0 0.0 0.0 0.0 0.1 0.2 0.0 0.3 0.7 0.0 1.8 1.7 0.1 0.1 0.2C18 Colon 0.0 0.0 0.0 0.1 0.3 0.6 0.1 0.5 1.4 1.4 2.6 6.2 6.6 7.2 18.5 23.7 1.6 2.0 2.7C19-21 Retum 0.0 0.0 0.0 0.0 0.1 0.4 0.5 1.3 1.6 1.7 4.1 8.7 11.1 9.9 14.3 12.7 1.7 2.2 4.1C22 Liver 0.2 0.1 0.1 0.0 0.2 0.2 0.3 0.5 1.0 0.5 2.2 4.0 4.2 6.5 6.6 18.5 1.0 1.3 1.8C23-24 Gall Bladder 0.0 0.0 0.0 0.0 0.0 0.1 0.3 0.3 0.7 1.1 2.4 3.4 4.5 3.4 4.8 13.8 0.8 1.1 1.8C25 Pancreas 0.0 0.0 0.0 0.0 0.1 0.1 0.4 0.3 0.4 1.3 2.4 2.8 4.5 7.2 7.7 14.4 1.0 1.2 1.7C26 Oth Dig Org 0.0 0.0 0.0 0.0 0.0 0.0 0.0 0.0 0.0 0.0 0.2 0.0 0.0 0.0 0.0 0.0 0.0 0.0 0.0C30-31 Nose, Sinuse 0.0 0.0 0.0 0.0 0.1 0.0 0.1 0.0 0.9 0.3 0.2 0.9 1.7 1.1 2.4 4.0 0.3 0.4 0.6C32 Larynx 0.0 0.0 0.0 0.0 0.0 0.0 0.3 0.3 0.7 0.5 1.1 0.9 2.8 3.4 5.4 9.8 0.6 0.7 0.9C33-34 Lung 0.0 0.0 0.0 0.0 0.1 0.2 0.3 1.3 2.6 3.2 6.3 11.1 11.1 12.9 16.7 23.1 2.2 2.8 5.3C37-38 Mediastinum, Plura 0.1 0.0 0.0 0.0 0.0 0.1 0.1 0.0 0.1 0.0 0.2 0.3 0.7 1.1 1.2 1.2 0.1 0.2 0.2C40-41 Bone 0.1 0.4 0.9 0.5 0.5 0.5 0.0 0.4 0.0 0.5 0.9 1.5 0.3 0.8 1.2 0.0 0.5 0.5 0.6C43 Skin Melanoma 0.0 0.0 0.0 0.0 0.0 0.0 0.1 0.2 0.0 0.0 0.0 0.0 0.3 0.0 0.6 1.2 0.1 0.1 0.1C44 Skin Others 0.0 0.0 0.1 0.0 0.0 0.2 0.3 0.3 0.6 1.0 0.9 2.2 2.4 2.7 6.6 7.5 0.6 0.7 1.1C47 Nervous System 0.0 0.0 0.0 0.0 0.1 0.0 0.0 0.0 0.0 0.0 0.0 0.0 0.3 0.0 0.0 0.0 0.0 0.0 0.0C48 Retroperitonium 0.0 0.0 0.0 0.1 0.0 0.0 0.1 0.0 0.4 0.2 0.0 0.3 0.0 0.8 1.8 0.0 0.1 0.1 0.2C49 Conn & Soft Tissue 0.1 0.1 0.2 0.1 0.2 0.5 0.2 0.4 0.9 0.8 2.0 1.9 2.1 2.3 3.0 4.0 0.6 0.7 1.2C50 Breast 0.0 0.1 0.1 0.0 0.6 3.0 7.4 14.2 33.1 47.9 64.7 90.6 91.5 82.6 84.6 120.6 19.2 23.6 52.4C51-52 Oth Fem Gen Org 0.0 0.0 0.0 0.0 0.1 0.0 0.1 0.5 0.7 0.6 1.7 2.5 3.8 1.5 4.2 1.7 0.5 0.6 1.5C53 Cervix 0.0 0.0 0.0 0.0 0.2 1.3 2.3 8.6 15.5 21.6 35.0 43.9 50.6 43.4 40.5 34.6 9.2 11.3 26.7C54 Corpus Uteri 0.0 0.0 0.0 0.0 0.1 0.2 0.2 1.0 0.7 3.2 9.8 12.4 15.3 16.0 12.5 15.6 2.3 3.0 6.1C55 Uterus 0.0 0.0 0.0 0.0 0.0 0.0 0.0 0.2 0.3 0.8 0.9 0.3 2.1 1.1 4.8 4.0 0.3 0.4 0.7C56 Ovary 0.2 0.1 0.3 0.5 0.4 0.9 1.5 2.9 4.9 9.7 11.5 18.9 18.7 21.7 21.4 34.0 4.2 5.2 10.1C57-58 Oth Unsp Fem Gen Org 0.0 0.0 0.0 0.0 0.0 0.0 0.0 0.0 0.0 0.2 0.0 0.3 0.0 0.4 0.0 0.0 0.0 0.0 0.1C64-65 Kidney 0.1 0.1 0.1 0.0 0.3 0.2 0.0 0.3 1.1 0.8 2.0 2.5 3.1 3.4 4.2 3.5 0.6 0.8 1.5C66-68 Urinary Bladder 0.0 0.0 0.0 0.1 0.2 0.0 0.1 0.1 0.3 0.2 1.3 2.8 2.4 3.8 7.7 11.5 0.6 0.8 1.0C69 Eye 0.2 0.0 0.0 0.0 0.0 0.0 0.2 0.0 0.1 0.2 0.2 0.0 0.3 0.0 0.0 0.0 0.1 0.1 0.1C70-72 Brain 0.5 1.1 0.6 0.6 0.9 0.5 1.7 1.4 1.7 2.4 4.8 6.2 4.9 4.2 6.0 7.5 1.7 1.9 3.3C73 Thyroid 0.0 0.1 0.0 0.3 0.5 0.7 1.0 1.6 1.4 1.3 1.3 0.9 4.5 3.4 2.4 4.6 0.9 1.0 1.8C74-75 Other Endocrine Gland 0.1 0.1 0.0 0.0 0.1 0.1 0.0 0.0 0.1 0.3 0.0 0.0 0.0 0.4 0.6 0.6 0.1 0.1 0.1C76 Other Ill Def Sites 0.1 0.0 0.0 0.0 0.1 0.0 0.0 0.1 0.1 0.0 0.2 0.6 1.0 0.4 0.0 1.2 0.1 0.1 0.3C77 Lymph Nodes 0.0 0.0 0.0 0.0 0.1 0.0 0.1 0.1 0.3 0.0 0.0 1.2 0.7 0.8 0.0 1.2 0.1 0.2 0.3C78 Sec Resp & Dig 0.0 0.0 0.0 0.0 0.0 0.1 0.2 0.0 0.1 0.0 0.4 0.3 1.0 0.8 4.2 4.0 0.2 0.3 0.3C79 Sec Others 0.0 0.0 0.1 0.0 0.0 0.1 0.1 0.2 0.1 0.8 0.4 1.2 1.4 1.1 0.0 0.6 0.2 0.3 0.6C80 Unknown Primary 0.1 0.1 0.3 0.1 0.2 0.1 0.0 0.3 0.9 1.1 2.2 3.1 2.8 3.4 7.1 9.8 0.8 1.0 1.6C81 Hodgkin Lymphoma 0.0 0.1 0.0 0.2 0.2 0.1 0.2 0.2 0.4 0.5 0.2 0.6 0.7 0.4 3.0 1.2 0.3 0.3 0.4C82-85 N.H.Lymphoma 0.1 0.3 0.2 0.3 0.2 0.7 0.8 0.9 1.9 1.3 4.3 6.8 5.2 6.5 14.3 11.5 1.5 1.8 3.0C90 Multiple Myeloma 0.0 0.0 0.0 0.0 0.0 0.1 0.1 0.1 0.3 0.5 0.4 4.9 2.8 1.5 1.2 2.3 0.4 0.5 1.2C91 Lymphoid Leukemia 0.3 0.8 0.6 0.5 0.2 0.2 0.2 0.2 0.3 0.6 0.4 0.3 0.0 0.4 1.8 1.7 0.4 0.4 0.3C92 Myeloid Leukemia 0.3 0.3 0.3 0.2 0.2 0.4 0.2 0.9 0.3 1.0 1.3 3.4 1.4 3.0 2.4 2.3 0.6 0.7 1.2C93-95 Other Leukemia 0.3 0.2 0.0 0.0 0.0 0.0 0.1 0.3 0.4 0.3 0.9 0.6 1.4 0.0 1.2 1.2 0.2 0.3 0.6Total All Sites 3.0 4.1 3.7 3.7 6.5 12.6 21.9 45.0 86.2 123.9 193.8 286.0 323.5 309.7 373.5 489.3 64.8 80.2 159.3

29
Table 11: Incidence Cases of Cancer by Most Valid Basis of Diagnosis and Site (ICD10) with Percentage, Pune, 2006-10, Male ICD-10 SITE
# % # % # % # % # %C00 Lip 19 0.3 0 0.0 1 0.2 1 0.2 21 0.3C01-02 Tongue 291 4.9 2 2.2 22 5.3 9 2.1 324 4.7C03-06 Mouth 582 9.9 2 2.2 68 16.4 19 4.5 671 9.8C07-08 Salivary Gland 25 0.4 1 1.1 11 2.7 1 0.2 38 0.6C09-10 Oropharynx 55 0.9 0 0.0 6 1.4 2 0.5 63 0.9C11 Nasopharynx 21 0.4 1 1.1 2 0.5 0 0.0 24 0.4C12-13 Hypopharynx 109 1.8 1 1.1 6 1.4 5 1.2 121 1.8C14 Other Oral 15 0.3 0 0.0 3 0.7 7 1.7 25 0.4C15 Oesophagus 303 5.1 8 8.8 29 7.0 56 13.4 396 5.8C16 Stomach 258 4.4 4 4.4 17 4.1 37 8.8 316 4.6C17 Small Intestine 15 0.3 0 0.0 3 0.7 1 0.2 19 0.3C18 Colon 230 3.9 2 2.2 12 2.9 18 4.3 262 3.8C19-21 Retum 260 4.4 4 4.4 20 4.8 19 4.5 303 4.4C22 Liver 272 4.6 2 2.2 6 1.4 14 3.3 294 4.3C23-24 Gall Bladder 59 1.0 2 2.2 9 2.2 6 1.4 76 1.1C25 Pancreas 109 1.8 2 2.2 28 6.7 33 7.9 172 2.5C26 Oth Dig Org 1 0.0 0 0.0 0 0.0 3 0.7 4 0.1C30-31 Nose, Sinuse 44 0.7 1 1.1 3 0.7 2 0.5 50 0.7C32 Larynx 336 5.7 3 3.3 39 9.4 17 4.1 395 5.8C33-34 Lung 377 6.4 11 12.1 37 8.9 54 12.9 479 7.0C37-38 Mediastinum, Plura 14 0.2 0 0.0 1 0.2 1 0.2 16 0.2C40-41 Bone 65 1.1 0 0.0 2 0.5 2 0.5 69 1.0C43 Skin Melanoma 10 0.2 0 0.0 0 0.0 0 0.0 10 0.1C44 Skin Others 82 1.4 1 1.1 0 0.0 1 0.2 84 1.2C47 Nervous System 7 0.1 0 0.0 1 0.2 0 0.0 8 0.1C48 Retroperitonium 10 0.2 0 0.0 0 0.0 0 0.0 10 0.1C49 Conn & Soft Tissue 91 1.5 0 0.0 0 0.0 0 0.0 91 1.3C50 Breast 71 1.2 3 3.3 5 1.2 8 1.9 87 1.3C60 Penis 62 1.0 0 0.0 5 1.2 1 0.2 68 1.0C61 Prostate 481 8.1 4 4.4 32 7.7 56 13.4 573 8.4C62 Testis 29 0.5 0 0.0 0 0.0 3 0.7 32 0.5C63 Oth Male Gen Org 1 0.0 0 0.0 0 0.0 0 0.0 1 0.0C64-65 Kidney 148 2.5 1 1.1 3 0.7 4 1.0 156 2.3C66-68 Urinary Bladder 204 3.5 1 1.1 6 1.4 14 3.3 225 3.3C69 Eye 4 0.1 0 0.0 0 0.0 0 0.0 4 0.1C70-72 Brain 293 5.0 27 29.7 6 1.4 1 0.2 327 4.8C73 Thyroid 56 0.9 1 1.1 1 0.2 0 0.0 58 0.8C74-75 Other Endocrine Gland 9 0.2 0 0.0 0 0.0 0 0.0 9 0.1C76 Other Ill Def Sites 18 0.3 0 0.0 3 0.7 5 1.2 26 0.4C77 Lymph Nodes 35 0.6 0 0.0 0 0.0 0 0.0 35 0.5C78 Sec Resp & Dig 34 0.6 0 0.0 1 0.2 0 0.0 35 0.5C79 Sec Others 20 0.3 0 0.0 0 0.0 0 0.0 20 0.3C80 Unknown Primary 96 1.6 7 7.7 27 6.5 19 4.5 149 2.2C81 Hodgkin Lymphoma 54 0.9 0 0.0 0 0.0 0 0.0 54 0.8C82-85 N.H.Lymphoma 335 5.7 0 0.0 0 0.0 0 0.0 335 4.9C90 Multiple Myeloma 74 1.3 0 0.0 0 0.0 0 0.0 74 1.1C91 Lymphoid Leukemia 87 1.5 0 0.0 0 0.0 0 0.0 87 1.3C92 Myeloid Leukemia 100 1.7 0 0.0 0 0.0 0 0.0 100 1.5C93-95 Other Leukemia 35 0.6 0 0.0 0 0.0 0 0.0 35 0.5Total All Sites 5906 100.0 91 100.0 415 100.0 419 100.0 6831 100.0
Microscopic Clin Invst Clinical DCO Total

30
Table12: Incidence Cases of Cancer by Most Valid Basis of Diagnosis and Site (ICD10) with Percentage, Pune, 2006-10, Female ICD-10 SITE
# % # % # % # % # %C00 Lip 16 0.2 0 0.0 1 0.3 0 0.0 17 0.2C01-02 Tongue 125 1.9 0 0.0 7 1.9 3 0.7 135 1.8C03-06 Mouth 299 4.5 1 1.7 26 7.0 16 3.5 342 4.6C07-08 Salivary Gland 19 0.3 0 0.0 2 0.5 0 0.0 21 0.3C09-10 Oropharynx 13 0.2 0 0.0 1 0.3 0 0.0 14 0.2C11 Nasopharynx 8 0.1 1 1.7 1 0.3 1 0.2 11 0.1C12-13 Hypopharynx 43 0.7 0 0.0 3 0.8 0 0.0 46 0.6C14 Other Oral 7 0.1 0 0.0 2 0.5 4 0.9 13 0.2C15 Oesophagus 213 3.2 5 8.6 23 6.2 40 8.7 281 3.8C16 Stomach 108 1.6 3 5.2 10 2.7 14 3.0 135 1.8C17 Small Intestine 8 0.1 0 0.0 2 0.5 1 0.2 11 0.1C18 Colon 152 2.3 1 1.7 8 2.2 20 4.3 181 2.4C19-21 Retum 175 2.7 2 3.4 9 2.4 11 2.4 197 2.6C22 Liver 104 1.6 1 1.7 4 1.1 12 2.6 121 1.6C23-24 Gall Bladder 71 1.1 3 5.2 9 2.4 12 2.6 95 1.3C25 Pancreas 78 1.2 0 0.0 16 4.3 16 3.5 110 1.5C26 Oth Dig Org 0 0.0 0 0.0 0 0.0 1 0.2 1 0.0C30-31 Nose, Sinuse 26 0.4 0 0.0 6 1.6 1 0.2 33 0.4C32 Larynx 45 0.7 1 1.7 8 2.2 11 2.4 65 0.9C33-34 Lung 187 2.8 9 15.5 20 5.4 40 8.7 256 3.4C37-38 Mediastinum, Plura 15 0.2 0 0.0 0 0.0 0 0.0 15 0.2C40-41 Bone 49 0.7 2 3.4 1 0.3 2 0.4 54 0.7C43 Skin Melanoma 8 0.1 0 0.0 0 0.0 0 0.0 8 0.1C44 Skin Others 67 1.0 0 0.0 1 0.3 1 0.2 69 0.9C47 Nervous System 2 0.0 0 0.0 0 0.0 0 0.0 2 0.0C48 Retroperitonium 10 0.2 0 0.0 1 0.3 1 0.2 12 0.2C49 Conn & Soft Tissue 71 1.1 0 0.0 0 0.0 0 0.0 71 0.9C50 Breast 2031 30.8 4 6.9 76 20.4 110 23.9 2221 29.7C51-52 Oth Fem Gen Org 53 0.8 0 0.0 3 0.8 1 0.2 57 0.8C53 Cervix 964 14.6 4 6.9 62 16.7 32 6.9 1062 14.2C54 Corpus Uteri 244 3.7 0 0.0 8 2.2 8 1.7 260 3.5C55 Uterus 18 0.3 1 1.7 2 0.5 17 3.7 38 0.5C56 Ovary 396 6.0 4 6.9 26 7.0 60 13.0 486 6.5C57-58 Oth Unsp Fem Gen Org 3 0.0 0 0.0 0 0.0 0 0.0 3 0.0C64-65 Kidney 72 1.1 0 0.0 0 0.0 2 0.4 74 1.0C66-68 Urinary Bladder 69 1.0 0 0.0 0 0.0 4 0.9 73 1.0C69 Eye 6 0.1 0 0.0 2 0.5 0 0.0 8 0.1C70-72 Brain 175 2.7 12 20.7 4 1.1 3 0.7 194 2.6C73 Thyroid 97 1.5 0 0.0 4 1.1 3 0.7 104 1.4C74-75 Other Endocrine Gland 10 0.2 0 0.0 0 0.0 0 0.0 10 0.1C76 Other Ill Def Sites 9 0.1 0 0.0 2 0.5 2 0.4 13 0.2C77 Lymph Nodes 16 0.2 0 0.0 0 0.0 0 0.0 16 0.2C78 Sec Resp & Dig 26 0.4 0 0.0 0 0.0 0 0.0 26 0.3C79 Sec Others 25 0.4 0 0.0 0 0.0 0 0.0 25 0.3C80 Unknown Primary 55 0.8 4 6.9 22 5.9 12 2.6 93 1.2C81 Hodgkin Lymphoma 30 0.5 0 0.0 0 0.0 0 0.0 30 0.4C82-85 N.H.Lymphoma 175 2.7 0 0.0 0 0.0 0 0.0 175 2.3C90 Multiple Myeloma 44 0.7 0 0.0 0 0.0 0 0.0 44 0.6C91 Lymphoid Leukemia 48 0.7 0 0.0 0 0.0 0 0.0 48 0.6C92 Myeloid Leukemia 73 1.1 0 0.0 0 0.0 0 0.0 73 1.0C93-95 Other Leukemia 28 0.4 0 0.0 0 0.0 0 0.0 28 0.4Total All Sites 6586 100.0 58 100.0 372 100.0 461 100.0 7477 100.0
Microscopic Clin Invst Clinical DCO Total

31
Table 13: Incidence Cases of Cancer by Religion and Site (ICD10) with Crude Incidence Rate (CR), Pune, 2006-10, Male ICD-10 SITE
CR % CR % CR % CR % CR %C00 Lip 21 0.2 0 0.0 0 0.0 0 0.0 21 0.2C01-02 Tongue 279 2.7 31 2.7 5 1.5 9 0.8 324 2.5C03-06 Mouth 585 5.7 63 5.5 6 1.8 17 1.5 671 5.2C07-08 Salivary Gland 30 0.3 5 0.4 0 0.0 3 0.3 38 0.3C09-10 Oropharynx 49 0.5 8 0.7 4 1.2 2 0.2 63 0.5C11 Nasopharynx 19 0.2 3 0.3 1 0.3 1 0.1 24 0.2C12-13 Hypopharynx 102 1.0 14 1.2 2 0.6 3 0.3 121 0.9C14 Other Oral 20 0.2 4 0.3 1 0.3 0 0.0 25 0.2C15 Oesophagus 349 3.4 25 2.2 14 4.1 8 0.7 396 3.1C16 Stomach 269 2.6 32 2.8 8 2.4 7 0.6 316 2.5C17 Small Intestine 16 0.2 1 0.1 0 0.0 2 0.2 19 0.1C18 Colon 241 2.4 13 1.1 3 0.9 5 0.4 262 2.0C19-21 Retum 259 2.5 28 2.4 7 2.1 9 0.8 303 2.4C22 Liver 262 2.6 19 1.7 7 2.1 6 0.5 294 2.3C23-24 Gall Bladder 70 0.7 4 0.3 2 0.6 0 0.0 76 0.6C25 Pancreas 143 1.4 22 1.9 5 1.5 2 0.2 172 1.3C26 Oth Dig Org 3 0.0 1 0.1 0 0.0 0 0.0 4 0.0C30-31 Nose, Sinuse 43 0.4 5 0.4 2 0.6 0 0.0 50 0.4C32 Larynx 349 3.4 30 2.6 10 2.9 6 0.5 395 3.1C33-34 Lung 400 3.9 47 4.1 20 5.9 12 1.1 479 3.7C37-38 Mediastinum, Plura 14 0.1 1 0.1 1 0.3 0 0.0 16 0.1C40-41 Bone 63 0.6 3 0.3 2 0.6 1 0.1 69 0.5C43 Skin Melanoma 8 0.1 1 0.1 1 0.3 0 0.0 10 0.1C44 Skin Others 69 0.7 10 0.9 2 0.6 3 0.3 84 0.7C47 Nervous System 6 0.1 2 0.2 0 0.0 0 0.0 8 0.1C48 Retroperitonium 8 0.1 1 0.1 0 0.0 1 0.1 10 0.1C49 Conn & Soft Tissue 80 0.8 10 0.9 1 0.3 0 0.0 91 0.7C50 Breast 60 0.6 15 1.3 10 2.9 2 0.2 87 0.7C60 Penis 66 0.6 1 0.1 1 0.3 0 0.0 68 0.5C61 Prostate 490 4.8 47 4.1 21 6.2 15 1.3 573 4.5C62 Testis 28 0.3 2 0.2 2 0.6 0 0.0 32 0.2C63 Oth Male Gen Org 1 0.0 0 0.0 0 0.0 0 0.0 1 0.0C64-65 Kidney 132 1.3 17 1.5 5 1.5 2 0.2 156 1.2C66-68 Urinary Bladder 183 1.8 32 2.8 10 2.9 0 0.0 225 1.7C69 Eye 3 0.0 0 0.0 0 0.0 1 0.1 4 0.0C70-72 Brain 293 2.9 20 1.7 7 2.1 7 0.6 327 2.5C73 Thyroid 43 0.4 12 1.0 3 0.9 0 0.0 58 0.5C74-75 Other Endocrine Gland 8 0.1 0 0.0 0 0.0 1 0.1 9 0.1C76 Other Ill Def Sites 21 0.2 4 0.3 1 0.3 0 0.0 26 0.2C77 Lymph Nodes 28 0.3 4 0.3 3 0.9 0 0.0 35 0.3C78 Sec Resp & Dig 31 0.3 2 0.2 2 0.6 0 0.0 35 0.3C79 Sec Others 16 0.2 2 0.2 1 0.3 1 0.1 20 0.2C80 Unknown Primary 122 1.2 21 1.8 2 0.6 4 0.4 149 1.2C81 Hodgkin Lymphoma 47 0.5 4 0.3 1 0.3 2 0.2 54 0.4C82-85 N.H.Lymphoma 296 2.9 25 2.2 9 2.7 5 0.4 335 2.6C90 Multiple Myeloma 63 0.6 7 0.6 4 1.2 0 0.0 74 0.6C91 Lymphoid Leukemia 69 0.7 13 1.1 4 1.2 1 0.1 87 0.7C92 Myeloid Leukemia 88 0.9 8 0.7 1 0.3 3 0.3 100 0.8C93-95 Other Leukemia 28 0.3 4 0.3 2 0.6 1 0.1 35 0.3Total All Sites 5873 57.3 623 54.5 193 56.8 142 12.6 6831 53.1
Hindu Muslim Christian Others Total
32
Table 14: Incidence Cases of Cancer by Religion and Site (ICD10) with Crude Incidence Rate (CR), Pune, 2006-10, Female ICD-10 SITE
CR % CR % CR % CR % CR %C00 Lip 17 0.2 0 0.0 0 0.0 0 0.0 17 0.1C01-02 Tongue 120 1.3 12 1.2 0 0.0 3 0.3 135 1.2C03-06 Mouth 302 3.3 21 2.0 4 1.4 15 1.5 342 3.0C07-08 Salivary Gland 16 0.2 4 0.4 0 0.0 1 0.1 21 0.2C09-10 Oropharynx 12 0.1 0 0.0 0 0.0 2 0.2 14 0.1C11 Nasopharynx 9 0.1 1 0.1 0 0.0 1 0.1 11 0.1C12-13 Hypopharynx 43 0.5 3 0.3 0 0.0 0 0.0 46 0.4C14 Other Oral 10 0.1 2 0.2 0 0.0 1 0.1 13 0.1C15 Oesophagus 260 2.8 11 1.1 4 1.4 6 0.6 281 2.4C16 Stomach 121 1.3 7 0.7 3 1.0 4 0.4 135 1.2C17 Small Intestine 10 0.1 0 0.0 0 0.0 1 0.1 11 0.1C18 Colon 159 1.7 14 1.4 2 0.7 6 0.6 181 1.6C19-21 Retum 172 1.9 16 1.6 1 0.3 8 0.8 197 1.7C22 Liver 106 1.1 9 0.9 3 1.0 3 0.3 121 1.0C23-24 Gall Bladder 84 0.9 6 0.6 0 0.0 5 0.5 95 0.8C25 Pancreas 100 1.1 8 0.8 0 0.0 2 0.2 110 1.0C26 Oth Dig Org 1 0.0 0 0.0 0 0.0 0 0.0 1 0.0C30-31 Nose, Sinuse 30 0.3 2 0.2 1 0.3 0 0.0 33 0.3C32 Larynx 55 0.6 8 0.8 1 0.3 1 0.1 65 0.6C33-34 Lung 225 2.4 23 2.2 3 1.0 5 0.5 256 2.2C37-38 Mediastinum, Plura 13 0.1 2 0.2 0 0.0 0 0.0 15 0.1C40-41 Bone 50 0.5 3 0.3 0 0.0 1 0.1 54 0.5C43 Skin Melanoma 6 0.1 2 0.2 0 0.0 0 0.0 8 0.1C44 Skin Others 59 0.6 4 0.4 4 1.4 2 0.2 69 0.6C47 Nervous System 2 0.0 0 0.0 0 0.0 0 0.0 2 0.0C48 Retroperitonium 10 0.1 1 0.1 1 0.3 0 0.0 12 0.1C49 Conn & Soft Tissue 60 0.7 7 0.7 2 0.7 2 0.2 71 0.6C50 Breast 1937 21.0 168 16.4 55 19.0 61 6.1 2221 19.2C51-52 Oth Fem Gen Org 50 0.5 5 0.5 1 0.3 1 0.1 57 0.5C53 Cervix 957 10.4 62 6.0 16 5.5 27 2.7 1062 9.2C54 Corpus Uteri 215 2.3 27 2.6 11 3.8 7 0.7 260 2.3C55 Uterus 35 0.4 1 0.1 2 0.7 0 0.0 38 0.3C56 Ovary 438 4.7 34 3.3 10 3.4 4 0.4 486 4.2C57-58 Oth Unsp Fem Gen Org 2 0.0 0 0.0 1 0.3 0 0.0 3 0.0C64-65 Kidney 66 0.7 5 0.5 2 0.7 1 0.1 74 0.6C66-68 Urinary Bladder 66 0.7 3 0.3 3 1.0 1 0.1 73 0.6C69 Eye 7 0.1 1 0.1 0 0.0 0 0.0 8 0.1C70-72 Brain 180 2.0 5 0.5 5 1.7 4 0.4 194 1.7C73 Thyroid 85 0.9 14 1.4 3 1.0 2 0.2 104 0.9C74-75 Other Endocrine Gland 8 0.1 1 0.1 0 0.0 1 0.1 10 0.1C76 Other Ill Def Sites 13 0.1 0 0.0 0 0.0 0 0.0 13 0.1C77 Lymph Nodes 15 0.2 0 0.0 0 0.0 1 0.1 16 0.1C78 Sec Resp & Dig 23 0.2 2 0.2 1 0.3 0 0.0 26 0.2C79 Sec Others 22 0.2 2 0.2 1 0.3 0 0.0 25 0.2C80 Unknown Primary 83 0.9 6 0.6 3 1.0 1 0.1 93 0.8C81 Hodgkin Lymphoma 26 0.3 3 0.3 0 0.0 1 0.1 30 0.3C82-85 N.H.Lymphoma 154 1.7 14 1.4 3 1.0 4 0.4 175 1.5C90 Multiple Myeloma 37 0.4 3 0.3 2 0.7 2 0.2 44 0.4C91 Lymphoid Leukemia 39 0.4 7 0.7 1 0.3 1 0.1 48 0.4C92 Myeloid Leukemia 66 0.7 4 0.4 1 0.3 2 0.2 73 0.6C93-95 Other Leukemia 26 0.3 1 0.1 0 0.0 1 0.1 28 0.2Total All Sites 6602 71.5 534 52.1 150 51.7 191 19.2 7477 64.8
Hindu Muslim Christian Others Total

33
Table 15: Number of Incidence Cases of Cancer by Histology (ICDO3) and Sex, Pune, 2006-10 ICD-O-3 HISTOLOGY
# % # % # %800 Malignant Neoplasms, Nos 919 13.5 883 11.8 1802 12.68001-8005 Malignant Tumors 140 2.0 156 2.1 296 2.1801-804 Malignant Epithelial Neoplasm 251 3.7 179 2.4 430 3.0805-808 Squamus Cell Neoplasms 1978 29.0 1881 25.2 3859 27.0809-811 Basal Cell Neoplasms 26 0.4 28 0.4 54 0.4812-813 Transitional Cell Carcinoma 189 2.8 63 0.8 252 1.8814-838 Adenocarc inomas 1928 28.2 1356 18.1 3284 23.0839-842 Skin Appendage Neoplasms 1 0.0 0 0.0 1 0.0843 Mucoepidermoid Neoplasm 10 0.1 3 0.0 13 0.1844-849 Cystic , Mucious & Serous Neoplasm 98 1.4 244 3.3 342 2.4850-854 Ductal and Lobular Neoplasm 71 1.0 1924 25.7 1995 13.9855 Acinar Cell Neoplasms 2 0.0 0 0.0 2 0.0856-857 Complex Epithelial Neoplasms 0 0.0 7 0.1 7 0.0858 Thymic Epithelial Neoplasms 2 0.0 1 0.0 3 0.0859-867 Specialised Gonadal Neoplasm 0 0.0 1 0.0 1 0.0872-879 Nevi and Melanomas 17 0.2 12 0.2 29 0.2880 Soft Tissue Tumors and Sarcomas 61 0.9 46 0.6 107 0.7881-883 Fibromatous Neoplasms 7 0.1 11 0.1 18 0.1885-888 Lipomatous Neoplasms 7 0.1 2 0.0 9 0.1889-892 Myomatous Neoplasms 21 0.3 19 0.3 40 0.3893-899 Complex mixed and stromal Neoplasms 15 0.2 15 0.2 30 0.2900-903 Fibroepithelial Neoplasms 0 0.0 8 0.1 8 0.1904 Synovial Neoplasms 6 0.1 3 0.0 9 0.1905 Mesothelial Neoplasms 3 0.0 1 0.0 4 0.0906-909 Germ Cell Neoplasms 28 0.4 13 0.2 41 0.3910 Triphoblas tic Neoplasms 0 0.0 1 0.0 1 0.0912-916 Blood Vessel Tumors 3 0.0 0 0.0 3 0.0918-924 Osseous and Chrondromatous Neoplasms 33 0.5 22 0.3 55 0.4925 Giant Cell Tumors 11 0.2 6 0.1 17 0.1926 Miscellaneous Bone Tumors 12 0.2 12 0.2 24 0.2927-934 Odontogenic Tumors 3 0.0 1 0.0 4 0.0938-948 Gliomas 285 4.2 160 2.1 445 3.1949-952 Neuroepitheliomatous Neoplasms 6 0.1 7 0.1 13 0.1953 Meningiomas 3 0.0 9 0.1 12 0.1954-957 Nerve Sheath Tumors 7 0.1 4 0.1 11 0.1958 Granular Cell Tumors 1 0.0 0 0.0 1 0.0959 Malignant Lymphomas, Nos 278 4.1 148 2.0 426 3.0965-966 Hodgk ins Lymphoma 52 0.8 28 0.4 80 0.6967-972 Non Hodgkins Lymphoma 60 0.9 31 0.4 91 0.6973 Plasma Cell Tumors 76 1.1 43 0.6 119 0.8980-994 Leukemias 221 3.2 147 2.0 368 2.6998 Myelodysplastic Syndromes 0 0.0 2 0.0 2 0.0Total All Histologies 6831 100.0 7477 100.0 14308 100.0
Male Female Tota l

34
Table 16: Number of Cancer Deaths by Age and Site (ICD10) with Percentages, Pune, 2006-10, Male ICD-10 SITE 0 5 10 15 20 25 30 35 40 45 50 55 60 65 70 75 99 Total %C00 Lip 0 0 0 0 0 0 0 0 0 1 0 1 2 1 0 2 0 7 0.3C01-02 Tongue 0 0 0 0 0 1 0 11 11 6 7 15 10 6 10 9 0 86 3.1C03-06 Mouth 1 1 0 0 0 1 3 7 14 12 24 25 27 28 18 13 0 174 6.3C07-08 Salivary Gland 0 0 0 0 0 0 0 0 0 0 2 0 1 1 0 2 0 6 0.2C09-10 Oropharynx 0 0 0 0 0 0 0 1 0 2 1 6 1 1 1 3 0 16 0.6C11 Nasopharynx 0 0 0 2 0 1 0 0 0 1 0 0 0 0 1 0 0 5 0.2C12-13 Hypopharynx 0 0 0 0 0 0 1 1 3 0 9 4 4 7 1 9 0 39 1.4C14 Other Oral 0 0 0 0 0 0 0 0 2 1 4 0 3 3 0 1 0 14 0.5C15 Oesophagus 0 0 0 0 1 1 4 7 4 6 13 23 25 34 29 70 1 218 7.9C16 Stomach 0 0 0 0 0 5 3 4 7 9 12 25 23 27 25 41 0 181 6.6C17 Small Intestine 0 0 0 0 0 0 0 1 1 1 0 1 0 2 2 0 0 8 0.3C18 Colon 0 0 0 3 0 2 3 4 7 10 6 12 15 18 10 31 0 121 4.4C19-21 Retum 0 0 0 0 0 3 5 4 1 7 7 6 11 14 13 19 0 90 3.3C22 Liver 1 0 0 0 0 2 2 1 3 9 14 17 29 29 32 58 2 199 7.2C23-24 Gall Bladder 0 0 0 0 0 1 2 3 1 0 0 3 5 8 7 5 0 35 1.3C25 Pancreas 0 0 0 0 0 1 0 2 3 2 16 15 27 12 15 30 1 124 4.5C26 Oth Dig Org 0 0 0 0 0 0 0 0 0 0 0 0 0 1 1 2 0 4 0.1C30-31 Nose, Sinuse 0 0 0 0 1 0 1 2 1 1 1 0 3 2 1 3 0 16 0.6C32 Larynx 0 0 0 0 0 1 0 0 8 7 9 18 22 18 9 30 0 122 4.4C33-34 Lung 0 0 0 2 2 0 3 4 9 12 22 29 31 50 39 67 0 270 9.8C37-38 Mediastinum, Plura 0 0 0 0 0 0 0 0 0 0 3 0 1 0 0 1 0 5 0.2C40-41 Bone 0 0 1 7 4 1 1 0 0 1 0 4 3 0 0 2 0 24 0.9C43 Skin Melanoma 0 0 0 1 0 0 0 0 1 0 1 0 0 0 1 0 0 4 0.1C44 Skin Others 0 0 0 1 0 1 0 0 0 1 1 0 2 1 0 5 0 12 0.4C47 Nervous System 0 0 0 0 1 0 0 1 0 0 0 0 0 0 0 0 0 2 0.1C48 Retroperitonium 0 0 0 0 0 0 0 0 0 0 0 0 1 0 0 0 0 1 0.0C49 Conn & Soft Tissue 1 0 0 0 2 1 0 1 0 1 1 1 1 3 2 4 0 18 0.7C50 Breast 0 0 0 0 0 0 0 1 2 5 2 2 1 3 2 6 1 25 0.9C60 Penis 0 0 0 0 0 0 0 0 0 1 2 2 1 4 1 2 0 13 0.5C61 Prostate 0 0 0 1 0 0 0 0 0 1 1 8 19 26 49 120 1 226 8.2C62 Testis 0 0 0 1 0 1 1 0 0 1 0 0 1 0 1 2 0 8 0.3C64-65 Kidney 0 0 0 0 0 0 1 2 1 3 4 5 3 12 3 13 0 47 1.7C66-68 Urinary Bladder 0 0 0 0 0 0 0 2 0 1 6 6 10 11 14 26 1 77 2.8C69 Eye 1 1 0 0 0 0 0 0 1 1 0 0 0 0 0 0 0 4 0.1C70-72 Brain 2 3 0 3 2 3 3 6 5 8 9 7 3 10 6 4 0 74 2.7C73 Thyroid 0 0 0 0 0 0 0 0 0 0 1 2 2 2 1 2 1 11 0.4C74-75 Other Endocrine Gland 0 0 0 0 1 0 0 0 0 0 0 0 0 2 0 0 0 3 0.1C76 Other Ill Def Sit 0 0 0 0 0 0 1 1 0 1 3 0 0 2 1 4 0 13 0.5C77 Lymph Nodes 0 0 0 0 0 0 0 2 2 0 3 0 0 1 1 1 0 10 0.4C78 Sec Resp & Dig 0 0 0 0 0 0 1 1 1 2 1 2 3 4 2 5 0 22 0.8C79 Sec Others 0 0 0 0 0 0 0 0 1 0 0 0 0 0 1 0 0 2 0.1C80 Unknown Primary 0 0 0 1 0 0 3 2 2 6 9 10 9 15 15 22 1 95 3.4C81 Hodgkin Lymphoma 3 0 0 1 1 1 0 3 1 0 2 1 5 1 2 0 0 21 0.8C82-85 N.H.Lymphoma 1 0 6 2 1 0 7 8 10 6 9 13 10 16 16 33 0 138 5.0C90 Multiple Myeloma 0 0 0 0 0 0 0 0 2 0 4 6 2 5 6 5 0 30 1.1C91 Lymphoid Leukemia 3 9 3 1 1 4 4 0 1 3 1 1 1 1 1 4 0 38 1.4C92 Myeloid Leukemia 1 2 3 3 1 5 3 4 3 6 1 4 10 9 7 10 0 72 2.6C93-95 Other Leukemia 0 2 1 2 0 1 0 4 2 1 2 1 5 1 5 2 0 29 1.1Total All Sites 14 18 14 31 18 37 52 90 110 136 213 275 332 391 351 668 9 2759 100.0

35
Table 17: Number of Cancer Deaths by Age and Site (ICD10) with Percentages, Pune, 2006-10, Female ICD-10 SITE 0 5 10 15 20 25 30 35 40 45 50 55 60 65 70 75 99 Total %C00 Lip 0 0 0 0 0 0 0 1 0 0 1 0 1 1 0 0 0 4 0.1C01-02 Tongue 0 0 0 0 1 0 3 0 5 4 3 6 2 3 2 2 0 31 1.1C03-06 Mouth 0 0 0 0 0 1 1 5 3 16 16 11 20 14 14 17 0 118 4.2C07-08 Salivary Gland 0 0 0 0 1 0 0 0 0 0 2 0 0 0 1 1 0 5 0.2C09-10 Oropharynx 0 0 0 0 0 0 0 1 0 2 0 3 0 0 0 1 0 7 0.2C11 Nasopharynx 0 0 0 0 0 0 0 0 0 0 1 1 0 0 1 1 0 4 0.1C12-13 Hypopharynx 0 0 0 0 0 0 0 1 1 2 2 0 3 0 2 0 0 11 0.4C14 Other Oral 0 0 0 0 0 0 0 0 0 0 0 0 1 0 0 2 0 3 0.1C15 Oesophagus 0 0 0 0 0 0 4 3 7 10 12 16 15 17 23 47 0 154 5.5C16 Stomach 0 0 0 0 0 2 1 5 2 4 7 11 12 13 11 14 0 82 2.9C17 Small Intestine 0 0 0 0 0 0 0 0 0 0 0 0 1 0 2 3 0 6 0.2C18 Colon 0 0 0 0 1 4 1 1 6 4 7 5 11 8 16 26 2 92 3.3C19-21 Retum 0 0 0 0 1 1 1 3 2 2 6 9 8 8 9 14 0 64 2.3C22 Liver 0 0 0 0 1 1 2 3 4 3 5 9 7 10 10 22 0 77 2.7C23-24 Gall Bladder 0 0 0 0 0 0 1 2 0 3 6 5 7 7 6 16 0 53 1.9C25 Pancreas 0 0 0 0 1 0 2 1 1 7 4 7 5 12 11 24 0 75 2.7C26 Oth Dig Org 0 0 0 0 0 0 0 0 0 0 1 0 0 0 0 0 0 1 0.0C30-31 Nose, Sinuse 0 0 0 0 0 0 0 0 2 0 0 3 2 0 2 3 0 12 0.4C32 Larynx 0 0 0 0 0 0 0 0 1 2 1 1 4 3 4 12 0 28 1.0C33-34 Lung 0 0 0 0 0 1 3 11 9 7 22 20 19 22 22 32 0 168 6.0C37-38 Mediastinum, Plura 0 0 0 0 0 1 0 0 1 0 0 0 0 2 1 1 0 6 0.2C40-41 Bone 0 2 4 1 2 1 0 1 0 4 1 3 1 1 1 0 1 23 0.8C43 Skin Melanoma 0 0 0 0 0 0 0 1 0 0 0 0 0 0 0 0 0 1 0.0C44 Skin Others 0 0 0 0 0 0 0 0 0 1 1 0 1 1 2 1 0 7 0.2C48 Retroperitonium 0 0 0 0 0 0 0 0 1 1 0 1 0 1 2 0 0 6 0.2C49 Conn & Soft Tissue 0 0 0 0 1 1 1 0 2 1 2 1 0 2 4 1 0 16 0.6C50 Breast 0 0 0 0 2 6 22 30 64 89 70 102 60 81 57 112 1 696 24.8C51-52 Oth Fem Gen Org 0 0 0 0 0 0 0 1 1 0 0 1 3 1 2 6 0 15 0.5C53 Cervix 0 0 0 0 0 3 1 15 21 39 45 35 30 25 28 33 2 277 9.9C54 Corpus Uteri 0 0 0 0 0 0 1 1 0 1 2 6 4 7 13 11 0 46 1.6C55 Uterus 0 0 0 0 0 0 0 1 2 3 3 2 3 3 5 5 0 27 1.0C56 Ovary 0 0 0 0 2 2 7 8 13 24 19 42 29 32 27 49 2 256 9.1C57-58 Oth Unsp Fem Gen Org 0 0 0 0 0 0 0 0 0 0 0 0 0 1 0 0 0 1 0.0C64-65 Kidney 0 0 0 0 0 0 0 0 3 1 3 2 4 4 4 4 0 25 0.9C66-68 Urinary Bladder 0 0 0 1 0 0 0 0 0 0 0 0 1 7 7 10 0 26 0.9C69 Eye 0 0 0 0 0 0 0 0 0 0 0 0 1 0 0 0 0 1 0.0C70-72 Brain 2 2 1 3 1 2 2 1 3 1 6 9 5 6 1 5 0 50 1.8C73 Thyroid 0 0 0 0 0 0 0 1 0 1 1 0 3 2 3 3 0 14 0.5C74-75 Other Endocrine Gland 0 0 0 0 0 0 0 0 0 0 0 0 0 1 1 1 0 3 0.1C76 Other Ill Def Sites 0 0 0 0 0 0 0 0 0 0 2 1 1 0 0 3 0 7 0.2C77 Lymph Nodes 0 0 0 0 1 0 0 1 0 0 0 1 1 0 0 0 0 4 0.1C78 Sec Resp & Dig 0 0 0 0 0 0 1 0 0 1 0 0 2 1 2 3 0 10 0.4C79 Sec Others 0 0 0 0 0 0 0 1 0 2 1 2 2 3 0 1 0 12 0.4C80 Unknown Primary 0 0 1 1 0 0 0 2 6 5 6 6 5 8 8 13 2 63 2.2C81 Hodgkin Lymphoma 0 0 0 0 0 1 0 1 2 0 1 2 1 0 2 1 0 11 0.4C82-85 N.H.Lymphoma 0 1 1 0 0 5 1 1 4 3 6 6 7 11 10 11 0 67 2.4C90 Multiple Myeloma 0 0 0 0 0 0 0 0 1 1 1 6 7 1 2 2 0 21 0.7C91 Lymphoid Leukemia 1 2 2 2 4 1 2 1 2 2 2 0 1 1 3 3 0 29 1.0C92 Myeloid Leukemia 3 3 3 2 2 4 2 4 2 5 5 8 3 7 4 4 0 61 2.2C93-95 Other Leukemia 3 2 0 0 0 2 2 2 3 1 3 1 4 0 2 3 0 28 1.0Total All Sites 9 12 12 10 21 39 61 110 174 252 276 344 297 327 327 523 10 2804 100.0

36
Table 18: Average Annual Age-Specific World Age Adjusted, Truncated (35-64) Cancer Death Rates per 100,000 Persons, Pune, 2006-10, Male ICD-10 SITE 0 5 10 15 20 25 30 35 40 45 50 55 60 65 70 75 CR AAR TRC00 Lip 0.0 0.0 0.0 0.0 0.0 0.0 0.0 0.0 0.0 0.2 0.0 0.3 0.7 0.5 0.0 1.2 0.1 0.1 0.2C01-02 Tongue 0.0 0.0 0.0 0.0 0.0 0.1 0.0 1.2 1.3 0.9 1.3 4.2 3.6 2.7 6.5 5.6 0.7 0.9 1.9C03-06 Mouth 0.1 0.1 0.0 0.0 0.0 0.1 0.3 0.7 1.7 1.8 4.3 7.0 9.8 12.8 11.8 8.1 1.4 2.0 3.7C07-08 Salivary Gland 0.0 0.0 0.0 0.0 0.0 0.0 0.0 0.0 0.0 0.0 0.4 0.0 0.4 0.5 0.0 1.2 0.0 0.1 0.1C09-10 Oropharynx 0.0 0.0 0.0 0.0 0.0 0.0 0.0 0.1 0.0 0.3 0.2 1.7 0.4 0.5 0.7 1.9 0.1 0.2 0.4C11 Nasopharynx 0.0 0.0 0.0 0.1 0.0 0.1 0.0 0.0 0.0 0.2 0.0 0.0 0.0 0.0 0.7 0.0 0.0 0.0 0.0C12-13 Hypopharynx 0.0 0.0 0.0 0.0 0.0 0.0 0.1 0.1 0.4 0.0 1.6 1.1 1.4 3.2 0.7 5.6 0.3 0.4 0.7C14 Other Oral 0.0 0.0 0.0 0.0 0.0 0.0 0.0 0.0 0.2 0.2 0.7 0.0 1.1 1.4 0.0 0.6 0.1 0.2 0.3C15 Oesophagus 0.0 0.0 0.0 0.0 0.1 0.1 0.4 0.7 0.5 0.9 2.3 6.4 9.1 15.5 19.0 43.7 1.7 2.6 2.8C16 Stomach 0.0 0.0 0.0 0.0 0.0 0.4 0.3 0.4 0.9 1.4 2.1 7.0 8.3 12.3 16.3 25.6 1.4 2.1 2.8C17 Small Intestine 0.0 0.0 0.0 0.0 0.0 0.0 0.0 0.1 0.1 0.2 0.0 0.3 0.0 0.9 1.3 0.0 0.1 0.1 0.1C18 Colon 0.0 0.0 0.0 0.2 0.0 0.1 0.3 0.4 0.9 1.5 1.1 3.4 5.4 8.2 6.5 19.4 0.9 1.4 1.9C19-21 Retum 0.0 0.0 0.0 0.0 0.0 0.2 0.4 0.4 0.1 1.1 1.3 1.7 4.0 6.4 8.5 11.9 0.7 1.0 1.2C22 Liver 0.1 0.0 0.0 0.0 0.0 0.1 0.2 0.1 0.4 1.4 2.5 4.8 10.5 13.2 20.9 36.2 1.5 2.4 2.7C23-24 Gall Bladder 0.0 0.0 0.0 0.0 0.0 0.1 0.2 0.3 0.1 0.0 0.0 0.8 1.8 3.7 4.6 3.1 0.3 0.4 0.4C25 Pancreas 0.0 0.0 0.0 0.0 0.0 0.1 0.0 0.2 0.4 0.3 2.9 4.2 9.8 5.5 9.8 18.7 1.0 1.5 2.4C26 Oth Dig Org 0.0 0.0 0.0 0.0 0.0 0.0 0.0 0.0 0.0 0.0 0.0 0.0 0.0 0.5 0.7 1.2 0.0 0.1 0.0C30-31 Nose, Sinuse 0.0 0.0 0.0 0.0 0.1 0.0 0.1 0.2 0.1 0.2 0.2 0.0 1.1 0.9 0.7 1.9 0.1 0.2 0.3C32 Larynx 0.0 0.0 0.0 0.0 0.0 0.1 0.0 0.0 1.0 1.1 1.6 5.0 8.0 8.2 5.9 18.7 0.9 1.5 2.3C33-34 Lung 0.0 0.0 0.0 0.1 0.1 0.0 0.3 0.4 1.1 1.8 3.9 8.1 11.2 22.8 25.5 41.8 2.1 3.2 3.8C37-38 Mediastinum, Plura 0.0 0.0 0.0 0.0 0.0 0.0 0.0 0.0 0.0 0.0 0.5 0.0 0.4 0.0 0.0 0.6 0.0 0.1 0.1C40-41 Bone 0.0 0.0 0.1 0.5 0.3 0.1 0.1 0.0 0.0 0.2 0.0 1.1 1.1 0.0 0.0 1.2 0.2 0.2 0.3C43 Skin Melanoma 0.0 0.0 0.0 0.1 0.0 0.0 0.0 0.0 0.1 0.0 0.2 0.0 0.0 0.0 0.7 0.0 0.0 0.0 0.1C44 Skin Others 0.0 0.0 0.0 0.1 0.0 0.1 0.0 0.0 0.0 0.2 0.2 0.0 0.7 0.5 0.0 3.1 0.1 0.1 0.2C47 Nervous System 0.0 0.0 0.0 0.0 0.1 0.0 0.0 0.1 0.0 0.0 0.0 0.0 0.0 0.0 0.0 0.0 0.0 0.0 0.0C48 Retroperitonium 0.0 0.0 0.0 0.0 0.0 0.0 0.0 0.0 0.0 0.0 0.0 0.0 0.4 0.0 0.0 0.0 0.0 0.0 0.0C49 Conn & Soft Tissue 0.1 0.0 0.0 0.0 0.1 0.1 0.0 0.1 0.0 0.2 0.2 0.3 0.4 1.4 1.3 2.5 0.1 0.2 0.2C50 Breast 0.0 0.0 0.0 0.0 0.0 0.0 0.0 0.1 0.2 0.8 0.4 0.6 0.4 1.4 1.3 3.7 0.2 0.3 0.4C60 Penis 0.0 0.0 0.0 0.0 0.0 0.0 0.0 0.0 0.0 0.2 0.4 0.6 0.4 1.8 0.7 1.2 0.1 0.2 0.2C61 Prostate 0.0 0.0 0.0 0.1 0.0 0.0 0.0 0.0 0.0 0.2 0.2 2.2 6.9 11.9 32.0 75.0 1.8 2.9 1.2C62 Testis 0.0 0.0 0.0 0.1 0.0 0.1 0.1 0.0 0.0 0.2 0.0 0.0 0.4 0.0 0.7 1.2 0.1 0.1 0.1C64-65 Kidney 0.0 0.0 0.0 0.0 0.0 0.0 0.1 0.2 0.1 0.5 0.7 1.4 1.1 5.5 2.0 8.1 0.4 0.6 0.6C66-68 Urinary Bladder 0.0 0.0 0.0 0.0 0.0 0.0 0.0 0.2 0.0 0.2 1.1 1.7 3.6 5.0 9.2 16.2 0.6 0.9 0.9C69 Eye 0.1 0.1 0.0 0.0 0.0 0.0 0.0 0.0 0.1 0.2 0.0 0.0 0.0 0.0 0.0 0.0 0.0 0.0 0.1C70-72 Brain 0.2 0.3 0.0 0.2 0.1 0.2 0.3 0.6 0.6 1.2 1.6 2.0 1.1 4.6 3.9 2.5 0.6 0.7 1.1C73 Thyroid 0.0 0.0 0.0 0.0 0.0 0.0 0.0 0.0 0.0 0.0 0.2 0.6 0.7 0.9 0.7 1.2 0.1 0.1 0.2C74-75 Other Endocrine Gland0.0 0.0 0.0 0.0 0.1 0.0 0.0 0.0 0.0 0.0 0.0 0.0 0.0 0.9 0.0 0.0 0.0 0.0 0.0C76 Other Ill Def Sites 0.0 0.0 0.0 0.0 0.0 0.0 0.1 0.1 0.0 0.2 0.5 0.0 0.0 0.9 0.7 2.5 0.1 0.1 0.1C77 Lymph Nodes 0.0 0.0 0.0 0.0 0.0 0.0 0.0 0.2 0.2 0.0 0.5 0.0 0.0 0.5 0.7 0.6 0.1 0.1 0.2C78 Sec Resp & Dig 0.0 0.0 0.0 0.0 0.0 0.0 0.1 0.1 0.1 0.3 0.2 0.6 1.1 1.8 1.3 3.1 0.2 0.3 0.3C79 Sec Others 0.0 0.0 0.0 0.0 0.0 0.0 0.0 0.0 0.1 0.0 0.0 0.0 0.0 0.0 0.7 0.0 0.0 0.0 0.0C80 Unknown Primary 0.0 0.0 0.0 0.1 0.0 0.0 0.3 0.2 0.2 0.9 1.6 2.8 3.3 6.9 9.8 13.7 0.7 1.1 1.3C81 Hodgkin Lymphoma 0.3 0.0 0.0 0.1 0.1 0.1 0.0 0.3 0.1 0.0 0.4 0.3 1.8 0.5 1.3 0.0 0.2 0.2 0.4C82-85 N.H.Lymphoma 0.1 0.0 0.5 0.1 0.1 0.0 0.6 0.9 1.2 0.9 1.6 3.6 3.6 7.3 10.5 20.6 1.1 1.5 1.8C90 Multiple Myeloma 0.0 0.0 0.0 0.0 0.0 0.0 0.0 0.0 0.2 0.0 0.7 1.7 0.7 2.3 3.9 3.1 0.2 0.4 0.5C91 Lymphoid Leukemia 0.3 0.9 0.2 0.1 0.1 0.3 0.4 0.0 0.1 0.5 0.2 0.3 0.4 0.5 0.7 2.5 0.3 0.3 0.2C92 Myeloid Leukemia 0.1 0.2 0.2 0.2 0.1 0.4 0.3 0.4 0.4 0.9 0.2 1.1 3.6 4.1 4.6 6.2 0.6 0.8 1.0C93-95 Other Leukemia 0.0 0.2 0.1 0.1 0.0 0.1 0.0 0.4 0.2 0.2 0.4 0.3 1.8 0.5 3.3 1.2 0.2 0.3 0.5Total All Sites 1.3 1.8 1.1 2.3 1.2 2.7 4.6 9.6 13.5 20.7 38.1 77.1 120.2 178.6 229.5 417.2 21.5 31.9 40.1

37
Table 19: Average Annual Age-Specific World Age Adjusted, Truncated (35-64) Cancer Death Rates per 100,000 Persons, Pune, 2006-10, Female ICD-10 SITE 0 5 10 15 20 25 30 35 40 45 50 55 60 65 70 75 CR AAR TRC00 Lip 0.0 0.0 0.0 0.0 0.0 0.0 0.0 0.1 0.0 0.0 0.2 0.0 0.3 0.4 0.0 0.0 0.0 0.0 0.1C01-02 Tongue 0.0 0.0 0.0 0.0 0.1 0.0 0.3 0.0 0.7 0.6 0.7 1.9 0.7 1.1 1.2 1.2 0.3 0.3 0.7C03-06 Mouth 0.0 0.0 0.0 0.0 0.0 0.1 0.1 0.5 0.4 2.5 3.5 3.4 6.9 5.3 8.3 9.8 1.0 1.3 2.6C07-08 Salivary Gland 0.0 0.0 0.0 0.0 0.1 0.0 0.0 0.0 0.0 0.0 0.4 0.0 0.0 0.0 0.6 0.6 0.0 0.1 0.1C09-10 Oropharynx 0.0 0.0 0.0 0.0 0.0 0.0 0.0 0.1 0.0 0.3 0.0 0.9 0.0 0.0 0.0 0.6 0.1 0.1 0.2C11 Nasopharynx 0.0 0.0 0.0 0.0 0.0 0.0 0.0 0.0 0.0 0.0 0.2 0.3 0.0 0.0 0.6 0.6 0.0 0.0 0.1C12-13 Hypopharynx 0.0 0.0 0.0 0.0 0.0 0.0 0.0 0.1 0.1 0.3 0.4 0.0 1.0 0.0 1.2 0.0 0.1 0.1 0.3C14 Other Oral 0.0 0.0 0.0 0.0 0.0 0.0 0.0 0.0 0.0 0.0 0.0 0.0 0.3 0.0 0.0 1.2 0.0 0.0 0.0C15 Oesophagus 0.0 0.0 0.0 0.0 0.0 0.0 0.4 0.3 1.0 1.6 2.6 4.9 5.2 6.5 13.7 27.1 1.3 1.7 2.3C16 Stomach 0.0 0.0 0.0 0.0 0.0 0.2 0.1 0.5 0.3 0.6 1.5 3.4 4.2 4.9 6.6 8.1 0.7 0.9 1.5C17 Small Intestine 0.0 0.0 0.0 0.0 0.0 0.0 0.0 0.0 0.0 0.0 0.0 0.0 0.3 0.0 1.2 1.7 0.1 0.1 0.0C18 Colon 0.0 0.0 0.0 0.0 0.1 0.3 0.1 0.1 0.9 0.6 1.5 1.5 3.8 3.0 9.5 15.0 0.8 1.0 1.2C19-21 Retum 0.0 0.0 0.0 0.0 0.1 0.1 0.1 0.3 0.3 0.3 1.3 2.8 2.8 3.0 5.4 8.1 0.6 0.7 1.1C22 Liver 0.0 0.0 0.0 0.0 0.1 0.1 0.2 0.3 0.6 0.5 1.1 2.8 2.4 3.8 6.0 12.7 0.7 0.9 1.1C23-24 Gall Bladder 0.0 0.0 0.0 0.0 0.0 0.0 0.1 0.2 0.0 0.5 1.3 1.5 2.4 2.7 3.6 9.2 0.5 0.6 0.9C25 Pancreas 0.0 0.0 0.0 0.0 0.1 0.0 0.2 0.1 0.1 1.1 0.9 2.2 1.7 4.6 6.6 13.8 0.6 0.8 0.9C26 Oth Dig Org 0.0 0.0 0.0 0.0 0.0 0.0 0.0 0.0 0.0 0.0 0.2 0.0 0.0 0.0 0.0 0.0 0.0 0.0 0.0C30-31 Nose, Sinuse 0.0 0.0 0.0 0.0 0.0 0.0 0.0 0.0 0.3 0.0 0.0 0.9 0.7 0.0 1.2 1.7 0.1 0.1 0.3C32 Larynx 0.0 0.0 0.0 0.0 0.0 0.0 0.0 0.0 0.1 0.3 0.2 0.3 1.4 1.1 2.4 6.9 0.2 0.3 0.3C33-34 Lung 0.0 0.0 0.0 0.0 0.0 0.1 0.3 1.2 1.3 1.1 4.8 6.2 6.6 8.4 13.1 18.5 1.5 1.9 3.1C37-38 Mediastinum, Plura 0.0 0.0 0.0 0.0 0.0 0.1 0.0 0.0 0.1 0.0 0.0 0.0 0.0 0.8 0.6 0.6 0.1 0.1 0.0C40-41 Bone 0.0 0.2 0.3 0.1 0.2 0.1 0.0 0.1 0.0 0.6 0.2 0.9 0.3 0.4 0.6 0.0 0.2 0.2 0.3C43 Skin Melanoma 0.0 0.0 0.0 0.0 0.0 0.0 0.0 0.1 0.0 0.0 0.0 0.0 0.0 0.0 0.0 0.0 0.0 0.0 0.0C44 Skin Others 0.0 0.0 0.0 0.0 0.0 0.0 0.0 0.0 0.0 0.2 0.2 0.0 0.3 0.4 1.2 0.6 0.1 0.1 0.1C48 Retroperitonium 0.0 0.0 0.0 0.0 0.0 0.0 0.0 0.0 0.1 0.2 0.0 0.3 0.0 0.4 1.2 0.0 0.1 0.1 0.1C49 Conn & Soft Tissue 0.0 0.0 0.0 0.0 0.1 0.1 0.1 0.0 0.3 0.2 0.4 0.3 0.0 0.8 2.4 0.6 0.1 0.2 0.2C50 Breast 0.0 0.0 0.0 0.0 0.2 0.5 2.2 3.3 9.2 14.1 15.2 31.5 20.8 30.8 34.0 64.6 6.0 7.5 14.3C51-52 Oth Fem Gen Org 0.0 0.0 0.0 0.0 0.0 0.0 0.0 0.1 0.1 0.0 0.0 0.3 1.0 0.4 1.2 3.5 0.1 0.2 0.2C53 Cervix 0.0 0.0 0.0 0.0 0.0 0.2 0.1 1.6 3.0 6.2 9.8 10.8 10.4 9.5 16.7 19.0 2.4 3.0 6.4C54 Corpus Uteri 0.0 0.0 0.0 0.0 0.0 0.0 0.1 0.1 0.0 0.2 0.4 1.9 1.4 2.7 7.7 6.3 0.4 0.5 0.5C55 Uterus 0.0 0.0 0.0 0.0 0.0 0.0 0.0 0.1 0.3 0.5 0.7 0.6 1.0 1.1 3.0 2.9 0.2 0.3 0.5C56 Ovary 0.0 0.0 0.0 0.0 0.2 0.2 0.7 0.9 1.9 3.8 4.1 13.0 10.1 12.2 16.1 28.3 2.2 2.8 4.9C57-58 Oth Unsp Fem Gen Or 0.0 0.0 0.0 0.0 0.0 0.0 0.0 0.0 0.0 0.0 0.0 0.0 0.0 0.4 0.0 0.0 0.0 0.0 0.0C64-65 Kidney 0.0 0.0 0.0 0.0 0.0 0.0 0.0 0.0 0.4 0.2 0.7 0.6 1.4 1.5 2.4 2.3 0.2 0.3 0.5C66-68 Urinary Bladder 0.0 0.0 0.0 0.1 0.0 0.0 0.0 0.0 0.0 0.0 0.0 0.0 0.3 2.7 4.2 5.8 0.2 0.3 0.0C69 Eye 0.0 0.0 0.0 0.0 0.0 0.0 0.0 0.0 0.0 0.0 0.0 0.0 0.3 0.0 0.0 0.0 0.0 0.0 0.0C70-72 Brain 0.2 0.2 0.1 0.3 0.1 0.2 0.2 0.1 0.4 0.2 1.3 2.8 1.7 2.3 0.6 2.9 0.4 0.5 0.9C73 Thyroid 0.0 0.0 0.0 0.0 0.0 0.0 0.0 0.1 0.0 0.2 0.2 0.0 1.0 0.8 1.8 1.7 0.1 0.2 0.2C74-75 Other Endocrine Gland 0.0 0.0 0.0 0.0 0.0 0.0 0.0 0.0 0.0 0.0 0.0 0.0 0.0 0.4 0.6 0.6 0.0 0.0 0.0C76 Other Ill Def Sites 0.0 0.0 0.0 0.0 0.0 0.0 0.0 0.0 0.0 0.0 0.4 0.3 0.3 0.0 0.0 1.7 0.1 0.1 0.2C77 Lymph Nodes 0.0 0.0 0.0 0.0 0.1 0.0 0.0 0.1 0.0 0.0 0.0 0.3 0.3 0.0 0.0 0.0 0.0 0.0 0.1C78 Sec Resp & Dig 0.0 0.0 0.0 0.0 0.0 0.0 0.1 0.0 0.0 0.2 0.0 0.0 0.7 0.4 1.2 1.7 0.1 0.1 0.1C79 Sec Others 0.0 0.0 0.0 0.0 0.0 0.0 0.0 0.1 0.0 0.3 0.2 0.6 0.7 1.1 0.0 0.6 0.1 0.1 0.3C80 Unknown Primary 0.0 0.0 0.1 0.1 0.0 0.0 0.0 0.2 0.9 0.8 1.3 1.9 1.7 3.0 4.8 7.5 0.5 0.7 1.0C81 Hodgkin Lymphoma 0.0 0.0 0.0 0.0 0.0 0.1 0.0 0.1 0.3 0.0 0.2 0.6 0.3 0.0 1.2 0.6 0.1 0.1 0.2C82-85 N.H.Lymphoma 0.0 0.1 0.1 0.0 0.0 0.4 0.1 0.1 0.6 0.5 1.3 1.9 2.4 4.2 6.0 6.3 0.6 0.7 1.0C90 Multiple Myeloma 0.0 0.0 0.0 0.0 0.0 0.0 0.0 0.0 0.1 0.2 0.2 1.9 2.4 0.4 1.2 1.2 0.2 0.3 0.6C91 Lymphoid Leukemia 0.1 0.2 0.2 0.2 0.3 0.1 0.2 0.1 0.3 0.3 0.4 0.0 0.3 0.4 1.8 1.7 0.3 0.3 0.3C92 Myeloid Leukemia 0.3 0.3 0.3 0.2 0.2 0.3 0.2 0.4 0.3 0.8 1.1 2.5 1.0 2.7 2.4 2.3 0.5 0.6 0.9C93-95 Other Leukemia 0.3 0.2 0.0 0.0 0.0 0.2 0.2 0.2 0.4 0.2 0.7 0.3 1.4 0.0 1.2 1.7 0.2 0.3 0.5Total All Sites 1.0 1.3 1.0 0.9 1.7 3.2 6.1 11.9 24.9 40.0 60.0 106.4 103.0 124.4 194.8 301.8 24.3 30.8 51.6

38
APPENDIX Calculation of rates and ratios Age specific rates are calculated by dividing the number of cases in each 5 year age and sex stratum by corresponding population estimate for that stratum and multiplying the product by 100,000 to give the rates per 100,000. Crude rates are calculated by the same way using total cancer cases and total cases and total population base by sex. Age adjusted rates are calculated by summing the products of the age specific rates and the world standered population strata. They provide a rate which is independent of the age structure of the population of interest and are therefore useful in making comparisons between different populations, time periods etc. Cumulative rates are calculated by multiplying the five year age specific rates per person by 5 and summing over age groups from 0-4 to 70-74. This rate is then expressed as a percentage. This rate is a good indicator of life time risk.