canfor corporation · pdf filecanfor corporation forward looking ... china • sichuan wood...
TRANSCRIPT

Canfor Corporation1
Canfor Corporation
June 2010

2Canfor Corporation
Forward Looking Statements
► The presentation and answers to questions today contain forward-looking statements which involve known and unknown risks, uncertainties and other factors that may cause actual results to be materially different from any future results, performance or achievements expressed or implied by such statements. Factors that could have a material impact on any future oriented statements made herein include, but are not limited to: general economic, market and business conditions, product selling prices, raw material and operating costs, foreign exchange rates, interest rates, changes in law and public policy, the outcome of trade disputes, and opportunities available to or pursued by the Company.
► For further details on these factors and our assumptions and applicable risks and uncertainties, please refer to Canfor Corporation’s Annual Report for the year ended December 31, 2009 available at www.canfor.com or www.sedar.com.

3Canfor Corporation
Canfor Overview► 15 sawmills in Canada
(Capacity – 4.3 Bfbm)
► 4 sawmills in the US(Capacity – 0.6 Bfbm)
► 50.2% interest in Canfor Pulp (3 BC interior pulp mills) (Capacity - 1 million admt)
Non Core Holdings► 50% interest in Peace Valley OSB plant ► 2 panel plants in BC – OSB & plywood ► 1 BCTMP pulp mill in BC ► 50% interest in Howe Sound Pulp LP

4Canfor Corporation
Canfor Overview2%
43%55%
LumberPulpUnallocated
20%
32%
48%LumberPulpUnallocated
0200400600800
1,0001,2001,4001,6001,8002,000
WFT CFP NBD CPLP IFP TMB
Market Capitalization (MM$) – at May 28/10
2009 Revenues ($2,100 million) 2009 Assets ($2,700 million)

5Canfor Corporation
The Downturn
► Reduced sawmill capacity to below 60%, idled OSB and plywood plants
► Reduced corporate and support staff levels by 25%
► Rolled back salaried staff wages 3-15%
► Rolled back contractor and supplier invoices by 10-15%
► Reduced peak working capital by approximately $100 million
► Reduced capital expenditures to minimal levels ($40 million)
0.0
0.5
1.0
1.5
2.0
2.5
J-04
M-04 M-04 J-04
S-04 N-04 J-05
M-05 M-05 J-05
S-05 N-05 J-06
M-06 M-06 J-06
S-06 N-06 J-07
M-07 M-07 J-07
S-07 N-07 J-08
M-08 M-08 J-08
S-08 N-08 J-09
M-09 M-09 J-09
S-09 N-09 J-10
M-10
0
50
100
150
200
250
300
350
400
450
500
US Housing Starts (millions) USD Lumber Price (right axis)

6Canfor Corporation
Improved Lumber Prices
(50)
(40)
(30)
(20)
(10)
0
10
20
Q1.09 Q2.09 Q3.09 Q4.09 Q1.10
Lumber EBITDA (MM$)
150
170
190
210
230
250
270
290
Q1.09 Q2.09 Q3.09 Q4.09 Q1.10 Current
SPF 2x4 (CAD)
Represents EBITDA adjusted for restructuring and inventory devaluation

7Canfor Corporation
Our Markets - Lumber
Market Focus► Grow high value customers
• Increase integration with US retail customers
• Key Asian customers
► Grow Asian markets
SPF
Offshore27%
Canada21%
US 52%
SPF88%
SYP 12%
SYP
Offshore1%
US 99%
Represents Q1 2010 volumes

8Canfor Corporation
U.S. Lumber Demand2009 – Repair & Remodelling - 40% of the total US Demand
0
5
10
15
20
25
30
2008 2009 2010 2011 2012 2013 2014
0
10
20
30
40
50
60
Single-Family Repair & Remod. Industrial Multifamily
Mobile Nonresid.Constr. US Consumption
Volume (Bfbm) Volume (Bfbm)
* Source - RISI(right axis)
9Canfor Corporation
Canfor’s Top 10 Global Customers
►Alpa Forest Products Inc.Pro Dealer
►Lowes CompaniesHome Center
►Millman Lumber CompanyPro Dealer
►Pro BuildPro Dealer
►Universal Forest ProductsHouse Components
►Home DepotHome Center
►LMCPro Dealer
►Mitsui Homes (Japan)Home Builder
►Stock Building SupplyPro Dealer
►Wing Corp (Japan)Industrial
These represent approximately 50% of total lumber revenues.

10Canfor Corporation
Developing Asia
► Japan• Further develop the DIY segment• Further develop Post & Beam / 2X4 hybrid market• Increase committed volumes to strategic customers
► China• Sichuan wood frame reconstruction• Infill partition walls, trusses / floor systems in concrete structures• Custom remanufacturing for Japan and other countries
► Korea• Increase market share of wood frame construction homes
Guangzhou, China

11Canfor Corporation
China
► Long term commitment to China
► Building codes are more conducive to wood frame construction
► Establishing 2 X 4 for the emerging housing sector
► Significant demand for low grade product
► Provincial and Federal government support for market development
0
50
100
150
200
250
300
350
400
450
500
2005 2006 2007 2008 2009 2010F
Low Grade #2 & better
Lumber Volume - MMfbm

12Canfor Corporation
Margin FocusedMargin (% of Sales) – Lumber Segment
(25%)(20%)(15%)(10%)(5%)
0%5%
10%15%20%25%30%
Q4/
03
Q1/
04
Q2/
04
Q3/
04
Q4/
04
Q1/
05
Q2/
05
Q3/
05
Q4/
05
Q1/
06
Q2/
06
Q3/
06
Q4/
06
Q1/
07
Q2/
07
Q3/
07
Q1/
08
Q2/
08
Q3/
08
Q4/
08
Q1/
09
Q2/
09
Q3/
09
Q4/
09
Q1/
10
Canfor Competitor A Competitor B Competitor C Competitor D Competitor E

13Canfor Corporation
BC Interior Annual Allowable Cut
Source: Ministry of Forests
0
10
20
30
40
50
60
Historical 2006-2010 2011-2015 2016-2020
(millions of cubic metres)

14Canfor Corporation
BC Fibre Outlook – Production Capacity
Capacity = 1,200Mfbm
Capacity = 1,200Mfbm
Capacity = 1,400Mfbm
Capacity = 400Mfbm
0
20
40
60
80
100
2010 2020
Pine Spruce/Other Species
0
20
40
60
80
2010 2020
Pine Spruce/Other Species
0
20
40
60
80
2010 2020
Pine Spruce/Other Species
0
10
20
30
40
50
2010 2020
Pine Spruce/Other Species

15Canfor Corporation
Elements of a Lumber Supply Shortage
33European Imports
100%
78
8
10
60
78
2014F*
(2)(1)MPB/Canadian Cut Reduction
27
4
0
23
8
6
Change
7251Total Consumption (Bfbm)
94%73%Operating Rate
84Offshore
1010Canadian Consumption
5437US Consumption
7770Total Capacity (Bfbm)
6Capacity Growth (2.2%)
7070North American Capacity
Normalized2010F(in billions of fbm)
* Sources: Capacity as per USDA; Consumption as per FEA (except 2014 Offshore), company estimates
Normalized assumes 1.5 million housing starts

16Canfor Corporation
Lumber Price/Operating RateForecast operating rate is high by historic standards…
Sources: FEA, RISI, Company estimates
50.0%
60.0%
70.0%
80.0%
90.0%
100.0%
110.0%
$- $100 $200 $300 $400 $500 $600
CAD 2x4 Price
N.A
. Ope
ratin
g R
ate
FEA Forecast (2010-2014)
1992-2009 Actual
Including Export Growth
2010
20142013
2012
2011

17Canfor Corporation
Capital Expenditures
► 2010 projected capital spend of $115 million:
Maintenance capital - $25 million
► 2011+ projected capital spend - $125 million annually
Mill modernization and reductions of fossil fuel usage
0
50
100
150
200
250
300
350
400
2005 2006 2007 2008 2009 2010E 2011E
Capital Expenditures (MM$)
18Canfor Corporation
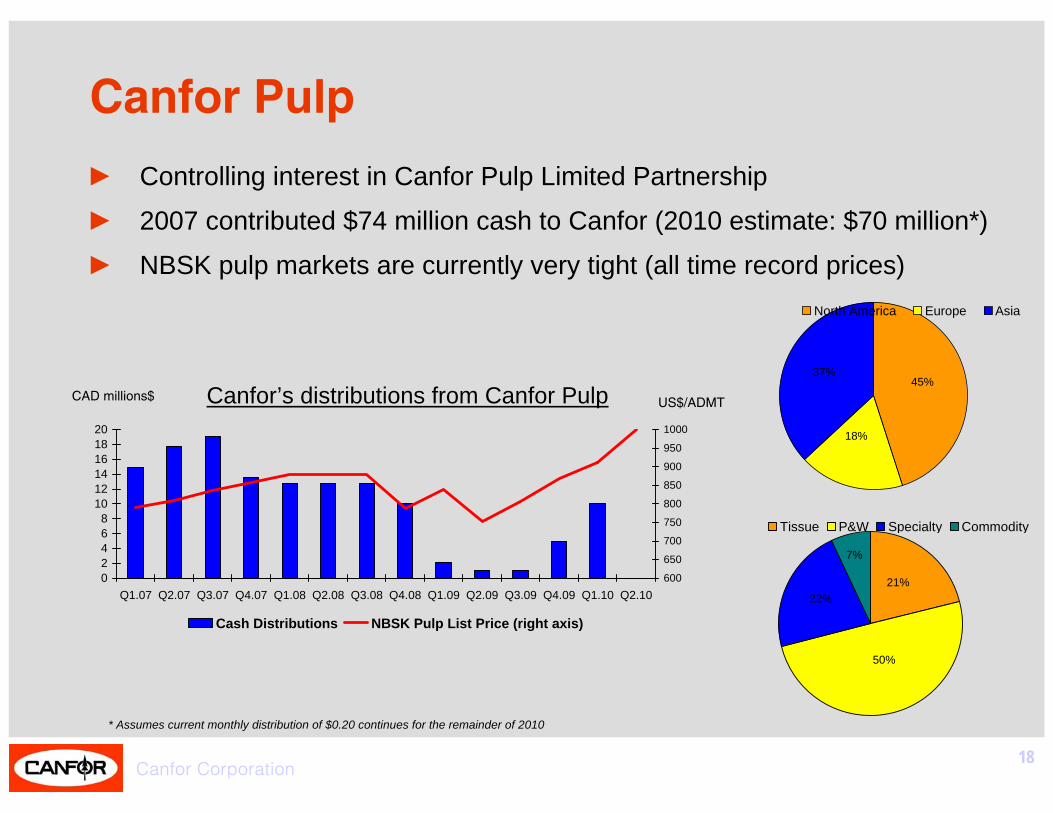
Canfor Pulp
► Controlling interest in Canfor Pulp Limited Partnership
► 2007 contributed $74 million cash to Canfor (2010 estimate: $70 million*)
► NBSK pulp markets are currently very tight (all time record prices)
02468
101214161820
Q1.07 Q2.07 Q3.07 Q4.07 Q1.08 Q2.08 Q3.08 Q4.08 Q1.09 Q2.09 Q3.09 Q4.09 Q1.10 Q2.10600
650
700
750
800
850
900
950
1000
Cash Distributions NBSK Pulp List Price (right axis)
Canfor’s distributions from Canfor PulpCAD millions$ US$/ADMT
37%
18%
45%
North America Europe Asia
7%
22%21%
50%
Tissue P&W Specialty Commodity
* Assumes current monthly distribution of $0.20 continues for the remainder of 2010

19Canfor Corporation
Leveraged to Lumber Market Recovery
0
100
200
300
400
500
600
700
800
2011 2012 2013
Current Production Full Capacity
$351$300RISI 2x4 (CAD) $275
201320122011
Change in EBITDA*(in millions $)
* Base year 2009

20Canfor Corporation
CFP Trading Liquidity
0
100,000
200,000
300,000
400,000
500,000
600,000
2006 2007 2008 2009 2010YTD
CFP WFT IFPAverage Daily Trading Volume
Source: Bloomberg
0
1,000,000
2,000,000
3,000,000
4,000,000
5,000,000
6,000,000
7,000,000
2006 2007 2008 2009 2010YTD
CFP WFT IFP
Average Daily Trading Value
Major Shareholders*The Pattison Group 31%
Mackenzie Cundill 15%
Jarislowsky Fraser 15%
* As per public filings

21Canfor Corporation
Canfor Corporation
TSX:CFP
www.canfor.com
Contacts:Thomas Sitar – VP Finance and CFO
604 661 [email protected]
Patrick Elliott – Treasurer604 661 5441

22Canfor Corporation
Appendix

23Canfor Corporation
Historic North American Capacity and Consumption
40.0
45.0
50.0
55.0
60.0
65.0
70.0
75.0
80.0
85.0
1995 1996 1997 1998 1999 2000 2001 2002 2003 2004 2005 2006 2007 2008 2009
Capacity Consumption
Source: USDA
Peak to Trough Annual Growth Rate: 2.2%
BFBM
CapacityBC Capacity - 15.8 Bfbm (22% vs. peak of 24%)Non-BC Canadian Capacity - 14.7 Bfbm (21% vs. peak of 25%)
ConsumptionOffshore Shipments - 3.7 Bfbm (8% of total)Projected Offshore Shipments - 7.7 Bfbm (11% of total compared to 4% in last peak)

24Canfor Corporation
US Housing Starts – What is Normalized Demand?
0.0
0.5
1.0
1.5
2.0
2.5
1970's 1980's 1990's 2000's
Household Formations House Removals Other
Source: RISI
Current HousingStarts Level

25Canfor Corporation
Impact of Normalized Housing Demand
12.421.99.5Total Consumption (Bfbm)
-6.356.35Board feet per Sq. Foot
-2,3002,300Square Feet per House
8501,500650Housing Starts (000’s)
ChangeNormalizedCurrent
Note: Increase to normalized level assumes all new starts are single family. At the peak another 3 Bfbm of consumption in multi-family and mobile home applications.

26Canfor Corporation
Capitalization and Liquidity (as at March 31, 2010)
Canfor Corp. Debt $ Millions
Senior Unsecured Notes 8.03% 2011 32
Senior Unsecured Notes 6.18% 2011 50
Senior Unsecured Notes 6.33% 2012 50
Senior Unsecured Notes 5.42% 2013 75
Total 207
Cash 53
Shareholders’ Equity 1,398
Net Debt to Total Capitalization 10%
Liquidity $ Millions
Syndicated operating facility 2011 355
Operating facility “A” & “B” 2011/12 49
Outstanding Letters of Credit (18)
Cash balance 53
Net Liquidity 439
(35)
(25)
(15)
(5)
5
15
2004 2005 2006 2007 2008 2009
Net Debt to Total Capitalization
All information below excludes CPLP