cann group appendix 4e and annual report for personal … · 2017-08-28 · cann group limited...
TRANSCRIPT
ASX ANNOUNCEMENT
29 AUGUST 2017
CANN GROUP APPENDIX 4E AND ANNUAL REPORT
In accordance with the Listing Rules, Cann Group Limited encloses for immediate release the following
information:
1. Appendix 4E; and
2. Cann Group Limited Annual Report 2017
For further information please contact: Peter Crock Matthew Wright Cann Group Limited NWR Communications +61 (0) 3 9095 7088 +61 (0) 451 896 420 [email protected] [email protected] About Cann Group Cann Group is building a world-class business focused on breeding, cultivating and manufacturing medicinal cannabis for sale and use within Australia. The company has established research and cultivation facilities in Melbourne and is striving to provide access to medicinal cannabis for Australian patients. Cann Group has executed collaboration agreements that will enable it to establish a leading position in plant genetics, breeding, extraction, analysis and production techniques required to facilitate the supply of medicinal cannabis for a range of diseases and medical conditions. It was issued with Australia’s first medicinal cannabis research licence in February 2017, in addition to Australia’s first medicinal cannabis cultivation licence in March 2017. Aurora Cannabis Inc – Canada’s second largest listed medicinal cannabis company – is a cornerstone investor in Cann, with a 19.9% shareholding.
For
per
sona
l use
onl
y
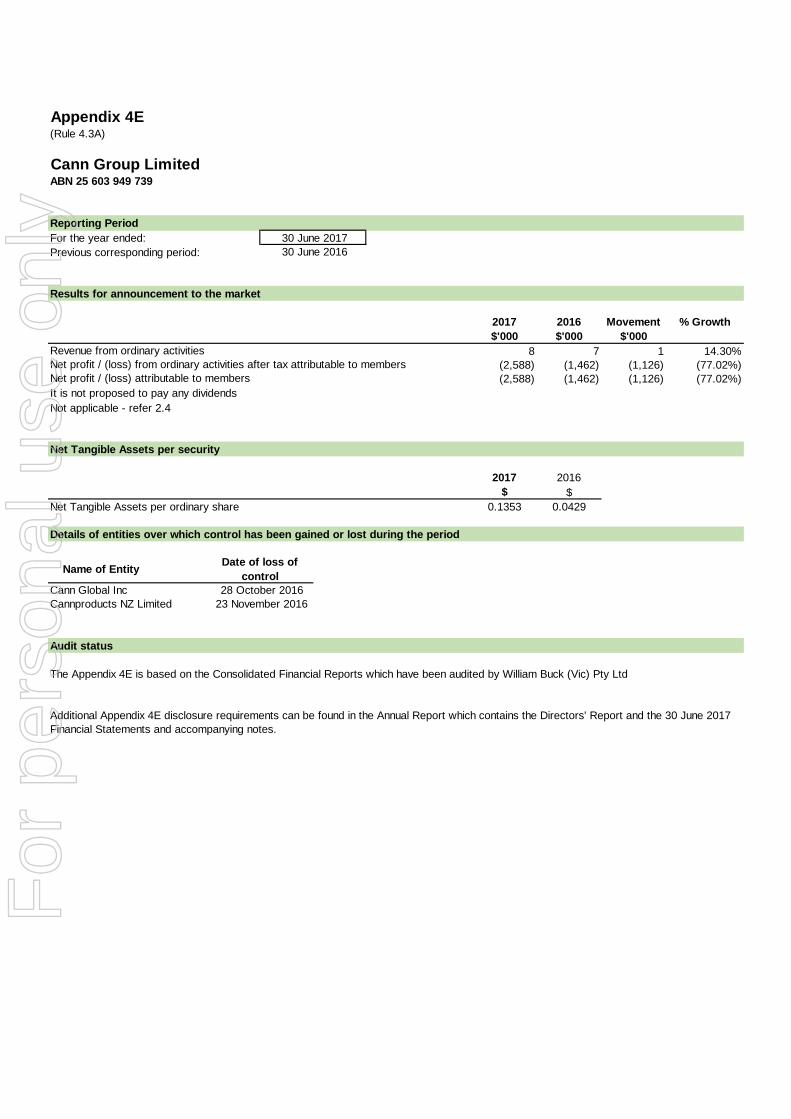
Appendix 4E(Rule 4.3A)
Cann Group LimitedABN 25 603 949 739
Reporting Period
For the year ended:
Previous corresponding period:
Results for announcement to the market
2017 2016 Movement % Growth
$'000 $'000 $'000
8 7 1 14.30%
(2,588) (1,462) (1,126) (77.02%)
(2,588) (1,462) (1,126) (77.02%)
Not applicable - refer 2.4
Net Tangible Assets per security
2017 2016
$ $
Net Tangible Assets per ordinary share 0.1353 0.0429
Details of entities over which control has been gained or lost during the period
Audit status
The Appendix 4E is based on the Consolidated Financial Reports which have been audited by William Buck (Vic) Pty Ltd
Additional Appendix 4E disclosure requirements can be found in the Annual Report which contains the Directors' Report and the 30 June 2017
Financial Statements and accompanying notes.
30 June 2017
It is not proposed to pay any dividends
Revenue from ordinary activities
Net profit / (loss) attributable to members
Net profit / (loss) from ordinary activities after tax attributable to members
30 June 2016
Name of EntityDate of loss of
control
28 October 2016Cann Global Inc
Cannproducts NZ Limited 23 November 2016
For
per
sona
l use
onl
y

CA
NN
GR
OU
P LIM
ITED
AN
NU
AL R
EP
OR
T
CANN GROUP LIMITED
AnnuAl RepoRt 2017
AND ITs CONTROLLED ENTITIEs
ABN 25 603 949 739
Note: to be read in conjunction with the Appendix 4E: Preliminary Final Report lodged with the Australian Securities Exchange on 29 August 2017
For
per
sona
l use
onl
y

B
CoRpoRAte DiReCtoRy
COMPANYCann Group LimitedACN 603 949 739Registered OfficeLevel 2, 409 St Kilda RoadMelbourne, Victoria, 3004
DIRECTORs Allan McCallumPhilip JacobsenDoug RathboneGeoff Pearce
sHARE REGIsTRY*Link Market Services LimitedTower 4,727 Collins Street,Melbourne, Victoria, 3008Ph: 1300 554 474
COMPANY sECRETARYRichard Baker
CEOPeter Crock
AUDITORsWilliam Buck Audit (VIC) Pty LtdLevel 20,181 William StreetMelbourne, Victoria, 3000Ph: 03 9824 8555
LAWYERsWilliam Ross Lawyers & AdvisersLevel 27, 101 Collins StreetMelbourne, Victoria, 3000Ph: 03 9653 9400
Corporate Information These are the full financial statements of Cann Group Ltd (the Company) and its 100% owned subsidiaries, including Cannproducts Pty Ltd (incorporated and domiciled in Victoria, Australia), Cannoperations Pty Ltd (incorporated and domiciled in Victoria, Australia), Cann IP Pty Ltd (incorporated and domiciled in Victoria, Australia) and Botanitech Pty Ltd (incorporated and domiciled in Victoria, Australia), (together, the Group). These financial statements are for the year ended 30 June 2017. Unless otherwise stated, all amounts are presented in $AUD.
A description of the Group’s operations and of its principal activities is included in the review of operations and activities in the attaching directors’ report.
For
per
sona
l use
onl
y

Contents
iFC Corporate Directory2 Message From Chairman
and Chief executive officer4 Directors’ Report20 Annual Financial Statements21 Consolidated Statement of profit or loss
and other Comprehensive income22 Consolidated Statement of Financial position23 Consolidated Statement of Changes in equity24 Consolidated Statement of Cash Flows25 notes to the financial statements41 Directors’ Declaration42 independent Auditor’s Report47 Shareholder information
For
per
sona
l use
onl
y

2
MeSSAge FRoM ChAiRMAn AnD ChieF exeCutive oFFiCeR
On behalf of our board, we present the 2017 Annual Report for Cann Group Limited, reflecting on a year in which our Company has achieved many important milestones in its development and is continuing to show substantial growth as a market leader.
Cann listed on the Australian Securities Exchange (ASX) in May 2017 following completion of a fully underwritten Initial Public Offer (IPO). The Company issued 45,000,000 new shares at 30 cents per share to raise $13.5 million before costs. The support and enthusiasm of investors ahead of our listing on the ASX was quite gratifying, and we are pleased to have seen significant growth in our share price since we started trading.
Medicinal cannabis has the potential to revolutionize the way a range of medical conditions are treated and change the lives of possibly hundreds of thousands of Australians, and Cann wants to be the leader in the field. We are focused on breeding, cultivating and manufacturing medicinal cannabis for sale and use within Australia. We see a market opportunity for medicinal cannabis driven by demand from patients with various conditions, and expect the industry will see initial demand for about 8,000kg of highly-refined, pharmaceutical cannabis products that could provide more than A$100m potential revenue in year one – growing to A$380m in 2018 and A$1.3bn in 2026.
The Narcotic Drugs Amendment Bill passed by Australia’s Federal Parliament in February 2016 was an integral step to Cann, as it allowed cannabis cultivation for medicinal and related scientific purposes.
Cann was the first Company to secure both the necessary licences (research & cultivation) and permits (one medicinal cannabis permit and two cannabis research permits) from the Office of Drug Control (ODC). The permits have allowed for the establishment of breeding plants for propagation purposes; a research program being undertaken with CSIRO to develop unique cannabis extracts; and the supply of plant material for manufacturing into medicinal cannabis products for patient use.
In late May, the Company received its first plant material to start cultivation of medicinal cannabis. The first plants cultivated at our Southern facility in Melbourne were harvested in August after an eight week flowering cycle. The harvested material was cured and dried in preparation for delivery under Cann’s medicinal cannabis licence and permits. The plants have been cultivated under a confidential commercial agreement. Cannabis grown by Cann will be manufactured into a product that can be accessed by patients via clinical trials, or through the TGA’s Authorised Prescriber or Special Access Scheme.
We have continued preparations for expanded growing capabilities, with our Northern facility, also in Melbourne to more than quadruple our initial cultivation and production capacity. The Company is in the process of extending its licences and permits for the new facility so it is ready for use in the first half of FY2018. The Company is also adding capacity at its Southern facility with the construction of three new secure cultivation rooms, a drying room, and
secure storage room, all of which will be commissioned by the end of 2017. This expansion is part of a three-phase growth strategy to build our cultivation capability, and we have adequate funds to complete these first two phases through to commissioning of the Northern facility.
We see medicinal cannabis as a high-value agribusiness opportunity after conducting extensive research on the product and market in the lead-up to our listing on the ASX. Our internal research will be further supported by a Technical Services Agreement (TSA) with Aurora Cannabis Inc, Canada’s second largest publicly listed medicinal cannabis producer and the first Canadian company to establish purpose built cultivation facilities. The TSA with Aurora, a 19.9% shareholder of Cann, will facilitate an exchange of information and support across areas including the cultivation and processing of medicinal cannabis (particularly the Aurora Sky Project); extraction and manufacturing technology; and analysis of cannabis extracts. Canada has a well-established medicinal cannabis industry, and Aurora is one of its leaders, so this partnership will be very beneficial to Cann in an industry which is still finding its feet in Australia.
This relationship with Aurora demonstrates the skills of Cann’s highly motivated and experienced board and management team, which has developed a strategy to build the capabilities and collaborative relationships necessary to capitalise on the opportunities emerging in the industry.
We thank our board members for their leadership, and our management team and staff for their efforts in fulfilling the ASX listing requirements and the achievements made in the months since then. We also thank our shareholders for their support and belief that Cann Group can be a leader in its market, a position we are determined to maintain.
The year ahead will be an exciting one for our Company, as we have already arranged delivery our first plant material after harvesting it from our Southern facility for analytical testing. In the next year, we expect to:
• Commission the Northern facility by the end of 2017
• Deliver first revenues with provision of product for clinical trials in Victoria
• Target and secure research grants with various non-government organisations and/or industry bodies
• Develop our portfolio of intellectual property
We are ramping-up rapidly and Cann will keep our shareholders informed of our progress as we lead the way in Australia’s emerging medicinal cannabis sector.
Allan McCallum Peter Crock Chairman Chief Executive Officer
Cann Group Limited annuaL report 2017
For
per
sona
l use
onl
y

Developing A woRlD-ClASS, AuStRAliA-FoCuSeD MeDiCinAl CAnnAbiS opeRAtion
3
For
per
sona
l use
onl
y

DiReCtoRS’ RepoRt
4
For
per
sona
l use
onl
y

5Cann Group Limited annuaL report 2017
DiReCtoRS’ RepoRt
Your directors present their report on the Group for the year ended 30 June 2017.
Information on Directors The names and details of the directors in office during the year and until the date of this report are as follows. Directors have been in office for this entire year unless otherwise stated.
Allan McCallum, Dip. Ag Science, FAICD (Non-executive Chairman)Allan has broad experience as a public company director in agribusiness and healthcare who has strong ethics, proven leadership capabilities and extensive experience in strategy development and implementation and mergers and acquisitions. Allan is the current Chair of Tassal Group Ltd (ASX TGR –) from 7 October 2003 Australia’s largest producer of Atlantic salmon and a Director of Medical Developments International Ltd (ASX MVP) from 27 October 2003, a pharmaceutical and device manufacturer, marketing nationally and internationally. His previous board roles include Incitec Pivot Ltd (ASX IPL) from 30 January 1998 to 19 December 2013 and Graincorp Ltd (ASX GNR) from 26 February 1998 to 26 August 2005.
Special Responsibilities
Member – Audit and Risk Committee
Interest in Shares
5,480,000 Ordinary Shares
Philip Robert Nicholas Jacobsen, CPA (Deputy Chairman)An experienced public company director, he co-founded Premier Artists in 1975 and The Frontier Touring Company in 1979. He serves as a director of Liberation Music, Premier Artists, The Harbour Agency and Jacobsen Bloodstock. Former Chair of MCM Entertainment Group, Philip brings to the Board a 45 plus year history of applying solid fiscal accounting perspectives to an emerging business model in a constantly changing, high demand market place.
Special Responsibilities
Chairman – Audit and Risk Committee
Interest in Shares
3,773,334 Ordinary Shares
Douglas John Rathbone, AM, FATSE, FI ChemE, ARMIT B Comm, TTCAn experienced public company director, he is the former Managing Director and CEO of Nufarm Limited (ASX NUF) from 21 August 1987 to 4 February 2015 – an ASX 200 listed company and is a former Board member of the FERNZ Corporation and the CSIRO. He Chairman of the Rathbone Wine Group, Director of Cotton Seed Distributors, Leaf Resources Ltd (ASX LER) from 1 November 2016, Go Resources, Queenscliff Harbour Pty Ltd and AgBiTech. He is also an Honorary Life Governor of the Royal Children’s Hospital and a former Director of the Burnett Centre for Medical Research. Doug brings to the Board experienced management and corporate governance skills together with a passion to grow the business having successfully transformed Nufarm to become one of the world’s leading crop protection and seed companies with an extensive global footprint.
Special Responsibilities
Member – Audit and Risk Committee
Interest in Shares and Performance Rights
2,193,334 Ordinary Shares
For
per
sona
l use
onl
y

DiReCtoRS’ RepoRt
6
Geoffrey Ronald Pearce Geoff is a successful entrepreneur and businessman with more than 40 years’ experience in the personal care industry. He established and owned Scental Pacific Pty Ltd and grew the business to become Victoria’s largest manufacturer of personal care products before selling it to the Smorgon Family. He later built a contract manufacturing business, Beautiworx Australia Pty Ltd, which was also sold. Geoff currently owns The Continental Group, which supplies pharmaceutical packaging and raw materials and has developed alliances with some of the world’s leading herbal extract manufacturers. He has extensive experience in areas including manufacturing, procurement, distribution and regulatory affairs. He is Chairman of Probiotec Ltd (ASX PBP) since 28 November 2016.
Special Responsibilities
Member – Audit and Risk Committee
Interest in Shares
1,200,000 Ordinary Shares
Michael Kenneth Murchison, MAICD (resigned 28 October 2016)Michael is an experienced project manager, with direct experience and business interests in the US regulated cannabis industry. He holds certifications under Californian medicinal cannabis laws and is a long term advocate for the development of a regulated medicinal cannabis industry in Australia. Michael founded the first Cann Group company in early 2014 after a successful career in the music and entertainment promotions industry. Apart from his extensive knowledge of the international medicinal cannabis industry, Michael brings experience in logistics, international business and technology licensing.
Special Responsibilities
Member – Audit and Risk Committee
Interest in Shares
260,000 Ordinary Shares
Chief Executive OfficerPeter Crock – CEO, B.Ag.Sci (Hon); MBA Peter is an experienced public company senior manager with strong skills in marketing and technology development. In a 28-year career at Nufarm Limited (ASX NUF), Peter held senior management roles in marketing, business development, and information technology, most recently heading up the group’s new technologies division which involved the licensing and commercial development of several new agribusiness technologies. He has project managed the successful integration of newly acquired businesses and has extensive experience working with regulators in Australia and overseas.
Company secretary and Chief Financial OfficerRichard Baker, M.Commrcl Law, B.Ec., CPAA senior experienced Financial Controller and Company Secretary, with extensive ASX experience, in terms of governance, capital raisings and reporting including implementing internal controls, accounting and ERP systems in established and start-up enterprises. He has had public practice experience in business services, taxation and audit to a diverse range of clients involved in FMCG, manufacturing, professional services and transport and gained a variety of experience as Financial Controller with previous employers including mineral exploration, import and distribution, FMCG and professional consulting.
For
per
sona
l use
onl
y

DiReCtoRS’ RepoRt
7Cann Group Limited annuaL report 2017
DividendsNo dividends have been paid or have been recommended during the year.
Principal activitiesThe principal activities of the Group during the year consisted of developing and testing of Cann’s cannabis cultivation technology of controlled growing environments with a view to substantially increasing capacity of the growing environments for both research and cultivation purposes and to commercialise the outputs for medicinal uses.
No significant change in the nature of these activities occurred during the year.
Operating results for the yearThe Group made a loss of $2,588,445 for the year ended 30 June 2017.
The Group’s basic and diluted earnings per share is ($0.05) (2016:($0.053)). The Weighted Average number of Shares used to calculate the basic and diluted earnings per share is 52,328,805 (2016: 27,592,420).
The net assets of the Group are $14.66 million as at 30 June 2017 (2016: $1.69 million).
For further detail please refer to the Message from Chairman and Chief Executive Officer which forms part of this annual report.
significant changes in the state of affairsCapital raisingDuring the year the Company issued an Initial Public Offering (IPO) Prospectus dated 28 March 2017 (and Supplementary Prospectus dated 12 April 2017). The IPO was for an offer of 45,000,000 New Shares in the Company at 30 cents per New Share to raise a minimum of $13,500,000 before costs (Offer). The Offer was fully underwritten and closed on 26 April 2017.
Listing on Australian Securities Exchange (ASX)As a result of the successful IPO above the Company applied for and was granted admission to the Official List of the ASX on 4 May 2017.
There were no other significant changes in the state of affairs of the Group during the year.
Future developments, prospects and business strategiesOther than matters referred to elsewhere in this report and above, further information as to likely developments in the operations of the Group and the expected results of operations have not been included in this report because the directors believe it would be likely to result in unreasonable prejudice to the Group.
Environmental regulation and performanceThe Group’s operations are not subject to any particular environmental regulations.
For
per
sona
l use
onl
y

DiReCtoRS’ RepoRt
8
Directors’ meetingsThe number of meetings of the Company’s Board of Directors and Audit and Risk Committee members held during the year ended 30 June 2017 and the number of meetings attended by each Director / member were:
Board MeetingsAudit and Risk
Committee Meetings
Name
Number eligible to
attendNumber
attended
Number eligible to
attendNumber
attended
Allan McCallum 9 8 2 2
Philip Jacobsen 9 9 2 2
Douglas Rathbone 9 9 2 2
Geoff Pearce 9 8 2 2
Michael Murchison (resigned 28 October 2016) 3 3 1 1
OptionsDuring the year the Group issued 13,486,667 ordinary shares resulting from the exercise of 13,486,667 options over shares issued pursuant to the Information Memorandum dated 12 April 2016. The exercise price to exercise the options for the issue of ordinary shares was $0.15 each. The options were exercise throughout March 2017 and all options were exercised on or before 31 March 2017. Allotment of ordinary shares from the exercise of those options occurred on 21 March 2017 (6,646,667 shares), 27 March 2017 (3,800,000 shares and 4 April 2017 (3,040,000 shares).
The Group presently has on issue 2,000,000 options to purchase ordinary fully paid shares. The options were issued to the Underwriters of the Initial Public Offering Prospectus dated 28 March 2017 and the associated Supplementary Prospectus dated 12 April 2017.
The options are exercisable at $0.37 at any time during the period commencing from the date of their issue and expiring on 30 June 2019.
For
per
sona
l use
onl
y

DiReCtoRS’ RepoRt
9Cann Group Limited annuaL report 2017
Remuneration ReportIntroductionCann’s Remuneration Report for the year ended 30 June 2017 (financial year).
Since being admitted to the Official List of the ASX Cann has actively been recruiting a team to ensure the successful implementation of the Company’s business plan.
CEO remuneration outcomesMr Peter Crock was appointed as Chief Executive Officer commencing as an employee on 1 September 2016 on a salary of $200,000 plus Superannuation Guarantee. Prior to this date Mr Crock was paid $55,088 as a consultant to Cann. Mr Crock was also paid a bonus of $50,000 in May 2017 for development of strategic relationships and the business plan for inclusion in the IPO Prospectus which enabled the Company to successfully list on the Australian Securities Exchange (ASX). Listing on the ASX was the event required to trigger the bonus payment.
It is anticipated that Mr Crock will participate in both Short Term Incentive and Long Term Incentive schemes when they are formalised during the 2018 financial year. Any incentive schemes formulated by the Company will be performance based with determination of success by the Board.
Non-Executive Director remuneration outcomesThe Board resolved that there would be no remuneration of any form paid to Non-Executive Directors for their service as Directors until such time as Cann was admitted to the Official List of the ASX. Non-Executive Directors Fees are set on an annual basis within the limit set by Shareholders at the General Meeting of 19 October 2016. Non-executive Directors Fees were paid for the two months of May and June 2017.
In line with ASX Corporate Governance Principles and Recommendations, Cann has continued Board review activities, including ensuring the Board contains an appropriate mix of skills and experience as well as assessing the independence of each Non-Executive Director.
Remuneration ReportThe Directors of Cann Group Limited (Cann or the Company) are pleased to present the Remuneration Report (Report) for the Company and its subsidiaries (Group) for the financial year ended 30 June 2017. This Report has been prepared and audited in accordance with the requirements of the Corporations Act 2011.
For the purpose of this Report Key Management Personnel (KMP) are defined as persons having authority and responsibility for planning, directing and controlling major activities of the Group and include all Non-Executive Directors of the Company and Executives who are listed in the table below.
Non-Executive Directors
Mr Allan McCallum Chairman
Mr Philip Jacobsen Deputy Chairman
Mr Geoff Pearce Non-Executive Director
Mr Doug Rathbone Non-Executive Director
Mr Michael Murchison Non-Executive Director (resigned 28 October 2016)
Executives
Mr Peter Crock Chief Executive Officer
The above Non-Executive Directors and Executives were the KMP for the whole of the financial year, unless otherwise indicated.
For
per
sona
l use
onl
y

DiReCtoRS’ RepoRt
10
Remuneration GovernanceThe Board is responsible for determining Non-Executive Director and Senior Executive remuneration. The Company has not appointed a Remuneration Committee, rather the Board conducts the activities of the Remuneration Committee.
In accordance with section 206K of the Corporations Act 2001, the Board has a process for engaging remuneration consultants. The Board commissions and receives information, advice and recommendations directly from remunerations consultants, ensuring remuneration recommendations are free of undue influence by management.
No consultants were engaged with respect to providing remuneration recommendations for the Non-Executive Directors and Executives during the Financial Year.
Executive RemunerationExecutive remuneration is based on total reward structure comprising fixed remuneration and at-risk remuneration. For the year ended 30 June 2017 at-risk remuneration was made up of Short Term Incentives (STI’s) only and was designed to align Executive remuneration with achievement of strategic and financial objectives that lead to the creation of shareholder value. Long Term Incentives (LTI’s) will be developed during the 2018 financial year and will be designed to align Executive remuneration with achievement of strategic and financial objectives that lead to the creation of shareholder value.
The reward structure has the strategic objectives of:
• Attracting, retaining and motivating suitably qualified and experienced executives;
• Encouraging a strong focus on performance; and
• Supporting the delivery of outstanding results for the Group over the short and (future) long term.
Fixed RemunerationThe fixed remuneration component of an Executive’s total remuneration package is expressed as a total package consisting of base salary and statutory superannuation contributions.
Fixed remuneration reflects the complexity of the individual’s role and their experience, knowledge and performance. Internal and external benchmarking is regularly undertaken and fixed remuneration levels are set with regard to the external market median, with scope for incremental increase for superior performance.
Fixed remuneration is reviewed annually on the anniversary dates of the individual’s commencement date, taking into account the performance of the individual and the Group. There are no guaranteed increases to fixed remuneration in any contracts of employment.
Short Term IncentiveThe STI component of an Executive’s total remuneration is an annual cash incentive plan. The STI links a portion of Executive remuneration opportunity to specific financial and non-financial measures.
The performance measures are described in the table above. From a governance perspective, all performance measures under the STI must be clearly defined and measurable. The Board approves the targets and assesses the performance outcome of the CEO. The CEO sets the targets and assesses the performance of other Executives. The Board approves STI payments for the CEO and other Executives. Under the STI plan, the Board has discretion to adjust STI outcomes based on the achievements which are consistent with the Group’s strategic priorities and, in the opinion of the Board, enhance shareholder value.
One hundred percent (100%) of awarded STI is paid in cash at a time determined by the Board, however for future years the timing will be upon Board approval of the audited year-end accounts. In future years the financial performance measures will be implemented and then for the Executive’s to qualify for a payment of an STI a pre-agreed level of Group profit must first be achieved. Once this has been achieved, the level of payment the Executive receives is determined based on the achievement of their pre-determined financial and non-financial measures.
For
per
sona
l use
onl
y

DiReCtoRS’ RepoRt
11Cann Group Limited annuaL report 2017
Long Term IncentiveThe LTI component of an Executive’s total remuneration is yet to be determined however it will be an equity incentive plan that is designed to encourage Executives to focus on key performance drivers which underpin sustainable growth in shareholder value. The LTI will facilitate share ownership by Executive’s and links a significant proportion of their at-risk remuneration to the Group’s ongoing share price and returns to shareholders over the performance period. This will be achieved by motivating and rewarding the Executives to drive share price growth via improvements to Total Shareholder Returns and Return on Invested Capital.
Other Remuneration DisclosuresNon-Executive Director Remuneration
Non-Executive Directors are paid Directors Fees that are treated as salaries with tax withheld and superannuation guarantee paid at statutory amounts. Non-Executive Director Remuneration is not performance based and as such no Non-Executive Director has received performance based remuneration during the year. At the General Meeting of 19 October 2016 Non-Executive Director remuneration was fixed at a total annual aggregate of $175,000 inclusive of superannuation guarantee. At a Board Meeting held 30 November 2016 it was resolved that Non-Executive Chairman remuneration would be $30,000 per annum and Non-Executive Director remuneration would be $20,000 per annuum, both exclusive of superannuation guarantee and that Non-Executive Directors would only be paid remuneration after the Company was admitted to the Official List of the Australian Securities Exchange.
Service Agreements
The employment conditions and remuneration of the Executives are formalised in individual contracts of employment. No fixed terms are specified within these employment contracts and the following termination provisions apply:
Executive Notice Period by Company Notice Period by Employee
Mr P Crock 4 months 4 months
The Company may terminate an employment contract without cause by providing written notice or making a payment in lieu of the notice period based on the individual’s fixed annual remuneration. Each employment contract provides for termination of employment without notice in circumstances sufficient to warrant summary termination.
Transactions with Directors
Mr Michael Murchison and his Director-related entities purchased two subsidiary companies from Cann Group Limited, being Cann Global LLC and Cannproducts NZ Limited. Cannproducts NZ Limited was registered but never operated within the Group. Both subsidiaries were sold to Mr Murchison and his related entities for $1 each which the Directors believe to be on commercial terms.
Other transactions entered into by the Group with Directors and their Director-related entities are within normal employee, customer or supplier relationships on terms and conditions no more favourable than those available in similar arm’s length dealings.
Performance Evaluations of Board and Senior Executives
During the year the Board conducted reviews of the Board itself, its Committees and of Senior Executives which included feedback on performance and training arranged where deemed appropriate.
For
per
sona
l use
onl
y

DiReCtoRS’ RepoRt
12
Table 1: Remuneration Disclosure for Key Management Personnel of the Group for years ended 30 June 2017 and 30 June 2016
Short-term Benefits
Post-employment
Benefits
Salary and Fees
$
STI cash bonus
$
Super- annuation
$
Other KMP related
payments** $
Share-based remun-
eration*** $
Total $
Perfor- mance related
%
2017 Financial Year
Non-Executive Directors
Mr Allan McCallum 5,000 – 475 – 11,686 17,161 –
Mr Philip Jacobsen 3,650 – – – 5,843 9,493 –
Mr Douglas Rathbone 3,333 – 317 – 6,778 10,428 –
Mr Michael Murchison (resigned 28 October 2016) 103,210 – – – 3,038 106,248 –
Mr Geoff Pearce 3,333 – 317 – 4,207 7,857 –
Subtotal for Non-Executive Directors 118,526 – 1,109 – 31,552 151,187 –
Executives
Mr Peter Crock 194,224 50,000 15,712 – 2,921 262,857 19.0%
Subtotal for Executives 194,224 50,000 15,712 – 2,921 252,857 19.0%
Total 2017 Financial Year 312,750 50,000 16,821 – 34,473 414,044 12.1%
2016 Financial Year
Non-Executive Directors
Mr Allan McCallum 8,000 – 760 2,086 11,986 22,832 –
Mr Philip Jacobsen 8,000 – 760 4,108 5,993 18,861 –
Mr Alberto Mariani (resigned 11 April 2016) 8,000 – 760 – 4,315 13,075 –
Mr Michael Murchison 120,000 – 24,785 – 51,062 195,847 –
Mr Geoff Pearce (appointed 11 April 2016) – – – – – – –
Mr Douglas Rathbone 8,000 – 760 – 959 9,719 –
Subtotal for Non-Executive Directors 152,000 – 27,825 6,194 74,315 260,334 –
Executives
Mr Peter Crock 39,069 – – – – 39,069 –
Subtotal for Executives 39,069 – – – – 39,069 –
Total 2016 Financial Year 191,069 – 27,825 6,194 74,315 299,403 –
Notes:
* Mr Crock FY2017 Salary and Allowances includes a bonus paid of $50,000 and Mr Murchison FY2016 Salary and Allowances includes a living away from home allowance of $34,124.
** Interest and Guarantee Fees paid to Mr McCallum and Mr Jacobsen in respect to loans to the Company provided by Mr McCallum and Mr Jacobsen.
*** Vesting charge reflecting change in value of Class B Performance Rights granted or otherwise acquired by KMP. Class A Performance Rights were cancelled effective 1 March 2017 and therefore no vesting charge is included. The Class A Performance Rights were share-based payments when granted and were cancelled with the consent of all of the holders of those Rights.
For
per
sona
l use
onl
y

DiReCtoRS’ RepoRt
13Cann Group Limited annuaL report 2017
Table 2: Shares held by Key Management Personnel of the Group for years ended 30 June 2017 and 30 June 2016
The movement during the reporting period in the number of shares in Cann Group Limited held, directly, indirectly or beneficially, by each key management person, including their related parties, is as follows:
2017
NameBalance
1 July 2016Net Change
Other*
Issued on conversion of Performance
Rights
Issued on exercise of Options
Balance 30 June 2017
Non-Executive Directors
Mr Allan McCallum 3,840,000 – 1,000,000 640,000 5,480,000
Mr Philip Jacobsen 2,300,000 173,334 500,000 800,000 3,773,334
Mr Douglas Rathbone 1,120,000 173,334 580,000 320,000 2,193,334
Mr Geo ff Pearce 520,000 – 360,000 320,000 1,200,000
Mr Michael Murchison 13,600,000 (13,600,000) 260,000 – 260,000
Subtotal for Non-Executive Directors 21,380,000 (13,253,332) 2,700,000 2,080,000 12,906,668
Executives
Mr Peter Crock – 86,667 250,000 – 336,667
Subtotal for Executives – 86,667 250,000 – 336,667
Total 21,380,000 (13,166,665) 2,950,000 2,080,000 13,243,335
2016
NameBalance
1 July 2015Net Change
Other*
Issued on conversion of Performance
RightsNet Change
Share Split**Balance
30 June 2016
Non-Executive Directors
Mr Allan McCallum 800,000 160,000 – 2,880,000 3,840,000
Mr Philip Jacobsen 375,000 200,000 – 1,725,000 2,300,000
Mr Douglas Rathbone 50,000 180,000 – 890,000 1,120,000
Mr Geoff Pearce 50,000 80,000 – 390,000 520,000
Mr Michael Murchison 3,400,000 – – 10,200,000 13,600,000
Subtotal for Non-Executive Directors 4,675,000 670,000 – 16,085,000 21,380,000
Executives
Mr Peter Crock – – – – –
Subtotal for Executives – – – – –
Total 4,675,000 670,000 – 16,085,000 21,380,000
Notes:
* Net Change Other refers to shares purchased or sold or otherwise transferred during the year.
** Net Change Share-split refers to the share-split on the basis that every share be divided into four fully paid ordinary shares with effect from 5:00pm (Melbourne time) on 30 June 2016 approved at the Annual General Meeting held that day.
For
per
sona
l use
onl
y

DiReCtoRS’ RepoRt
14
Table 3: Options held by Key Management Personnel of the Group for years ended 30 June 2017 and 30 June 2016
NameBalance
1 July 2016Net Change
Other* ExercisedBalance
30 June 2017
Non-Executive Directors
Mr Allan McCallum 640,000 – (640,000) –
Mr Philip Jacobsen 800,000 – (800,000) –
Mr Douglas Rathbone 320,000 – (320,000) –
Mr Geoff Pearce 320,000 – (320,000) –
Total 2,080,000 – (2,080,000) –
NameBalance
1 July 2015Net Change
Other*Net Change
Share Split**Balance
30 June 2016
Non-Executive Directors
Mr Allan McCallum – 160,000 480,000 640,000
Mr Philip Jacobsen – 200,000 600,000 800,000
Mr Douglas Rathbone – 80,000 240,000 320,000
Mr Geoff Pearce – 80,000 240,000 320,000
Total – 520,000 1,560,000 2,080,000
Notes:
* Net Change Other refers to Options purchased or sold or otherwise transferred during the year.
** Net Change Share-split refers to the share-split on the basis that every share be divided into four fully paid ordinary shares with effect from 5:00pm (Melbourne time) on 30 June 2016 approved at the Annual General Meeting held that day, applied in the same basis to all securities on issue including options and performance rights.
For
per
sona
l use
onl
y

DiReCtoRS’ RepoRt
15Cann Group Limited annuaL report 2017
Table 4: Performance Rights Class A held by Key Management Personnel of the Group for years ended 30 June 2017 and 30 June 2016
NameBalance
1 July 2016Net Change
Other* Cancelled***Balance
30 June 2017
Non-Executive Directors
Mr Allan McCallum 2,000,000 – (2,000,000) –
Mr Philip Jacobsen 1,000,000 – (1,000,000) –
Mr Douglas Rathbone 80,000 – (80,000) –
Mr Michael Murchison 6,480,000 – (6,480,000) –
Total 9,560,000 – (9,560,000) –
NameBalance
1 July 2015Net Change
Other*Net Change
Share Split**Balance
30 June 2016
Non-Executive Directors
Mr Allan McCallum 500,000 – 1,500,000 2,000,000
Mr Philip Jacobsen 250,000 – 750,000 1,000,000
Mr Douglas Rathbone 20,000 – 60,000 80,000
Mr Michael Murchison 1,487,000 133,000 4,860,000 6,480,000
Total 2,257,000 133,000 7,170,000 9,560,000
Notes:
* Net Change Other refers to Performance Rights Class A purchased or sold or otherwise transferred during the year.
** Net Change Share-split refers to the share-split on the basis that every share be divided into four fully paid ordinary shares with effect from 5:00pm (Melbourne time) on 30 June 2016 approved at the Annual General Meeting held that day, applied in the same basis to all securities on issue including options and performance rights.
*** Cancelled refers to Class A Performance Rights were cancelled effective 1 March 2017.
For
per
sona
l use
onl
y

DiReCtoRS’ RepoRt
16
Table 5: Performance Rights Class B held by Key Management Personnel of the Group for years ended 30 June 2017 and 30 June 2016
NameBalance
1 July 2016Net Change
Other*
Converted to Ordinary
SharesBalance
30 June 2017
Non-Executive Directors
Mr Allan McCallum 1,000,000 – (1,000,000) –
Mr Philip Jacobsen 500,000 – (500,000) –
Mr Douglas Rathbone 80,000 500,000 (580,000) –
Mr Geoff Pearce – 360,000 (360,000) –
Mr Michael Murchison 4,260,000 (4,000,000) (260,000) –
Subtotal for Non-Executive Directors 5,840,000 (3,140,000) (2,700,000) –
Executives
Mr Peter Crock – 250,000 (250,000) –
Subtotal for Executives – 250,000 (250,000) –
Total 5,840,000 (2,890,000) (2,950,000) –
NameBalance
1 July 2015Net Change
Other*Net Change
Share Split**Balance
30 June 2016
Non-Executive Directors
Mr Allan McCallum 250,000 – 750,000 1,000,000
Mr Philip Jacobsen 125,000 – 375,000 500,000
Mr Douglas Rathbone 20,000 – 60,000 80,000
Mr Michael Murchison 932,500 132,500 3,195,000 4,260,000
Total 1,327,500 132,500 4,380,000 5,840,000
Notes:
* Net Change Other refers to Performance Rights Class B purchased or sold or otherwise transferred during the year.
** Net Change Share-split refers to the share-split on the basis that every share be divided into four fully paid ordinary shares with effect from 5:00pm (Melbourne time) on 30 June 2016 approved at the Annual General Meeting held that day, applied in the same basis to all securities on issue including options and performance rights.
This concludes the Remuneration Report, which has been audited.
For
per
sona
l use
onl
y

DiReCtoRS’ RepoRt
17Cann Group Limited annuaL report 2017
Indemnifying Officers or AuditorNo indemnities have been given however a Directors and Officers insurance premium totalling $23,977 has been paid, during or since the end of the year, for any person who is or has been an officer of the Group. No indemnities have been given during or since the end of the year for any person who has been an auditor of the Group.
Proceedings on behalf of the GroupNo person has applied for leave of court to bring proceedings on behalf of the Group or intervene in any proceedings to which the Group is a party for the purpose of taking responsibility on behalf of the Group for all or any part of those proceedings.
There were no proceedings during the year.
Events after the end of the reporting periodThere were no other matters or circumstances have arisen since the end of the year which significantly affected or may significantly affect the operation of the Group, the results of those operations, or the state of affairs of the Group in future financial years.
Non-Audit servicesThe Company’s Audit and Risk Committee (“the Committee”) is responsible for the maintenance of audit independence.
Specifically, the Committee Charter ensures the independence of the auditor is maintained by:
• Limiting the scope and nature of non-audit services that may be provided; and
• Requiring that permitted non-audit services must be pre-approved by the Chairman of the Committee.
During the year William Buck, the Group’s auditor, has performed certain other services in addition to the audit and review of the financial statements. The Board has considered the non-audit services provided during the year by the auditor and in accordance with the advice provided by the Committee, is satisfied that the provision of those non-audit services during the year by the auditor is compatible with, and did not compromise, the auditor independence requirements of the Corporations Act 2001 for the following reasons:
• All non-audit services were subject to the corporate governance procedures adopted by the Group and have been reviewed by the Committee to ensure they do not impact the integrity and objectivity of the auditor; and
• The non-audit services provided do not undermine the general principles relating to auditor independence as set out in APES 110 Code of Ethics for Professional Accountants as they did not involve reviewing or auditing the auditors own work, acting in a management or decision making capacity for the Group, acting as an advocate for the Group or jointly sharing risks and rewards.
Details of the amounts paid to the auditor of the Group. William Buck, for audit and non-audit services provided during the year are set out in Note 5.
For
per
sona
l use
onl
y

DiReCtoRS’ RepoRt
18
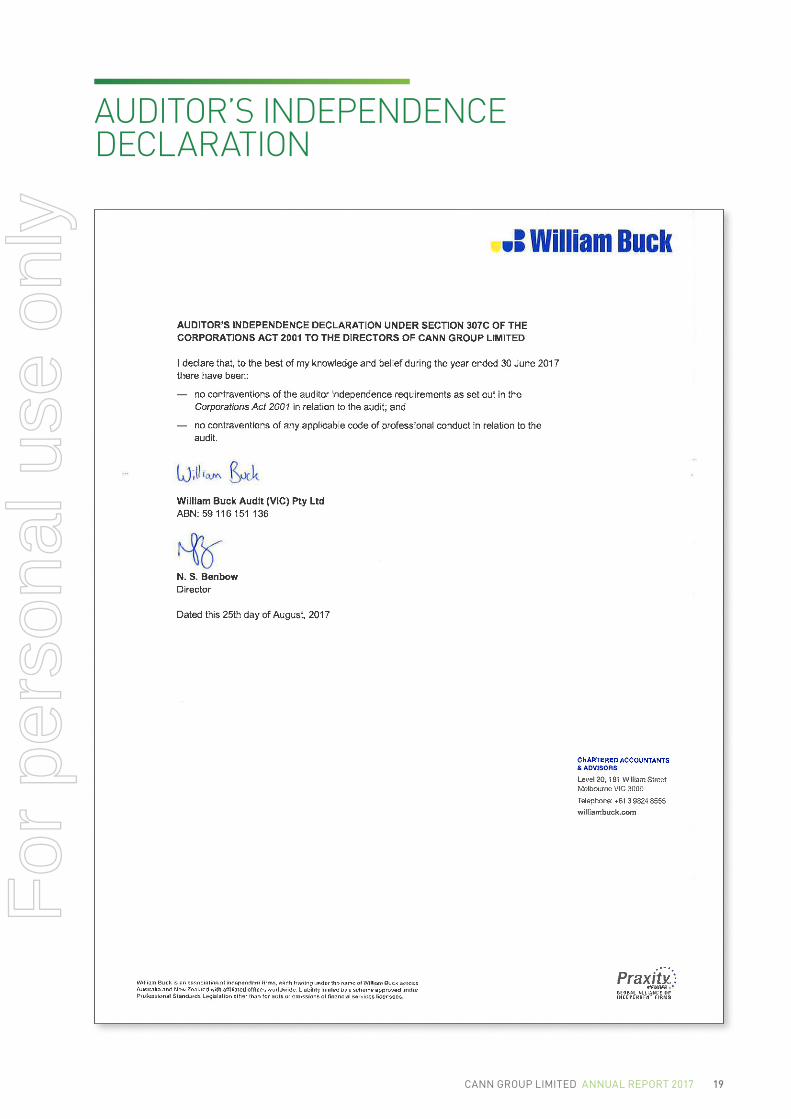
Auditor’s independence declarationA copy of the auditor’s independence declaration as required under section 307C of the Corporations Act 2001 is set out on page 19.
CEO and CFO declarationThe CEO and CFO have given a declaration to the Board concerning the Group’s financial statements under section 295A(2) of the Corporations Act 2001 and recommendations 4.2 and 7.2 of the ASX Corporate Governance Council Principles of Good Corporate Governance and Best Practice Recommendations in regards to the integrity of the financial statements.
Corporate Governance statementIn accordance with Listing Rule 4.10.3 and the Appendix 4G lodged by the Company, the Company’s 2017 Corporate Governance Statement can be found on its website https://www.canngrouplimited.com
Signed in accordance with a resolution of the Board of Directors:
Allan McCallum Chairman Date: 25 August 2017
For
per
sona
l use
onl
y
19Cann Group Limited annuaL report 2017
AuDitoR’S inDepenDenCe DeClARAtion
For
per
sona
l use
onl
y
20
AnnuAl FinAnCiAl StAteMentS
For
per
sona
l use
onl
y

21Cann Group Limited annuaL report 2017
ConSoliDAteD StAteMent oF pRoFit oR loSS AnD otheR CoMpRehenSive inCoMeFoR the yeAR enDeD 30 June 2017
Note2017
$2016
$
Other income 8,421 6,662
Administration and corporate costs 3 (1,642,100) (1,104,217)
Research and development costs 3 (547,782) (348,923)
Loss before transaction costs, finance costs and income tax expense (2,181,461) (1,446,478)
Transaction costs of the IPO (406,435) –
Finance costs (549) (15,533)
Loss before income tax expense (2,588,445) (1,462,011)
Income tax expense – –
Loss attributable to members of the Group (2,588,445) (1,462,011)
Other comprehensive income – –
Total comprehensive loss attributable to members of the Group (2,588,445) (1,462,011)
Basic and Diluted Earnings Per Share (EPS) (0.05) (0.053)
Weighted Average number of Shares used to calculate EPS* 52,328,805 27,592,420
* The potentially dilutive effects of any contingently issuable ordinary shares have not been considered in the diluted loss per share calculation, because the Group is in a loss-making position and such an effect would be anti-dilutive.
The accompanying notes form part of these statements.
For
per
sona
l use
onl
y

22
ConSoliDAteD StAteMent oF FinAnCiAl poSitionAS At 30 June 2017
Note2017
$2016
$
ASSETS
CURRENT AssETs
Cash and cash equivalents 11,113,964 1,344,055
Prepayments 133,453 5,519
Stock on hand 24,927 –
TOTAL CURRENT ASSETS 11,272,344 1,349,574
NON-CURRENT AssETs
Plant and equipment 6 716,672 486,758
Investments in term deposits 3,000,000 –
Rental bonds 85,000 35,000
TOTAL NON-CURRENT ASSETS 3,801,672 521,758
TOTAL ASSETS 15,074,016 1,871,332
LIABILITIES
CURRENT LIABILITIEs
Unsecured trade and other payables 389,103 181,849
Lease liability 4,198 –
TOTAL CURRENT LIABILITIES 393,301 181,849
NON-CURRENT LIABILITIEs
Lease liability 20,567 –
TOTAL NON-CURENT LIABILITIES 20,567 –
TOTAL LIABILITIES 413,868 181,849
NET ASSETS 14,660,148 1,689,483
EQUITY
Issued capital 8 20,187,092 4,376,271
Performance rights reserve 10 – 515,409
Accumulated losses (5,526,944) (3,202,197)
TOTAL EQUITY 14,660,148 1,689,483
The accompanying notes form part of these statements.
For
per
sona
l use
onl
y
23Cann Group Limited annuaL report 2017
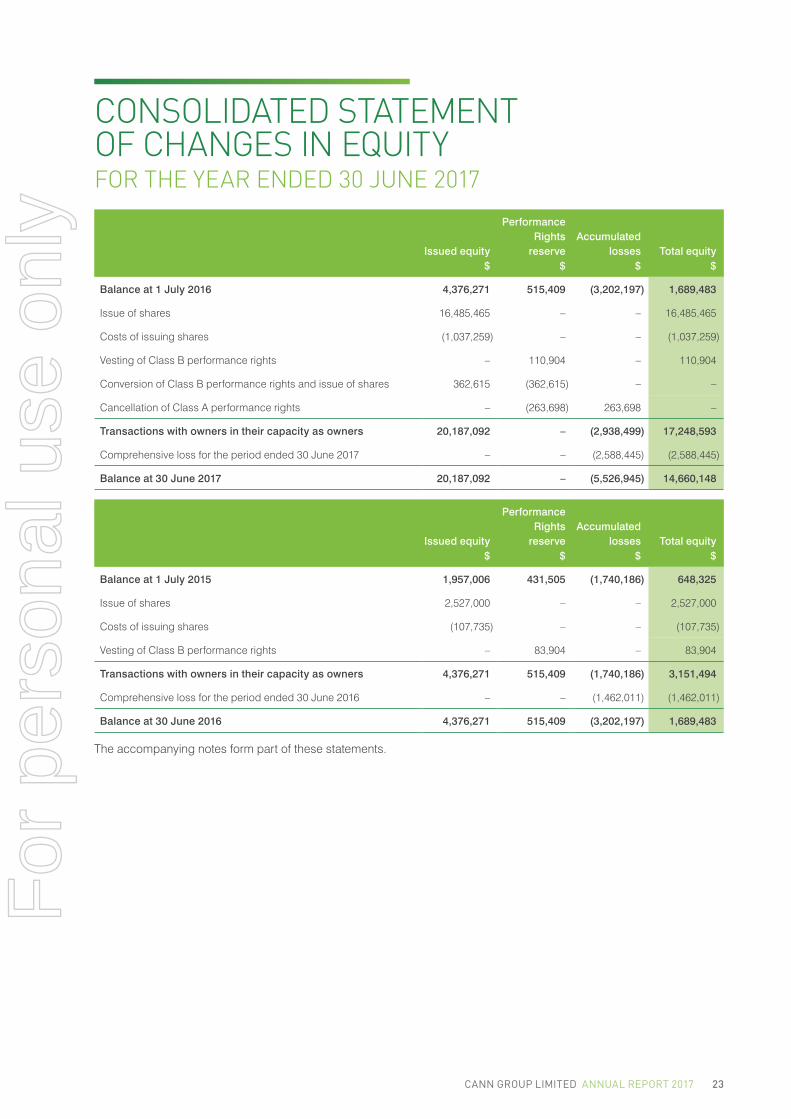
ConSoliDAteD StAteMent oF ChAngeS in equityFoR the yeAR enDeD 30 June 2017
Issued equity $
Performance Rights
reserve $
Accumulated losses
$Total equity
$
Balance at 1 July 2016 4,376,271 515,409 (3,202,197) 1,689,483
Issue of shares 16,485,465 – – 16,485,465
Costs of issuing shares (1,037,259) – – (1,037,259)
Vesting of Class B performance rights – 110,904 – 110,904
Conversion of Class B performance rights and issue of shares 362,615 (362,615) – –
Cancellation of Class A performance rights – (263,698) 263,698 –
Transactions with owners in their capacity as owners 20,187,092 – (2,938,499) 17,248,593
Comprehensive loss for the period ended 30 June 2017 – – (2,588,445) (2,588,445)
Balance at 30 June 2017 20,187,092 – (5,526,945) 14,660,148
Issued equity $
Performance Rights
reserve $
Accumulated losses
$Total equity
$
Balance at 1 July 2015 1,957,006 431,505 (1,740,186) 648,325
Issue of shares 2,527,000 – – 2,527,000
Costs of issuing shares (107,735) – – (107,735)
Vesting of Class B performance rights – 83,904 – 83,904
Transactions with owners in their capacity as owners 4,376,271 515,409 (1,740,186) 3,151,494
Comprehensive loss for the period ended 30 June 2016 – – (1,462,011) (1,462,011)
Balance at 30 June 2016 4,376,271 515,409 (3,202,197) 1,689,483
The accompanying notes form part of these statements.
For
per
sona
l use
onl
y
24
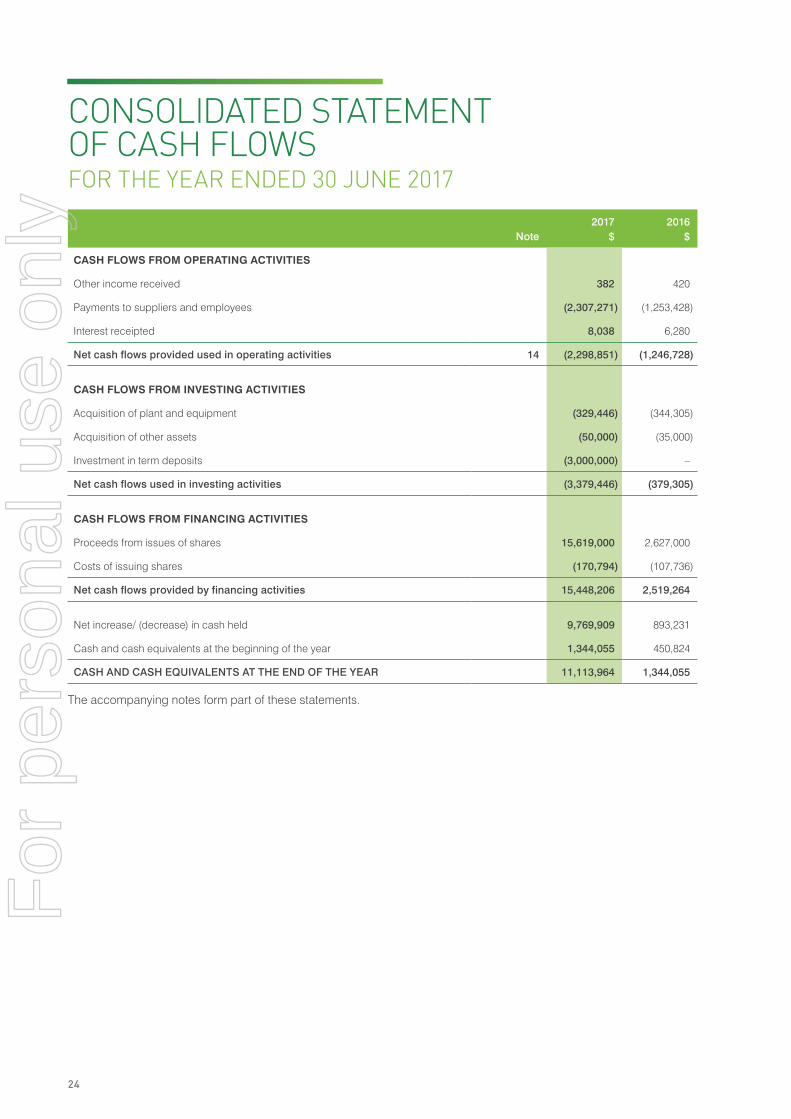
ConSoliDAteD StAteMent oF CASh FlowSFoR the yeAR enDeD 30 June 2017
Note2017
$2016
$
CAsH FLOWs FROM OPERATING ACTIVITIEs
Other income received 382 420
Payments to suppliers and employees (2,307,271) (1,253,428)
Interest receipted 8,038 6,280
Net cash flows provided used in operating activities 14 (2,298,851) (1,246,728)
CAsH FLOWs FROM INVEsTING ACTIVITIEs
Acquisition of plant and equipment (329,446) (344,305)
Acquisition of other assets (50,000) (35,000)
Investment in term deposits (3,000,000) –
Net cash flows used in investing activities (3,379,446) (379,305)
CAsH FLOWs FROM FINANCING ACTIVITIEs
Proceeds from issues of shares 15,619,000 2,627,000
Costs of issuing shares (170,794) (107,736)
Net cash flows provided by financing activities 15,448,206 2,519,264
Net increase/ (decrease) in cash held 9,769,909 893,231
Cash and cash equivalents at the beginning of the year 1,344,055 450,824
CASH AND CASH EQUIVALENTS AT THE END OF THE YEAR 11,113,964 1,344,055
The accompanying notes form part of these statements.
For
per
sona
l use
onl
y
25Cann Group Limited annuaL report 2017
noteS to the FinAnCiAl StAteMentS
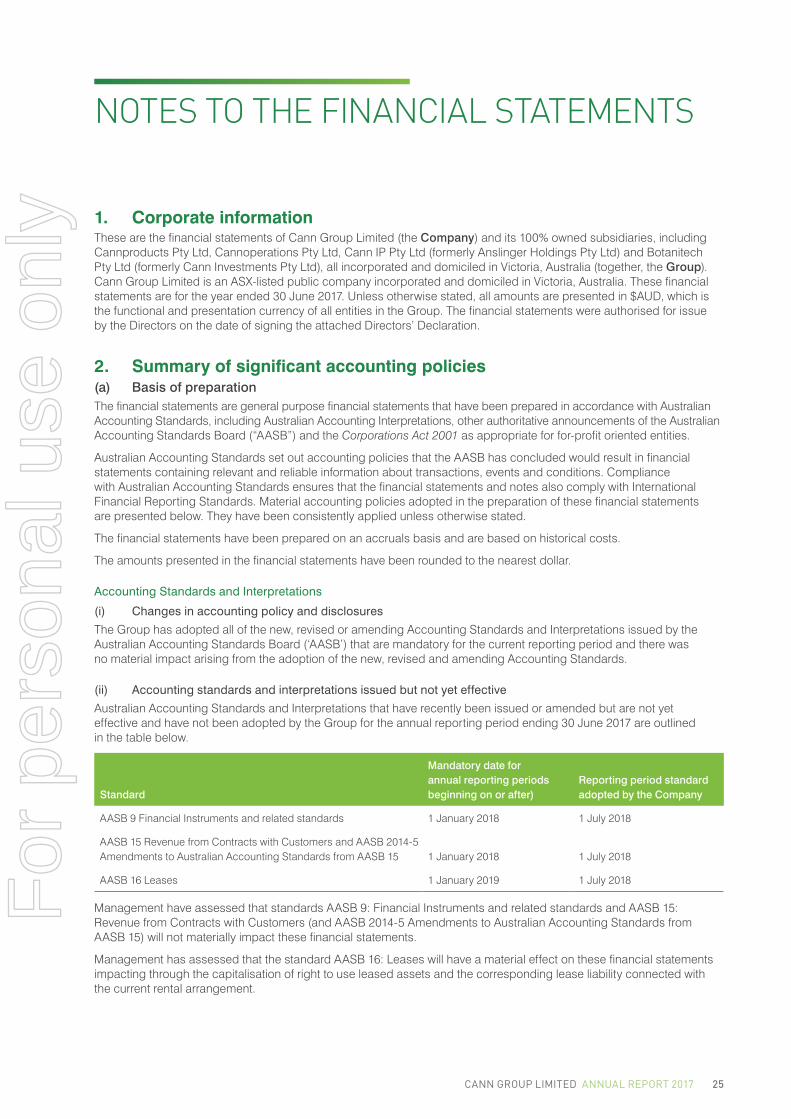
1. Corporate informationThese are the financial statements of Cann Group Limited (the Company) and its 100% owned subsidiaries, including Cannproducts Pty Ltd, Cannoperations Pty Ltd, Cann IP Pty Ltd (formerly Anslinger Holdings Pty Ltd) and Botanitech Pty Ltd (formerly Cann Investments Pty Ltd), all incorporated and domiciled in Victoria, Australia (together, the Group). Cann Group Limited is an ASX-listed public company incorporated and domiciled in Victoria, Australia. These financial statements are for the year ended 30 June 2017. Unless otherwise stated, all amounts are presented in $AUD, which is the functional and presentation currency of all entities in the Group. The financial statements were authorised for issue by the Directors on the date of signing the attached Directors’ Declaration.
2. summary of significant accounting policies(a) Basis of preparationThe financial statements are general purpose financial statements that have been prepared in accordance with Australian Accounting Standards, including Australian Accounting Interpretations, other authoritative announcements of the Australian Accounting Standards Board (“AASB”) and the Corporations Act 2001 as appropriate for for-profit oriented entities.
Australian Accounting Standards set out accounting policies that the AASB has concluded would result in financial statements containing relevant and reliable information about transactions, events and conditions. Compliance with Australian Accounting Standards ensures that the financial statements and notes also comply with International Financial Reporting Standards. Material accounting policies adopted in the preparation of these financial statements are presented below. They have been consistently applied unless otherwise stated.
The financial statements have been prepared on an accruals basis and are based on historical costs.
The amounts presented in the financial statements have been rounded to the nearest dollar.
Accounting Standards and Interpretations
(i) Changes in accounting policy and disclosures
The Group has adopted all of the new, revised or amending Accounting Standards and Interpretations issued by the Australian Accounting Standards Board (‘AASB’) that are mandatory for the current reporting period and there was no material impact arising from the adoption of the new, revised and amending Accounting Standards.
(ii) Accounting standards and interpretations issued but not yet effective
Australian Accounting Standards and Interpretations that have recently been issued or amended but are not yet effective and have not been adopted by the Group for the annual reporting period ending 30 June 2017 are outlined in the table below.
Standard
Mandatory date for annual reporting periods beginning on or after)
Reporting period standard adopted by the Company
AASB 9 Financial Instruments and related standards 1 January 2018 1 July 2018
AASB 15 Revenue from Contracts with Customers and AASB 2014-5 Amendments to Australian Accounting Standards from AASB 15 1 January 2018 1 July 2018
AASB 16 Leases 1 January 2019 1 July 2018
Management have assessed that standards AASB 9: Financial Instruments and related standards and AASB 15: Revenue from Contracts with Customers (and AASB 2014-5 Amendments to Australian Accounting Standards from AASB 15) will not materially impact these financial statements.
Management has assessed that the standard AASB 16: Leases will have a material effect on these financial statements impacting through the capitalisation of right to use leased assets and the corresponding lease liability connected with the current rental arrangement.
For
per
sona
l use
onl
y

noteS to the FinAnCiAl StAteMentS
26
2. summary of significant accounting policies (continued)(b) Principles of ConsolidationThese consolidated financial statements comprise the financial statements of the Company and its controlled entities throughout reporting periodSubsidiaries are entities controlled by the Group. The Group controls an entity when it is exposed to, or has rights to, variable returns from its involvement with the entity and has the ability to affect those returns through its power over the entity. The financial statements of subsidiaries are included in the consolidated financial statements from the date on which control commences until the date on which control ceases.
Consolidation of a subsidiary begins when the Company obtains control over the subsidiary and ends when the Company loses control of the subsidiary. Specifically, income and expenses of a subsidiary acquired or disposed of during the year are included in the Consolidated Statement of Profit or Loss and Other Comprehensive Income from the date the Company gains control until the date when the Company ceases to control the subsidiary.
The financial statements of the controlled entities used in the preparation of the consolidated financial statements are prepared for the same reporting date as the Company. Consistent accounting policies are applied to like transactions and events in similar circumstances.
All intra-group balances, income and expenses and unrealised gains and losses resulting from intra-group transactions and dividends are eliminated in full.
(c) Income Tax The income tax expense (income) for the year comprises current income tax expense (income) and deferred tax expense (income).
Current income tax expense charged to profit or loss is the tax payable on taxable income. Current tax liabilities (assets) are therefore measured at the amounts expected to be paid to (recovered from) the relevant taxation authority.
Deferred income tax expense reflects movements in deferred tax asset and deferred tax liability balances during the year as well as unused tax losses.
Deferred tax assets and liabilities are calculated at the tax rates that are expected to apply to the period when the asset is realised or the liability is settled and their measurement also reflects the manner in which management expects to recover or settle the carrying amount of the related asset or liability.
Deferred tax assets relating to temporary differences and unused tax losses are recognised only to the extent that it is probable that future taxable profit will be available against which the benefits of the deferred tax asset can be utilised.
(d) Cash and cash equivalentsCash in the Statement of Financial Position comprise cash at bank and in hand.
For the purposes of the Statement of Cash Flows, cash and cash equivalents consist of cash and cash equivalents as defined above.
(e) InventoryPlant-based inventory is classified at initial recognition depending upon its specific designated purpose by the Group.
Plants held for research purposes
Plants held for research purposes are expensed as incurred.
Bearer plants
Bearer plants are those which include a range of genetic varieties from which non-bearer plants are propagated from and are maintained to ensure genetic consistency. These are held at cost and incrementally capitalised throughout their life cycle to reflect the cost value of direct and indirect activities undertaken to grow the plants, less any accumulated depreciation or amortization.
For
per
sona
l use
onl
y
noteS to the FinAnCiAl StAteMentS
27Cann Group Limited annuaL report 2017
Non-bearer plants
Non-bearer plants are those which are grown to maturity (flowering) and then the full plant is harvested from which a product will be derived. These plants are recognized as biological assets and are held at fair value less costs to sell, or where fair value cannot be reliably measured, at cost and incrementally capitalized throughout their life cycle to reflect the direct and indirect activities undertaken to grow the plants, provided that such cost plus incremental gain does not exceed their net realizable value.
(f) Research and developmentResearch and development activities include all costs involved in researching and testing different cultivation methods and equipment in a quest to obtain optimal outcomes with regard to the chemical make-up and quantity of harvested and/or manufactured produce. Research and development activities may include specific experiments that may be registered for the Research and Development Tax Incentive or general research and development activities conducted as part of the Group’s general operations. The Group maintains a quantity of both bearer and non-bearer plants.specifically under its Cannabis Research Licence for use solely in research and development activities and they are destroyed upon conclusion of those activities.
Research and development costs are expensed as incurred.
(g) Goods and Services Tax (GST)Revenues, expenses and assets are recognised net of the amount of GST, except where the amount of GST incurred is not recoverable from the Australian Taxation Office (ATO).
Receivables and payables are stated inclusive of the amount of GST receivable or payable. The net amount of GST recoverable from, or payable to, the ATO is included with other receivables or payables in the statement of financial position.
Cash flows are presented on a gross basis. The GST components of cash flows arising from investing or financing activities which are recoverable from, or payable to, the ATO are presented as operating cash flows included in receipts from customers or payments to suppliers.
(h) Trade and other payablesTrade payables and other payables are carried at amortised cost and represent liabilities for goods and services provided to the Group prior to the end of the financial year that are unpaid and arise when the Group becomes obliged to make future payments in respect of the purchase of these goods and services.
(i) Trade and other receivablesTrade and other receivables include amounts due from customers for goods sold and services performed in the ordinary course of business. Receivables expected to be collected within 12 months of the end of the reporting period are classified as current assets. All other receivables are classified as non-current assets.
Trade and other receivables are initially recognised at fair value and subsequently measured at amortised cost using the effective interest method, less any provision for impairment.
At each reporting date, the Group’s directors assess whether there is objective evidence that trade and other receivables have been impaired. Impairment losses are recognised in the profit or loss.
For
per
sona
l use
onl
y

noteS to the FinAnCiAl StAteMentS
28
2. summary of significant Accounting Policies (continued)(j) Plant and Equipment Each class of plant and equipment is carried at cost less any accumulated depreciation and impairment losses.
The carrying amount of plant and equipment is reviewed annually by directors to ensure it is not in excess of the recoverable amount from these assets. The recoverable amount is assessed on the basis of the expected net cash flows that will be received from the asset’s employment and subsequent disposal. The expected net cash flows have been discounted to their present values in determining recoverable amounts.
The cost of plant and equipment constructed within the Group includes the cost of materials, direct labour, borrowing costs and an appropriate proportion of fixed and variable overheads.
Depreciation
The depreciable amount of all plant and equipment is depreciated on a diminishing value basis over the asset’s useful life to the Group commencing from the time the asset is held ready for use.
As at 30 June 2017, the Group’s asset classes had effective useful lives as follows:
Asset ClassUseful Life
(years)
Growth facilities 7
Other plant and equipment (includes computer equipment, network equipment, security equipment, leasehold improvements, furniture, cultivation tools and workshop equipment) 1 to 3
The assets’ residual values and useful lives are reviewed, and adjusted if appropriate, at the end of each reporting period.
Gains and losses on disposals are determined by comparing proceeds with the carrying amount. These gains and losses are included in the statement of profit of loss and other comprehensive income.
(k) Impairment of AssetsAt each reporting date, the Group’s directors review the carrying values of the Group’s tangible and intangible assets to determine whether there is any indication that those assets have been impaired. If such an indication exists, the recoverable amount of the asset, being the higher of the asset’s fair value less cost to sell and value in use, is compared to the assets carrying value. Any excess of the assets carrying value over its recoverable amount is expensed to the statement of profit or loss and other comprehensive income.
(l) LeasesLeases in which a significant portion of the risks and rewards of ownership are retained by the lessor are classified as operating leases. Payments made under operating leases, net of any incentives received from the lessor, are charged to the Consolidated Statement of Profit or Loss and Other Comprehensive Income on a straight-line basis over the period of the lease.
(m) Share Based PaymentsThe Company reflects in its comprehensive income (or loss) and its financial position the effects of share-based payment transactions, including expenses associated with transactions in which shares are granted to related parties, key management personnel and employees.
For share-based payments received by employees and key management personnel of the Group, fair value is measured by reference to the fair value of the equity instruments granted at their grant date, being the date that both the recipient and the Company have a shared understanding of the terms and conditions connected to the share-based payment. Any market-based vesting conditions are incorporated into the valuation of the share-based payment arrangement as at the grant date of the share-based payment. Share-based payments with non-market based performance conditions vest according to the pro-rata achievement of those conditions. Share-based payments with non-performance based conditions are valued using the Black-Scholes model and payments with market-based performance conditions are valued using a binomial model which incorporates from both the performance rights arrangement and market data that existed at grant date.
For
per
sona
l use
onl
y

noteS to the FinAnCiAl StAteMentS
29Cann Group Limited annuaL report 2017
(n) Critical Accounting Estimates and Judgements The Directors evaluate estimates and judgements incorporated into the financial statements based on historical knowledge and best available current information. Estimates assume reasonable expectation of future events and are based on current trends and economic data, obtained both externally and within the entity.
Key Judgement – non-recognition of carry-forward tax losses
The balance of future income tax benefit estimated as $703,351 (2016: $359,222) arising from current year tax losses of $2,588,445 (2016: $1,198,314) and timing differences has not been recognised as an asset because recovery is not regarded as probable. The cumulative future income tax benefit estimated to be $1,428,739, which has not been recognised as an asset, will only be obtained if:
(i) the Company derives future assessable income of a nature and an amount sufficient to enable the benefit to be realised;
(ii) the Company continues to comply with the conditions for deductibility imposed by law; and
(iii) no changes in tax legislation adversely affecting the Company realising the benefit.
Key Judgement – non-recognition of research and development tax incentive benefits
The balance of research and development tax incentive arising from operations of the Company has not been recognised as an asset because receipt as at this stage as it cannot be reliably calculated. The research and development tax incentive, which has not been recognised as an asset, will only be obtained if:
(i) the Company’s activities fulfil the eligibility criteria of the research and development tax initiative and it is successful in registering for the research and development tax initiative;
(ii) the Company continues to comply with the conditions for registration of the research and development tax initiative imposed by law; and
(iii) no changes in tax legislation adversely affecting the Company realising the tax incentive from research and development.
Key Judgement – valuation of Underwriter Options
The Underwriter Options issued to Underwriters to the Initial Public Offering received as part of their remuneration for services were independently valued using the Black-Scholes valuation methodology. The data input into the Black-Scholes valuation methodology included the Option tenure period of 2.167 years from grant date of 4 May 2017, a risk-free rate of 1.74% and an expected volatility rate of 80%.
3. Expenses2017
$2016
$
Depreciation (124,297) (28,917)
Employee salaries (569,945) (169,624)
Employee superannuation (53,147) (47,154)
Share based payments (110,904) (83,904)
Lease expense (834) –
Occupancy expenses (269,690) (79,754)
(1,128,817) (409,353)
For
per
sona
l use
onl
y

noteS to the FinAnCiAl StAteMentS
30
4. Key management personnel(a) Names and positions held of key management personnel in office at any time during the year are:
Key Management Person Position
Mr Allan McCallum Chairman
Mr Philip Jacobsen Deputy Chairman
Mr Douglas Rathbone Director
Mr Geoff Pearce Director
Mr Michael Murchison (resigned 28 October 2016) Director
Mr Peter Crock Chief Executive Officer
(b) Remuneration paid to Key Management Personnel
2017 $
2016 $
Short-term employee benefits 362,750 191,069
Post-employment benefits 16,821 27,825
Share-based payments 34,473 74,315
414,044 293,209
5. Auditor’s remunerationDuring the year the following fees were paid or payable for services provided by the auditor of Group, its related practices and non-related audit firms:
2017 $
2016 $
(i) Audit and other assurance services
Audit and review of financial statements 24,000 11,000
Assistance with Due Diligence 1,365 –
Total remuneration for audit and other assurance services 25,365 11,000
(ii) Consulting services
Consulting fees regarding Research and Development Tax Incentive 800 –
Total remuneration for consulting services 800 –
Total remuneration of William Buck 26,165 11,000
For
per
sona
l use
onl
y

noteS to the FinAnCiAl StAteMentS
31Cann Group Limited annuaL report 2017
6. Plant and equipment(a) Plant and equipment
2017 2016
Growth Facilities
$
Other plant & equipment
$Total
$
Growth Facilities
$
Other plant & equipment
$Total
$
Cost 728,597 141,288 869,855 469,489 46,186 515,675
Accumulated Depreciation (106,374) (46,839) (153,213) (17,117) (11,800) (28,917)
Closing Balance 622,223 94,449 716,672 452,372 34,386 486,758
(b) Movements in plant and equipment
2017 2016
Growth Facilities
$
Other plant & equipment
$Total
$
Growth Facilities
$
Other plant & equipment
$Total
$
Opening Balance 452,372 34,386 486,758 171,369 – 171,369
Additions 259,109 95,104 354,213 298,120 46,186 344,306
Depreciation (89,258) (35,039) (124,297) (17,117) (11,800) (28,917)
Closing Balance 622,223 94,451 716,672 452,372 34,386 486,758
During the year Secure Cultivation Rooms 01 and 02 were completed to operational levels and were available for use as at 1 August 2016. Secure Cultivation Rooms 03, 04 and 05 to 07 were in various stages of construction as at 30 June 2017. As at 30 June 2017 the Directors reviewed the overall progress of the Secure Cultivation Rooms and the Directors conducted an impairment test which was applied as at 30 June 2017 whereby the Directors compared the carrying values of all of the Secure Grow Rooms plus the Research & Development / Nursery Room and the Laboratory / Drying Room to the selling values of comparable assets and concluded that no impairment existed relating to these assets.
For
per
sona
l use
onl
y

noteS to the FinAnCiAl StAteMentS
32
7. Controlled entitiesCann Group Limited has four wholly-owned subsidiaries as at 30 June 2017 as follows:
Subsidiary Name Principle Activity Date AcquiredNumber of
Shares heldPercentage
Shareholding
Cannproducts Pty Ltd (ACN 600 887 189)
To market and distribute the Group’s medicinal cannabis products.
27 February 2015 100 100%
Cannoperations Pty Ltd (ACN 603 323 226)
To hold all relevant licences and permits required to conduct all operations relating to research and development, cultivation and seed acquisition/importation. Owns all cultivation and other assets used throughout the Group.
27 February 2015 100 100%
Cann IP Pty Ltd (formerly Anslinger Holdings Pty Ltd) (ACN 169 764 407)
To hold all intellectual property for Group members. 27 February 2015 100 100%
Botanitech Pty Ltd (formerly Cann Investments Pty Ltd) (ACN 604 834 488)
To hold any investments undertaken by the Group in the future that are relevant or complimentary to the vertical integration of the Group’s business.
18 March 2015 100 100%
During the year the Group disposed of two wholly-owned subsidiaries. Those entities were as follows:
Subsidiary Name Principle Activity Date DisposedNumber of
Shares heldPercentage
Shareholding
Cann Global Inc Corporate shell 28 October 2016 100 100%
Cannproducts NZ Limited Corporate shell23 November 2016 100 100%
Both entities were disposed for the purpose of internally structuring the legal form of the Group. As these transactions only related to the structure of the Group and did not influence its operations, the Directors have assessed that these disposals, sold to related parties for $1 each at arm’s-length terms, did not meet the definition of a business, being corporate shells, and therefore they have not been classified as a discontinued operation in these financial statements.
8. Issued capital 30 June 2017
Number of Shares
30 June 2016 Number of
Shares30 June 2017
$30 June 2016
$
Ordinary shares – fully paid 108,353,335 39,346,668 20,187,092 4,376,271
Total issued capital 108,353,335 39,346,668 20,187,092 4,376,271
Ordinary shares participate in dividends and the proceeds on winding up of the Company in proportion to the number of shares held. At shareholders’ meetings each ordinary share is entitled to one vote when a poll is called, otherwise each shareholder has one vote on a show of hands.F
or p
erso
nal u
se o
nly

noteS to the FinAnCiAl StAteMentS
33Cann Group Limited annuaL report 2017
Movements in issued capital:
Issue DateIssue Price
$
Number of Shares and
Options2017
$
Balance 1 July 2016 39,346,668 4,376,271
29 September 2016 – placement 0.15 320,000 48,000
22 November 2016 – placement 0.15 160,000 24,000
21 February 2017 – placement 0.15 160,000 24,000
31 March 2017 – issued pursuant to exercise of options 0.15 13,486,667 2,023,000
20 April 2017 – issued pursuant to vesting of Performance Rights – 7,180,000 362,615
3 May 2017 – issued pursuant to Initial Public Offering (net of costs)* 0.30 47,700,000 13,091,206
Total Issued Shares as at 30 June 2017 108,353,335 19,949,092
Total Options on issue** – 2,000,000 238,000
Total Issued Capital as at 30 June 2017 110,353,335 20,187,092
* Costs of the issue of shares pursuant to the Initial Public Offering are as follows:
Settlement method
CostCash
$Shares
$Options
$Total
$
Underwriting fee – 810,000 238,000*** 1,048,000
Legal fees 108,660 – – 108,660
Corporate advisory, investigating accountant and other consulting fees 103,901 – – 103,901
Printing and design costs 14,697 – – 14,697
Total 227,258 810,000 238,000 1,275,258
** Refer Note 9 regarding total number of Options on issue as at 30 June 2017.
*** Included in the Underwriter Fees is an amount of $238,000 representing the value of 2,000,000 Underwriter Options which the Underwriters to the Initial Public Offering received as part of their remuneration for services. For the Key Judgements regarding the Option valuation refer to Note 2(l).
Issue DateIssue Price
$Number of
Shares2016
$
Balance 1 July 2015 6,025,000 1,957,006
13 August 2015 – placement 1.00 150,000 150,000
30 October 2015 – placement 1.00 450,000 450,000
12 May 2016 – issued pursuant to Information Memorandum 0.60 3,211,667 1,880,533
30 June 2016 – 29,510,001 –
30 June 2016 – Costs of issuing shares – – (61,268)
Total Issued Capital as at 30 June 2016 39,346,668 4,376,271
For
per
sona
l use
onl
y

noteS to the FinAnCiAl StAteMentS
34
9. OptionsDuring the year the Group had two classes of options on issue, being options issued pursuant to the Information Memorandum dated 11 April 2016 and Underwriter Options issued pursuant to the Initial Public Offering Prospectus dated 28 March 2017 (and the Supplementary Prospectus dated 12 April 2017).
Options issued pursuant to Information Memorandum dated 11 April 2016All options were exercised at fifteen ($0.15) cents each before the expiration date of 4.00pm (Melbourne, Victoria time) on 31 March 2017.
Issue DateIssue Price
$Number
of Options
Balance 1 July 2016 12,846,668
29 September 2016* – 320,000
22 November 2016* 160,000
21 February 2017* 160,000
31 March 2017** – (13,486,668)
Balance 30 June 2017 –
Issue DateIssue Price
$Number of
Options
Balance 1 July 2015 –
12 May 2016*** – 3,211,667
30 June 2016**** – 9,635,001
Balance 30 June 2016 12,846,668
* On 29 September 2016, 22 November 2016 and 21 February 2017 the Company issued a total of 640,000 Ordinary Shares at fifteen cents ($0.15) per Share (post share-split) by placements on the same terms as those issued pursuant to the Information Memorandum dated 11 April 2016, hence issuing one attaching Option at no additional cost for each new share subscribed for under those placements.
** On 31 March 2017 the Company issued 13,486,668 Ordinary Shares pursuant to all holders of options exercising all of their options.
*** On 12 May 2016 the Company issued 3,211,667 Ordinary Shares at sixty cents ($0.60) per Share pursuant to the Information Memorandum dated 11 April 2016 and issued one attaching Option at no additional cost for each new share subscribed for under that Information Memorandum.
**** On 30 June 2016, at the Annual General Meeting held on that day, shareholders passed the resolution that in accordance with section 254H of the Corporations Act 2001 (Cth), the fully paid ordinary shares in the issued capital of the Company be split on the basis that every share be divided into four fully paid ordinary shares with effect from 5.00pm (Melbourne time) on 30 June 2016. Options and performance rights on issue at the effective date of the share split were also adjusted which involved an increase in the number of these securities in the same ratio as the share split, and a decrease in the exercise price in the inverse ratio.
Underwriter Options issued pursuant to the Initial Public Offering Prospectus dated 28 March 2017 (and the Supplementary Prospectus dated 12 April 2017)The Underwriters (or their respective nominees) to the Initial Public Offering were issued 2,000,000 Underwriter Options in the Company. The Underwriter Options will have an exercise price $0.37 and expire on 30 June 2019.
Refer to Note 2(l) and Note 8 regarding the value of these Options at the date of issue.
The Underwriter Options (and any underlying Shares issued as a result of the exercise of any of these Underwriter Options) will be subject to a 24-month escrow period.
Upon conversion, the underlying Shares issued will be subject to the same rights and liabilities of all other Shares.
For
per
sona
l use
onl
y

noteS to the FinAnCiAl StAteMentS
35Cann Group Limited annuaL report 2017
Issue DateIssue Price
$Number of
Options
Balance 1 July 2016 –
Issued 2 May 2017 – 2,000,000
Balance 30 June 2017 2,000,000
10. Performance RightsThe Company has no Performance Rights on issue as at 30 June 2017. The Performance Rights Reserve reflects the vesting of the fair value of Performance Rights, which were issued by the Group prior to the IPO and of which all were either cancelled or converted by the completion of the IPO. Performance Rights solely with market conditions which were cancelled were taken directly to accumulated losses and not recycled through profit and loss.
Movement in Performance Rights Reserve
PERFORMANCE RIGHTS CLASS A
Date
Number of Performance
Rights2017
$
Balance 1 July 2016 11,000,000 263,698
1 March 2017* (11,000,000) (263,698)
Balance 30 June 2017 – –
* On 1 March 2017 all Performance Rights Class A were cancelled with the agreement of all holders and was credited to the Statement of Profit or Loss and Other Comprehensive Income.
PERFORMANCE RIGHTS CLASS A
Date
Number of Performance
Rights 2016
$
Balance 1 July 2015 11,000,000 263,698
Balance 30 June 2016 11,000,000 263,698
For
per
sona
l use
onl
y

noteS to the FinAnCiAl StAteMentS
36
10. Performance Rights (continued)
PERFORMANCE RIGHTS CLASS B
Date
Number of Performance
Rights2017
$
Balance 1 July 2016 7,000,000 251,711
1 July 2016** 180,000 21,600
20 April 2017̂ – 89,304
20 April 2017̂ ^ (7,180,000) (362,615)
Balance 30 June 2017 – –
** On 1 July 2016 180,000 Performance Rights Class B were issued to contractors to the Group.^ Vesting of Performance Rights Class B to conversion due to increase in probability of conversion milestone being achieved attributed to the
Statement of Profit or Loss and Other Comprehensive Income.^^ On 20 April 2017 all Performance Rights Class B were converted into Ordinary Shares, having fulfilled the vesting requirements, being the milestone
of the Company applying to be admitted to the Official List of the ASX. Refer Note 8 Issued Capital.
CLASS B
Date
Number of Performance
Rights2016
$
Balance 1 July 2015 7,000,000 167,807
30 June 2016̂ ^^ – 83,904
Balance 30 June 2016 7,000,000 251,711
^^^ Vesting of Performance Rights Class B during year due to increase in probability of conversion milestone being achieved attributed to the Statement of Profit or Loss and Other Comprehensive Income.
For
per
sona
l use
onl
y

noteS to the FinAnCiAl StAteMentS
37Cann Group Limited annuaL report 2017
11. Related party information2017
$2016
$
Transactions between the Consolidated Group and related parties are on normal commercial terms and conditions no more favourable than those available to other parties unless otherwise stated. Related party transactions not otherwise disclosed in these financial statements include the following:
All shares in Cann Global LLC were transferred from Cann Group Limited to Mr Michael Murchison on an arm’s-length basis 1 –
All shares in Cannproducts NZ Limited were transferred from Cann Group Limited to entities associated with Mr Michael Murchison on an arm’s-length basis 1 –
Fees for United States representative services were paid to BPI Inc., a company of which Mr Michael Murchison is a Director and shareholder. – 41,100
Fees for hire of office equipment and furniture were paid to Odd Couple Productions Pty Ltd, a company of which Mr Michael Murchison is a Director and shareholder. – 35,500
Purchase of office equipment and furniture from Odd Couple Productions Pty Ltd, a company of which Mr Michael Murchison is a Director and shareholder. 1,500 24,495
1,502 101,095
12. Contingent liabilities and commitmentsThe Company has a bank guarantees of $35,000 and $50,000 for the operating premises lease of the Company’s Southern and Northern premises respectively. With the exception of these bank guarantees, the Company currently has no contingent liabilities or commitments at the date of signing this report.
13. Events after the end of the reporting periodThere were no other matters or circumstances arising since the end of the year which significantly affected or may significantly affect the operation of the Group, the results of those operations, or the state of affairs of the Group in future financial years.
For
per
sona
l use
onl
y

noteS to the FinAnCiAl StAteMentS
38
14. Cash flow informationReconciliation of net loss after tax to net cash flows from operations
2017 $
2016 $
Profit/(loss) for the year (2,588,445) (1,462,011)
Non-cash flows in profit
Vesting of performance rights Class B 110,904 83,904
Depreciation 124,297 28,917
Movements in working capital
(Increase)/decrease in trade receivables and other assets (127,934) (1,558)
(Decrease)/increase in trade and other payables 207,254 104,021
(Increase)/decrease in stock on hand (24,927) –
Net cash outflows from operating activities (2,298,851) (1,246,728)
15. LeasesOperating LeasesOn 3 March 2017 the Group entered into an operating lease for premises known as the Northern Facility for a period of three years commencing 1 April 2017. As disclosed in the 2016 Annual Report the Group had entered into an operating lease for premises at the Southern Facility with the term of the lease being three years and six months and which allows for two further terms of three years each. Both Facilities are located in Melbourne, Victoria.
Operating lease commitments are:
Period2017
$2016
$
Less than 12 months 518,021 110,000
From one to five years 834,138 183,333
1,352,159 293,333
For
per
sona
l use
onl
y

noteS to the FinAnCiAl StAteMentS
39Cann Group Limited annuaL report 2017
Finance LeaseOn 24 May 2017 the Group entered into a finance lease with Crown Equipment Pty Ltd trading as Crown Credit for lifting equipment known as a walkie stacker.
Finance lease commitments are:
Period2017
$2016
$
Less than 12 months 4,198 –
From one to five years 20,567 –
24,765 –
16. Financial risk managementThe consolidated Group’s material financial instruments consist of deposits with banks and its accounts payable and other liabilities. The Board is responsible for managing the Group’s only significant financial risk, which is its liquidity risk, which it does through regularly reviewing rolling cash flow forecasts and examining its levels of available working capital against such forecasts.
Liquidity risk arises from the possibility that the Group may encounter difficulty in meeting its obligations for its financial liabilities, which at 30 June 2017 were accounts payable with due terms from 0 – 45 days.
The Directors have assessed that the fair values of the Group’s financial assets and liabilities reasonably approximate their carrying values, as represented in these financial statements.
17. Capital managementThe Board of Directors are charged with determining the optimal mix of debt and equity which is suitable for the needs of the Group. For the year ended 30 June 2017 the Group held no material commercial borrowings or material facilities for credit as the board considered that, at this point of time, that funds sourced through equity would be most appropriate. The Group’s Chief Financial Officer reports to the board periodically with forecast cash flow information that enables the Board to conduct its capital raising activities in an orderly fashion at a dilutive cost to existing shareholders that is appropriate and reasonable.
18. segment informationThe Group operates in one segment being the medicinal cannabis industry with operations only in Australia.
For
per
sona
l use
onl
y

noteS to the FinAnCiAl StAteMentS
40
19. Parent entity disclosures
Financial Position2017
$2016
$
Assets
Current assets 16,911,629 1,378,747
Non-current assets 25,314 1,693,207
Total assets 16,936,943 3,071,954
Liabilities
Current liabilities 227,298 157,662
Non-current liabilities 20,567 –
Total liabilities 247,865 157,662
Equity
Issued capital 20,187,092 4,376,270
Reserves – 515,409
Accumulated losses (3,498,014) (1,977,417)
Total equity 16,689,078 2,914,262
Financial Performance2017
$2016
$
Loss for the year (1,784,294) (930,503)
Other comprehensive income – –
Total comprehensive loss (1,784,294) (930,503)
The subsidiary companies have expenditure commitments under the premises lease. The parent entity has committed to providing funds to ensure the subsidiary companies can fulfil these commitments as well as any other operating commitments.
For
per
sona
l use
onl
y

41Cann Group Limited annuaL report 2017
DiReCtoRS’ DeClARAtion
1. The Directors declare that the financial statements and notes set out on pages 22 to 40 are in accordance with the Corporations Act 2001 and:
a. comply with International Financial Reporting Standards, as stated in Note 2 to the financial statements;
b. comply with Accounting Standards, the Corporations Regulations 2001; and
c. give a true and fair view of the financial position as at 30 June 2017 and of the performance for the year ended 30 June 2017 of the consolidated group.
2. The Chief Executive Officer and Company Secretary have each declared that:
a. the financial records of the Company for the year ended 30 June 2017 have been properly maintained in accordance with section 286 of the Corporations Act 2001;
b. the financial statements and notes for the year comply with the Accounting Standards; and
c. the financial statements and notes for the year give a true and fair view.
3. In the Directors’ opinion there are reasonable grounds to believe that the Company will be able to pay its debts as and when they become due and payable.
This declaration is made in accordance with a resolution of the Directors.
Allan McCallum Chairman Date: 25 August 2017
For
per
sona
l use
onl
y

42
inDepenDent AuDitoR’S RepoRt
For
per
sona
l use
onl
y

43Cann Group Limited annuaL report 2017
inDepenDent AuDitoR’S RepoRt
For
per
sona
l use
onl
y

44
inDepenDent AuDitoR’S RepoRt
For
per
sona
l use
onl
y

45Cann Group Limited annuaL report 2017
inDepenDent AuDitoR’S RepoRt
For
per
sona
l use
onl
y

46
inDepenDent AuDitoR’S RepoRt
For
per
sona
l use
onl
y

47Cann Group Limited annuaL report 2017
ShAReholDeR inFoRMAtion
Equity security holdersAs at 23 August 2017 the Company had 108,353,335 ordinary shares on issue. Further details of the Company’s equity securities are as follows:
Largest holdersThe following table shows the 20 largest registered shareholders as at 23 August 2017 (as named on the register of shareholders:
Rank Name 23 Aug 2017
% of Issued Shares
1 AURORA CANNABIS INC 21,562,314 19.90
2 MULLACAM PTY LTD <ATF THE MCCALLUM FAMILY SUPER FUND> 5,480,000 5.06
3 WEXFORD RISE PTY LTD <WEXFORD RISE SUPER FUND> 4,533,334 4.18
4 CROFTON PARK DEVELOPMENTS PTY LTD <THE BROUGHAM SUPERANNUATION FUND> 4,284,099 3.95
5 MR PHILIP JACOBSEN & MRS MAXINE JACOBSEN <THE JAYESS S/F> 2,966,667 2.74
6 CG NOMINEES (AUSTRALIA) PTY LTD 2,540,000 2.34
7 UBS NOMINEES PTY LTD 2,332,201 2.15
8 CANACCORD GENUITY (AUSTRALIA) LIMITED 2,025,000 1.87
9 GRAPEFULL PTY LTD <ATF THE GRAPEFULL SUPER FUND> 2,020,000 1.86
10 MR RAYMOND THOMAS HOBSON & MRS RHONDA ELLEN HOBSON 2,005,000 1.85
11 ELLERSTON CAPITAL LIMITED <RE OF THE GLOBAL EQUITY MANAGERS FUND> 2,000,000 1.85
12 CITICORP NOMINEES PTY LIMITED 1,674,888 1.55
13 HARDMAIL PTY LTD 1,600,000 1.48
13 MR ALLAN WAYNE ROHDE & MRS LYNDEL MARGARET ROHDE <THE LYNAL SUPER FUND A/C> 1,600,000 1.48
13 MR ALLAN WAYNE ROHDE 1,600,000 1.48
14 HSBC CUSTODY NOMINEES (AUSTRALIA) LIMITED 1,421,581 1.31
15 INTERDALE PTY LTD <MAPLE SUPER FUND> 1,350,000 1.25
16 MR ED STEVEN MOROZ 1,328,138 1.23
17 LEIBLER NOMINEES PTY LTD <THE KIRRAMA> 1,050,000 0.97
18 CG NOMINEES (AUSTRALIA) PTY LTD 1,040,000 0.96
19 EGEA PTY LTD 1,000,000 0.92
19 AUSTRALIAN BUSINESSPOINT PTY LTD 1,000,000 0.92
19 TALMETAL PTY LTD 1,000,000 0.92
19 MR GEOFFREY LLOYD NALDER 975,667 0.90
20 STARWAY CORPORATION PTY LTD <THE GILES SUPERANNUATION FUND> 900,000 0.83
Total 69,288,889 63.95
Balance of register 39,064,446 36.05
Grand total 108,353,335 100.00
For
per
sona
l use
onl
y

ShAReholDeR inFoRMAtion
48
substantial shareholdersThe following table shows the substantial holders as notified to the Company in substantial holding notices as at 23 August 2017:
NameNoted Date of Change
Number of Equity
SecuritiesRelevant Interest
AURORA CANNABIS INC 03/05/2017 21,562,314 19.90%
MULLACAM PTY LTD <ATF THE MCCALLUM FAMILY SUPER FUND> 03/05/2017 5,480,000 5.06%
Distribution of equity securityholdersHoldings distribution
Number of equity security holders
RangeOrdinary
shares Options
100,001 and over 94 2
10,001 to 100,000 393 -
5,001 to 10,000 302 -
1,001 to 5,000 761 -
1 to 1,100 435 -
Total 1,985 2
Unmarketable ParcelsThe number of security investors holding less than a marketable parcel of 437 securities ($1.145 on 23 August 2017) is 43 and they hold 13,581 securities.
Voting RightsThe voting rights attaching to each ordinary shares are that holders of ordinary shares have the right to vote at every general meeting of the Company. At a general meeting every holder of ordinary shares present in person or by proxy has, on poll, one vote for each ordinary share held.
Unquoted equity securitiesCann Group Limited has 2,000,000 unquoted underwriter options on issue at 23 August 2017.
Securities exchangeThe Company is listed on the Australian Securities Exchange. The home exchange is Melbourne.
Other informationCann Group Limited, incorporated and domiciled in Australia, is a publicly listed company limited by shares.
For
per
sona
l use
onl
y

For
per
sona
l use
onl
y

CA
NN
GR
OU
P LIM
ITED
AN
NU
AL R
EP
OR
T
canngrouplimited.com
For
per
sona
l use
onl
y