cannabis concentrate use in adolescents
TRANSCRIPT
Cannabis Concentrate Usein AdolescentsMadeline H. Meier, PhD,a Meagan Docherty, PhD,b Scott J. Leischow, PhD,c Kevin J. Grimm, PhD,a Dustin Pardini, PhDb
abstractBACKGROUND: Cannabis concentrates, which are cannabis plant extracts that contain highconcentrations of D-9-tetrahydrocannbinol (THC), have become increasingly popular amongadults in the United States. However, no studies have reported on the prevalence or correlatesof cannabis concentrate use in adolescents, who, as a group, are thought to be particularlyvulnerable to the harms of THC.
METHODS:Participants are a racially and ethnically diverse group of 47 142 8th-, 10th-, and 12th-grade students recruited from 245 schools across Arizona in 2018. Participants reported ontheir lifetime and past-month marijuana and cannabis concentrate use, other substance use,and risk and protective factors for substance use problems spanning multiple life domains (ie,individual, peer, family, school, and community).
RESULTS: Thirty-three percent of all 8th-, 10th-, and 12th-graders reported lifetime cannabis use,and 24% reported lifetime concentrate use. Seventy-two percent of all lifetime cannabis usershad used concentrates. Relative to adolescent cannabis users who had not used concentrates,adolescent concentrate users were more likely to use other substances and to experiencemore risk factors, and fewer protective factors, for substance use problems across numerouslife domains.
CONCLUSIONS: Most adolescent cannabis users have used concentrates. Based on their risk andprotective factor profile, adolescent concentrate users are at higher risk for substance useproblems than adolescent cannabis users who do not use concentrates. Findings raiseconcerns about high-risk adolescents’ exposure to high-THC cannabis.
WHAT’S KNOWN ON THIS SUBJECT: Cannabisconcentrates have high D-9-tetrahydrocannbinol (THC)content, and adolescents are thought to be especiallyvulnerable to the harms of THC. However, little isknown about the prevalence or correlates ofconcentrate use in adolescents.
WHAT THIS STUDY ADDS: Cannabis concentrate usewas common in adolescents (prevalence = 24%).Concentrate users were worse off thannonconcentrate cannabis users on every risk andprotective factor for substance use problems, raisingconcerns about high-risk adolescents’ exposure tohigh-THC cannabis.
To cite: Meier MH, Docherty M, Leischow SJ, et al.Cannabis Concentrate Use in Adolescents. Pediatrics.2019;144(3):e20190338
aDepartment of Psychology, Arizona State University, Tempe, Arizona bSchool of Criminology and Criminal Justice,and cCollege of Health Solutions, Arizona State University, Phoenix, Arizona
Dr Meier conceptualized and designed the study, interpreted the data, and drafted the initialmanuscript; Dr Docherty analyzed and interpreted the data and reviewed and revised themanuscript; Dr Leischow interpreted the data and reviewed and revised the manuscript; Dr Grimmreviewed data analyses, interpreted the data, and reviewed and revised the manuscript; Dr Pardiniconceptualized and designed the study, collected and interpreted the data, and reviewed andrevised the manuscript; and all authors approved the final manuscript as submitted and agree tobe accountable for all aspects of the work.
DOI: https://doi.org/10.1542/peds.2019-0338
Accepted for publication Jun 6, 2019
Address correspondence to Madeline H. Meier, PhD, Department of Psychology, Arizona StateUniversity, PO Box 871104, Tempe, AZ 85287-1104. E-mail: [email protected]
PEDIATRICS (ISSN Numbers: Print, 0031-4005; Online, 1098-4275).
Copyright © 2019 by the American Academy of Pediatrics
FINANCIAL DISCLOSURE: The authors have indicated they have no financial relationships relevant tothis article to disclose.
PEDIATRICS Volume 144, number 3, September 2019:e20190338 ARTICLE
Dow
nloaded from http://publications.aap.org/pediatrics/article-pdf/144/3/e20190338/1077403/peds_20190338.pdf by guest on 12 D
ecember 2021
At a time when cannabis use isincreasing and perceived risk ofcannabis use is declining,1,2 there isgrowing concern that the health risksof cannabis use might beunderestimated. This is because theconcentration of D-9-tetrahydrocannabinol (THC) incannabis has risen dramatically inrecent years.3–5 THC is the mainpsychoactive constituent of cannabisand has dose effects on drugreinforcement, cognitive impairment,and psychotic-like experiences.6–10
Thus, there is speculation, as well asemerging evidence, that use ofcannabis with higher THC contentmight increase risk for cannabis usedisorder, cognitive impairment,psychosis, and other adverseconsequences.7,11–21
Concerns about rising THCconcentrations have come to theforefront recently, in part becausecannabis legalization in the UnitedStates has led to the marketing andpromotion of cannabis concentrates:cannabis plant extracts withunprecedentedly high THC content.11,22 Compared with marijuana (thedried buds of the cannabis plant),which has average THC contentranging from 12% to 20% in theUnited States,3,23,24 the estimatedaverage THC content of concentratesis much higher, ranging from ∼39% to69%, depending on how theconcentrate is produced.3,22,24
Concentrates are produced either byusing solvents, such as butane orsupercritical carbon dioxide, ornonsolvent-based methods, such asa sieve, ice water, or heat andpressure, to extract THC fromcannabis plant material.22 Solvent-based extraction methods produceconcentrates (eg, wax, dab, shatter,and butane hash oil [BHO])with average THC content of∼54% to 69%,3,22,24,25 but THCcontent of these concentratescan exceed 80%. Nonsolvent-based extraction methodsproduce concentrates (eg, kief, hash
or hashish, and rosin) with THCcontent of ∼39% to 60%.3,22
Evidence suggests that cannabisconcentrates are increasingly popularin the United States. Google searchdata from 2004 to 2016 show thatcannabis concentrate–relatedsearches increased dramatically inthe United States from ∼2012 to2016.26 Moreover, data fromWashington state, where recreationaland medical cannabis use are legal,show that growth in concentrate salesoutpaced growth in marijuana salesfrom 2014 to 2016, with concentratesaccounting for 21% of all cannabisexpenditures in 2016, a 146%increase from 2014.24 However,epidemiological data on theprevalence of concentrate use arelacking. Nationally representativesurveys have not yet askedspecifically about concentrate use.27
Moreover, although a number ofstudies have reported on theprevalence of concentrate use in adultcannabis users and have generallyfound that rates of concentrate useamong adult cannabis users are high(Supplemental Table 6),21,28–36 thesestudies are based onunrepresentative samples of adultsrecruited, for the most part, online.No studies have reported on theprevalence of concentrate use ina representative sample, and nostudies have reported on theprevalence of concentrate use inadolescents.
Understanding the prevalence ofcannabis concentrate use inadolescents is important becausecannabis use is typically initiated inadolescence, and adolescence isa developmental period characterizedby heightened risk for cannabis usedisorder and other cannabis-relatedconsequences.37–39 Adolescentcannabis users’ use of concentrates,specifically, might further amplifytheir risk for cannabis use disorderand adverse cannabis-relatedconsequences; studies of adultcannabis users have suggested that
use of concentrates and use ofmarijuana with higher versus lowerTHC content are associated with moresevere cannabis dependence,7,13,19,21,35
greater risk of psychosis,17,18,40
and greater cannabis-relateddifferences in brain structure.20
Moreover, use of cannabis with higherTHC content may cause more severeacute effects, such as altered realityand loss of consciousness,15,28,32,41–43
and the production and use ofsolvent-based concentrates areassociated with increased risk ofexplosions and burns.27,44 Thesesevere acute consequences might beespecially likely among inexperiencedcannabis users,16 who comprise themajority of adolescents who usecannabis.
The purpose of this study was toreport on the prevalence of cannabisconcentrate use in a large sample of8th-, 10th-, and 12th-graders fromthe state of Arizona, a medicalcannabis state. Another aim of thestudy was to test whether adolescentcannabis users who had versus hadnot used concentrates weredistinguishable in terms of othersubstance use and multiple risk andprotective factors that have beenshown to robustly predict substanceuse problems in longitudinal studies,including individual, peer, family,school, and community factors.45,46
Understanding which risk andprotective factors distinguishadolescent concentrate users willhave important implications forprevention and intervention.
METHODS
Participants
Participants were 8th-, 10th-, and12th-grade students who participatedin the statewide 2018 Arizona YouthSurvey (AYS) (for details, see http://azcjc.gov/content/arizona-youth-survey). The AYS is conducted every2 years by the Arizona CriminalJustice Commission to assesssubstance use and risky behavior as
2 MEIER et al
Dow
nloaded from http://publications.aap.org/pediatrics/article-pdf/144/3/e20190338/1077403/peds_20190338.pdf by guest on 12 D
ecember 2021
well as known risk andprotective factors for these problembehaviors. All Arizona schoolsthat serve 8th-, 10th-, and 12th-grade students (traditional public,private, or charter school) areinvited to participate via mailingsand e-mails. The 2018 surveywas administered to 52 336students attending 245 schoolsfrom all 15 Arizona counties.
Of the 52 336 adolescents whoparticipated in the survey, 824were excluded from analyses becausethey reported use of “phenoxydine,”a fake drug. An additional 4370adolescents were excluded becauseof missing cannabis data. This lefta total analytic sample of 47 142adolescents. To ascertain samplerepresentativeness, participantswere compared with all studentsenrolled in the same grades acrossthe state of Arizona in terms ofsex and race and/or ethnicity byusing the most recent NationalCenter for Education Statistics(NCES) Common Core of Data(2015–2016).47 The 2 sampleswere nearly identical in terms ofsex and race and/or ethnicity
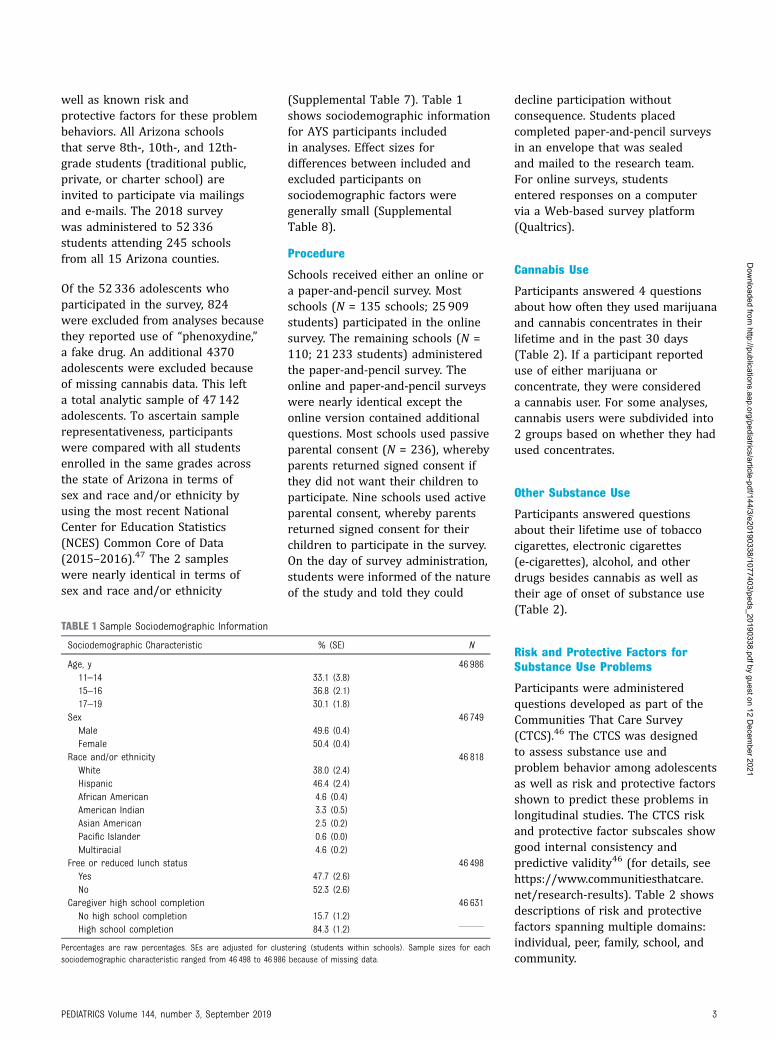
(Supplemental Table 7). Table 1shows sociodemographic informationfor AYS participants includedin analyses. Effect sizes fordifferences between included andexcluded participants onsociodemographic factors weregenerally small (SupplementalTable 8).
Procedure
Schools received either an online ora paper-and-pencil survey. Mostschools (N = 135 schools; 25 909students) participated in the onlinesurvey. The remaining schools (N =110; 21 233 students) administeredthe paper-and-pencil survey. Theonline and paper-and-pencil surveyswere nearly identical except theonline version contained additionalquestions. Most schools used passiveparental consent (N = 236), wherebyparents returned signed consent ifthey did not want their children toparticipate. Nine schools used activeparental consent, whereby parentsreturned signed consent for theirchildren to participate in the survey.On the day of survey administration,students were informed of the natureof the study and told they could
decline participation withoutconsequence. Students placedcompleted paper-and-pencil surveysin an envelope that was sealedand mailed to the research team.For online surveys, studentsentered responses on a computervia a Web-based survey platform(Qualtrics).
Cannabis Use
Participants answered 4 questionsabout how often they used marijuanaand cannabis concentrates in theirlifetime and in the past 30 days(Table 2). If a participant reporteduse of either marijuana orconcentrate, they were considereda cannabis user. For some analyses,cannabis users were subdivided into2 groups based on whether they hadused concentrates.
Other Substance Use
Participants answered questionsabout their lifetime use of tobaccocigarettes, electronic cigarettes(e-cigarettes), alcohol, and otherdrugs besides cannabis as well astheir age of onset of substance use(Table 2).
Risk and Protective Factors forSubstance Use Problems
Participants were administeredquestions developed as part of theCommunities That Care Survey(CTCS).46 The CTCS was designedto assess substance use andproblem behavior among adolescentsas well as risk and protective factorsshown to predict these problems inlongitudinal studies. The CTCS riskand protective factor subscales showgood internal consistency andpredictive validity46 (for details, seehttps://www.communitiesthatcare.net/research-results). Table 2 showsdescriptions of risk and protectivefactors spanning multiple domains:individual, peer, family, school, andcommunity.
TABLE 1 Sample Sociodemographic Information
Sociodemographic Characteristic % (SE) N
Age, y 46 98611–14 33.1 (3.8)15–16 36.8 (2.1)17–19 30.1 (1.8)
Sex 46 749Male 49.6 (0.4)Female 50.4 (0.4)
Race and/or ethnicity 46 818White 38.0 (2.4)Hispanic 46.4 (2.4)African American 4.6 (0.4)American Indian 3.3 (0.5)Asian American 2.5 (0.2)Pacific Islander 0.6 (0.0)Multiracial 4.6 (0.2)
Free or reduced lunch status 46 498Yes 47.7 (2.6)No 52.3 (2.6)
Caregiver high school completion 46 631No high school completion 15.7 (1.2)High school completion 84.3 (1.2)
Percentages are raw percentages. SEs are adjusted for clustering (students within schools). Sample sizes for eachsociodemographic characteristic ranged from 46 498 to 46 986 because of missing data.
PEDIATRICS Volume 144, number 3, September 2019 3
Dow
nloaded from http://publications.aap.org/pediatrics/article-pdf/144/3/e20190338/1077403/peds_20190338.pdf by guest on 12 D
ecember 2021

TABLE 2 Description of Substance Use Measures and Risk and Protective Factors for Substance Use Problems
Variable Description
Substance useCannabis Participants were asked, “On how many occasions (if any) have you used marijuana [in your lifetime, during the
past 30 days],” and “On how many occasions (if any) have you smoked or vaped marijuana concentrates (eg,hash oil, wax, crumble, shatter) [in your lifetime, during the past 30 days].” Responses options were “0,” “1–2,”“3–5,” “6–9,” “10–19,” and “201.”
Tobacco cigarettes Participants were asked, “Have you ever smoked cigarettes (not including electronic cigarettes)?”E-cigarettes Participants were asked, “Have you ever used electronic cigarettes (e-cigs, vapes)?”Alcohol Participants were asked, “On how many occasions (if any) have you drunk alcoholic beverages—more than just
a few sips—in your lifetime?” This variable was coded as never versus ever.Other drugs Participants were asked about lifetime use of other drugs in a similar way to how they were asked about lifetime
alcohol use. If a participant reported use of any of the following drugs, they were considered a lifetime druguser: cocaine or crack, LSD or other hallucinogens, inhalants, methamphetamines, heroin, ecstasy, prescriptionpain relievers or prescription sedatives without a prescription, synthetic drugs, or over-the-counter drugs forthe purposes of getting high.
Age of onset of cigarette, alcohol, andmarijuana use
Participants were asked, “How old were you when you first…[smoked a cigarette, even a puff; had more than a sipor 2 of alcohol; smoked marijuana]?” Response options were never, 1–10, 11, 12, 13, 14, 15, 16, and 17–21. Thisvariable was coded as onset before age 17 vs never or onset age 171.
Risk and protective factors for substanceuse problemsIndividualPerceived risk of harm of
marijuanaParticipants were asked, “How much do you think people risk harming themselves (physically or in other ways) if
they…[try marijuana once or twice or smoke marijuana regularly (once or twice a week)]?” Response optionsranged from 1 (no risk) to 4 (great risk). Responses to each item were averaged. a = .90
Rebelliousness Participants were asked to respond to the following statements: “I like to see how much I can get away with,” “Iignore rules that get in my way,” and “I do the opposite of what people tell me just to get them mad.” Responseoptions ranged from 1 (very false) to 4 (very true). Responses to each item were averaged. a = .77
Attitudes toward antisocialbehavior
Participants were asked, “How wrong do you think it is for someone your age to…[take a handgun to school, stealsomething worth more than $5, attack someone with the idea of seriously hurting them, pick a fight withsomeone, or stay away from school all day when their parents think they are at school]?” Response optionsranged from 1 (very wrong) to 4 (not wrong at all). Responses to each item were averaged. a = .80
PeerPeer substance use Participants were asked, “Think of the 4 friends you feel closest to. In the past 12 months, how many of them
have…[smoked cigarettes, tried alcohol when their parents did not know about it, used marijuana, or usedillegal drugs besides marijuana].” Response options ranged from 0 to 4. Responses to each item were averaged.a = .79
Peer attitudes toward drug use Participants were asked, “How wrong do your friends feel it would be for you to…[smoke tobacco, have 1 or 2drinks of an alcoholic beverage nearly every day, use prescription drugs not prescribed to you, smokemarijuana, or use illegal drugs besides marijuana]?” Response options ranged from 1 (very wrong) to 4 (notwrong at all). Responses to the 4 items were averaged. a = .87
Perceived as cool for usingmarijuana
Participants were asked, “What are the chances that you would be seen as cool if you smoked marijuana?”Response options ranged from 1 (no or very little) to 5 (very good).
Antisocial peers Participants were asked, “Think of the 4 friends you feel closest to. In the past 12 months, how many of themhave…[sold illegal drugs; been suspended from school; dropped out of school; carried a handgun; stolen ortried to steal a motor vehicle, such as a car or motorcycle; or been arrested]?” Response options ranged from0 to 4. Responses to each item were averaged. a = .80
FamilyFamily history of alcohol or drug
useParticipants were asked, “Has anyone in your family ever had a severe alcohol or drug problem?” “Have any of your
brothers and sisters ever…[smoked cigarettes; drunk beer, wine, or hard liquor; used prescription drugswithout a doctor telling them to take them; smoked marijuana; or used illegal drugs besides marijuana]?” Ifa participant answered “yes” to any question, they were considered to have a family history of alcohol or druguse. a = .78
Family conflict Participants were asked to respond to the following statements: “People in my family often insult or yell at eachother,” “We argue about the same things in my family over and over,” and “People in my family have seriousarguments.” Response options ranged from 1 to 4 (NO!, no, yes, or YES!). Responses to the 3 items wereaveraged. a = .78
Poor family management Participants were asked to respond to the following statements and questions: “The rules in my family are clear,”“When I am not at home, 1 of my parents knows where I am and who I am with,” “My family has clear rules aboutalcohol and drug use,” “If you drank some alcohol without your parents’ permission, would you be caught byyour parents?,” “If you carried a handgun without your parents’ permission, would you be caught by yourparents?” “If you skipped school, would you be caught by your parents?” “My parents ask if I’ve gotten my
4 MEIER et al
Dow
nloaded from http://publications.aap.org/pediatrics/article-pdf/144/3/e20190338/1077403/peds_20190338.pdf by guest on 12 D
ecember 2021

Statistical Analyses
Before analyses, we tested forsurvey mode effects (paper andpencil versus online). There was noevidence that the prevalence ofcannabis use or cannabis concentrateuse differed as a function of surveymode (Supplemental Table 9). Toascertain whether concentrateusers, cannabis users who had notused cannabis concentrates, andcannabis nonusers could bedistinguished in terms ofsociodemographic factors, othersubstance use, and risk andprotective factors for substanceuse problems, we compared the3 groups using mixed-effectslinear regression (for continuous
variables) or logistic regression(for categorical variables). Analysesof sociodemographic factors werebivariate. Analyses of other substanceuse and risk and protective factors forsubstance use problems includedsociodemographic factors ascovariates (linear and quadraticage, grade, sex, race and/orethnicity, parent education, and freeor reduced lunch status). To accountfor clustering (students clusteredwithin schools), we includeda random intercept for school.To control for any differencesbetween schools, we held schoolconstant by including 2 independentvariables: 1 that was school-meancentered and 1 that was the schoolmean.48 The estimate for the school-
mean–centered independentvariable yields the person-levelassociation of interest net of anyschool effects.48 Statistical testswere 2 tailed. To gauge themagnitude of effects, we reportedeffect sizes: mean differences in SDunits for continuous variables andodds ratios for categorical variables.Analyses were conducted in Stataversion 15.1 (Stata Corp, CollegeStation, TX).
RESULTS
Prevalence of Cannabis Use andCannabis Concentrate Use
Table 3 shows the lifetime and past-month prevalence of cannabis use
TABLE 2 Continued
Variable Description
homework done,” and “Would your parents know if you did not come home on time?” Response options rangedfrom 1 to 4 (NO!, no, yes, or YES!). Responses to each item were reverse coded and then averaged. a = .82
Parental attitudes favorable towarddrug use
Participants were asked, “How wrong do your parents feel it would be for you to…[smoke cigarettes, have 1 or 2alcoholic drinks nearly every day, or smoke marijuana].” Response options ranged from 1 (very wrong) to 4 (notwrong at all). Responses to the 3 items were averaged. a = .68
Family attachment Participants were asked, “Do you feel very close to your [mother or father]?” and “Do you share your thoughts andfeeling with your [mother or father]?” Response options ranged from 1 to 4 (NO!, no, yes, or YES!). Responses tothe 4 items were averaged. a = .77
Opportunities for prosocialinvolvement
Participants responded to the following statements: “My parents ask me what I think before most family decisionsaffecting me are made,” “If I had a personal problem, I could ask my mom or dad for help,” and “My parents giveme lots of chances to do fun things with them.” Response options ranged from 1 to 4 (NO!, no, yes, or YES!).Responses to the 3 items were averaged. a = 0.76
SchoolAcademic failure Participants were asked, “Putting them all together, what were your grades like last year?” Response options
ranged from 1 (mostly A’s) to 5 (mostly F’s), but values were recoded according to CTCS guidelines to be on thesame scale as the next item. Participants were asked, “Are your school grades better than the grades of moststudents in your class?” Response options ranged from 1 to 4 (YES!, yes, no, or NO!). Responses to the 2 itemswere averaged. a = .70
Low commitment to school Participants were asked, “How interesting are most of your courses to you?” and “How important do you think thethings you are learning in school are going to be for your later life?” Response options for these 2 questionsranged from 1 (very interesting or very important) to 5 (not at all interesting or not at all important).Participants were also asked, “Now thinking back over the past year in school, how often did you…[enjoy beingin school, hate being in school, try to do your best work, or feel that the schoolwork you were assigned wasmeaningful and important]?” Response options ranged from 1 (almost always) to 5 (never). Finally, participantswere asked, “During the last 4 weeks, how many whole days of school have you missed because you skipped orcut?” Response options ranged from 0 (0 d) to 7 (11 or more d), but values were recoded to according to CTCSguidelines to be on the same scale as the other items. Responses to the 7 items were averaged. a = .74
CommunityLaws and norms favorable to drug
useParticipants were asked, “Would a kid in your neighborhood get caught by police if they…[drank alcohol, smoked
marijuana, or carried a handgun]?” Response options ranged from 1 to 4 (NO!, no, yes, or YES!), and items werereverse coded. Participants were also asked, “How wrong would most adults (over 21) in your neighborhoodthink it is for kids your age to…[smoke cigarettes, drink alcohol, or use marijuana]?” Response options rangedfrom 1 (very wrong) to 4 (not wrong at all). Responses to the 6 items were averaged. a = .78
Perceived availability of drugs Participants were asked, “How easy would it be for you to get the following things if you wanted them…[somecigarettes, some alcohol, some marijuana, or an illegal drug besides marijuana]?” Response options rangedfrom 1 (very hard) to 4 (very easy). Responses to the 4 items were averaged. a = .88
Sample sizes for each variable ranged from 41 503 to 47 119 because of missing data. LSD, lysergic acid diethylamide.
PEDIATRICS Volume 144, number 3, September 2019 5
Dow
nloaded from http://publications.aap.org/pediatrics/article-pdf/144/3/e20190338/1077403/peds_20190338.pdf by guest on 12 D
ecember 2021

and cannabis concentrate usefor the total sample andsociodemographic subgroups. Thirty-three percent of the sample reportedlifetime cannabis use (ie, lifetime useof either marijuana or concentrate),and 24% reported lifetimeconcentrate use. As expected, theprevalence of cannabis use andconcentrate use increased acrossgrade in school. For example,19.9%, 35.0%, and 46.4% of 8th-,10th-, and 12th-graders, respectively,had used cannabis in their lifetime,and 14.7%, 25.3%, and 32.9% of8th--, 10th-, and 12th-graders,respectively, had used concentratesin their lifetime. Cannabis useand cannabis concentrate usewere slightly more prevalent ingirls than boys and in youthwhose caregivers did not completehigh school. Cannabis use andcannabis concentrate use were lesscommon among Asian Americanyouth compared with youth of otherraces and/or ethnicities.
Comparison of Cannabis Groups onSociodemographic Factors, OtherSubstance Use, and Risk andProtective Factors for Substance UseProblems
We compared the following cannabisgroups on sociodemographic factors,use of other substances besidescannabis, and risk and protectivefactors for substance use problems:cannabis nonusers (N = 31 463;66.7% of the sample), cannabisusers who had not used concentrates(N = 4379; 9.3% of the sampleand 27.9% of cannabis users),and cannabis users who hadused concentrates (N = 11 300;24.0% of the sample and 72.1%of cannabis users). The 3 groupsdiffered somewhat in terms ofsociodemographic characteristics(Table 4). Therefore, we adjustedfor sociodemographic characteristicswhen comparing the groups interms of other substance use and riskand protective factors for substanceuse problems (Table 5). Table 5
shows that concentrate users had thehighest lifetime rates of othersubstance use, particularly e-cigaretteuse (81.7%). For example, the odds ofusing e-cigarettes were 3.24 timeshigher (P , .001) for concentrateusers than for cannabis users whohad not used concentrates and were24.50 times higher (P , .001) forconcentrate users than for cannabisnonusers. Concentrate users werealso more likely to have initiatedsubstance use before age 17. Forexample, the odds of using alcoholbefore age 17 were 1.75 times higher(P , .001) for concentrate usersthan for cannabis users who hadnot used concentrates and were13.86 times higher (P , .001) forconcentrate users than for cannabisnonusers. In terms of risk andprotective factors for substanceuse problems, concentrate usersshowed the highest levels of riskand the lowest levels of protectionon every factor, including perceivedrisk of harm from marijuana,
TABLE 3 Prevalence of Cannabis Use and Cannabis Concentrate Use by Sociodemographic Characteristics
Sociodemographic Characteristic Lifetime Cannabis Use Lifetime ConcentrateUse
Past-Month CannabisUse
Past-MonthConcentrate Use
% (SE) N % (SE) N % (SE) N % (SE) N
Total 33.3 (1.0) 47 142 24.0 (0.9) 47 142 18.3 (0.7) 46 733 12.7 (0.7) 46 592Grade 46 373 46 373 45 985 45 8428th 19.9 (0.9) 14.7 (0.7) 10.4 (0.6) 6.9 (0.4)10th 35.0 (0.8) 25.3 (0.9) 19.5 (0.7) 13.8 (0.8)12th 46.4 (1.1) 32.9 (1.1) 25.7 (0.9) 18.0 (0.9)
Sex 46 749 46 749 46 347 46 211Male 31.6 (1.0) 22.9 (0.9) 17.4 (0.7) 12.5 (0.7)Female 34.9 (1.1) 25.0 (0.9) 19.1 (0.7) 13.0 (0.7)
Race and/or ethnicity 46 818 46 818 46 417 46 276White 31.1 (1.6) 23.1 (1.4) 17.5 (1.1) 12.8 (0.9)Hispanic 35.1 (1.0) 25.0 (0.8) 18.7 (0.7) 12.9 (0.6)African American 33.0 (1.3) 22.6 (1.3) 18.7 (1.2) 11.5 (1.0)American Indian 41.0 (2.5) 26.5 (1.5) 24.4 (1.9) 14.5 (1.2)Asian American 18.4 (1.4) 13.5 (1.2) 8.6 (0.8) 6.6 (0.8)Pacific Islander 33.9 (2.9) 30.0 (2.7) 20.9 (2.6) 18.7 (2.5)Multiracial 37.1 (1.6) 26.1 (1.4) 20.9 (1.3) 13.8 (1.2)
Free or reduced lunch status 46 498 46 498 46 110 45 974No 32.8 (1.4) 24.4 (1.3) 18.4 (1.0) 13.5 (0.9)Yes 34.0 (0.9) 23.7 (0.7) 18.3 (0.7) 12.0 (0.5)
Caregiver high school completion 46 631 46 631 46 232 46 096No high school completion 37.2 (1.0) 26.6 (0.8) 20.3 (0.8) 13.7 (0.7)High school completion 32.6 (1.1) 23.6 (1.0) 18.0 (0.8) 12.6 (0.7)
Percentages are raw percentages. SEs are adjusted for clustering (students within schools). Lifetime cannabis use = lifetime use of either marijuana or concentrate. Past-month cannabisuse = past-month use of either marijuana or concentrate. Percentages are interpreted as the percentage of those within a specific sociodemographic category who had used cannabis intheir lifetime, used concentrates in their lifetime, used cannabis in the past month, and used concentrates in the past month. Sample sizes for each analysis ranged from 45 842 to 47 142due to missing sociodemographic data.
6 MEIER et al
Dow
nloaded from http://publications.aap.org/pediatrics/article-pdf/144/3/e20190338/1077403/peds_20190338.pdf by guest on 12 D
ecember 2021

peer substance use, parentalattitudes toward drug use,commitment to school, and perceivedavailability of drugs in thecommunity. Findings were similarwhen we reanalyzed the data withcannabis groups defined on the basisof past-month use (SupplementalTables 10 and 11).
DISCUSSION
The lifetime prevalence of cannabisconcentrate use in this sample of∼50 000 8th-, 10th-, and 12th-gradersfrom the state of Arizona was high,ranging from 15% in 8th-graders to33% in 12th-graders. The majority(72%) of adolescents who had usedcannabis had used concentrates.Overall, the high rates of concentrateuse in adolescents are concerningbecause some evidence in adultssuggests that exposure to cannabiswith higher THC content couldincrease a person’s risk for cannabisuse disorder, cognitive impairment,and psychosis.7,13,14,17–19,21,35,42,43
Moreover, adolescent cannabisusers may be more vulnerable tothese effects than adult cannabisusers.37–39 Finally, adverse acuteconsequences of concentrate use,such as loss of consciousness andburn injuries,15,27,28,41,44 might bemore likely among infrequent users,who comprise the majority ofadolescent users.
Our prevalence estimates of lifetimecannabis use are comparable toestimates obtained in the nationallyrepresentative 2017 Monitoring theFuture survey.49 Specifically, wefound that 19.9%, 35.0%, and 46.4%of 8th-, 10th-, and 12th-graders hadused cannabis in their lifetime,respectively, and correspondingestimates in the Monitoring theFuture survey were 13.5%, 30.7%,and 45.0%, respectively.49 Ourslightly but consistently higherestimates might be explained, in part,by regional differences becauseMonitoring the Future dataTA
BLE4Comparisonof
Lifetim
eCannabisNonusers,Lifetim
eCannabisUsersWho
HadNeverUsed
Concentrates,and
Lifetim
eConcentrateUserson
Sociodem
ographicFactors
Sociodem
ographicFactors
Group1:Cannabis
Nonusers
(N=
31463)
Group2:
Nonconcentrate
CannabisUsers
(N=4379)
Group3:
ConcentrateUsers
(N=11
300)
Group2vs
1Group3vs
1Group3vs
2
Mean,%
SEMean,%
SEMean,%
SEEffect
Size
a95%
CIEffectSize
a95%
CIEffectSize
a95%
CI
Age
14.94
0.07
15.17
0.07
15.15
0.07
0.14
*0.12
to0.16
0.13
*0.12
to0.14
20.01
20.03
to0.01
Sex(m
ale)
50.8
0.4
47.0
0.7
48.0
0.5
0.84
*0.78
to0.90
0.88
*0.84
to0.92
1.05
0.97
to1.12
Race
and/or
ethnicity
White
35.2
1.6
32.1
1.6
31.8
1.5
0.82
*0.76
to0.89
0.80
*0.76
to0.85
0.98
0.90
to1.07
Hispanic
47.9
1.5
49.9
1.7
52.1
1.6
1.12
*1.04
to1.21
1.26
*1.20
to1.33
1.13
*1.04
to1.23
AfricanAm
erican
4.5
0.4
5.2
0.5
4.1
0.4
1.17
*1.01
to1.36
0.92
0.82
to1.03
0.79
*0.67
to0.94
American
Indian
4.0
0.5
5.4
0.7
4.9
0.6
1.38
*1.15
to1.67
1.24
*1.08
to1.43
0.90
0.73
to1.10
AsianAm
erican
2.3
0.2
0.8
0.2
0.7
0.1
0.43
*0.32
to0.57
0.41
*0.34
to0.49
0.95
0.69
to1.31
PacificIslander
0.3
0.0
0.0
0.0
0.4
0.1
0.39
*0.20
to0.76
1.29
0.98
to1.70
3.34
*1.67
to6.68
Multiracial
4.2
0.2
6.2
0.5
5.3
0.3
1.43
*1.24
to1.67
1.23
*1.11
to1.37
0.86
0.73
to1.01
CaregiverHS
completion
82.9
0.9
81.6
1.1
80.3
1.0
0.91
*0.83
to0.99
0.82
*0.77
to0.87
0.90
*0.82
to0.99
Free
orreducedlunch
56.1
1.8
58.8
1.8
58.7
1.8
1.19
*1.10
to1.28
1.18
*1.12
to1.25
1.00
0.92
to1.08
Means
areestim
ated
marginalm
eans
foreach
cannabisgroup(nonuser,nonconcentratecannabisuser,and
concentrateuser).Percentagesareestim
ated
marginalprobabilitiesandthereforesumto
closeto
100%
forrace
and/or
ethnicity.All
analyses
arebivariate.N=44
847forallanalyses(n
=29
833cannabisnonusers;n
=4207
nonconcentratecannabisusers;andn=10
807concentrateusers)becauseindividualswith
missing
dataon
anysociodem
ographicfactor
wereexcluded
from
analyses.H
S,high
school.
aEffect
sizesareeither
meandifferences
inSD
units
(for
continuous
correlates)or
odds
ratios(for
categoricalcorrelates).
*P,
.05.
PEDIATRICS Volume 144, number 3, September 2019 7
Dow
nloaded from http://publications.aap.org/pediatrics/article-pdf/144/3/e20190338/1077403/peds_20190338.pdf by guest on 12 D
ecember 2021

TABLE5ComparisonofLifetim
eCannabisNonusers,Lifetim
eCannabisUsersWho
HadNeverUsed
Concentrates,and
Lifetim
eConcentrateUserson
OtherSubstanceUseandRisk
andProtectiveFactors
forSubstanceUseProblems,Adjusted
forSociodem
ographicFactors
Group1:
Cannabis
Nonusers
(N=
31463)
Group2:
Nonconcentrate
CannabisUsers
(N=4379)
Group3:
Concentrate
Users(N
=11
300)
Group2vs
1Group3vs
1Group3vs
2
Mean,%
SEMean,
%SE
Mean,%
SEEffect
Size
a95%
CIEffect
Size
a95%
CIEffect
Size
a95%
CINb
Othersubstanceuse
Cigaretteuse(lifetim
e)5.8
0.3
34.0
1.0
47.2
0.8
8.53
*7.82
to9.32
16.10*
15.03to
17.26
1.89
*1.74
to2.04)
44639
E-cigaretteuse(lifetim
e)20.2
0.5
60.4
0.9
81.7
0.6
7.55
*7.02
to8.13
24.50*
23.00to
26.11
3.24
*2.98
to3.53)
44751
Alcoholuse(lifetim
e)29.4
0.4
75.6
0.8
84.6
0.5
9.53
*8.79
to10.35
17.31*
16.23to
18.46
1.82
*1.65
to2.00
44755
Otherdrug
use(lifetim
e)8.8
0.3
26.4
0.8
47.2
0.6
3.76
*3.45
to4.11
10.54*
9.91
to11.21
2.80
*2.58
to3.05
44702
Ageof
onsetof
alcohol(,
17)
28.5
0.6
70.8
0.9
80.2
0.6
7.93
*7.34
to8.57
13.86*
13.04to
14.72
1.75
*1.60
to1.91
44041
Ageof
onsetof
cigarette(,
17)
5.8
0.3
32.9
1.0
45.6
0.8
8.06
*7.38
to8.81
14.94*
13.93to
16.01
1.85
*1.71
to2.01
44393
Ageof
onsetof
marijuana(,
17)
N/A
N/A
82.4
1.1
84.0
1.0
N/A
N/A
N/A
N/A
1.14
*1.02
to1.26
14560
Risk
andprotectivefactors
Individual
Perceivedrisk
ofharm
from
marijuana
2.66
0.01
1.90
0.02
1.70
0.01
20.68
*20.71
to20.65
20.86
*20.88
to20.84
20.18
*20.21
to20.14
42629
Rebelliousness
1.63
0.01
1.89
0.01
2.03
0.01
0.35
*0.32
to0.39
0.55
*0.53
to0.57
0.19
*0.16
to0.23
42897
Favorableattitudes:antisocialbehavior
1.42
0.00
1.61
0.01
1.75
0.01
0.35
*0.32
to0.38
0.59
*0.57
to0.62
0.24
*0.21
to0.28
42761
Peer Peer
useof
anysubstance(pastyear)
0.48
0.01
1.16
0.01
1.64
0.01
0.69
*0.66
to0.71
1.17
*1.15
to1.19
0.48
*0.45
to0.51
44457
Peer
favorableattitudes:d
ruguse
1.44
0.01
1.95
0.01
2.26
0.01
0.66
*0.63
to0.69
1.06
*1.04
to1.08
0.40
*0.37
to0.44
44329
Perceivedas
cool
formarijuanause
2.24
0.02
2.84
0.03
3.02
0.02
0.41
*0.38
to0.44
0.54
*0.52
to0.56
0.13
*0.09
to0.16
42946
Antisocialpeers
0.19
0.01
0.33
0.01
0.58
0.01
0.26
*0.23
to0.29
0.71
*0.69
to0.74
0.46
*0.42
to0.49
44508
Family
Family
historyalcoholand/or
drug
use
58.9
0.4
80.3
0.7
84.6
0.4
3.1*
2.86
to3.43
4.26
*4.00
to4.55
1.36
*1.23
to1.51
41835
Family
conflict
2.24
0.01
2.43
0.01
2.51
0.01
0.25
*0.22
to0.28
0.35
*0.32
to0.37
0.10
*0.06
to0.13
41987
Poor
family
managem
ent
1.70
0.01
1.94
0.01
2.05
0.01
0.41
*0.37
to0.44
0.60
*0.57
to0.62
0.19
*0.15
to0.22
41878
Parental
favorableattitudes:d
ruguse
1.14
0.00
1.33
0.01
1.46
0.01
0.40
*0.36
to0.43
0.67
*0.65
to0.69
0.27
*0.24
to0.31
42208
Family
attachment
2.88
0.01
2.66
0.01
2.58
0.01
20.29
*20.32
to20.25
20.39
*20.41
to20.36
20.10
*20.14
to20.06
41335
Prosocialopportunities
2.97
0.01
2.78
0.01
2.68
0.01
20.26
*20.29
to20.23
20.39
*20.41
to20.37
20.13
*20.17
to20.09
41451
School
Academ
icfailure
1.96
0.01
2.15
0.01
2.29
0.01
0.27
*0.24
to0.30
0.47
*0.44
to0.49
0.20
*0.16
to0.23
43836
Lowcommitm
entto
school
2.62
0.01
2.87
0.01
3.02
0.01
0.38
*0.35
to0.41
0.60
*0.58
to0.62
0.22
*0.19
to0.25
44703
Community
Lawsandnorm
sfavorableto
drug
use
2.06
0.01
2.30
0.01
2.40
0.01
0.38
*0.35
to0.41
0.54
*0.52
to0.56
0.16
*0.13
to0.20
39750
Perceivedavailabilityof
drugs
2.13
0.01
2.68
0.02
2.93
0.01
0.54
*0.51
to0.57
0.79
*0.77
to0.81
0.24
*0.21
to0.28
42593
Means
areestim
ated
marginalmeans,and
percentagesareestim
ated
marginalprobabilities.Estim
ates
areadjusted
forsociodem
ographiccharacteristics(linearandquadratic
age,grade,sex,race/ethnicity,caregiver
education,andfree
orreducedlunch).N
/A,not
applicable.
aEffect
sizesareeither
meandifferences
inSD
units
(for
continuous
correlates)or
odds
ratios(for
categoricalcorrelates).
bSamplesizesforeach
analysisranged
from
39750to
44755becauseof
missing
data.
*P,
.05.
8 MEIER et al
Dow
nloaded from http://publications.aap.org/pediatrics/article-pdf/144/3/e20190338/1077403/peds_20190338.pdf by guest on 12 D
ecember 2021

showed that the prevalence ofcannabis use is highest in westernstates (such as AZ), particularly for8th-graders.49 Another possibleexplanation for our slightly higherestimates is that we defined cannabisuse based on answers to 2questions (ie, 1 question aboutmarijuana use and 1 question aboutconcentrate use) as opposed to thesingle question used in theMonitoring the Future survey (ie, 1question about marijuana or hashishuse). When we recalculated thelifetime prevalence of cannabis usebased on our single question aboutmarijuana use, our prevalenceestimates were nearly identical toMonitoring the Future estimates(Supplemental Table 12). In oursample, cannabis use and concentrateuse were both slightly more prevalentamong girls than boys. This is notinconsistent with the 2017Monitoring the Future data,which showed either no sexdifference in the prevalence ofcannabis use or a slightly higherprevalence in 1 sex or the otherdepending on grade in school. Overall,the between-study similaritiesprovide an important context forinterpreting our estimates of theprevalence of concentrate use.Namely, because our sampling andassessment procedures producedestimates of cannabis use that are inthe range of what we expected on thebasis of a similar survey, we haveincreased confidence in our estimatesof concentrate use.
Concentrate users weredistinguishable from cannabis userswho had not used concentrates andfrom cannabis nonusers in thatthey had higher rates of othersubstance use and were worse offon every risk and protective factorfor substance use problems. Notably,the substance that best distinguishedconcentrate users was e-cigaretteuse. This is consistent with recentstudies suggesting that adolescentsand young adults are using
e-cigarettes to vaporize cannabis,50–53
and it reinforces the recentdecision by the Food and DrugAdministration to impose newrestrictions on e-cigarettes andtheir constituents as a means ofreducing cannabis use.
This study has limitations. First,information about cannabis use wasbased on self-reports, and evidencesuggests that adolescents both under-and overreport cannabis use.54
However, adolescents were informedthat surveys were voluntary,anonymous, and confidential,mitigating risk of underreporting forfear of getting caught. We alsoexcluded adolescents who reporteduse of a fake drug, mitigatingoverreporting. Second, someadolescents might not haveunderstood the difference betweenconcentrates and marijuana. Todistinguish concentrates frommarijuana, we provided specificexamples of concentrates (ie, hash oil,wax, crumble, and shatter). However,it is possible that some adolescentsreported that they had usedconcentrates despite having onlyused marijuana. Third, although weasked broadly about use of“concentrates,” the specific examplesof concentrates we provided areexamples of solvent-basedconcentrates. Therefore, ourestimates of concentrate use mightnot capture use of nonsolvent-basedconcentrates (eg, kief and hash orhashish). Fourth, findings are limitedto adolescents from the state ofArizona, a medical cannabis state.Studies of adult cannabis users haveshown that the prevalence ofconcentrate use is higher in stateswith recreational or medicalcannabis laws than in prohibitionstates,30,55 suggesting that theprevalence of concentrate use inadolescents from Arizona might behigher than in adolescents fromprohibition states. Notably, most USstates are not prohibition states. Themajority of states have legalized
medical cannabis use. Yet, medicalcannabis laws differ from state tostate,56 and some states withmedical cannabis laws prohibitcannabis concentrates. In AZ, thecourts have reversed decisions on thelegality of concentrates numeroustimes, but concentrates are currentlysold in Arizona dispensaries.Research is needed to determine ifour findings generalize to adolescentsfrom other states with medicalcannabis laws. Fifth, data from thisstudy are cross-sectional.Longitudinal data are needed todetermine the temporal associationsbetween cannabis concentrate use,other substance use, and some of therisk and protective factors studiedhere that could be affected byconcentrate use, such as academicfailure.
CONCLUSIONS
This study has a number ofimplications. First, cannabisconcentrate use is common inadolescents from a medical cannabisstate. Such high rates of concentrateuse raise concerns about adolescents’exposure to high-THC cannabisbecause some research suggests thatuse of cannabis with higher THCcontent is associated with increasedrisk of cannabis use disorder,cognitive impairment, andpsychosis.7,13,14,17–19,21,35,42,43
Second, the risk and protective factorprofile for adolescent concentrateusers suggests that concentrateusers are at higher risk for substanceuse problems than cannabis userswho do not use concentrates. It willbe important to ascertain ifadolescent concentrate users havehigher rates of substance useproblems generally, and cannabis usedisorder specifically, and todisentangle effects associatedwith selection into concentrate usefrom effects of exposure to higher-THC cannabis. Third, concentrateusers’ higher levels of risk, andlower levels of protection, across
PEDIATRICS Volume 144, number 3, September 2019 9
Dow
nloaded from http://publications.aap.org/pediatrics/article-pdf/144/3/e20190338/1077403/peds_20190338.pdf by guest on 12 D
ecember 2021

multiple life domains suggest thatbroad interventions that targetmultiple risk factors are needed.Restricting e-cigarette use might notbe enough to reduce cannabis use andlower the risk of concentrate use inthe highest-risk adolescents. Fourth,monitoring of adolescent concentrateuse is needed, as is a standardizedand psychometrically sound measure
that accurately distinguishesmarijuana and concentrate use.As findings emerge showing highrates of concentrate use inadolescents, and increased cannabis-related risks associated with useof high-THC cannabis, policymakers might consider puttinga limit on THC concentration incannabis.
ABBREVIATIONS
AYS: Arizona Youth SurveyCTCS: Communities That Care
Surveye-cigarette: electronic cigaretteNCES: National Center for
Education StatisticsTHC: D-9-tetrahydrocannbinol
FUNDING: Arizona Youth Survey data collection was funded by a grant to Dr Pardini from the Arizona Criminal Justice Commission.
POTENTIAL CONFLICT OF INTEREST: The authors have indicated they have no potential conflicts of interest to disclose.
COMPANION PAPER: A companion to this article can be found online at www.pediatrics.org/cgi/doi/10.1542/peds.2019-1256.
REFERENCES
1. Hasin DS, Saha TD, Kerridge BT, et al.Prevalence of marijuana use disordersin the United States between 2001-2002and 2012-2013. JAMA Psychiatry. 2015;72(12):1235–1242
2. Okaneku J, Vearrier D, McKeever RG,LaSala GS, Greenberg MI. Change inperceived risk associated withmarijuana use in the United Statesfrom 2002 to 2012. Clin Toxicol (Phila).2015;53(3):151–155
3. ElSohly MA, Mehmedic Z, Foster S, GonC, Chandra S, Church JC. Changes incannabis potency over the last twodecades (1995-2014): analysis ofcurrent data in the United States. BiolPsychiatry. 2016;79(7):613–619
4. Cascini F, Aiello C, Di Tanna G.Increasing delta-9-tetrahydrocannabinol (D-9-THC) contentin herbal cannabis over time:systematic review and meta-analysis.Curr Drug Abuse Rev. 2012;5(1):32–40
5. Swift W, Wong A, Li KM, Arnold JC,McGregor IS. Analysis of cannabisseizures in NSW, Australia: cannabispotency and cannabinoid profile. PLoSOne. 2013;8(7):e70052
6. Curran HV, Freeman TP, Mokrysz C,Lewis DA, Morgan CJ, Parsons LH. Keepoff the grass? Cannabis, cognition andaddiction. Nat Rev Neurosci. 2016;17(5):293–306
7. Freeman TP, van der Pol P, Kuijpers W,et al. Changes in cannabis potency andfirst-time admissions to drug
treatment: a 16-year study in theNetherlands. Psychol Med. 2018;48(14):2346–2352
8. D’Souza DC, Perry E, MacDougall L, et al.The psychotomimetic effects ofintravenous delta-9-tetrahydrocannabinol in healthyindividuals: implications for psychosis.Neuropsychopharmacology. 2004;29(8):1558–1572
9. D’Souza DC, Ranganathan M, Braley G,et al. Blunted psychotomimetic andamnestic effects of delta-9-tetrahydrocannabinol in frequent usersof cannabis.Neuropsychopharmacology. 2008;33(10):2505–2516
10. Chait LD, Burke KA. Preference for high-versus low-potency marijuana.Pharmacol Biochem Behav. 1994;49(3):643–647
11. Carlini BH, Garrett SB, Harwick RM.Beyond joints and brownies: marijuanaconcentrates in the legal landscape ofWA state. Int J Drug Policy. 2017;42:26–29
12. Smith N. High potency cannabis: theforgotten variable. Addiction. 2005;100(10):1558–1560; author reply1560–1561
13. Freeman TP, Winstock AR. Examining theprofile of high-potency cannabis and itsassociation with severity of cannabisdependence. Psychol Med. 2015;45(15):3181–3189
14. Murray RM, Quigley H, Quattrone D,Englund A, Di Forti M. Traditionalmarijuana, high-potency cannabis andsynthetic cannabinoids: increasing riskfor psychosis. World Psychiatry. 2016;15(3):195–204
15. Cavazos-Rehg PA, Sowles SJ, Krauss MJ,Agbonavbare V, Grucza R, Bierut L. Acontent analysis of tweets about high-potency marijuana. Drug AlcoholDepend. 2016;166:100–108
16. Stogner JM, Miller BL. Assessing thedangers of “dabbing”: mere marijuanaor harmful new trend? Pediatrics. 2015;136(1):1–3
17. Di Forti M, Marconi A, Carra E, et al.Proportion of patients in south Londonwith first-episode psychosisattributable to use of high potencycannabis: a case-control study. LancetPsychiatry. 2015;2(3):233–238
18. Di Forti M, Morgan C, Dazzan P, et al.High-potency cannabis and the risk ofpsychosis. Br J Psychiatry. 2009;195(6):488–491
19. Loflin M, Earleywine M. A new method ofcannabis ingestion: the dangers ofdabs? Addict Behav. 2014;39(10):1430–1433
20. Rigucci S, Marques TR, Di Forti M, et al.Effect of high-potency cannabis oncorpus callosum microstructure.Psychol Med. 2016;46(4):841–854
21. Meier MH. Associations between butanehash oil use and cannabis-related
10 MEIER et al
Dow
nloaded from http://publications.aap.org/pediatrics/article-pdf/144/3/e20190338/1077403/peds_20190338.pdf by guest on 12 D
ecember 2021

problems. Drug Alcohol Depend. 2017;179:25–31
22. Raber JC, Elzinga S, Kaplan C.Understanding dabs: contaminationconcerns of cannabis concentrates andcannabinoid transfer during the act ofdabbing. J Toxicol Sci. 2015;40(6):797–803
23. Vergara D, Bidwell LC, Gaudino R, et al.Compromised external validity:federally produced cannabis does notreflect legal markets. Sci Rep. 2017;7:46528
24. Smart R, Caulkins JP, Kilmer B,Davenport S, Midgette G. Variation incannabis potency and prices in a newlylegal market: evidence from 30 millioncannabis sales in Washington state.Addiction. 2017;112(12):2167–2177
25. Stogner JM, Miller BL. The dabbingdilemma: a call for research on butanehash oil and other alternate forms ofcannabis use. Subst Abus. 2015;36(4):393–395
26. Zhang Z, Zheng X, Zeng DD, Leischow SJ.Tracking dabbing using search querysurveillance: a case study in the UnitedStates. J Med Internet Res. 2016;18(9):e252
27. Al-Zouabi I, Stogner JM, Miller BL, LaneES. Butane hash oil and dabbing:insights into use, amateur productiontechniques, and potential harmmitigation. Subst Abuse Rehabil. 2018;9:91–101
28. Daniulaityte R, Lamy FR, Barratt M, et al.Characterizing marijuana concentrateusers: a web-based survey. DrugAlcohol Depend. 2017;178:399–407
29. Daniulaityte R, Zatreh MY, Lamy FR, et al.A Twitter-based survey on marijuanaconcentrate use. Drug Alcohol Depend.2018;187:155–159
30. Sagar KA, Lambros AM, Dahlgren MK,Smith RT, Gruber SA. Made fromconcentrate? A national web surveyassessing dab use in the United States.Drug Alcohol Depend. 2018;190:133–142
31. Lankenau SE, Fedorova EV, Reed M,Schrager SM, Iverson E, Wong CF.Marijuana practices and patterns ofuse among young adult medicalmarijuana patients and non-patientmarijuana users. Drug Alcohol Depend.2017;170:181–188
32. Chan GCK, Hall W, Freeman TP, Ferris J,Kelly AB, Winstock A. Usercharacteristics and effect profile ofButane Hash Oil: an extremely high-potency cannabis concentrate. DrugAlcohol Depend. 2017;178:32–38
33. Krauss MJ, Rajbhandari B, Sowles SJ,Spitznagel EL, Cavazos-Rehg P. A latentclass analysis of poly-marijuana useamong young adults. Addict Behav.2017;75:159–165
34. Kilmer B, Caulkins JP, Midgette G,Dahlkemper L, MacCoun RJ, LiccardoPR. Before the Grand Opening:Measuring Washington State’sMarijuana Market in the Last YearBefore Legalized Commercial Sales.Santa Monica, CA: Rand Corporation;2013
35. Cinnamon Bidwell L, YorkWilliams SL,Mueller RL, Bryan AD, Hutchison KE.Exploring cannabis concentrates on thelegal market: User profiles, productstrength, and health-related outcomes.Addict Behav Rep. 2018;8:102–106
36. Knapp AA, Lee DC, Borodovsky JT, AutySG, Gabrielli J, Budney AJ. Emergingtrends in cannabis administrationamong adolescent cannabis users.J Adolesc Health. 2019;64(4):487–493
37. Volkow ND, Baler RD, Compton WM,Weiss SR. Adverse health effects ofmarijuana use. N Engl J Med. 2014;370(23):2219–2227
38. Hall W, Degenhardt L. Adverse healtheffects of non-medical cannabis use.Lancet. 2009;374(9698):1383–1391
39. Volkow ND, Swanson JM, Evins AE, et al.Effects of cannabis use on humanbehavior, including cognition,motivation, and psychosis: a review.JAMA Psychiatry. 2016;73(3):292–297
40. Schoeler T, Petros N, Di Forti M, et al.Effects of continuation, frequency, andtype of cannabis use on relapse in thefirst 2 years after onset of psychosis:an observational study. LancetPsychiatry. 2016;3(10):947–953
41. Cavazos-Rehg PA, Krauss MJ, Sowles SJ,et al. Leveraging user perspectives forinsight into cannabis concentrates. AmJ Drug Alcohol Abuse. 2018;44(6):628–641
42. Pierre JM, Gandal M, Son M. Cannabis-induced psychosis associated with high
potency “wax dabs”. Schizophr Res.2016;172(1–3):211–212
43. Keller CJ, Chen EC, Brodsky K, Yoon JH.A case of butane hash oil (marijuanawax)-induced psychosis. Subst Abus.2016;37(3):384–386
44. Bell C, Slim J, Flaten HK, Lindberg G,Arek W, Monte AA. Butane hash oilburns associated with marijuanaliberalization in Colorado. J Med Toxicol.2015;11(4):422–425
45. Hawkins JD, Catalano RF, Miller JY. Riskand protective factors for alcohol andother drug problems in adolescenceand early adulthood: implications forsubstance abuse prevention. PsycholBull. 1992;112(1):64–105
46. Arthur MW, Hawkins JD, Pollard JA,Catalano RF, Baglioni AJ Jr. Measuringrisk and protective factors forsubstance use, delinquency, and otheradolescent problem behaviors. TheCommunities That Care Youth Survey.Eval Rev. 2002;26(6):575–601
47. Institute of Education Sciences; NationalCenter for Education Statistics.Common core of data: America’s publicschools. Available at https://nces.ed.gov/ccd/. Accessed July 15,2019
48. Raudenbush SW, Bryk AS. HierarchicalLinear Models: Applications and DataAnalysis Methods. Vol 1. Thousand Oaks:Sage Publications; 2002
49. Miech RA, Johnston LD, O’Malley PM,Bachman JG, Schulenberg JE, PatrickME. Monitoring the Future: NationalSurvey Results on Drug Use, 1975-2017,Vol. 1: Secondary School Students. AnnArbor, MI: Institute for Social Research,The University of Michigan; 2018
50. Morean ME, Kong G, Camenga DR,Cavallo DA, Krishnan-Sarin S. Highschool students’ use of electroniccigarettes to vaporize cannabis.Pediatrics. 2015;136(4):611–616
51. Jones CB, Hill ML, Pardini DA, Meier MH.Prevalence and correlates of vapingcannabis in a sample of young adults.Psychol Addict Behav. 2016;30(8):915–921
52. Trivers KF, Phillips E, Gentzke AS, TynanMA, Neff LJ. Prevalence of cannabis usein electronic cigarettes among USyouth. JAMA Pediatr. 2018;172(11):1097–1099
PEDIATRICS Volume 144, number 3, September 2019 11
Dow
nloaded from http://publications.aap.org/pediatrics/article-pdf/144/3/e20190338/1077403/peds_20190338.pdf by guest on 12 D
ecember 2021

53. Jones CB, Meier MH, Pardini DA.Comparison of the locations where youngadults smoke, vape, and eat/drinkcannabis: implications for harm reduction.Addict Behav Rep. 2018;8:140–146
54. Buchan BJ, L Dennis M, Tims FM,Diamond GS. Cannabis use: consistency
and validity of self-report, on-siteurine testing and laboratorytesting. Addiction. 2002;97(suppl 1):98–108
55. Daniulaityte R, Nahhas RW, Wijeratne S,et al. “Time for dabs”: analyzing Twitterdata on marijuana concentrates across
the U.S. Drug Alcohol Depend. 2015;155:307–311
56. Pacula RL, Powell D, Heaton P, SevignyEL. Assessing the effects of medicalmarijuana laws on marijuana use: thedevil is in the details. J Policy AnalManage. 2015;34(1):7–31
12 MEIER et al
Dow
nloaded from http://publications.aap.org/pediatrics/article-pdf/144/3/e20190338/1077403/peds_20190338.pdf by guest on 12 D
ecember 2021